Corporate Political Spending and Shareholder Activism ... · shareholder activism is more sensitive...
51
Corporate Political Spending and Shareholder Activism: Evidence from Shareholder Proposals * Geeyoung Min † Hye Young You ‡ Abstract Corporate political spending become a controversial issue for shareholders, but little is known about how it influences shareholder activism. We examine whether shareholder activism is more sensitive to corporate political spending when there is a significant divergence in political orientations between the shareholders and the management. Using original data on S&P 500 companies during the period between 1997 through 2014, we find that the divergence in political orientations between shareholders and management is strongly associated with submissions of shareholder proposal on social issues. Companies that contribute more to the Re- publican Party are more likely to be targeted by non-individual shareholders that are Democratic-leaning. These findings suggest that the political orientation of management reflected in corporate campaign contributions sends a signal about companies’ policy to shareholders and may ultimately lead to more activism by those shareholders whose political preferences diverge from those of management. * We are grateful to Jonathan Ashley, Joshua Clinton, Michael Gilbert, Eric Helland, John Matsusaka, Daniel Wolfenzon, and participants at the 2015 American Law and Economics Association Annual Meet- ing and the 2015 Conference on Empirical Legal Studies for their helpful comments and suggestions. † Research Assistant Professor, University of Virginia School of Law and Adjunct Assistant Professor, Columbia Law School, NYC, NY. Email: [email protected] ‡ Assistant Professor, Department of Political Science, Vanderbilt University, Nashville, TN. Email: [email protected] 1
Transcript of Corporate Political Spending and Shareholder Activism ... · shareholder activism is more sensitive...
Corporate Political Spending and Shareholder
Activism: Evidence from Shareholder Proposals∗
Geeyoung Min† Hye Young You‡
Abstract
Corporate political spending become a controversial issue for shareholders, butlittle is known about how it influences shareholder activism. We examine whethershareholder activism is more sensitive to corporate political spending when thereis a significant divergence in political orientations between the shareholders andthe management. Using original data on S&P 500 companies during the periodbetween 1997 through 2014, we find that the divergence in political orientationsbetween shareholders and management is strongly associated with submissions ofshareholder proposal on social issues. Companies that contribute more to the Re-publican Party are more likely to be targeted by non-individual shareholders thatare Democratic-leaning. These findings suggest that the political orientation ofmanagement reflected in corporate campaign contributions sends a signal aboutcompanies’ policy to shareholders and may ultimately lead to more activism bythose shareholders whose political preferences diverge from those of management.
∗We are grateful to Jonathan Ashley, Joshua Clinton, Michael Gilbert, Eric Helland, John Matsusaka,Daniel Wolfenzon, and participants at the 2015 American Law and Economics Association Annual Meet-ing and the 2015 Conference on Empirical Legal Studies for their helpful comments and suggestions.†Research Assistant Professor, University of Virginia School of Law and Adjunct Assistant Professor,
Columbia Law School, NYC, NY. Email: [email protected]‡Assistant Professor, Department of Political Science, Vanderbilt University, Nashville, TN. Email:
1
1 Introduction
Shareholders’ concerns over corporate political spending have intensified in recent
years, especially after the U.S. Supreme Court’s decision in Citizens United v. Federal
Election Commission. During the 2014 and 2015 proxy seasons, the most common topic
in proposals submitted by shareholders had to do with political contribution and lob-
bying activities, which easily outpaced corporate governance issues such as having an
independent chair and declassifying boards of directors.1
Corporate political activity (CPA) has also received a lot of attention recently from
scholars who have documented the relationship between lobbying and campaign contri-
butions by firms and stock market returns, taxes, or CEO compensation (Claessens and
Laeven 2008; Richter and Timmons 2009; Cooper, Gulen, and Ovtchinnikov 2010; Aggar-
wal, Meschke, and Wang 2012; Coates 2012). The prior literature on corporate political
spending tends to focus on how corporate political activity is associated with “outcomes,”
such as firm value instead of “processes,” such as how shareholders respond to firm’s po-
litical activities. As such, the link between corporate political activity and shareholder
activism is still not well understood.
Recent debate over whether the Security and Exchange Commission (SEC) should
mandate the disclosure of corporate political spending demonstrates why it matters to
understand the link between corporate political spending and shareholder activism. Pro-
ponents of the rule-making petition argue that more transparency on corporate political
spending will ensure that shareholders are provided with better information on firms’
involvement in the political process (Bebchuk and Jackson 2010, 2013). On the other
hand, opponents are concerned that the mandatory disclosure rule would trigger more
activism by special-interest groups such as public pension funds and labor union whose
political interests are antagonistic to corporate interests (Copland 2013). Despite the in-1Elizabeth Ising, “Shareholder Proposal Developments During the 2015 Proxy Season,” (July 17, 2015)
available at http://corpgov.law.harvard.edu/2015/07/17/shareholder-proposal-developments-during-the-2015-proxy-season/
2
tense debate, we know little about how corporate political activity relates to shareholder
activism.
To advance our understanding on this relationship, we examine how firms’ lobbying
and campaign contribution patterns are associated with one type of shareholder activism -
shareholder proposal submission - the most traditional way to express shareholders’ voice
to managements. Given that a shareholder proposal is relatively less costly to submit and
thus available to a much broader range of shareholders, a number of shareholder proposal
submissions can serve as a useful parameter to see how various shareholders react to
corporate political spending.
We collected data on S&P 500 companies between 1997 through 2014 and merged a
dataset on shareholder proposals with another on corporate political spending, market
performance, and governance structure. We categorized shareholder proposal submis-
sions by agenda and proponent. In order to measure companies’ political orientations,
we gathered three different levels of campaign contributions: CEO contribution, employee
contribution, and companies’ PAC. Another contribution is that we measure shareholders’
political preference by collecting campaign contribution records of non-individual share-
holders who submitted shareholder proposals. This allows us to directly compare the
divergence in political preference reflected in campaign contributions between a company
and its shareholders.
We argue that corporate political spending reveals information not only on firms’ po-
litical involvement but also on other types of corporate policies, which shareholders may
use to gauge the management practice and policies. There is some evidence suggest-
ing that corporate political spending is related to firm’s governance issues such as CEO
compensation (Gupta and Wowak 2016), but the existing literature shows a stronger cor-
relation with non-governance issues such as labor, environment, and social engagement
issues (Hutton, Jiang, and Kumar 2014, 2015; Chin, Hambrick, and Trevino 2013; Di Giuli
and Kostovetsky 2014). If this is the case, we can expect that shareholders who care more
3
about labor, environmental, and corporate social responsibility (CSR) issues will be more
responsive to a certain pattern of corporate political activity that indicates issues in those
dimensions.
First, we find that the number of shareholder proposals on governance issues increase as
companies lobbying expenditure expands, but is not associated with the level of campaign
contributions. As lobbying expenditure less likely reflects management’s political views,
it does not trigger shareholder proposal submission on social issues. Second, we find that
shareholder proposal submission is more sensitive to corporate political spending when
there is a larger divergence between the political orientation of shareholders and the man-
agement. For example, Republican-leaning firms, measured by campaign contributions
by CEOs, employees, and firm’s PAC, receive more shareholder proposals on social issues,
especially from public pension funds, religious groups and socially responsible investment
fund shareholders. This finding is consistent with recent studies suggesting firms with Re-
publican culture are more likely to become targets of civil rights, labor, and environmental
litigation than their Democratic counterparts (Hutton, Jiang, and Kumar 2015), and lib-
eral CEOs put more emphasis on CSR practices (Chin, Hambrick, and Trevino 2013;
Di Giuli and Kostovetsky 2014). These non-individual shareholders that submitted pro-
posals are much more Democratic-leaning in terms of their campaign contributions than
firms they invested in and target with shareholder proposals. The divergence in political
orientation between management and shareholders is a robust predictor of shareholder
proposal submission on social issues.
These findings suggest that shareholders may use corporate political spending as a
signal about firms’ type in management practice and firm policies. In that sense, greater
disclosure could give more information to their shareholders, not only on firms’ involve-
ment in the political process but also on other processes. An agency problem arises when
managers have differing preferences from shareholders (Agrawal and Knoeber 1996; Be-
bchuk and Fried 2003). If corporate political spending sends a signal about management’s
4
preference and submitting a shareholder proposal is one mechanism to address that agency
problem, we can expect that shareholders will submit more proposals when the political
culture of firms in which they invested is opposed to their own. Our findings also indicate
that increasing corporate political activity could lead to more activism by shareholders
whose political preferences are not aligned with management.
2 Citizens United and the Debate on the Disclosure
of Corporate Political Activity
In 2010, The Supreme Court Decision of Citizens United v. Federal Election Commis-
sion (hereafter, “Citizens United”) struck down traditional campaign finance law prevent-
ing corporations and unions from using their coffers to sponsor electioneering activities
during campaigns.2 In theory, after Citizens United, corporations could use their corporate
budgets to sponsor issue advocacy groups that only engage in independent expenditures
and do not coordinate with candidates, as is required of “super PACs.” (Kang 2010, 2012;
Briffault 2012).
Critics of Citizens United expected that corporations would unleash their massive
resources on the political system. Indeed, the episode of Target Corporation spend-
ing $150,000 in support of Minnesota gubernatorial candidate Tom Emmer in the 2010
midterm election - right after the Citizens United decision - seemed to support this pre-
diction (Kang 2012). However, there is little additional evidence that this prediction
has come to pass. Most campaign contributions to candidates come from individuals
(Ansolabehere, de Figueiredo, and Snyder 2003) and a few publicly trade corporations
contributed to super PACs.3
Although there is a seemingly lack of corporate involvement in elections, shareholder2130 S.Ct. 876, 558 U.S. 310 (2010)3The Center for Responsive Politics, 2014, “Four Years After Citizens United: The Fallout,” January
21 (https://www.opensecrets.org/news/2014/01/four-years-after-citizens-united-the-fallout/).
5
proposals requesting the disclosure of corporate political spending visibly increased after
Citizens United, becoming the most frequently submitted shareholder proposal both in
the 2014 and 2015 proxy seasons. During the 2014 proxy season, 126 shareholder pro-
posals were submitted on corporate political and lobbying activities, while 110 proposals
were submitted in 2015 on the same issue. With respect to the contents of the proposals,
among the 126 shareholder proposals in 2014, 112 proposals requested greater disclosures,
and 6 asked for board oversight or required shareholder approval of all political spending.
Furthermore, 8 proposals barred companies from political spending entirely.4 In respond-
ing to requests from shareholders, 160 among 300 of the largest companies in the S&P
500 have been formally engaged by shareholder proposals on corporate political spending
and 99 of those companies have reached an agreement to disclose their direct and indi-
rect political spending.5 Also, even without any history of shareholder proposals, some
companies voluntarily disclose their political spending partially or fully.
Despite the expansion of voluntary disclosures on corporate political spending, some
scholars have expressed concerns about the low quality of information provided by com-
panies on their political involvements (Bebchuk and Jackson 2013). They argue that
although federal and state law require firms to disclose their contributions to candidates
and independent expenditure organizations, we have no information about contributions
from companies to trade associations and 501(c) social welfare groups because they are
not required to disclose their donors’ identities. Thus, they petitioned the SEC to man-
date all public companies disclose their corporate political spending.6 Amid shareholders’
rising concerns about corporate political activity, the petition soon attracted massive pub-
lic attention, and the SEC received more than one million comment letters - the highest
amount in its history.7
4As You Sow, “Proxy Preview Report 2014,” p.39 (2014).5Center for Political Accountability, “The 2014 CPA-Zicklin index of Corporate Political Disclosure
and Accountability,” p. 23 (September 24, 2014)6Lucian A. Bebchuk et al., Committee on Disclosure of Corporate Political Spending Petition for
Rulemaking (August 3, 2011).7Lucian A. Bebchuk and Rober J. Jackson Jr., “The Million-Comment-Letter Petition: The Rule-
6
The SEC, however, has explicitly excluded the mandatory disclosure on corporate
political spending from its agenda by saying that it must attend to more urgent rulemaking
matters. However, the disclosure of corporate political spending has entered a new phase
because prominent politicians such as presidential candidate Hillary Clinton and 44 US
Democratic Senators expressed their support for the rule to requiring public companies
to disclose their political spending.8 In addition, two former chairmen of the SEC, Arthur
Levitt and William Donaldson, urged the agency to require the disclosure.9 On the other
hand, Republican lawmakers sought to prevent the SEC from requiring public companies
to disclose by including a section that explicitly prohibits the SEC from implementing any
such rule in the Fiscal Year 2016 Financial Services Bill.10 Republicans argue that the
SEC should steer clear of the issue because shareholders have disapproved of proposals on
political spending disclosure by a large margin and mandating political spending disclosure
is beyond the commission’s mission to protect investors and ensure market efficiency
(Copland 2013).
In addition to a lower support level for proposals on disclosure of political spending,
the opponents of the SEC rule worry that some activist shareholders will use the disclosed
political spending information to pursue their special interests, rather than maximizing
firm value. Leading advocates of shareholder proposals on corporate political spending,
such as public pension funds, have been accused of silencing corporate voices so that they
can dominate politics to a greater extent (Bainbridge 2012; Copland 2013). Therefore, the
debate on whether greater disclosure on corporate political spending serves the interest
of shareholders or whether some special interest shareholders will exploit the opportunity
making on Disclosure of Political Spending Attracts More than 1,000,000 SEC Comment Letters,” TheHarvard Law School Forum on Corporate Governance and Financial Regulation (Sep 4, 2014).
8Lucian Bebchuck and Robert J. Jackson, “Hillary Clinton Announces Support for SEC rulemakingon Corporate Political Spending,” (September 8, 2015), Harvard Law School Forum on Corporate Gov-ernance and Financial Regulation; Emily Chasan, “Senate Democrats Ask SEC to Revisit CorporatePolitical Spending,” (September 1, 2015), The Wall Street Journal.
9Dave Michaels, “SEC Should Require Political-Spending Reports, Ex-Chairs Say,” (May 27, 2015)BloombergBusiness.
10Emily Chasan, “House Aims to Prevent SEC from Requiring Corporate Political Disclosures Again,”(June 19, 2015) The Wall Street Journal.
7
has not yet settled.
3 Corporate Political Activity as a Signal of Firm’s
Type to Shareholders
The key question is whether corporate political spending information would enhance
the interests of the majority of shareholders. It is difficult to generalize the real motive
behind the shareholder activism without further information, but both sides agree that
disclosure will generate more information about firms. First, it must be ascertained what
types of information is revealed through a firm’s corporate political activity and how
shareholders would respond to this information.
First of all, beyond revealing firms’ involvement in politics, corporate political activ-
ity disclosure will provide an opportunity for shareholders to learn more about political
preference of firms. Given that scholars have documented the self-interest of public pen-
sion funds and labor unions shareholders (Romano 1993; Agrawal 2011), divergence in
preferences between these shareholders and management can loom large. For these share-
holders, increased political involvement by firms may be threatening to their interests, if
contributions are used to support candidates whose policies could potentially harm the
interests of labor and public sector workers such as weakening collective bargaining and
workers’ compensation.
Second, corporate political spending can provide supplemental information beyond
firms’ involvement in politics. Recent studies present evidence that a firm’s political
culture is associated with a particular set of corporate policies. For example, Chin, Ham-
brick, and Trevino (2013) show that, compared with conservative CEOs, liberal CEOs
tend to pay more attention to firms’ CSR practices. Republican managers tend to adopt
more conservative financial policies such as lower levels of corporate debt and Republican-
leaning firms tend to be the subjects of civil rights, labor, and environmental litigation
8
than Democratic-leaning firms (Hutton, Jiang, and Kumar 2014, 2015). Therefore, if
corporate political spending could provide more information about management practice
and firms’ policies, this can trigger more shareholder activism when some of shareholders
possess different preferences.
The fact that management’s partisan orientation is associated with firm policies on
labor, environment, and CSR practices has an important implication for shareholder
activism since socially responsible investment (SRI) - an investment based on ethical,
moral, and religious principles - has significantly grown in recent years. Based on the
principal of SRI, mutual funds and religious groups have been participating in advocacy
efforts by submitting shareholder proposals to influence corporate behaviors (Shueth 2003;
Renneboog, Horst, and Zhang 2008). If a firm’s political culture is an indicator of firm’s
policies on issues that other shareholders place higher priority on, activist shareholders
will generate tension with the management over those policies.
We contend that the agency problem, which arises when the management has different
political preferences from the shareholders, leads to more shareholder proposal submis-
sions. Given that political culture is often associated with firms’ policies on social issues,
we also expect that political orientation of firms will have more salient effect on share-
holder proposals on social issues than the effect on governance proposals. In the next
section, we empirically investigate whether corporate political spending is associated with
shareholder activism and whether shareholders are particularly responsive to corporate
political activity that opposes with their political preference.
4 Data and Stylized Facts
We focus on firms in the S&P 500 as of 2014, collecting various data from multiple
sources about those companies for the years from 1997 through 2014. Among the multiple
sources from which we drew our data, we consulted RiskMetrics for shareholder proposal
9
data, such as whether a proposal addresses issues on corporate governance or social issues,
the proponent of the proposal and proponent type, the status of the proposal - i.e.,
omitted, withdrawn, or voted - , and the percentage of support for the proposal if it was
voted on.
In total, there were 10,156 shareholder proposals submitted to S&P 500 companies
between 1997 and 2014.11 Our data is distinctive because, whereas previous literature
has mainly focused on shareholder proposal related to corporate governance, our study
also includes proposals on social issues such as corporate political spending and the envi-
ronment. Given that the proportion of shareholder proposals on social issues has been on
the rise, driving extensive debate in recent years, it is important to include shareholder
proposals on social issues to fully understand shareholder activism. This comprehensive
data allows us to discern similarities and differences across the various types of proposals
in terms of characteristics of the target firms.
Also, previous literature concerning shareholder proposals mainly focused on proposals
voted on by shareholders. However, the probability of a submitted proposal being voted
on is not random and the reasons for withdrawal or omission may be related to specific
company characteristics, such as the relationship between management and shareholders.
Examining only the proposals voted on ignores this potential selection bias.12 In this
study, we consider all shareholder proposals submitted distinguishing between proposals
submitted but not voted on and those submitted and voted on.13 As such, this constitutes
one of the most comprehensive datasets on shareholder activism through shareholder
proposal submissions.
Table 1 presents the summary statistics of shareholder proposal activities. Panel A11The original number of the total shareholder proposals during the period is 10,234. There are 78
shareholder proposals that do not have information on proponents. We drop those observations from theanalysis.
12Renneboog and Szilagyi (2011) note that “Proposals are sometimes withdrawn because the sponsorhas negotiated a satisfactory resolution, or the SEC has allowed the firm to reject the submission due tothe improper subject matter or technical reasons.”
13RiskMetrics data indicate the status of the proposal as: voted, withdrawn, not in proxy, and omitted,allowing us to infer the proposal’s disposition.
10
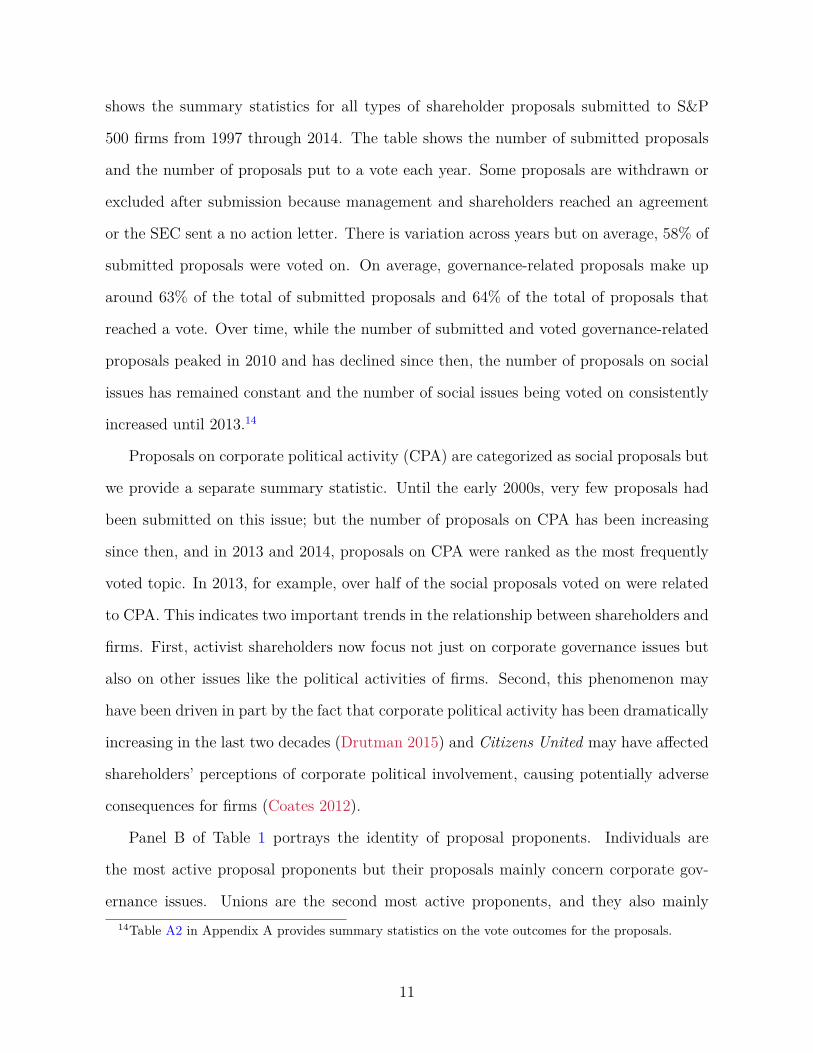
shows the summary statistics for all types of shareholder proposals submitted to S&P
500 firms from 1997 through 2014. The table shows the number of submitted proposals
and the number of proposals put to a vote each year. Some proposals are withdrawn or
excluded after submission because management and shareholders reached an agreement
or the SEC sent a no action letter. There is variation across years but on average, 58% of
submitted proposals were voted on. On average, governance-related proposals make up
around 63% of the total of submitted proposals and 64% of the total of proposals that
reached a vote. Over time, while the number of submitted and voted governance-related
proposals peaked in 2010 and has declined since then, the number of proposals on social
issues has remained constant and the number of social issues being voted on consistently
increased until 2013.14
Proposals on corporate political activity (CPA) are categorized as social proposals but
we provide a separate summary statistic. Until the early 2000s, very few proposals had
been submitted on this issue; but the number of proposals on CPA has been increasing
since then, and in 2013 and 2014, proposals on CPA were ranked as the most frequently
voted topic. In 2013, for example, over half of the social proposals voted on were related
to CPA. This indicates two important trends in the relationship between shareholders and
firms. First, activist shareholders now focus not just on corporate governance issues but
also on other issues like the political activities of firms. Second, this phenomenon may
have been driven in part by the fact that corporate political activity has been dramatically
increasing in the last two decades (Drutman 2015) and Citizens United may have affected
shareholders’ perceptions of corporate political involvement, causing potentially adverse
consequences for firms (Coates 2012).
Panel B of Table 1 portrays the identity of proposal proponents. Individuals are
the most active proposal proponents but their proposals mainly concern corporate gov-
ernance issues. Unions are the second most active proponents, and they also mainly14Table A2 in Appendix A provides summary statistics on the vote outcomes for the proposals.
11
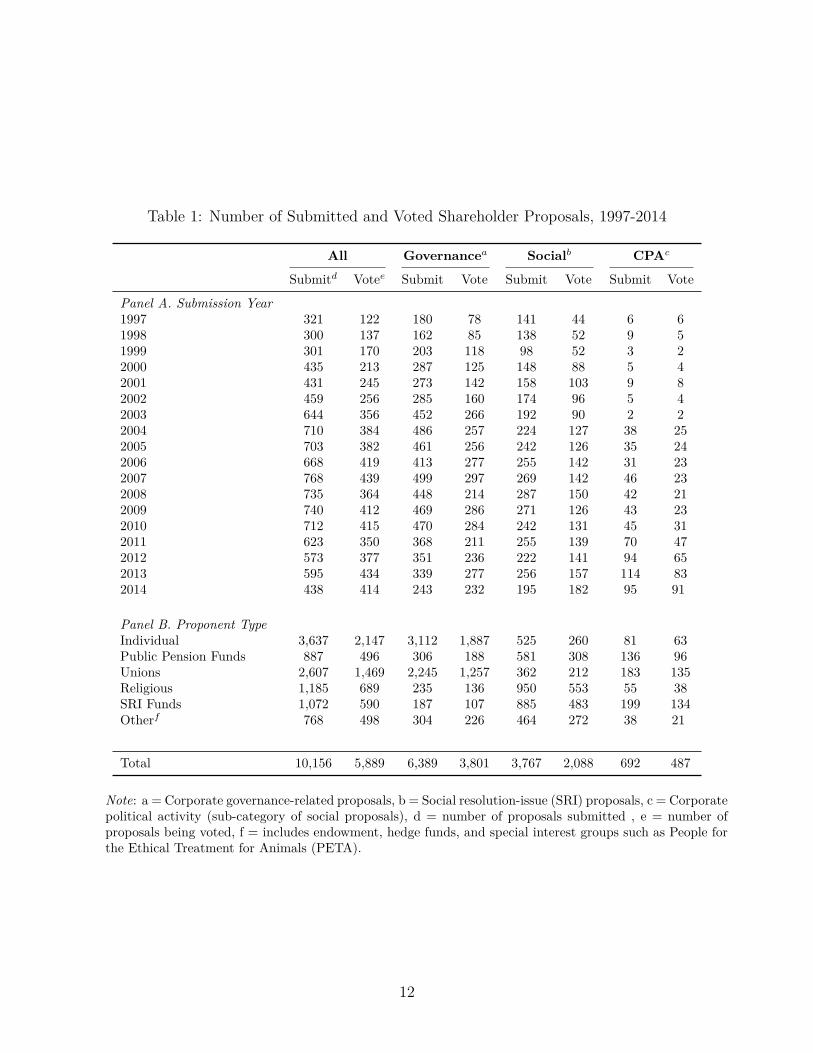
Table 1: Number of Submitted and Voted Shareholder Proposals, 1997-2014
All Governancea Socialb CPAc
Submitd Votee Submit Vote Submit Vote Submit Vote
Panel A. Submission Year1997 321 122 180 78 141 44 6 61998 300 137 162 85 138 52 9 51999 301 170 203 118 98 52 3 22000 435 213 287 125 148 88 5 42001 431 245 273 142 158 103 9 82002 459 256 285 160 174 96 5 42003 644 356 452 266 192 90 2 22004 710 384 486 257 224 127 38 252005 703 382 461 256 242 126 35 242006 668 419 413 277 255 142 31 232007 768 439 499 297 269 142 46 232008 735 364 448 214 287 150 42 212009 740 412 469 286 271 126 43 232010 712 415 470 284 242 131 45 312011 623 350 368 211 255 139 70 472012 573 377 351 236 222 141 94 652013 595 434 339 277 256 157 114 832014 438 414 243 232 195 182 95 91
Panel B. Proponent TypeIndividual 3,637 2,147 3,112 1,887 525 260 81 63Public Pension Funds 887 496 306 188 581 308 136 96Unions 2,607 1,469 2,245 1,257 362 212 183 135Religious 1,185 689 235 136 950 553 55 38SRI Funds 1,072 590 187 107 885 483 199 134Otherf 768 498 304 226 464 272 38 21
Total 10,156 5,889 6,389 3,801 3,767 2,088 692 487
Note: a = Corporate governance-related proposals, b = Social resolution-issue (SRI) proposals, c = Corporatepolitical activity (sub-category of social proposals), d = number of proposals submitted , e = number ofproposals being voted, f = includes endowment, hedge funds, and special interest groups such as People forthe Ethical Treatment for Animals (PETA).
12
focus on corporate governance issues. On the other hand, shareholder proponents such
as public pension funds, religious groups, and SRI funds such as Trillium Asset Manage-
ment submitted more proposals on social issues than corporate governance. With respect
to proposals on corporate political spending, SRI Funds submitted the most proposals,
followed by unions and public pension funds shareholders.15
In addition, we collected information on corporate political activity from the Cen-
ter for Responsive Politics for the period between 1997 through 2014.16 For campaign
contributions, we gathered three specific types of campaign contributions. First, CEOs’
campaign contributions to measure political preference of management (Fremeth, Richter,
and Schaufele 2013; Gupta and Wowak 2016)17; second, all individual campaign contri-
butions to Democratic and/or Republican candidates, parties, and organizations, from
donors associated with S&P 500 firms; and third, contributions made by a firm’s Political
Action Committee (PAC) to Democratic or Republican candidates, parties or organiza-
tions including other PACs. Traditionally, scholars have only collected PACs contribu-
tions to candidates and parties, but PACs frequently contribute to other PACs and these
transfer - despite their significant volume (over 40% of the total PACs’ contribution in our
data) - have been overlooked in the literature. To overcome this limitation and capture
corporate political activities in elections more accurately, we included PACs’ transfers to
other PACs in addition to their contributions to candidates in this study.18
In total, there are 1,016,646 records of contributions that are associated with S&P 50015Table A3 in Appendix A shows the top five shareholders who submitted the most proposals in each
category.16The Center for Responsive Politics (www.opensecrets.org) compiled campaign finance reports sub-
mitted to the Federal Election Commission (FEC) and lobbying reports submitted to the Clerk of theU.S. House of Representatives and the Secretary of the U.S. Senate.
17When an individual (both CEOs and non-CEOs) makes campaign contributions, the FEC requiresdisclosure of employer of the donor. We only collected individual contributions to candidates, parties,and PACs that clearly identify the recipient’s party affiliation to create a measure of political preference.For example, if a CEO contributed to a PAC which does not have a clear party affiliation in the FECdata, we did not include those contributions because it is hard to how much of the contribution fromthat CEO went to either party.
18We included the contribution in the dataset if recipient PACs have a clear party affiliation in case ofPAC to PACs transfers. Across different election cycles, on average, we could identify 99% of recipientPACs’ party affiliation for PAC to PACs transfers.
13
firms during the period of study. For lobbying activities, we calculated the total annual
lobbying expenditures at the firm level for each year. Table 2 presents the total yearly
sum of contributions and lobbying spending by S&P 500 firms and related individuals.
For individual contributors, we separately present the total campaign contributions by
CEOs from contributions by all individuals, including CEOs, who identified a S&P 500
firm as their employer.
Table 2: S&P 500 Corporate Political Activities, 1997-2014
Campaign Contribution ($M) Lobbying ($M)
Year CEO Employee PAC Spending
1997 1.4 22.0 21.7 -1998 2.9 33.9 32.2 436.41999 2.1 44.1 30.9 480.72000 6.8 82.1 59.5 513.82001 1.3 42.3 34.2 561.42002 4.7 63.2 50.6 590.82003 1.9 25.3 45.6 684.82004 5.8 51.4 66.0 705.42005 2.1 17.7 64.2 742.72006 3.5 27.5 77.5 827.22007 3.2 39.4 76.0 951.82008 6.3 71.7 85.8 1,116.22009 2.4 19.2 70.5 1,195.52010 3.6 32.8 113.3 1,236.52011 4.1 38.1 76.1 1,152.42012 8.9 103.7 108.0 1,124.72013 3.5 26.4 92.2 1,104.02014 4.2 31.2 113.2 786.3Total 69.4 772.9 1,219.3 14,211.5
Note: All numbers are inflation adjusted (in 2014 dollar term). Numbersindicate the total annual contributions and lobbying spending in millions ofdollars by S&P 500 firms and related individuals. Lobbying expenditure dataare available since 1998.
Upon examination of the data, we noticed a couple salient aspects. First, election
years tend to have more campaign contributions in all three categories of contributions
than non-election years. Second, contributions from the PACs to candidates and other
14
PACs increased over time, whereas contributions from CEOs and other individuals who
are associated with S&P 500 firms fluctuated cycle by cycle. Third, lobbying spending by
S&P 500 firms is much larger than campaign contributions by the same entities, and the
expenditures on lobbying increased over time until 2010.
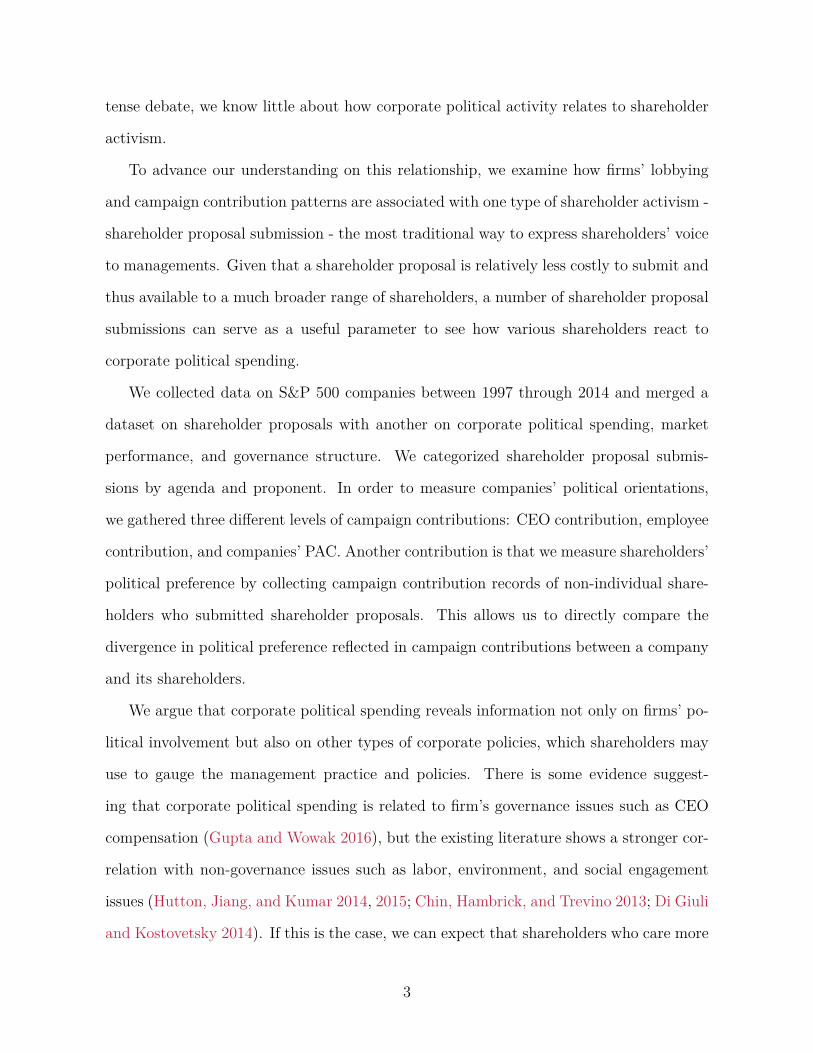
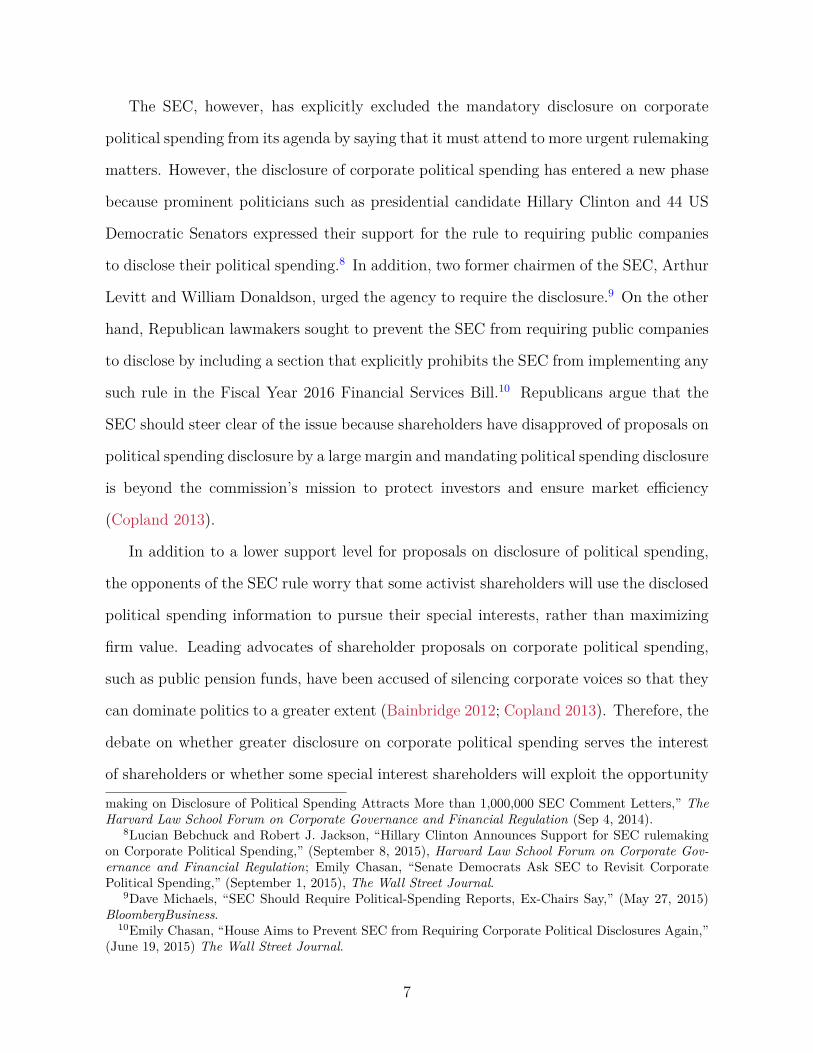
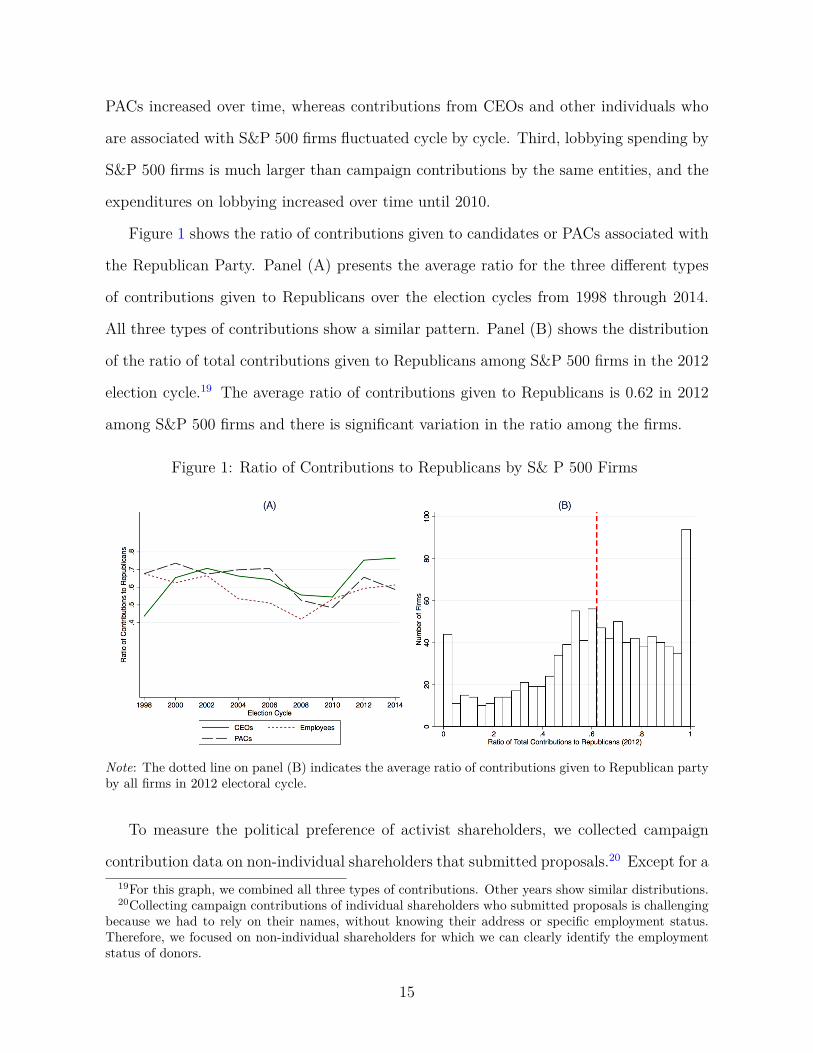
Figure 1 shows the ratio of contributions given to candidates or PACs associated with
the Republican Party. Panel (A) presents the average ratio for the three different types
of contributions given to Republicans over the election cycles from 1998 through 2014.
All three types of contributions show a similar pattern. Panel (B) shows the distribution
of the ratio of total contributions given to Republicans among S&P 500 firms in the 2012
election cycle.19 The average ratio of contributions given to Republicans is 0.62 in 2012
among S&P 500 firms and there is significant variation in the ratio among the firms.
Figure 1: Ratio of Contributions to Republicans by S& P 500 Firms
Note: The dotted line on panel (B) indicates the average ratio of contributions given to Republican partyby all firms in 2012 electoral cycle.
To measure the political preference of activist shareholders, we collected campaign
contribution data on non-individual shareholders that submitted proposals.20 Except for a19For this graph, we combined all three types of contributions. Other years show similar distributions.20Collecting campaign contributions of individual shareholders who submitted proposals is challenging
because we had to rely on their names, without knowing their address or specific employment status.Therefore, we focused on non-individual shareholders for which we can clearly identify the employmentstatus of donors.
15
few labor union shareholders such as the AFL-CIO, non-individual shareholders including
religious groups and SRI funds generally do not have PACs. Therefore, we did not separate
out individual member’s contributions and PACs contributions for shareholders. Among
256 non-individual shareholders that submitted at least one shareholder proposal during
the period, 117 shareholders made positive contributions at least one year over the period.
For each shareholder, we collected the total contributions given to candidates as well as
PACs and calculated the ratio of contributions given to Republicans. In total, there were
162,378 contributions associated by non-individual shareholders that submitted at least
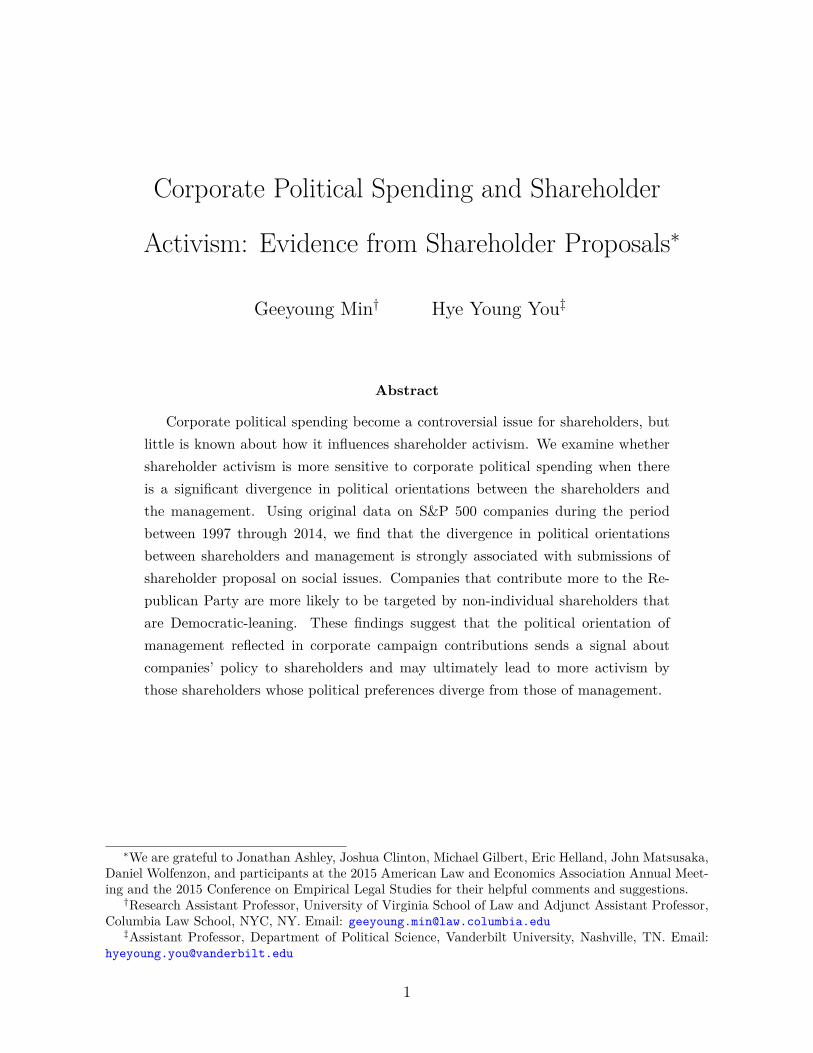
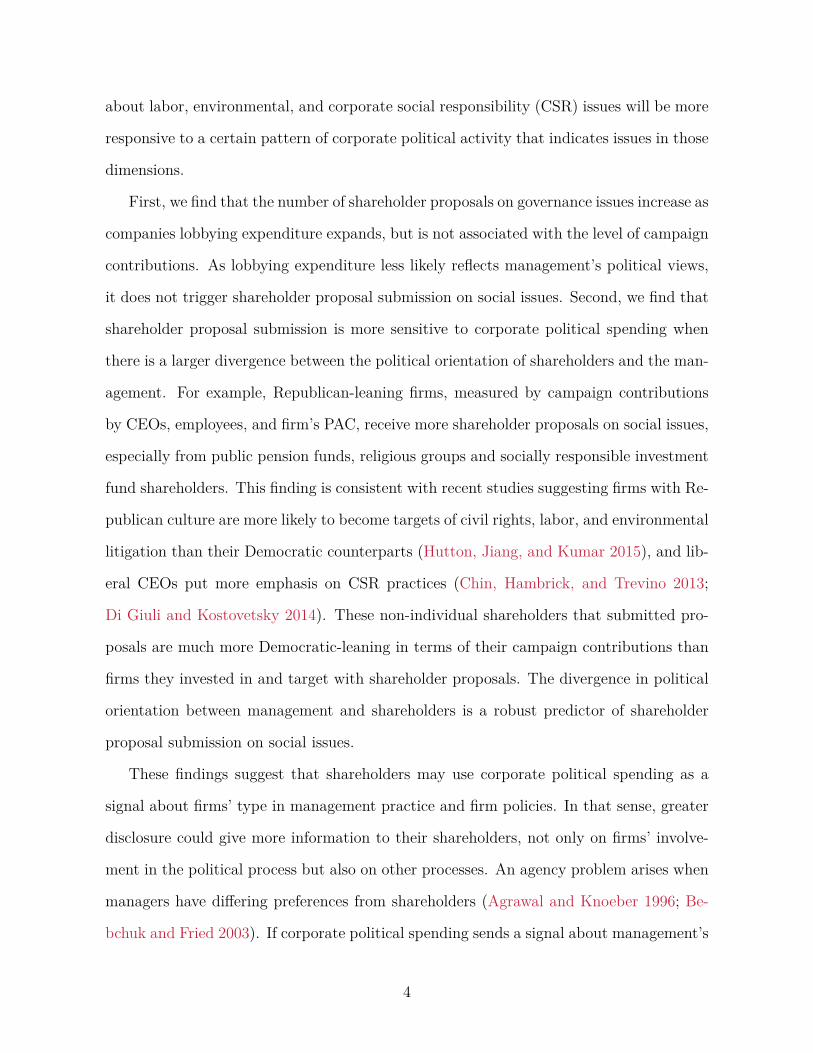
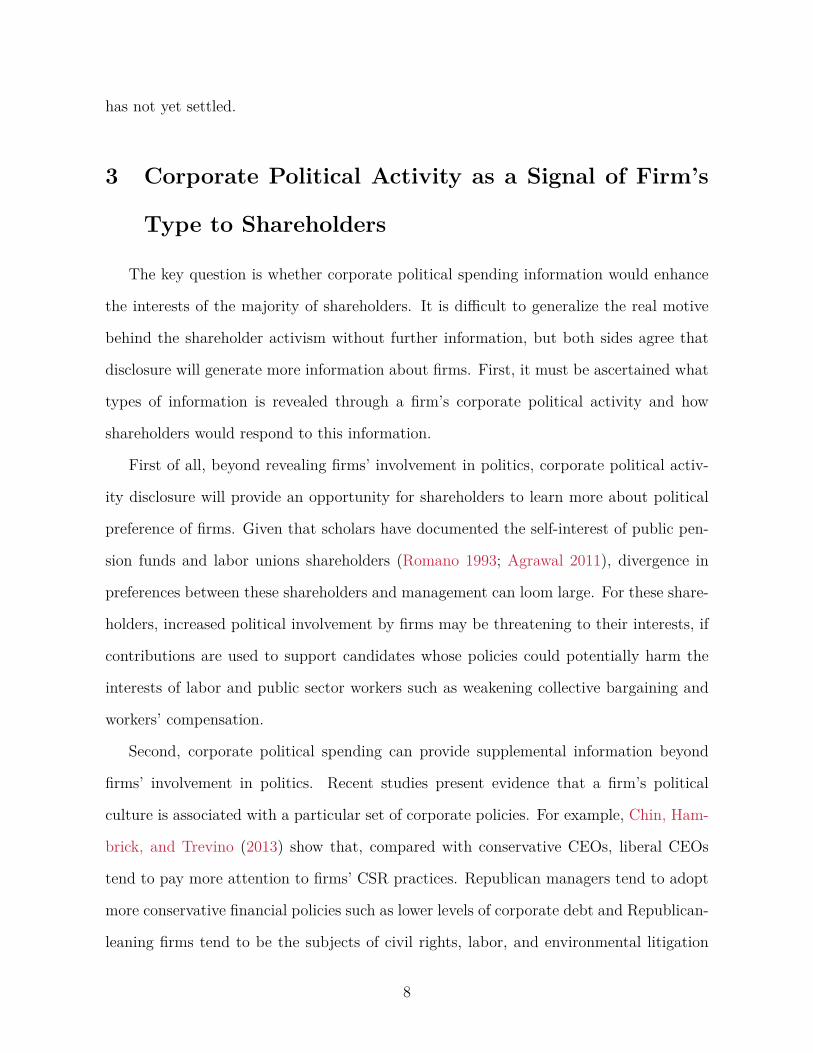
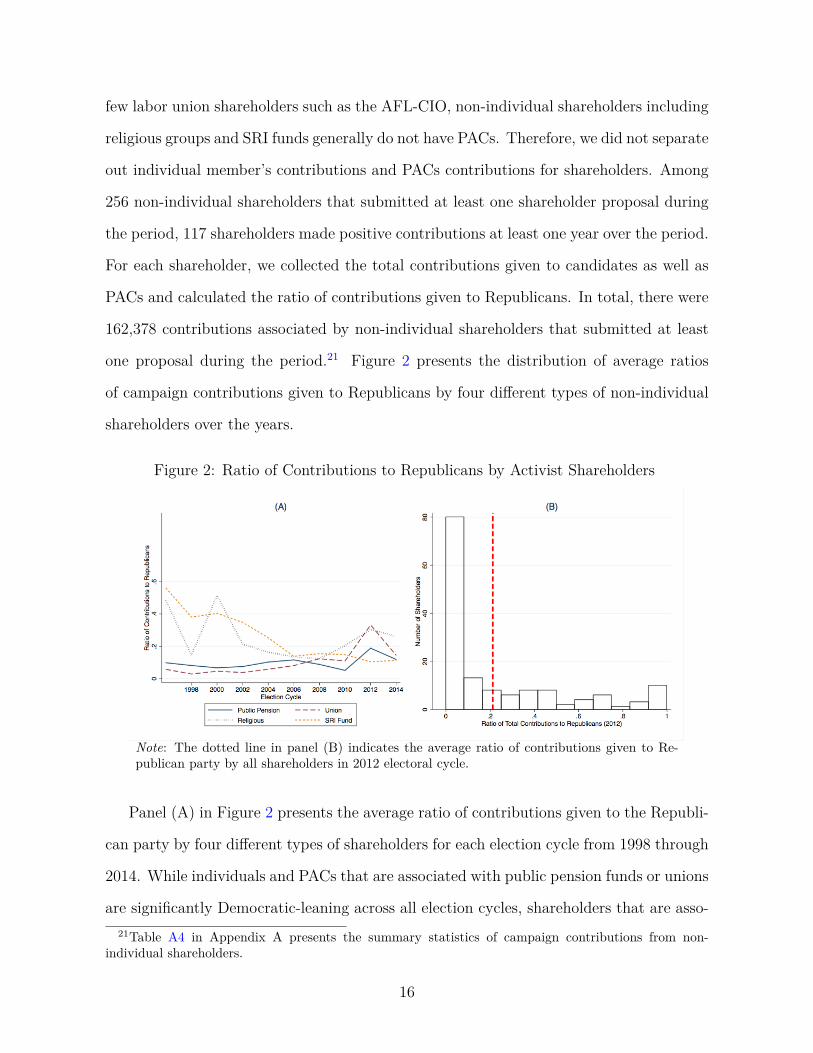
one proposal during the period.21 Figure 2 presents the distribution of average ratios
of campaign contributions given to Republicans by four different types of non-individual
shareholders over the years.
Figure 2: Ratio of Contributions to Republicans by Activist Shareholders
Note: The dotted line in panel (B) indicates the average ratio of contributions given to Re-publican party by all shareholders in 2012 electoral cycle.
Panel (A) in Figure 2 presents the average ratio of contributions given to the Republi-
can party by four different types of shareholders for each election cycle from 1998 through
2014. While individuals and PACs that are associated with public pension funds or unions
are significantly Democratic-leaning across all election cycles, shareholders that are asso-21Table A4 in Appendix A presents the summary statistics of campaign contributions from non-
individual shareholders.
16
ciated with religious organizations and SRI funds became more Democratic-leaning during
the time period. Panel (B) shows the distribution of the ratio of contributions given to the
Republican Party in all types of non-individual shareholders that made positive contribu-
tions during the 2012 election cycle. The average ratio is 0.21 which is in stark contrast
to the distribution of the ratio among S&P 500 firms in the same period, presented in
Panel (B) in Figure 1. This suggests that shareholders which submitted proposals may
have different political preferences from firms that they typically target.
In addition to data on shareholder proposals and corporate and shareholder political
activity, we gathered corporate governance information from the RiskMetrics governance
database. The data shows some discontinuity in terms of types of data collected and the
coding before 2007 versus since 2007. Therefore, we selected governance variables that are
considered important in terms of shareholder activism and that are common across all time
periods such as classified board and poison pill provisions. Then, we added firm-specific
characteristics such as annual sales, standard industry classification (SIC) and financial
performance such as Tobins’ q score from COMPUSTAT Fundamental Annual.22
5 Empirical Analysis
In this section, we test whether CPA is associated with the submission of shareholder
proposals and present the main results. The main empirical specification is as follows:
yijst = β0 + β1Republican Ratioit−1 + ΓX ′it−1 + αj + γt + εijst (1)
In the specification, yijst is the number of shareholder proposals submitted to a firm i
in an industry j from a shareholder proponent type s in a given year t. Republican Ra-
tioit−1 indicates the ratio that a firm i’s total campaign contributions given to Republican22Table A5 in Appendix A presents the mean-differences in financial characteristics, governance, and
CPA between targeted and non-targeted firms.
17
candidates and PACs. Following Hutton, Jiang, and Kumar (2015), we assume political
neutrality for the firms that do not make any contribution in a given year and assign a
value of 0.5 to the Republican Ratio variable.23 Xit includes information about financial
performance, governance characteristics, total campaign contributions and lobbying ex-
penditure of a firm in the previous year.24 We also included an industry fixed effect with
a three-digit SIC industry code (αj) as well as a year fixed effect (γt).25
Table 3 presents the results. Column (1) shows the results for all types of proponents.
Columns (2) through (5) present the results for different proponents. Panel A shows
the result when a dependent variable in Equation (1) is the total number of shareholder
proposals on governance issues. Panel B shows the result in the case when a social issue-
related proposal is submitted, and Panel C shows the result when a corporate political
spending-related proposal (a sub-category of an SRI proposal) is submitted. We only
present the results regarding corporate political variables here; the Appendix presents the
full regression results.26
Our results suggest, first, firms that spend more on lobbying tend to receive more
proposals on governance issues. This is particularly salient for proposals submitted by
individual, union, and SRI fund shareholders. Republican-leaning firms do not necessarily
receive more governance-related proposals in total, but it varies by proponents. While23Among 8,545 observations (firm × year), 1,085 observations show no campaign contributions. For
robustness checks, we ran the analysis without imputation thereby limiting the sample to the firmsthat made positive campaign contributions. We additionally ran a model including the total campaigncontribution and the total contribution given to Republican party to avoid the imputation for zerocontribution cases. In both cases, the results are similar and the results are reported in Tables A15 andA16 in Appendix C.
24For the summary statistics of the full list of variables included in the analysis, see Table A6 inAppendix A.
25A firm fixed effect would be desirable if there is enough variation in political activities within thefirm. However, firms do not show sufficient within-firm variation in their political activities. Therefore,following the literature (Hutton, Jiang, and Kumar 2015), we included an industry fixed effect to controlunobservable but time-invariant industry-specific characteristics using three-digit SIC codes. As robust-ness checks, we present the results when we used a firm fixed effect in Table A17 in Appendix C. Althoughthe statistical power declines due to the dearth of variation in the ratio of Republican contributions withina firm, results with a firm fixed effect are largely consistent with the main results.
26Full regression results for each type of proposal are presented in Tables A7, A8, and A9 in AppendixB.
18
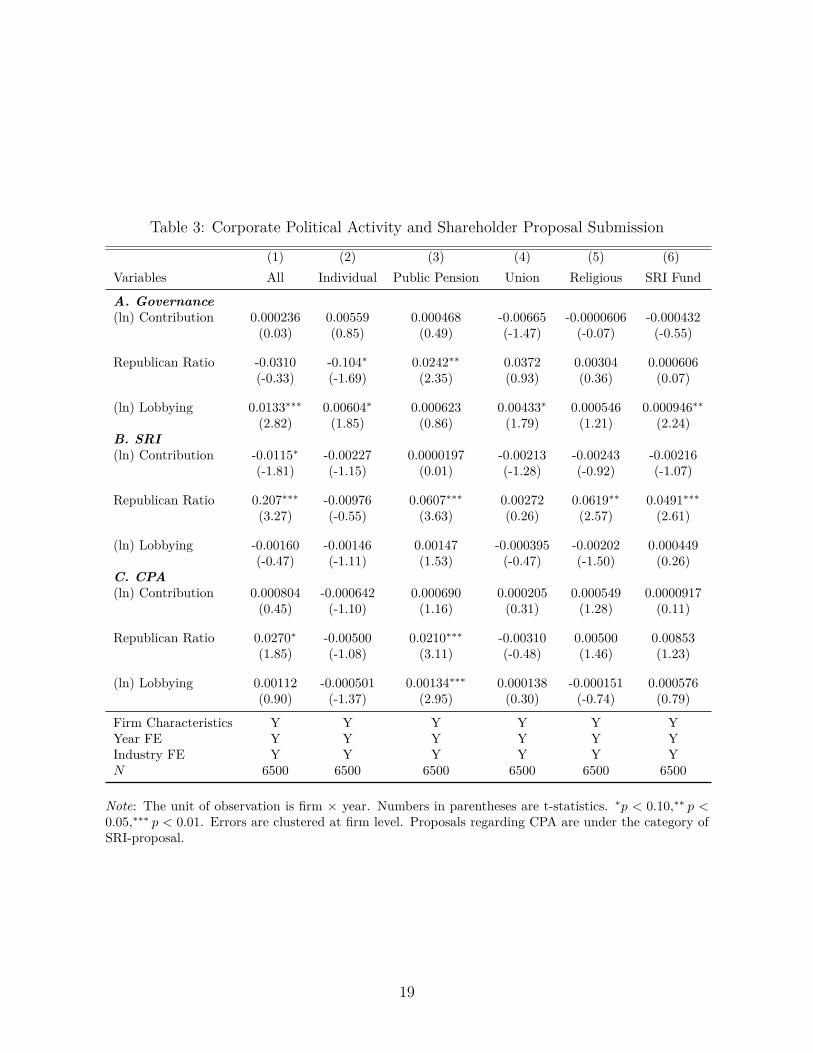
Table 3: Corporate Political Activity and Shareholder Proposal Submission
(1) (2) (3) (4) (5) (6)Variables All Individual Public Pension Union Religious SRI Fund
A. Governance(ln) Contribution 0.000236 0.00559 0.000468 -0.00665 -0.0000606 -0.000432
(0.03) (0.85) (0.49) (-1.47) (-0.07) (-0.55)
Republican Ratio -0.0310 -0.104∗ 0.0242∗∗ 0.0372 0.00304 0.000606(-0.33) (-1.69) (2.35) (0.93) (0.36) (0.07)
(ln) Lobbying 0.0133∗∗∗ 0.00604∗ 0.000623 0.00433∗ 0.000546 0.000946∗∗(2.82) (1.85) (0.86) (1.79) (1.21) (2.24)
B. SRI(ln) Contribution -0.0115∗ -0.00227 0.0000197 -0.00213 -0.00243 -0.00216
(-1.81) (-1.15) (0.01) (-1.28) (-0.92) (-1.07)
Republican Ratio 0.207∗∗∗ -0.00976 0.0607∗∗∗ 0.00272 0.0619∗∗ 0.0491∗∗∗(3.27) (-0.55) (3.63) (0.26) (2.57) (2.61)
(ln) Lobbying -0.00160 -0.00146 0.00147 -0.000395 -0.00202 0.000449(-0.47) (-1.11) (1.53) (-0.47) (-1.50) (0.26)
C. CPA(ln) Contribution 0.000804 -0.000642 0.000690 0.000205 0.000549 0.0000917
(0.45) (-1.10) (1.16) (0.31) (1.28) (0.11)
Republican Ratio 0.0270∗ -0.00500 0.0210∗∗∗ -0.00310 0.00500 0.00853(1.85) (-1.08) (3.11) (-0.48) (1.46) (1.23)
(ln) Lobbying 0.00112 -0.000501 0.00134∗∗∗ 0.000138 -0.000151 0.000576(0.90) (-1.37) (2.95) (0.30) (-0.74) (0.79)
Firm Characteristics Y Y Y Y Y YYear FE Y Y Y Y Y YIndustry FE Y Y Y Y Y YN 6500 6500 6500 6500 6500 6500
Note: The unit of observation is firm × year. Numbers in parentheses are t-statistics. ∗p < 0.10,∗∗ p <0.05,∗∗∗ p < 0.01. Errors are clustered at firm level. Proposals regarding CPA are under the category ofSRI-proposal.
19
Republican-leaning firms tend to receive less governance proposals from individuals share-
holders, they receive more governance proposals from public pension fund shareholders.
Second, Republican-leaning firms tend to receive more shareholder proposals regard-
ing social issues which is mainly driven by shareholders associated with public pension
funds, religious groups, and SRI funds. This is consistent with the fact that these types
of shareholders are reported to put more weight on social issues than other types of share-
holders like individual investors or hedge funds (Renneboog, Horst, and Zhang 2008).
Shareholder proposals on corporate political spending are commonly categorized as SRI
proposals. However, we ran a separate analysis on them to see whether CPA proposal
submissions show a distinctive pattern. Public pension fund shareholders in particular
are more likely to submit proposals on CPA to firms that are Republican-leaning and that
spend more on lobbying. Submissions from other types of shareholders are not associated
with CPA.
We also divided the total contributions into two categories: contributions made by
CEOs and contributions made by firms’ PACs, after which we ran the same analysis to
see whether shareholders are more responsive to certain types of contribution patterns.27
Although individual shareholders tend to submit less governance-related proposals and
religious groups tend to submit more proposals on CPA if CEOs are Republican-leaning,
the most robust pattern is that firms receive much more social issue-related proposals
from public pension, religious, and SRI fund shareholders when firms’ chosen PAC is
Republican-leaning.28
Given that the ratio of campaign contributions to the Republican party in each elec-
tion cycle is endogenous, one concern for our analysis would be that there might still be
the possibility of reverse causality or omitted variable bias. To address these issues, we
employed an instrumental variable analysis. Following Hutton, Jiang, and Kumar (2015),27For this exercise, we also assign a value of 0.5 to Republican Ratio variables if there is no contribution
record by CEOs or PACs.28The results are reported in Table A10 in Appendix B.
20
we identified a state where each S&P 500 firms’ headquarters is located from COMPUS-
TAT and used the headquarter-state’s gun ownership rate in 1994 as an instrument for the
ratio of contributions given to Republicans.29 The rationale is that firms located in states
with higher gun-ownership are more likely to contribute to Republican party since local
political culture may influence how firms contribute during elections but gun ownership
in home-states of S&P 500 firms in 1994 should not directly influence the shareholder
proposal submissions from 1997 through 2014.
We find that the relationship between home-state gun ownership in 1994 and firms’
contribution ratio given to Republicans is strong and statistically significant at 1% level
(first-stage). The F -statistic is 56.47 which is sufficiently large to avoid a weak instrument
variable issue.30 The results from instrumental variable analysis are largely consistent
with the results presented in Table 3. Public pensions and SRI funds are more likely
to submit shareholder proposals on social issues if a firm’s campaign contributions are
Republican-leaning.
Proponent type may be a good indicator for a proponent’s political preference to
register the existence of a potential preference gap between management and shareholders,
but it is possible that shareholders may own shares of firms that exhibit similar political
preferences. For example, public pension fund shareholders may own more shares of firms
that are Democratic-leaning in their political culture and that are sympathetic to issues
that affect public pension funds. If this type of sorting behavior happens in the decision-
making stage of investment, shareholder type may not accurately capture the preference
difference between firms and shareholders.
To address the issue, we employed a more direct test. Using campaign contributions
by non-individual shareholders, we calculated total campaign contributions and the ratio29Like Hutton, Jiang, and Kumar (2015), we use the home-state gun ownership data from the National
Study of Private Ownership of Firearms in the United States conducted in 1994.30The results with the instrumental variable analysis are presented in Table A18 in Appendix C.
Generally an F statistic over 10 is required to be considered sufficiently strong (Stock, Wright, andmotohiro Yogo 2002).
21
of contributions given to the Republican party by each shareholder type that submitted
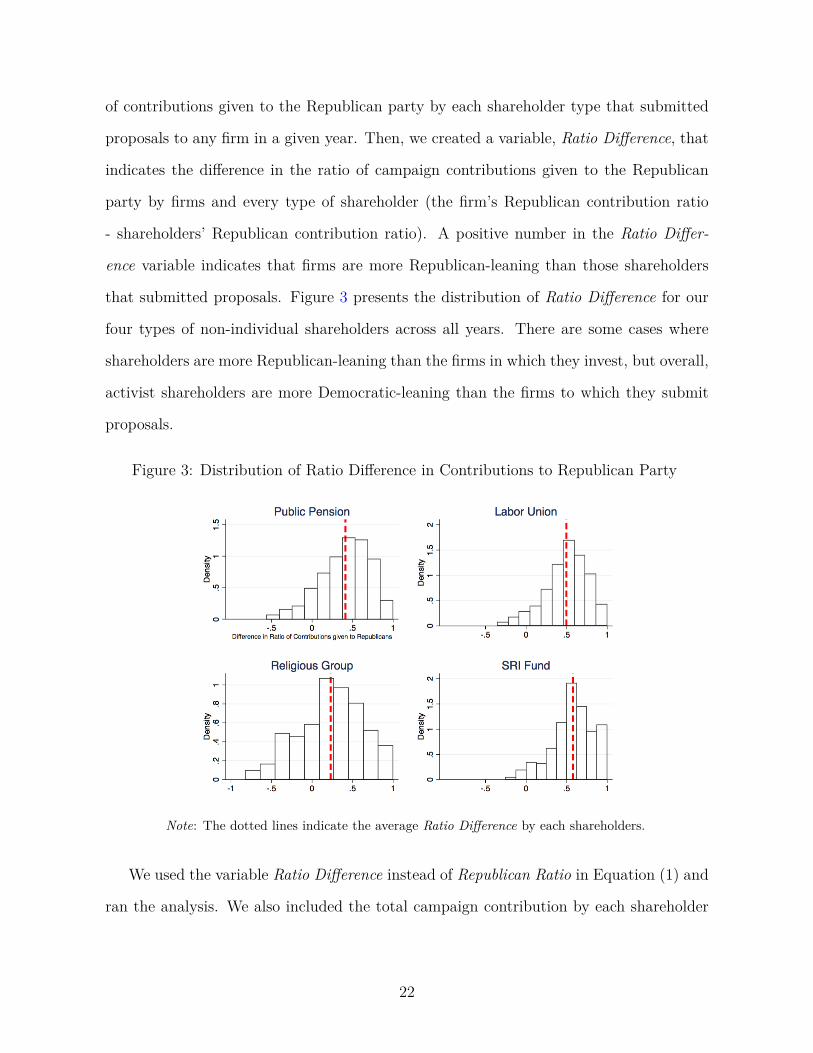
proposals to any firm in a given year. Then, we created a variable, Ratio Difference, that
indicates the difference in the ratio of campaign contributions given to the Republican
party by firms and every type of shareholder (the firm’s Republican contribution ratio
- shareholders’ Republican contribution ratio). A positive number in the Ratio Differ-
ence variable indicates that firms are more Republican-leaning than those shareholders
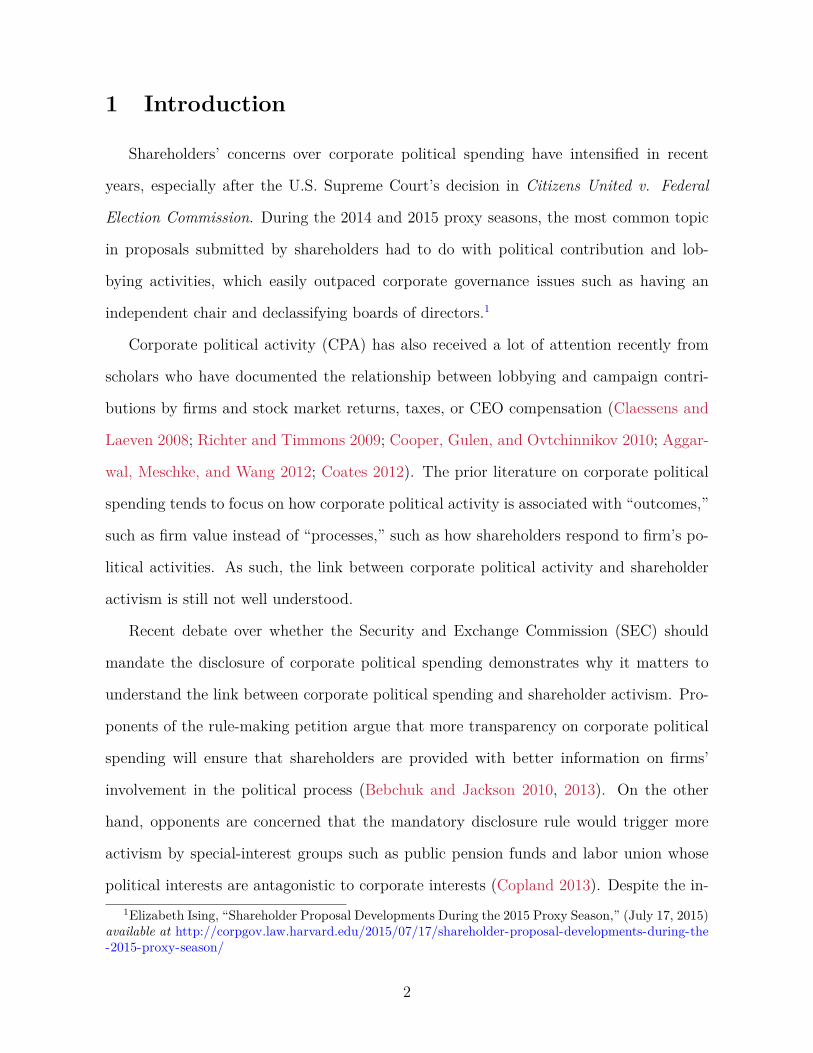
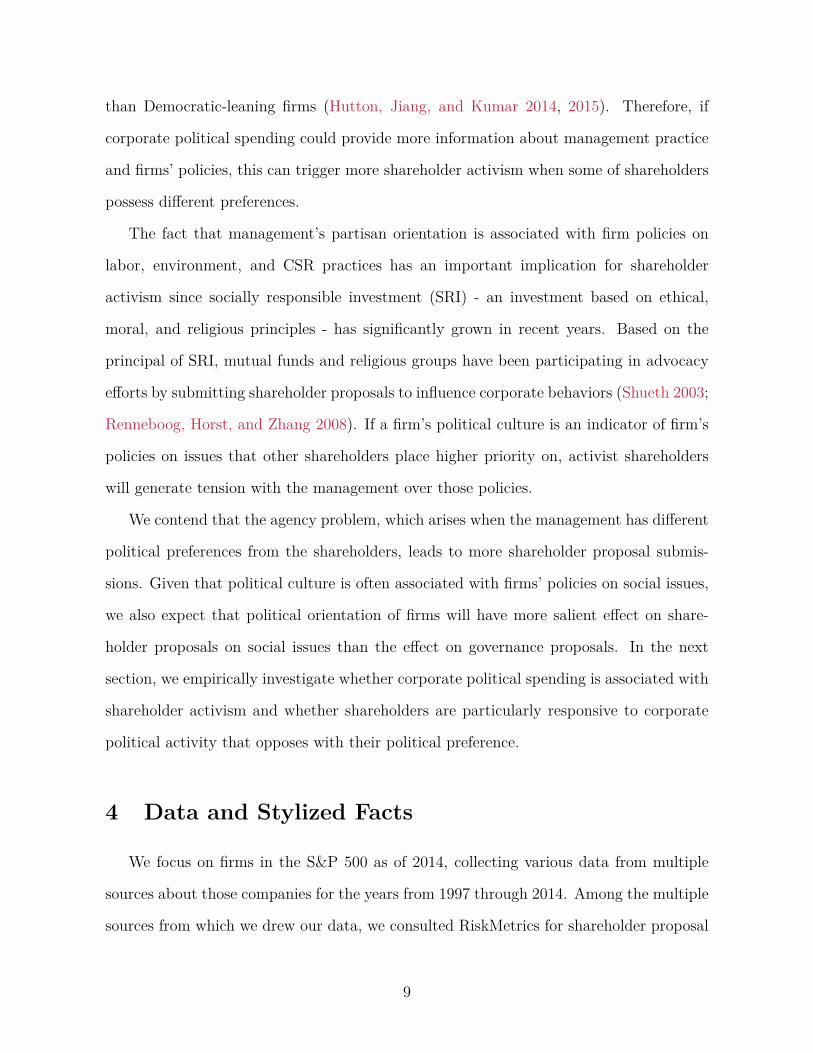
that submitted proposals. Figure 3 presents the distribution of Ratio Difference for our
four types of non-individual shareholders across all years. There are some cases where
shareholders are more Republican-leaning than the firms in which they invest, but overall,
activist shareholders are more Democratic-leaning than the firms to which they submit
proposals.
Figure 3: Distribution of Ratio Difference in Contributions to Republican Party
Note: The dotted lines indicate the average Ratio Difference by each shareholders.
We used the variable Ratio Difference instead of Republican Ratio in Equation (1) and
ran the analysis. We also included the total campaign contribution by each shareholder
22
as a control variable.31 Table 4 presents the results with respect to variables on politi-
cal spending.32 First, non-individual shareholders that are more likely to contribute to
candidates and PACs are more likely to submit both governance and social issue-related
proposals. Second, the difference in the ratio of contributions given to Republican party
between firms and shareholders is strongly associated with the submission of SRI proposals
for public pension, religious, and SRI fund shareholders. Specifically, Republican-leaning
firms tend to receive more shareholder proposals on social issues. However, we do not ob-
serve the pattern that the difference in political preference is associated with submission
on governance issues. Third, this pattern is also true for proposals on CPA by shareholders
associated with public pension funds.33
One surprising pattern is the result with respect to union shareholders. Union share-
holders that make more campaign contributions are more likely to submit shareholder
proposals both on governance and social issues. The frequency of union shareholders’
proposal submissions, however, is not sensitive to companies’ political preference. The re-
sults presented in Table 4 suggest that the difference in political preference is significantly
associated with the submission of social issue proposals. However, Table 1 shows that
unions heavily focus on governance proposals, compared to other non-individual share-
holders, where we do not observe the effect of political difference on shareholder activism.
Only 14% of the total proposals that union shareholders submitted were on social issues.
In contrast, 65% of the total proposals submitted by public pensions and 82% of the
those submitted by SRI funds were on social issues. Union shareholders’ disproportionate
focus on governance issues may explain why we do not see the same pattern for union31If non-individual shareholders that submitted proposals did not contribute at all, we assume political
neutrality for those shareholders, following Hutton, Jiang, and Kumar (2015), and assign a value of 0.5to the ratio of shareholder’s contribution to Republicans.
32For the full regression results, see Tables A11, A12, and A13 in Appendix B. As a robustness check,we also present the results when we include a firm fixed effect in Table A19 in Appendix C.
33We also divide firms’ contributions into those by CEOs and by PACs to create the Republican Ratiodifference measures between each type of firm contribution and each shareholder to see whether certainshareholders are more responsive to a difference of political preference. Table A14 in Appendix B. Share-holders seem more responsive to the difference between their contribution and firms’ PAC contributionsthan CEOs’ contributions.
23
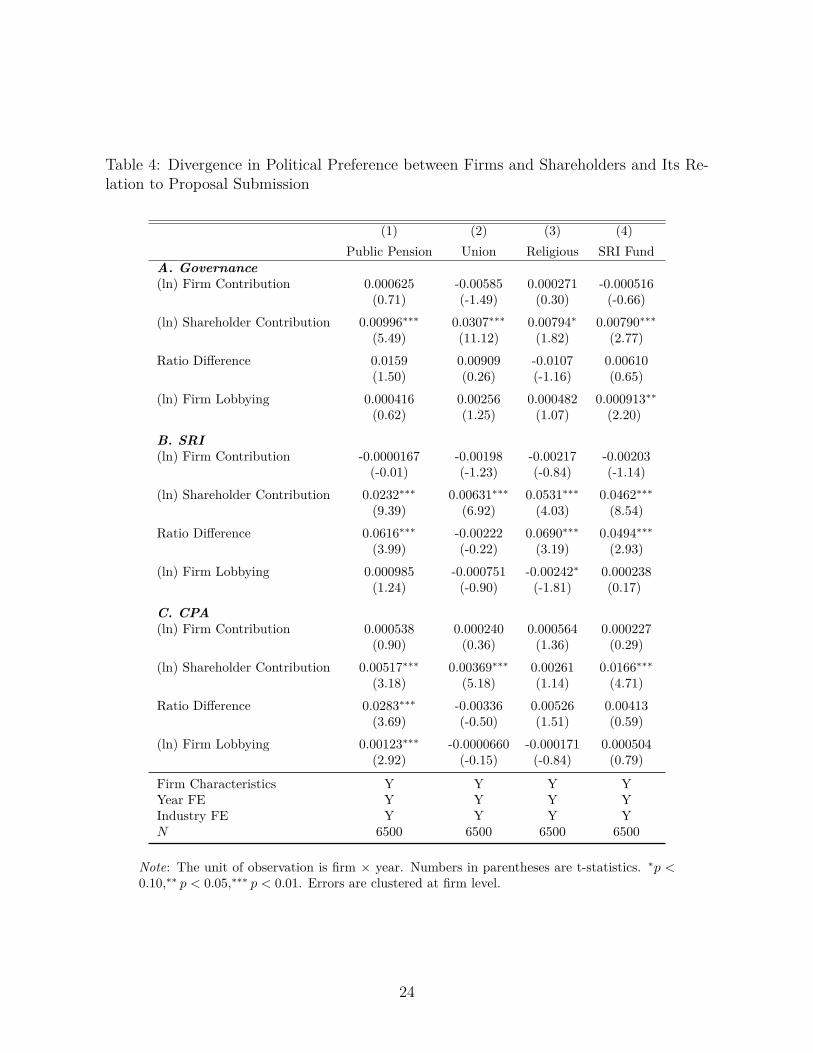
Table 4: Divergence in Political Preference between Firms and Shareholders and Its Re-lation to Proposal Submission
(1) (2) (3) (4)Public Pension Union Religious SRI Fund
A. Governance(ln) Firm Contribution 0.000625 -0.00585 0.000271 -0.000516
(0.71) (-1.49) (0.30) (-0.66)(ln) Shareholder Contribution 0.00996∗∗∗ 0.0307∗∗∗ 0.00794∗ 0.00790∗∗∗
(5.49) (11.12) (1.82) (2.77)Ratio Difference 0.0159 0.00909 -0.0107 0.00610
(1.50) (0.26) (-1.16) (0.65)(ln) Firm Lobbying 0.000416 0.00256 0.000482 0.000913∗∗
(0.62) (1.25) (1.07) (2.20)
B. SRI(ln) Firm Contribution -0.0000167 -0.00198 -0.00217 -0.00203
(-0.01) (-1.23) (-0.84) (-1.14)(ln) Shareholder Contribution 0.0232∗∗∗ 0.00631∗∗∗ 0.0531∗∗∗ 0.0462∗∗∗
(9.39) (6.92) (4.03) (8.54)Ratio Difference 0.0616∗∗∗ -0.00222 0.0690∗∗∗ 0.0494∗∗∗
(3.99) (-0.22) (3.19) (2.93)(ln) Firm Lobbying 0.000985 -0.000751 -0.00242∗ 0.000238
(1.24) (-0.90) (-1.81) (0.17)
C. CPA(ln) Firm Contribution 0.000538 0.000240 0.000564 0.000227
(0.90) (0.36) (1.36) (0.29)(ln) Shareholder Contribution 0.00517∗∗∗ 0.00369∗∗∗ 0.00261 0.0166∗∗∗
(3.18) (5.18) (1.14) (4.71)Ratio Difference 0.0283∗∗∗ -0.00336 0.00526 0.00413
(3.69) (-0.50) (1.51) (0.59)(ln) Firm Lobbying 0.00123∗∗∗ -0.0000660 -0.000171 0.000504
(2.92) (-0.15) (-0.84) (0.79)
Firm Characteristics Y Y Y YYear FE Y Y Y YIndustry FE Y Y Y YN 6500 6500 6500 6500
Note: The unit of observation is firm × year. Numbers in parentheses are t-statistics. ∗p <0.10,∗∗ p < 0.05,∗∗∗ p < 0.01. Errors are clustered at firm level.
24
shareholders on social issue-related proposal submissions.
In addition, recent studies document how labor union shareholders are mainly in-
terested in increasing their influence in unionized firms and bargaining leverage through
shareholder proposals (Agrawal (2011); Matsusaka, Ozbas, and Yi (2015)). This may also
explain why labor union shareholders are not particularly responsive to firms’ political
orientation. Unlike other non-individual shareholders, labor unions have a direct channel
to management and accordingly have much more information about certain companies.
Thus, they are less likely sensitive to companies’ political preference revealed through
corporate political spending because the information is likely not new to them.
Overall, the results presented in Tables 3 and 4 suggest that Republican-leaning firms
receive more proposals on social resolutions, particularly from shareholders associated
with public pension funds, religious groups, and SRI funds. Given that we control for
variables related to corporate governance and financial performance, the argument that
Republican-leaning firms have systematically different governance or market performance
can be ruled out. The fact that the difference in political preference measured by campaign
contribution patterns is strongly related to proposal submission on social issues suggests
that shareholders may use CPA as a proxy for corporate policy on social issues.
From the shareholder’s perspective, the agency problem in controlling management
is most severe when the preference divergence between the shareholder and management
is larger (Matsusaka and Ozbas 2014). Shareholders cannot observe the true preference
of management, but they can use corporate political spending, a decision made by man-
agement, as a means to discern where management stands. Active shareholders whose
political orientation is more aligned with Democrats may perceive Republican-favoring
contribution patterns by firms as an indicator of a potential agency problem. This result
suggests that firms exhibiting a significant difference in political contribution patterns
from their activist shareholders may have more conflicts between management and other
stakeholders in issue areas where their shareholders care, leading to increased shareholder
25
activism.
6 Conclusion
Shareholder proposals requesting disclosure on CPA have significantly increased in
the wake of Citizens United, but despite heightened shareholder focus on CPA, there
is little empirical research on how increased CPA influences shareholders. This paper
advances our understanding of the relationship between CPA and shareholder activism.
We find that shareholder activism is more sensitive to CPA if there is a larger divergence
between the political orientation of shareholders and management. Our results indicate
that Republican-leaning firms receive more shareholder proposals regarding social issues
from their public pension, religious group, and SRI fund shareholders that are more
Democratic-leaning than the firms. We present evidence that the divergence in political
preference between a firm and its shareholders is strongly associated with an increase in
the number of shareholder proposal submissions on social issues.
How shall we think about CPA and its disclosure? Our results imply that increased
CPA reveals information about firms’ policies on various issues, and this, in turn, can spark
activism by certain shareholders who have divergent political views and preferences from
firms’. As social and political issues become more important in shareholder activism, it is
crucial to understand how shareholders may get a sense of the firm’s social and political
leaning. For shareholders, CPA signals firms’ political leaning and their stances on social
issues in addition to information on the firms’ political involvement.
This has an important implication for the long-held debate on the mandatory disclo-
sure of CPA and the role of special-interest shareholders. The more complete, consistent,
and accessible disclosure of political spending will allow shareholders to be better in-
formed of companies they invest in. At the same time, our result also shows that the
more information may galvanize certain shareholders to submit proposals. The fact that
26
Democratic-leaning shareholders tend to target Republican-leaning firms, however, does
not necessarily mean that these shareholders act adversely to firms’ interests. For exam-
ple, when firms with certain political orientations have systemic issue between labor and
management and this disrupts production at the plant level, activism by shareholders
who prioritize labor issues can potentially benefit other shareholders by challenging firms’
policies.34
On the contrary, if shareholder activism is motivated, for example, by the narrow
self-interests of politically-oriented boards of trustees of public pension funds due to their
career concerns, politically-biased activism may create the potentially harmful outcomes
of their motives to other shareholders. Accordingly, the question of whether the activism
by shareholding special-interest groups, often times with strong political preferences, is
beneficial or harmful to firms requires more future research.
34For example, Krueger and Mas (2004) show that labor strife at the plant level is related to lowerproduct quality.
27
ReferencesAggarwal, Rajesh, Felix Meschke, and Tracy Wang. 2012. “Corporate Political Donations:Investment or Agency?” Business and Politics 14 (1): 1-38.
Agrawal, Anup, and Charles Knoeber. 1996. “Firm Performance and Mechanisms to Con-trol Agency Problem between Managers and Shareholders.” Journal of Financial andQuantitative Analysis 31 (3): 377-397.
Agrawal, Ashwini. 2011. “Corporate Governance Objectives of Labor Union Shareholders:Evidence from Proxy Voting.” Journal of Financial Studies 24 (1): 1-40.
Ansolabehere, Stephen, John M. de Figueiredo, and James Snyder. 2003. “Why Is ThereSo Little Money in U.S. Politics?” Journal of Economic Perspectives 17 (1): 105-130.
Bainbridge, Stephen. 2012. Corporate Governance after the Financial Crisis. Oxford Uni-versity Press.
Bebchuk, Lucian, and Jesse Fried. 2003. “Executive Compensation as an Agency Prob-lem.” Journal of Economic Perspectives 17 (3): 71-92.
Bebchuk, Lucian, and Robert Jackson. 2010. “Corporate Political Speech: Who Decides?”Harvard Law Review 124 (1): 83-117.
Bebchuk, Lucian, and Robert Jackson. 2013. “Shining Light on Corporate Political Spend-ing.” Georgetown Law Journal 101 (4): 923-967.
Briffault, Richard. 2012. “Super PACs.” Minnesota Law Review 96 (5): 1644-1693.
Chin, M.K, Donald Hambrick, and Linda Trevino. 2013. “Political Ideologies of CEOs:The Influence of Executives’ Values on Corporate Social Responsibility.” AdministrativeScience Quarterly 58 (2): 197-232.
Claessens, Stijn, Erik Feijen, and Luc Laeven. 2008. “Political Connections and Prefer-ential Access to Finance: The Role of Campaign Contributions.” Journal of FinancialEconomics 88 (3): 554-580.
Coates, John. 2012. “Corporate Politics, Governance, and Value Before and After CitizenUnited.” Journal of Empirical Legal Studies 9 (4): 657-696.
Cooper, Michael J., Huseyin Gulen, and Alexei V. Ovtchinnikov. 2010. “Corporate Polit-ical Contributions and Stock Returns.” Journal of Finance 65 (2): 687-724.
Copland, James. 2013. “Against an SEC-Mandated Rule on Political Spending Disclosure:A Reply to Bebchuk and Jackson.” Harvard Business Law Review 3 (2): 381-411.
Di Giuli, Alberta, and Leonard Kostovetsky. 2014. “Are Red and Blue Companies MoreLikely To Go Green? Politics and Corporate Social Responsiblity.” Journal of FinancialEconomics 111: 158-180.
28
Drutman, Lee. 2015. The Business of America is Lobbying: How Corporations BecamePoliticized and Politics Became More Corporate. Oxford University Press.
Fremeth, Adam, Brian Kelleher Richter, and Brandon Schaufele. 2013. “Campaign Con-tributions over CEOs’ Careers.” American Economic Journal: Applied Economics 5 (3):170-188.
Gupta, Abhinav, and Adam Wowak. 2016. “The Elephant (or Donkey) in the Boardroom:How Board Political Ideology Affects CEO Pay.” Administrative Science Quarterly.
Hutton, Irena, Danling Jiang, and Alok Kumar. 2014. “Corporate Policies of RepublicanManagers.” Journal of Financial and Quantitative Analysis 49 (5/6): 1279-1310.
Hutton, Irena, Danling Jiang, and Alok Kumar. 2015. “Political Values, Culture, andCorporate Litigation.” Management Science 61 (12): 2905-2925.
Kang, Michael. 2010. “After Citizens United.” Indiana Law Review 44: 243-254.
Kang, Michael. 2012. “The End of Campaign Finance Law.” Virginia Law Review 98 (1):1-65.
Krueger, Alan, and Alexandre Mas. 2004. “Strikes, Scabs, and Tread Separations: LaborStrife and the Production of Defective Bridgestone/Firestone Tires.” Journal of PoliticalEconomy 112 (2): 253-289.
Matsusaka, John G., and Oguzhan Ozbas. 2014. “Managerial Accomodation, Proxy Ac-cess, and the Cost of Shareholder Empowerment.” Marshall School of Business, Uni-versity of Southern California Working Paper.
Matsusaka, John G., Oguzhan Ozbas, and Irene Yi. 2015. “Opportunistic Proposals byUnion Shareholders.” Marshall School of Business, University of Southern CaliforniaWorking Paper.
Renneboog, Luc, Jenke Ter Horst, and Chendi Zhang. 2008. “Socially Responsible Invest-ments: Institutional Aspects, Performance, and Investor Behavior.” Journal of Banking& Finance 32: 1723-1742.
Renneboog, Luc, and Peter G. Szilagyi. 2011. “The Role of Shareholder Proposals inCorporate Governance.” Journal of Corporate Finance 17 (1): 167-188.
Richter, Brian Kelleher, Krislert Samphantharak, and Jeffrey F. Timmons. 2009. “Lob-bying and Taxes.” American Journal of Political Science 53 (4): 893-909.
Romano, Roberta. 1993. “Public Pension Fund Activism in Corporate Governance Re-considered.” Columbia Law Review 93 (4): 795-853.
Shueth, Steve. 2003. “Socially Responsible Investing in the United States.” Journal ofBusiness Ethics 43 (3): 189-194.
29

Stock, James, Jonathan Wright, and motohiro Yogo. 2002. “Survey of Weak Instrumentsand Weak Identification in Generalized Methods of Moments.” Journal of Business &Economic Statistics 20 (4): 518-529.
30
Appendix A: Data Description and Summary Statis-tics
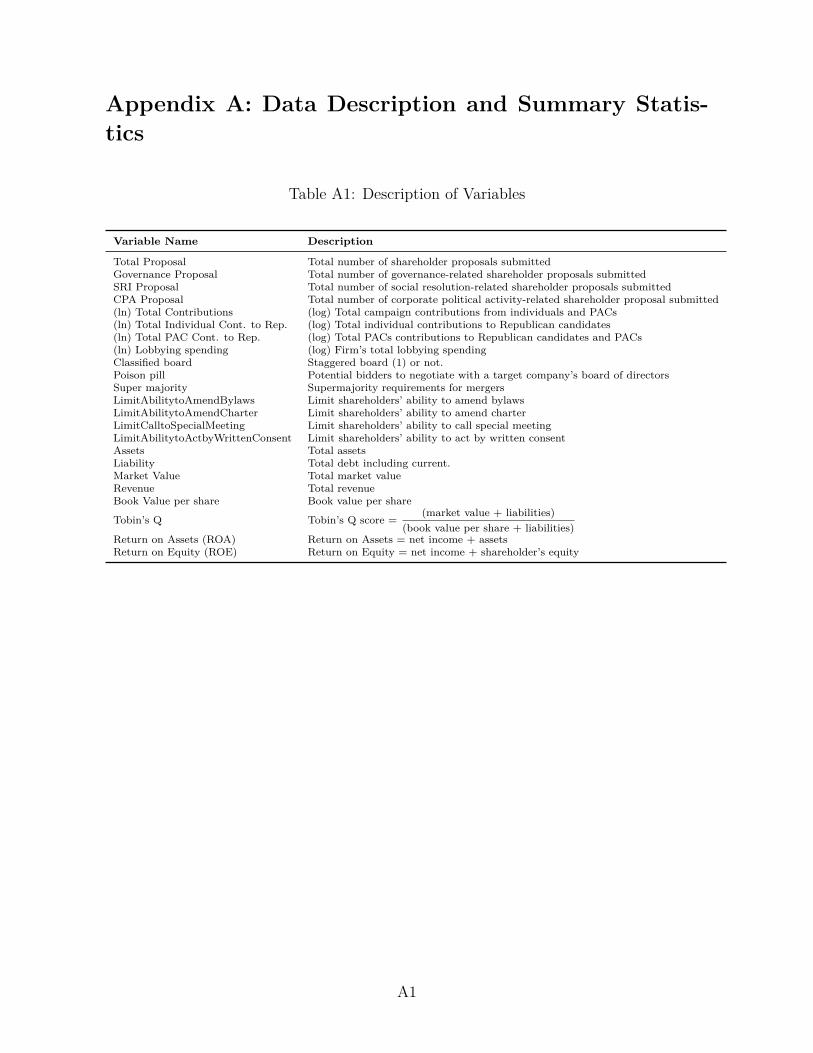
Table A1: Description of Variables
Variable Name Description
Total Proposal Total number of shareholder proposals submittedGovernance Proposal Total number of governance-related shareholder proposals submittedSRI Proposal Total number of social resolution-related shareholder proposals submittedCPA Proposal Total number of corporate political activity-related shareholder proposal submitted(ln) Total Contributions (log) Total campaign contributions from individuals and PACs(ln) Total Individual Cont. to Rep. (log) Total individual contributions to Republican candidates(ln) Total PAC Cont. to Rep. (log) Total PACs contributions to Republican candidates and PACs(ln) Lobbying spending (log) Firm’s total lobbying spendingClassified board Staggered board (1) or not.Poison pill Potential bidders to negotiate with a target company’s board of directorsSuper majority Supermajority requirements for mergersLimitAbilitytoAmendBylaws Limit shareholders’ ability to amend bylawsLimitAbilitytoAmendCharter Limit shareholders’ ability to amend charterLimitCalltoSpecialMeeting Limit shareholders’ ability to call special meetingLimitAbilitytoActbyWrittenConsent Limit shareholders’ ability to act by written consentAssets Total assetsLiability Total debt including current.Market Value Total market valueRevenue Total revenueBook Value per share Book value per share
Tobin’s Q Tobin’s Q score =(market value + liabilities)
(book value per share + liabilities)Return on Assets (ROA) Return on Assets = net income + assetsReturn on Equity (ROE) Return on Equity = net income + shareholder’s equity
A1
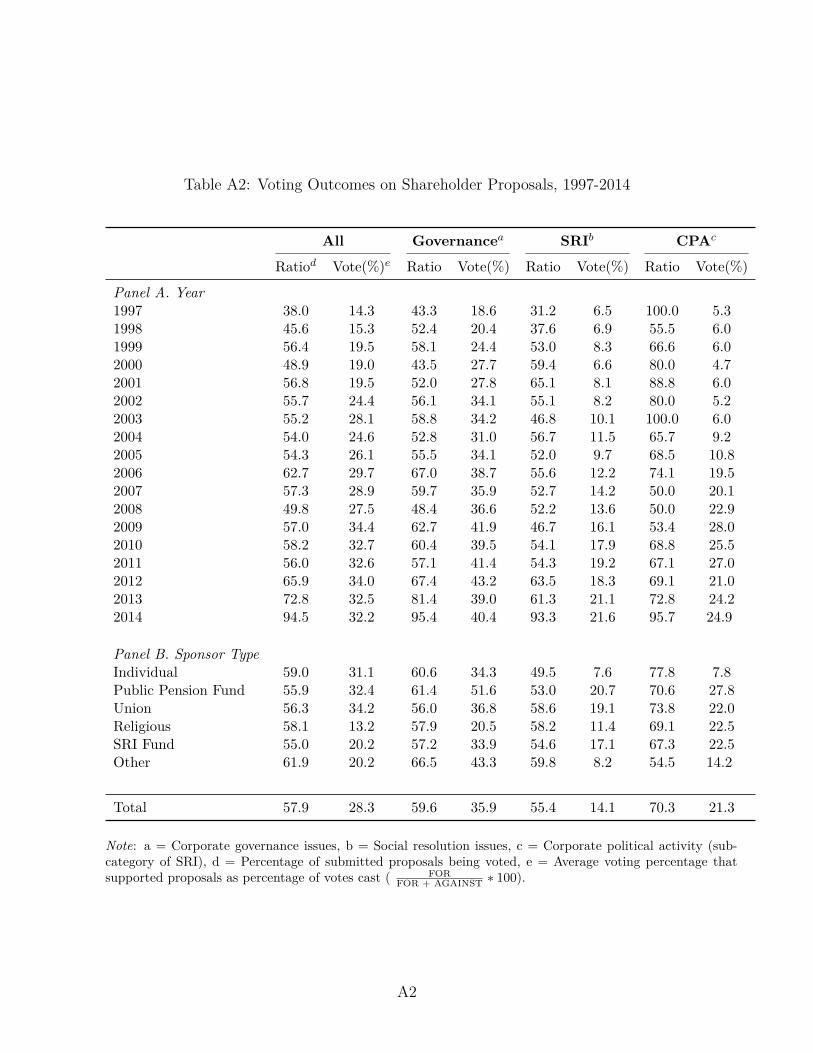
Table A2: Voting Outcomes on Shareholder Proposals, 1997-2014
All Governancea SRIb CPAc
Ratiod Vote(%)e Ratio Vote(%) Ratio Vote(%) Ratio Vote(%)
Panel A. Year1997 38.0 14.3 43.3 18.6 31.2 6.5 100.0 5.31998 45.6 15.3 52.4 20.4 37.6 6.9 55.5 6.01999 56.4 19.5 58.1 24.4 53.0 8.3 66.6 6.02000 48.9 19.0 43.5 27.7 59.4 6.6 80.0 4.72001 56.8 19.5 52.0 27.8 65.1 8.1 88.8 6.02002 55.7 24.4 56.1 34.1 55.1 8.2 80.0 5.22003 55.2 28.1 58.8 34.2 46.8 10.1 100.0 6.02004 54.0 24.6 52.8 31.0 56.7 11.5 65.7 9.22005 54.3 26.1 55.5 34.1 52.0 9.7 68.5 10.82006 62.7 29.7 67.0 38.7 55.6 12.2 74.1 19.52007 57.3 28.9 59.7 35.9 52.7 14.2 50.0 20.12008 49.8 27.5 48.4 36.6 52.2 13.6 50.0 22.92009 57.0 34.4 62.7 41.9 46.7 16.1 53.4 28.02010 58.2 32.7 60.4 39.5 54.1 17.9 68.8 25.52011 56.0 32.6 57.1 41.4 54.3 19.2 67.1 27.02012 65.9 34.0 67.4 43.2 63.5 18.3 69.1 21.02013 72.8 32.5 81.4 39.0 61.3 21.1 72.8 24.22014 94.5 32.2 95.4 40.4 93.3 21.6 95.7 24.9
Panel B. Sponsor TypeIndividual 59.0 31.1 60.6 34.3 49.5 7.6 77.8 7.8Public Pension Fund 55.9 32.4 61.4 51.6 53.0 20.7 70.6 27.8Union 56.3 34.2 56.0 36.8 58.6 19.1 73.8 22.0Religious 58.1 13.2 57.9 20.5 58.2 11.4 69.1 22.5SRI Fund 55.0 20.2 57.2 33.9 54.6 17.1 67.3 22.5Other 61.9 20.2 66.5 43.3 59.8 8.2 54.5 14.2
Total 57.9 28.3 59.6 35.9 55.4 14.1 70.3 21.3
Note: a = Corporate governance issues, b = Social resolution issues, c = Corporate political activity (sub-category of SRI), d = Percentage of submitted proposals being voted, e = Average voting percentage thatsupported proposals as percentage of votes cast ( FOR
FOR + AGAINST ∗ 100).
A2
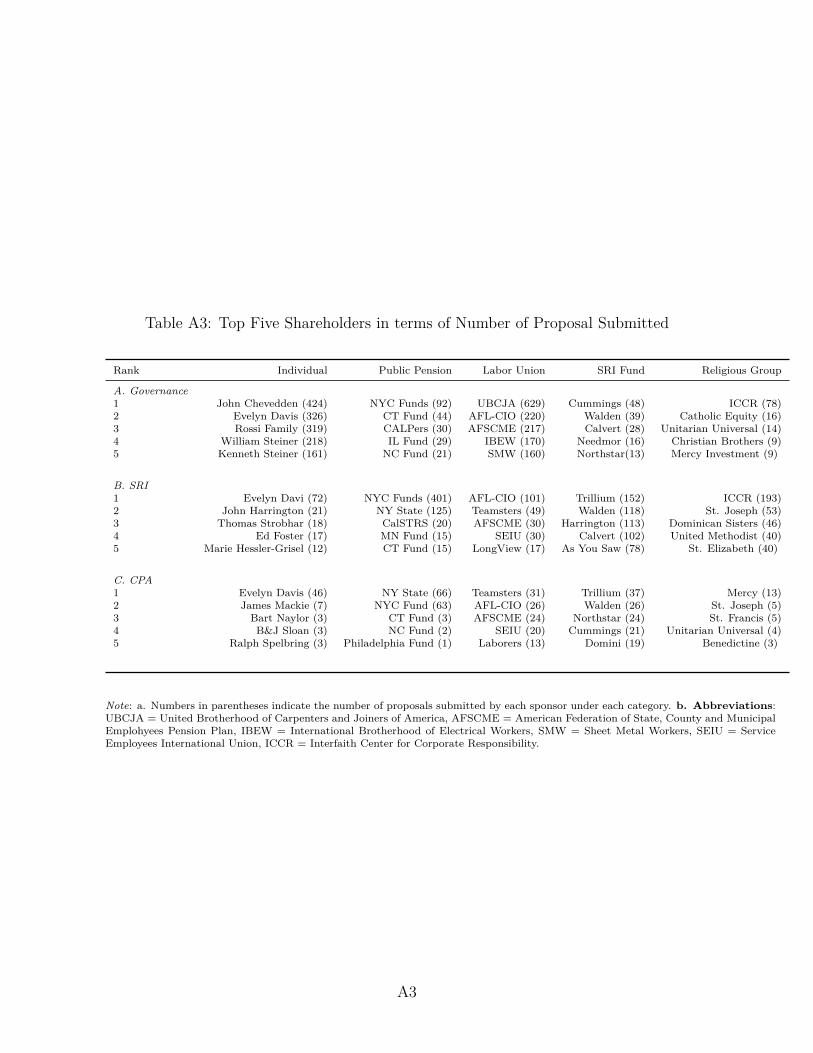
Table A3: Top Five Shareholders in terms of Number of Proposal Submitted
Rank Individual Public Pension Labor Union SRI Fund Religious Group
A. Governance1 John Chevedden (424) NYC Funds (92) UBCJA (629) Cummings (48) ICCR (78)2 Evelyn Davis (326) CT Fund (44) AFL-CIO (220) Walden (39) Catholic Equity (16)3 Rossi Family (319) CALPers (30) AFSCME (217) Calvert (28) Unitarian Universal (14)4 William Steiner (218) IL Fund (29) IBEW (170) Needmor (16) Christian Brothers (9)5 Kenneth Steiner (161) NC Fund (21) SMW (160) Northstar(13) Mercy Investment (9)
B. SRI1 Evelyn Davi (72) NYC Funds (401) AFL-CIO (101) Trillium (152) ICCR (193)2 John Harrington (21) NY State (125) Teamsters (49) Walden (118) St. Joseph (53)3 Thomas Strobhar (18) CalSTRS (20) AFSCME (30) Harrington (113) Dominican Sisters (46)4 Ed Foster (17) MN Fund (15) SEIU (30) Calvert (102) United Methodist (40)5 Marie Hessler-Grisel (12) CT Fund (15) LongView (17) As You Saw (78) St. Elizabeth (40)
C. CPA1 Evelyn Davis (46) NY State (66) Teamsters (31) Trillium (37) Mercy (13)2 James Mackie (7) NYC Fund (63) AFL-CIO (26) Walden (26) St. Joseph (5)3 Bart Naylor (3) CT Fund (3) AFSCME (24) Northstar (24) St. Francis (5)4 B&J Sloan (3) NC Fund (2) SEIU (20) Cummings (21) Unitarian Universal (4)5 Ralph Spelbring (3) Philadelphia Fund (1) Laborers (13) Domini (19) Benedictine (3)
Note: a. Numbers in parentheses indicate the number of proposals submitted by each sponsor under each category. b. Abbreviations:UBCJA = United Brotherhood of Carpenters and Joiners of America, AFSCME = American Federation of State, County and MunicipalEmplohyees Pension Plan, IBEW = International Brotherhood of Electrical Workers, SMW = Sheet Metal Workers, SEIU = ServiceEmployees International Union, ICCR = Interfaith Center for Corporate Responsibility.
A3
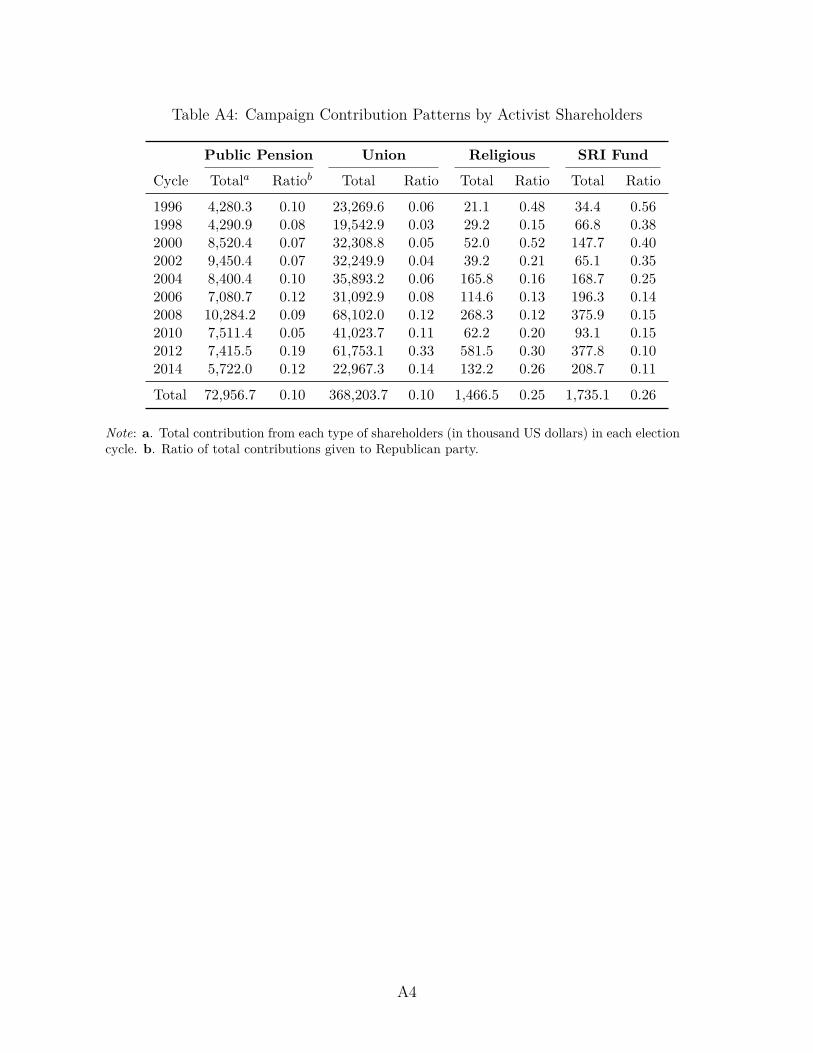
Table A4: Campaign Contribution Patterns by Activist Shareholders
Public Pension Union Religious SRI Fund
Cycle Totala Ratiob Total Ratio Total Ratio Total Ratio
1996 4,280.3 0.10 23,269.6 0.06 21.1 0.48 34.4 0.561998 4,290.9 0.08 19,542.9 0.03 29.2 0.15 66.8 0.382000 8,520.4 0.07 32,308.8 0.05 52.0 0.52 147.7 0.402002 9,450.4 0.07 32,249.9 0.04 39.2 0.21 65.1 0.352004 8,400.4 0.10 35,893.2 0.06 165.8 0.16 168.7 0.252006 7,080.7 0.12 31,092.9 0.08 114.6 0.13 196.3 0.142008 10,284.2 0.09 68,102.0 0.12 268.3 0.12 375.9 0.152010 7,511.4 0.05 41,023.7 0.11 62.2 0.20 93.1 0.152012 7,415.5 0.19 61,753.1 0.33 581.5 0.30 377.8 0.102014 5,722.0 0.12 22,967.3 0.14 132.2 0.26 208.7 0.11
Total 72,956.7 0.10 368,203.7 0.10 1,466.5 0.25 1,735.1 0.26
Note: a. Total contribution from each type of shareholders (in thousand US dollars) in each electioncycle. b. Ratio of total contributions given to Republican party.
A4
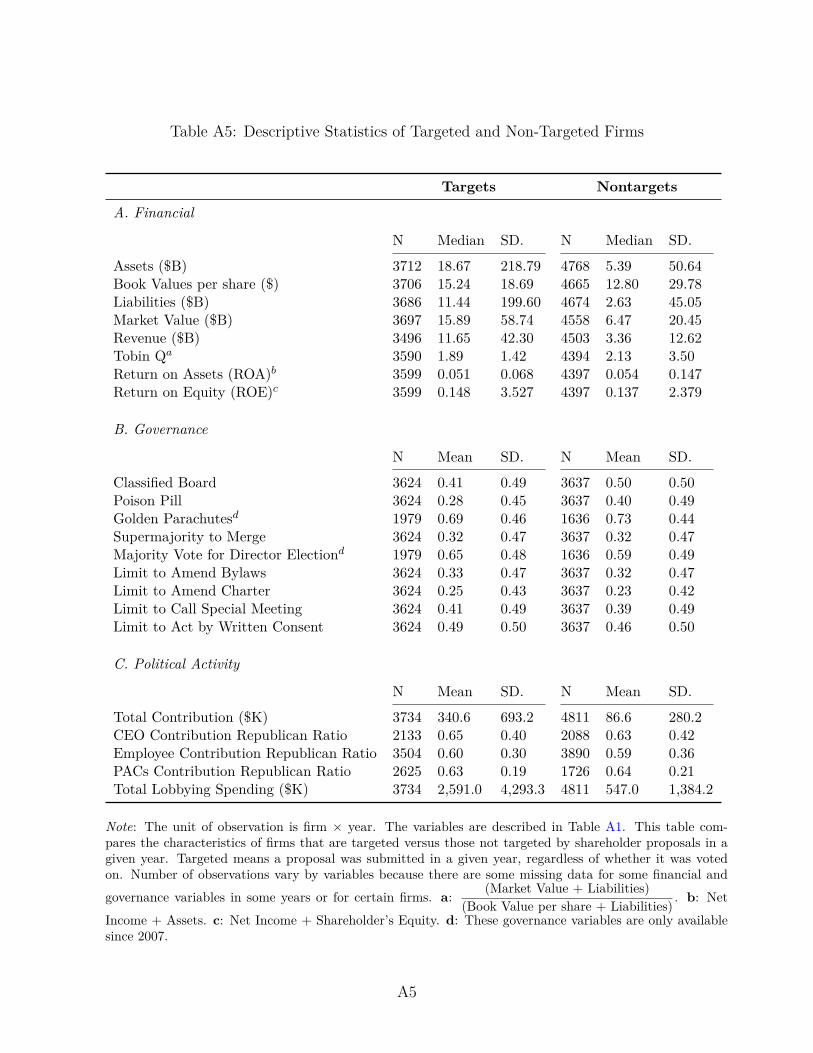
Table A5: Descriptive Statistics of Targeted and Non-Targeted Firms
Targets Nontargets
A. Financial
N Median SD. N Median SD.
Assets ($B) 3712 18.67 218.79 4768 5.39 50.64Book Values per share ($) 3706 15.24 18.69 4665 12.80 29.78Liabilities ($B) 3686 11.44 199.60 4674 2.63 45.05Market Value ($B) 3697 15.89 58.74 4558 6.47 20.45Revenue ($B) 3496 11.65 42.30 4503 3.36 12.62Tobin Qa 3590 1.89 1.42 4394 2.13 3.50Return on Assets (ROA)b 3599 0.051 0.068 4397 0.054 0.147Return on Equity (ROE)c 3599 0.148 3.527 4397 0.137 2.379
B. Governance
N Mean SD. N Mean SD.
Classified Board 3624 0.41 0.49 3637 0.50 0.50Poison Pill 3624 0.28 0.45 3637 0.40 0.49Golden Parachutesd 1979 0.69 0.46 1636 0.73 0.44Supermajority to Merge 3624 0.32 0.47 3637 0.32 0.47Majority Vote for Director Electiond 1979 0.65 0.48 1636 0.59 0.49Limit to Amend Bylaws 3624 0.33 0.47 3637 0.32 0.47Limit to Amend Charter 3624 0.25 0.43 3637 0.23 0.42Limit to Call Special Meeting 3624 0.41 0.49 3637 0.39 0.49Limit to Act by Written Consent 3624 0.49 0.50 3637 0.46 0.50
C. Political Activity
N Mean SD. N Mean SD.
Total Contribution ($K) 3734 340.6 693.2 4811 86.6 280.2CEO Contribution Republican Ratio 2133 0.65 0.40 2088 0.63 0.42Employee Contribution Republican Ratio 3504 0.60 0.30 3890 0.59 0.36PACs Contribution Republican Ratio 2625 0.63 0.19 1726 0.64 0.21Total Lobbying Spending ($K) 3734 2,591.0 4,293.3 4811 547.0 1,384.2
Note: The unit of observation is firm × year. The variables are described in Table A1. This table com-pares the characteristics of firms that are targeted versus those not targeted by shareholder proposals in agiven year. Targeted means a proposal was submitted in a given year, regardless of whether it was votedon. Number of observations vary by variables because there are some missing data for some financial andgovernance variables in some years or for certain firms. a: (Market Value + Liabilities)
(Book Value per share + Liabilities) . b: Net
Income + Assets. c: Net Income + Shareholder’s Equity. d: These governance variables are only availablesince 2007.
A5
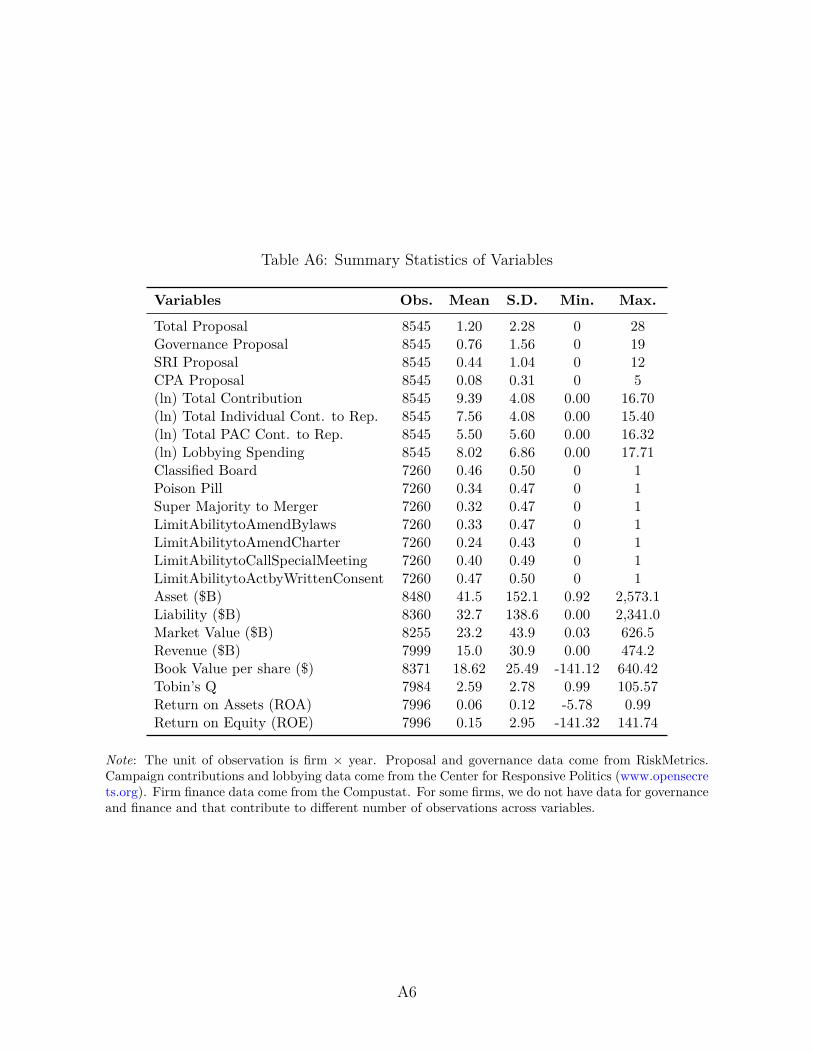
Table A6: Summary Statistics of Variables
Variables Obs. Mean S.D. Min. Max.
Total Proposal 8545 1.20 2.28 0 28Governance Proposal 8545 0.76 1.56 0 19SRI Proposal 8545 0.44 1.04 0 12CPA Proposal 8545 0.08 0.31 0 5(ln) Total Contribution 8545 9.39 4.08 0.00 16.70(ln) Total Individual Cont. to Rep. 8545 7.56 4.08 0.00 15.40(ln) Total PAC Cont. to Rep. 8545 5.50 5.60 0.00 16.32(ln) Lobbying Spending 8545 8.02 6.86 0.00 17.71Classified Board 7260 0.46 0.50 0 1Poison Pill 7260 0.34 0.47 0 1Super Majority to Merger 7260 0.32 0.47 0 1LimitAbilitytoAmendBylaws 7260 0.33 0.47 0 1LimitAbilitytoAmendCharter 7260 0.24 0.43 0 1LimitAbilitytoCallSpecialMeeting 7260 0.40 0.49 0 1LimitAbilitytoActbyWrittenConsent 7260 0.47 0.50 0 1Asset ($B) 8480 41.5 152.1 0.92 2,573.1Liability ($B) 8360 32.7 138.6 0.00 2,341.0Market Value ($B) 8255 23.2 43.9 0.03 626.5Revenue ($B) 7999 15.0 30.9 0.00 474.2Book Value per share ($) 8371 18.62 25.49 -141.12 640.42Tobin’s Q 7984 2.59 2.78 0.99 105.57Return on Assets (ROA) 7996 0.06 0.12 -5.78 0.99Return on Equity (ROE) 7996 0.15 2.95 -141.32 141.74
Note: The unit of observation is firm × year. Proposal and governance data come from RiskMetrics.Campaign contributions and lobbying data come from the Center for Responsive Politics (www.opensecrets.org). Firm finance data come from the Compustat. For some firms, we do not have data for governanceand finance and that contribute to different number of observations across variables.
A6
Appendix B: Full Regression ResultsTables A7, A8, and A9 present the full regression results for Panel A, B, and C in
Table 3, respectively. Table A10 presents the results when firms’ campaign contributionsare disaggregated into CEOs’ and PACs’ contributions (replication of Table 3 with dis-aggregated contribution variables). Tables A11, A12, and A13 present the full regressionresults for Panel A, B, and C in Table 4, respectively. Table A14 presents the resultswhen firms’ campaign contributions are disaggregated into CEOs’ and PACs’ contribu-tions (replication of Table 4 with disaggregated contribution variables).
A7
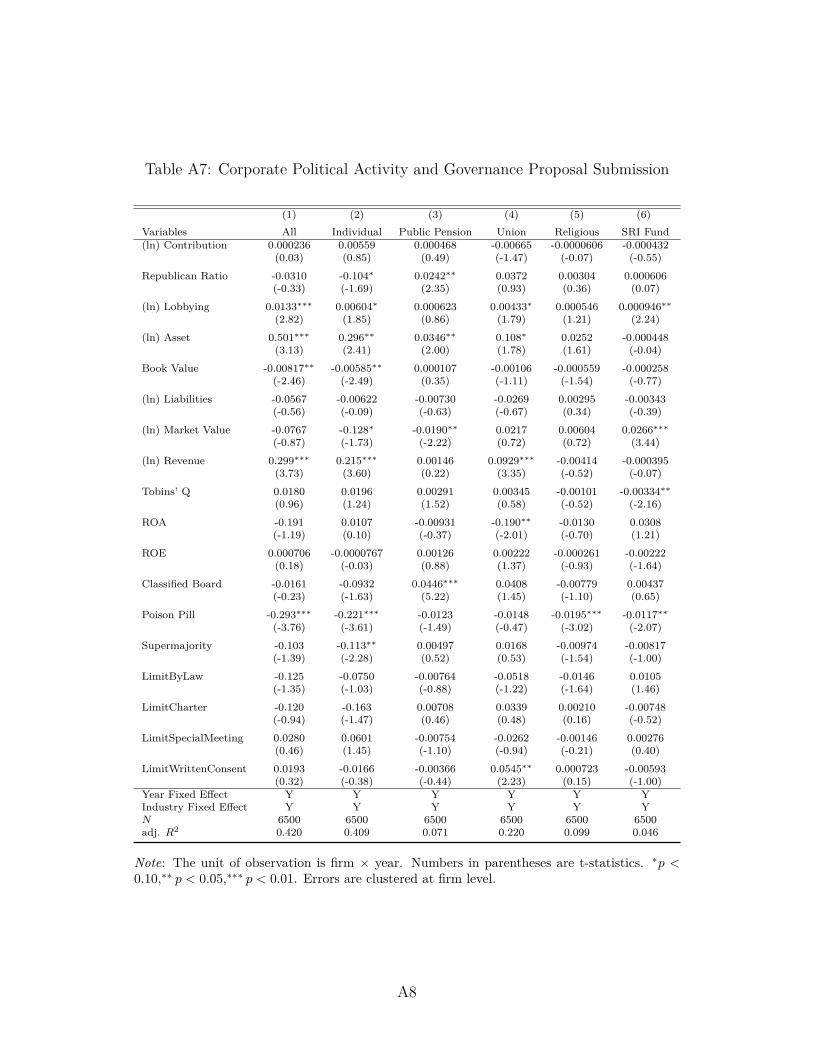
Table A7: Corporate Political Activity and Governance Proposal Submission
(1) (2) (3) (4) (5) (6)Variables All Individual Public Pension Union Religious SRI Fund(ln) Contribution 0.000236 0.00559 0.000468 -0.00665 -0.0000606 -0.000432
(0.03) (0.85) (0.49) (-1.47) (-0.07) (-0.55)Republican Ratio -0.0310 -0.104∗ 0.0242∗∗ 0.0372 0.00304 0.000606
(-0.33) (-1.69) (2.35) (0.93) (0.36) (0.07)(ln) Lobbying 0.0133∗∗∗ 0.00604∗ 0.000623 0.00433∗ 0.000546 0.000946∗∗
(2.82) (1.85) (0.86) (1.79) (1.21) (2.24)(ln) Asset 0.501∗∗∗ 0.296∗∗ 0.0346∗∗ 0.108∗ 0.0252 -0.000448
(3.13) (2.41) (2.00) (1.78) (1.61) (-0.04)Book Value -0.00817∗∗ -0.00585∗∗ 0.000107 -0.00106 -0.000559 -0.000258
(-2.46) (-2.49) (0.35) (-1.11) (-1.54) (-0.77)(ln) Liabilities -0.0567 -0.00622 -0.00730 -0.0269 0.00295 -0.00343
(-0.56) (-0.09) (-0.63) (-0.67) (0.34) (-0.39)(ln) Market Value -0.0767 -0.128∗ -0.0190∗∗ 0.0217 0.00604 0.0266∗∗∗
(-0.87) (-1.73) (-2.22) (0.72) (0.72) (3.44)(ln) Revenue 0.299∗∗∗ 0.215∗∗∗ 0.00146 0.0929∗∗∗ -0.00414 -0.000395
(3.73) (3.60) (0.22) (3.35) (-0.52) (-0.07)Tobins’ Q 0.0180 0.0196 0.00291 0.00345 -0.00101 -0.00334∗∗
(0.96) (1.24) (1.52) (0.58) (-0.52) (-2.16)ROA -0.191 0.0107 -0.00931 -0.190∗∗ -0.0130 0.0308
(-1.19) (0.10) (-0.37) (-2.01) (-0.70) (1.21)ROE 0.000706 -0.0000767 0.00126 0.00222 -0.000261 -0.00222
(0.18) (-0.03) (0.88) (1.37) (-0.93) (-1.64)Classified Board -0.0161 -0.0932 0.0446∗∗∗ 0.0408 -0.00779 0.00437
(-0.23) (-1.63) (5.22) (1.45) (-1.10) (0.65)Poison Pill -0.293∗∗∗ -0.221∗∗∗ -0.0123 -0.0148 -0.0195∗∗∗ -0.0117∗∗
(-3.76) (-3.61) (-1.49) (-0.47) (-3.02) (-2.07)Supermajority -0.103 -0.113∗∗ 0.00497 0.0168 -0.00974 -0.00817
(-1.39) (-2.28) (0.52) (0.53) (-1.54) (-1.00)LimitByLaw -0.125 -0.0750 -0.00764 -0.0518 -0.0146 0.0105
(-1.35) (-1.03) (-0.88) (-1.22) (-1.64) (1.46)LimitCharter -0.120 -0.163 0.00708 0.0339 0.00210 -0.00748
(-0.94) (-1.47) (0.46) (0.48) (0.16) (-0.52)LimitSpecialMeeting 0.0280 0.0601 -0.00754 -0.0262 -0.00146 0.00276
(0.46) (1.45) (-1.10) (-0.94) (-0.21) (0.40)LimitWrittenConsent 0.0193 -0.0166 -0.00366 0.0545∗∗ 0.000723 -0.00593
(0.32) (-0.38) (-0.44) (2.23) (0.15) (-1.00)Year Fixed Effect Y Y Y Y Y YIndustry Fixed Effect Y Y Y Y Y YN 6500 6500 6500 6500 6500 6500adj. R2 0.420 0.409 0.071 0.220 0.099 0.046
Note: The unit of observation is firm × year. Numbers in parentheses are t-statistics. ∗p <0.10,∗∗ p < 0.05,∗∗∗ p < 0.01. Errors are clustered at firm level.
A8
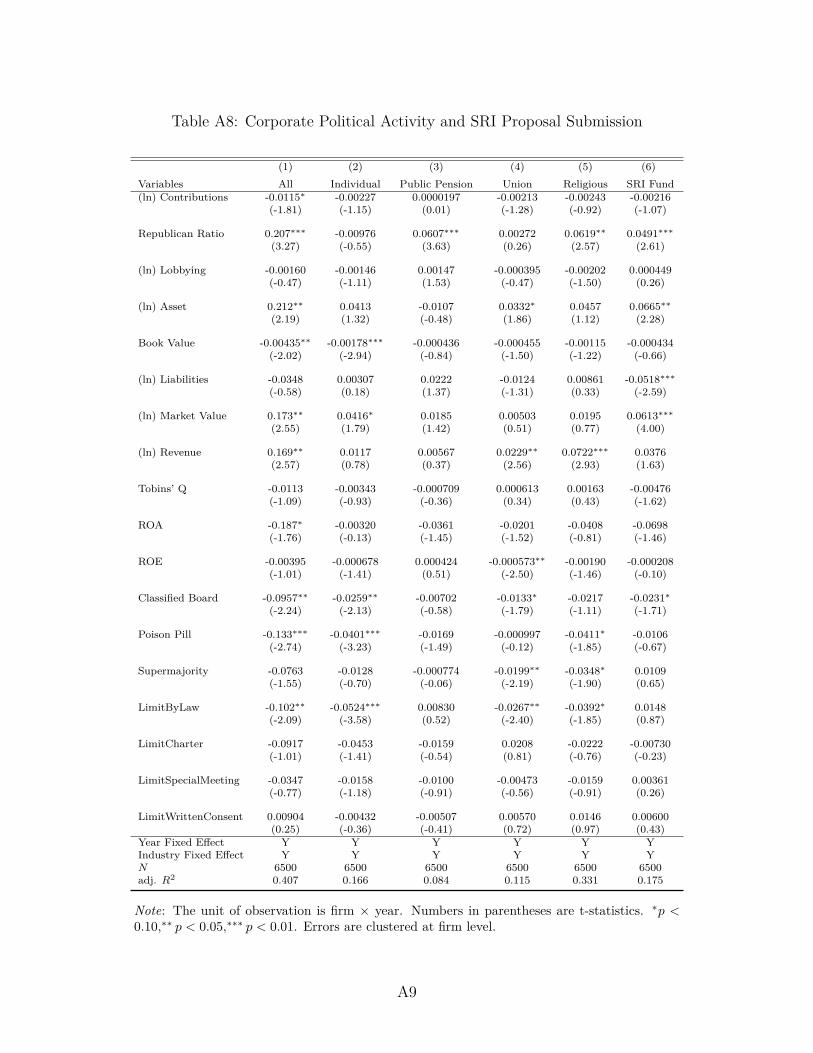
Table A8: Corporate Political Activity and SRI Proposal Submission
(1) (2) (3) (4) (5) (6)Variables All Individual Public Pension Union Religious SRI Fund(ln) Contributions -0.0115∗ -0.00227 0.0000197 -0.00213 -0.00243 -0.00216
(-1.81) (-1.15) (0.01) (-1.28) (-0.92) (-1.07)
Republican Ratio 0.207∗∗∗ -0.00976 0.0607∗∗∗ 0.00272 0.0619∗∗ 0.0491∗∗∗
(3.27) (-0.55) (3.63) (0.26) (2.57) (2.61)
(ln) Lobbying -0.00160 -0.00146 0.00147 -0.000395 -0.00202 0.000449(-0.47) (-1.11) (1.53) (-0.47) (-1.50) (0.26)
(ln) Asset 0.212∗∗ 0.0413 -0.0107 0.0332∗ 0.0457 0.0665∗∗
(2.19) (1.32) (-0.48) (1.86) (1.12) (2.28)
Book Value -0.00435∗∗ -0.00178∗∗∗ -0.000436 -0.000455 -0.00115 -0.000434(-2.02) (-2.94) (-0.84) (-1.50) (-1.22) (-0.66)
(ln) Liabilities -0.0348 0.00307 0.0222 -0.0124 0.00861 -0.0518∗∗∗
(-0.58) (0.18) (1.37) (-1.31) (0.33) (-2.59)
(ln) Market Value 0.173∗∗ 0.0416∗ 0.0185 0.00503 0.0195 0.0613∗∗∗
(2.55) (1.79) (1.42) (0.51) (0.77) (4.00)
(ln) Revenue 0.169∗∗ 0.0117 0.00567 0.0229∗∗ 0.0722∗∗∗ 0.0376(2.57) (0.78) (0.37) (2.56) (2.93) (1.63)
Tobins’ Q -0.0113 -0.00343 -0.000709 0.000613 0.00163 -0.00476(-1.09) (-0.93) (-0.36) (0.34) (0.43) (-1.62)
ROA -0.187∗ -0.00320 -0.0361 -0.0201 -0.0408 -0.0698(-1.76) (-0.13) (-1.45) (-1.52) (-0.81) (-1.46)
ROE -0.00395 -0.000678 0.000424 -0.000573∗∗ -0.00190 -0.000208(-1.01) (-1.41) (0.51) (-2.50) (-1.46) (-0.10)
Classified Board -0.0957∗∗ -0.0259∗∗ -0.00702 -0.0133∗ -0.0217 -0.0231∗
(-2.24) (-2.13) (-0.58) (-1.79) (-1.11) (-1.71)
Poison Pill -0.133∗∗∗ -0.0401∗∗∗ -0.0169 -0.000997 -0.0411∗ -0.0106(-2.74) (-3.23) (-1.49) (-0.12) (-1.85) (-0.67)
Supermajority -0.0763 -0.0128 -0.000774 -0.0199∗∗ -0.0348∗ 0.0109(-1.55) (-0.70) (-0.06) (-2.19) (-1.90) (0.65)
LimitByLaw -0.102∗∗ -0.0524∗∗∗ 0.00830 -0.0267∗∗ -0.0392∗ 0.0148(-2.09) (-3.58) (0.52) (-2.40) (-1.85) (0.87)
LimitCharter -0.0917 -0.0453 -0.0159 0.0208 -0.0222 -0.00730(-1.01) (-1.41) (-0.54) (0.81) (-0.76) (-0.23)
LimitSpecialMeeting -0.0347 -0.0158 -0.0100 -0.00473 -0.0159 0.00361(-0.77) (-1.18) (-0.91) (-0.56) (-0.91) (0.26)
LimitWrittenConsent 0.00904 -0.00432 -0.00507 0.00570 0.0146 0.00600(0.25) (-0.36) (-0.41) (0.72) (0.97) (0.43)
Year Fixed Effect Y Y Y Y Y YIndustry Fixed Effect Y Y Y Y Y YN 6500 6500 6500 6500 6500 6500adj. R2 0.407 0.166 0.084 0.115 0.331 0.175
Note: The unit of observation is firm × year. Numbers in parentheses are t-statistics. ∗p <0.10,∗∗ p < 0.05,∗∗∗ p < 0.01. Errors are clustered at firm level.
A9
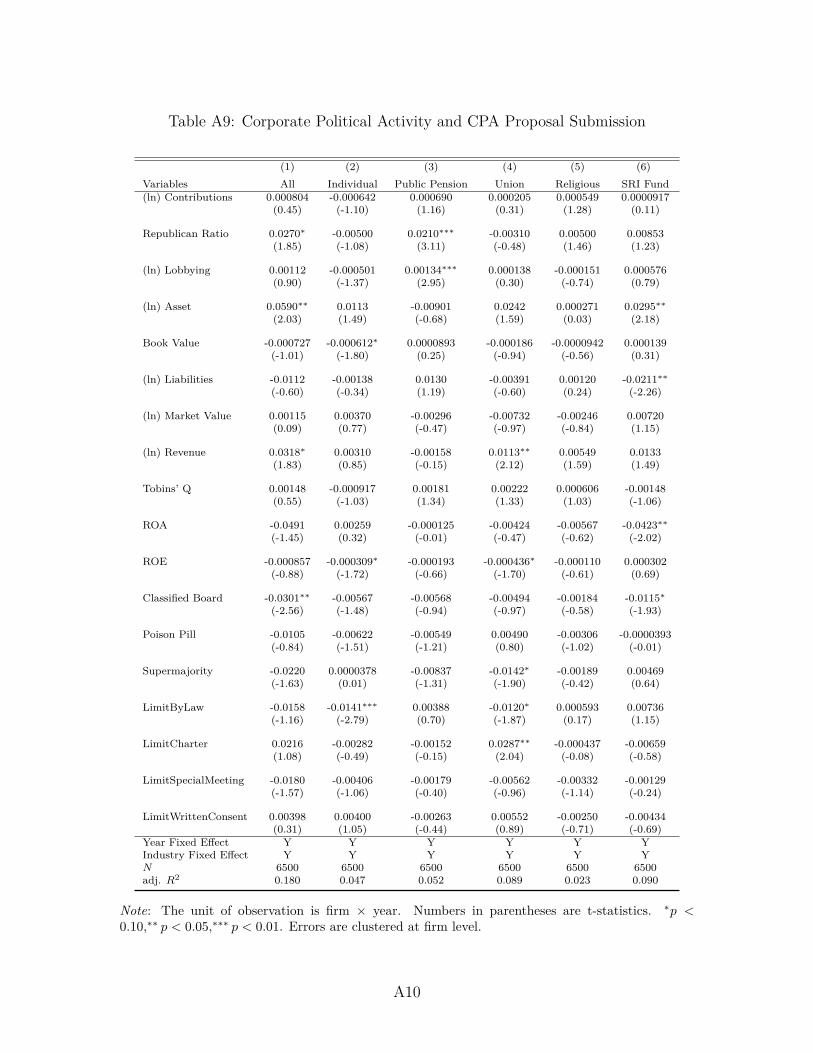
Table A9: Corporate Political Activity and CPA Proposal Submission
(1) (2) (3) (4) (5) (6)Variables All Individual Public Pension Union Religious SRI Fund(ln) Contributions 0.000804 -0.000642 0.000690 0.000205 0.000549 0.0000917
(0.45) (-1.10) (1.16) (0.31) (1.28) (0.11)
Republican Ratio 0.0270∗ -0.00500 0.0210∗∗∗ -0.00310 0.00500 0.00853(1.85) (-1.08) (3.11) (-0.48) (1.46) (1.23)
(ln) Lobbying 0.00112 -0.000501 0.00134∗∗∗ 0.000138 -0.000151 0.000576(0.90) (-1.37) (2.95) (0.30) (-0.74) (0.79)
(ln) Asset 0.0590∗∗ 0.0113 -0.00901 0.0242 0.000271 0.0295∗∗
(2.03) (1.49) (-0.68) (1.59) (0.03) (2.18)
Book Value -0.000727 -0.000612∗ 0.0000893 -0.000186 -0.0000942 0.000139(-1.01) (-1.80) (0.25) (-0.94) (-0.56) (0.31)
(ln) Liabilities -0.0112 -0.00138 0.0130 -0.00391 0.00120 -0.0211∗∗
(-0.60) (-0.34) (1.19) (-0.60) (0.24) (-2.26)
(ln) Market Value 0.00115 0.00370 -0.00296 -0.00732 -0.00246 0.00720(0.09) (0.77) (-0.47) (-0.97) (-0.84) (1.15)
(ln) Revenue 0.0318∗ 0.00310 -0.00158 0.0113∗∗ 0.00549 0.0133(1.83) (0.85) (-0.15) (2.12) (1.59) (1.49)
Tobins’ Q 0.00148 -0.000917 0.00181 0.00222 0.000606 -0.00148(0.55) (-1.03) (1.34) (1.33) (1.03) (-1.06)
ROA -0.0491 0.00259 -0.000125 -0.00424 -0.00567 -0.0423∗∗
(-1.45) (0.32) (-0.01) (-0.47) (-0.62) (-2.02)
ROE -0.000857 -0.000309∗ -0.000193 -0.000436∗ -0.000110 0.000302(-0.88) (-1.72) (-0.66) (-1.70) (-0.61) (0.69)
Classified Board -0.0301∗∗ -0.00567 -0.00568 -0.00494 -0.00184 -0.0115∗
(-2.56) (-1.48) (-0.94) (-0.97) (-0.58) (-1.93)
Poison Pill -0.0105 -0.00622 -0.00549 0.00490 -0.00306 -0.0000393(-0.84) (-1.51) (-1.21) (0.80) (-1.02) (-0.01)
Supermajority -0.0220 0.0000378 -0.00837 -0.0142∗ -0.00189 0.00469(-1.63) (0.01) (-1.31) (-1.90) (-0.42) (0.64)
LimitByLaw -0.0158 -0.0141∗∗∗ 0.00388 -0.0120∗ 0.000593 0.00736(-1.16) (-2.79) (0.70) (-1.87) (0.17) (1.15)
LimitCharter 0.0216 -0.00282 -0.00152 0.0287∗∗ -0.000437 -0.00659(1.08) (-0.49) (-0.15) (2.04) (-0.08) (-0.58)
LimitSpecialMeeting -0.0180 -0.00406 -0.00179 -0.00562 -0.00332 -0.00129(-1.57) (-1.06) (-0.40) (-0.96) (-1.14) (-0.24)
LimitWrittenConsent 0.00398 0.00400 -0.00263 0.00552 -0.00250 -0.00434(0.31) (1.05) (-0.44) (0.89) (-0.71) (-0.69)
Year Fixed Effect Y Y Y Y Y YIndustry Fixed Effect Y Y Y Y Y YN 6500 6500 6500 6500 6500 6500adj. R2 0.180 0.047 0.052 0.089 0.023 0.090
Note: The unit of observation is firm × year. Numbers in parentheses are t-statistics. ∗p <0.10,∗∗ p < 0.05,∗∗∗ p < 0.01. Errors are clustered at firm level.
A10
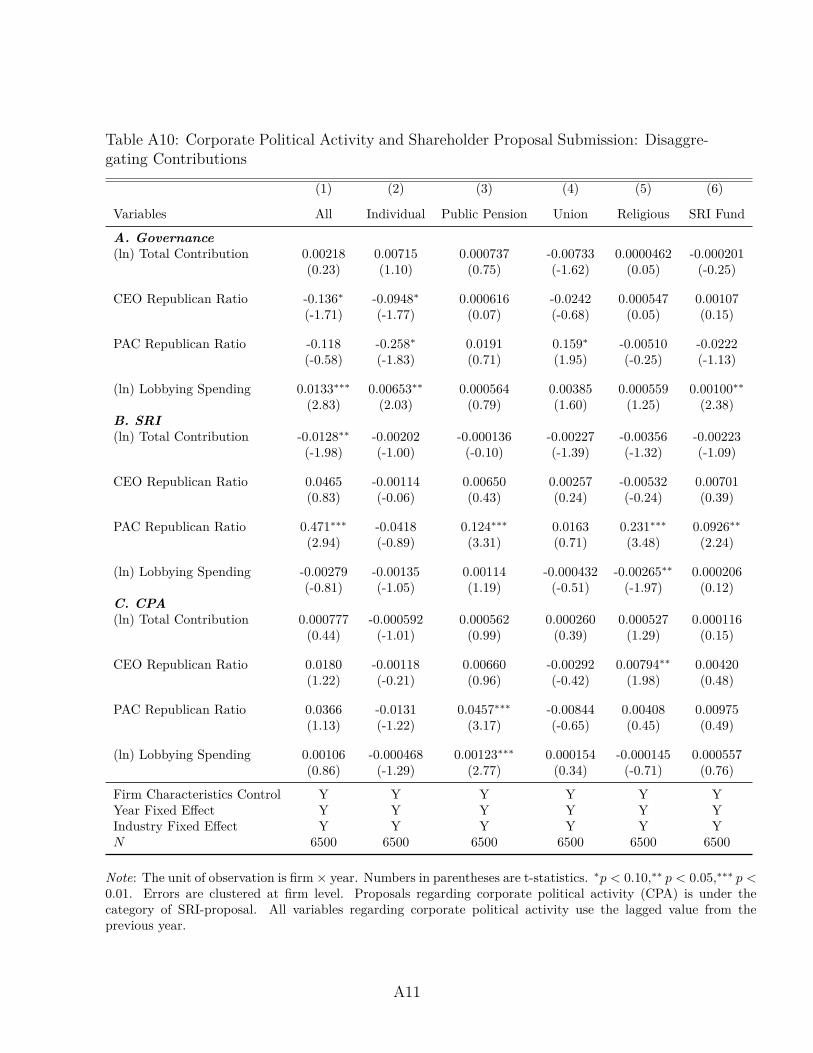
Table A10: Corporate Political Activity and Shareholder Proposal Submission: Disaggre-gating Contributions
(1) (2) (3) (4) (5) (6)
Variables All Individual Public Pension Union Religious SRI Fund
A. Governance(ln) Total Contribution 0.00218 0.00715 0.000737 -0.00733 0.0000462 -0.000201
(0.23) (1.10) (0.75) (-1.62) (0.05) (-0.25)
CEO Republican Ratio -0.136∗ -0.0948∗ 0.000616 -0.0242 0.000547 0.00107(-1.71) (-1.77) (0.07) (-0.68) (0.05) (0.15)
PAC Republican Ratio -0.118 -0.258∗ 0.0191 0.159∗ -0.00510 -0.0222(-0.58) (-1.83) (0.71) (1.95) (-0.25) (-1.13)
(ln) Lobbying Spending 0.0133∗∗∗ 0.00653∗∗ 0.000564 0.00385 0.000559 0.00100∗∗(2.83) (2.03) (0.79) (1.60) (1.25) (2.38)
B. SRI(ln) Total Contribution -0.0128∗∗ -0.00202 -0.000136 -0.00227 -0.00356 -0.00223
(-1.98) (-1.00) (-0.10) (-1.39) (-1.32) (-1.09)
CEO Republican Ratio 0.0465 -0.00114 0.00650 0.00257 -0.00532 0.00701(0.83) (-0.06) (0.43) (0.24) (-0.24) (0.39)
PAC Republican Ratio 0.471∗∗∗ -0.0418 0.124∗∗∗ 0.0163 0.231∗∗∗ 0.0926∗∗(2.94) (-0.89) (3.31) (0.71) (3.48) (2.24)
(ln) Lobbying Spending -0.00279 -0.00135 0.00114 -0.000432 -0.00265∗∗ 0.000206(-0.81) (-1.05) (1.19) (-0.51) (-1.97) (0.12)
C. CPA(ln) Total Contribution 0.000777 -0.000592 0.000562 0.000260 0.000527 0.000116
(0.44) (-1.01) (0.99) (0.39) (1.29) (0.15)
CEO Republican Ratio 0.0180 -0.00118 0.00660 -0.00292 0.00794∗∗ 0.00420(1.22) (-0.21) (0.96) (-0.42) (1.98) (0.48)
PAC Republican Ratio 0.0366 -0.0131 0.0457∗∗∗ -0.00844 0.00408 0.00975(1.13) (-1.22) (3.17) (-0.65) (0.45) (0.49)
(ln) Lobbying Spending 0.00106 -0.000468 0.00123∗∗∗ 0.000154 -0.000145 0.000557(0.86) (-1.29) (2.77) (0.34) (-0.71) (0.76)
Firm Characteristics Control Y Y Y Y Y YYear Fixed Effect Y Y Y Y Y YIndustry Fixed Effect Y Y Y Y Y YN 6500 6500 6500 6500 6500 6500
Note: The unit of observation is firm × year. Numbers in parentheses are t-statistics. ∗p < 0.10,∗∗ p < 0.05,∗∗∗ p <0.01. Errors are clustered at firm level. Proposals regarding corporate political activity (CPA) is under thecategory of SRI-proposal. All variables regarding corporate political activity use the lagged value from theprevious year.
A11
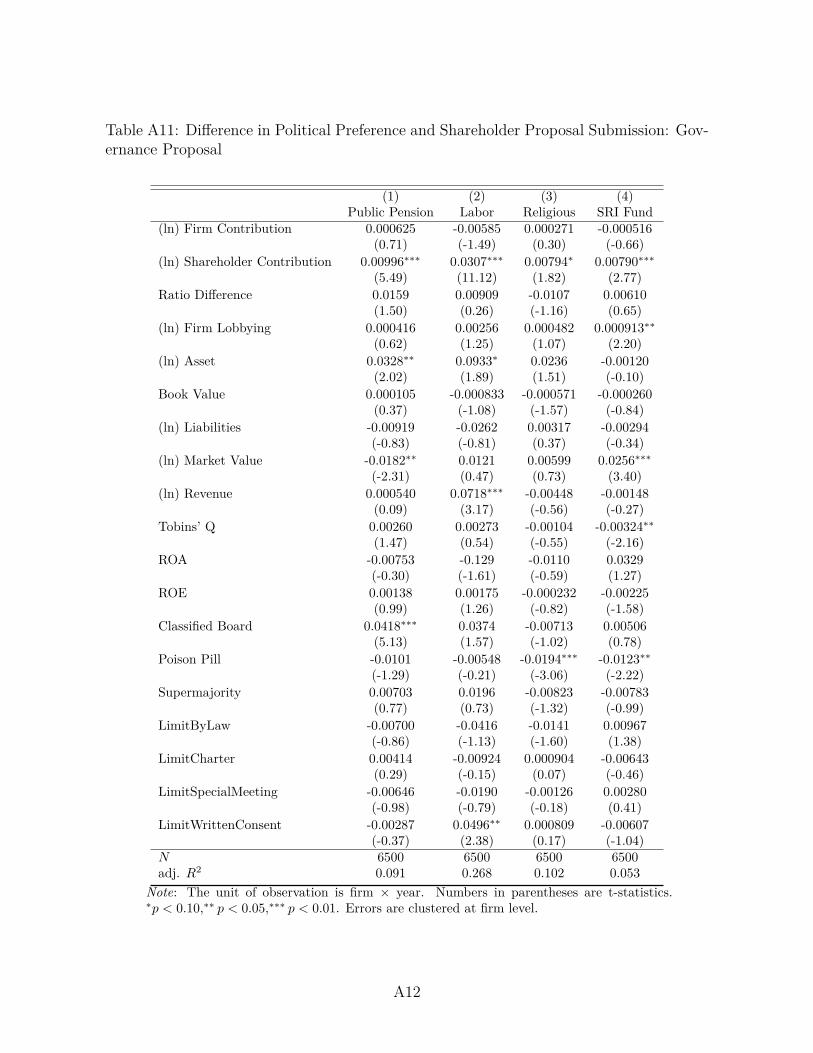
Table A11: Difference in Political Preference and Shareholder Proposal Submission: Gov-ernance Proposal
(1) (2) (3) (4)Public Pension Labor Religious SRI Fund
(ln) Firm Contribution 0.000625 -0.00585 0.000271 -0.000516(0.71) (-1.49) (0.30) (-0.66)
(ln) Shareholder Contribution 0.00996∗∗∗ 0.0307∗∗∗ 0.00794∗ 0.00790∗∗∗(5.49) (11.12) (1.82) (2.77)
Ratio Difference 0.0159 0.00909 -0.0107 0.00610(1.50) (0.26) (-1.16) (0.65)
(ln) Firm Lobbying 0.000416 0.00256 0.000482 0.000913∗∗(0.62) (1.25) (1.07) (2.20)
(ln) Asset 0.0328∗∗ 0.0933∗ 0.0236 -0.00120(2.02) (1.89) (1.51) (-0.10)
Book Value 0.000105 -0.000833 -0.000571 -0.000260(0.37) (-1.08) (-1.57) (-0.84)
(ln) Liabilities -0.00919 -0.0262 0.00317 -0.00294(-0.83) (-0.81) (0.37) (-0.34)
(ln) Market Value -0.0182∗∗ 0.0121 0.00599 0.0256∗∗∗(-2.31) (0.47) (0.73) (3.40)
(ln) Revenue 0.000540 0.0718∗∗∗ -0.00448 -0.00148(0.09) (3.17) (-0.56) (-0.27)
Tobins’ Q 0.00260 0.00273 -0.00104 -0.00324∗∗(1.47) (0.54) (-0.55) (-2.16)
ROA -0.00753 -0.129 -0.0110 0.0329(-0.30) (-1.61) (-0.59) (1.27)
ROE 0.00138 0.00175 -0.000232 -0.00225(0.99) (1.26) (-0.82) (-1.58)
Classified Board 0.0418∗∗∗ 0.0374 -0.00713 0.00506(5.13) (1.57) (-1.02) (0.78)
Poison Pill -0.0101 -0.00548 -0.0194∗∗∗ -0.0123∗∗(-1.29) (-0.21) (-3.06) (-2.22)
Supermajority 0.00703 0.0196 -0.00823 -0.00783(0.77) (0.73) (-1.32) (-0.99)
LimitByLaw -0.00700 -0.0416 -0.0141 0.00967(-0.86) (-1.13) (-1.60) (1.38)
LimitCharter 0.00414 -0.00924 0.000904 -0.00643(0.29) (-0.15) (0.07) (-0.46)
LimitSpecialMeeting -0.00646 -0.0190 -0.00126 0.00280(-0.98) (-0.79) (-0.18) (0.41)
LimitWrittenConsent -0.00287 0.0496∗∗ 0.000809 -0.00607(-0.37) (2.38) (0.17) (-1.04)
N 6500 6500 6500 6500adj. R2 0.091 0.268 0.102 0.053
Note: The unit of observation is firm × year. Numbers in parentheses are t-statistics.∗p < 0.10,∗∗ p < 0.05,∗∗∗ p < 0.01. Errors are clustered at firm level.
A12
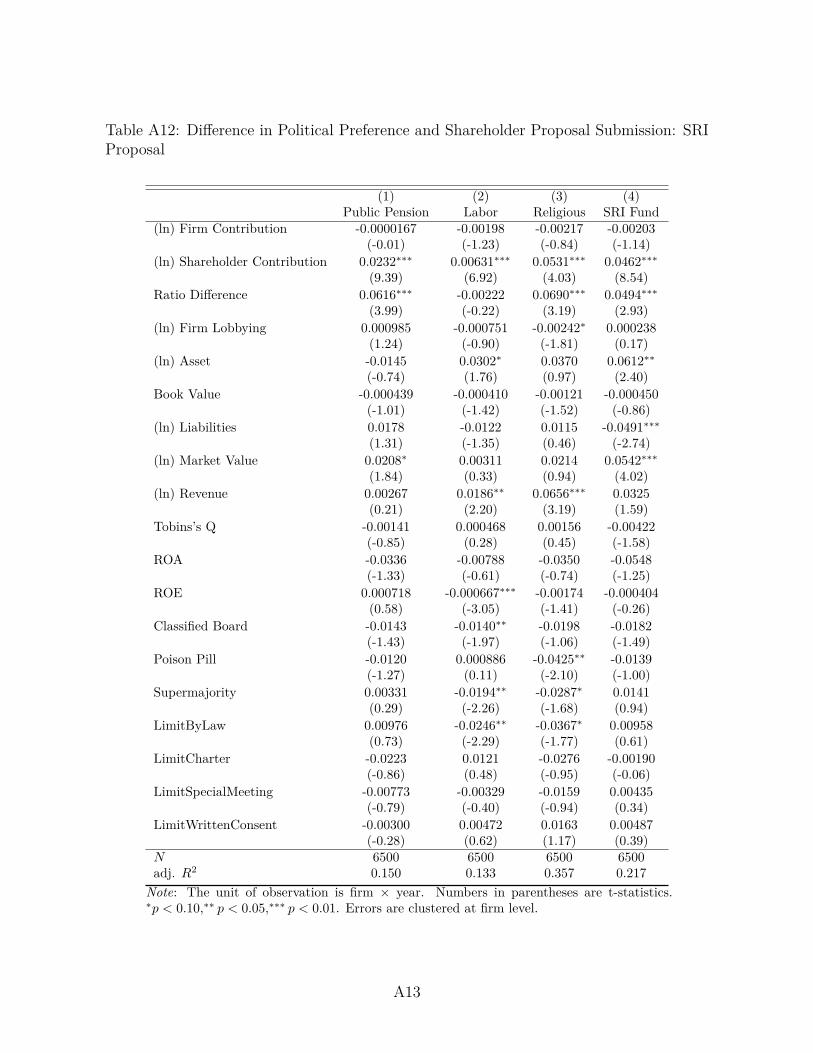
Table A12: Difference in Political Preference and Shareholder Proposal Submission: SRIProposal
(1) (2) (3) (4)Public Pension Labor Religious SRI Fund
(ln) Firm Contribution -0.0000167 -0.00198 -0.00217 -0.00203(-0.01) (-1.23) (-0.84) (-1.14)
(ln) Shareholder Contribution 0.0232∗∗∗ 0.00631∗∗∗ 0.0531∗∗∗ 0.0462∗∗∗(9.39) (6.92) (4.03) (8.54)
Ratio Difference 0.0616∗∗∗ -0.00222 0.0690∗∗∗ 0.0494∗∗∗(3.99) (-0.22) (3.19) (2.93)
(ln) Firm Lobbying 0.000985 -0.000751 -0.00242∗ 0.000238(1.24) (-0.90) (-1.81) (0.17)
(ln) Asset -0.0145 0.0302∗ 0.0370 0.0612∗∗(-0.74) (1.76) (0.97) (2.40)
Book Value -0.000439 -0.000410 -0.00121 -0.000450(-1.01) (-1.42) (-1.52) (-0.86)
(ln) Liabilities 0.0178 -0.0122 0.0115 -0.0491∗∗∗(1.31) (-1.35) (0.46) (-2.74)
(ln) Market Value 0.0208∗ 0.00311 0.0214 0.0542∗∗∗(1.84) (0.33) (0.94) (4.02)
(ln) Revenue 0.00267 0.0186∗∗ 0.0656∗∗∗ 0.0325(0.21) (2.20) (3.19) (1.59)
Tobins’s Q -0.00141 0.000468 0.00156 -0.00422(-0.85) (0.28) (0.45) (-1.58)
ROA -0.0336 -0.00788 -0.0350 -0.0548(-1.33) (-0.61) (-0.74) (-1.25)
ROE 0.000718 -0.000667∗∗∗ -0.00174 -0.000404(0.58) (-3.05) (-1.41) (-0.26)
Classified Board -0.0143 -0.0140∗∗ -0.0198 -0.0182(-1.43) (-1.97) (-1.06) (-1.49)
Poison Pill -0.0120 0.000886 -0.0425∗∗ -0.0139(-1.27) (0.11) (-2.10) (-1.00)
Supermajority 0.00331 -0.0194∗∗ -0.0287∗ 0.0141(0.29) (-2.26) (-1.68) (0.94)
LimitByLaw 0.00976 -0.0246∗∗ -0.0367∗ 0.00958(0.73) (-2.29) (-1.77) (0.61)
LimitCharter -0.0223 0.0121 -0.0276 -0.00190(-0.86) (0.48) (-0.95) (-0.06)
LimitSpecialMeeting -0.00773 -0.00329 -0.0159 0.00435(-0.79) (-0.40) (-0.94) (0.34)
LimitWrittenConsent -0.00300 0.00472 0.0163 0.00487(-0.28) (0.62) (1.17) (0.39)
N 6500 6500 6500 6500adj. R2 0.150 0.133 0.357 0.217
Note: The unit of observation is firm × year. Numbers in parentheses are t-statistics.∗p < 0.10,∗∗ p < 0.05,∗∗∗ p < 0.01. Errors are clustered at firm level.
A13
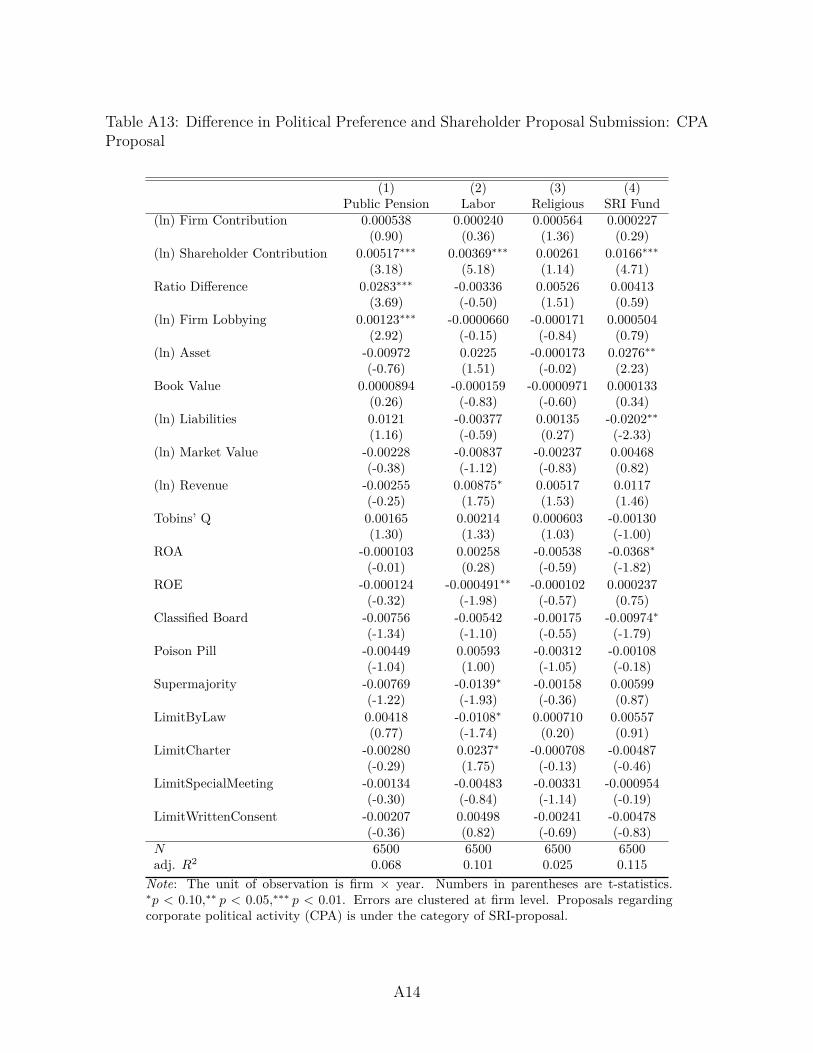
Table A13: Difference in Political Preference and Shareholder Proposal Submission: CPAProposal
(1) (2) (3) (4)Public Pension Labor Religious SRI Fund
(ln) Firm Contribution 0.000538 0.000240 0.000564 0.000227(0.90) (0.36) (1.36) (0.29)
(ln) Shareholder Contribution 0.00517∗∗∗ 0.00369∗∗∗ 0.00261 0.0166∗∗∗(3.18) (5.18) (1.14) (4.71)
Ratio Difference 0.0283∗∗∗ -0.00336 0.00526 0.00413(3.69) (-0.50) (1.51) (0.59)
(ln) Firm Lobbying 0.00123∗∗∗ -0.0000660 -0.000171 0.000504(2.92) (-0.15) (-0.84) (0.79)
(ln) Asset -0.00972 0.0225 -0.000173 0.0276∗∗(-0.76) (1.51) (-0.02) (2.23)
Book Value 0.0000894 -0.000159 -0.0000971 0.000133(0.26) (-0.83) (-0.60) (0.34)
(ln) Liabilities 0.0121 -0.00377 0.00135 -0.0202∗∗(1.16) (-0.59) (0.27) (-2.33)
(ln) Market Value -0.00228 -0.00837 -0.00237 0.00468(-0.38) (-1.12) (-0.83) (0.82)
(ln) Revenue -0.00255 0.00875∗ 0.00517 0.0117(-0.25) (1.75) (1.53) (1.46)
Tobins’ Q 0.00165 0.00214 0.000603 -0.00130(1.30) (1.33) (1.03) (-1.00)
ROA -0.000103 0.00258 -0.00538 -0.0368∗(-0.01) (0.28) (-0.59) (-1.82)
ROE -0.000124 -0.000491∗∗ -0.000102 0.000237(-0.32) (-1.98) (-0.57) (0.75)
Classified Board -0.00756 -0.00542 -0.00175 -0.00974∗(-1.34) (-1.10) (-0.55) (-1.79)
Poison Pill -0.00449 0.00593 -0.00312 -0.00108(-1.04) (1.00) (-1.05) (-0.18)
Supermajority -0.00769 -0.0139∗ -0.00158 0.00599(-1.22) (-1.93) (-0.36) (0.87)
LimitByLaw 0.00418 -0.0108∗ 0.000710 0.00557(0.77) (-1.74) (0.20) (0.91)
LimitCharter -0.00280 0.0237∗ -0.000708 -0.00487(-0.29) (1.75) (-0.13) (-0.46)
LimitSpecialMeeting -0.00134 -0.00483 -0.00331 -0.000954(-0.30) (-0.84) (-1.14) (-0.19)
LimitWrittenConsent -0.00207 0.00498 -0.00241 -0.00478(-0.36) (0.82) (-0.69) (-0.83)
N 6500 6500 6500 6500adj. R2 0.068 0.101 0.025 0.115
Note: The unit of observation is firm × year. Numbers in parentheses are t-statistics.∗p < 0.10,∗∗ p < 0.05,∗∗∗ p < 0.01. Errors are clustered at firm level. Proposals regardingcorporate political activity (CPA) is under the category of SRI-proposal.
A14
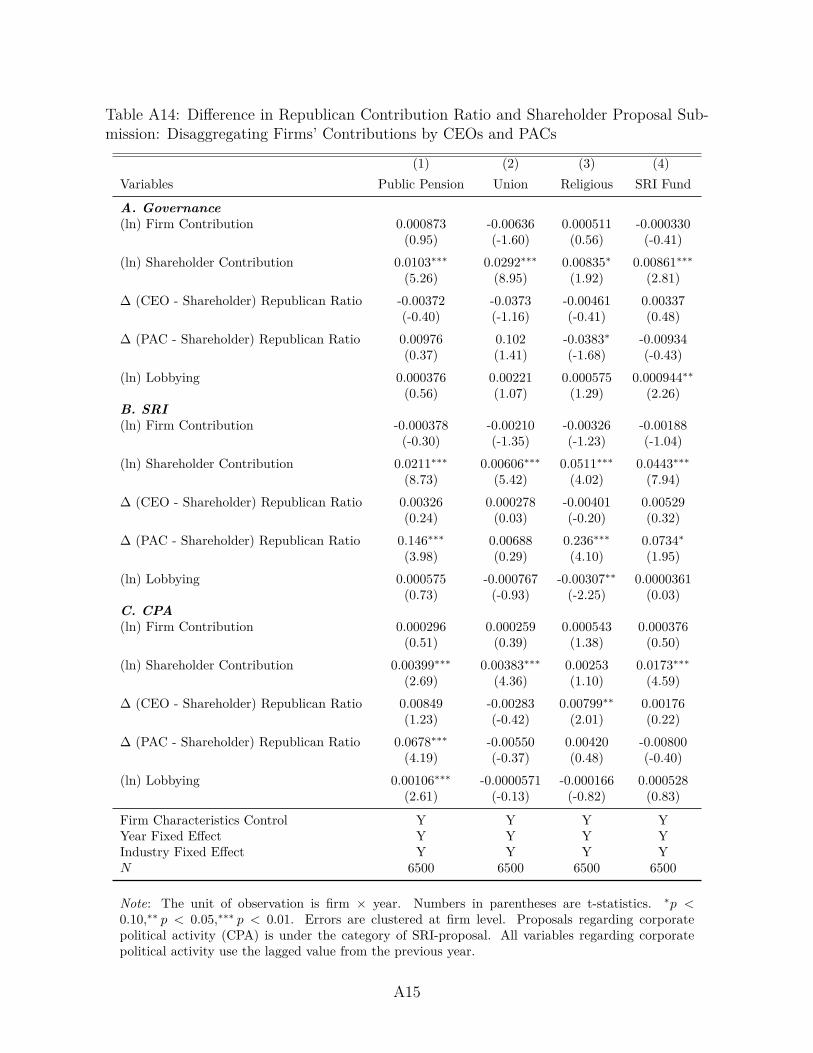
Table A14: Difference in Republican Contribution Ratio and Shareholder Proposal Sub-mission: Disaggregating Firms’ Contributions by CEOs and PACs
(1) (2) (3) (4)Variables Public Pension Union Religious SRI Fund
A. Governance(ln) Firm Contribution 0.000873 -0.00636 0.000511 -0.000330
(0.95) (-1.60) (0.56) (-0.41)(ln) Shareholder Contribution 0.0103∗∗∗ 0.0292∗∗∗ 0.00835∗ 0.00861∗∗∗
(5.26) (8.95) (1.92) (2.81)∆ (CEO - Shareholder) Republican Ratio -0.00372 -0.0373 -0.00461 0.00337
(-0.40) (-1.16) (-0.41) (0.48)∆ (PAC - Shareholder) Republican Ratio 0.00976 0.102 -0.0383∗ -0.00934
(0.37) (1.41) (-1.68) (-0.43)(ln) Lobbying 0.000376 0.00221 0.000575 0.000944∗∗
(0.56) (1.07) (1.29) (2.26)B. SRI(ln) Firm Contribution -0.000378 -0.00210 -0.00326 -0.00188
(-0.30) (-1.35) (-1.23) (-1.04)(ln) Shareholder Contribution 0.0211∗∗∗ 0.00606∗∗∗ 0.0511∗∗∗ 0.0443∗∗∗
(8.73) (5.42) (4.02) (7.94)∆ (CEO - Shareholder) Republican Ratio 0.00326 0.000278 -0.00401 0.00529
(0.24) (0.03) (-0.20) (0.32)∆ (PAC - Shareholder) Republican Ratio 0.146∗∗∗ 0.00688 0.236∗∗∗ 0.0734∗
(3.98) (0.29) (4.10) (1.95)(ln) Lobbying 0.000575 -0.000767 -0.00307∗∗ 0.0000361
(0.73) (-0.93) (-2.25) (0.03)C. CPA(ln) Firm Contribution 0.000296 0.000259 0.000543 0.000376
(0.51) (0.39) (1.38) (0.50)(ln) Shareholder Contribution 0.00399∗∗∗ 0.00383∗∗∗ 0.00253 0.0173∗∗∗
(2.69) (4.36) (1.10) (4.59)∆ (CEO - Shareholder) Republican Ratio 0.00849 -0.00283 0.00799∗∗ 0.00176
(1.23) (-0.42) (2.01) (0.22)∆ (PAC - Shareholder) Republican Ratio 0.0678∗∗∗ -0.00550 0.00420 -0.00800
(4.19) (-0.37) (0.48) (-0.40)(ln) Lobbying 0.00106∗∗∗ -0.0000571 -0.000166 0.000528
(2.61) (-0.13) (-0.82) (0.83)
Firm Characteristics Control Y Y Y YYear Fixed Effect Y Y Y YIndustry Fixed Effect Y Y Y YN 6500 6500 6500 6500
Note: The unit of observation is firm × year. Numbers in parentheses are t-statistics. ∗p <0.10,∗∗ p < 0.05,∗∗∗ p < 0.01. Errors are clustered at firm level. Proposals regarding corporatepolitical activity (CPA) is under the category of SRI-proposal. All variables regarding corporatepolitical activity use the lagged value from the previous year.
A15
Appendix C: Robustness ChecksTable A15 presents the results when we do not use an imputation for a variable
Republican Ratio for firms that did not contribute at all in a given year. The results arebased on observations with a positive campaign contribution. Results are substantiallysimilar to Table 3 in the main text. Table A16 presents the results when we use the totalcontributions given to Republican to measure the political preference of firms, instead ofthe ratio of Republican contributions. Under this exercise, firms that did not contributeat all in a given year have zero total contribution and the contribution to Republican andwe do not need to impute the variable. The main results are robust. Table A17 presentsthe results when we include a firm fixed effect. Because there is not significant variationin terms of Republican Ratio within firms over time, the statistical significance is reduced.However, similar patterns to the main results are still observed. Table A18 presents theresult when we use the home-state’s gun ownership in 1994 as an instrument for the ratio ofcontributions to Republican and replicate the results for Table 3. Table A19 presents theresult when the main independent variable is the difference in the Republican contributionratio between a firm and a specific shareholder and when we use a firm fixed effect as arobustness check for the results in Table 4.
A16
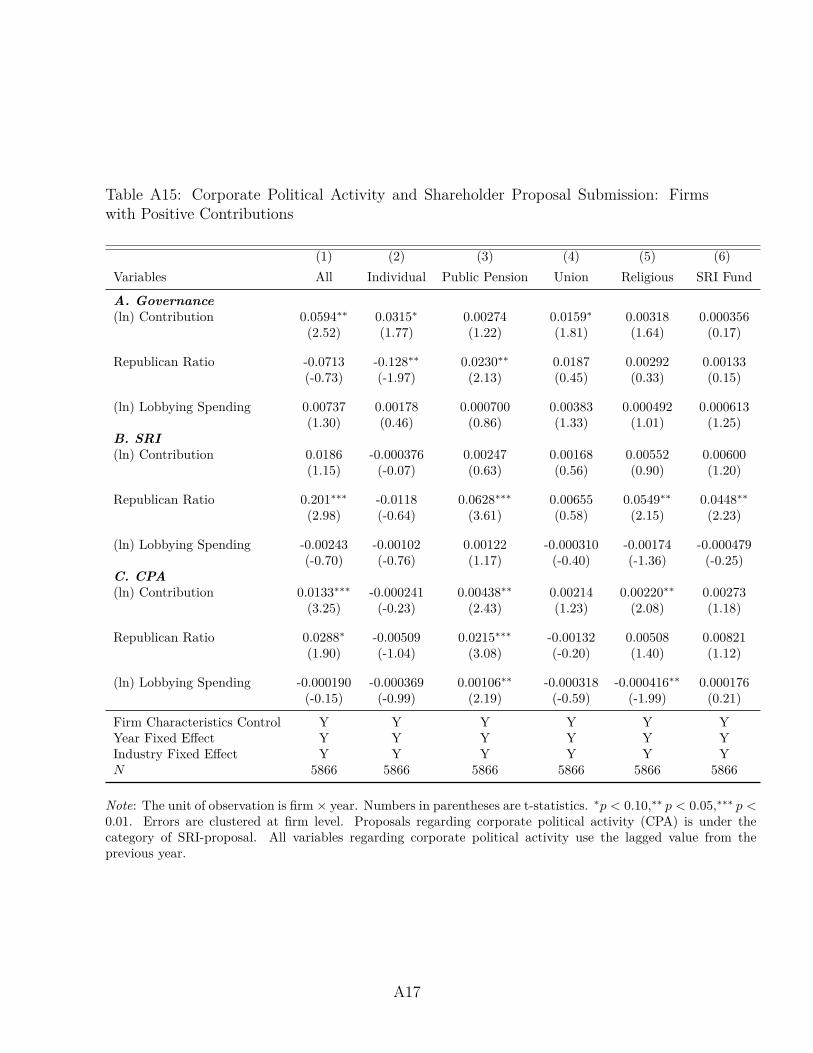
Table A15: Corporate Political Activity and Shareholder Proposal Submission: Firmswith Positive Contributions
(1) (2) (3) (4) (5) (6)Variables All Individual Public Pension Union Religious SRI Fund
A. Governance(ln) Contribution 0.0594∗∗ 0.0315∗ 0.00274 0.0159∗ 0.00318 0.000356
(2.52) (1.77) (1.22) (1.81) (1.64) (0.17)
Republican Ratio -0.0713 -0.128∗∗ 0.0230∗∗ 0.0187 0.00292 0.00133(-0.73) (-1.97) (2.13) (0.45) (0.33) (0.15)
(ln) Lobbying Spending 0.00737 0.00178 0.000700 0.00383 0.000492 0.000613(1.30) (0.46) (0.86) (1.33) (1.01) (1.25)
B. SRI(ln) Contribution 0.0186 -0.000376 0.00247 0.00168 0.00552 0.00600
(1.15) (-0.07) (0.63) (0.56) (0.90) (1.20)
Republican Ratio 0.201∗∗∗ -0.0118 0.0628∗∗∗ 0.00655 0.0549∗∗ 0.0448∗∗(2.98) (-0.64) (3.61) (0.58) (2.15) (2.23)
(ln) Lobbying Spending -0.00243 -0.00102 0.00122 -0.000310 -0.00174 -0.000479(-0.70) (-0.76) (1.17) (-0.40) (-1.36) (-0.25)
C. CPA(ln) Contribution 0.0133∗∗∗ -0.000241 0.00438∗∗ 0.00214 0.00220∗∗ 0.00273
(3.25) (-0.23) (2.43) (1.23) (2.08) (1.18)
Republican Ratio 0.0288∗ -0.00509 0.0215∗∗∗ -0.00132 0.00508 0.00821(1.90) (-1.04) (3.08) (-0.20) (1.40) (1.12)
(ln) Lobbying Spending -0.000190 -0.000369 0.00106∗∗ -0.000318 -0.000416∗∗ 0.000176(-0.15) (-0.99) (2.19) (-0.59) (-1.99) (0.21)
Firm Characteristics Control Y Y Y Y Y YYear Fixed Effect Y Y Y Y Y YIndustry Fixed Effect Y Y Y Y Y YN 5866 5866 5866 5866 5866 5866
Note: The unit of observation is firm × year. Numbers in parentheses are t-statistics. ∗p < 0.10,∗∗ p < 0.05,∗∗∗ p <0.01. Errors are clustered at firm level. Proposals regarding corporate political activity (CPA) is under thecategory of SRI-proposal. All variables regarding corporate political activity use the lagged value from theprevious year.
A17
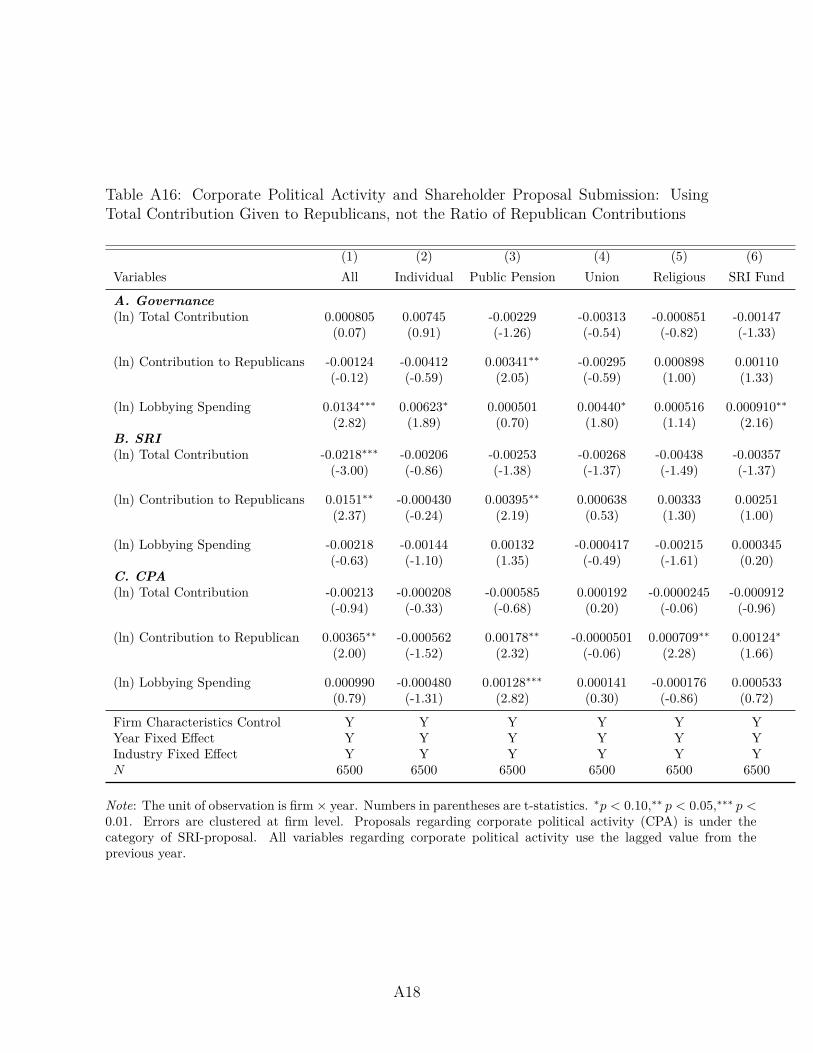
Table A16: Corporate Political Activity and Shareholder Proposal Submission: UsingTotal Contribution Given to Republicans, not the Ratio of Republican Contributions
(1) (2) (3) (4) (5) (6)Variables All Individual Public Pension Union Religious SRI Fund
A. Governance(ln) Total Contribution 0.000805 0.00745 -0.00229 -0.00313 -0.000851 -0.00147
(0.07) (0.91) (-1.26) (-0.54) (-0.82) (-1.33)
(ln) Contribution to Republicans -0.00124 -0.00412 0.00341∗∗ -0.00295 0.000898 0.00110(-0.12) (-0.59) (2.05) (-0.59) (1.00) (1.33)
(ln) Lobbying Spending 0.0134∗∗∗ 0.00623∗ 0.000501 0.00440∗ 0.000516 0.000910∗∗(2.82) (1.89) (0.70) (1.80) (1.14) (2.16)
B. SRI(ln) Total Contribution -0.0218∗∗∗ -0.00206 -0.00253 -0.00268 -0.00438 -0.00357
(-3.00) (-0.86) (-1.38) (-1.37) (-1.49) (-1.37)
(ln) Contribution to Republicans 0.0151∗∗ -0.000430 0.00395∗∗ 0.000638 0.00333 0.00251(2.37) (-0.24) (2.19) (0.53) (1.30) (1.00)
(ln) Lobbying Spending -0.00218 -0.00144 0.00132 -0.000417 -0.00215 0.000345(-0.63) (-1.10) (1.35) (-0.49) (-1.61) (0.20)
C. CPA(ln) Total Contribution -0.00213 -0.000208 -0.000585 0.000192 -0.0000245 -0.000912
(-0.94) (-0.33) (-0.68) (0.20) (-0.06) (-0.96)
(ln) Contribution to Republican 0.00365∗∗ -0.000562 0.00178∗∗ -0.0000501 0.000709∗∗ 0.00124∗(2.00) (-1.52) (2.32) (-0.06) (2.28) (1.66)
(ln) Lobbying Spending 0.000990 -0.000480 0.00128∗∗∗ 0.000141 -0.000176 0.000533(0.79) (-1.31) (2.82) (0.30) (-0.86) (0.72)
Firm Characteristics Control Y Y Y Y Y YYear Fixed Effect Y Y Y Y Y YIndustry Fixed Effect Y Y Y Y Y YN 6500 6500 6500 6500 6500 6500
Note: The unit of observation is firm × year. Numbers in parentheses are t-statistics. ∗p < 0.10,∗∗ p < 0.05,∗∗∗ p <0.01. Errors are clustered at firm level. Proposals regarding corporate political activity (CPA) is under thecategory of SRI-proposal. All variables regarding corporate political activity use the lagged value from theprevious year.
A18
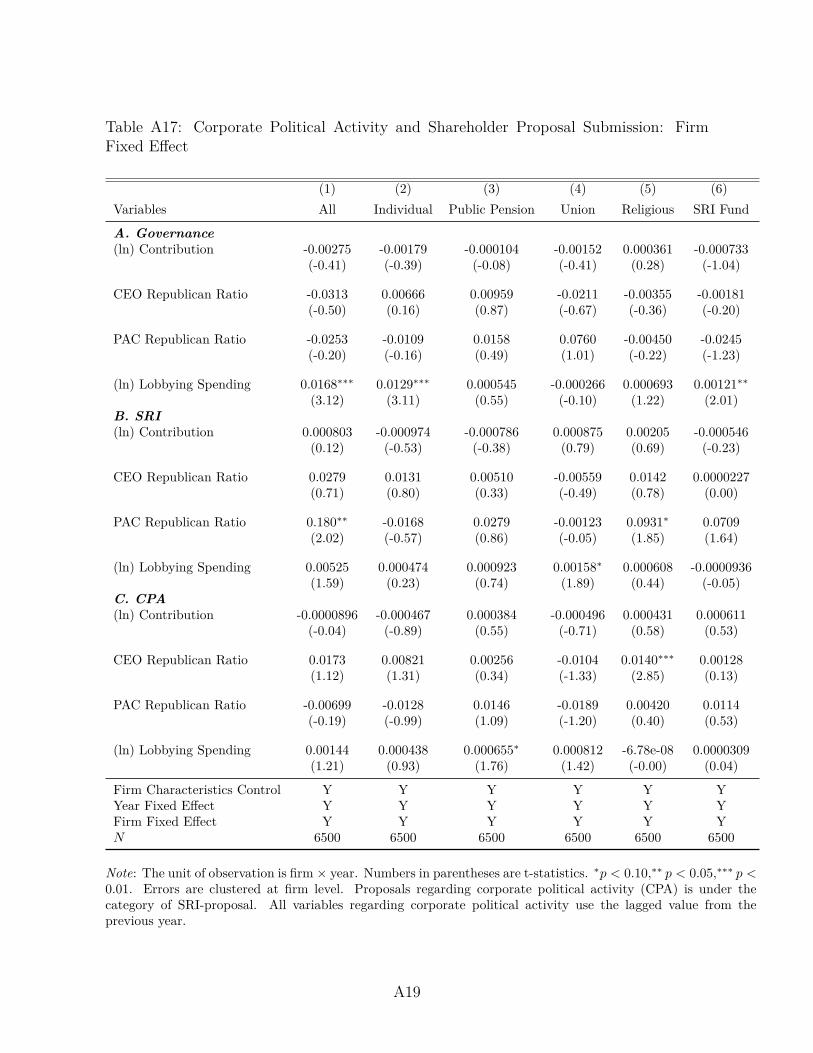
Table A17: Corporate Political Activity and Shareholder Proposal Submission: FirmFixed Effect
(1) (2) (3) (4) (5) (6)Variables All Individual Public Pension Union Religious SRI Fund
A. Governance(ln) Contribution -0.00275 -0.00179 -0.000104 -0.00152 0.000361 -0.000733
(-0.41) (-0.39) (-0.08) (-0.41) (0.28) (-1.04)
CEO Republican Ratio -0.0313 0.00666 0.00959 -0.0211 -0.00355 -0.00181(-0.50) (0.16) (0.87) (-0.67) (-0.36) (-0.20)
PAC Republican Ratio -0.0253 -0.0109 0.0158 0.0760 -0.00450 -0.0245(-0.20) (-0.16) (0.49) (1.01) (-0.22) (-1.23)
(ln) Lobbying Spending 0.0168∗∗∗ 0.0129∗∗∗ 0.000545 -0.000266 0.000693 0.00121∗∗(3.12) (3.11) (0.55) (-0.10) (1.22) (2.01)
B. SRI(ln) Contribution 0.000803 -0.000974 -0.000786 0.000875 0.00205 -0.000546
(0.12) (-0.53) (-0.38) (0.79) (0.69) (-0.23)
CEO Republican Ratio 0.0279 0.0131 0.00510 -0.00559 0.0142 0.0000227(0.71) (0.80) (0.33) (-0.49) (0.78) (0.00)
PAC Republican Ratio 0.180∗∗ -0.0168 0.0279 -0.00123 0.0931∗ 0.0709(2.02) (-0.57) (0.86) (-0.05) (1.85) (1.64)
(ln) Lobbying Spending 0.00525 0.000474 0.000923 0.00158∗ 0.000608 -0.0000936(1.59) (0.23) (0.74) (1.89) (0.44) (-0.05)
C. CPA(ln) Contribution -0.0000896 -0.000467 0.000384 -0.000496 0.000431 0.000611
(-0.04) (-0.89) (0.55) (-0.71) (0.58) (0.53)
CEO Republican Ratio 0.0173 0.00821 0.00256 -0.0104 0.0140∗∗∗ 0.00128(1.12) (1.31) (0.34) (-1.33) (2.85) (0.13)
PAC Republican Ratio -0.00699 -0.0128 0.0146 -0.0189 0.00420 0.0114(-0.19) (-0.99) (1.09) (-1.20) (0.40) (0.53)
(ln) Lobbying Spending 0.00144 0.000438 0.000655∗ 0.000812 -6.78e-08 0.0000309(1.21) (0.93) (1.76) (1.42) (-0.00) (0.04)
Firm Characteristics Control Y Y Y Y Y YYear Fixed Effect Y Y Y Y Y YFirm Fixed Effect Y Y Y Y Y YN 6500 6500 6500 6500 6500 6500
Note: The unit of observation is firm × year. Numbers in parentheses are t-statistics. ∗p < 0.10,∗∗ p < 0.05,∗∗∗ p <0.01. Errors are clustered at firm level. Proposals regarding corporate political activity (CPA) is under thecategory of SRI-proposal. All variables regarding corporate political activity use the lagged value from theprevious year.
A19
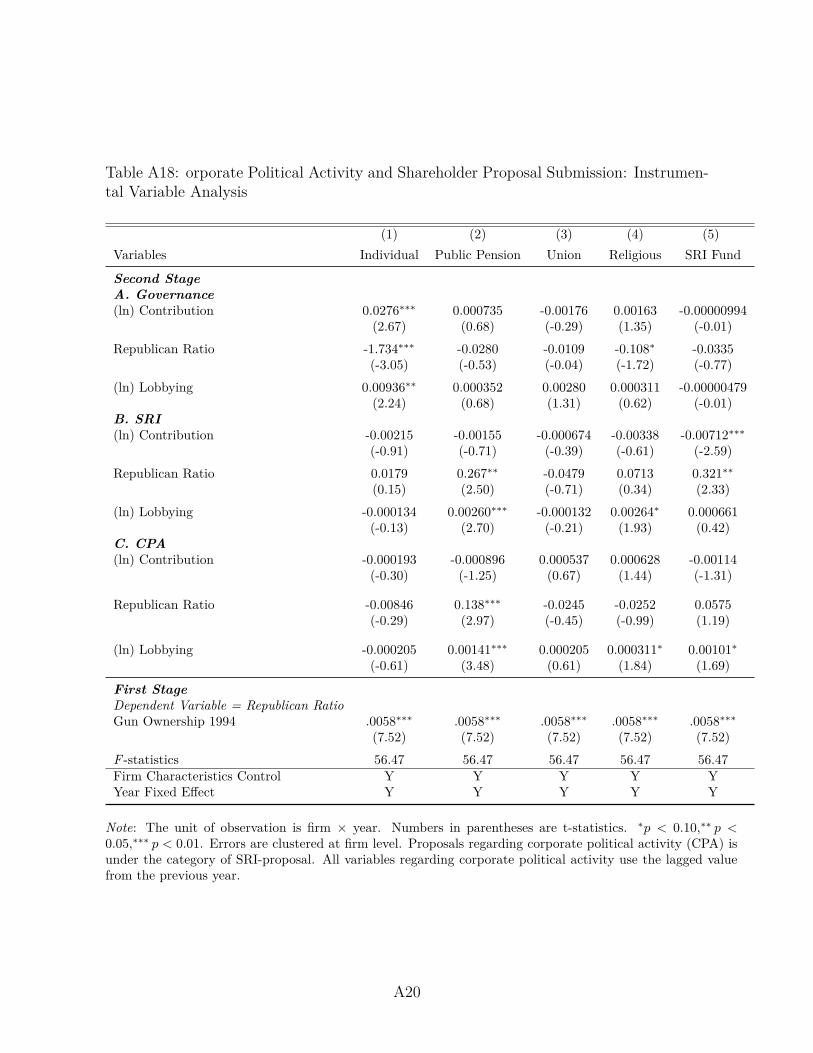
Table A18: orporate Political Activity and Shareholder Proposal Submission: Instrumen-tal Variable Analysis
(1) (2) (3) (4) (5)Variables Individual Public Pension Union Religious SRI Fund
Second StageA. Governance(ln) Contribution 0.0276∗∗∗ 0.000735 -0.00176 0.00163 -0.00000994
(2.67) (0.68) (-0.29) (1.35) (-0.01)Republican Ratio -1.734∗∗∗ -0.0280 -0.0109 -0.108∗ -0.0335
(-3.05) (-0.53) (-0.04) (-1.72) (-0.77)(ln) Lobbying 0.00936∗∗ 0.000352 0.00280 0.000311 -0.00000479
(2.24) (0.68) (1.31) (0.62) (-0.01)B. SRI(ln) Contribution -0.00215 -0.00155 -0.000674 -0.00338 -0.00712∗∗∗
(-0.91) (-0.71) (-0.39) (-0.61) (-2.59)Republican Ratio 0.0179 0.267∗∗ -0.0479 0.0713 0.321∗∗
(0.15) (2.50) (-0.71) (0.34) (2.33)(ln) Lobbying -0.000134 0.00260∗∗∗ -0.000132 0.00264∗ 0.000661
(-0.13) (2.70) (-0.21) (1.93) (0.42)C. CPA(ln) Contribution -0.000193 -0.000896 0.000537 0.000628 -0.00114
(-0.30) (-1.25) (0.67) (1.44) (-1.31)
Republican Ratio -0.00846 0.138∗∗∗ -0.0245 -0.0252 0.0575(-0.29) (2.97) (-0.45) (-0.99) (1.19)
(ln) Lobbying -0.000205 0.00141∗∗∗ 0.000205 0.000311∗ 0.00101∗(-0.61) (3.48) (0.61) (1.84) (1.69)
First StageDependent Variable = Republican RatioGun Ownership 1994 .0058∗∗∗ .0058∗∗∗ .0058∗∗∗ .0058∗∗∗ .0058∗∗∗
(7.52) (7.52) (7.52) (7.52) (7.52)F -statistics 56.47 56.47 56.47 56.47 56.47Firm Characteristics Control Y Y Y Y YYear Fixed Effect Y Y Y Y Y
Note: The unit of observation is firm × year. Numbers in parentheses are t-statistics. ∗p < 0.10,∗∗ p <0.05,∗∗∗ p < 0.01. Errors are clustered at firm level. Proposals regarding corporate political activity (CPA) isunder the category of SRI-proposal. All variables regarding corporate political activity use the lagged valuefrom the previous year.
A20
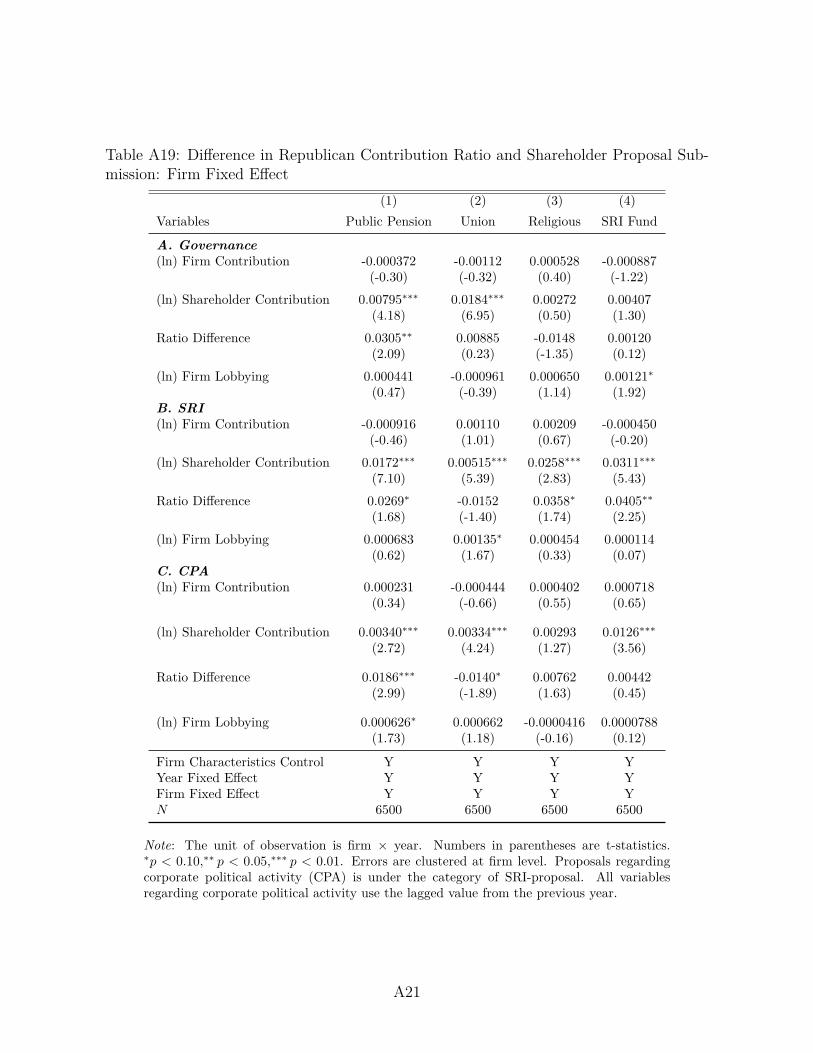
Table A19: Difference in Republican Contribution Ratio and Shareholder Proposal Sub-mission: Firm Fixed Effect
(1) (2) (3) (4)Variables Public Pension Union Religious SRI Fund
A. Governance(ln) Firm Contribution -0.000372 -0.00112 0.000528 -0.000887
(-0.30) (-0.32) (0.40) (-1.22)(ln) Shareholder Contribution 0.00795∗∗∗ 0.0184∗∗∗ 0.00272 0.00407
(4.18) (6.95) (0.50) (1.30)Ratio Difference 0.0305∗∗ 0.00885 -0.0148 0.00120
(2.09) (0.23) (-1.35) (0.12)(ln) Firm Lobbying 0.000441 -0.000961 0.000650 0.00121∗
(0.47) (-0.39) (1.14) (1.92)B. SRI(ln) Firm Contribution -0.000916 0.00110 0.00209 -0.000450
(-0.46) (1.01) (0.67) (-0.20)(ln) Shareholder Contribution 0.0172∗∗∗ 0.00515∗∗∗ 0.0258∗∗∗ 0.0311∗∗∗
(7.10) (5.39) (2.83) (5.43)Ratio Difference 0.0269∗ -0.0152 0.0358∗ 0.0405∗∗
(1.68) (-1.40) (1.74) (2.25)(ln) Firm Lobbying 0.000683 0.00135∗ 0.000454 0.000114
(0.62) (1.67) (0.33) (0.07)C. CPA(ln) Firm Contribution 0.000231 -0.000444 0.000402 0.000718
(0.34) (-0.66) (0.55) (0.65)
(ln) Shareholder Contribution 0.00340∗∗∗ 0.00334∗∗∗ 0.00293 0.0126∗∗∗(2.72) (4.24) (1.27) (3.56)
Ratio Difference 0.0186∗∗∗ -0.0140∗ 0.00762 0.00442(2.99) (-1.89) (1.63) (0.45)
(ln) Firm Lobbying 0.000626∗ 0.000662 -0.0000416 0.0000788(1.73) (1.18) (-0.16) (0.12)
Firm Characteristics Control Y Y Y YYear Fixed Effect Y Y Y YFirm Fixed Effect Y Y Y YN 6500 6500 6500 6500
Note: The unit of observation is firm × year. Numbers in parentheses are t-statistics.∗p < 0.10,∗∗ p < 0.05,∗∗∗ p < 0.01. Errors are clustered at firm level. Proposals regardingcorporate political activity (CPA) is under the category of SRI-proposal. All variablesregarding corporate political activity use the lagged value from the previous year.
A21