Corporate Plan - Airports Company South Africa Final Corporate Plan...Corporate Plan April 2014...
26
Corporate Plan April 2014 Presentation
Transcript of Corporate Plan - Airports Company South Africa Final Corporate Plan...Corporate Plan April 2014...

Corporate Plan
April 2014 Presentation
Table of contents
1 20 Years - Timeline
2 Governance Structure
3 Core Outcomes
4 Strategic Thrusts
5 Operating Environment
6 Strategic Risks
7 Traffic Volumes
8 Economic Regulation Update
9 Financial Highlights
10 Capex
11 Funding Plan
12 Key Focus Areas
13 Conclusion

20 years of thinking forward and
embracing change
1993 1994-1998 1999-2005 2006-2008 2009 2010 2011 2012 2013
3
• 23 July 1993, the
company officially
established and 9
airports transferred to
the Company
• Airports Company
South Africa’s sole
shareholder is the
state, through the
NDoT
• Commenced
operations in 1994
• Opening of O.R.
Tambo International
Airport Central
Terminal Building
• Announcement of the
review of the
Economic Regulation
Framework
• Opening of O.R.
Tambo International
Airport Domestic
Terminal
• PIC acquires Adrisa
which owns 20% of
Airports Company
South Africa from
Aeroporti di Roma
• Adoption of Early
Debt Repayment
Strategy resulting in
R3bn being set aside
to repay debt
• New Economic
Regulatory
Committee appointed
• Government sells 25.4% of
Airports Company South Africa’s
shares to Aeroporti di Roma,
various empowerment groups,
management and employees
• Airport operator in consortium
that was awarded Mumbai
International Airport operating
concession and acquired a 10%
shareholding
• R12bn DMTN programme
registered and R2bn debut bond
issued
• Opening of international pier at
O.R. Tambo International Airport
Domestic Terminal
• Opening of Cape Town
International Airport Central
Terminal
• Completion of King Shaka
International Airport and
successful move from Durban
International Airport to new site in
just 6 hours
• Successful facilitation of the 2010
FIFA World Cup
• Updated the DMTN programme
to R30bn
• Airport operator in consortium
that was awarded the Guarulhos
International Airport operating
concession and acquired a 5.1%
shareholding
• Sale of Durban International
Airport site
• The company’s airports continue
to be recognised as leading
airports in Africa through
numerous service excellence
awards by the Airports Council
International

9th
1st
Achievements: 20 years Airport Service Awards
4
Africa’s Leading Airport
1998 1999 2000 2001 2006 2007 2008 2009 2010 2011 2012 2013
OR Tambo
International
Airport
Cape Town
International
Airport
King Shaka International
Airport / Durban
International Airport
George
Airport
Port Elizabeth
International
Airport
East
London
Airport
Upington
International
Airport
Africa Airport of the
Year Award
Airport Council International
Awards – by Region : Africa
Best Airport
Best Improved Airport
Best Regional Airport
Best Improved Regional Airport
Hall of Fame
Skytrax
Worlds Top 100 Airports
Worlds Best Domestic Airport
Worlds Best Airport by Passenger Numbers
Under 5 million
5 – 10 million
10 -20 million
28th 22nd 26th
3rd
1st
Airport Cargo Excellence –
2013 African Airport of the Yea

Governance Structure
Shareholders
Airports Company South Africa Board of Directors
Audit & Risk Remuneration &
Nomination
Treasury & Economic Regulation
Commercial Board
Social & Ethics Executive Committee
Managing Director
(Bongani Maseko)
Financial Director
(Maureen Manyama-Matome)
5

Leadership Structure
6
CEO
Governance & Assurance
Compliance. Legal & Risk
COO
HR Chief
Information Officer
Airports (Corp Office Today - Airport Ops, Aviation Services, Commercial, Support Services)
Regional Airports King Shaka International
Airport
Cape Town International
Airport
O.R. Tambo International
Airport
Corporate Affairs (Today - Brand, Communications,
Marketing, Stakeholder Management, CSI)
CFO
Group Investments Officer
(Subsidiaries, Concessions, 'Propco', 'AMS')
Company Secretary
Internal Audit

Core Outcomes
7
Sustainability
Growth
Efficiency and cost management
Relevance
Business Performance excellence

7 Strategic Thrusts
8
7 S
trate
gic
th
rusts
Deliver shareholder value
Build win-win partnerships with all stakeholders
Identifying and securing new business
Strengthening business excellence
Acceleration of sustainability and transformation programmes
Facilitation of economic regulatory legislation and funding framework
Managing and developing a high performing and engaged team

Operating Environment
9
Economic climate
Economic regulation
Aviation Industry conditions
Airport transport policy
Credit rating
Stakeholder relations
(management)
Government Objectives

Strategic Risks
1. Real GDP growth;
2. Resilience of Airlines - fuel price and foreign exchange affects airlines more,
3. Interest rates
4. Finalization of a predictable and transparent economic regulation;
5. Succession planning;
6. National transport master plan (Natmap) and aviation policies;
7. Rate of economic recovery;
8. Fitch rating impact on cost of capital; and
9. Security of energy supply (fuel and electricity)
10

Traffic Volumes: Assumptions
-
5
10
15
20
25
30
2011A 2012A 2013A 2014F 2015E 2016E 2017E 2018E 2019E 2020E 2021E 2022E 2023E 2024E 2025E
Mil
lio
ns
Departing Passengers
Domestic International Regional Unscheduled
0
50
100
150
200
250
300
350
400
2011A 2012A 2013A 2014F 2015E 2016E 2017E 2018E 2019E 2020E 2021E 2022E 2023E 2024E 2025E
Th
ou
sa
nd
s
Aircraft Landings
Domestic International Regional Unscheduled
11

Economic Regulation
May 2011 amended
permission
Current 10 year investment plan
Capex claw-back and smoothing assumed
2012/13 2013/14 2014/15 2015/16 2016/17 2017/18 2018/19 2019/20
Promulgated tariff increase 30.6% 5.5% 5.6%
Indicative tariff increase
based on current approach
(12.0%) - - - -
Steering Committee of the Economic Regulatory Review
• Draft amendment bill scheduled to go before parliament during the 2014 calendar year
→ Merit-based appeal mechanism and enabling regulations remain the items to be agreed on
• Good progress on agreement of funding model
→ A number of aspects dependent on regulatory capacity, i.e. full-time regulatory body
Permission Application 2016 – 2020
• Submission due by 30 June 2014
• Draft approach document issued in November 2013 – awaiting final approach document
→ Positive developments such as hybrid till for non-aviation land (property development strategy) and share
investments (international strategy)
→ No pre-funding allowances expected in final approach document
• Much improved consultation process delivering on capex programme revisions and agreements on major
infrastructure developments. This is expected to reduce regulatory discretion.
12

CE v5.5 13
Financial Highlights
2015B 2016E 2017E
Departing Passengers 17.8m 18.4m 19.0m
Aircraft Landings 260 644 262 434 270 513
Tariff Increase on Previous Year 5.6% -12.0% 0%
Revenue R7.6bn R7.4bn R7.9bn
EBITDA R4.6bn R4.2bn R4.4bn
Net Profit R1.3bn R1.1bn R1.2bn
Capex R1.3bn R3.1bn R3.2bn
Return on Capital Employed
(Target 11.2 - 10.3%)
9.7%
8.0%
7.6%
Net Debt / EBITDA
(Target <3.0x)
2.1x
2.4x 2.4x
EBITDA Interest Cover
(Target >3.1x)
3.3x
3.6x 4.0x
13

10 Year Plan Revenue Analysis & EBITDA
48%
41% 36% 36% 35%
39% 40% 41% 42% 44% 44% 44% 44% 45% 45%
0%
10%
20%
30%
40%
50%
60%
-
2,000
4,000
6,000
8,000
10,000
12,000
14,000
16,000
2011A 2012A 2013A 2014F 2015B 2016E 2017E 2018E 2019E 2020E 2021E 2022E 2023E 2024E 2025E
Revenue
Non-aeronautical revenue Aeronautical revenue Non-aeronautical revenue %
56%
63% 64% 60% 60%
56% 56% 56% 55% 52%
57% 58% 59% 60% 61%
0%
10%
20%
30%
40%
50%
60%
70%
-
1,000
2,000
3,000
4,000
5,000
6,000
7,000
8,000
9,000
2011A 2012A 2013A 2014F 2015B 2016E 2017E 2018E 2019E 2020E 2021E 2022E 2023E 2024E 2025E
EBITDA & EBITDA margin
EBITDA EBITDA margin
14

10 Year Plan Profit & Returns
-5%
3%
15% 16% 17%
15% 15% 14%
12%
9%
14%
16%
19% 17%
15%
-10%
-5%
0%
5%
10%
15%
20%
-500
-
500
1,000
1,500
2,000
2,500
2011A 2012A 2013A 2014F 2015B 2016E 2017E 2018E 2019E 2020E 2021E 2022E 2023E 2024E 2025E
Net profit & Net profit margin
Net profit / (loss) Net profit margin
2.9%
5.3%
7.8%
9.1% 9.8%
8.1% 7.7%
7.1% 6.7%
5.9%
7.1% 7.5% 7.7% 7.5% 7.5%
0.0%
2.0%
4.0%
6.0%
8.0%
10.0%
12.0%
2011A 2012A 2013A 2014F 2015B 2016E 2017E 2018E 2019E 2020E 2021E 2022E 2023E 2024E 2025E
Return on Capital Employed
Return on capital employed Regulatory WACC
15

Capital Expenditure FY 2015 - 2017
R1.3
billion
R7.7
billion
16

-
2,000
4,000
6,000
8,000
10,000
12,000
2011A 2012A 2013A 2014F 2015E 2016E 2017E 2018E 2019E 2020E 2021E 2022E 2023E 2024E 2025E
Millio
ns
Capital expenditure (incl. capitalised interest) Capital expenditure in 2013 monetary terms
10 Year Plan Capex profile
17
CTIA: Re-
alignment of
runway & T2
ORTIA:
Midfield (all)
& fuel tanks
ORTIA:
Remote
aprons
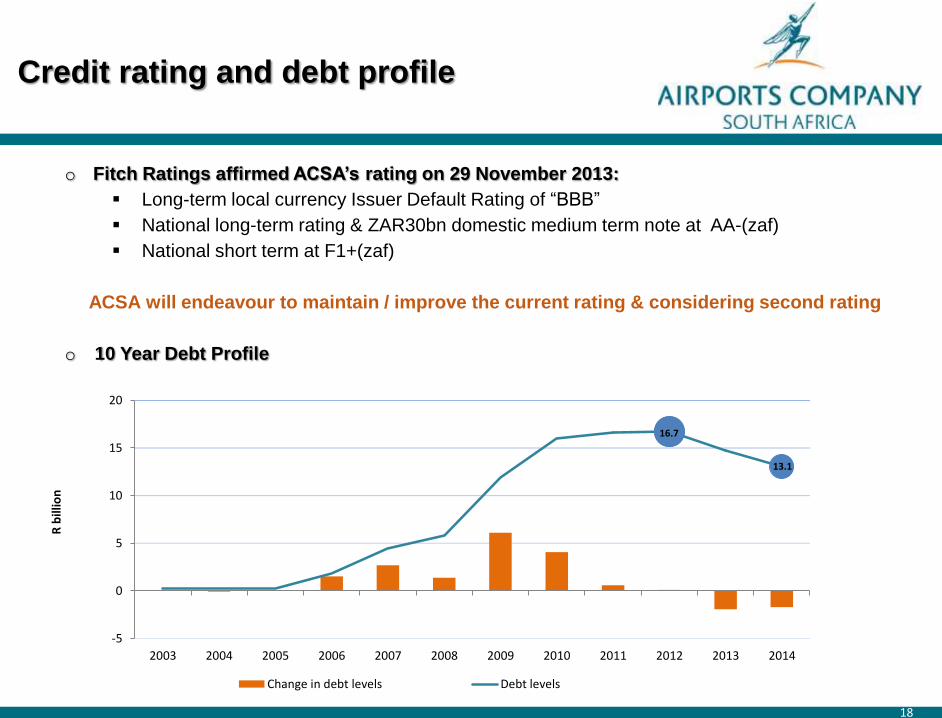
o Fitch Ratings affirmed ACSA’s rating on 29 November 2013:
Long-term local currency Issuer Default Rating of “BBB”
National long-term rating & ZAR30bn domestic medium term note at AA-(zaf)
National short term at F1+(zaf)
ACSA will endeavour to maintain / improve the current rating & considering second rating
o 10 Year Debt Profile
Credit rating and debt profile
16.7
13.1
-5
0
5
10
15
20
2003 2004 2005 2006 2007 2008 2009 2010 2011 2012 2013 2014
R b
illio
n
Change in debt levels Debt levels
18

Debt Book 31 March 2014
Diversified funding sources Debt composition
31 Mar 2012 31 Mar 2013 *31 Mar 2014
Total debt
consideration R16.7 bn R14.7 bn R13.1 bn
WACB 10% NACS 10% NACS 10% NACS
Gearing 60% 53% 47%
• In 2013/14 FY a total of about R2 billion mainly by repaying
• Buyback of the AIR02U (R500 million) on the 5th July 2013
• Redemption of the AIRL02 (R1.3 billion) on the 18th February 2014
19

3 Year Funding / Borrowing Plan FY 2015 - 2017
Funding Composition (Per Year)
Funding Requirements (2015E -2017E)
5 195
2 300
7 494
0
1000
2000
3000
4000
5000
6000
7000
8000
Available cash Gross debt financing Total capex
69%
31%
1 288
1 781 2 125
1 300 1 000
-500
500
1500
2500
3500
2015E 2016E 2017E
Cash Flow Debt
■ Funding up to financial year end 31 March 2015
■ No debt funding required
■ Funding up to financial year end 31 March 2016 &
2017
■ Required
– Funding R2.3 billion
■ Sources
– Domestic Debt Capital Markets (DMTN)
– Refinance AIR03 maturing 2016
– Commercial Paper
– Tap AIR02 maturing 2023
– Issue new benchmark bond
– Bank credit facilities and financing
– Development Finance Institutions (DFIs)
Debt Funding Required & Sources
20

Refinancing Strategy FY 2015
0
500
1000
1500
2000
2500
3000
3500
4000
R m
illi
on
Fixed rate bonds Inflation linked bonds Bank Loans
Floating Rate Notes DFI Loans (DBSA, INCA & AFD) Funding space
■ Investor Appetite – 2013 Road show
■ Existing Maturity Profile Gaps
■ Factors Assessed
– Time to maturity (duration),
– Trading price
– Redemption volume
– Spread above benchmark government
bond
■ Maturity Gap Areas
– 2022E (8yrs)
– 20125E (10yrs)
– 2031E (16yrs)
Debt Maturity Profile Gaps Refinancing Considerations
21

10 Year Funding / Borrowing Plan FY 2015 - 2025
Capital Expenditure
– R55 billion
New Debt Funding Requirement
– R29 billion (53% funding of capex)
Credit Ratings to be maintained at current levels as projected credit matrix are within an
investment grade credit rating
Funding Sources
– Domestic Debt Capital Market issuances through R30 billion registered DMTN
– Bank funding through facilities and loans
– Development Finance Institution financing
– Export Credit Agency (ECA) backed funding
– International bond issuances and private placements
– Project Financing
22

10 Year Plan Credit Metrics
6.1
4.1
2.9 2.6
2.1 2.4 2.4 2.8 2.9 3.2 3.0
3.3 3.7 3.7
3.1
0.0
1.0
2.0
3.0
4.0
5.0
6.0
7.0
Net Debt / EBITDA
Net debt / EBITDA Target (below this line)
62% 60% 53%
49% 43% 41% 40%
44% 44% 45% 46% 49% 52% 51%
48%
0%
10%
20%
30%
40%
50%
60%
70%
Net Debt / Capitalisation
Net debt / Capitalisation Target (below this line)
1.7
2.2
2.9 3.3 3.4
3.6 4.0
3.7
3.1 3.0 3.3 3.1
2.8 2.7 2.9
0.00.51.01.52.02.53.03.54.04.5
EBITDA Interest Cover
EBITDA interest cover Target (above this line)
23

Key focus areas
FY 2015
24
Deliver shareholder value
Issue of Minority Shareholders
Finalise model to secure new business in Africa and other emerging markets
Unlock value potential in land at ACSA airports
Acceleration of sustainability and transformation programmes
Facilitation of economic regulatory legislation and funding framework
Managing and developing a high performing and engaged team

Key focus areas FY 2015 - 2017
o Strengthened the stakeholder engagement process;
o Continued admiration of passengers and airlines for its customer focussed services
and facilities;
o Delivered on the imperatives of the government agenda (transformation and
sustainability programmes);
o Job Creation
o Delivered on the BBBEE codes of good practice
o Contributed to economic growth;
o Established ‘ring-fenced’ property development and international investment
businesses;
o Achieved a respected presence in emerging markets;
o Optimised its infrastructure and efficient processes;
o Enabled information technology platforms; and
o Developed a transformed workforce that is energetic.
25

Conclusion
1. Key risks for delivering this plan remain
o GDP growth; and
o economic regulation
2. The following ever changing economic elements to be closely monitored:
o fuel price;
o interest rates;
o foreign exchange rates; and
o cost of borrowing
3. The implementation of new capacity infrastructure dependant on favourable
economic conditions
4. Stakeholder management with industry, economic regulator and Investors will be
maintained
5. ACSA will maintain its course to meet shareholder expectations
26