CORPORATE OVERVIEW - Jefferies - The Global · PDF file · 2014-08-19CORPORATE...
32
Westport Innovations Inc. CORPORATE OVERVIEW stock symbols market capitalization TSX NASDAQ CAD USD WPT WPRT $1.1 billion $1.0 billion 1
Transcript of CORPORATE OVERVIEW - Jefferies - The Global · PDF file · 2014-08-19CORPORATE...

Westport Innovations Inc.
CORPORATE
OVERVIEW
stock symbols market capitalization
TSX NASDAQ CAD USD
WPT WPRT $1.1 billion $1.0 billion
1

» This presentation contains forward-looking statements that are based on the beliefs of
Westport’s management and reflect Westport’s current expectations. Investors are cautioned
that all forward-looking statements involve risks and uncertainties that could cause actual
results to differ materially from those expressed in these forward-looking statements,
including, without limitation, Westport’s ability to develop viable fuel systems; Westport’s
ability to provide the capital required for research, product development, operations, and
marketing; product development, production and commercial launch delays; changing
environmental regulations; Westport’s ability to attract and retain key personal and business
partners; competition from conventional diesel fuelled engines; and Westport’s ability to
protect its intellectual property. These factors should be considered carefully and investors
should not rely on any forward-looking statements. Investors are encouraged to review
Management’s Discussion and Analysis and the Risk Factors section in Westport’s most
recently filed Annual Information Form and filings with securities regulators for a more
complete discussion of factors that could affect Westport’s future performance. We undertake
no obligation to update or revise any forward-looking statements, whether as a result of new
information, future events or otherwise, except as required by law.
» All figures are in U.S. dollars unless otherwise stated.
Forward Looking Statements
2

» Energy transitions are enormously difficult
» Natural gas is emerging as the first significant new transportation fuel in a century
Driving a Shift to Natural Gas as a Transportation Fuel
ENERGY
• Gas exploration & production• Distribution & utilities• Fuel station owners/operators• Renewable fuels
TECHNOLOGY
• Market-spanning experience• Expansive IP portfolio• Capital light business models
TRANSPORTATION
• Engine & vehicle OEMs• Fleet operators• Shippers, transportation users• Consumers
3

Technologies / Products
CombustionFuel Storage &
DeliveryComponents & Fuel Systems
Electronics
Expertise
Design engineering
OEM process alignment
Supply chain management
Testing and analysis
Precision manufacturing
Vehicle integration
Intellectual Property
Why Westport? Integrated Know-How
» Westport translates unique IP and expertise into an entire
spectrum of technologies and products
4
Revenue
Products Licensing Service Parts
Technologies / ProductsCombustion
• Westport™ HPDI
• Spark Ignition
• Dual fuel
• Spark Ignited Direct Injection
Fuel Storage & Delivery
• iCE PACK™ LNG Tank System
• Westport LNG Tender
• JumpStart Mobile Refueling
Components & Fuel Systems
• CNG & LNG components
• WiNG™ Power System
• Bi-Fuel Volvo Cars
Electronics
• Engine control units
• LNG tank actuator
• Capacitance sensor
• Accelerometer
Expertise
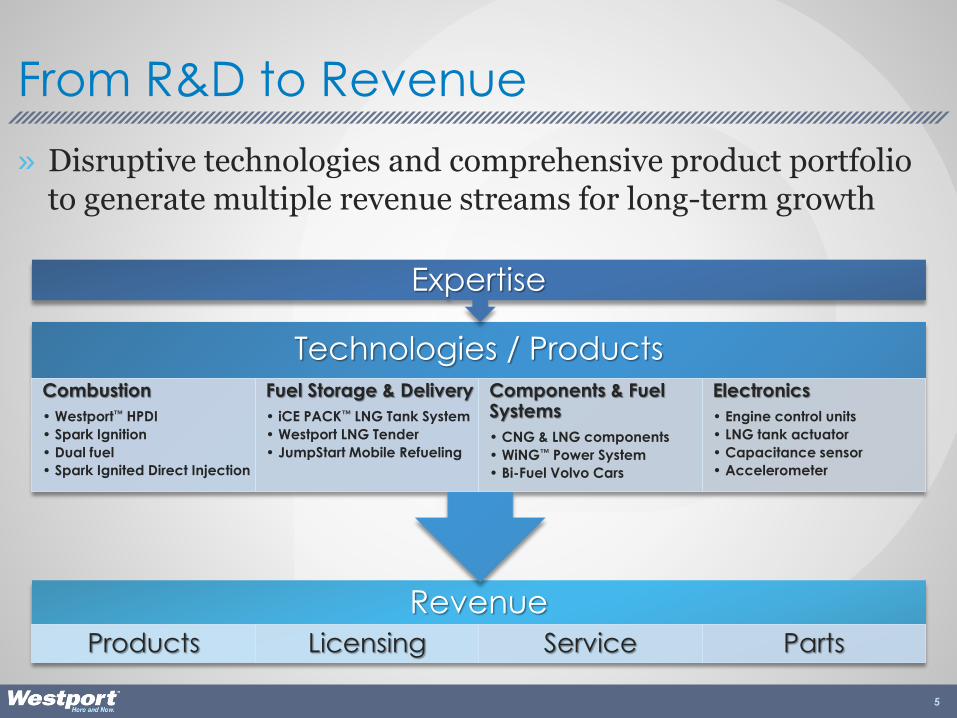
From R&D to Revenue
» Disruptive technologies and comprehensive product portfolio to generate multiple revenue streams for long-term growth
5

Financial Summary
($ in millions) CY2011 CY2012 CY2013YTD Jun 30
2014
Westport Revenue $ 100.8 $ 155.6 $ 164.0 $ 82.0
CWI Revenue 163.9 198.0 310.7 159.6
WWI Revenue 109.8 272.1 466.6 246.4
Adjusted EBITDA
Operating Business
Units (36.0) (40.3) (34.6) (0.6)
Corporate &
Technology
Investments (22.5) (42.2) (75.7) (39.0)
Westport’s Share of
Income from the JVs 17.1 16.2 13.4 0.7
Total (41.4) (66.3) (96.9) (38.9)
Consolidated including Corporate & Technology Adjusted EBITDA positive by end of 2015
Corporate & Technology
Investments for new products developed
with Volvo, Caterpillar, Weichai,
Delphi and others
Full Year Operating Business Units to be
Adjusted EBITDA positive by end of
2014
6

1. Natural gas increasingly visible as a global transportation fuel
2. Westport is the key technology provider for OEM natural gas engine
and vehicle systems with by far the largest patent position and experience
in this area.
3. Joint ventures in China and the US are the overwhelmingly dominant
engine suppliers in these markets; combined sales CAGR of 69%
2010-2013.
4. Westport invested over $239 million since 2012 in new collaborations
with global OEMs for products with Volvo, Caterpillar, Weichai, Delphi
to be delivered 2015-2017.
5. 2013 saw Westport reposition from market creation investments to
product sales. Forecast full year operating business units positive
Adjusted EBITDA by end of 2014.
7
Investment Highlights

MACRO PERSPECTIVE
» Widespread availability of low cost natural gas (as a commodity) vs.
expensive oil is driving the first new global fuel for transportation in a century
» Adoption will be driven first by high-fuel-use fleets and transportation users
seeking lower costs—not consumers
» OEMs are now engaging; this will shift the market from aftermarket
conversion to OEM factory-built vehicles
» Emerging infrastructure participants
8

Stability of Fuel Price Differential is Driving Confidence at Fleets
0.00
0.50
1.00
1.50
2.00
2.50
3.00
3.50
4.00
4.50
2010 2015 2020 2025 2030
Pri
ce
of
cru
de
oil [
U.S
. $
/bb
l]
Price History of Diesel Fuel & CNG for Vehicles,
with EIA Projections
Actual Diesel fuel price [$/gal] Forecast Diesel fuel price [$/gal]
Actual CNG fuel price [$/DGE] Forecast CNG fuel price [$/DGE]
9
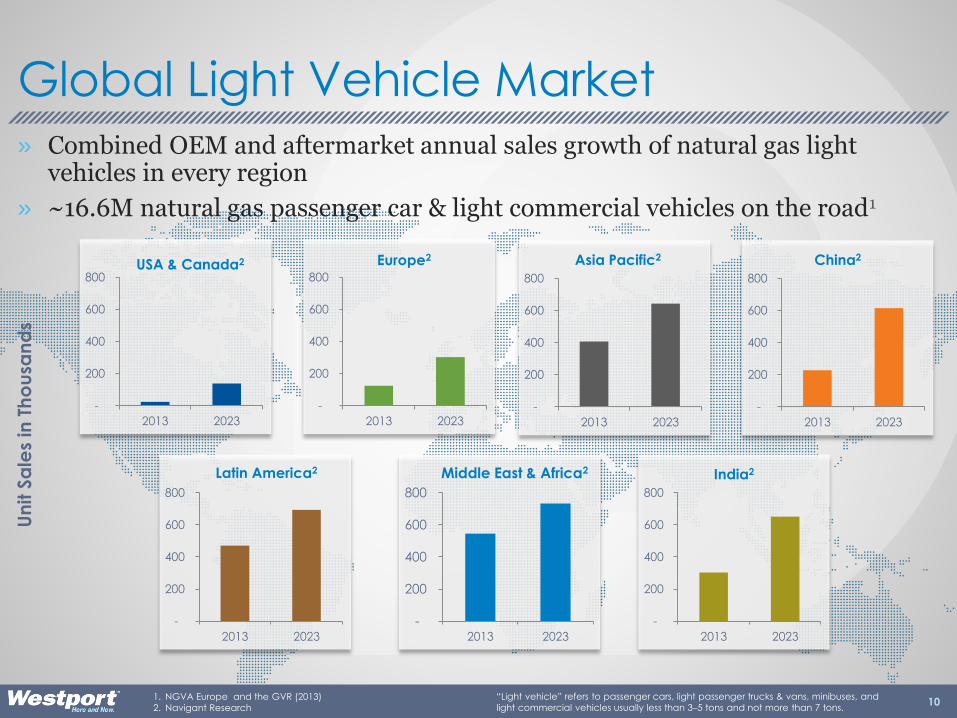
Global Light Vehicle Market
“Light vehicle” refers to passenger cars, light passenger trucks & vans, minibuses, and
light commercial vehicles usually less than 3–5 tons and not more than 7 tons.
» Combined OEM and aftermarket annual sales growth of natural gas light vehicles in every region
» ~16.6M natural gas passenger car & light commercial vehicles on the road1
1. NGVA Europe and the GVR (2013)
2. Navigant Research
-
200
400
600
800
2013 2023
USA & Canada2
-
200
400
600
800
2013 2023
Europe2
-
200
400
600
800
2013 2023
China2
-
200
400
600
800
2013 2023
India2
-
200
400
600
800
2013 2023
Latin America2
-
200
400
600
800
2013 2023
Middle East & Africa2
-
200
400
600
800
2013 2023
Asia Pacific2
Un
it S
ale
s in
Th
ou
san
ds
10

Global Markets Emerging in Every Region
1. NGVA Europe and the GVR (2013)
-
1,000
2,000
3,000
4,000
5,000
6,000
2007 2013
USA & Canada1
-
1,000
2,000
3,000
4,000
5,000
6,000
2007 2013
Europe1
-
1,000
2,000
3,000
4,000
5,000
6,000
2007 2013
China1
40%CAGR
-
1,000
2,000
3,000
4,000
5,000
6,000
2007 2013
India1
-
1,000
2,000
3,000
4,000
5,000
6,000
2007 2013
Latin America1
-
1,000
2,000
3,000
4,000
5,000
6,000
2007 2013
Middle East & Africa1
-
1,000
2,000
3,000
4,000
5,000
6,000
2007 2013
Asia Pacific1
Number of CNG & LNG Stations
11

» Majority of natural gas vehicles (NGVs) to date have been “aftermarket” conversions
delivered by third parties
» Next generation NGV OEM vehicles will be superior performance and customer
value; Westport positioned to be the dominant specialist in commercial vehicle
sector
The NGV Market is Evolving Quickly TE
CH
NO
LOG
Y
LOW
HIGH
HIGH$ / VEHICLE
MarketTransition
Components & Aftermarket(majority today)
OEM Product(fully engineered, certified)
12

0%
5%
10%
15%
20%
25%
30%
35%
40%
2012 2013 2014 2015 2016 2017 2018 2019 2020
Frost & Sullivan – High
Frost & Sullivan – Reference
Frost & Sullivan – Conservative
NPC – Reference Oil mid point
ACT Research
ACT Research1
(8 yr. CAGR 43%)
NPC2
(8 yr. CAGR 53%)
<1,700units4
>3,500units4
3–5%(~6,000–10,000 units)
Westport Analysis – Actuals
Westport – Estimated range
Urban Commercial Fleets,Truck Market in North America
Market Share of New Class 7 & 8 Natural Gas Trucks(NPC with approximate correction from VMT to vehicle units)
1. Act Research Future of Natural Gas Engines August 20122. NPC Advancing Technology, Reference Case, August
2012
3. Frost & Sullivan Strategic Outlook Truck Market 20134. Westport Analysis 13

Significant Off Road Opportunities
RAIL
MARINE
1. Morgan Stanley/Parker Bay, Westport analysis
2. UN Energy Statistics Database 2008
3. Burlington Northern 2008 Annual Report
4. Parker Bay Mobile Mining Equipment Database 2012,
Westport Analysis
5. Baker Hughes Rotary Rig Count Report, Westport analysis
6. Diesel Locomotives – Global Market Trends 2011 by SCI Verkehr GmbH, Westport analysis
7. Diesel and Gas Turbine Magazine 2011 Marine Propulsion Order Survey, Westport analysis
8. Zeus Intelligence
MINING
EXPLORATION & PRODUCTION
TARGET VEHICLES OPPORTUNITY WORLDWIDE UNITS
mine haul trucksAlmost 2 billion gallons of diesel consumed annually by the top 10 mining companies operating worldwide1
19,411 engine units4
(large mining trucks >127 ton capacity)
drill rigs andfrac pumps
Land-based rigs represent 500 million to 850 million diesel gallons per year8
13,890 engine units5
(drill rigs &frac pumps)
diesel mainline freight
locomotives
diesel passenger locomotives
Rail industry consumes 9bn gal of diesel fuel annually, half of this in North America2
Fuel represents approximately 23% of US railroad operating costs3
50,594 engine units6
(mainline locomotives)
ferries,tugboats,
PSVs,work, andcrew boats
Marine industry consumes 13bn gal of diesel fuel/year2
Emissions reduction in sensitive coastal and inland waterways are a priority
Some examples of LNG ferries and platform support vessels (PSV) in Scandinavia, but no widespreadadoption yet
25,000 engine units7
(small vessels)
14
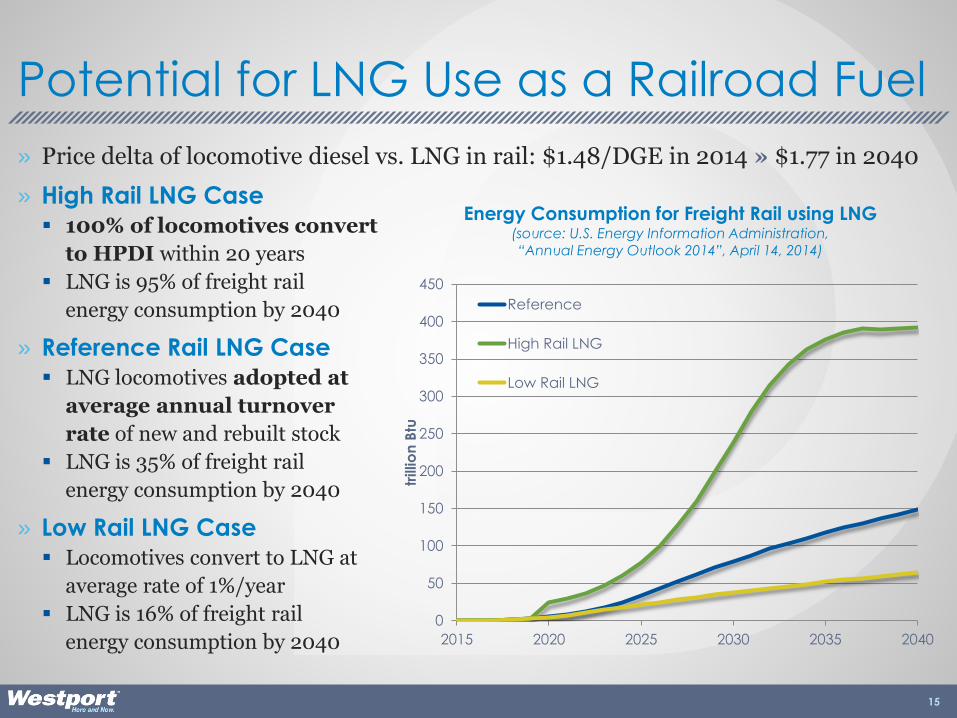
» Price delta of locomotive diesel vs. LNG in rail: $1.48/DGE in 2014 » $1.77 in 2040
» High Rail LNG Case
100% of locomotives convert
to HPDI within 20 years
LNG is 95% of freight rail
energy consumption by 2040
» Reference Rail LNG Case
LNG locomotives adopted at
average annual turnover
rate of new and rebuilt stock
LNG is 35% of freight rail
energy consumption by 2040
» Low Rail LNG Case
Locomotives convert to LNG at
average rate of 1%/year
LNG is 16% of freight rail
energy consumption by 2040
Potential for LNG Use as a Railroad Fuel
0
50
100
150
200
250
300
350
400
450
2015 2020 2025 2030 2035 2040
trillio
n B
tu
Energy Consumption for Freight Rail using LNG(source: U.S. Energy Information Administration,
“Annual Energy Outlook 2014”, April 14, 2014)
Reference
High Rail LNG
Low Rail LNG
15

TECHNOLOGIES / PRODUCTS
» Intellectual property leader
» Individual precision manufactured components up to
fully engineered complete systems for OEMs
16

» Originated at University of British
Columbia
» Strong global patent portfolio pivotal to
market leading position with OEMs
» Worldwide, Westport and its affiliates
have filed over 825 patent applications
Strong Intellectual Property Heritage Positions Westport as the Global Leader
* As of February 24, 2014 and based on the patent search results of publicly available data within the International Patent Classification F02, meeting the search term criteria: one of ("engine" or "combustion" or "injector" or "injection valve") and ("natural gas" or "methane" or "gaseous fuel") and in the claims, not ("fuel cell" or "turbine"). This chart includes issued or granted patents from: Argentina, Australia, Austria, Belgium, Brazil, Bulgaria, Canada, Ceuta and Melilla, China, Czech Republic, Denmark, European Patent Office Grants, Finland, France, Georgia, Germany, Greece, Hong Kong, Hungary, India, Ireland, Italy, Japan, Latvia, Malaysia, Mexico, Moldova, Monaco, Netherlands, OAPI grants, Philippines, Poland, Portugal, Romania, Russian Federation, Serbia, Singapore, Slovakia, Slovenia, South Africa, South Korea, Spain, Sweden, Switzerland, Taiwan, Tajikistan, Turkey, UK, Ukraine, USA, USSR, Yugoslavia, and pending published patent applications from: Canada, China, the European Patent Office, USA, and the World Intellectual Property Office.
50
62
65
82
85
99
102
154
201
327
Bosch
Cummins
GM
Honda
Toyota
Siemens
GE
Ford
CAT
Westport
Top 10 Companies with
Natural Gas Engine Related Patents*
Combustion
41%Fuel Storage
& Delivery
31%
Components
& Fuel
Systems
21%
Electronics
7%
Westport Patent Portfolio
Technology Breakdown
17

Westport Technology & Applications
Heavy-Duty & High Horsepower Applications Medium-Duty Applications
Bi-Fuel Vehicles Spark IgnitedDirect Injection
Advanced Dual Fuel Vehicles
18

APPLICATION
ENGINE
DISPLACEMENT FUEL / YEAR MILEAGE
FUEL
CHOICE CONSIDERATIONS
Large marineup to
25,000 Lup to 30M L
(7.9M gallons) LNG
Off-highway• locomotive• mine haul• medium marine
20 to 150 L~1,000,000 L
(264,000 gallons) LNG
Heavy-duty
vehicles• on-highway trucks
9 to 16 L~100,000 L
(26,400 gallons)> 250
miles/day
LNG
or
CNG
• range vs. return to base
• weight of tank system vs. payload needs
• grading of terrain
• fueling time
• chassis / body style impacts
• fuel supply and price
Medium-duty
vehicles• buses• refuse haulers
5 to 9 L~40,000 L
(10,500 gallons)< 250
miles/day
Light-duty vehicles• passenger cars• lights-duty trucks
up to 7 L~5,000 L
(1,320 gallons)< 250
miles/day CNG
LNG and CNG – Customer’s Choice
19

» Scalable, asset-light business model leverages OEM partners’ infrastructure
allows us to operate globally
Operating Business Units & JVs
» Profitable business,
growing
» $91.4M TTM revenue
» Sells to over 20 global
OEMs including Fiat,
Volkswagen, the GAZ
Group, Chrysler, and
Tata Motors
» Sells to aftermarket
customers in over 60
countries
Applied Technologies
» Ford QVM commercial
trucks (Westport WiNG™);
Volvo car systems
» Westport iCE PACK™;
Westport™ JumpStart
» $72.3M TTM revenue
» Moving from 1st
generation products and
R&D culture to ROI and
profit
On-Road Systems
» Rail, mining and
industrial industry focus
» $4.0M TTM revenue
» Westport LNG Tender—
works with locomotives
from all major North
American manufacturers
» Westport™ 2.4L
industrial engine for
forklift and oilfield
applications
Off-Road Systems
» Cummins Westport
• $347.7M TTM revenue
• 3yr CAGR = 38%
• Profitable
» Weichai Westport
• $454.7M TTM revenue
• 3yr CAGR = 118%
• Profitable
JointVentures
20TTM = Trailing Twelve Months

» 2014: Major focus on US trucking
industry with goal of 3% to 5%
market penetration; new ISX12 G
engine available across the
industry
» Westport has a 50% ownership
interest in Cummins Westport
with the potential to earn more
than 50% of the income based on
meeting certain sales thresholds
Cummins Westport Summary
(millions of USD except units) 2012 2013YTD Jun 30
2014
Engines sold 6,804 10,314 4,959
Revenue $ 198.0 $ 310.7 159.6
Gross margin % 31.0% 20.7% 11.3%
Gross margin % excl.
warranty adjustments(1) 39.2% 32.5% 27.0%
Operating expenses 26.1 40.7 19.8
Segment operating
income(2) 35.3 23.5 (1.8)
Westport interest 13.2 9.4 (0.4)
Capital expenditures 0.2 0.4 0.5
Notes:
1. The decrease in CWI gross margin and operating income percentage was primarily due to warranty adjustments related to the ISL G 8.9L engine.
2. Gross margin less operating expenses
Joint Ventures
21

» Weichai Westport JV commenced July 2010; Westport has 35% interest
» Focus on improved efficiencies in JV supply chain while trying to keep up with significant growth profile
JV represents beach head creating NG market in China for other product introductions from Westport while participating in JV’s profitability
Continued Growth in China
(millions of USD except units) 2012 2013YTD Jun 30
2014
Engines sold 22,025 38,138 20,198
Revenue $ 272.1 $ 466.6 $ 246.4
Gross margin % 9.1% 8.0% 6.1%
Operating expenses 15.0 22.8 11.1
Segment operating income 9.8 14.5 4.0
Westport 35% interest 2.9 4.3 1.2
Joint Ventures
» Current priorities
Launch Westport HPDI technology in China
Sale of components to JV and other vehicle OEMs
Expand product offerings with differentiated technology
22

Advanced Vehicle Components
High pressure
CNG lines
CNGcylinder
valve
filling valve & external CNG
filling valve
CNG & LPG reducer
Fuel injection rail
CNG & LPG filter
Electronic controls
Applied Technologies
23

Whole System Solutions:Ford Trucks and Volvo Cars
» Westport WiNG™ Power System
Dedicated CNG or bi-fuel (natural gas/gasoline)
Westport is now Ford’s largest partner under the Qualified Vehicle Modifier (QVM) program
Operational efficiencies by consolidating under one roof Q1 2014
» Volvo Car
Volvo V70 wagon & Volvo V60 sportwagon
Bi-fuel: CNG/biomethane or petrol (gasoline)
Installed inside Volvo’s main production centre in Gothenburg, Sweden
Export market opportunity
On-Road Systems
24

» First deliveries underway
» High average selling price ~$800K to $1.2 million
» > 10,000 gallons LNG capacity—provides longer range than a diesel locomotive, reducing the need for LNG refuelling infrastructure and refuelling stops
» Supports one or two locomotives, reducing the capital investment required to move to LNG
Westport LNG Tender
Gas Supply Moduleproprietary cryogenic
components deliver low or high pressure fuel
LNG Storage VesselIndustry standard
40’ “Cold” LNG tank
Universal ConnectionCompatible with locomotives from leading manufacturers
Off-Road & Industrial
25
INVESTMENT OVERVIEW
» Growth strategy
» Path to profitability
» Investing in the future of natural gas technologies
» Key milestones
26

Westport Growth Strategy
» Lead New & Differentiated
Technologies Combustion & engine development Fuel storage & delivery Components & fuel systems Electronics
ex: HPDI, spark ignited, advanced dual fuel
» Expand Application
Segments Medium duty urban vehicles (buses,
refuse trucks, delivery Heavy-Duty Trucks Light duty fleets Locomotives, other off-road enginesex: GAZ , Tata, Weichai, CAT
» Increase Systems Solutions Add new OEM relationships Broaden content with current OEMs Implement vertical integration
ex: Strong relationships with top natural gas
car producers such as Volkswagen and Fiat
» Geographic Expansion Market leader in North America,
Europe, China
Target emerging markets such as India,
Russia, Africa, South America
ex: Tata, Weichai, GAZ
27

$(8.9)
$(1.6)
$1.0
$(16.0)
$(14.0)
$(12.0)
$(10.0)
$(8.0)
$(6.0)
$(4.0)
$(2.0)
-
2.00
Q1 Q2 Q3 Q4 Q1 Q2 Q3 Q4 Q1 Q2 Q3 Q4
millio
ns
28
Achieved Operating Business Units Adjusted EBITDA Goal Ahead of Plan
Average $(9.4)M
2012 2013 2014
OPERATING BUSINESS UNITS ADJUSTED EBITDA
» Full year operating
business units to be
positive Adjusted
EBITDA by end of
2014
29
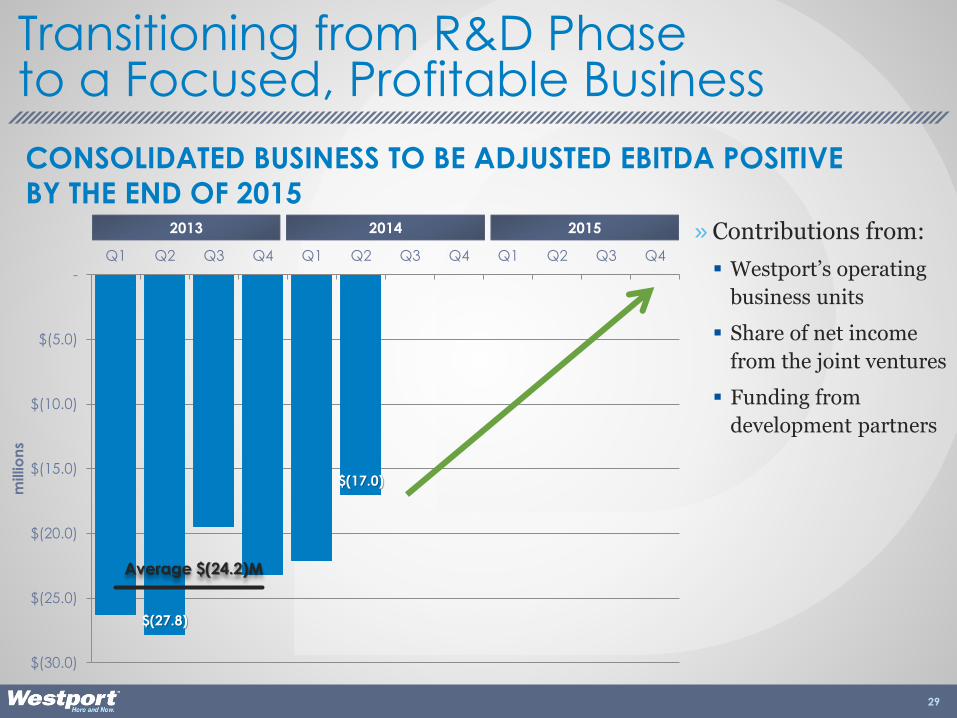
Transitioning from R&D Phaseto a Focused, Profitable Business
$(27.8)
$(17.0)
$(30.0)
$(25.0)
$(20.0)
$(15.0)
$(10.0)
$(5.0)
-
Q1 Q2 Q3 Q4 Q1 Q2 Q3 Q4 Q1 Q2 Q3 Q4
millio
ns
Average $(24.2)M
CONSOLIDATED BUSINESS TO BE ADJUSTED EBITDA POSITIVE
BY THE END OF 2015
» Contributions from:
Westport’s operating
business units
Share of net income
from the joint ventures
Funding from
development partners
2013 2014 2015

» Westport has invested over $239M since 2012
Co-investing with OEMs to develop a portfolio of new natural gas vehicle technologies and related systems and components
Investments with 3 to 5 year development cycles from start of development to product sales
Careful management of future programs and capital allocation designed to deliver high margin returns
30
Investing in Next Generation Products
Off-Road
9%
Trucking
39%Automotive
27%
Advanced
Engineering
14%Capital
Expenditure
11%
Breakdown of Investments

» 2014
First full year of sales for CWI’s new truck engine, the ISX12 G
First HPDI 2.0 trucks delivered with Weichai and Shaanqi in China
First HPDI locomotive delivered with CN in Canada, first deliveries of LNG fuel tenders to CN
Profitable expansion of Ford and Volvo car business including first international sales by Volvo; new Volvo V60 product
iCE PACK LNG systems deliveries to ISX12 G customers
Full year positive Adjusted EBITDA from operations
» 2015 Westport’s consolidated business to be Adjusted EBITDA positive
by end of the year
Key Milestones
31

Strong
First-Mover
Advantage
Valuable Strategic &
Business
Alliances
Capital
Efficient &
Scalable
Business
Model
Talented & Experienced
Management
Team
westport.com
» Pure-play global leader for natural gas as a
transportation fuel
32