Corporate Offices International Locations€¦Ngee Ann City Tower A Singapore 238873 011...
72
Our Success Begins Here 2006 ANNUAL REPORT
Transcript of Corporate Offices International Locations€¦Ngee Ann City Tower A Singapore 238873 011...

Corporate Offices
Sparton Corporation2400 East Ganson StreetJackson, Michigan 49202(517) 787-8600FAX: (517) 787-1822
United States Locations
Albuquerque8500 Bluewater Road, NWAlbuquerque, New Mexico 87121(505) 892-5300FAX: (505) 892-5515
Brooksville30167 Power Line RoadBrooksville, Florida 34602(352) 799-6520FAX: (352) 796-7482
International Locations
International Purchasing Office391 A Orchard Road #13-08Ngee Ann City Tower ASingapore 238873011 65-6838-5240
London99 Ash StreetLondon, Ontario, Canada N5Z 4V3(519) 455-6320FAX: (519) 452-3967
Spartronics Inc.3 VSIP Street 6Vietnam Singapore Industrial ParkThuan An DistrictBinh Duong Province, Vietnam011 (84-650) 784-890
www.sparton.comwww.spartronics.comwww.astroinst.com
DeLeon Springs5612 Johnson Lake RoadDeLeon Springs, Florida 32130(386) 985-4631FAX: (386) 985-5036
Deming2400 Atlantic WayDeming, New Mexico 88030(505) 546-2686FAX: (505) 546-8462
Jackson2400 East Ganson StreetJackson, Michigan 49202(517) 787-8600FAX: (517) 787-8046
StrongsvilleAstro22740 Lunn RoadStrongsville, Ohio 44149(440) 878-4630FAX: (440) 878-4636
Our Success Begins Here
2006 ANNUAL REPORT
Sparton Corporation
2006 Annual Report

Sparton’s facility in Deming, New Mexico manufactures suspensions. The facility was contacted on a Thursday afternoon by a Sparton associate in DeLeon Springs, Florida. The DeLeon Springs facility needed to have the suspensions on site Saturday morning to meet their production schedule.
The cost to ship the product in order to meet the Saturday deadline was astronomical.
At the eleventh hour, Liliana Lopez and Cathy Galvadon both volunteered to drive the product from New Mexico to Florida. Within two hours of volunteering, the women were off in a rented truck on their way across the United States.
Liliana and Cathy left the plant around 5:00 o’clock on Thursday afternoon and drove straight through to Florida. This feat was compounded by the fact that these women began their trek after working a full shift.
After a 46-hour journey, the product arrived in Florida on time and ready for production, thanks to Liliana and Cathy.
Lisa Jordan is a Sparton associate employed in Jackson, Michigan. Lisa was promoted to Communications Liaison for the facility.
Lisa was formerly a Production Specialist and supported numerous customer manufacturing programs. She has been selected to replace the Facility Receptionist who retired earlier in the year.
The intent was to place Lisa into her new position immediately. However, Lisa chose to remain at her current position until a her replacement was properly trained, ensuring that her customer’s programs would not suffer during the transitional phase.
On The Cover:
Jeffrey Hastings, Materials ManagerAstroTimothy Greszler, Director of Quality and ReliabilityAstro
Tran Thi Chinh, Quality Assurance SupervisorSpartronics
(l to r):Tonya Policht, Material ProcessorSpartonDiane Phillips, Production SpecialistSpartonLisa Jordan, Communications LiaisonSpartonMichelangelo “Mike” Siciliano, Machine Specialist IISpartonMiranda Surratt, Production SpecialistSpartonHoang Trong Vinh, Product Assurance ManagerSpartronicsJorge Mejia, Manufacturing Support/Test TechnicianSpartonSarah Kurtz, Material ProcessorSparton
Cathy GalvadonQuality Assurance Inspector Sparton
Liliana LopezSenior Specialty ClerkSparton
On the Back Cover:
Top Row (l to r):Jorge Mejia, Manufacturing Support/Test TechnicianSpartonDianna Linnabary, Human Resources AssistantSpartonTran Thi Chinh, Quality Assurance SupervisorSpartronicsMiranda Surratt, Production SpecialistSparton
Bottom Row (l to r):Tonya Policht, Material ProcessorSpartonLisa Jordan, Communications LiaisonSparton
Lisa JordanCommunications LiaisonSparton
Constance McMahonChief Information OfficerSparton

Financial HighlightsSparton Corporation & Subsidiaries for the Years Ended June 30
Net Sales
Net income (loss)
Working capitalWorking capital ratio
Weighted average common shares outstanding: Basic Diluted
Earnings (loss) per share: Basic Diluted
Shareowners’ equity per common share
$170,804,982
98,356
68,197,1233.17:1
9,339,1429,375,810
$0.010.01
$10.31
2006
$167,156,809
8,112,158
75,502,5543.89:1
9,229,8419,355,585
$0.880.87
$10.48
2005
$161,003,942.
(2,043,497)
72,347,305.4.81:1.
9,200,746.9,200,746.
$(0.22)(0.22)
$9.65.
2004
Market Data
Price rangeNew York Stock Exchange
Years Ended June 30
Quarter ended:
September 30December 31March 31June 30
2006 2005 2004
$11.1110.25
9.298.80
$9.588.608.558.20
$ 9.2510.00
9.8010.10
$8.318.678.919.15
$11.2211.5510.50
9.20
$8.609.158.208.00
High Low High Low High Low
Recent Price as of August 31, 2006 ..................................................................... $8.81Shareowners of record as of August 31, 2006 ........................................................ 503
Financial Trends at a Glance
$170.8 167.2 161.0
2006 2005 2004 2006 2005 2004 2006 2005 2004 2006 2005 2004
$0.01 0.88 (0.22) $10.31 10.48 9.65 $68.2 75.5 72.3
Net Sales(in Millions of Dollars)
Basic Earnings (Loss)Per Common Share
Equity Per Common Share Working Capital(in Millions of Dollars)
nyse | spa

sparton corporation | overview
2
To Our Shareowners:
At the close of fiscal 2006, we reported net sales of $170.8 million, compared to $167.2 million last year, a growth rate of ap-proximately 2%. For the year, Industrial sales increased 21% to $57.6 million, while Aerospace sales decreased 23% to $52.8 million. Government sales increased 11% to $42.5 million, due primarily to successful sonobuoy drop tests and greater access to the Navy’s test facility. Medical and scientific instrumentation sales increased 38% to $17.9 million as new programs began, although not as quickly as expected. Sparton recently acquired Astro Instrumentation, Inc. (Astro). Astro principally operates in the medical market and contributed $3.3 million of medical sales for the one-month ended June 30, 2006. Industrial sales increased due primarily to higher demand from existing customers. Aerospace sales decreased in fiscal 2006 due to unusu-ally large demand in the prior year for products related to aircraft collision avoidance systems, which systems were mandated by the Federal Aviation Administration for installation in all commercial aircraft. The higher level of aerospace sales were not expected to continue.
Fiscal 2006 gross profit percentage was 8.2%, down from 10.8% last year. The lower margins this year reflected changes in cost estimates related to certain sonobuoy programs, which resulted in additional charges of $1.8 million. These charges were the result of product design and manufacturing problems on these contracts. In addition, two new medical programs resulted in negative margins totaling $0.6 million in fiscal 2006. These two new programs are in the start-up phase and expected to pro-duce significant revenues in the future.
Our net income for the year was $98,000 ($0.01 per share basic and diluted) compared to $8.1 million ($0.88 per share ba-sic and $0.87 per share diluted) last year. Net income for fiscal 2005 was favorably impacted by an insurance settlement of $5,455,000 (pre-tax). The settlement reflected the recovery of a portion of past costs incurred in investigation and site remedia-tion of our Coors Road, Albuquerque, New Mexico facility, an Environmental Protection Agency matter which commenced
in 1983. Site remediation is expected to continue for the foreseeable future and related anticipated expenses have been accrued for in our financial statements.
At June 30, 2006, our total shareowners’ equity was $96.9 million, we had $19.8 million in debt related to the recent acquisition of Astro, and our cash and cash equivalents, plus investment securities, totaled $23.5 million.
While this past fiscal year reflects financial results significantly below those desired and previously anticipated, the changes underway at Sparton are significant and expected to add to Sparton’s growth and profitability in future years.
For perspective, in 1996 Sparton sold its automotive divisions, which gener-ated essentially half of our approximately $200 million in annual sales. Since that time, Sparton has worked to diversify and expand into other commer-cial areas, with the result that in fiscal 2006 we have exceeded $170 million in sales. While the last several years have had their ups and downs, in total the last five years of operations have resulted in approximately $818 million in sales and $18 million in net income. Until the acquisition of Astro on May 31, 2006, this growth was organic and occurred without incurring debt.
Our plan is to continue expanding our market presence through acquisi-tions in the defense and medical device markets, while continuing to focus on organic growth with selected original equipment manufacturers (OEM’s). The acquisition of our newest subsidiary, Astro, brought to Sparton an experienced management group, along with customers new to Sparton and many potential customer opportunities. Astro was a privately owned electronic manufacturing services (EMS) provider in Strongsville, Ohio that had been in business as Astro Instrumentation, LLC for approximately 5 years. Astro’s sales volume for its year ended December 31, 2005, was ap-
Bradley O. SmithChairman

nyse | spa
3
Bradley O. Smith Chairman
David W. HockenbrochtCEO and President
proximately $34 million. Astro’s production, design, and development capabilities in the highly specialized fluid science and diagnostic laboratory equipment niche of the complex medical device industry favorably positions us for significant potential growth.
Additionally, Sparton is expanding its global opportunities for customers desiring an off shore product design and manufactur-ing option. Spartronics, our Vietnam based subsidiary, completed its first prototype production in March of 2005. By August 2005, Spartronics had received the ISO 9001 designation and AS 9100 certification, significant achievements for a new plant with a new workforce. While our Vietnam volume is still below the manufacturing level required to achieve profitable opera-tions, the number of customers with new product implementations scheduled, or under discussion, continues to grow. Several new programs are pending and should mature over the next few months, and we expect that this facility will achieve produc-tion volumes on a monthly basis to allow at or near breakeven levels by the end of fiscal 2007. During fiscal 2006, the Board of Directors approved the payment of a $0.10 per share cash dividend to shareowners, which was paid in October 2005. In that same month, the Board approved a 5% stock dividend which was distributed to shareowners in January 2006. In August 2005, the Board discussed and approved the implementation of a program for the repurchase of Company stock. The repurchase of Sparton stock is believed to be a good use of capital and another way to potentially en-hance shareowner value. The repurchase of up to $4,000,000 of shares of Sparton’s outstanding common stock was authorized by the Board. Repurchases are made by a broker/dealer who assists the Company in connection with the stock repurchase program. Purchases are subject to market conditions and all applicable laws and regulations. The timing of purchases and the exact number of shares purchased is dependent on market conditions and certain legal restrictions applicable to such pro-grams. As of June 30, 2006, approximately 39,000 shares of stock at a cost of approximately $363,000 have been repurchased. It is our intent to finance continuing stock purchases using available cash and short-term investments. Repurchased shares are subsequently retired.
We have scheduled Wednesday, October 25, 2006, as the date for Sparton’s Annual Shareowners’ Meeting. The meeting will be held at the Walter F. Ehrnfelt Recreation and Senior Complex in Strongsville, Ohio starting at 10:00 AM. After the meeting, a tour of Astro’s facility will be offered to interested shareowners. A map showing directions to the center is included on the back cover of this report and is available on our website at www.sparton.com.
As always, we appreciate your continued interest and support of our activities at Sparton.
Cordially,
Forward Looking Statements. This Annual Report contains certain statements, including Sparton’s expectations for future profitability, margin growth, financial results, and cash flows, Sparton’s estimate of the strength of its financial position, and Sparton’s plans for future expansions and growth opportunities, which are or could be construed to be forward looking statements within the meaning of the Securities Exchange Act of 1934. These state-ments are based on Sparton’s estimates, assumptions and projections and reflect Sparton’s current views with respect to these items. Sparton does not undertake to update the informa-tion contained herein, which speaks only as of the date of this Annual Report. Sparton has identified certain risk factors which could cause actual plans and results to differ materially from those included in the forward looking statements. These factors are discussed in the Risk Factors section of Sparton’s most recently filed Form 10-K, and that discussion regard-ing risk factors is incorporated herein by reference.
David W. HockenbrochtChief Executive Officer & President

sparton corporation | overview
4
In an effort to strengthen its medical device manufacturing market presence and improve its core capabilities, Sparton Corporation purchased its newest subsidiary, Astro Instrumentation, Inc., on May 31, 2006.
Astro is an FDA and ISO 13485 registered design and manufacturing electro-mechanical services company founded in 2000 by a team of experienced managers from a global, multi-billion dollar medical Original Equipment Manufacturer (OEM).
Astro is a world-class service provider for proven reliable contract design, development, manufacturing and engineering complex electro-mechanical devices. Astro’s facility is located in Strongsville, Ohio, and operates from a 40,000 square foot facility in an industrial park. A 20,000 square foot addition to the facility is now under construction.
Our Distinction
From designing and developing an instrument which prepares precision blood samples for cancer detection to manufacturing complex instrumentation for OEMs and emerging medical technologies, Astro is trusted to serve as an invisible arm of our customers for delivering quality product direct to the end user.
Since Astro is responsible for the complete instrument as well as value added services such as wet chemistry testing, end of life management, service and repair parts, and value engineering, medical device customers benefit from having a strategic one-stop source to go from concept to shipping validated units released for sale.
nancy pratt
dave lapeus
brenda fisher
ed green
joe regiec
tim barr
bennie martinez
.ast
ro t
eam
mem
bersastro instrumentation, inc.
Duane StierhoffVice President and General ManagerAstro
Many of the Astro associates identified above have been employed or associated with this industry on average of twelve years. All have been recognized for their leadership skills and their commitment to growing Astro’s business.
Customers that have toured the Astro facility have often stated that Astro associates are one of the key factors in their choosing Astro as their manufacturing and design partner.
Back Row (l to r): Thomas Harbart, Director of Engineering Timothy Greszler, Director of Quality Timothy Walsh, Director of Manufacturing Duane Stierhoff, Vice President & General Manager Edward Majercak, Controller Thomas Heider, Manufacturing Manager
Front Row (l to r): Roy Rodgers, Director of Business Development Daneen Madaras, Human Resources Manager Jeffrey Hastings, Materials Manager
The Astro Management Team
jackie withrow

nyse | spa
5
performing.
expanding.
Hoang Trong VinhProduct Assurance ManagerSpartronics, Inc.
Tran Thi ChinhQuality Assurance SupervisorSpartronics, Inc.
Along with the acquisition of Astro,Sparton has focused on further penetra-tion of the medical device marketplace.The sales and engineering team for Sparton Medical Systems have made strides toward improving its engineeringcapabilities and building long-term sus-tainable relationships with its customers.
•Sparton Medical Systems’ engineering and manufacturing team completed several key development projects, such as a rapid infusion pump, in addition tointroducing several new system build programs into manufacturing.
•The Sparton Medical Systems team de-veloped a business process to create an atmosphere for engaging the customer at any point from product concept to production.
•Sparton Medical Systems’ business development efforts have produced several new, strategic customers in Fis-cal 2006.
•Sparton Medical Systems engineeringteam continually stays abreast of chang-ing technologies, and FDA and interna-tional regulatory requirements for the medical device industry, such as ISO13485, to sustain its competitive advan-tage.
Spartronics, Inc. has experienced a very productive and interesting first year of operation. The team has achieved numerous accomplishments in building and maintaining Sparton’s seamless business process:
•Spartronics is certified for ISO 9001:2002, AS 9100 and ISO 13485, all of which occured within the first year of operation.
•Spartronics is still the only manufacturer in Vietnam with the aerospace industry’s AS 9100 certification.
•Spartronics installed a second Surface Mount Technology (SMT) line which is capable of lead-free (RoHS) manufacturing.
•Spartronics utilizes the same ERP system as Sparton’s North American facilities, creating a seamless business process.
•All Spartronics employees are trained to IPC Class III quality requirements.
Sparton’s strong reputation has helped build its business. This reputa-
tion for getting the job done, gave Sparton the opportunity to partner with a new customer.
An aerospace customer was aware of Sparton’s successes and presented Sparton with their need for 35 new assemblies within six weeks. The successful solution to the customer’s requirements engaged three different Sparton facilities in manufacturing the boards. Sparton’s centrally man-aged New Product Introduction (NPI) process assured close coordination of requirements compliance and communication of project status and action item resolution.

sparton corporation | overview
6
.streamlining.changing
Whether it was the extended hours worked by engineers Keith Huber, Robert Cortese, John Houck, Gene Smith, Dave
Bruder, Tandy Watson & Denny Byrne to iron out last minute design issues, or the dedicated manufac-turing personnel Gloria Vazquez, Tammy Register, Barbara Caviness & Steve Cahl who worked late into the evening to ensure that the final line was kept moving; whether it was project manager, Dave Powell, who hand-carried product to the airport to meet a shipping deadline, or en-gineer, Jim Prochaska, who flew out to the customer’s facility to spend the weekend resolving hardware issues and performing last-minute up-grades, Sparton team members pulled together to make this program a huge success and a job well done!
Jeffrey HastingsMaterials ManagerAstro
Timothy GreszlerDirector of Quality and ReliabilityAstro
Throughout the past year, the Sparton aerospace sales team’s objective was to provide our customers improved efficiencies in inventory management, materials handling and costing methodologies. By improving efficiencies in these key areas, long-term, strategic partnerships with major aerospace original equipment manufacturers have been successfully developed.
•The aerospace group has added three new customers in fiscal 2006 and also qualified as a strategic supplier with four of its international aerospace customers.
•Sparton operations collaborated with Spartronics in Vietnam offering customers a low-cost alternative to circuit card production in China.
•Sparton has successfully implemented the “Sparton-Owned Inventory” (SOI) program. The program works to improve efficiencies and lower costs for customers by Sparton’s on-site management of the customer’s inventory.
In the industrial market, Sparton’steam has made tremendous strides in managing a rapidly changing environment. This team has kept its focus while ramping up its efforts to meet business demands:
•Industrial sales has experienced substantial sales growth within its customer base.
•The industrial team is setting new standards of excellence throughout Sparton for successfully managing and sustaining their customers’ increasing forecasts.
•Sparton’s industrial market has improved by team members focused on growing the profitability of accounts by implementing selective retention strategies among its client base.
•The Company exited the proprietary telecommunications markets in fiscal 2006. Industrial business development now focuses on markets such as gaming systems, chemical & explosive detection equipment, electronic test and inspection equipment, machine vision, motion stabilized camera systems and long-throw cable harnesses.
William BrysonBusiness Development ManagerSparton
nyse | spa
�
A Sparton Medical Systems team of engineers including Ben Miller, Andrew
Lewis, Rickey Durias, Chuck Miller, Brian Rose, Howard Wood, Ann Gibson, Michael Wetherington, Randy
Ross and Project Manager Brad Rainier successfully
completed the Rapid Infusion Pump product development and provided the customer with documentation required to complete their FDA filing for the device.
Completion of the design and the filing requires extensive, complex, technical documentation that records the “design history” of the device being submitted for the FDA’s review prior to marketing the device. Completion of this extensive documentation under a very aggressive submission deadline required excellent teamwork and substantial extra effort by the design team via night and weekend work.
The rapid infusion pump is a compact, lightweight infusion pump to be used by civilian and military trauma units that require very high volume rapid infusion of fluids which have been heated from their cooled storage temperatures to near body temperature. The device has been in product development at Sparton Medical Systems for about 2 years.
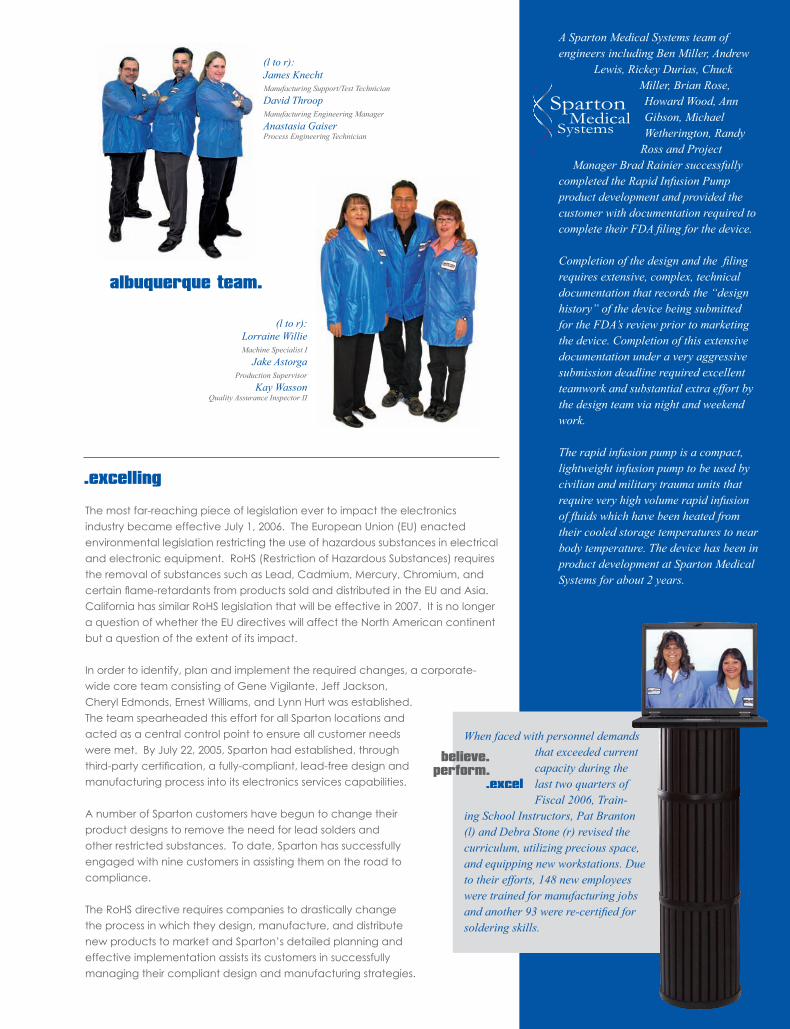
(l to r):Lorraine WillieMachine Specialist I
Jake AstorgaProduction Supervisor
Kay WassonQuality Assurance Inspector II
(l to r):James KnechtManufacturing Support/Test TechnicianDavid ThroopManufacturing Engineering ManagerAnastasia GaiserProcess Engineering Technician
When faced with personnel demands that exceeded current capacity during the last two quarters of Fiscal 2006, Train-
ing School Instructors, Pat Branton (l) and Debra Stone (r) revised the curriculum, utilizing precious space, and equipping new workstations. Due to their efforts, 148 new employees were trained for manufacturing jobs and another 93 were re-certified for soldering skills.
albuquerque team.
The most far-reaching piece of legislation ever to impact the electronics industry became effective July 1, 2006. The European Union (EU) enacted environmental legislation restricting the use of hazardous substances in electrical and electronic equipment. RoHS (Restriction of Hazardous Substances) requires the removal of substances such as Lead, Cadmium, Mercury, Chromium, and certain flame-retardants from products sold and distributed in the EU and Asia. California has similar RoHS legislation that will be effective in 2007. It is no longer a question of whether the EU directives will affect the North American continent but a question of the extent of its impact.
In order to identify, plan and implement the required changes, a corporate-wide core team consisting of Gene Vigilante, Jeff Jackson, Cheryl Edmonds, Ernest Williams, and Lynn Hurt was established. The team spearheaded this effort for all Sparton locations and acted as a central control point to ensure all customer needs were met. By July 22, 2005, Sparton had established, through third-party certification, a fully-compliant, lead-free design and manufacturing process into its electronics services capabilities.
A number of Sparton customers have begun to change their product designs to remove the need for lead solders and other restricted substances. To date, Sparton has successfully engaged with nine customers in assisting them on the road to compliance.
The RoHS directive requires companies to drastically change the process in which they design, manufacture, and distribute new products to market and Sparton’s detailed planning and effective implementation assists its customers in successfully managing their compliant design and manufacturing strategies.
.excelling

sparton corporation | overview
8
partnering.
Sparton’s government sales group is focused on serving the needs of the government market. Sparton has been providing innovative engineering, manufacturing and technology solutions to the United States government, its allies and their industrial bases for over 90 years.
The Company is engaged in multiple research and development programs to design new sensors and systems for airborne, sea-based and land-based military applications and homeland defense. Product offerings today range from sonobuoys operating in severe deep ocean environments; to data links, antennas, power supplies, batteries, and acoustic devices; to our newest product – the digital compass – which provides accurate heading readings, regardless of position or atmospheric condition. In addition to our own proprietary line of products, Sparton provides engineering and manufacturing services to the government market.
As a Joint Design Manufacturer, Sparton Government Sales provides integrated engineering and manufacturing solutions by partnering with customers to augment their engineering teams in completing product designs. When designs are validated, Sparton then functions as a virtual factory to manage the supply chain, manufacture and distribute finished products, and provide life cycle support ranging from parts obsolescence management to depot maintenance and repair.
•Sparton has positioned itself as a premiere Joint Design Manufacturer for government and defense customers. This will provide a greater opportunity for the development of customer relationshipsin the government and homeland defense industries.
•Sparton government engineers recently completed an extensive effort to develop a prototype of the next generation of sonobuoys, utilizing the latest advances in homeland security technology.
Tom StaffordMedical Engineering ManagerSparton Medical Systems
Roberta ShaugerCorporate Applications ManagerSparton
A customer had an urgent demand for 30,000 circuit board assemblies and the London, Ontario facility was up to the challenge. The customer requested the completion of 250 circuit board assemblies per day. In order to meet this rigorous production schedule, the core team realigned its
manufacturing shifts. Instead of the entire group working one shift per day, the team split the workload into three separate shifts. This allowed the assemblies to be manufactured continuously throughout a 24-hour period. Not only did the team meet the customer’s request, the group also reduced the total cost of producing each assembly by 10 percent.
(l to r):Dustin FrankCustomer Business ManagerKevin BrownMaster SchedulerMarianne TantonQuality Assurance ManagerDavor StepanovicProduction SupervisorGarret GrootenboerTraffic/Stockroom Supervisor
.london team

Sparton Corporation 2006 A
nnual Report
1
NYSE:SPA
United States Securities and Exchange CommissionWashington D.C. 20549
FORM 10-K
[X] ANNUAL REPORT PURSUANT TO SECTION 13 OR 15 (d) OF THE SECURITIES EXCHANGE ACT OF 1934 FOR THE FISCAL YEAR ENDED JUNE 30, 2006.
[ ] TRANSITION REPORT PURSUANT TO SECTION 13 OR 15 (d) OF THE SECURITIES EXCHANGE ACT OF 1934 FOR THE TRANSITION PERIOD FROM _____ TO _____
COMMISSION FILE NUMBER 1-1000
SPARTON CORPORATION(Exact name of registrant as specified in its charter)
OHIO 38-1054690 (State or Other Jurisdiction of (I.R.S. Employer Identification No.) Incorporation or Organization)
2400 EAST GANSON STREET, JACKSON, MICHIGAN 49202-3795(Address of Principal Executive Offices)
(517) 787-8600
(Registrant’s Telephone Number, Including Area Code)
Securities registered pursuant to Section 12(b) of the Act:
COMMON STOCK, $1.25 Par Value NEW YORK STOCK EXCHANGE (Title of each class) (Name of each exchange on which registered)
Securities registered pursuant to Section 12(g) of the Act: NONE
Indicate by check mark if the registrant is a well-known seasoned issuer, as defined in Rule 405 of the Securities Act. Yes [ ] No [ X ]
Indicate by check mark if the registant is not required to file reports pursuant to Section 13 or Section 15(d) of the Act. Yes [ ] No [ X ]
Indicate by check mark whether the registrant (1) has filed all reports required to be filed by Section 13 or 15(d) of the Securities Exchange Act of 1934 during the preceding 12 months (or for such shorter period that the registrant was required to file such reports), and (2) has been subject to such filing requirements for the past 90 days. Yes [ X ] No [ ]
Indicate by check mark if disclosure of delinquent filers pursuant to Item 405 of Regulation S-K is not contained herein, and will not be contained, to the best of registrant’s knowledge, in definitive proxy or information statements incorporated by reference in Part III of this Form 10-K or any amendment to this Form 10-K. [ X ]
Indicate by check mark whether the registrant is a large accelerated filer, an accelerated filer, or a non-accelerated filer. See definition of “accelerated filer and large accelerated filer” in Rule 12b-2 of the Exchange Act. (Check one):
Large accelerated filer [ ] Accelerated filer [ ] Non-accelerated filer [ X ]
Indicate by check mark whether the registrant is a shell company (as defined in Exchange Act Rule 12b-2). Yes [ ] No [ X ]
State the aggregate market value of the voting and non-voting common stock held by non-affiliates computed by reference to the price at which the com-mon stock was last sold, or the average bid and asked price of such common stock, as of the last business day of the registrant’s most recently completed second fiscal quarter: The aggregate market value of voting (no non-voting) common stock held by non-affiliates was $56 million, based on the closing price of common shares as of December 31, 2005, which was $8.96 per share.
The number of shares of common stock outstanding as of August 31, 2006, was 9,385,005.
DOCUMENTS INCORPORATED BY REFERENCE
Part III - Portions of the definitive Proxy Statement for the fiscal year ended June 30, 2006, to be delivered to shareowners in connection with the Annual Meeting of Shareowners to be held October 25, 2006, are incorporated by reference into Part III of this Form 10-K.

Sparton Corporation 2006 A
nnual Report
2
NYSE:SPA
(This Page Intentionally Left Blank)

Sparton Corporation 2006 A
nnual Report
3
NYSE:SPA
TABLE OF CONTENTS
PART I
Item 1. Business .............................................................................................................................................................................5Item 1(a). Risk Factors ........................................................................................................................................................................6Item 1(b). Unresolved Staff Comments ............................................................................................................................................ 11Item 2. Properties .......................................................................................................................................................................... 11Item 3. Legal Proceedings ............................................................................................................................................................ 11Item 4. Submission of Matters to a Vote of Security Holders ......................................................................................................14
PART II
Item 5. Market for Registrant’s Common Equity, Related Stockholder Matters and Issuer Purchases of Equity Securities ......14Item 6. Selected Financial Data ....................................................................................................................................................16Item 7. Management’s Discussion and Analysis of Financial Condition and Results of Operations ..........................................17Item 7(a). Quantitative and Qualitative Disclosures About Market Risk .........................................................................................27Item 8. Financial Statements and Supplementary Data ................................................................................................................28Item 9. Changes in and Disagreements with Accountants on Accounting and Financial Disclosure ..........................................50Item 9(a). Controls and Procedures ..................................................................................................................................................50Item 9(b). Other Information .............................................................................................................................................................50
PART III
Item 10. Directors and Executive Officers of the Registrant ..........................................................................................................51Item 11. Executive Compensation ..................................................................................................................................................51Item 12. Security Ownership of Certain Beneficial Owners and Management and Related Stockholder Matters ........................51Item 13. Certain Relationships and Related Transactions ..............................................................................................................51Item 14. Principal Accountant Fees and Services ..........................................................................................................................51
PART IV
Item 15. Exhibits and Financial Statement Schedules ....................................................................................................................52 Signatures and Certifications ............................................................................................................................................53

Sparton Corporation 2006 A
nnual Report
4
NYSE:SPA
(This Page Intentionally Left Blank)

Sparton Corporation 2006 A
nnual Report
5
NYSE:SPA
PART I
Item l. Business
The Company has been in continuous existence since 1900. It was last reorganized in 1919 as an Ohio corporation. The Company’s operations are in one line of business, electronic manufacturing services (EMS). The Company provides design and electronic manufacturing services, which include a complete range of engineering, pre-manufacturing and post-manufacturing services. Capabilities range from product design and development through aftermarket support. All of the facilities are registered to ISO standards, including 9001 or 13485, with most having additional certifications. Products and services include complete “Box Build” products for Original Equipment Manufacturers, microprocessor-based systems, transducers, printed circuit boards and assemblies, sensors and electromechanical devices for the medical/scientific instrumentation, electronics, aerospace, and other industries, as well as engineering services relating to these product sales. The Company also designs and manufactures sonobuoys, anti-submarine warfare (ASW) devices, used by the U.S. Navy and other free-world countries. See Note 12 to the Consolidated Financial Statements included in Item 8 of this report for information regarding the Company’s product sales concentration and locations of long-lived assets. The Company’s website address is www.sparton.com. Information provided at the website includes, among other items, the Annual Report on Form 10-K, Quarterly Reports on Form 10-Q, Quarterly Earnings Releases, News Releases, Governance Guidelines, and the Code of Ethics, as well as various Board of Director committee charters. The Company provides, free of charge, copies of its periodic and current reports (e.g., Forms 10-K, 10-Q and 8-K) and amendments to such reports that are filed with the Securities and Exchange Commission (SEC), as well as the Board of Director committee charters. Reports are available as soon as reasonably practicable after such reports are filed with or furnished to the SEC, either at the Company’s website, through a link to the SEC’s site or through the Company’s Shareowner Relations Department.
Electronic Contract Manufacturing Services
Historically, the Company’s principal electronics product was sonobuoys, which are ASW devices used by the U.S. Navy and other free-world military organizations. The Company competes with a very limited number of qualified manufacturers for sonobuoy procurements by the U.S. and select foreign governments. Contracts are obtained through competitive bid or direct procurement. Certain sonobuoy contracts are awarded and produced through a joint venture agreement with UnderSea Sensor Systems, Inc. (USSI), another producer of sonobuoys. USSI’s parent company is Ultra Electronics Holdings PLC, based in the United Kingdom. The joint venture arrangement operates under the name ERAPSCO. ERAPSCO allows the two companies to consolidate their own unique and complementary backgrounds and to jointly develop and produce certain agreed-upon designs for the U.S. Navy. While the joint agreement provides the opportunity to maximize efficiencies in the design and development of the related sonobuoys, both companies function independently; therefore, there is no separate entity to be accounted for or consolidated. Thus, individual contract risk exposures are reduced, while simultaneously enhancing the likelihood of achieving U.S. Navy and other ASW objectives. In general, the agreed upon designs included under the joint venture agreement are developmental or are sonobuoys with low volume demand, although the Company would like to expand the ERAPSCO arrangement to potentially include all sonobuoy efforts.
The Company is now focused on substantially expanding sales in the high-mix, low to medium-volume non-sonobuoy EMS markets. High-mix describes customers needing multiple product types with generally low volume manufacturing runs. This is where the Company expects substantial future revenue growth, with emphasis on government, aerospace, medical/scientific instrumentation, and industrial markets. Many of the physical and technical attributes in the production of electronics for sonobuoys are the same as those required in the production of other electrical and electromechanical products and assemblies. The Company’s EMS business includes design and/or manufacture of a variety of electronic and electromechanical products and assemblies. Sales are generally obtained on a competitive basis. Competitive factors include technical ability, customer service, product quality, timely delivery and price.
Non-sonobuoy electronic contract manufacturing and services are sold primarily through a direct sales force. Design services in the non-sonobuoy area are supported by an engineering organization, with centralized management and decentralized operations, which allows the Company to deliver products and services in an efficient manner and enhances the Company’s focus on new and expanding technologies. In the commercial EMS business, Sparton must compete with a significant number of domestic and foreign manufacturers, some of which are much larger in terms of size and/or financial resources. The Company generally contracts with its customers to manufacture products based on the customer’s design, specifications and shipping schedules. Normally, EMS programs do not require the Company’s direct involvement in original equipment manufacturer product marketing. Material cost and availability, product quality, delivery and reliability are all very important factors in the commercial EMS business.
The Company signed a membership purchase agreement and completed the acquisition of Astro Instrumentation, LLC (“Astro”) on May 31, 2006. Astro was a privately-owned EMS company located in Strongsville, Ohio (near Cleveland) which had been in business for approximately five years. Under the terms of the purchase agreement, the previous owners

Sparton Corporation 2006 A
nnual Report
6
NYSE:SPA
entered into non-competition agreements with the Company. Astro is an EMS provider that designs and manufactures a variety of specialized medical products, generally involving high-quality medical laboratory test equipment. The acquisition of Astro furthered the Company’s strategy of identifying, evaluating and purchasing potential acquisition candidates in both the defense and medical device markets. The Company believes the acquisition of Astro will favorably position Sparton within the medical market to attract and expand its customer base. Astro operates from a 40,000 square foot facility in an industrial park. A 20,000 square foot addition to the facility is now under construction. Sparton operates the business as a wholly-owned subsidiary at its present location and with the current manufacturing management and staff. The Company’s intentions are to integrate Astro’s operations and general management oversite with those of the other Sparton locations.
In May 2005, Spartronics, the Company’s Vietnam based subsidiary, began regular production. This facility, located just outside of Ho Chi Minh City, is anticipated to provide growth opportunities for the Company, in current as well as new markets. Spartronics is a full service manufacturing facility, providing an off shore option for customers requesting this type of production facility.
At June 30, 2006 and 2005, the government funded backlog was approximately $41 million and $42 million, respectively. A majority of the fiscal 2006 backlog is expected to be realized in the next 12-15 months. Commercial EMS sales are not included in the backlog. The Company does not believe the amount of backlog of commercial sales covered by firm pur-chase orders is a meaningful measure of future sales, as such orders may be rescheduled or cancelled without significant penalty.
Other
One of Sparton’s largest customers is the U.S. Navy. While the loss of U.S. government sonobuoy sales would have a mate-rial adverse financial effect on the Company, the loss of any one of several other customers, including Honeywell and Bally both with sales in excess of 10% of total sales, could also have a significant financial impact. The Company continues to grow its non-sonobuoy EMS sales with the objective of expanding the customer base, thus reducing the Company’s exposure to any single customer. The Astro acquisition will further expand our customer base. While overall sales fluctuate during the year, such fluctuations do not reflect a seasonal pattern or tendency.
Materials for the electronics operations are generally available from a variety of worldwide sources, except for selected components. Access to competitively priced materials is critical to success in the EMS business. In certain markets, the volume purchasing power of the larger competitors creates a cost advantage for them. Although the electronics industry has experienced spot shortages, the Company does not expect to encounter significant long-term problems in obtaining sufficient raw materials. The risk of material obsolescence in the contract EMS business is less than it is in many other markets be-cause raw materials and component parts are generally purchased only upon receipt of a customer’s order. However, excess material resulting from order lead-time is a risk factor due to potential order cancellation or design changes by customers.
Expenditures for research and development (R&D) not funded by customers amounted to approximately $882,000 in fiscal 2006, compared to $1,756,000 in fiscal 2004, and these expenses were included in selling and administrative expense. There were no non-funded R&D expenditures in fiscal 2005. Customer funded R&D costs are generally not considered material, are usually part of a larger production agreement, and as such are included in both sales and costs of goods sold. While there are approximately 73 employees involved in R&D activities, none are engaged in this activity on a full time basis.
Sparton employed approximately 1,200 people at June 30, 2006. The Company has one manufacturing division and five wholly-owned active manufacturing subsidiaries, including the recent addition of Astro.
Item 1(a). Risk Factors
We operate in a changing economic, political and technological environment that presents numerous risks, many of which are driven by factors that we cannot control or predict. The following discussion, as well as our “Critical Accounting Policies and Estimates” and “Management’s Discussion and Analysis” in Item 7, highlight some of these risks. The terms “Sparton,” “the Company,” “we,” “us,” and “our” refer to Sparton Corporation and Subsidiaries.
The industry is extremely competitive and we depend on continued outsourcing by OEMs.
The EMS industry in general is highly fragmented and intensely competitive. The contract manufacturing services provided are available from many sources, and we compete with numerous domestic and foreign EMS firms. Within Sparton’s target market, the high-mix, low to medium-volume sector of the EMS industry, there are substantially fewer competitors, but competition remains strong. Some competitors have substantially greater manufacturing, R&D, marketing, and/or financial resources and in some cases have more geographically diversified international operations, including manufacturing facili-ties in Europe and South America. Sparton expects competition to intensify further as more companies enter our target

Sparton Corporation 2006 A
nnual Report
7
NYSE:SPA
markets and our customers consolidate. In the future, increased competition from large electronic component manufactur-ers that are selling, or may begin to sell, electronics manufacturing services may occur. Future growth will depend on new outsourcing opportunities, and could be limited by OEMs performing such functions internally or delaying their decision to outsource.
In some cases, Sparton may not be able to offer prices as low as some competitors because those competitors may have lower cost structures for the services they provide, or because such competitors are willing to accept business at lower margins in order to utilize more of their excess capacity. In that event, net sales would decline. At times Sparton may be operating at a cost disadvantage compared to some competitors who have greater direct buying power. As a result, competitors may have a competitive advantage and obtain business from our customers.
Principal competitive factors in our targeted market are believed to be quality, reliability, the ability to meet delivery sched-ules, technological sophistication, geographic location, and price. During periods of recession in the electronics industry, our competitive advantages in the areas of adaptive manufacturing and responsive customer service may be of reduced importance due to increased price sensitivity. We also expect our competitors to continue to improve the performance of their current products or services, to reduce their current products or service sales prices and to introduce new products or services that may offer greater performance and improved pricing. Any of these could cause a decline in sales, loss of market acceptance of our products or services, profit margin compression, or loss of market share.
Our operating results are subject to general economic conditions and may vary significantly from period to period due to a number of factors.
We are subject to inflation, interest rate changes, availability of capital markets, consumer spending rates, the effects of governmental plans to manage economic conditions and other national and global economic occurrences beyond our con-trol. Such factors, economic weakness, and constrained customer spending have resulted in the past, and may result in the future, in decreased revenue, gross margin, earnings, or growth rates.
We often experience significant fluctuations in our annual and quarterly results of operations. In addition to general economic conditions, other factors that contribute to these fluctuations are Sparton’s effectiveness in managing the manufacturing processes and costs in order to decrease manufacturing expenses, as well as the level of capacity utilization of our manu-facturing facilities and associated fixed costs. Sparton’s ASW sales are totally dependent upon access to the U.S. Navy’s test facilities for sonobuoys. Additionally, the Company relies on our customer’s demands, which can and does change dramatically. Such factors also could affect our results of operations in the future.
Start-up costs and inefficiencies related to new or transferred programs can adversely affect our operating results and may not be recoverable.
Start-up costs, the management of labor and equipment resources in connection with new programs and new customer relationships, and the need to estimate required resources in advance can adversely affect profit margins and operating results. These factors are particularly evident with the introduction of new products and programs. The effects of these start-up costs and inefficiencies can also occur when new facilities are opened, such as our facility near Ho Chi Minh City, Vietnam that opened in fiscal 2005.
If new programs or new customer relationships are terminated or delayed, our operating results may be harmed, particularly in the near term. We may not be able to recoup our start-up costs or replace anticipated new program revenues.
We depend on limited or sole source suppliers for some critical components; the inability to obtain components as re-quired, with favorable purchase terms, could harm our business.
A significant portion of our costs are related to electronic components purchased to produce our products. In some cases, there may be only one supplier of a particular component. Supply shortages for a particular component can delay production, and thus delay shipments to customers and the associated revenue of all products using that component. This could cause the Company to experience a reduction in sales, increased inventory levels and costs, and could adversely affect relationships with existing and prospective customers. In the past, we have secured sufficient allocations of constrained components so that revenue was not materially impacted. If we are unable to procure necessary components under favorable purchase terms, including at favorable prices and with the order lead-times needed for the efficient and profitable operation of our factories, our results of operations could suffer.

Sparton Corporation 2006 A
nnual Report
8
NYSE:SPA
We are dependent on a few large customers; the loss of such customers or reduction in their demand could substantially harm our business and operating results.
For the fiscal year ended June 30, 2006, our six largest customers, including the US government, accounted for approxi-mately 77% of net sales. U.S. governmental sales, primarily the US Navy, represented 22% of our fiscal 2006 sales. We expect to continue to depend upon a relatively small number of customers, but cannot ensure that present or future large customers will not terminate, significantly change, reduce, or delay their manufacturing arrangements with us. Because our major customers represent such a large part of our business, the loss of any of our major customers or reduced sales to these customers could negatively impact our business. While the integration of Astro is anticipated to expand our customer base, currently Astro’s customer base is also highly concentrated, with approximately 80% of their sales to one customer with several locations.
We rely on the continued growth and financial stability of our customers, including our major customers. Adverse changes in the end markets they serve can reduce demand from our customers in those markets and/or make customers in these end markets more price sensitive. Furthermore, mergers or restructurings among our customers or our customers’ customers could increase concentration and/or reduce total demand as the combined entities rationalize their business and consolidate their suppliers. Future developments, particularly in those in end markets which account for more significant portions of our revenues, could harm our business and our results of operations.
Future governmental sales could be affected by a decrease in defense spending by the U.S. government, or by changes in spending allocation that could result in one or more of the Company’s programs being reduced, delayed or terminated, which would adversely affect our financial results. The Company’s U.S. governmental sales are funded by the federal budget. Changes in congressional schedules, negotiations for program funding levels or unforeseen world events can interrupt the funding for a program or contract. The timing of sonobuoy sales to the U.S. Navy is dependent upon access to, and suc-cessful passage of, product tests by the U.S. Navy. Reduced governmental budgets have made access to the test range less predictable and less frequent than in the past, which has impacted our reported revenues.
Sparton generates large accounts receivable in connection with our providing of electronic contract manufacturing. If one or more of our customers experiences financial difficulty and is unable to pay for the services provided, our operating results and financial condition would be adversely affected.
Customer cancellations, reductions, or delays could adversely affect our operating results.
We generally do not obtain long-term purchase commitments from our customers. Customers may cancel orders, delay the delivery of orders, or release orders for fewer products than we previously anticipated for a variety of reasons, including decreases in demand for their products and services. Such changes by a significant customer, by a group of customers, or by a single customer whose production is material to an individual facility could seriously harm results of that operation in that period. In addition, since much of our costs and operating expenses are relatively fixed, a reduction in customer demand would adversely affect our margins and operating income. Although we are always seeking new opportunities, we cannot be assured that we will be able to replace deferred, reduced or cancelled orders.
Our inability to forecast the level of customer orders with much certainty makes it difficult to schedule production and maximize utilization of manufacturing capacity. If actual demand is higher than anticipated, we may be required to increase staffing and other expenses in order to meet such demand of our customers. Alternatively, anticipated orders from our customers may fail to materialize, thereby adversely affecting our results of operations. Such customer order fluctuations and deferrals have had a material adverse effect on us in the past, and we may experience such effects in the future.
Such order changes could cause a delay in the repayment to us for inventory expenditures we incurred in preparation for the customer’s orders or, in certain circumstances, require us to return the inventory to our suppliers, re-sell the inventory to another customer or continue to hold the inventory. In some cases excess material resulting from longer order lead-time is a risk due to the potential of order cancellation or design changes by customers. Additionally, dramatic changes in cir-cumstances for a customer could also negatively impact the carrying value of our inventory for that customer.
The Company and its customers may be unable to keep current with technological changes.
The Company’s customers’ participate in markets that have rapidly changing technology, evolving industry standards, frequent new product introductions, and relatively short product life cycles. The introduction of products embodying new technolo-gies or the emergence of new industry standards can render existing products obsolete or unmarketable. The Company’s success depends upon our customers’ ability to enhance existing products and to develop and introduce new products, on a timely and cost-effective basis, that keep pace with technological developments and emerging industry standards, and

Sparton Corporation 2006 A
nnual Report
9
NYSE:SPA
address increasingly sophisticated customer requirements. There is no assurance that the Company’s customers will do so and failure to do so could substantially harm the Company’s customers and indirectly the Company.
Additionally, the Company’s future success will depend upon its ability to maintain and enhance its own technological capabilities, develop and market manufacturing services which meet changing customer needs, and successfully anticipate or respond to technological changes in manufacturing processes on a cost-effective and timely basis. If Sparton is unable to do so, business, financial condition and operating results could be materially adversely affected.
Fluctuations in foreign currency exchange rates could increase operating costs.
A portion of the Company’s operations and some customers are in foreign locations. As a result, transactions may occur in currencies other than the U.S. dollar. Currency exchange rates fluctuate on a daily basis as a result of a number of factors and cannot be easily predicted. Volatility in the functional currencies of our entities and the U.S. dollar could seriously harm our business, operating results and financial condition. The primary impact of currency exchange fluctuations is on the adjustments related to the translation of the Company’s Canadian and Vietnamese financial statements into U.S. dollars, which are included in current earnings, as well as impacting the cash, receivables, and payables of our operating entities. The Company currently does not use financial instruments to hedge foreign currency fluctuation and unexpected expenses could occur from future fluctuations in exchange rates.
Failure to attract and retain key personnel and skilled associates could hurt operations.
Our success depends to a large extent upon the continued services of key management personnel. We cannot be assured that we will retain our key employees, and the loss of service of any of these officers or key management personnel could have a material adverse effect on our business growth and operating results.
Our future success will require an ability to attract and retain qualified employees. Competition for such personnel is in-tense, and we cannot be assured that we will be successful in attracting and retaining such personnel. Changes in the cost of providing pension and other employee benefits, including changes in health care costs, investment returns on plan assets, and discount rates used to calculate pension and related liabilities, could lead to increased costs in any of our operations.
We are involved in legal proceedings and unfavorable decisions could materially affect us.
Our business activities expose us to risks of litigation with respect to our customers, suppliers, creditors, shareowners, prod-uct liability, or environmental-related matters. We may incur significant expense to defend or otherwise address current or future claims. Any litigation, even a claim without merit, could result in substantial costs and diversion of resources, and could have a material adverse effect on our business and results of operations.
Also, in the past, we have filed claims relating to various matters, including product defects discovered in certain aerospace circuit boards, which were supplied to us. Although we are pursuing such claims, we cannot predict the outcome. If we are not able to obtain a sufficient recovery, our business and operating results could be adversely impacted. Refer to Item 3 - “Legal Proceedings” of this report.
Adverse regulatory developments could harm our business.
Our business operates in heavily regulated environments. We must manage the risk of changes in or adverse actions under applicable law or in our regulatory authorizations, licenses and permits, governmental security clearances or other legal rights in order to operate our business, manage our work force, or import and export goods and services as needed. We also face the risk of other adverse regulatory actions, compliance costs, or governmental sanctions.
Business disruptions could seriously harm our business and results of operations.
Increased international political instability, evidenced by threats and occurrence of terrorist attacks, conflicts in the Middle East and Asia, and strained international relations arising from these conflicts, may hinder our ability to do business. The political environment in communist countries can contribute to the threat of instability. While we have not been adversely affected as yet due to this exposure, one of our facilities is based in Vietnam, which is a communist country. These events may continue to have an adverse impact on the U.S. and world economies, particularly customer confidence and spending, which in turn could affect our revenue and results of operations. The impact of these events on the volatility of the U.S. and world financial markets could increase the volatility of our securities and may limit the capital resources available to us, our customers and our suppliers.

Sparton Corporation 2006 A
nnual Report
10
NYSE:SPA
Our worldwide operations could be subject to natural disasters and other business disruptions, including earthquakes, power shortages, telecommunications failures, water shortages, tsunamis, floods, hurricanes, fires, and other natural or manmade disasters, which could seriously harm our financial condition and increase our expenses. In the past, hurricanes have ad-versely impacted the performance of two of our production facilities located in Florida.
We have a production facility outside Ho Chi Minh City, Vietnam, which is in the area affected by avian flu. To the best of our knowledge, concerns about the spread of avian flu have not affected our employees or operations. However, our Asian production could be severely impacted by an epidemic spread of avian flu. Concerns relating to avian flu are currently focused on Asia; however, avian flu or other epidemics could similarly affect facilities in other locations. These factors could also affect our suppliers and customers, and results of operations.
Recently enacted changes in the securities laws and regulations have increased, and are likely to continue to increase, our costs.
The Sarbanes-Oxley Act of 2002 that became law in July 2002 has required changes in some of our corporate governance, securities disclosure and compliance practices. In response to the requirements of that Act, the Securities and Exchange Commission and the New York Stock Exchange have promulgated new rules on a variety of subjects. Compliance with these new rules, particularly preparation for future compliance with Section 404 of the Sarbanes-Oxley Act regarding management’s assessment of internal control over financial reporting, which will become applicable to Sparton at a future date, has increased our legal, financial, and accounting costs. We expect some level of increased costs related to these new regulations to continue indefinitely. While preparation and consulting costs are anticipated to decline, audit costs related to the regulation are expected to increase. The extent of the ongoing and future costs is unknown at this time due to the SEC’s, and other regulatory entities’, pending guidance related to smaller companies. However, absent significant changes in related rules (which we cannot assure), we anticipate these costs may decline somewhat in future years as we become more efficient in our compliance processes. We also expect these developments to make it more difficult and more expensive to obtain director and officer liability insurance, and we may be forced to accept reduced coverage or incur substantially higher costs to obtain coverage. Likewise, these developments may make it more difficult for us to attract and retain qualified members of our board of directors or qualified management personnel.
We are subject to a variety of environmental laws, which expose us to potential liability.
Our operations are regulated under a number of federal, state, provincial, local and foreign environmental laws and regula-tions, which govern, among other things, the discharge of hazardous materials into the air and water, as well as the handling, storage and disposal of such materials. These laws and regulations include the Clean Air Act, the Clean Water Act, the Resource, Conservation and Recovery Act and the Comprehensive Environmental Response, Compensation and Liability Act, as well as analogous state and foreign laws. Compliance with these environmental laws is a significant consideration for us because we use various hazardous materials in our manufacturing processes. We may be liable under environmental laws for the cost of cleaning up properties we own or operate if they are or become contaminated by the release of hazardous materials, regardless of whether we caused the release, even if we fully comply with applicable environmental laws. In the event of contamination or violation of environmental laws, we could be held liable for damages including fines, penalties and the costs of remedial actions and could also be subject to revocation of our discharge permits. Any such penalties or revocations could require us to cease or limit production at one or more of our facilities, thereby harming our business. In addition, such regulations could restrict our ability to expand our facilities or could require us to acquire costly equipment, or to incur other significant expenses to comply with environmental regulations, including expenses associated with the recall of any non-compliant product. See Item 3 - “Legal Proceedings” of this report.
Certain shareowners have significant control and shares eligible for public sale could adversely affect the share price.
As of June 30, 2006, the directors, executive officers and 5% shareowners beneficially owned an aggregate of approximately 49% of our common stock, of which Bradley O. Smith, the Chairman of the Board, beneficially owned or controlled ap-proximately 24%. Accordingly, certain persons have significant influence over the election of our Board of Directors, the approval or disapproval of any other matters requiring shareowner approval, and the affairs and policies of Sparton. Such voting power could also have the effect of deterring or preventing a change in control of the Company that might otherwise be beneficial to other shareowners. In addition, substantially all of the outstanding shares of common stock are freely trad-able without restriction or further registration. Sales of substantial amounts of common stock by shareowners, or even the potential for such sales, may cause the market price to decline and could impair the ability to raise capital through the sale of equity securities.

Sparton Corporation 2006 A
nnual Report
11
NYSE:SPA
In the future, we may need additional funding, which may be raised through issuances of equity securities. We also have the right to issue shares upon such terms and conditions and at such prices as our Board of Directors may establish. Such offerings would dilute the ownership interest of existing shareholders and could cause a dilution of the net tangible book value of such shares.
At June 30, 2006, there were options outstanding for the purchase of approximately 517,000 shares of common stock of the Company, of which options for approximately 369,000 shares were vested and exercisable. Holders of the common stock could suffer dilution if outstanding common stock options are exercised.
Our stock price may be volatile, and the stock is thinly traded, which may cause investors to lose most or part of their investment in our common stock.
The stock market may experience volatility that is often unrelated to the operating performance of any particular company or companies. If market-sector or industry-based fluctuations occur, our stock price could decline regardless of our actual operating performance, and investors could lose a substantial part of their investments.
Moreover, if an active public market for our common stock is not sustained in the future, it may be difficult to resell such stock. For the three months ended August 1, 2006, the average number of shares of our common stock that traded on the NYSE has been approximately 2,300 shares per day. We had approximately 9,392,000 issued and outstanding shares as of June 30, 2006. When trading volumes are this low, a relatively small buy or sell order can result in a relatively large change in the trading price of our common stock and investors may not be able to sell their securities at a favorable price. In addition, should the vested and exercisable stock options be exercised and simultaneously sold (to fund the cost of the exercise and the related taxes), our stock price would be significantly adversely impacted.
Item 1(b). Unresolved Staff Comments
None.
Item 2. Properties
The following is a listing of the principal properties used by Sparton in its business. Except as described below, Sparton owns all of these properties. These facilities provide a total of approximately 897,000 square feet of manufacturing and administrative space, which includes the additional 20,000 square feet of new facilities under construction in Strongsville, Ohio. There are manufacturing and/or office facilities at each location. Reflective of the current economic environment, Sparton’s manufacturing facilities are underutilized. Underutilized percentages vary by plant; however, ample space exists to accommodate expected growth. Sparton believes these facilities are suitable for its operations.
Jackson, Michigan Deming, New MexicoDeLeon Springs, Florida Strongsville, OhioBrooksville, Florida London, Ontario, CanadaAlbuquerque, New Mexico Thuan An District, Binh Duong Province, Vietnam (Outside Ho Chi Minh City)
While the Company owns the building and other assets for Spartronics, including its manufacturing facility in Vietnam, the land is occupied under a long-term lease covering approximately 40 years. This is a prepaid lease, which cost is amortized over the life of the lease, and carried in other long-term assets on our balance sheet.
Not included above with the Company’s owned properties is the Company’s Coors Road, Albuquerque, New Mexico, facility. While this property is owned by Sparton, and included in the property, plant, and equipment section of our balance sheet, it is not used in Sparton’s manufacturing operations. Sparton leases this facility to another company under a long-term lease, which contains an option to buy.
Item 3. Legal Proceedings
Various litigation is pending against the Company, in many cases involving ordinary and routine claims incidental to the business of the Company and in others presenting allegations that are non-routine.
Environmental Remediation
The Company and its subsidiaries are involved in certain compliance issues with the United States Environmental Protec-tion Agency (EPA) and various state agencies, including being named as a potentially responsible party at several sites. Potentially responsible parties (PRPs) can be held jointly and severally liable for the clean-up costs at any specific site.

Sparton Corporation 2006 A
nnual Report
12
NYSE:SPA
The Company’s past experience, however, has indicated that when it has contributed relatively small amounts of materi-als or waste to a specific site relative to other PRPs, its ultimate share of any clean-up costs has been minor. Based upon available information, the Company believes it has contributed only small amounts to those sites in which it is currently viewed as a PRP.
In February 1997, several lawsuits were filed against Sparton’s wholly-owned subsidiary, Sparton Technology, Inc. (STI), alleging that STI’s Coors Road facility presented an imminent and substantial threat to human health or the environment. On March 3, 2000, a Consent Decree was entered into, settling the lawsuits. The Consent Decree represents a judicially enforceable settlement and contains work plans describing remedial activity STI agreed to undertake. The remediation activities called for by the work plans have been installed and are either completed or are currently in operation. It is anticipated that ongoing remediation activities will operate for a period of time during which STI and the regulatory agen-cies will analyze their effectiveness. The Company believes that it will take several years before the effectiveness of the groundwater containment wells can be established. Documentation and research for the preparation of the initial multi-year report and review are currently underway. If current remedial operations are deemed ineffective, additional remedies may be imposed at a significantly increased cost. There is no assurance that additional costs greater than the amount accrued will not be incurred or that no adverse changes in environmental laws or their interpretation will occur.
Upon entering into the Consent Decree, the Company reviewed its estimates of the future costs expected to be incurred in connection with its remediation of the environmental issues associated with its Coors Road facility over the next 30 years. At June 30, 2006, the undiscounted minimum accrual for future EPA remediation approximates $6,287,000. The Company’s estimate is based upon existing technology and current costs have not been discounted. The estimate includes equipment, operating and maintenance costs for the onsite and offsite pump and treat containment systems, as well as continued onsite and offsite monitoring. It also includes the required periodic reporting requirements. This estimate does not include legal and related consulting costs, which are expensed as incurred.
In 1998, STI commenced litigation in two courts against the United States Department of Energy (DOE) and others seeking reimbursement of Sparton’s costs incurred in complying with, and defending against, federal and state environmental require-ments with respect to its former Coors Road manufacturing facility. Sparton also sought to recover costs being incurred by the Company as part of its continuing remediation at the Coors Road facility. In fiscal 2003, Sparton reached an agreement with the DOE and others to recover certain remediation costs. Under the agreement, Sparton was reimbursed a portion of the costs the Company incurred in its investigation and site remediation efforts at the Coors Road facility. Under the settlement terms, Sparton received cash and the DOE agreed to reimburse Sparton for 37.5% of certain future environmental expenses in excess of $8,400,000 from the date of settlement. With the settlement, Sparton received cash and obtained some degree of risk protection, with the DOE sharing in costs incurred above the established level.
In 1995, Sparton Corporation and STI filed a Complaint in the Circuit Court of Cook County, Illinois, against Lumbermens Mutual Casualty Company and American Manufacturers Mutual Insurance Company demanding reimbursement of ex-penses incurred in connection with its remediation efforts at the Coors Road facility based on various primary and excess comprehensive general liability policies in effect between 1959 and 1975. In June 2005, Sparton reached an agreement with the insurers under which Sparton received $5,455,000 in cash in July 2005. This agreement reflects a recovery of a portion of past costs the Company incurred in its investigation and site remediation efforts, which began in 1983, and was recorded as income in June of fiscal 2005. The Company continues to pursue additional recoveries from excess carriers. The probability and amounts of recovery are uncertain at this time.
Customer Relationships
In September 2002, STI filed an action in the U.S. District Court for the Eastern District of Michigan to recover certain unreimbursed costs incurred as a result of a manufacturing relationship with two entities, Util-Link, LLC (Util-Link) of Delaware and National Rural Telecommunications Cooperative (NRTC) of the District of Columbia. On or about October 21, 2002, the defendants filed a counterclaim seeking money damages alleging that STI breached its duties in the manufac-ture of products for the defendants. The defendant NRTC asked for damages in the amount of $20 million for the loss of its investment in and loans to Util-Link. In addition, the defendant Util-Link had asked for damages in the amount of $25 million for lost profits. Sparton had reviewed these claims and believed they were duplicative. Util-Link did not pursue its claim at the below discussed trial.
The jury trial commenced on September 19, 2005 and concluded on November 9, 2005. The jury awarded Sparton dam-ages in the amount of $3.6 million, of which approximately $1.9 million represented costs related to the acquisition of raw materials. These costs were previously deferred and are included in other long-term assets on the Company’s June 30, 2006 balance sheet. As expected, there were post-trial proceedings, including motions by the defendant NRTC for judgment as matter of law on its counterclaim and a motion for new trial. On March 27, 2006, the trial court denied the defendant NRTC’s motion for judgment on its counter claim as a matter of law and granted the motion for new trial unless
Sparton Corporation 2006 A
nnual Report
13
NYSE:SPA
Sparton accepted a reduction of the judgment. Sparton accepted the reduction, which reduced the collective judgment in its favor to $1.9 million, which would enable the Company to recover the deferred costs and, accordingly, there would be no significant impact on operating results. An amended judgment was entered for $1.9 million in Sparton’s favor on April 5, 2006. On May 1, 2006, NRTC filed an appeal of the judgment, which could impact the ultimate result.
The Company has pending an action before the Federal Court of Claims to recover damages arising out of an alleged in-fringement by the U.S. Navy of certain patents held by Sparton and used in the production of sonobuoys. The case was dismissed on summary judgment; however, the decision of the Court of Claims was reversed by the Court of Appeals. The case is currently scheduled for trial in the first calendar quarter of 2007. The likelihood that the claim will be resolved and the extent of any recovery in favor of the Company is unknown at this time.
Product Issues
Some of the printed circuit boards supplied to the Company for its aerospace sales have been discovered to be defective. The defect occurred during production at the board supplier’s facility, prior to shipment to Sparton for further processing. Sparton; the board manufacturer, Electropac Co., Inc.; and our customer, who received the defective boards, have con-tained the defective boards. While investigations are underway, $2.9 million of related product and associated expenses have been deferred and classified in Sparton’s balance sheet within other long-term assets as of June 30, 2006. In August 2005, Sparton Electronics Florida, Inc. filed an action in U.S. District Court of Florida against Electropac Co., Inc. to re-cover these costs. The likelihood that the claim will be resolved and the extent of Sparton’s exposure, if any, is unknown at this time. No loss contingency has been established at June 30, 2006.

Sparton Corporation 2006 A
nnual Report
14
NYSE:SPA
Item 4. Submission of Matters to a Vote of Security Holders - No matters were submitted to a vote of the security hold-ers during the last quarter of the period covered by this report.
Executive Officers of the Registrant - Information with respect to executive officers of the Registrant is set forth below. The positions noted have been held for at least five years, except where noted.
David W. Hockenbrocht Chief Executive Officer since October 2000 and President since January 1978. (Age 71)
Douglas E. Johnson Chief Operating Officer and Executive Vice President since February 2001 and Vice President since 1995. (Age 58)
Richard L. Langley Senior Vice President since November 2004, Chief Financial Officer since February 2001, Vice Presi-
dent and Treasurer since 1990. (Age 61)
Joseph S. Lerczak Secretary since June 2002 and Corporate Controller since April 2000. (Age 49)
Michael G. Woods Senior Vice President, Industrial & Aerospace Business Systems since April 2005 and Vice President, General Manager of Sparton of Canada, Ltd. since August 1999. (Age 47)
Charles A. Stranko Vice President, International Business Development, since June 2005 and Vice President, Sparton Technology, Inc. since January 2001. (Age 48)
There are no family relationships among the persons named above. All officers are elected annually and serve at the discre-tion of the Board of Directors.
PART II
Item 5. Market for Registrant’s Common Equity, Related Stockholder Matters and Issuer Purchases of Equity Securities
The Company’s common stock is traded on the New York Stock Exchange under the symbol SPA. On August 31, 2006, there were 503 registered holders of record of the Company’s common stock. The price of the Company’s common stock as of August 31, 2006, was $8.81. During fiscal 2006, the Company declared a 5% common stock dividend on October 25, 2005; cash was paid in lieu of fractional shares. The Company also paid a $0.10 per share cash dividend on October 5, 2005, to shareowners of record as of September 14, 2005. The Company did not pay a cash dividend on its common stock in fiscal 2005. The historical high and low common stock prices per share were as follows:
For the quarter ended: (1) September 30 December 31 March 31 June 30
Fiscal 2006 High $11.11 $10.25 $9.29 $8.80 Low 9.58 8.60 8.55 8.20
Fiscal 2005 High 9.25 10.00 9.80 10.10 Low 8.31 8.67 8.91 9.15
(1) The above stock price information has not been adjusted to reflect any potential impact of the 5% stock dividends previously declared.
See Part III, Item 12 for certain information concerning common stock that may be issued under the Company’s equity compensation plans.
Stock repurchase program - Effective September 14, 2005, the Board of Directors authorized a publicly-announced com-mon share repurchase program for the repurchase, at the discretion of management, of up to $4 million of shares of the Company’s outstanding common stock in open market transactions. For the fiscal year ended June 30, 2006, 39,037 shares had been repurchased for cash consideration of approximately $363,000. During that period, the monthly weighted aver-age share prices ranged from $8.38 to $10.18 per share. The program expires September 14, 2007. For the nine months ended March 31, 2006, the Company had purchased 28,237 shares at an average price paid per share of $9.08.

Sparton Corporation 2006 A
nnual Report
15
NYSE:SPA
Information on shares repurchased in the most recently completed quarter ended June 30, 2006, and the approximate dollar value of shares that may yet be repurchased pursuant to our stock repurchase program, is as follows:
Total number of shares Approximate dollar value Total number purchased as of shares that may of shares Average price part of publicly yet be purchased Period purchased paid per share announced programs under the program
April 1-30 - - - $3,730,000 May 1-31 400 $8.39 400 3,727,000 June 1-30 10,400 8.47 10,400 3,637,000 Total 10,800 10,800
In February 2006, Sparton’s Board of Directors approved that all shares previously repurchased, and those subsequently acquired pursuant to our stock repurchase program, be retired.

Sparton Corporation 2006 A
nnual Report
16
NYSE:SPA
Item 6. Selected Financial Data (1)
The following table sets forth a summary of selected financial data for the last five years. This selected financial data should be read in conjunction with the consolidated financial statements and notes thereto included in Item 8 of this Form 10-K.
2006 2005 2004 2003 2002 OPERATING RESULTSNet sales $170,804,982 $167,156,809 $161,003,942 $169,861,287. $149,672,143Costs of goods sold 156,752,961 149,048,308 151,642,234 150,659,969 132,273,801Other operating expenses 15,969,528 7,844,236 13,669,067 7,866,686 13,373,770 Operating income (loss) (1,917,507) 10,264,265 (4,307,359) 11,334,632 4,024,572
Other income 1,622,863 1,097,893 126,862 898,640 43,632
Income (loss) before income taxes (294,644) 11,362,158 (4,180,497) 12,233,272 4,068,204Provision (credit) for income taxes (393,000) 3,250,000 (2,137,000) 3,241,000 1,140,000 Net income (loss) $ 98,356 $ 8,112,158 $ (2,043,497) $ 8,992,272. $ 2,928,204
WEIGHTED-AVERAGE COMMON SHARES OUTSTANDING (1)
Common stock - basic 9,339,142 9,229,841 9,200,746 9,194,463 9,194,210Common stock - diluted 9,375,810 9,355,585 9,200,746 9,292,362 9,255,691
PER SHARE OF COMMON STOCK - INCOME (LOSS) (2)
Common stock - basic $0.01 $0.88 $(0.22) $0.98 $0.32Common stock - diluted 0.01 0.87 (0.22) 0.97 0.32
SHAREOWNERS’ EQUITY - PER SHARE $10.31 $10.48 $9.65 $9.91 $8.88
CASH DIVIDENDS - PER SHARE (3) $0.10 - - - -.
OTHER FINANCIAL DATATotal assets $150,057,736 $129,460,786 $114,419,496 $116,013,870 $102,401,248Working capital 68,197,123 75,502,554 72,347,305 77,982,082 70,710,441Working capital ratio. 3.17:1 3.89:1 4.81:1 5.33:1. 6.27:1Debt 19,826,449 - - - -.Shareowners’ equity $96,850,378 $97,171,986 $88,866,099 $91,168,206 $81,614,417
The operating results of our recently acquired subsidiary, Astro, have been included in our consolidated financial statements since the date of acquisition on May 31, 2006. Presented separately below are Astro’s operating results for the month of June, 2006:
ASTRO INSTRUMENTATION, INC. FOR THE ONE MONTH ENDED JUNE 30, 2006 OPERATING RESULTSNet sales $3,358,398Costs of goods sold 2,901,835Other operating expenses 264,193 Operating income 192,370
Other expense (98,088)
Income before income taxes 94,282Provision (credit) for income taxes (3,262) Net income $ 97,544
(1) As discussed in Note 1 to the Consolidated Financial Statements included in Item 8, all average outstanding shares and per share information has been restated to reflect the impact of the 5% stock dividend declared in October 2005.
(2) As a result of the adoption in fiscal 2006 of SFAS No. 123(R), Share-Based Payment, stock option expense impacted 2006 results by $0.04 per share for both basic and diluted.
(3) The Company has not declared or paid any cash dividends on our common stock for many years prior to fiscal 2006. The Board of Directors will review the Company’s financial results and condition at least annually and consider payment of a cash dividend at that time.

Sparton Corporation 2006 A
nnual Report
17
NYSE:SPA
Item 7. Management’s Discussion and Analysis of Financial Condition and Results of Operations
The following is management’s discussion and analysis of certain significant events affecting the Company’s earnings and financial condition during the periods included in the accompanying financial statements. Additional information regarding the Company can be accessed via Sparton’s website at www.sparton.com. Information provided at the website includes, among other items, the Annual Report on Form 10-K, Quarterly Reports on Form 10-Q, Quarterly Earnings Releases, News Releases, and the Code of Ethics, as well as various corporate charters. The Company’s operations are in one line of busi-ness, electronic manufacturing services (EMS). Sparton’s capabilities range from product design and development through aftermarket support, specializing in total business solutions for government, medical/scientific instrumentation, aerospace and industrial markets. This includes the design, development and/or manufacture of electronic parts and assemblies for both government and commercial customers worldwide. Governmental sales are mainly sonobuoys.
The Private Securities Litigation Reform Act of 1995 reflects Congress’ determination that the disclosure of forward-look-ing information is desirable for investors and encourages such disclosure by providing a safe harbor for forward-looking statements by corporate management. This report on Form 10-K contains forward-looking statements within the scope of the Securities Act of 1933 and the Securities Exchange Act of 1934. The words “expects,” “anticipates,” “believes,” “intends,” “plans,” “will,” “shall,” and similar expressions, and the negatives of such expressions, are intended to identify forward-looking statements. In addition, any statements which refer to expectations, projections or other characterizations of future events or circumstances are forward-looking statements. The Company undertakes no obligation to publicly dis-close any revisions to these forward-looking statements to reflect events or circumstances occurring subsequent to filing this Form 10-K with the Securities and Exchange Commission (SEC). These forward-looking statements are subject to risks and uncertainties, including, without limitation, those discussed below. Accordingly, Sparton’s future results may differ materially from historical results or from those discussed or implied by these forward-looking statements. The Company notes that a variety of factors could cause the actual results and experience to differ materially from anticipated results or other expectations expressed in the Company’s forward-looking statements.
Sparton, as a high-mix, low to medium-volume supplier, provides rapid product turnaround for customers. High-mix de-scribes customers needing multiple product types with generally low volume manufacturing runs. As a contract manufacturer with customers in a variety of markets, the Company has substantially less visibility of end user demand and, therefore, forecasting sales can be problematic. Customers may cancel their orders, change production quantities and/or reschedule production for a number of reasons. Depressed economic conditions may result in customers delaying delivery of product, or the placement of purchase orders for lower volumes than previously anticipated. Unplanned cancellations, reductions, or delays by customers may negatively impact the Company’s results of operations. As many of the Company’s costs and operating expenses are relatively fixed within given ranges of production, a reduction in customer demand can dispropor-tionately affect the Company’s gross margins and operating income. The majority of the Company’s sales have historically come from a limited number of customers. Significant reductions in sales to, or a loss of, one of these customers could materially impact business if the Company were not able to replace those sales with new business.
Other risks and uncertainties that may affect operations, performance, growth forecasts and business results include, but are not limited to, timing and fluctuations in U.S. and/or world economies, competition in the overall EMS business, avail-ability of production labor and management services under terms acceptable to the Company, Congressional budget outlays for sonobuoy development and production, Congressional legislation, foreign currency exchange rate risk, uncertainties associated with the costs and benefits of new facilities, including the plant in Vietnam and the Company’s newest subsid-iary Astro Instrumentation, Inc., and the closing of others, uncertainties associated with the outcome of litigation, changes in the interpretation of environmental laws and the uncertainties of environmental remediation, and uncertainties related to defects discovered in certain of the Company’s aerospace circuit boards. Further risk factors are the availability and cost of materials. A number of events can impact these risks and uncertainties, including potential escalating utility and other related costs due to natural disasters, as well as political uncertainties such as the conflict in Iraq. The Company has encountered availability and extended lead time issues on some electronic components in the past when market demand has been strong; this resulted in higher prices and late deliveries. Additionally, the timing of sonobuoy sales to the U.S. Navy is dependent upon access to the test range and successful passage of product tests performed by the U.S. Navy. Reduced governmental budgets have made access to the test range less predictable and less frequent than in the past. Finally, the Sarbanes-Oxley Act of 2002 required changes in, and formalization of, some of the Company’s corporate governance and compliance practices. The SEC and New York Stock Exchange (NYSE) also passed rules and regulations requiring addi-tional compliance activities. Compliance with these rules has increased administrative costs, and it is expected that certain of these costs will continue indefinitely. A further discussion of the Company’s risk factors has been included in Part I, Item 1(a), Risk Factors of this report. Management cautions readers not to place undue reliance on forward-looking statements, which are subject to influence by the enumerated risk factors as well as unanticipated future events.

Sparton Corporation 2006 A
nnual Report
18
NYSE:SPA
The following discussion should be read in conjunction with the Consolidated Financial Statements and Notes thereto included in Item 8 of this report.
FISCAL 2006 COMPARED TO FISCAL 2005
2006 2005 Sales % of Total Sales % of Total % Change
Government $ 42,536,000 25% $ 38,243,000 23% 11% Industrial/Other 57,602,000 34 47,588,000 28 21 Aerospace 52,794,000 31 68,375,000 41 (23) Medical/Scientific Instrumentation 17,873,000 10 12,951,000 8 38 Totals $170,805,000 100% $167,157,000 100% 2%
Sales for the year ended June 30, 2006, totaled $170,805,000 an increase of $3,648,000 (2%) from fiscal 2005. Govern-ment sales increased $4,293,000, primarily due to increased availability and access to the sonobuoy test range and accepted lots. Industrial sales, which includes gaming, improved significantly. This is reflective of continued strong sales to existing customers. Sales in the aerospace market decreased 23%, due principally to experiencing strong sales of collision avoid-ance systems in fiscal 2005, which level of sales were not expected to continue into fiscal 2006. We expect aerospace sales to expand in fiscal 2007. Medical sales improved from the prior year, primarily due to new program start-ups. In addition, the Company’s new acquisition, Astro, operates principally in the medical market. We expect sales in the medical market to expand. Total medical sales of $17,873,000 include $3,280,000 of sales contributed by Astro since acquisition, which occurred on May 31, 2006.
The majority of the Company’s sales come from a small number of customers. Sales to our six largest customers, includ-ing government sales, accounted for approximately 77% of net sales in both fiscal 2006 and 2005. Four of the customers, including government, were the same both years. One customer accounted for 20% and 13% of our sales in fiscal 2006 and 2005, respectively. Additionally, one other customer, with several facilities, provided 19% and 28% of our sales for the years ended June 30, 2006 and 2005, respectively.
The following table presents consolidated income statement data as a percentage of net sales for the years ended June 30, 2006 and 2005, respectively.
2006 2005
Net sales 100.0% 100.0% Costs of goods sold 91.8 89.2
Gross profit 8.2 10.8
Selling and administrative 9.2 7.9 EPA related (income) expense - net environmental remediation - (3.0) Net (gain) loss on sale of property, plant and equipment 0.1 (0.2)
Operating income (loss) (1.1) 6.1
Interest and investment income 0.6 0.5 Interest expense - - Equity income (loss) in investment - - Other income (expense) - net 0.3 0.2
Income (loss) before income taxes (0.2) 6.8 Provision (credit) for income taxes (0.3) 1.9 Net income 0.1% 4.9%
An operating loss of $1,918,000 was reported for the fiscal year ended June 30, 2006, compared to operating income of $10,264,000 for the fiscal year ended June 30, 2005. The results of Astro for the one month period ended June 30, 2006, did not have a significant impact on the Company’s fiscal 2006 results other than disclosed. The gross profit percentage for

Sparton Corporation 2006 A
nnual Report
19
NYSE:SPA
the year ended June 30, 2006, was 8.2%, down from 10.8% for the same period last year. Gross profit varies from period to period and can be affected by a number of factors, including product mix, production efficiencies, capacity utilization, and new product introduction, all of which impacted fiscal 2006 performance. Reflected in gross profit for the year ended June 30, 2006, were charges of $1,789,000 resulting from changes in estimates, primarily related to certain sonobuoy programs. Of these charges, $903,000 were incurred in the fourth quarter. These programs are now expected to be loss contracts and the Company recognized the entire estimated losses as of June 30, 2006. While some of these programs were completed and shipped by June 30 of this fiscal year, there is a backlog of $5.5 million which will be completed and shipped during fiscal 2007. These $5.5 million of sales will reflect no profit margin upon their sale due to their loss position. Included for the twelve months ended June 30, 2006, are the results from the Company’s new Vietnam facility, the start-up of which adversely impacted gross profit by $1.6 million. A number of new programs are scheduled to commence in Vietnam dur-ing the summer months of 2006. In addition, the prior year’s gross profit benefited by the inclusion of delayed government sales of $4.7 million. These sales carried a higher than usual margin, contributing $1.7 million in the first quarter of fiscal 2005, which sales the Company was unable to match in fiscal 2006. The current year’s reduced gross profit also includes several medical programs, which are operating in a loss or breakeven position due to their current status in the start-up phase. Two of these programs had negative margins which, for the year ended June 30, 2006, totaled $585,000, $269,000 of which occurred during the fourth quarter. The issues related to these losses are being addressed. Finally, discussions and resolution with a customer regarding the recovery of past material component costs, $183,000 of which were previously deferred in fiscal 2005, were not completed during the period and as a result, $378,000 was charged to expense during the year ended June 30, 2006. The Company is continuing its efforts to resolve this issue with the customer and fully recover these costs.
Selling and administrative expenses in fiscal 2006 included approximately $524,000 of litigation expenses related to the NRTC litigation, which is further discussed in Part II, Item 1 - “Other Information-Legal Proceedings” of this report. In ad-dition, beginning in fiscal 2006, the Company was required to expense the vested portion of the fair value of stock options. Share-based compensation expense recorded for the year ended June 30, 2006, totaled $344,000, approximately 84% of which, or $290,000, is included in selling and administrative expense. Additional costs are also being incurred as a result of compliance activity due to increased SEC and other regulatory requirements. These compliance costs have increased in several areas, both internally and externally. In addition to increased audit fees and other costs, the Company has out-sourced some of the new compliance efforts to a consulting firm, resulting in additional costs of $272,000 during the year ended June 30, 2006. The remainder of the increase in selling and administrative expenses relates to minor and expected increases in various categories, such as wages, employee benefits, insurance, and other items.
Operating income also includes charges related to the New Mexico environmental remediation effort, principally legal fees, of $65,000 in fiscal 2006 and $424,000 in fiscal 2005. In addition, fiscal 2005 includes $5,455,000 (pre-tax) of income related to the Company’s settlement with previous insurance carriers, which reflects a recovery of a portion of past costs the Company incurred in its investigation and site remediation of its Coors Road facility. These EPA charges and income are more fully discussed in Note 10 to the Consolidated Financial Statements included in Item 8. Net gain on sale of property, plant and equipment in fiscal 2005 included a gain of $397,000 on the sale of a warehouse in DeLeon Springs, Florida.
Interest and investment income increased $225,000 to $1,116,000 in fiscal 2006. This increase was due to increased funds available for investment during the year and improved investment rates. Investment securities are more fully described in Note 3 to the Consolidated Financial Statements included in Item 8. Interest expense of $98,000 in fiscal 2006 is a result of the debt incurred and acquired in the acquisition of Astro. A complete discussion of debt is contained in Note 9 to the Consolidated Financial Statements included in Item 8. Other income (expense) - net was $583,000 and $221,000 in fis-cal 2006 and 2005, respectively. Other-net in fiscal 2006 and 2005 includes $586,000 and $228,000, respectively, of net translation and transaction gains.
Equity investment income (loss) was $21,000 and ($15,000) in fiscal 2006 and 2005, respectively. Included in the equity investments is the Company’s investment in Cybernet Systems Corporation (Cybernet), representing a 14% ownership interest.
The Company’s effective tax rate (benefit) for fiscal 2006 was (133%) compared to the statutory U.S. federal tax rate of 34%. A complete discussion of the elements of the tax provision is contained in Note 7 to the Consolidated Financial State-ments included in Item 8.
After provision for applicable income taxes the Company reported net income of $98,000 ($0.01 per share, basic and diluted) in fiscal 2006, compared to net income of $8,112,000 ($0.88 per share; $0.87 diluted) in fiscal 2005. Fiscal 2005 results include income of $5,455,000 related to the EPA settlement (approximately $3,895,000 net of tax).

Sparton Corporation 2006 A
nnual Report
20
NYSE:SPA
FISCAL 2005 COMPARED TO FISCAL 2004
2005 2004 Sales % of Total Sales % of Total % Change Government $ 38,243,000 23% $ 44,808,000 28% (15)% Industrial/Other 47,588,000 28 39,856,000 25 19 Aerospace 68,375,000 41 58,403,000 36 17 Medical/Scientific Instrumentation 12,951,000 8 17,937,000 11 (28) Totals $167,157,000 100% $161,004,000 100% 4%
Sales for the year ended June 30, 2005, totaled $167,157,000, an increase of $6,153,000 (4%) from fiscal 2004. Govern-ment sales decreased, and included $4.7 million of a delayed sonobuoy sale originally anticipated to ship in fiscal 2004. Rescheduling of engineering redesign work, failed sonobuoy drop tests, and lack of access to the U.S. Navy’s test site contributed to the depressed government sales. Industrial and other market sales, which include gaming sales, increased from the same period last year. This increase was attributed to increased demand from two existing customers. Sales to the aerospace markets continued to grow, increasing 17% over the prior year. In general, this reflected stronger demand in the commercial aerospace market, primarily increased demand for products related to aircraft collision avoidance systems mandated for installation in all commercial aircraft. Approximately $2 million of the aerospace increase was attributable to increased orders from one customer, to which the Company supplies product to several separate manufacturing facilities. Medical/Scientific Instrumentation sales declined from the prior year. This decrease resulted from overall lower demand from existing customers in this market area, as well as new program delays.
Sales to our six largest customers, including government sales, accounted for approximately 77% and 74% of net sales in fiscal 2005 and 2004, respectively. Five of the customers, including government, were the same both years. One of these customers, with six separate facilities as discussed above, provided 28% and 25% of the sales for the years ended June 30, 2005 and 2004, respectively.
The following table presents consolidated income statement data as a percentage of net sales for the years ended June 30, 2005 and 2004, respectively.
2005 2004
Net sales 100.0% 100.0% Costs of goods sold 89.2 94.2
Gross profit 10.8 5.8
Selling and administrative 7.9 8.8 EPA related (income) expense - net environmental remediation (3.0) 0.2 Net gain on sale of property, plant and equipment (0.2) (0.5)
Operating income (loss) 6.1 (2.7)
Interest and investment income 0.5 0.4 Equity income (loss) in investment - - Other income (expense) - net 0.2 (0.3)
Income (loss) before income taxes 6.8 (2.6) Provision (credit) for income taxes 1.9 (1.3) Net income (loss) 4.9% (1.3)%
Operating income of $10,264,000 was reported for the fiscal year ended June 30, 2005, compared to a loss of $4,307,000 for the fiscal year ended June 30, 2004. Gross profit percentage for the year was 10.8%, up from 5.8% in the prior year. Results for fiscal 2005 were impacted by severe tropical storms in Florida during the period. While the tropical storms largely bypassed the Company’s two Florida facilities, extensive preparations were undertaken for the predicted storms. This unexpected activity, along with the minor damage that was experienced and unproductive wages, resulted in costs of

Sparton Corporation 2006 A
nnual Report
21
NYSE:SPA
approximately $500,000 being charged in the first quarter of fiscal 2005, the majority of which were included in cost of goods sold. Fiscal 2005’s gross profit also included a settlement with a customer in the second quarter of fiscal 2005, which resulted in the Company’s recovery of $500,000 of prior period start-up expenses. Fiscal 2004’s depressed margin reflects the inclusion of costs on the start-up phase of several major programs, as well as final charges incurred at the completion of one sonobuoy contract that had experienced technical problems. In addition, fiscal 2004’s margin included a redesign effort on an existing product line, which resulted in a charge to operations of $519,000. Gross margin was further reduced in 2005 and 2004 by charges of $609,000 and $1,021,000, respectively, for obsolete inventory at two locations. The Com-pany continued to experience underutilized capacity which, due to the fixed nature of many of the Company’s costs, con-tinued to negatively impact margins. Finally, pension costs decreased $247,000, to $480,000 in fiscal 2005 from $727,000 in fiscal 2004. This decrease in pension costs was due to an increase in the expected return on pension assets and reduced amortization costs related to unrecognized actuarial losses. The majority of pension costs are charged to cost of goods sold. Spartronics Vietnam officially began operations in May 2005. Included in fiscal 2005 results were the operations from the Company’s new Vietnam facility, which startup adversely impacted gross margin by $1,600,000.
The lowered selling and administrative expenses were primarily the result of decreased bid and proposal and research and development expenses for fiscal 2005, which were approximately $2 million below prior year. These cost reductions were not indicative of reduced bid and proposal activity, but primarily the result of a one time sonobuoy engineering project in fiscal 2004 which has been completed.
Operating income also includes charges related to the New Mexico environmental remediation effort, principally legal fees, of $424,000 in fiscal 2005 and $321,000 in fiscal 2004. In addition, fiscal 2005 includes $5,455,000 (pre-tax) of income related to the Company’s settlement with previous insurance carriers, which reflected a recovery of a portion of past costs the Company incurred in its investigation and site remediation of its Coors Road facility. EPA charges and income are more fully discussed in Note 10 to the Consolidated Financial Statements included in Item 8. Net gain on sale of property, plant and equipment in fiscal 2005 includes a gain of $397,000 on the sale of a warehouse in DeLeon Springs, Florida. Fiscal 2004 includes a gain of $844,000 related to the disposal of the Rio Rancho plant, which was replaced by the current Albuquerque, New Mexico facility.
In the fourth quarter of fiscal 2005, the Company also settled negotiations with a Canadian customer for past costs and inventory. This settlement resulted in the receipt of approximately $1 million cash, with a loss recognized of approximately $347,000. Most of this inventory had previously been carried as a long-term asset in the Company’s balance sheet.
Interest and investment income increased $175,000 to $892,000 in fiscal 2005. This increase was due to increased funds available for investment and improved investment rates. Investment securities are more fully described in Note 3 to the Consolidated Financial Statements included in Item 8. Other income (expense) - net was $221,000 and $(604,000) in fiscal 2005 and 2004, respectively. Other-net in fiscal 2004 includes $598,000 of costs related to an insurance adjustment for the Company’s previously owned automotive segment. These charges were for a previously disputed claim, which has been settled. Other-net in fiscal 2005 and 2004 includes $228,000 and $5,000, respectively, of net translation and transaction gains.
Equity investment loss was $15,000 in fiscal 2005, compared to income of $14,000 in fiscal 2004. Included in the equity investments is the Company’s investment in Cybernet Systems Corporation (Cybernet), representing a 14% ownership interest, which was acquired in June 1999.
The Company’s effective tax rate for fiscal 2005 was 29%, compared to the statutory U.S. federal tax rate of 34%. A complete discussion of the elements of the tax provision is contained in Note 7 to the Consolidated Financial Statements included in Item 8. After provision for applicable income taxes, the Company reported a net profit of $8,112,000 ($0.88 per share; $0.87 diluted) in fiscal 2005, compared to a net loss of $2,043,000 ($(0.22) per share; basic and diluted) in fiscal 2004.

Sparton Corporation 2006 A
nnual Report
22
NYSE:SPA
LIQUIDITY AND CAPITAL RESOURCES
The primary source of liquidity and capital resources has historically been generated from operations. Certain government contracts provide for interim progress billings based on costs incurred. These progress billings reduce the amount of cash that would otherwise be required during the performance of these contracts. As the volume of U.S. defense-related contract work has declined over the past several years, so has the relative importance of progress billings as a liquidity resource. At the present time, the Company plans on using its investment securities to provide working capital, invest in additional property, plant and equipment, and to strategically accommodate growth. Growth is expected to be achieved through in-ternal expansion and/or acquisition or joint venture. In addition, the Company’s previously announced $4,000,000 stock repurchase program is expected to utilize a portion of the Company’s investments. Through June 30, 2006, approximately 39,000 shares, at a cost of approximately $363,000, have been repurchased. These repurchased shares have been retired.
For the fiscal year ended June 30, 2006, cash and cash equivalents decreased $1,865,000 to $7,503,000. Operating activi-ties provided $7,992,000, $6,547,000 and $1,028,000 in fiscal 2006, 2005 and 2004, respectively, in net cash flows. The primary source of cash in fiscal 2006 resulted from the receipt of $5,455,000 in cash from a legal settlement, which oc-curred in fiscal 2005. Additionally, collection of receivables, reflective of the high amount of sales in June of fiscal 2005, also contributed to cashflow. The primary use of cash in fiscal 2006 was a net settlement in accounts payable and accrued liabilities. The change in this area between fiscal 2006 and 2005 is primarily due to the payment of $2.4 million in income taxes payable from fiscal 2005, as well as payment for the increase in inventory and other liabilities recorded at June 30, 2005. The primary source of cash in 2005 was from operations, after reduction for the non-cash income related to a legal settlement, plus the increase in accounts payable and other accruals. Partially offsetting this was an increase in accounts receivable reflecting higher government sales in June 2005. The legal settlement resulted in the Company’s recognition of $5,455,000 of income, the receipt of which occurred in July 2005. The primary source of cash in fiscal 2004, which reflected a net loss, was from collection of accounts receivable. The fiscal 2004 decrease in accounts receivable was reflec-tive of the receipt of payments for the large volume of sales recognized in June 2003. The change in cash flow related to inventory and prepaid expenses between fiscal 2005 and 2004 was reflective of a large increase at June 30, 2004 of inven-tory due to delayed customer delivery schedules, as well as increased inventory for new customer contracts. Inventory levels at June 30, 2005, reflected a decline, as these customers’ schedules were no longer delayed, as well as the start of several new customer contracts. In fiscal 2005, the increase in accounts payable and accrued liabilities was primarily due to income taxes payable. In fiscal 2004, the Company, due to its loss position, recorded an income tax receivable. Fiscal 2005 cash flow from operations also includes an “other” net reduction of $1,185,000 including two separate transactions. The first, reflecting a reduction in operating cash flow, relates to a claim for an amount due of $2,884,000 in fiscal 2006, an increase of $487,000 from fiscal 2005, from a vendor for defective circuit boards supplied to us, the resolution of which the Company is currently pursuing with the board’s manufacturer. This amount, reflecting prior accounts receivable and inventory and associated expenses, is included in other long-term assets. The second, reflecting an increase in operating cash flow, includes a $1,212,000 settlement and collection from a customer for past costs and inventory which, due to the age of the claim, had been included in other long-term assets.
Cash flows used by investing activities totaled $19,304,000, $8,300,000 and $808,000 in fiscal 2006, 2005 and 2004, re-spectively. Cash was primarily used for the purchase of Astro, as well as the purchase of property, plant and equipment, which is discussed below. Included in the Company’s balance sheet as of June 30, 2006, is construction in progress of approximately $300,000 towards the construction of Astro’s new 20,000 square foot addition. Total cost for this expanded production space is anticipated to be $1.7 million. The purchase of, and proceeds from the sale and maturities of, invest-ment securities are generally reflective of activity within the various investment options, with the net purchases position representing the investment of excess cash generated from operations in fiscal 2005. In fiscal 2006, net proceeds from the sale and maturities of investments were also used to fund the Astro acquisition. In fiscal 2005 and 2004, net proceeds from the sale and maturities of investments were also used to fund purchases of property, plant and equipment.
Cash flows provided by financing activities were $9,447,000, $300,000, and $39,000 in fiscal 2006, 2005 and 2004, respec-tively, primarily in fiscal 2006 from the issuance of debt related to the acquisition of Astro, and reflecting in all three fiscal years presented the exercise of stock options. Cash flows used by financing activity in fiscal 2006 were primarily from the repurchase of Company stock and the payment of a $0.10 per share cash dividend which is further discussed below.
Historically, the Company’s market risk exposure to foreign currency exchange and interest rates on third party receivables and payables has not been considered to be material, principally due to their short-term nature and the minimal amount of receivables and payables designated in foreign currency. However, due to the strengthened Canadian dollar, the impact of transaction and translation gains on intercompany activity and balances has increased. If the exchange rate were to ma-terially change, the Company’s financial position could be significantly affected. The Company currently has an unused formal line of credit totaling $20 million and a bank loan totaling $10 million. In addition, there are notes payable totaling $7.5 million outstanding to the former owners of Astro. These borrowings are discussed below.

Sparton Corporation 2006 A
nnual Report
23
NYSE:SPA
At June 30, 2006 and 2005, the aggregate government funded EMS backlog was approximately $41 million and $42 mil-lion, respectively. A majority of the June 30, 2006, backlog is expected to be realized in the next 12-15 months. Com-mercial EMS orders are not included in the backlog. The Company does not believe the amount of commercial activity covered by firm purchase orders is a meaningful measure of future sales, as such orders may be rescheduled or cancelled without significant penalty.
The Company signed a membership purchase agreement and completed the acquisition of Astro on May 31, 2006. Astro’s sales volume for the year ended December 31, 2005, was approximately $34 million. The purchase price was approximate-ly $26.15 million, plus the extinguishment by Sparton at closing of $4.2 million in seller credit facilities and the assumption of $2.3 million in bonded debt. The purchase price was funded using a combination of cash, $10 million in bank debt, and $7.5 million in notes payable to Astro’s previous owners (sellers). Additional contingent consideration may be paid to the sellers over the four years based on 20% of Astro’s earnings before interest, depreciation, and taxes as defined, and if paid will be added to goodwill. Under the terms of the purchase agreement, the prior owners entered into non-competition agreements with the Company. Astro is an EMS provider that designs and manufactures a variety of specialized medical products, generally involving high-quality medical laboratory test equipment. Astro operates from a 40,000 square foot facility in an industrial park. A 20,000 square foot addition to the facility is now under construction. Sparton now operates the business as a wholly-owned subsidiary at its present location and with the current operating management and staff. A further discussion of the Astro purchase is contained in Notes 9 and 13 to the Consolidated Financial Statements included in Item 8. The Company is continuing a program of identifying and evaluating potential acquisition candidates in both the defense and medical markets.
Construction of the Company’s Spartronics’ plant in Vietnam was completed and production began in May 2005. This facility is anticipated to provide increased growth opportunities for the Company, in current as well as new markets. As the Company has not previously done business in this emerging market, there are many uncertainties and risks inherent in this venture. To date, the Company’s total investment approximates $6 million, which includes land, building, and initial operating expenses, with approximately $3 million having been expended for the construction of the new facility, primar-ily in fiscal 2005. As with the Company’s other facilities, the majority of the equipment utilized in production operations is leased.
The Company purchased a manufacturing facility in Albuquerque, New Mexico in December 2003 for approximately $4.5 million. This facility replaced an existing plant in Rio Rancho, New Mexico. The costs of remodeling and facility upgrades approximated $2 million and were incurred, primarily in 2005, as the Company transitioned between facilities. The Rio Rancho plant was sold in June 2004 for approximately $1.7 million ($1.6 million after expenses related to the sale), resulting in a $844,000 gain. The Company leased the Rio Rancho facility until the transition to the new facility was completed in December 2004. The new facility provides a much more efficient manufacturing space.
In the first quarter of fiscal 2006, a $0.10 per share cash dividend, totaling approximately $889,000, was paid to shareowners on October 5, 2005. Subsequently in October 2005, the Company declared a 5% stock dividend. This dividend was distrib-uted January 13, 2006, to shareowners of record on December 21, 2005. At June 30, 2006, the Company had $96,850,000 in shareowners’ equity ($10.31 per share), $68,197,000 in working capital, and a 3.17:1.00 working capital ratio. The Company believes it has sufficient liquidity for its anticipated needs over the next 12-18 months, unless an additional sig-nificant business acquisition were to be identified and completed for cash.
CONTRACTUAL OBLIGATIONS
The Company’s current obligations, which are due within twelve months, for the payment of accounts payable, accruals, and other liabilities totaled $31,401,000 at June 30, 2006, and includes the $3,816,000 and $491,000, respectively, for the current portions of our long-term debt and environmental liability, respectively, and $505,000 of the standby letters of credit. These obligations are reflected in the Consolidated Balance Sheets in Item 8. The following tables summarize the Company’s significant contractual obligations and other commercial commitments as of June 30, 2006:
Payments due by Fiscal PeriodContractual Obligations: Total 2007 2008 2009 2010 2011 ThereafterLong-term debt, including interest payments $23,884,000 $ 4,925,000 $4,814,000 $4,688,000 $4,559,000 $2,321,000 $2,577,000Operating leases 11,766,000 4,380,000 3,577,000 2,515,000 1,039,000 255,000 -Environmental liabilities 6,287,000 491,000 281,000 316,000 281,000 281,000 4,637,000Noncancelable purchase orders 15,246,000 15,246,000 - - - - - Total $57,183,000 $25,042,000 $8,672,000 $7,519,000 $5,879,000 $2,857,000 $7,214,000

Sparton Corporation 2006 A
nnual Report
24
NYSE:SPA
Amount of Commitment by Fiscal Expiration PeriodOther Commercial Commitments: Total 2007 2008 2009 2010 2011 ThereafterStandby letters of credit $990,000 $657,000 $333,000 - - - -
Long-term debt - Payments include principal and interest for both short-term and long-term debt, including a $10 million bank loan, notes totaling $7.5 million payable to the previous owners of Astro, and Industrial Revenue bond obligations, which were assumed by Sparton at the time of purchase. See Note 9 to the consolidated financial statements included in Item 8 of this report for further discussion on borrowings.
Operating leases - See Note 8 to the Consolidated Financial Statements included in Item 8 of this report for further discus-sion of operating leases.
Environmental liabilities - See Note 10 to the Consolidated Financial Statements included in Item 8 of this report for a description of the accrual for environmental remediation. Of the $6,287,000 total accrued, $491,000 is classified as a cur-rent liability and $5,796,000 is classified as a long-term liability, both of which are included on the balance sheet as of June 30, 2006.
Noncancelable purchase orders - Binding orders the Company has placed with suppliers that are subject to quality and performance requirements.
Standby letters of credit - The Company has standby letters of credit outstanding of approximately $990,000 at June 30, 2006, principally to support self-insured programs, certain foreign sales contracts, and a portion of the Industrial Revenue bonds assumed from Astro. Approximately $505,000 of the potential liabilities related to these letters of credit are reflected as accrued liabilities on the Company’s June 30, 2006 balance sheet.
CRITICAL ACCOUNTING POLICIES AND ESTIMATES
The preparation of our consolidated financial statements in conformity with accounting principles generally accepted in the United States of America (GAAP) requires management to make estimates, judgments and assumptions that affect the amounts reported as assets, liabilities, revenues and expenses, and related disclosure of contingent assets and liabilities. Estimates are regularly evaluated and are based on historical experience and on various other assumptions believed to be reasonable under the circumstances. Actual results could differ from those estimates. In many cases, the accounting treat-ment of a particular transaction is specifically dictated by GAAP and does not require management’s judgment in applica-tion. There are also areas in which management’s judgment in selecting among available alternatives would not produce a materially different result. The Company believes that of its significant accounting policies as discussed in Note 1 included to the Consolidated Financial Statements, which is included in Item 8, the following involve a higher degree of judgement and complexity. Senior management has reviewed these critical accounting policies and related disclosures with Sparton’s audit committee of the Board of Directors.
Environmental Contingencies
One of Sparton’s former manufacturing facilities, located in Albuquerque, New Mexico (Coors Road), has been the subject of ongoing investigations and remediation efforts conducted with the Environmental Protection Agency (EPA) under the Resource Conservation and Recovery Act (RCRA). As discussed in Note 10 to the Consolidated Financial Statements included in Item 8, Sparton has accrued its estimate of the minimum future non-discounted financial liability. The estimate was developed using existing technology and excludes legal and related consulting costs. The minimum cost estimate includes equipment, operating and monitoring costs for both onsite and offsite remediation. Sparton recognizes legal and consulting services in the periods incurred and reviews its EPA accrual activity quarterly. Uncertainties associated with environmental remediation contingencies are pervasive and often result in wide ranges of reasonably possible outcomes. It is possible that cash flows and results of operations could be materially affected by the impact of changes in these estimates.
Government Contract Cost Estimates
Government production contracts are accounted for based on completed units accepted with respect to revenue recognition and their estimated average cost per unit regarding costs. Losses for the entire amount of the contract are recognized in the period when such losses are determinable. Significant judgment is exercised in determining estimated total contract costs including, but not limited to, cost experience to date, estimated length of time to contract completion, costs for materials, production labor and support services to be expended, and known issues on remaining units to be completed. In addition, estimated total contract costs can be significantly affected by changing test routines and procedures, resulting

Sparton Corporation 2006 A
nnual Report
25
NYSE:SPA
design modifications and production rework from these changing test routines and procedures, and limited range access for testing these design modifications and rework solutions. Estimated costs developed in the early stages of contracts can change, sometimes significantly, as the contracts progress, and events and activities take place. Changes in estimates can also occur when new designs are initially placed into production. The Company formally reviews its costs incurred-to-date and estimated costs to complete on all significant contracts at least quarterly and revised estimated total contract costs are reflected in the financial statements. Depending upon the circumstances, it is possible that the Company’s financial position, results of operations and cash flows could be materially affected by changes in estimated costs to complete on one or more significant contracts.
Commercial Inventory Valuation Allowances
Inventory valuation allowances for commercial customer inventories require a significant degree of judgment and are influenced by the Company’s experience to date with both customers and other markets, prevailing market conditions for raw materials, contractual terms and customers’ ability to satisfy these obligations, environmental or technological materials obsolescence, changes in demand for customer products, and other factors resulting in acquiring materials in excess of customer product demand. Contracts with some commercial customers may be based upon estimated quantities of product manufactured for shipment over estimated time periods. Raw material inventories are purchased to fulfill these customer requirements. Within these arrangements, customer demand for products frequently changes, sometimes creating excess and obsolete inventories.
The Company regularly reviews raw material inventories by customer for both excess and obsolete quantities, with adjustments made accordingly. Wherever possible, the Company attempts to recover its full cost of excess and obsolete inventories from customers or, in some cases, through other markets. When it is determined that the Company’s carrying cost of such excess and obsolete inventories cannot be recovered in full, a charge is taken against income and a valuation allowance is established for the difference between the carrying cost and the estimated realizable amount. Conversely, should the disposition of adjusted excess and obsolete inventories result in recoveries in excess of these reduced carrying values, the remaining portion of the valuation allowances are reversed and taken into income when such determinations are made. It is possible that the Company’s financial position, results of operations and cash flows could be materially affected by changes to inventory valuation allowances for commercial customer excess and obsolete inventories.
Allowance for Probable Losses on Receivables
The accounts receivable balance is recorded net of allowances for amounts not expected to be collected from customers. The allowance is estimated based on historical experience of write-offs, the level of past due amounts, information known about specific customers with respect to their ability to make payments, and future expectations of conditions that might impact the collectibility of accounts. Accounts receivable are generally due under normal trade terms for the industry. Credit is granted, and credit evaluations are periodically performed, based on a customer’s financial condition and other factors. Although the Company does not generally require collateral, cash in advance or letters of credit may be required from customers in certain circumstances, including some foreign customers. When management determines that it is prob-able that an account will not be collected, it is charged against the allowance for probable losses. The Company reviews the adequacy of its allowance monthly. The allowance for doubtful accounts was $67,000 and $6,000 at June 30, 2006 and 2005, respectively. If the financial condition of customers were to deteriorate, resulting in an impairment of their ability to make payment, additional allowances may be required. Given the Company’s significant balance of government receivables and letters of credit from foreign customers, collection risk is considered minimal. Historically, uncollectible accounts have generally been insignificant and the minimal allowance is deemed adequate.
Pension Obligations
The Company calculates the cost of providing pension benefits under the provisions of Statement of Financial Accounting Standards (SFAS) No. 87, Employers’ Accounting for Pensions. The key assumptions required within the provisions of SFAS No. 87 are used in making these calculations. The most significant of these assumptions are the discount rate used to value the future obligations and the expected return on pension plan assets. The discount rate is consistent with market interest rates on high-quality, fixed income investments. The expected return on assets is based on long-term returns and assets held by the plan, which is influenced by historical averages. If actual interest rates and returns on plan assets materi-ally differ from the assumptions, future adjustments to the financial statements would be required. While changes in these assumptions can have a significant effect on the pension benefit obligation and the unrecognized gain or loss accounts dis-closed in the Notes to the Financial Statements, the effect of changes in these assumptions is not expected to have the same relative effect on net periodic pension expense in the near term. While these assumptions may change in the future based on changes in long-term interest rates and market conditions, there are no known expected changes in these assumptions as of June 30, 2006. As indicated above, to the extent the assumptions differ from actual results or if there are changes made to accounting standards for these costs, there would be a future impact on the financial statements. The extent to which this

Sparton Corporation 2006 A
nnual Report
26
NYSE:SPA
will result in future expense is not determinable at this time as it will depend upon a number of variables, including trends in interest rates and the actual return on plan assets. During the quarter ended March 31, 2006, the annual actuarial valuation of the pension plan was completed. Based on this valuation, net periodic pension expense for fiscal 2006 was determined to be $548,000 compared to $480,000 for fiscal 2005. The components of net periodic pension expense are detailed in Note 6 to the Consolidated Financial Statements included in Item 8 of this report. No cash payments are expected to be required prior to 2008 due to the plan’s funded status.
Business Combinations
In accordance with accepted business combination accounting, the Company allocated the purchase price of its recent Astro acquisition to the tangible and intangible assets acquired and liabilities assumed based on their estimated fair values. The Company engaged an independent, third-party appraisal firm to assist management in determining the fair value of certain assets acquired and liabilities assumed. Such valuations require management to make significant estimates, judgments and assumptions, especially with respect to intangible assets.
Management arrived at estimates of fair value based upon assumptions believed to be reasonable. These estimates are based on historical experience and information obtained from the management of the acquired business and are inherently uncertain. Critical estimates in valuing certain of the intangible assets include but are not limited to: future expected dis-counted cash flows from customer relationships and contracts assuming similar product platforms and completed projects; the acquired company’s market position, as well as assumptions about the period of time the acquired customer relationships will continue to generate revenue streams; and attrition and discount rates. Unanticipated events and circumstances may occur which may affect the accuracy or validity of such assumptions, estimates or actual results, particularly with respect to amortization periods assigned to identifiable intangible assets.
Goodwill and Customer Relationships
The Company currently reviews goodwill associated with its Cybernet investment on a regular basis for possible impairment. Additionally, the Company will review goodwill and customer relationships, associated with the recent Astro acquisition, for impairment annually, with the first review anticipated to occur in April 2007. Possible impairment of these assets will also be reviewed should events or changes in circumstances indicate their carrying value may not be recoverable in accor-dance with SFAS No. 142, Goodwill and Other Intangible Assets. The provisions of SFAS No. 142 require that a two-step impairment test be performed on intangible assets. In the first step, the Company compares the fair value of each reporting unit to its carrying value. If the fair value of the reporting unit exceeds the carrying value of the net assets assigned to the unit, goodwill is considered not impaired and the Company is not required to perform further testing. If the carrying value of the net assets assigned to the reporting unit exceeds the fair value of the reporting unit, then management will perform the second step of the impairment test in order to determine the implied fair value of the reporting unit’s goodwill. If the carrying value of a reporting unit’s goodwill exceeds its implied fair value, then the Company would record an impairment loss equal to the difference.
Determining the fair value of any reporting entity is judgmental in nature and involves the use of significant estimates and assumptions. These estimates and assumptions include revenue growth rates, operating margins used to calculate projected future cash flows, risk-adjusted discount rates, future economic and market conditions and, if appropriate, determination of appropriate market comparables. The Company bases its fair value estimates on assumptions believed to be reasonable, but which are unpredictable and inherently uncertain. Actual future results may differ from those estimates. In addition, the Company makes certain judgments and assumptions in allocating shared assets and liabilities to determine the carry-ing values for each of the Company’s reporting units. The most recent annual goodwill impairment analysis related to the Company’s Cybernet investment, which was performed during the fourth quarter of fiscal 2006, did not result in an impairment charge.
OTHER
Litigation
One of Sparton’s facilities, located in Albuquerque, New Mexico, has been the subject of ongoing investigations conducted with the Environmental Protection Agency (EPA) under the Resource Conservation and Recovery Act (RCRA). The inves-tigation began in the early 1980’s and involved a review of onsite and offsite environmental impacts.
At June 30, 2006, Sparton has accrued $6,287,000 as its estimate of the future undiscounted minimum financial liability with respect to this matter. The Company’s cost estimate is based upon existing technology and excludes legal and related consulting costs, which are expensed as incurred, and is anticipated to cover approximately the next 24 years. The Company’s estimate includes equipment and operating costs for onsite and offsite operations and is based on existing methodology.

Sparton Corporation 2006 A
nnual Report
27
NYSE:SPA
Uncertainties associated with environmental remediation contingencies are pervasive and often result in wide ranges of reasonably possible outcomes. Estimates developed in the early stages of remediation can vary significantly. Normally, a finite estimate of cost does not become fixed and determinable at a specific point in time. Rather, the costs associated with environmental remediation become estimable over a continuum of events and activities that help to frame and define a li-ability. It is possible that cash flows and results of operations could be affected significantly by the impact of the ultimate resolution of this contingency.
Some of the printed circuit boards supplied to the Company for its aerospace sales have been discovered to be defective. The defect occurred during production at the raw printed circuit board suppliers facility, prior to shipment to Sparton for further processing. Sparton; the board manufacturer, Electropac Co., Inc.; and our customer, who received the defective boards, have contained the defective boards. While investigations are underway, $2.9 million of related product and associ-ated expenses have been classified in Sparton’s balance sheet within other long-term assets as of June 30, 2006. In August 2005, Sparton Electronics Florida, Inc. filed an action in U.S. District Court of Florida against Electropac Co., Inc. to re-cover these costs. The likelihood that the claim will be resolved and the extent of Sparton’s exposure, if any, is unknown at this time. No loss contingency has been established at June 30, 2006.
Sparton is currently involved with legal actions, which are disclosed in Part I Item 3 - “Legal Proceedings”, of this report. At this time, the Company is unable to predict the outcome of these claims.
Item 7(a). Quantitative and Qualitative Disclosures About Market Risk
MARKET RISK EXPOSURE
The Company manufactures its products in the United States, Canada, and Vietnam. Sales are to the U.S. and Canada, as well as other foreign markets. The Company is potentially subject to foreign currency exchange rate risk relating to intercompany activity and balances and to receipts from customers and payments to suppliers in foreign currencies. Also, adjustments related to the translation of the Company’s Canadian and Vietnamese financial statements into U.S. dollars are included in current earnings. As a result, the Company’s financial results could be affected by factors such as changes in foreign currency exchange rates or economic conditions in the domestic and foreign markets in which the Company oper-ates. However, minimal third party receivables and payables are denominated in foreign currency and the related market risk exposure is considered to be immaterial. Historically, foreign currency gains and losses related to intercompany activ-ity and balances have not been significant. However, due to the strengthened Canadian dollar, the impact of transaction and translation gains has increased. If the exchange rate were to materially change, the Company’s financial position could be significantly affected.
The Company has financial instruments that are subject to interest rate risk, principally short-term investments. Histori-cally, the Company has not experienced material gains or losses due to such interest rate changes. Based on the current holdings of short-term investments, the interest rate risk is not considered to be material.

Sparton Corporation 2006 A
nnual Report
28
NYSE:SPA
Item 8. Financial Statements and Supplementary Data
REPORT OF INDEPENDENT REGISTERED PUBLIC ACCOUNTING FIRM
To the Board of Directors and Shareowners of Sparton Corporation
We have audited the accompanying consolidated balance sheets of Sparton Corporation and subsidiaries as of June 30, 2006 and 2005, and the related consolidated statements of income, shareowners’ equity and cash flows for each of the three years in the period ended June 30, 2006. Our audits also included the financial statement schedule listed in the index at Item 15(a)2. These financial statements and schedule are the responsibility of the Company’s management. Our responsibility is to express an opinion on these financial statements and schedule based on our audits. We conducted our audits in accordance with the standards of the Public Company Accounting Oversight Board (United States). Those standards require that we plan and perform the audit to obtain reasonable assurance about whether the finan-cial statements are free of material misstatement. The Company is not required to have, nor were we engaged to perform, an audit of its internal control over financial reporting. Our audits included consideration of internal control over financial reporting as a basis for designing audit procedures that are appropriate in the circumstances, but not for the purpose of expressing an opinion on the effectiveness of the Company’s internal control over financial reporting. Accordingly, we express no such opinion. An audit also includes examining, on a test basis, evidence supporting the amounts and disclo-sures in the financial statements and schedule, assessing the accounting principles used and significant estimates made by management, as well as evaluating the overall presentation of the financial statements and schedule. We believe that our audits provide a reasonable basis for our opinion.
In our opinion, the consolidated financial statements referred to above present fairly, in all material respects, the financial position of Sparton Corporation and subsidiaries as of June 30, 2006 and 2005, and the results of their operations and their cash flows for each of the three years in the period ended June 30, 2006, in conformity with accounting principles gener-ally accepted in the United States of America. Also, in our opinion, the financial statement schedule presents fairly, in all material respects, the information set forth therein.
Grand Rapids, MichiganAugust 25, 2006

Sparton Corporation 2006 A
nnual Report
29
NYSE:SPA
SPARTON CORPORATION AND SUBSIDIARIESConsolidated Balance Sheets
June 30, 2006 2005 ASSETSCurrent assets: Cash and cash equivalents $ 7,503,438 $ 9,368,120 Investment securities (Note 3) 15,969,136 20,659,621 Accounts receivable: Trade, less allowance of $67,000 ($6,000 in 2005) 20,613,574 19,796,336 U.S. and foreign governments 4,494,868 6,208,609 Environmental settlement receivable (Note 10) - 5,455,000 Inventories and costs of contracts in progress (Note 4) 46,892,183 36,847,385 Deferred income taxes (Note 7) 2,662,692 2,640,561 Prepaid expenses and other current assets 1,462,190 631,132 Total current assets 99,598,081 101,606,764
Pension asset (Note 6) 4,420,932 4,968,507
Property, plant and equipment: (Note 1) Land and land improvements 3,028,001 3,160,368 Buildings and building equipment 21,374,162 19,145,258 Machinery and equipment 21,712,973 21,276,316 Construction in progress 428,744 497,392 46,543,880 44,079,334 Less accumulated depreciation (28,944,974) (27,648,345) Net property, plant and equipment 17,598,906 16,430,989
Goodwill and other intangibles (Notes 13 and 14) 22,469,807 770,000Other assets (Notes 3 and 7) 5,970,010 5,684,526
Total assets $150,057,736 $129,460,786
LIABILITIES AND SHAREOWNERS’ EQUITYCurrent liabilities: Current portion of long-term debt (Note 9) $ 3,815,833 $ - Accounts payable 16,748,814 12,694,057 Salaries and wages 4,388,396 4,435,089 Accrued health benefits 1,142,693 1,041,850 Other accrued liabilities 4,996,408 5,518,920 Income taxes payable 308,814 2,414,294 Total current liabilities 31,400,958 26,104,210Long-term debt - noncurrent portion (Note 9) 16,010,616 -Environmental remediation - noncurrent portion (Note 10) 5,795,784 6,184,590 Total liabilities 53,207,358 32,288,800Commitments and contingencies (Note 10)
Shareowners’ Equity (Note 5): Preferred stock, no par value; 200,000 shares authorized, none outstanding - - Common stock, $1.25 par value; 15,000,000 shares authorized, 9,392,305 shares outstanding (8,830,428 at June 30, 2005) 11,740,381 11,038,035 Capital in excess of par value 15,191,990 10,558,757 Retained earnings 70,183,104 75,619,392 Accumulated other comprehensive loss (Note 2) (265,097) (44,198) Total shareowners’ equity 96,850,378 97,171,986 Total liabilities and shareowners’ equity $150,057,736 $129,460,786
See accompanying notes to consolidated financial statements.

Sparton Corporation 2006 A
nnual Report
30
NYSE:SPA
SPARTON CORPORATION AND SUBSIDIARIESConsolidated Statements of Income
Year ended June 30, 2006 2005 2004
Net sales $170,804,982 $167,156,809 $161,003,942Costs of goods sold 156,752,961 149,048,308 151,642,234 Gross profit 14,052,021 18,108,501 9,361,708
Selling and administrative expenses 15,805,830 13,229,728 14,207,745EPA related - net environmental remediation (Note 10) 64,800 (5,031,079) 320,622Net (gain) loss on sale of property, plant and equipment 98,898 (354,413) (859,300) 15,969,528 7,844,236 13,669,067Operating income (loss) (1,917,507) 10,264,265 (4,307,359)
Other income (expense): Interest and investment income 1,116,452 891,672 717,033 Interest expense (98,088) - - Equity income (loss) in investment (Note 3) 21,000 (15,000) 14,000 Other - net 583,499 221,221 (604,171) 1,622,863 1,097,893 126,862
Income (loss) before income taxes (294,644) 11,362,158 (4,180,497)Provision (credit) for income taxes (Note 7) (393,000) 3,250,000 (2,137,000) Net income (loss) $ 98,356 $ 8,112,158 $ (2,043,497)
Earnings (loss) per share - basic (1) $0.01 $0.88 $(0.22)Earnings (loss) per share - diluted (1) $0.01 $0.87 $(0.22)
(1) All share and per share information have been adjusted to reflect the impact of the 5% stock dividend declared in October 2005.
See accompanying notes to consolidated financial statements.
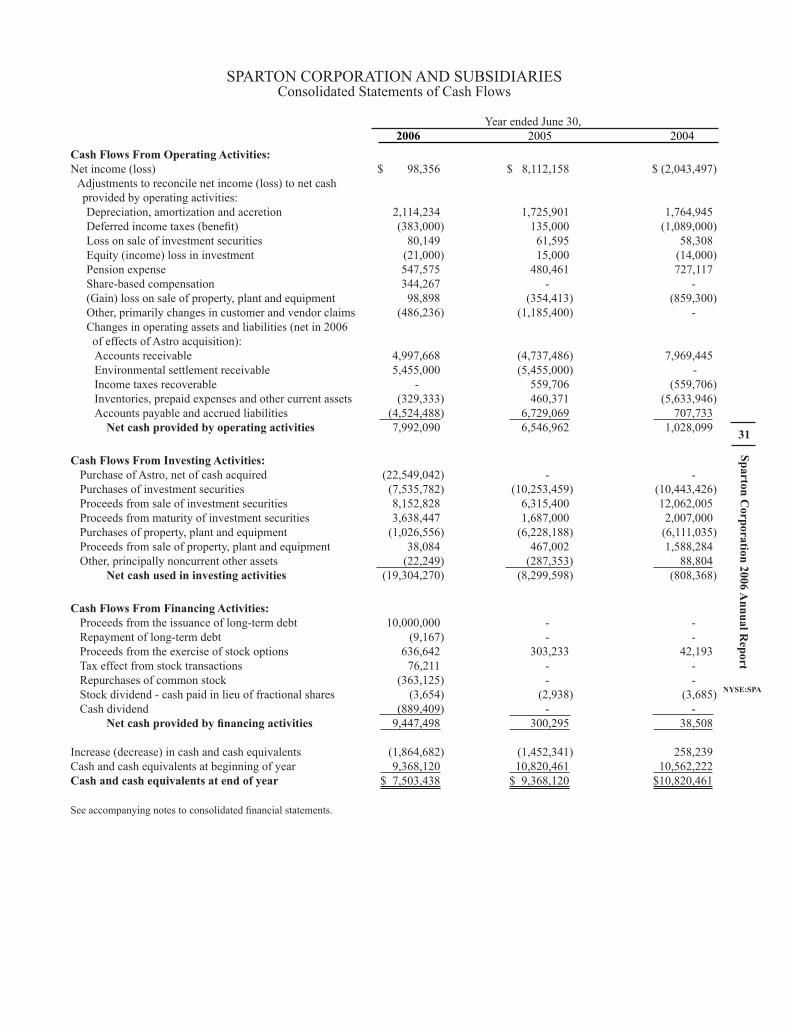
Sparton Corporation 2006 A
nnual Report
31
NYSE:SPA
SPARTON CORPORATION AND SUBSIDIARIESConsolidated Statements of Cash Flows
Year ended June 30, 2006 2005 2004 Cash Flows From Operating Activities:Net income (loss) $ 98,356 $ 8,112,158 $ (2,043,497) Adjustments to reconcile net income (loss) to net cash provided by operating activities: Depreciation, amortization and accretion 2,114,234 1,725,901 1,764,945 Deferred income taxes (benefit) (383,000) 135,000 (1,089,000) Loss on sale of investment securities 80,149 61,595 58,308 Equity (income) loss in investment (21,000) 15,000 (14,000) Pension expense 547,575 480,461 727,117 Share-based compensation 344,267 - - (Gain) loss on sale of property, plant and equipment 98,898 (354,413) (859,300) Other, primarily changes in customer and vendor claims (486,236) (1,185,400) - Changes in operating assets and liabilities (net in 2006 of effects of Astro acquisition): Accounts receivable 4,997,668 (4,737,486) 7,969,445 Environmental settlement receivable 5,455,000 (5,455,000) - Income taxes recoverable - 559,706 (559,706) Inventories, prepaid expenses and other current assets (329,333) 460,371 (5,633,946) Accounts payable and accrued liabilities (4,524,488) 6,729,069 707,733 Net cash provided by operating activities 7,992,090 6,546,962 1,028,099
Cash Flows From Investing Activities: Purchase of Astro, net of cash acquired (22,549,042) - - Purchases of investment securities (7,535,782) (10,253,459) (10,443,426) Proceeds from sale of investment securities 8,152,828 6,315,400 12,062,005 Proceeds from maturity of investment securities 3,638,447 1,687,000 2,007,000 Purchases of property, plant and equipment (1,026,556) (6,228,188) (6,111,035) Proceeds from sale of property, plant and equipment 38,084 467,002 1,588,284 Other, principally noncurrent other assets (22,249) (287,353) 88,804 Net cash used in investing activities (19,304,270) (8,299,598) (808,368)
Cash Flows From Financing Activities: Proceeds from the issuance of long-term debt 10,000,000 - - Repayment of long-term debt (9,167) - - Proceeds from the exercise of stock options 636,642 303,233 42,193 Tax effect from stock transactions 76,211 - - Repurchases of common stock (363,125) - - Stock dividend - cash paid in lieu of fractional shares (3,654) (2,938) (3,685) Cash dividend (889,409) - - Net cash provided by financing activities 9,447,498 300,295 38,508
Increase (decrease) in cash and cash equivalents (1,864,682) (1,452,341) 258,239Cash and cash equivalents at beginning of year 9,368,120 10,820,461 10,562,222Cash and cash equivalents at end of year $ 7,503,438 $ 9,368,120 $10,820,461
See accompanying notes to consolidated financial statements.

Sparton Corporation 2006 A
nnual Report
32
NYSE:SPA
SPARTON CORPORATION AND SUBSIDIARIESConsolidated Statements of Shareowners’ Equity
Capital Accumulated other Common Stock in excess Retained comprehensive Shares Amount of par value earnings income (loss) Total
Balance at July 1, 2003 7,943,671 $9,929,589 $3,015,989 $77,863,142 $359,486 $91,168,206Stock dividend (5% declared October 21, 2003) 397,039 496,299 4,089,502 (4,589,486) (3,685)Stock options exercised 10,828 13,535 28,658 42,193
Comprehensive income (loss), net of tax: Net loss (2,043,497) (2,043,497) Net unrealized loss on investment securities owned (493,601) (493,601) Reclassification adjustment for net loss realized and reported in net loss 38,483 38,483 Net unrealized gain on equity investment 158,000 158,000 Comprehensive loss (2,340,615)Balance at June 30, 2004 8,351,538 10,439,423 7,134,149 71,230,159 62,368 88,866,099
Stock dividend (5% declared November 9, 2004) 417,507 521,883 3,198,104 (3,722,925) (2,938)Stock options exercised 61,383 76,729 226,504 303,233
Comprehensive income (loss), net of tax: Net income 8,112,158 8,112,158 Net unrealized loss on investment securities owned (148,219) (148,219) Reclassification adjustment for net loss realized and reported in net income 40,653 40,653 Net unrealized gain on equity investment 1,000 1,000 Comprehensive income 8,005,592Balance at June 30, 2005 8,830,428 11,038,035 10,558,757 75,619,392 (44,198) 97,171,986
Stock dividend (5% declared October 25, 2005) 446,287 557,857 3,820,645 (4,382,156) (3,654)Stock options exercised, net of common stock surrendered to facilitate exercise 154,627 193,285 443,357 636,642Cash dividend ($0.10 per share) (889,409) (889,409)Repurchases of common stock as part of 2005 share repurchase program (39,037) (48,796) (51,247) (263,079) (363,122)
Stock-based compensation 344,267 344,267Tax effect from stock transactions 76,211 76,211
Comprehensive income (loss), net of tax: Net income 98,356 98,356 Net unrealized loss on investment securities owned (245,797) (245,797) Reclassification adjustment for net loss realized and reported in net income 52,898 52,898 Net unrealized loss on equity investment (28,000) (28,000) Comprehensive loss (122,543)Balance at June 30, 2006 9,392,305 $11,740,381 $15,191,990 $70,183,104 $(265,097) $96,850,378
See accompanying notes to consolidated financial statements.

Sparton Corporation 2006 A
nnual Report
33
NYSE:SPA
SPARTON CORPORATION AND SUBSIDIARIESNotes to Consolidated Financial Statements
1. BUSINESS AND SUMMARY OF SIGNIFICANT ACCOUNTING POLICIES
Basis of presentation - The consolidated financial statements include the accounts of Sparton Corporation and subsidiaries (the Company) and have been prepared in accordance with accounting principles generally accepted in the United States of America. All significant intercompany transactions and accounts have been eliminated. Certain reclassifications of prior year amounts have been made to conform to the current year presentation.
Operations - The Company operates in one line of business, electronic manufacturing services (EMS). The Company provides design and electronic manufacturing services, which include a complete range of engineering, pre-manufacturing and post-manufacturing services. Capabilities range from product design and development through aftermarket support. All of the facilities are registered to ISO standards, including 9001 or 13485, with most having additional certifications. Products and services include complete “Box Build” products for Original Equipment Manufacturers, microprocessor-based systems, transducers, printed circuit boards and assemblies, sensors and electromechanical devices. Markets served are in the government, medical/scientific instrumentation, aerospace, and other industries, with a focus on regulated markets. The Company also develops and manufactures sonobuoys, anti-submarine warfare (ASW) devices, used by the U.S. Navy and other free-world countries. Many of the physical and technical attributes in the production of sonobuoys are the same as those required in the production of the Company’s other electrical and electromechanical products and assemblies.
Use of estimates - The Company’s consolidated financial statements are prepared in accordance with accounting principles generally accepted in the United States of America (GAAP). These accounting principles require management to make certain estimates, judgments and assumptions. The Company believes that the estimates, judgments and assumptions upon which it relies are reasonable based upon information available to it at the time that these estimates, judgments and assumptions are made. These estimates, judgments and assumptions can affect the reported amounts of assets and liabilities as of the date of the financial statements, as well as the reported amounts of revenues and expenses during the periods presented. To the extent there are material differences between these estimates, judgments or assumptions and actual results, the financial statements will be affected. In many cases, the accounting treatment of a particular transaction is specifically dictated by GAAP and does not require management’s judgment in its application. There are also areas in which management’s judg-ment in selecting among available alternatives would not produce a materially different result.
Revenue recognition - The Company’s net sales are comprised primarily of product sales, with supplementary revenues earned from engineering and design services. Standard contract terms are FOB shipping point. Revenue from product sales is generally recognized upon shipment of the goods; service revenue is recognized as the service is performed or under the percentage of completion method, depending on the nature of the arrangement. Long-term contracts relate principally to government defense contracts. These contracts are accounted for based on completed units accepted and their estimated average contract cost per unit. Costs and fees billed under cost-reimbursement-type contracts are recorded as sales. A pro-vision for the entire amount of a loss on a contract is charged to operations as soon as the loss is identified and the amount is determinable. Shipping and handling costs are included in costs of goods sold.
Accounts receivable, credit practices, and allowance for probable losses - Accounts receivable are customer obligations generally due under normal trade terms for the industry. Credit terms are granted and periodically revised based on evalua-tions of the customers’ financial condition. The Company performs ongoing credit evaluations of its customers and although the Company does not generally require collateral, letters of credit or cash advances may be required from customers in certain circumstances. Receivables from foreign customers are generally secured by letters of credit or cash advances.
The Company maintains an allowance for probable losses on receivables for estimated losses resulting from the inability of its customers to make required payments. The allowance is estimated based on historical experience of write-offs, the level of past due amounts (i.e., amounts not paid within the stated terms), information known about specific customers with respect to their ability to make payments, and future expectations of conditions that might impact the collectibility of accounts. When management determines that it is probable that an account will not be collected, all or a portion of the amount is charged against the allowance for probable losses.
Fair value of financial instruments - The fair value of cash and cash equivalents, trade accounts receivable, and accounts payable approximate their carrying value. Cash and cash equivalents consist of demand deposits and other highly liquid investments with an original term when purchased of three months or less. Due to the recent addition of the debt instru-ments, consisting of industrial revenue bonds, notes payable and bank debt, relating to the May 31, 2006 acquisition of Astro Instrumentation, LLC, as documented in Note 13, the fair value of these financial instruments approximates their carrying value at June 30, 2006.

Sparton Corporation 2006 A
nnual Report
34
NYSE:SPA
Investment securities - Investments in debt securities that are not cash equivalents or marketable equity securities have been designated as available for sale. Those securities, all of which are investment grade, are reported at fair value, with net unrealized gains and losses included in accumulated other comprehensive income or loss, net of applicable taxes. Unrealized losses that are other than temporary are recognized in earnings. The investment portfolio has various maturity dates up to 30 years. Realized gains and losses on investments are determined using the specific identification method.
Other investment - The Company has an active investment in Cybernet Systems Corporation, which is accounted for under the equity method, as more fully described in Note 3.
Market risk exposure - The Company manufactures its products in the United States, Canada, and Vietnam. Sales of the Company’s products are in the U.S. and Canada, as well as other foreign markets. The Company is potentially subject to foreign currency exchange rate risk relating to intercompany activity and balances, receipts from customers, and payments to suppliers in foreign currencies. Also, adjustments related to the translation of the Company’s Canadian and Vietnamese financial statements into U.S. dollars are included in current earnings. As a result, the Company’s financial results could be affected by factors such as changes in foreign currency exchange rates or economic conditions in the domestic and foreign markets in which the Company operates. However, minimal third party receivables and payables are denominated in for-eign currency and the related market risk exposure is considered to be immaterial. Historically, foreign currency gains and losses related to intercompany activity and balances have not been significant. However, due to the strengthened Canadian dollar, the impact of transaction and translation gains has increased. If the exchange rate were to materially change, the Company’s financial position could be significantly affected.
The Company has financial instruments that are subject to interest rate risk, principally short-term investments. Histori-cally, the Company has not experienced material gains or losses due to such interest rate changes. Based on the current holdings of short-term investments, the interest rate risk is not considered to be material. In addition, as of May 31, 2006, the Company has bank debt with an adjustable rate of interest, as more fully discussed in Note 9, which would adversely impact operations should the interest rate increase.
Inventories - Customer orders are based upon forecasted quantities of product, manufactured for shipment over defined periods. Raw material inventories are purchased to fulfill these customer requirements. Within these arrangements, customer demand for products frequently change, sometimes creating excess and obsolete inventories. When it is determined that the Company’s carrying cost of such excess and obsolete inventories cannot be recovered in full, a charge is taken against income and a valuation allowance is established for the difference between the carrying cost and the estimated realizable amount. Conversely, should the disposition of adjusted excess and obsolete inventories result in recoveries in excess of these reduced carrying values, the remaining portion of the valuation allowances are reversed and taken into income when such determinations are made. It is possible that the Company’s financial position, results of operations and cash flows could be materially affected by changes to inventory valuation allowances for excess and obsolete inventories.
Inventories are valued at the lower of cost (first-in, first-out basis) or market and include costs related to long-term contracts as disclosed in Note 4. Inventories, other than contract costs, are principally raw materials and supplies. The following are the approximate major classifications of inventory at June 30: 2006 2005 Raw materials $29,388,000 $23,463,000Work in process and finished goods 17,504,000 13,384,000
$46,892,000 $36,847,000
Work in process and finished goods inventories include $4.5 and $1.0 million of completed, but not yet accepted, sonobuoys at June 30, 2006 and 2005, respectively. Inventories are reduced by progress billings to the U.S. government of approximately $10.7 million and $5.6 million at June 30, 2006 and 2005, respectively. Inventory balances as of June 30, 2006, include $10.0 million of inventory at the Company’s newest subsidiary Astro Instrumentation, Inc. (Astro), which is comprised of $8.9 million of raw materials and $1.1 million of work in process and finished goods.
Property, plant, equipment and depreciation - Property, plant and equipment are stated at cost less accumulated deprecia-tion. Depreciation is provided over estimated useful lives on accelerated methods, except for certain buildings, machinery and equipment with aggregate historical costs at June 30, 2006, of approximately $19,967,000 ($10,889,000 net book value), which are being depreciated on the straight-line method. Estimated useful lives generally range from 5 to 50 years for buildings and improvements, 3 to 16 years for machinery and equipment and 3 to 5 years for test equipment. For tax purposes, accelerated depreciation methods with minimum lives are utilized. Estimated cost to complete construction in progress totaled approximately $1.7 million, primarily for the completion of Astro’s new facility.
Long-lived assets - The Company reviews long-lived assets that are not held for sale for impairment whenever events or changes in circumstances indicate that the carrying amount of an asset may not be recoverable. Impairment is determined

Sparton Corporation 2006 A
nnual Report
35
NYSE:SPA
by comparing the carrying value of the assets to their estimated future undiscounted cash flows. If it is determined that an impairment of a long-lived asset has occurred, a current charge to income is recognized. Additionally, the Company has goodwill and other intangibles which are considered long-lived assets. While a portion of goodwill is associated with the Company’s investment in Cybernet, the majority of the approximately $22 million of goodwill and other intangibles reflected on the Company’s balance sheet as of June 30, 2006, is associated with the acquisition of Astro. For a more complete discussion of goodwill and other intangibles see Note 14.
At June 30, 2006, undeveloped land with a cost in the amount of $613,000, located in New Mexico, was classified as held-for-sale and carried in other current assets in the Company’s balance sheet. The value of this land was not impaired, and its sale was completed in August 2006 at a profit of approximately $190,000.
Deferred income taxes - Deferred income taxes are based on enacted income tax rates in effect on the dates temporary differences between the financial reporting and tax bases of assets and liabilities reverse. The effect on deferred tax assets and liabilities of a change in income tax rates is recognized in income in the period that includes the enactment date. To the extent that available evidence about the future raises doubt about the realization of a deferred tax asset, a valuation al-lowance is established.
Supplemental cash flows information - Supplemental cash and noncash activities for the fiscal years 2006, 2005 and 2004 were as follows:
2006 2005 2004 Cash paid during the year: Income taxes - net $1,523,000 $95,000 $244,000 Interest expense $ 11,000 $ - $ -
Noncash investing and financing transactions: Debt assumed or issued in acquisition $9,835,000 $ - $ -
During the year ended June 30, 2006, the Company financed $19,837,000 of the Astro acquisition purchase price through the execution of long-term bank debt of $10,000,000, the noncash issuance of seller notes of $7,500,000 and the noncash assumption of existing bonds of $2,335,000.
Earnings (loss) per share - Basic and diluted earnings (loss) per share were computed based on the following shares outstanding:
2006 2005 2004 Weighted average shares outstanding 9,339,142 9,229,841 9,200,746Effect of dilutive stock options 36,668 125,744 - Weighted average diluted shares outstanding 9,375,810 9,355,585 9,200,746
Basic earnings (loss) per share - after stock dividends $0.01 $0.88 $(0.22)Diluted earnings (loss) per share - after stock dividends $0.01 $0.87 $(0.22)
On October 25, 2005, Sparton’s Board of Directors approved a 5% stock dividend. Eligible shareowners of record on December 21, 2005, received the stock dividend on January 13, 2006. To record the stock dividend, an amount equal to the fair market value of the common stock issued was transferred from retained earnings ($4,382,000) to common stock ($558,000) and capital in excess of par value ($3,821,000), with the balance ($3,000) paid in cash in lieu of fractional shares of stock.
All average outstanding shares and per share information have been restated to reflect the impact of the 5% stock divi-dends declared in October 2003, November 2004, and October 2005. Due to the Company’s fiscal 2004 reported net loss, 142,981 outstanding stock option share equivalents were excluded from the computation of diluted earnings per share for the fiscal year ended June 30, 2004, as their inclusion would have been anti-dilutive for the period. For fiscal 2005, options to purchase 139,125 shares of common stock were not included in the computation of diluted earnings per share as such options’ exercise prices were greater than the average market price of the Company’s common stock and, therefore, would be anti-dilutive. There were no anti-dilutive stock options in fiscal 2006.
Research and development expenditures - Expenditures for research and development (R&D) not funded by customers amounted to approximately $882,000 in fiscal 2006, compared to $1,756,000 of Company funded expenditures in fiscal 2004. There were no non-funded research and development expenditures in fiscal 2005. These expenses are included in

Sparton Corporation 2006 A
nnual Report
36
NYSE:SPA
selling and administrative expense. Customer funded R&D costs are generally not considered material, are usually part of a larger production agreement, and as such are included in both sales and costs of goods sold.
Foreign currency translation and transactions - For purposes of translating the financial statements of the Company’s Canadian and Vietnamese operations, the U.S. dollar is considered the functional currency. Related translation adjustments, along with gains and losses from foreign currency transactions, are included in current earnings and, in the aggregate, amounted to income of $586,000, $228,000, and $5,000 for the years ended June 30, 2006, 2005 and 2004, respectively.
Common stock repurchases - The Company records common stock repurchases at cost. The excess of cost over par value is first allocated to capital in excess of par value based on the per share amount of capital in excess of par value for all shares, with the remainder charged to retained earnings. Effective September 14, 2005, the Board of Directors authorized a publicly-announced common share repurchase program for the repurchase, at the discretion of management, of up to $4 million of shares of the Company’s outstanding common stock in open market transactions. For the fiscal year ended June 30, 2006, 39,037 shares had been repurchased at a cost of approximately $363,000, at monthly weighted average prices ranging from $8.38 to $10.18 per share. As of that date, the dollar value of shares that may yet be repurchased under the program approximates $3,367,000. The program expires September 14, 2007. Repurchased shares are retired.
New accounting standards - In July 2006, the Financial Accounting Standards Board (FASB) issued Interpretation No. 48, Accounting for Uncertainty in Income Taxes (FIN 48), an interpretation of Statement of Financial Accounting Stan-dards (SFAS) No. 109, Accounting for Income Taxes. FIN 48 seeks to reduce the significant diversity in practice associated with financial statement recognition and measurement in accounting for income taxes and prescribes a recognition thresh-old and measurement attribute for disclosure of tax positions taken or expected to be taken on an income tax return. This interpretation will be effective for the Company as of July 1, 2007. The Company does not expect the adoption of FIN 48 will have a significant impact on its results of operations, financial position or cash flows.
In May 2005, the FASB issued SFAS No. 154, Accounting Changes and Error Corrections, a replacement of APB No. 20 and SFAS No. 3” (SFAS No. 154). SFAS No. 154 requires retrospective application to prior periods’ financial state-ments of a voluntary change in accounting principle unless it is impracticable. APB Opinion No. 20 Accounting Changes, previously required that most voluntary changes in accounting principle be recognized by including in net income of the period of the change the cumulative effect of changing to the new accounting principle. This Statement is effective for the Company as of July 1, 2006. The Company does not expect the adoption of SFAS No. 154 will have a significant impact on the manner of display of its results of operations or financial position.
In December 2004, the FASB issued SFAS No. 123(R), Share-based Payment, which replaces SFAS No. 123, Accounting for Share-based Compensation, and supersedes Accounting Principles Board Opinion No. 25, Accounting for Stock Is-sued to Employees (APB No. 25). The Statement requires that the calculated cost resulting from all share-based payment transactions be recognized in the financial statements. The Statement also establishes fair value as the measurement ob-jective in accounting for share-based payment arrangements and requires all entities to apply a fair-value-based measure-ment method in accounting for share-based payment transactions with employees, except for equity instruments held by employee share ownership plans. The Statement was effective for the Company beginning July 1, 2005. The “modified prospective” method was required upon adoption; accordingly, results of prior periods have not been restated. Under the modified prospective method, the Statement applies to new awards and to awards modified, repurchased or cancelled after the effective date. Additionally, compensation cost for the unvested portion of awards as of the effective date is required to be recognized after the effective date as the awards vest. As of July 1, 2005, the Company implemented SFAS No.123(R), with share-based compensation expense now reflected in the Company’s statements of operations. See “Stock options,” Note 5 of this report, for additional information regarding the adoption of SFAS No. 123(R).
In December 2004, the FASB issued SFAS No. 153, Exchange of Nonmonetary Assets, an amendment of APB Opinion No. 29 (SFAS No. 153), which addresses the measurement of exchanges of nonmonetary assets. The Statement eliminates the exception for nonmonetary exchanges of similar productive assets and replaces it with a general exception for exchange of nonmonetary assets that do not have commercial substance. It also specifies that a nonmonetary exchange has com-mercial substance if the future cash flows of the entity are expected to change significantly as a result of the exchange. The Statement was effective for the Company beginning July 1, 2005, and did not have an impact on its results of operations or financial position.
In November 2004, the FASB issued SFAS No. 151, Inventory Costs (SFAS No. 151), which amends the guidance in Ac-counting Research Bulletin No. 43, Chapter 4, Inventory Pricing. The Statement requires that the accounting for abnormal amounts of idle facility expense, freight handling costs, and wasted material (spoilage) be recognized as current-period charges. In addition, the Statement requires that the allocation of fixed production overhead to the costs of conversion be based on the normal capacity of the production facilities. The Statement was effective for the Company for inventory costs incurred beginning July 1, 2005, and did not have an impact on its results of operations or financial position.

Sparton Corporation 2006 A
nnual Report
37
NYSE:SPA
2. COMPREHENSIVE INCOME (LOSS) - Comprehensive income (loss) includes net income (loss) as well as unreal-ized gains and losses, net of tax, on investment securities owned and investment securities held by an investee accounted for by the equity method, which are excluded from net income. Unrealized gains and losses, net of tax, are excluded from net income, but are reflected as a direct charge or credit to shareowners’ equity. Comprehensive income (loss) and the related components are disclosed in the accompanying consolidated statements of shareowners’ equity for each of the years ended June 30, 2006, 2005, and 2004. Comprehensive income (loss) is summarized as follows for the years ended of June 30, 2006, 2005 and 2004, respectively:
2006 2005 2004 Net income (loss) $ 98,000 $8,112,000 $(2,043,000)
Other comprehensive income (loss), net of tax Investment securities owned (193,000) (107,000) (456,000) Investment securities held by investee accounted for by the equity method (28,000) 1,000 158,000 (221,000) (106,000) (298,000) Comprehensive income (loss) $(123,000) $8,006,000 $(2,341,000)
At June 30, 2006 and June 30, 2005, shareowners’ equity includes an accumulated other comprehensive loss of $(265,000) and $(44,000), respectively, net of tax. The components of these amounts at those dates are as follows:
2006 2005 Accumulated other comprehensive income (loss), net of tax: Investment securities owned $(284,000) $(91,000) Investment securities held by investee accounted for by the equity method 19,000 47,000 Accumulated other comprehensive loss $(265,000) $(44,000)
3. INVESTMENT SECURITIES - Details of investment securities, which are classified as available-for-sale, as of June 30, 2006 and 2005, are as follows:
Gross Unrealized EstimatedDebt securities Amortized Cost Gains/(Losses) Fair Value June 30, 2006: Corporate - primarily U.S. $ 3,687,000 $2,000 $ (52,000) $ 3,637,000 U.S. government and federal agency 5,545,000 - (188,000) 5,357,000 State and municipal 2,880,000 - (109,000) 2,771,000 Bond fund 4,274,000 - (70,000) 4,204,000 Total investment securities $16,386,000 $2,000 $(419,000) $15,969,000
June 30, 2005: Corporate - primarily U.S. $ 4,704,000 $ 9,000 $ (55,000) $ 4,658,000 U.S. government and federal agency 7,432,000 12,000 (50,000) 7,394,000 State and municipal 4,412,000 28,000 (46,000) 4,394,000 Bond fund 4,257,000 - (43,000) 4,214,000 Total investment securities $20,805,000 $49,000 $(194,000) $20,660,000
The Company does not believe there are any significant individual unrealized losses as of June 30, 2006, which would represent other-than-temporary losses and unrealized losses which have existed for one year or more. A daily market exists for all of the investment securities. The Company believes that the impact of fluctuations in interest rates on its investment portfolio should not have a material impact on its financial position or results of operations. These highly liquid securities are designated as current assets. It is the Company’s intention to use these investment securities to provide working capital, fund the expansion of its business and for other customary business purposes. The contractual maturities of debt securities as of June 30, 2006, are as follows:
Debt securities: Within 1 year 1 to 5 years 5 to 10 years Over 10 years Total Corporate - primarily U.S. $ 808,000 $2,531,000 $ 187,000 $ 111,000 $ 3,637,000U.S. government and federal agency 215,000 2,271,000 1,417,000 1,454,000 5,357,000State and municipal - 2,080,000 691,000 - 2,771,000Bond fund 4,204,000 - - - 4,204,000 Total debt securities $5,227,000 $6,882,000 $2,295,000 $1,565,000 $15,969,000

Sparton Corporation 2006 A
nnual Report
38
NYSE:SPA
For the years ended June 30, 2006, 2005, and 2004, the Company had purchases of investment securities totaling $7,536,000, $10,253,000, and $10,443,000, and proceeds from investment securities sales totaling $8,153,000, $6,315,000, and $12,062,000, respectively. Gross realized gains and losses from sales of investment securities in fiscal 2006 amounted to $30,000 and $110,000, respectively. Gross realized gains and losses in fiscal 2005 amounted to $15,000 and $77,000, respectively. Gross realized gains and losses in fiscal 2004 amounted to $152,000 and $210,000, respectively.
At June 30, 2006 and 2005, the Company had net unrealized losses of $417,000 and $145,000, respectively, on its invest-ment securities portfolio. On those dates, the net after-tax effect of these losses was $284,000 and $91,000, respectively, which is included in accumulated other comprehensive loss within shareowners’ equity.
In June 1999, the Company purchased a 14% interest (12% on a fully diluted basis) in Cybernet Systems Corporation (Cybernet) for $3,000,000. Cybernet is a developer of hardware, software, next-generation network computing, and robotics products. It is located in Ann Arbor, Michigan. The investment is accounted for under the equity method and is included in other assets and goodwill on the balance sheet. At June 30, 2006 and 2005, the Company’s investment in Cybernet amounted to $1,645,000 and $1,656,000, respectively, representing its equity interest in Cybernet’s net assets plus $770,000 of goodwill (no longer being amortized in accordance with SFAS No. 142, Goodwill and Other Intangible Assets). The Company believes that the equity method is appropriate given Sparton’s level of involvement in Cybernet. Prior to June 2002, Sparton accounted for its Cybernet investment using the cost method, which reflected a more passive involvement with Cybernet’s operations. Sparton’s current President and CEO is one of three Cybernet Board members, and as part of that position is actively involved in Cybernet’s oversight and operations. In addition, he has a strategic management relationship with the owners, who are also the other two board members, resulting in his additional involvement in pursu-ing areas of common interest for both Cybernet and Sparton. The use of the equity method requires Sparton to record its share of Cybernet’s income or loss in earnings (“Equity income (loss) in investment”) in Sparton’s income statements with a corresponding increase or decrease in the investment account (“Other assets”) in Sparton’s balance sheets. In addition, Sparton’s share of unrealized gains (losses) on available-for-sale securities held by Cybernet, is carried in accumulated other comprehensive income (loss) within the shareowners’ equity section of Sparton’s balance sheets. The unrealized gains (losses) on available-for-sale securities reflect Cybernet’s investment in Immersion Corporation, a publicly traded company, as well as other investments.
4. LONG-TERM CONTRACTS - Government contracts allow for progress billings, against inventory purchased by the Company, to be submitted for payment throughout the performance of the job. Inventories include costs of approximately $14,069,000 and $7,825,000 at June 30, 2006 and 2005, respectively, related to long-term contracts, reduced by progress billings of approximately $10,711,000 and $5,649,000, respectively, to the U.S. government.
5. STOCK OPTIONS - As of July 1, 2005, SFAS No. 123(R) became effective for the Company. The Company had previously followed APB No. 25 and related Interpretations in accounting for its employee stock options. Under APB No. 25, no compensation expense was recognized, as the exercise price of the Company’s employee stock options equaled the market price of the underlying stock on the date of grant. Under SFAS No. 123(R), compensation expense is now recognized in the Company’s financial statements. Share-based compensation cost is measured on the grant date, based on the fair value of the award calculated at that date, and is recognized over the employee’s requisite service period, which generally is the options’ vesting period. Fair value is calculated using the Black-Scholes option pricing model. The Black-Scholes calculation, which was not necessary to be performed during the year ended June 30, 2006 as no options were granted during that fiscal year, would have utilized the methodology and assumptions consistent with those used in prior periods under SFAS No. 123.
The Company has an incentive stock option plan under which 912,142 authorized and unissued common shares, which includes 760,000 original shares adjusted by 152,142 shares for the declaration of stock dividends, were reserved for op-tion grants to directors and key employees at the fair market value of the Company’s common stock at the date of the grant. Options granted have either a five or ten-year term and become vested and exercisable cumulatively beginning one year after the grant date, in four equal annual installments. Options may terminate before their expiration dates if the optionee’s status as an employee is terminated, or upon death. No stock options were granted during the fiscal year ended June 30, 2006.
Employee stock options, which are granted by the Company pursuant to a plan last amended and restated on October 24, 2001, are structured to qualify as “incentive stock options” (ISOs). Under current federal income tax regulations, the Com-pany does not receive a tax deduction for the issuance, exercise or disposition of ISOs if the employee meets certain hold-ing period requirements. If the employee does not meet the holding period requirement a disqualifying disposition occurs, at which time the Company can receive a tax deduction. The Company does not record tax benefits related to ISOs unless and until a disqualifying disposition occurs. In the event of a disqualifying disposition, the entire tax benefit is recorded as a reduction of income tax expense. In accordance with SFAS No. 123(R), excess tax benefits (where the tax deduction exceeds the recorded compensation expense) are credited to “capital in excess of par value” in the consolidated statement

Sparton Corporation 2006 A
nnual Report
39
NYSE:SPA
of shareowners’ equity and tax benefit deficiencies (where the recorded compensation expense exceeds the tax deduction) are charged to “capital in excess of par value” to the extent previous excess tax benefits exist.
Share-based compensation expense and related tax benefit totaled $344,000 and $5,000, respectively, for the year ended June 30, 2006, all of which relates to awards granted prior to July 1, 2005. Basic and diluted earnings (loss) per share were impacted by approximately $.04. As of June 30, 2006, unrecognized compensation costs related to nonvested awards amounted to $554,000 and will be recognized over a remaining weighted average period of approximately 1.85 years.
The following sets forth a reconciliation of net income and earnings per share information for the years ended June 30, 2005 and 2004, respectively, as if the Company had recognized compensation expense based on the fair value at the grant date for awards under the plan.
2005 2004 Net income (loss), as reported $8,112,000 $(2,043,000)Deduct: Total share-based compensation expense determined under the fair value method for all awards, net of tax effects (175,000) (187,000) Pro forma net income (loss) $7,937,000 $(2,230,000)
Pro forma earnings (loss) per share: Basic earnings (loss) per share - after stock dividends $0.86 $(0.24) Diluted earnings (loss) per share - after stock dividends $0.85 $(0.24)
The following table summarizes additional information about stock options outstanding and exercisable at June 30, 2006:
Options Outstanding Options Exercisable Range of Wtd. Avg. Remaining Wtd. Avg. Wtd. Avg.Exercise Prices Number of shares Contractual Life (years) Exercise Price Number of shares Exercise Price
$5.77 to $6.99 361,212 1.35 $6.19 329,007 $6.12$8.08 to $9.00 155,858 8.81 8.97 39,709 8.97 517,070 368,716
In general, the Company’s policy is to issue new shares upon the exercise of a stock option. A summary of option activity under the Company’s stock option plan for each of the years ended June 30, 2006, 2005 and 2004 is presented below. All options presented have been adjusted to reflect the impact of the 5% common stock dividend declared in October 2005.
Weighted Weighted Average Remaining Total Shares Average Contractual Aggregate Under Option Exercise Price Term (years) Intrinsic Value
Outstanding at July 1, 2003 630,834 $5.72
Granted 2,977 $8.88Exercised (10,828) $3.90 $65,000Forfeited or expired (5,524) $6.19
Outstanding at June 30, 2004 617,459 $5.50 2.87
Granted 162,330 $8.97Exercised (61,383) $4.69 $275,000Forfeited or expired (9,402) $6.21
Outstanding at June 30, 2005 709,004 $6.37 3.75
Granted - -Exercised (167,953) $4.50 $820,000Forfeited or expired (23,981) $6.82
Outstanding at June 30, 2006 517,070 $7.02 3.59 $817,000

Sparton Corporation 2006 A
nnual Report
40
NYSE:SPA
The aggregate intrinsic value reflects the difference between an option’s fair value and its exercise price. The aggregate intrinsic value of options exercisable at June 30, 2006, was $768,000, with a weighted average remaining contractual life of 2.02 years. The difference between the weighted average exercise price and the grant date average fair value, calculated using the Black-Scholes model, and reflected in the table below, represents the intrinsic value on a per share basis.
Exercisable options Nonvested options Number Wtd. Avg. Grant Date Number Wtd. Avg. Grant Date Options Outstanding at: of Shares Exercise Price Avg. Fair Value of Shares Exercise Price Avg. Fair Value
June 30, 2004 307,239 $5.04 $2.38 310,220 $5.94 $2.82 June 30, 2005 471,337 $5.37 $2.80 237,667 $8.34 $4.30 June 30, 2006 368,716 $6.42 $3.96 148,354 $8.55 $4.30
Shares remaining available for grant
As of June 30, 2004 204,369As of June 30, 2005 133,363As of June 30, 2006 164,484
Under SFAS No. 123, fair value was estimated at the date of grant using the Black-Scholes option pricing model and the following weighted average assumptions for the options granted during the years ended June 30:
2006 2005 2004 Expected option life - 10 yrs 10 yrs Expected volatility - 33.3% 34.3% Risk-free interest rate - 4.2 4.1 Cash dividend yield - 0.0 0.0 Weighted average grant date fair value - $4.84 $4.97___________________
Black-Scholes assumptions information: Expected life used equals the time until expiration of the options. The expected volatility is based on a 10-year look-back of average stock prices which is consistent with the current exercise life of options awarded. Risk free interest rate is based upon the yield on 10-year treasury notes. Cash dividend yield has been set at zero, as the Company has not historically declared or paid cash dividends on a regularly scheduled basis.
6. EMPLOYEE RETIREMENT BENEFIT PLANS
Defined Pension Benefit Plan
Prior to March 31, 2000, the Company maintained a contributory defined benefit pension plan covering certain salaried and hourly domestic employees. Pension benefits were based on years of credited service. Additional benefits were available to contributory participants based upon their years of contributory service and compensation.
Effective April 1, 2000, the Company amended its defined benefit retirement plan for U.S. employees to determine future benefits using a cash balance formula. On March 31, 2000, credited and contributory credited service under the plan’s pre-vious formula were frozen and the benefit amount changed to be based on the final 5 years’ average compensation. Under the cash balance formula, each participant has an account which is credited yearly with 2% of their salary, as well as the interest earned on their previous year-end cash balance. In addition, a transition benefit was added to address the shortfall in projected benefits that some eligible employees could experience. The Company’s policy is to fund the plan based upon legal requirements and tax regulations.
The Company’s investment policy is based on a review of the actuarial and funding characteristics of the plan. Capital market risk and return opportunities are also considered. The investment policy’s primary objective is to achieve a long-term rate of return consistent with the actuarially determined requirements of the plan, as well as maintaining an asset level sufficient to meet the plan’s benefit obligations. A target allocation range between asset categories has been established to enable flexibility in investment, allowing for a better alignment between the long-term nature of pension plan liabilities, invested assets, and current and anticipated market returns on those assets. The weighted average expected long-term rate of return is based on a fourth quarter 2006 review of such rates.

Sparton Corporation 2006 A
nnual Report
41
NYSE:SPA
Below is a summary of pension plan asset allocations, along with expected long-term rates of return as of June 30, 2006, by asset category. Equity securities include 387,866 and 369,397 shares of Sparton common stock valued at $3,297,000 and $3,653,000 at June 30, 2006 and 2005, respectively, which represents 28.2% and 27.4% of the total investment in equity securities at those dates. The increase in Sparton shares held in the pension plan was a result of the 5% stock dividend declared October 2005.
Weighted Average Allocation Weighted Average Expected For the year ended June 30 Long-term Rate of Return Target Actual as of June 30, 2006
Asset Category: 2006 2006 2005
Equity securities 40 - 70% 76.3% 75.3% 9.5% Fixed income securities 30 - 60 18.5 23.3 5.3 Cash and cash equivalents 0 - 10 5.2 1.4 3.8 100.0% 100.0%
The weighted average assumptions used to determine benefit obligations and net periodic benefit cost for fiscal 2006, 2005 and 2004 were as follows:
Benefit Obligation Benefit Cost 2006 2005 2004 2006 2005 2004
Discount rate 6.00% 5.75% 5.75% 5.75% 5.75% 6.25% Expected return on plan assets 7.50 7.50 7.50 7.50 7.50 7.50 Rate of compensation increase 4.25 4.50 4.50 4.50 4.50 5.00
Net periodic pension expense of $548,000, $480,000, and $727,000 was recognized in fiscal 2006, 2005 and 2004, respec-tively. The components of net periodic pension expense for each of these fiscal years were as follows:
2006 2005 2004 Service cost $514,000 $549,000 $541,000Interest cost 650,000 663,000 674,000Expected return on plan assets (907,000) (978,000) (855,000)Amortization of prior service cost 97,000 96,000 97,000Amortization of unrecognized net actuarial loss 194,000 150,000 270,000 Net periodic pension expense $548,000 $480,000 $727,000
The following tables summarize the changes in benefit obligations, plan assets and funded status of the plan at March 31, 2006 and 2005 (measurement dates):
2006 2005 Change in prepaid benefit cost: Prepaid benefit cost at fiscal year beginning July 1 $ 4,969,000 $ 5,449,000 Net periodic cost for fiscal year (548,000) (480,000) Prepaid benefit cost at fiscal year end on June 30 $ 4,421,000 $ 4,969,000
Change in projected benefit obligation: Projected benefit obligation at prior measurement date $12,409,000 $12,630,000 Service cost 514,000 549,000 Interest cost 650,000 663,000 Actuarial (gain) losses (47,000) 20,000 Benefits paid (1,732,000) (1,453,000) Projected benefit obligation at current measurement date $11,794,000 $12,409,000
Change in plan assets: Fair value of plan assets at prior measurement date $13,280,000 $14,132,000 Actual return on plan assets 1,211,000 601,000 Benefits paid (1,732,000) (1,453,000) Fair value of plan assets at current measurement date $12,759,000 $13,280,000
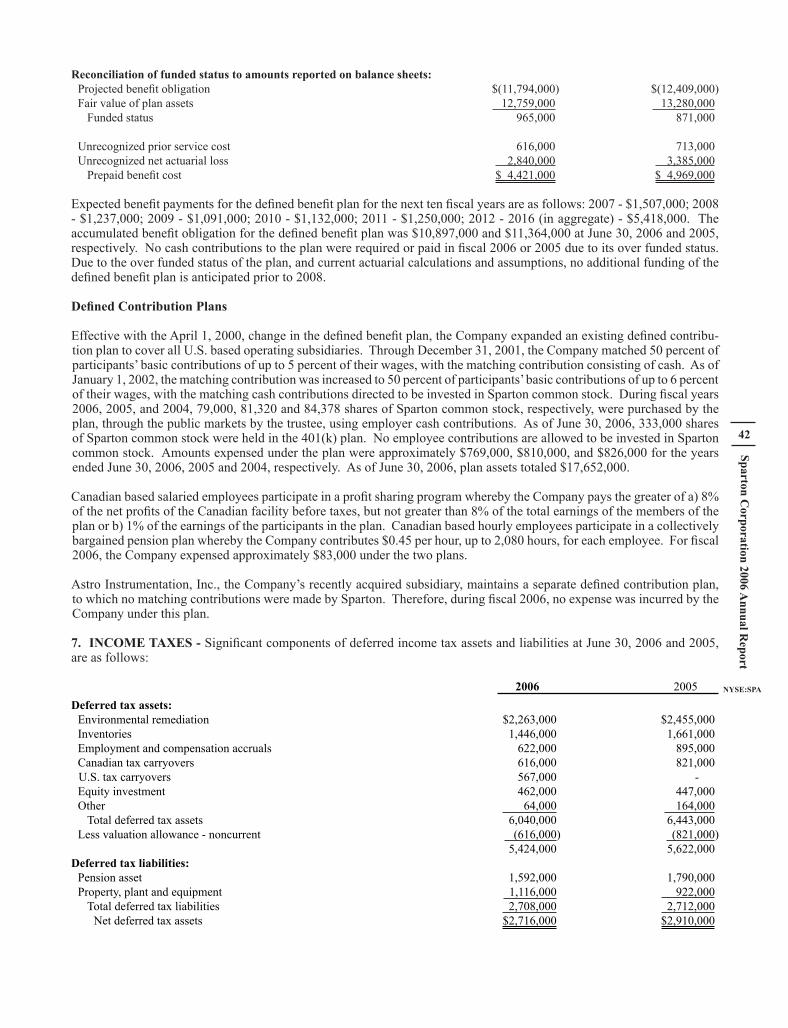
Sparton Corporation 2006 A
nnual Report
42
NYSE:SPA
Reconciliation of funded status to amounts reported on balance sheets: Projected benefit obligation $(11,794,000) $(12,409,000) Fair value of plan assets 12,759,000 13,280,000 Funded status 965,000 871,000
Unrecognized prior service cost 616,000 713,000 Unrecognized net actuarial loss 2,840,000 3,385,000 Prepaid benefit cost $ 4,421,000 $ 4,969,000
Expected benefit payments for the defined benefit plan for the next ten fiscal years are as follows: 2007 - $1,507,000; 2008 - $1,237,000; 2009 - $1,091,000; 2010 - $1,132,000; 2011 - $1,250,000; 2012 - 2016 (in aggregate) - $5,418,000. The accumulated benefit obligation for the defined benefit plan was $10,897,000 and $11,364,000 at June 30, 2006 and 2005, respectively. No cash contributions to the plan were required or paid in fiscal 2006 or 2005 due to its over funded status. Due to the over funded status of the plan, and current actuarial calculations and assumptions, no additional funding of the defined benefit plan is anticipated prior to 2008.
Defined Contribution Plans
Effective with the April 1, 2000, change in the defined benefit plan, the Company expanded an existing defined contribu-tion plan to cover all U.S. based operating subsidiaries. Through December 31, 2001, the Company matched 50 percent of participants’ basic contributions of up to 5 percent of their wages, with the matching contribution consisting of cash. As of January 1, 2002, the matching contribution was increased to 50 percent of participants’ basic contributions of up to 6 percent of their wages, with the matching cash contributions directed to be invested in Sparton common stock. During fiscal years 2006, 2005, and 2004, 79,000, 81,320 and 84,378 shares of Sparton common stock, respectively, were purchased by the plan, through the public markets by the trustee, using employer cash contributions. As of June 30, 2006, 333,000 shares of Sparton common stock were held in the 401(k) plan. No employee contributions are allowed to be invested in Sparton common stock. Amounts expensed under the plan were approximately $769,000, $810,000, and $826,000 for the years ended June 30, 2006, 2005 and 2004, respectively. As of June 30, 2006, plan assets totaled $17,652,000.
Canadian based salaried employees participate in a profit sharing program whereby the Company pays the greater of a) 8% of the net profits of the Canadian facility before taxes, but not greater than 8% of the total earnings of the members of the plan or b) 1% of the earnings of the participants in the plan. Canadian based hourly employees participate in a collectively bargained pension plan whereby the Company contributes $0.45 per hour, up to 2,080 hours, for each employee. For fiscal 2006, the Company expensed approximately $83,000 under the two plans.
Astro Instrumentation, Inc., the Company’s recently acquired subsidiary, maintains a separate defined contribution plan, to which no matching contributions were made by Sparton. Therefore, during fiscal 2006, no expense was incurred by the Company under this plan.
7. INCOME TAXES - Significant components of deferred income tax assets and liabilities at June 30, 2006 and 2005, are as follows:
2006 2005 Deferred tax assets: Environmental remediation $2,263,000 $2,455,000 Inventories 1,446,000 1,661,000 Employment and compensation accruals 622,000 895,000 Canadian tax carryovers 616,000 821,000 U.S. tax carryovers 567,000 - Equity investment 462,000 447,000 Other 64,000 164,000 Total deferred tax assets 6,040,000 6,443,000 Less valuation allowance - noncurrent (616,000) (821,000) 5,424,000 5,622,000Deferred tax liabilities: Pension asset 1,592,000 1,790,000 Property, plant and equipment 1,116,000 922,000 Total deferred tax liabilities 2,708,000 2,712,000 Net deferred tax assets $2,716,000 $2,910,000

Sparton Corporation 2006 A
nnual Report
43
NYSE:SPA
Deferred income taxes are included in the balance sheets at June 30, 2006 and 2005, as follows:
2006 2005 Deferred income taxes, current $2,662,000 $2,641,000 Other assets, noncurrent 54,000 269,000 $2,716,000 $2,910,000
Income (loss) before income taxes by country consists of the following amounts:
2006 2005 2004 United States $(545,000) $10,716,000 $(5,276,000) Canada 591,000 1,264,000 1,095,000 Vietnam (341,000) (618,000) - $(295,000) $11,362,000 $(4,181,000)
The provision (credit) for income taxes consists of the following components:
2006 2005 2004 Current:
United States $ - $2,922,000 $(1,048,000)State and local (10,000) 193,000 -
(10,000) 3,115,000 (1,048,000)Deferred - United States (383,000) 135,000 (1,089,000) $(393,000) $3,250,000 $(2,137,000)
The consolidated effective income tax (credit) rate differs from the statutory U.S. federal tax rate for the following reasons and by the following percentages:
2006 2005 2004 Statutory U.S. federal income tax (credit) rate (34.0)% 34.0% (34.0)%Significant increases (reductions) resulting from: Canadian tax loss carryovers (75.3) (4.0) (11.0) Foreign loss with no tax benefit 39.4 1.9 - Tax benefit of foreign sales (63.5) (2.4) (4.2) Tax exempt income (30.9) (0.5) - State and local income taxes, net of federal benefit (3.4) 1.8 (1.4) Other 34.5 (2.2) (0.5) Effective income tax (credit) rate (133.2)% 28.6% (51.1)%
The Company’s effective tax rate (benefit) for fiscal 2006 was (133.2%) compared to the statutory U.S. federal tax rate of (34%). The favorable tax rate (benefit) was principally attributable to taxable income of approximately $616,000 from the Canadian facility, for fiscal 2006, which relieved the Company’s Canadian deferred tax valuation allowance associated with the Canadian facility’s net operating loss carryforward. In addition, income from investment activity and certain foreign sales exempt under U.S. tax laws contributed to the benefit. Further, certain U.S. tax laws exempt income from state and local municipal bonds; the Company’s investment income from these instruments for fiscal 2006 was approximately $267,000, which provided a beneficial impact to the effective tax rate of approximately (31%). The Company’s operations in Vietnam are subject to a four-year tax holiday, with the possible extension to an eight-year tax holiday. The Company’s Vietnamese operations resulted in a loss of $341,000 for the year. Due to the Vietnam tax holiday associated with this facility, no tax benefit is available to be recognized.
For U.S income tax purposes approximately $1,575,000 of net operating loss carryovers were available at June 30, 2006, for carryover against income in furture tax years. The net operating loss carryovers expire in 2026. Management believes that realization of these carryovers is more likely than not.
For Canadian income tax purposes, approximately $689,000 of net operating loss carryovers and $1,022,000 of scientific research and development expenditures carryovers were available at June 30, 2006, for carryover against income in future tax years. The net operating loss carryovers expire as follows: $472,000 in 2007; $89,000 in 2008 and $128,000 in 2009. The scientific research and development expenditures have an unlimited carryover period. For financial reporting purposes, a valuation allowance of $616,000 has been established for the available Canadian carryovers at June 30, 2006.

Sparton Corporation 2006 A
nnual Report
44
NYSE:SPA
8. LEASES - The Company leases a substantial portion of its production machinery and data processing equipment. Such leases, some of which are noncancelable and in many cases include purchase or renewal options, expire at various dates. Generally, the Company is responsible for maintenance, insurance and taxes relating to these leased assets. Rent expense under agreements accounted for as operating leases was $4,972,000 in fiscal 2006, $5,486,000 in fiscal 2005, and $5,044,000 in fiscal 2004. At June 30, 2006, future minimum lease payments for all noncancelable operating leases totaled $11,766,000, and are payable as follows: 2007 - $4,380,000; 2008 - $3,577,000; 2009 - $2,515,000; 2010 - $1,039,000; 2011 - $255,000. The Company does not have any capital leases. All leases are operating leases, generally for machinery and equipment, with monthly payments over a fixed term in equal, non-escalating amounts.
9. BORROWINGS
Short-term debt maturities - Short-term debt as of June 30, 2006, includes the current portion of long-term bank loan debt of $2,000,000, the current portion of long-term notes payable debt of $1,724,000, and the current portion of Industrial Revenue bonds of $92,000. Both the bank loan and the notes payable were incurred as a result of the Company’s purchase of Astro Instrumentation, LLC on May 31, 2006, and are due and payable in equal installments over the next several years as further discussed below. The Industrial Revenue bonds were assumed at the time of Astro’s purchase and were previ-ously incurred by Astro.
The Company also has available an unsecured $20,000,000 revolving line-of-credit facility provided by a local bank to support working capital needs and other general corporate purposes. Interest on borrowings would be charged using a floating rate of 1.25% plus a base rate determined by reference to a specified index. There have been no drawings against this credit facility.
Long-term debt - Long-term debt, all of which arose in conjunction with the Astro acquisition, consists of the following obligations as of June 30, 2006:
2006 Industrial revenue bonds, face value $ 2,477,000Less unamortized purchase discount 150,000Industrial revenue bonds, carrying value 2,327,000Bank loan 10,000,000Notes payable 7,500,000 Total long-term debt 19,827,000Less current portion 3,816,000 Long-term debt, net of current portion $16,011,000
There were no short or long-term debt or other borrowings outstanding as of June 30, 2005.
The bank loan of $10 million is through National City Bank. This loan is to be repaid over five years, with quarterly prin-cipal payments of $500,000 commencing September 1, 2006. This loan bears interest at the variable rate of LIBOR plus 100 basis points, with interest calculated and payable quarterly along with the principal payment. As of June 30, 2006, this interest rate equaled 6.350%, with accrued interest of $52,000. As a condition of this bank loan the Company is subject to certain customary covenants, which become applicable beginning with the Company’s fiscal year ending June 30, 2007. If these covenants were to have been in place as of June 30, 2006, the Company would have met their requirements. This debt is not secured.
The two notes payable of $3,750,000 each, totaling $7.5 million, are payable to the sellers of Astro Instrumentation, LLC (Astro). These notes are to be repaid over four years, in aggregate semi-annual payments of principal and interest in the combined amount of $1,057,000 on July 1 and December 1 of each year commencing December 1, 2006. These notes each bear interest at 5.5% per annum. The notes are proportionately secured by the stock of Astro. As of June 30, 2006, there was interest accrued in the amount of $34,000.
The Company has assumed repayment of principal and interest on bonds originally issued to Astro by the State of Ohio. These bonds are Ohio State Economic Development Revenue Bonds, series 2002-4. Astro originally entered into the loan agreement with the State of Ohio for the issuance of these bonds to finance the construction of Astro’s current operating facility. The principal amount, including premium, was issued in 2002 and totaled $2,845,000. These bonds have interest rates which vary, dependent on the maturity date of the bonds. Due to an increase in interest rates since the original issuance of the bonds, a discount amounting to $151,000 on the date of assumption by Sparton was recorded.

Sparton Corporation 2006 A
nnual Report
45
NYSE:SPA
Scheduled principal maturities for each of the five years succeeding June 30, 2006 and thereafter, are summarized as fol-lows: Stated Amortization of Carrying Semi-AnnualYear ended June 30 Face Amount Purchase Discount Value Interest Rate 2007 $ 101,000 $ 9,000 $ 92,000 3.00% - 3.50% 2008 110,000 10,000 100,000 3.50% - 5.00% 2009 116,000 9,000 107,000 5.00% 2010 121,000 10,000 111,000 5.00% 2011 130,000 9,000 121,000 5.00% 2012 - 2015 578,000 38,000 540,000 5.00% 2016 - 2022 1,321,000 65,000 1,256,000 5.45% $2,477,000 $150,000 $2,327,000
The bonds carry certain sinking fund requirements generally obligating the Company to deposit funds into a sinking fund. The sinking fund requires the Company to make monthly deposits of one twelfth of the annual obligation plus accrued interest. The purchase discount is being amortized ratably over the remaining term of the bonds. Amortization expense for the one month ended June 30, 2006 was approximately $800, which is included in interest expense. The Company also had an irrevocable letter of credit in the amount of $284,000, which is renewable annually, to secure repayment of a portion of the bonds.
Scheduled aggregate principal maturities of all long-term debt for each of the five years succeeding June 30, 2006 and thereafter, is presented below:
Total 2007 2008 2009 2010 2011 ThereafterMaturities $19,827,000 $3,816,000 $3,922,000 $4,030,000 $4,142,000 $2,121,000 $1,796,000
10. COMMITMENTS AND CONTINGENCIES
Environmental Remediation
One of Sparton’s former manufacturing facilities, located in Albuquerque, New Mexico (Coors Road), has been the subject of ongoing investigations conducted with the Environmental Protection Agency (EPA) under the Resource Conservation and Recovery Act (RCRA). The investigation began in the early 1980s and involved a review of onsite and offsite envi-ronmental impacts.
In December 1999, the Company increased its accrual for the cost of addressing environmental impacts associated with its Coors Road facility by $10,000,000 pre-tax. This increase to the accrual was in response to a Consent Decree settling lawsuits, as well as a related administrative enforcement action, and covered costs expected to be incurred over the next thirty years.
At June 30, 2006, Sparton has accrued $6,287,000 as its best estimate of the remaining minimum future undiscounted financial liability with respect to this matter, of which $491,000 is classified as a current liability and included on the balance sheet in other accrued liabilities. The Company’s minimum cost estimate is based upon existing technology and excludes legal and related consulting costs, which are expensed as incurred. The Company’s estimate includes equipment and operating and maintenance costs for onsite and offsite pump and treat containment systems, as well as continued onsite and offsite monitoring. It also includes periodic reporting requirements.
Factors which cause uncertainties for the Company include, but are not limited to, the effectiveness of the current work plans in achieving targeted results and proposals of regulatory agencies for desired methods and outcomes. It is possible that cash flows and results of operations could be significantly affected by the impact of changes associated with the ultimate resolution of this contingency. Uncertainties associated with environmental remediation contingencies are pervasive and often result in wide ranges of reasonably possible outcomes. Estimates developed in the early stages of remediation can vary significantly. Normally a finite estimate of cost does not become fixed and determinable at a specific point in time. Rather, the costs associated with environmental remediation become estimable over a continuum of events and activities that help to frame and define a liability. It is possible that cash flows and results of operations could be materially affected by the impact of the ultimate resolution of this contingency.
In fiscal 2003, Sparton reached an agreement with the United States Department of Energy (DOE) and others to recover certain remediation costs. Under the settlement terms, Sparton received $4,850,000 cash and the DOE agreed to reimburse

Sparton Corporation 2006 A
nnual Report
46
NYSE:SPA
Sparton for 37.5% of certain future environmental expenses in excess of $8,400,000 incurred from the date of settlement. With the settlement, Sparton received cash and obtained some degree of risk protection, with the DOE agreeing to reimburse future costs incurred above the established level.
In 1995, Sparton Corporation and Sparton Technology Inc. (STI) filed a Complaint in the Circuit Court of Cook County, Il-linois, against Lumbermens Mutual Casualty Company and American Manufacturers Mutual Insurance Company demanding reimbursement of expenses incurred in connection with its remediation efforts at the Coors Road facility based on various primary and excess comprehensive general liability policies in effect between 1959 and 1975. In 1999, the Complaint was amended to add various other excess insurers, including certain London market insurers and Fireman’s Fund Insurance Company. In June 2005, Sparton reached an agreement under which Sparton received $5,455,000 in cash in July 2005. This agreement reflects a recovery of a portion of past costs the Company incurred in its investigation and site remediation efforts, which began in 1983, and was recorded as income in June of fiscal 2005. The Company continues to pursue ad-ditional recoveries from excess carriers. The probability and amounts of recovery are uncertain at this time.
Customer Relationships
In September 2002, STI filed an action in the U.S. District Court for the Eastern District of Michigan to recover certain unreimbursed costs incurred as a result of a manufacturing relationship with two entities, Util-Link, LLC (Util-Link) of Delaware and National Rural Telecommunications Cooperative (NRTC) of the District of Columbia. On or about October 21, 2002, the defendants filed a counterclaim seeking money damages alleging that STI breached its duties in the manufac-ture of products for the defendants. The defendant NRTC asked for damages in the amount of $20 million for the loss of its investment in and loans to Util-Link. In addition, the defendant Util-Link had asked for damages in the amount of $25 million for lost profits. Sparton had reviewed these claims and believed they were duplicative. Util-Link did not pursue its claim at the below discussed trial.
The jury trial commenced on September 19, 2005 and concluded on November 9, 2005. The jury awarded Sparton dam-ages in the amount of $3.6 million, of which approximately $1.9 million represented costs related to the acquisition of raw materials. These costs were previously deferred and are included in other long-term assets on the Company’s June 30, 2006 balance sheet. As expected, there were post-trial proceedings, including motions by the defendant NRTC for judgment as matter of law on its counterclaim and a motion for new trial. On March 27, 2006, the trial court denied the defendant NRTC’s motion for judgment on its counter claim as a matter of law and granted the motion for new trial unless Sparton accepted a reduction of the judgment. Sparton accepted the reduction, which reduced the collective judgment in its favor to $1.9 million, which would enable the Company to recover the deferred costs and, accordingly, there would be no significant impact on operating results. An amended judgment was entered for $1.9 million in Sparton’s favor on April 5, 2006. Additional post trial proceedings may be conducted. On May 1, 2006, NRTC filed an appeal of the judgment, which could impact the ultimate result.
The Company has pending an action before the Federal Court of Claims to recover damages arising out of an alleged in-fringement by the U.S. Navy of certain patents held by Sparton and used in the production of sonobuoys. The case was dismissed on summary judgment, however, the decision of the Court of Claims was reversed by the Court of Appeals. The case is currently scheduled for trial in the first calendar quarter of 2007. The likelihood that the claim will be resolved and the extent of any recovery in favor of the Company is unknown at this time.
Product Issues
Some of the printed circuit boards supplied to the Company for its aerospace sales have been discovered to be defective. The defect occurred during production at the board supplier’s facility, prior to shipment to Sparton for further processing. Sparton; the board manufacturer, Electropac Co., Inc.; and our customer, who received the defective boards, have contained the defective boards. While investigations are underway, $2.9 million of related product and associated expenses have been classified in Sparton’s balance sheet within other long-term assets as of June 30, 2006 ($2.4 million as of June 30, 2005). In August 2005, Sparton Electronics Florida, Inc. filed an action in U.S. District Court of Florida against Electropac Co., Inc. to recover these costs. The likelihood that the claim will be resolved and the extent of Sparton’s exposure, if any, is unknown at this time. No loss contingency has been established at June 30, 2006.

Sparton Corporation 2006 A
nnual Report
47
NYSE:SPA
11. SELECTED QUARTERLY FINANCIAL DATA (UNAUDITED) - The following unaudited information presents selected financial performance measures by quarter for each of the years ended June 30, 2006 and 2005, respectively:
First Second Third Fourth Astro Quarter Quarter Quarter Quarter InstrumentationNet sales 2006 $37,306,118 $37,693,154 $45,303,199 $50,502,511 $3,358,398 2005 $45,188,315 $34,526,907 $41,561,001 $45,880,586 -Gross profit 2006 $1,694,560 $3,783,068 $4,651,680 $3,922,713 $456,563 2005 $6,466,716 $3,476,373 $3,322,451 $4,842,961 -Net income (loss) 2006 $(1,298,946) $201,805 $727,332 $468,165 $97,544 2005 $2,413,598 $452,641 $308,307 $4,937,612 -
Earnings (loss) per share - basic 2006 $(0.14) $0.02 $0.08 $0.05 - 2005 $0.26 $0.05 $0.03 $0.54 -Earnings (loss) per share - diluted 2006 $(0.14) $0.02 $0.08 $0.05 - 2005 $0.26 $0.05 $0.03 $0.53 -
Fourth quarter performance shown above includes one month of operations in fiscal 2006 for Astro Instrumentation, Inc. (Astro), the Company’s recently acquired wholly owned subsidiary. The amounts included are reflective of Astro’s opera-tions for the month of June 2006, which are also listed separately above.
In the fourth quarter of fiscal 2006, the Company experienced significant completion issues on several government sonobuoy programs, resulting in cost-to-complete adjustments adversely impacting operating results by $903,000 during the quarter. In addition, two medical programs incurred negative margins of $269,000 during the fourth quarter. The issues related to these losses are being addressed.
Net income increased by $219,000 in the fourth quarter of fiscal 2006 due to the lower than expected effective tax rate (benefit) of (133%). The tax rate used in earlier fiscal 2006 quarters was based on anticipated financial results which did not materialize. The effective tax rate used for earlier fiscal 2006 periods was based upon expected higher fourth quarter earnings and less of an impact from the continuing slide of the U.S. dollar against the Canadian dollar. The combination of these factors in the fourth quarter, and the final tax provision calculation, greatly affected the final tax benefit in the fourth quarter in a manner not previously anticipated.
Pre-tax income in the fourth quarter of fiscal 2005 was increased by $5.5 million, the result of the Company’s settlement with previous insurance carriers previously discussed. In addition, the Company also settled negotiations with a Canadian customer for past costs and inventory, which had been carried as a long-term asset, resulting in the receipt of approximately $1 million cash, with a loss recognized of approximately $400,000. Finally, approximately $600,000 of obsolete inventory was written off in the fourth quarter of fiscal 2005. Pre-tax income in the fourth quarter of fiscal 2005 also included a gain of $397,000, which reflects the sale of a warehouse.
Translation adjustments for our Canadian and Vietnamese facilities, along with gains and losses from foreign currency trans-actions, are included in current earnings and, in the aggregate, amounted to income (expense) of $287,000 and ($416,000), during the fourth quarter of the fiscal years ended June 30, 2006 and 2005, respectively.
12. BUSINESS, GEOGRAPHIC, AND SALES CONCENTRATION - The Company operates in one business segment, electronic manufacturing services (EMS).
Sales to individual customers in excess of 10% of total sales for the year were as follows:
Customer 2006 2005 2004 Bally 20% 13% * Honeywell 19% 28% 25%
(*) denotes sales were below 10% of total.

Sparton Corporation 2006 A
nnual Report
48
NYSE:SPA
Sales to U.S. government agencies, primarily anti-submarine warfare (ASW) devices produced for the Navy, were $37,199,000 in fiscal 2006, $28,510,000 in fiscal 2005, and $39,169,000 in fiscal 2004.
The Company’s net sales were made to customers located in the following countries:
2006 2005 2004 United States $152,200,000 $149,841,000 $153,231,000Canada 14,210,000 8,584,000 3,432,000Other foreign countries (1) 4,395,000 8,732,000 4,341,000 Consolidated total $170,805,000 $167,157,000 $161,004,000
(1) No single country accounted for 10% or more of export sales in the fiscal years ended 2006, 2005, or 2004.
Included in fiscal 2006 shown above is one month of sales activity for Astro, which geographically is as follows: United States $1,636,000, Canada $0, and other foreign countries $1,722,000. Astro’s foreign sales are primarily to Ireland.
ASW devices and related engineering contract services to the U.S. government and foreign countries contributed approxi-mately $36,674,000 (22%), $27,151,000 (16%), and $36,354,000 (23%), respectively, to total sales for the fiscal years ended June 30, 2006, 2005 and 2004, respectively.
The Company’s property, plant and equipment, presented net of accumulated depreciation, are located in the United States, Canada and Vietnam as follows as of June 30:
2006 2005 United States $13,145,000 $11,272,000Canada 1,065,000 1,264,000Vietnam 3,389,000 3,895,000 Consolidated total $17,599,000 $16,431,000
Included as of June 30, 2006, in the above property, plant and equipment total located in the United States, is $3.2 million of property, plant and equipment recently acquired in the Astro purchase.
13. BUSINESS ACQUISITION - On May 31, 2006, the Company announced that a membership purchase agreement was signed, and the acquisition of Astro Instrumentation, LLC (“Astro”) was completed. The newly acquired entity was named Astro Instrumentation, Inc., incorporated in the state of Michigan, and is operating as a wholly owned subsidiary of Sparton Corporation. Astro was a privately owned EMS provider located in Strongsville, Ohio that had been in business as Astro for approximately 5 years. Astro’s sales volume for its year ended December 31, 2005, was approximately $34 million. The acquisition of Astro furthered the Company’s strategy of identifying, evaluating and purchasing potential acquisition candidates in both the defense and medical device markets.
The purchase price as of the acquisition date was approximately $26.15 million, plus the extinguishment by Sparton at closing of $4.22 million in seller credit facilities and the assumption of $2.32 million in bonded debt. The purchase price was funded using a combination of cash, $10 million in bank debt, and $7.5 million in notes payable to Astro’s previous owners (sellers). Additional contingent cash purchase consideration may be paid to the sellers over the four years following the closing based on 20% of Astro’s earnings before interest, depreciation and taxes as defined, and if paid will be added to goodwill. This additional contingent consideration, which will begin to be measured with the start of the next fiscal year on July 1, 2006, will be based annually on Astro’s fiscal 2007-2010 performance.

Sparton Corporation 2006 A
nnual Report
49
NYSE:SPA
The acquisition has been accounted for using the purchase method in accordance with SFAS No. 141, Business Combinations; accordingly, the operating results of Astro are included in these consolidated financial statements for the one month period since the acquisition date. The following table presents the allocation of the aggregate purchase price for the Astro acquisition based on the estimated fair values of assets acquired, including intangibles, and liabilities assumed:
Net working capital: Cash and cash equivalents $ 809,000 Accounts receivable 4,101,000 Inventories 9,817,000 Prepaid expenses and other current assets 83,000 Total current assets 14,810,000 Less: Total non-debt current liabilities (6,274,000) Total net working capital 8,536,000Property, plant and equipment 2,884,000Other assets 34,000Goodwill and other intangible assets 21,739,000 Total purchase price $33,193,000
Cash consideration, paid at closing $18,650,000Seller notes issued 7,500,000 26,150,000Direct acquisition costs 500,000 26,650,000Seller long-term liabilities extinguished at closing or assumed 6,543,000 Total consideration exchanged $33,193,000
The components of the intangible assets identified above as of the acquisition date considered a number of factors, including the utilization of an independent, third party appraisal and are summarized as follows:
Remaining Amount Useful LifeAmortizable identified intangibles: Customer relationships $ 6,600,000 15 yrs Covenants not to compete 165,000 4 yrs 6,765,000Goodwill 14,974,000 - Total intangible assets purchased $21,739,000
The customer relationships and noncompetition agreements are being amortized using the straight-line method based on estimated weighted undiscounted cash flows over their estimated useful lives. The straight-line method is being used to amortize the identified intangibles because the Company does not believe an accelerated pattern of consumption of these assets can be reliably determined, and expected undiscounted cash flows are reasonably consistent with a more ratable decline in value over time. The implied value of goodwill, which is deductible for income tax purposes, is derived from consideration of a number of factors, including the experience of the assembled work force, and related production know-how and technical proficiency in place to support and augment Astro’s production, design, and development capabilities in the highly specialized fluid science and diagnostic laboratory equipment niche of the complex medical device industry, which management believes favorably positions Astro as a supply source for significant potential new customers seeking to outsource electromechancial contract manufacturing and assembly activities.
The unaudited pro forma consolidated net sales, net income and diluted earnings per share for each of the fiscal years ended June 30, 2006 and 2005, would have been as follows had the acquisition of Astro been made at the beginning of the respective periods:
2006 2005 Net sales $204,550,000 $201,208,000
Net income (loss) $(345,000) $7,509,000
Earnings (loss) per share Basic $(0.04) $0.85 Diluted $(0.04) $0.84

Sparton Corporation 2006 A
nnual Report
50
NYSE:SPA
The pro forma results above reflect interest on the debt assumed or issued to fund part of the purchase price, assuming the acquisition occurred as of July 1, 2004, with interest calculated at rates assumed to have been in effect for the respective period. These pro forma amounts assume income taxes imputed at the Company’s consolidated effective income tax rate for the respective years.
The unaudited pro forma amounts are not intended to represent or necessarily be indicative of the Company’s consolidated results that would have occurred if the Astro acquisition had been completed as of the beginning of the periods presented and, therefore, should not be taken as indicative of the Company’s future consolidated operating results.
14. GOODWILL AND OTHER INTANGIBLES - The Company follows SFAS No. 141, Business Combinations (SFAS No. 141), and SFAS No. 142, Goodwill and Other Intangible Assets (SFAS No. 142). SFAS No. 141 requires that the purchase method of accounting be used for all business combinations initiated after June 30, 2001. SFAS No. 141 also specifies the criteria applicable to intangible assets acquired in a purchase method business combination to be recognized and reported apart from goodwill. SFAS No. 142 requires that goodwill and intangible assets with indefinite useful lives no longer be amortized, but instead be tested for impairment, at least annually. Cybernet goodwill is reviewed for impairment regularly, while goodwill and other intangibles related to the Astro purchase is expected to occur in April 2007. SFAS No. 142 also requires that intangible assets with definite useful lives be amortized over their estimated useful lives to their estimated residual values and be reviewed regularly for impairment. The change in the carrying amounts of goodwill and amortizable intangibles during the year ended June 30, 2006 are as follows (there were no changes during the year ended June 30, 2005):
Amortizable Total Goodwill Intangibles Intangibles Beginning balance July 1, 2005 $ 770,000 - $ 770,000Astro acquisition 14,974,000 $6,765,000 21,739,000Amortization - (39,000) (39,000)
Ending balance June 30, 2006 $15,744,000 $6,726,000 $22,470,000
Goodwill - The beginning balance of goodwill is related to the Company’s investment in Cybernet Systems Corporation (Cybernet), as more fully described in Note 3. Additional goodwill in the amount of $14,974,000 was recognized upon the Company’s purchase of Astro Instrumentation, LLC (Astro) in May 2006.
Other intangibles - Other intangibles of $6,765,000 were recognized upon the purchase of Astro in May 2006. Other purchased intangibles include non-compete agreements of $165,000 and customer relationships of $6,600,000. These costs will be amortized ratably over 4 years and 15 years, respectively. Amortization during fiscal 2006, recorded for the one month period ended June 30, 2006, amounted to $39,000. Amortization of intangible assets is estimated to be approximately $481,000 for each of the next four years, and approximately $440,000 for each of the subsequent 11 years.
Item 9. Changes in and Disagreements with Accountants on Accounting and Financial Disclosure
In fiscal 2006, there were no changes in the Company’s independent accountants and there have been no disagreements with the Company’s accountants on accounting and financial disclosure.
Item 9(a). Controls and Procedures
The Company maintains internal control over financial reporting intended to provide reasonable assurance that all material transactions are executed in accordance with Company authorization, are properly recorded and reported in the financial statements, and that assets are adequately safeguarded. The Company also maintains a system of disclosure controls and procedures to ensure that information required to be disclosed in Company reports, filed or submitted under the Securities Exchange Act of 1934, is properly reported in the Company’s periodic and other reports.
As of June 30, 2006, an evaluation was updated by the Company’s management, including the CEO and CFO, on the ef-fectiveness of the design and operation of the Company’s disclosure controls and procedures. Based on that evaluation, the Company’s management, including the CEO and CFO, concluded that the Company’s disclosure controls and procedures continue to be effective as of June 30, 2006. There have been no changes in the Company’s internal controls over financial reporting that occurred during the last fiscal quarter that have materially affected, or are reasonably likely to materially af-fect, the Company’s internal control over financial reporting.
Item 9(b). Other Information
None

Sparton Corporation 2006 A
nnual Report
51
NYSE:SPA
PART III
Item 10. Directors and Executive Officers of the Registrant
Directors and Executive Officers of the Registrant - Information with respect to directors is included in the Company’s Proxy Statement under “Election of Directors” and is incorporated herein by reference. Information concerning executive officers is included in Part I, Item 4 of this Annual Report on Form 10-K.
Audit Committee Financial Expert - Information with respect to the audit committee financial expert is included in the Company’s Proxy Statement under the heading “Election of Directors” and is incorporated herein by reference.
Identification and Composition of the Audit Committee - Information with respect to the identification and composi-tion of the audit committee is included in the Company’s Proxy Statement under the heading “Election of Directors” and is incorporated herein by reference.
Compliance with Section 16(a) of the Exchange Act - Information with respect to the compliance with Section 16(a) of the Exchange Act is included in the Company’s Proxy Statement under the heading “Section 16(a) Beneficial Ownership Reporting Compliance” and is incorporated herein by reference.
Code of Ethics - Information with respect to the Company’s Governance Guidelines and the Code of Ethics is available at the Company’s website www.sparton.com under the heading “Investor Relations”. The Company’s Code of Ethics as currently in effect (together with any amendments that may be adopted from time to time) is posted on the website. To the extent any waiver is granted with respect to the Code of Ethics that requires disclosure under applicable SEC rules, such waiver will also be posted on the website.
Item 11. Executive Compensation
Information concerning executive compensation is included under “Compensation of Executive Officers” in the Proxy Statement and is incorporated herein by reference.
Item 12. Security Ownership of Certain Beneficial Owners and Management and Related Stockholder Matters
Information on management and certain other beneficial ownership of the Company’s common stock is included under “Outstanding Stock and Voting Rights” in the Proxy Statement and is incorporated herein by reference.
The following table summarizes information about the Company’s Common Stock that may be issued upon the exercise of options, warrants and rights under all of the Company’s equity compensation plans as of June 30, 2006.
Number of securities remaining available for Number of securities to be issued upon exercise Weighted-average exercise price of future issurance under equity compensation plans of outstanding options, warrants and rights outstanding options, warrants and rights (excluding securities reflected in column (a))
(a) (b) (c) Equity compensation plans approved by security holders 517,070 $7.02 164,484Equity compensation plans not approved by security holders - - -
Item 13. Certain Relationships and Related Transactions
Information as to certain relationships and related transactions is included under “Certain Relationships and Transactions” in the Proxy Statement and is incorporated herein by reference.
Item 14. Principal Accountant Fees and Services
Information with respect to principal accountant fees and services, as well as information regarding the Audit Committee’s pre-approval policies and procedures regarding audit and other services, is included under “Relationship with Independent Auditors” in the Proxy Statement and is incorporated herein by reference.

Sparton Corporation 2006 A
nnual Report
52
NYSE:SPA
PART IV
Item 15. Exhibits and Financial Statement Schedules
(a) Documents filed as part of this report on Form 10-K
1. Financial Statements - The consolidated financial statements are set forth under Item 8 of this report on Form 10-K.
2. Financial Statement Schedule(s) - Schedule II - Valuation and Qualifying Accounts (Consolidated)
Changes in the allowance for probable losses on receivables for the years ended June 30:
2006 2005 2004 Balance at beginning of period $ 6,000 $ 46,000 $739,000 Charged to expense (income) 74,000 (47,000) 28,000 Write-offs, net of recoveries (13,000) 7,000 (721,000) Balance at end of period $67,000 $ 6,000 $ 46,000
Reserves deducted from inventory in the balance sheets for the years ended June 30:
2006 2005 2004 Balance at beginning of period $4,042,000 $3,944,000 $2,916,000 Charged to costs and expenses 800,000 2,143,000 2,819,000 Deductions (*) (1,313,000) (2,045,000) (1,791,000) Balance at end of period $3,529,000 $4,042,000 $3,944,000
(*) Deductions from the inventory reserve accounts represent obsolete or unsaleable inventory written off and/or disposed of.
All other schedules have been omitted since the required information is not present or not present in amounts suf ficient to require submission of the schedule, or because the information required is included in the consolidated financial statements or the notes thereto.
3. Exhibits - A list of the Exhibits filed as part of this report is set forth in the Exhibit Index that immediately precedes such Exhibits and is incorporated herein by reference.

Sparton Corporation 2006 A
nnual Report
53
NYSE:SPA
SIGNATURES
Pursuant to the requirements of Section 13 or 15(d) of the Securities Exchange Act of 1934, the Registrant has duly caused this report to be signed on its behalf by the undersigned, thereunto duly authorized.
Date: August 31, 2006 SPARTON CORPORATION Richard L. Langley, Chief Financial Officer (Principal Accounting and Financial Officer)
Pursuant to the requirements of the Securities Exchange Act of 1934, this report has been signed below by the following persons on behalf of the Registrant and in the capacities and on the dates indicated.
SIGNATURE AND TITLE DATE
By /s/ BRADLEY O. SMITH August 31, 2006 Bradley O. Smith, Chairman of the Board of Directors
By /s/ DAVID W. HOCKENBROCHT August 31, 2006 David W. Hockenbrocht, Chief Executive Officer, President and Director
By /s/ RICHARD L. LANGLEY August 31, 2006 Richard L. Langley, Chief Financial Officer, Senior Vice President, Treasurer and Director
By /s/ JAMES N. DEBOER August 31, 2006 James N. DeBoer, Director
By /s/ JAMES D. FAST August 31, 2006 James D. Fast, Director
By /s/ DR. RICHARD J. JOHNS August 31, 2006 Dr. Richard J. Johns, Director
By /s/ DAVID P. MOLFENTER August 31, 2006 David P. Molfenter, Director
By /s/ WILLIAM I. NOECKER August 31, 2006 William I. Noecker, Director
By /s/ W. PETER SLUSSER August 31, 2006 W. Peter Slusser, Director

Sparton Corporation 2006 A
nnual Report
54
NYSE:SPA
EXHIBIT INDEX
Exhibit No.
2 Membership Purchase Agreement for the acquisition of Astro Instrumentation, LLC was filed with Form 8-K on June 2, 2006, and is incorporated herein by reference.
3 and 4 Amended Articles of Incorporation of the Registrant were filed with Form 10-Q for the three-month period ended September 30, 2004, and are incorporated herein by reference.
Amended Code of Regulations of the Registrant were filed with Form 10-Q for the three-month period ended September 30, 2004, and are incorporated herein by reference.
Amended Bylaws of the Registrant were filed with Form 10-Q for the three-month period ended March 31, 2004, and are incorporated herein by reference.
22 Subsidiaries (filed herewith and attached)
23 Consent of independent registered public accounting firm (filed herewith and attached)
31.1 Chief Executive Officer certification under Section 302 of the Sarbanes-Oxley Act of 2002.
31.2 Chief Financial Officer certification under Section 302 of the Sarbanes-Oxley Act of 2002.
32.1 Chief Executive Officer certification pursuant to 18 U.S.C. Section 1350, as adopted pursuant to Section 906 of the Sarbanes-Oxley Act of 2002.
32.2 Chief Financial Officer certification pursuant to 18 U.S.C. Section 1350, as adopted pursuant to Section 906 of the Sarbanes-Oxley Act of 2002.

Sparton Corporation 2006 A
nnual Report
55
NYSE:SPA
EXHIBIT 22SUBSIDIARIES
The Registrant, Sparton Corporation, an Ohio Corporation, had the following subsidiaries at June 30, 2006:
Domestic Operations: Incorporated In: Sparton Electronics Florida, Inc. Florida Sparton Technology, Inc. New Mexico Spartronics, Inc. Michigan Astro Instrumentation, Inc. Michigan
Foreign Operations: Incorporated In: Sparton of Canada, Limited Ontario, Canada Spartronics Vietnam Co., LTD Vietnam
EXHIBIT 23CONSENT OF INDEPENDENT REGISTERED PUBLIC ACCOUNTING FIRM
We hereby consent to the incorporation by reference in the Registration Statement (Form S-8 No. 33-43703) pertaining to the Sparton Corporation 1989 Stock Option Plan and in the Registration Statement (Form S-8 No. 333-46804) pertaining to the Amended and Restated Sparton Corporation Stock Incentive Plan of our report dated August 25, 2006, relating to the consolidated financial statements and schedule of Sparton Corporation and subsidiaries, which appears in this Form 10-K.
Grand Rapids, Michigan September 13, 2006

Sparton Corporation 2006 A
nnual Report
56
NYSE:SPA
EXHIBIT 31.1
CERTIFICATION UNDER SECTION 302 OF THE SARBANES-OXLEY ACT OF 2002
I, David W. Hockenbrocht, certify that:
1. I have reviewed this Annual Report on Form 10-K of Sparton Corporation;
2. Based on my knowledge, this report does not contain any untrue statement of a material fact or omit to state a material fact necessary to make the statements made, in light of the circumstances under which such statements were made, not misleading with respect to the period covered by this report;
3. Based on my knowledge, the financial statements, and other financial information included in this report, fairly present in all material respects the financial condition, results of operations and cash flows of the registrant as of, and for, the periods presented in this report;
4. The registrant’s other certifying officer and I are responsible for establishing and maintaining disclosure controls and procedures (as defined in Exchange Act Rules 13a-15(e) and 15d-15(e)) for the registrant and have:
(a) Designed such disclosure controls and procedures, or caused such disclosure controls and procedures to be designed under our supervision, to ensure that material information relating to the registrant, including its consolidated subsidiaries, is made known to us by others within those entities, particularly during the period in which this annual report is being prepared;
(b) Evaluated the effectiveness of the registrant’s disclosure controls and procedures and presented in this report our conclusions about the effectiveness of the disclosure controls and procedures, as of the end of the period covered by this report based on such evaluation; and
(c) Disclosed in this report any change in the registrant’s internal control over financial reporting that occurred during the registrant’s most recent fiscal quarter (the registrant’s fourth fiscal quarter in the case of an annual report) that has materially affected, or is reasonably likely to materially affect, the registrant’s internal control over financial reporting; and
5. The registrant’s other certifying officer and I have disclosed, based on our most recent evaluation of internal control over financial reporting, to the registrant’s auditors and the audit committee of registrant’s board of directors (or persons performing the equivalent functions):
(a) All significant deficiencies and material weaknesses in the design or operation of internal control over financial reporting which are reasonably likely to adversely affect the registrant’s ability to record, process, summarize and report financial information; and
(b) Any fraud, whether or not material, that involves management or other employees who have a significant role in the registrant’s internal control over financial reporting.
Date: August 31, 2006
David W. Hockenbrocht, Chief Executive Officer

Sparton Corporation 2006 A
nnual Report
57
NYSE:SPA
EXHIBIT 31.2
CERTIFICATION UNDER SECTION 302 OF THE SARBANES-OXLEY ACT OF 2002
I, Richard L. Langley, certify that:
1. I have reviewed this Annual Report on Form 10-K of Sparton Corporation;
2. Based on my knowledge, this report does not contain any untrue statement of a material fact or omit to state a material fact necessary to make the statements made, in light of the circumstances under which such statements were made, not misleading with respect to the period covered by this report;
3. Based on my knowledge, the financial statements, and other financial information included in this report, fairly present in all material respects the financial condition, results of operations and cash flows of the registrant as of, and for, the periods presented in this report;
4. The registrant’s other certifying officer and I are responsible for establishing and maintaining disclosure controls and procedures (as defined in Exchange Act Rules 13a-15(e) and 15d-15(e)) for the registrant and have:
(a) Designed such disclosure controls and procedures, or caused such disclosure controls and procedures to be designed under our supervision, to ensure that material information relating to the registrant, including its consolidated subsidiaries, is made known to us by others within those entities, particularly during the period in which this annual report is being prepared;
(b) Evaluated the effectiveness of the registrant’s disclosure controls and procedures and presented in this report our conclusions about the effectiveness of the disclosure controls and procedures, as of the end of the period covered by this report based on such evaluation; and
(c) Disclosed in this report any change in the registrant’s internal control over financial reporting that occurred during the registrant’s most recent fiscal quarter (the registrant’s fourth fiscal quarter in the case of an annual report) that has materially affected, or is reasonably likely to materially affect, the registrant’s internal control over financial reporting; and
5. The registrant’s other certifying officer and I have disclosed, based on our most recent evaluation of internal control over financial reporting, to the registrant’s auditors and the audit committee of registrant’s board of directors (or persons performing the equivalent functions):
(a) All significant deficiencies and material weaknesses in the design or operation of internal control over financial reporting which are reasonably likely to adversely affect the registrant’s ability to record, process, summarize and report financial information; and
(b) Any fraud, whether or not material, that involves management or other employees who have a significant role in the registrant’s internal control over financial reporting.
Date: August 31, 2006
Richard L. Langley, Chief Financial Officer

Sparton Corporation 2006 A
nnual Report
58
NYSE:SPA
EXHIBIT 32.1
CERTIFICATION PURSUANT TO18 U.S.C. SECTION 1350,
AS ADOPTED PURSUANT TOSECTION 906 OF THE SARBANES-OXLEY ACT OF 2002
In connection with the Annual Report of Sparton Corporation (the “Company”) on Form 10-K for the year ending June 30, 2006, as filed with the Securities and Exchange Commission on the date hereof (the “Annual Report”), I, David W. Hockenbrocht, Chief Executive Officer of the Company, certify, pursuant to 18 U.S.C. § 1350, as adopted pursuant to § 906 of the Sarbanes-Oxley Act of 2002, that:
1. The Annual Report fully complies with the requirements of section 13(a) or 15(d) of the Securities Exchange Act of 1934; and
2. The information contained in the Annual Report fairly presents, in all material respects, the financial condition and results of operations of the Company.
Date: August 31, 2006. David W. Hockenbrocht, Chief Executive Officer
EXHIBIT 32.2
CERTIFICATION PURSUANT TO18 U.S.C. SECTION 1350,
AS ADOPTED PURSUANT TOSECTION 906 OF THE SARBANES-OXLEY ACT OF 2002
In connection with the Annual Report of Sparton Corporation (the “Company”) on Form 10-K for the year ending June 30, 2006, as filed with the Securities and Exchange Commission on the date hereof (the “Annual Report”), I, Richard L. Langley, Chief Financial Officer of the Company, certify, pursuant to 18 U.S.C. § 1350, as adopted pursuant to § 906 of the Sarbanes-Oxley Act of 2002, that:
1. The Annual Report fully complies with the requirements of section 13(a) or 15(d) of the Securities Exchange Act of 1934; and
2. The information contained in the Annual Report fairly presents, in all material respects, the financial condition and results of operations of the Company.
Date: August 31, 2006 Richard L. Langley, Chief Financial Officer

Sparton Corporation 2006 A
nnual Report
59
NYSE:SPA
BOARD OF DIRECTORS
James N. DeBoer ............................ Of Counsel Law Firm of Varnum, Riddering, Schmidt and Howlett, LLP Grand Rapids, Michigan (2,3)
James D. Fast .................................. Chief Executive Officer and President Ionia County National Bank (1,4)
Ionia, Michigan
David W. Hockenbrocht .................. Chief Executive Officer and President Sparton Corporation (3)
Richard J. Johns, M.D. .................... Distinguished Service Professor, Emeritus Department of Biomedical Engineering Johns Hopkins University School of Medicine Baltimore, Maryland (4)
Richard L. Langley ........................ Chief Financial Officer, Senior Vice President and Treasurer Sparton Corporation
David P. Molfenter ......................... Retired Vice President Command, Control, Communication and Information Systems Segment Raytheon Systems Company Fort Wayne, Indiana (1,2,4)
William I. Noecker ......................... Chairman, Brasco International Inc. Detroit, Michigan (1,3)
W. Peter Slusser .............................. President, Slusser Associates Inc. New York, New York (2)
Bradley O. Smith ............................ Chairman of the Board Sparton Corporation (3)
COMMITTEE ASSIGNMENTS:(1) Audit committee (2) Compensation committee (3) Executive committee (4) Nominating and Governance committee
CORPORATE OFFICERS
Bradley O. Smith ........................... Chairman of the BoardDavid W. Hockenbrocht ................ Chief Executive Officer and PresidentDouglas E. Johnson ....................... Chief Operating Officer, Executive Vice President and Assistant SecretaryRichard L. Langley ........................ Chief Financial Officer, Senior Vice President and TreasurerJoseph S. Lerczak .......................... Secretary and Corporate Controller
Michael G. Woods ......................... Senior Vice President, Industrial and Aerospace Business Systems and Vice President, General Manager Sparton of Canada, LTD.
Erik J. Fabricius-Olsen ................... Vice President Sales - AerospaceJames M. Lackemacher .................. Vice President Sales - Defense and Security Business SystemsLinda G. Munsey ............................ Vice President Performance ExcellenceDrew G. Richmond ......................... Vice President Sales - IndustrialGlenn E. Staples ............................. Vice President Global Supply ChainCharles A. Stranko ......................... Vice President Sales - International Business Development and Vice President Sparton Technology, Inc.

Sparton Corporation 2006 A
nnual Report
60
NYSE:SPA
Common Stock Ticker symbol: SPA Common stock listed and traded: New York Stock Exchange (NYSE)
Shareowner AssistanceFor address changes, registration changes, lost stock certificates and other shareowner information, please contact:
Principal Transfer Agent Illinois Stock Transfer Company 209 West Jackson Boulevard, Suite 903 Chicago, Illinois 60606-6905 U.S. toll-free (800) 757-5755 or (312) 427-2953 Internet: www.illinoisstocktransfer.com
Corporate Offices 2400 E. Ganson Street Jackson, Michigan 49202 U.S. toll-free (800) 248-9579 Direct (517) 787-8600 Fax (517) 787-1822
Administrative Offices Sparton Electronics Florida, Inc. 5612 Johnson Lake Road DeLeon Springs, Florida 32130 United States
Sparton Technology, Inc. 8500 Bluewater Road NW Albuquerque, New Mexico 87121 United States
Astro Instrumentation, Inc. 22740 Lunn Road Strongsville, OH 44149 United States
Sparton of Canada Ltd. 99 Ash Street London, Ontario N5Z 4V3 Canada Spartronics, Vietnam Co., LTD. 3 VSIP Street 6 Vietnam Singapore Industrial Park Thuan An District, Binh Duong Province Vietnam
SHAREOWNER INFORMATION
Manufacturing Facilities Albuquerque, New Mexico Brooksville, Florida DeLeon Springs, Florida Deming, New Mexico Jackson, Michigan London, Ontario, Canada Strongsville, Ohio Thuan An District, Binh Duong Province, Vietnam
Equal Opportunity PolicyIt is Sparton Corporation’s policy to afford equal employ-ment opportunity to all employees and qualified applicants without regard to race, religion, creed, color, sex, national origin, age, handicap or veteran status.
InternetOur website, www.sparton.com, offers information regard-ing the financial performance, products, services and other useful information about the Company.
Publications and CertificationsAnnual Report, Annual Report on Form 10-K, Quarterly Reports on Form 10-Q, Quarterly Earnings Releases, News Releases, Notice of Annual Meeting of Shareowners and Proxy Statement, are available, free of charge upon request from the company’s Shareowner Relations Depart-ment at the corporate address listed above or by calling toll-free (800) 248-9579. Financial information can also be accessed at www.sparton.com. The Company filed as exhibits to its Annual Report on Form 10-K the CEO and CFO Certifications as required by the Sarbanes-Oxley Act of 2002. The Company also submitted the required Annual CEO Certification to the NYSE.
Notice of Annual MeetingThe Annual Meeting of Shareowners of Sparton Corpo-ration will be held at the Walter F. Ehrnfelt Recreation & Senior Complex, 18100 Royalton Road, Strongsville, Ohio 44136, on Wednesday, October 25, 2006, at 10:00 a.m. Shareowners are cordially invited to attend. The record date for the Annual Meeting was September 15, 2006.
Proxy VotingShareowners of Record may vote their proxies by mail-ing the completed, signed, and dated proxy card. If your shares are held in street name with a bank or brokerage firm, you may also be able to vote over the internet or by telephone. For more information on how to vote street name shares, please consult the information provided by your bank or broker.
Investors who are interested in purchasing stock in Sparton Corporation must make the purchase through a bank or broker. Sparton does not sell shares directly to the public.

Sparton Corporation 2006 Annual MeetingWednesday, October 25, 2006
10:00 a.m. local time
Walter F. EhrnfeltRecreation and Senior Complex
18100 Royalton RoadStrongsville, Ohio 44136
(440) 878-6000
Direction and Map (Strongsville is approximately 20 miles south of Cleveland)
I-71 to the Strongsville Route 82 West Exit (Royalton Road)
Take Route 82 West approximately 1 mile to The Greens of Strongsville. Turn right into the Target drive. Follow signs to the Recreation Complex.

Corporate Offices
Sparton Corporation2400 East Ganson StreetJackson, Michigan 49202(517) 787-8600FAX: (517) 787-1822
United States Locations
Albuquerque8500 Bluewater Road, NWAlbuquerque, New Mexico 87121(505) 892-5300FAX: (505) 892-5515
Brooksville30167 Power Line RoadBrooksville, Florida 34602(352) 799-6520FAX: (352) 796-7482
International Locations
International Purchasing Office391 A Orchard Road #13-08Ngee Ann City Tower ASingapore 238873011 65-6838-5240
London99 Ash StreetLondon, Ontario, Canada N5Z 4V3(519) 455-6320FAX: (519) 452-3967
Spartronics Inc.3 VSIP Street 6Vietnam Singapore Industrial ParkThuan An DistrictBinh Duong Province, Vietnam011 (84-650) 784-890
www.sparton.comwww.spartronics.comwww.astroinst.com
DeLeon Springs5612 Johnson Lake RoadDeLeon Springs, Florida 32130(386) 985-4631FAX: (386) 985-5036
Deming2400 Atlantic WayDeming, New Mexico 88030(505) 546-2686FAX: (505) 546-8462
Jackson2400 East Ganson StreetJackson, Michigan 49202(517) 787-8600FAX: (517) 787-8046
StrongsvilleAstro22740 Lunn RoadStrongsville, Ohio 44149(440) 878-4630FAX: (440) 878-4636
Our Success Begins Here
2006 ANNUAL REPORT
Sparton Corporation
2006 Annual Report