Corporate Housing Industry Report 2017 - · PDF file2 The corporate housing industry...
17
Transcript of Corporate Housing Industry Report 2017 - · PDF file2 The corporate housing industry...


Corporate Housing Industry Report 2017
March 2017
Dear Corporate Housing Colleagues and Partners:
Successful companies rely on research and data to make informed business decisions. With today’s lodging sectorbecoming more confused by so many options, it’s imperative that corporate housing providers have access to a credible source of third-party, objective data.
This year’s Corporate Housing Industry Report provides national, regional and local data to better inform yourcompany’s decisions and educate clients on your value. The report includes data from 62 North American Metropolitan Statistical Areas (MSAs), allowing you to compare your company’s metrics against these industry benchmarks.
Here are a few highlights on the North American corporate housing industry:
• US corporate housing revenues increased 10.2%, to $3.2 billion in 2016. Canadian revenue is an estimated $278 million.
• US corporate housing inventory is estimated at 66,863 units while Canada adds approximately another 6,700rental units.
• Occupancy in the US was down slightly to 87.2%; Canadian occupancy increased to 83.3%.• Overall, US corporate housing average daily rate (ADR) increased to $150.44 in 2016; ADR in Canada
increased to $136.67.
This Executive Summary concisely reports the industry in North America. Regional comparisons help you determinetrends in your company’s key markets and rank your operations. Strategize your company’s performance by comparing occupancy, average rate and length of stay throughout North America. Read on for all this and more.
We look forward to supporting your company as we grow the corporate housing industry together.
Best regards,
Tania Odabashian, CCHP, CPA Mary Ann Passi, CAE Mark Skinner, ISHCChairman, CHPA CEO PartnerCorporate Apartment Specialists CHPA The Highland Group

1
In 2016, the industry hit its revenue peak, with revenue for the US corporate housing industry estimated at $3.2 billion, a 10.2% increase over 2015. For the fourth successive year, the supply of US corporate housing units increased. Average daily rate (ADR) rose6.3% in 2016, approximately double the growth in overall hotel ADR, according to STR.
Based on an estimated 6,703 units, the Canadian corporate housing industry generates room revenues of $278 million annually, a6.9% increase from 2015. However, we believe the Canadian industry is significantly larger than annual revenues currently indicateas only a portion of Canadian companies participate in this survey.
This report summarizes 56 US markets and six markets in Canada based on 96 North American company respondents, representinginternational, national, regional, provincial and local companies. Each market is specifically and individually highlighted later in thisreport.
United States
Executive Summary and Statistical Highlights
US Inventory
Source: The Highland GroupNote: Survey methodology different after 2001. Data not available for 2003 and 2004.

2
The corporate housing industry experienced the fourth successive year of growth in 2016. Supply of corporatehousing units increased to 66,863 in 2016. Unit supply was 4.7% higher than in 2015.
Unit supply has grown 14.2% since 2012. As residential apartment construction increased, the availability of unitsfor lease grew and the supply of corporate housing rose. Corporate housing providers have the flexibility to adjustinventory or add/drop units to respond to client demand. Unit inventory usually increases during expansionary periods (such as 2002 through 2007, when inventory grew by more than 45 percent).
In 2016, the increase in supply and small decline in occupancy meant that corporate housing unit demand increased3.7% over 2015. By comparison, overall hotel demand grew 1.7% in 2016 according to STR. With record construction of extended-stay hotel rooms, this segment’s demand rose 5.4% in 2016 compared to 2015.
United States
Source: The Highland Group

3
Because corporate housing supply is dynamic, the number of room nights corporate housing accommodates hasgreater variability when compared to hotels. Obtaining inventory at acceptable rents is highly correlated with theresidential apartment market. It is very unlikely that the true demand for corporate housing was lower in 2012 compared to 2011; but units occupied declined because corporate housing providers could not get inventory.
The number of occupied units has increased 12.5% since 2012. As residential apartment construction increased,the availability of units grew, as did accommodated demand. Recent research by Integra Realty Resources reportedthat the cyclical peak of apartment construction is expected in the next one to two years, indicating unit availabilityfor corporate housing should be higher in 2017.
Demand Variation
Source: The Highland Group
United States

4
Survey data is collected on the various types of corporate housing units including studio, one, two, three-bedroomand other number of rooms. This mix has been fairly consistent for the past nine years, with one-bedroom unitsmaking up 48% to 51% of inventory. There was minimal change to this unit mix between 2016 and 2015.
One and two-bedroom apartments are the mainstay in smaller MSAs and in suburban sub-markets. In smallerMSAs, the mix of units can change substantially from year to year.
Units by Type
Source: The Highland Group
United States

5
Overall occupancy in the US corporate housing industry decreased almost a percentage point to 87.2% in 2016from 2015. Although occupancy dropped below 88% for the first time since 1999, demand for corporate housingis at its highest since 2008.
Occupancy (Vacancy)
Source: The Highland GroupNote: Data not available for 2003 and 2004
United States

6
Individual markets, or MSAs, reported a wide range of ADR growth and decline. In 51 reporting MSAs, only 16reported lower ADR in 2016. Most ADR declines, such as in Chicago suburbs and Miami, were the result of an increase in lower priced units. MSAs and sub-markets reporting the strongest gains included San Francisco EastBay (75%), Oklahoma City (34%) and Greensboro/Winston Salem (26%).
Corporate housing, hotels and especially upscale extended-stay hotels are closely related and usually post similarADR increases. Corporate housing ADR rose 6.3% in 2016 over the previous year, the strongest growth in ADRsince 2011. By comparison, upscale extended-stay hotels reported a 2.6% ADR gain in 2016 compared to 2015.
Many corporate housing providers also charge set-up, departure, and housekeeping fees that are reflected as roomrate increases because the guest pays them; traditional hotels do not usually charge for these services.
Rents - Average Rate
Source: The Highland GroupNote: Data for 2003 not available
United States

7
Rents by Unit Type
Source: The Highland Group
Source: The Highland Group
United States

8
Source: The Highland Group
Source: The Highland Group
Rate increases for studio and three-bedroom units were above the overall ADR growth in 2016. Increases for oneand two-bedroom units were 6.3% and 5.8% respectively.
United States

9
The average stay in a US corporate housing unit was 86 nights in 2016, an increase of two nights over 2015. Theaverage length of stay has trended upward since 1999.
Average Stay
Source: The Highland GroupNote: Data not available for 2003 and 2004
United States

10
For the sixth successive year, relocation was the largest reason for using corporate housing in the US. Project/Training was the second most cited use of corporate housing in 2016.
Technology and healthcare are the largest generators of corporate housing demand by industry. The “Other” category includes industries not specified in the chart below.
Purpose of Trip
Source: The Highland Group
Source: The Highland Group
United States
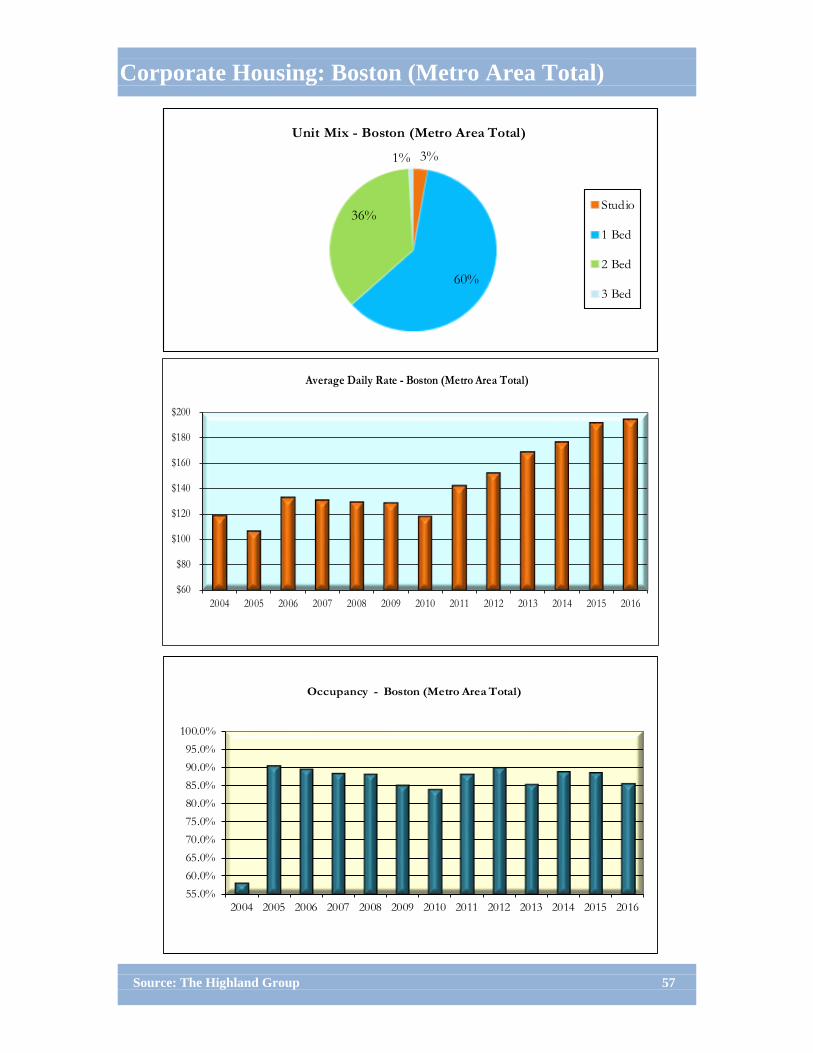
Corporate Housing: Boston (Metro Area Total)
Source: The Highland Group 57
$60
$80
$100
$120
$140
$160
$180
$200
2004 2005 2006 2007 2008 2009 2010 2011 2012 2013 2014 2015 2016
Average Daily Rate - Boston (Metro Area Total)
55.0%60.0%65.0%70.0%75.0%80.0%85.0%90.0%95.0%
100.0%
2004 2005 2006 2007 2008 2009 2010 2011 2012 2013 2014 2015 2016
Occupancy - Boston (Metro Area Total)
3%
60%
36%
1%
Unit Mix - Boston (Metro Area Total)
Studio
1 Bed
2 Bed
3 Bed

Corporate Housing: Boston (City Center)
892
1,007
655
536
n/a
87%
86%
84%
n/a
$144
$164
$160
83
101
2015 Sample Units
2014 Sample Units
2013 Sample Units
2012 Sample Units
2007 Average
2008 Average
2009 Average
2010 Average
2007 ADR
2008 ADR
2009 ADR
2010 ADR
Average Stay 2008
Average Stay 2009
Studio: 3%
1B Units: 60%
2B Units: 36%
3B Units: 1%
Other: 0%
Studio ADR: $130.41
1-Bedroom ADR: $181.81
2-Bedroom ADR: $247.03
3-Bedroom ADR: $273.74
Occupancy
Unit Sample by Unit Type Ratio
Average Daily Rate
Average Daily Rate by Type
$1642011 ADR
2011 Average 90%
Average Stay 2010 74
Average Stay 2007 n/a
2012 ADR $174
2012 Average 92%
Average Stay 2011 82
Inventory
2015 Average 89%
Average Stay
2013 ADR $185
86%2013 Average
65Average Stay 2012
$1812014 ADR
89%2014 Average
51Average Stay 2013
$2062015 ADR
64
Average Stay 2015 71
Average Stay 2014
5492011 Sample Units
2512010 Sample Units
4692009 Sample Units
6792008 Sample Units
n/a2007 Sample Units
2016 Sample Units 731 2016 Average 86%
Average Stay 2016 762016 ADR $204
Source: The Highland Group 58

Corporate Housing: Boston (City Center)
Source: The Highland Group 59
$50
$70
$90
$110
$130
$150
$170
$190
$210
2008 2009 2010 2011 2012 2013 2014 2015 2016
Average Daily Rate - Boston (City Center)
3%
60%
36%
1%
Unit Mix - Boston (City Center)
Studio
1 Bed
2 Bed
3 Bed
80.0%
85.0%
90.0%
95.0%
100.0%
2008 2009 2010 2011 2012 2013 2014 2015 2016
Occupancy - Boston (City Center)

Corporate Housing: Boston (Suburbs)
319
318
350
288
n/a
88%
84%
83%
n/a
$114
$85
$101
77
69
2015 Sample Units
2014 Sample Units
2013 Sample Units
2012 Sample Units
2007 Average
2008 Average
2009 Average
2010 Average
2007 ADR
2008 ADR
2009 ADR
2010 ADR
Average Stay 2008
Average Stay 2009
Studio: 3%
1B Units: 48%
2B Units: 45%
3B Units: 4%
Other: 0%
Studio ADR: $88.27
1-Bedroom ADR: $158.04
2-Bedroom ADR: $180.03
3-Bedroom ADR: $352.75
Occupancy
Unit Sample by Unit Type Ratio
Average Daily Rate
Average Daily Rate by Type
$1082011 ADR
2011 Average 85%
Average Stay 2010 70
Average Stay 2007 n/a
2012 ADR $110
2012 Average 87%
Average Stay 2011 63
Inventory
2015 Average 87%
Average Stay
2013 ADR $137
83%2013 Average
67Average Stay 2012
$1602014 ADR
88%2014 Average
69Average Stay 2013
$1512015 ADR
82
Average Stay 2015 72
Average Stay 2014
3402011 Sample Units
5442010 Sample Units
3782009 Sample Units
6672008 Sample Units
n/a2007 Sample Units
2016 Sample Units 332 2016 Average 83%
Average Stay 2016 692016 ADR $173
Source: The Highland Group 60

Corporate Housing: Boston (Suburbs)
Source: The Highland Group 61
3%
48%45%
4%
Unit Mix - Boston (Suburbs)
Studio
1 Bed
2 Bed
3 Bed
$50
$70
$90
$110
$130
$150
$170
$190
2008 2009 2010 2011 2012 2013 2014 2015 2016
Average Daily Rate - Boston (Suburbs)
80.0%
85.0%
90.0%
95.0%
100.0%
2008 2009 2010 2011 2012 2013 2014 2015 2016
Occupancy - Boston (Suburbs)