CORPORATE GOVERNANCE AND THE RISE OF · PDF file3 Corporate Governance and the Rise of...
42
1 Corporate Governance and the Rise of Integrating Corporate Social Responsibility Criteria in Executive Compensation: Effectiveness and Implications for Firm Outcomes CORPORATE GOVERNANCE AND THE RISE OF INTEGRATING CORPORATE SOCIAL RESPONSIBILITY CRITERIA IN EXECUTIVE COMPENSATION: EFFECTIVENESS AND IMPLICATIONS FOR FIRM OUTCOMES CAROLINE FLAMMER Boston University, Questrom School of Business [email protected] BRYAN HONG University of Western Ontario, Ivey Business School [email protected] DYLAN MINOR Northwestern University, Kellogg School of Management [email protected] Date of Submission: October 1, 2017 ABSTRACT Research Abstract: This study examines the integration of corporate social responsibility (CSR) criteria in executive compensation, a relatively recent practice in corporate governance. We construct a novel database of CSR contracting and document that CSR contracting has become more prevalent over time. We further find that the adoption of CSR contracting leads to i) an increase in long-term orientation; ii) an increase in firm value; iii) an increase in social and environmental performance; iv) a reduction in emissions; and v) an increase in green innovations. These findings are consistent with our theoretical arguments predicting that CSR contracting helps direct management’s attention to stakeholders that are less salient but financially material to the firm in the long run, thereby enhancing corporate governance. Managerial Abstract: This paper examines the effectiveness and implications of integrating environmental and social performance criteria in executive compensation (“CSR contracting”), a relatively recent practice in corporate governance. We construct a novel database of CSR contracting and document that CSR contracting has become more prevalent over time―which echoes the increased public scrutiny on companies’ behavior in the real economy. We further show that the adoption of CSR contracting mitigates corporate short-termism and improves business performance. Firms that adopted CSR contracting experienced a significant increase in firm value. This increase in firm value foreshadowed an increase in operating profits that materialized within three years. We unpack the reasons for these improvements in performance, and find that firms that adopted CSR contracting improved their environmental and social performance, especially with respect to the natural environment and local communities. For example, they reduced their emissions and increased innovations in green technologies. Overall, the findings of this study suggest that CSR contracting helps direct management’s attention to stakeholders that are less salient but financially material to the firm in the long run, thereby improving a firm’s governance as well as its impact on society and the natural environment. Accordingly, they are of foremost relevance to the IRRC Institute Research Award objective.
Transcript of CORPORATE GOVERNANCE AND THE RISE OF · PDF file3 Corporate Governance and the Rise of...

1 Corporate Governance and the Rise of Integrating Corporate Social Responsibility Criteria in Executive Compensation: Effectiveness and Implications for Firm Outcomes
CORPORATE GOVERNANCE AND THE RISE OF INTEGRATING CORPORATE SOCIAL RESPONSIBILITY CRITERIA IN EXECUTIVE COMPENSATION:
EFFECTIVENESS AND IMPLICATIONS FOR FIRM OUTCOMES
CAROLINE FLAMMER Boston University, Questrom School of Business
BRYAN HONG University of Western Ontario, Ivey Business School
DYLAN MINOR Northwestern University, Kellogg School of Management
Date of Submission: October 1, 2017
ABSTRACT
Research Abstract: This study examines the integration of corporate social responsibility (CSR) criteria in executive compensation, a relatively recent practice in corporate governance. We construct a novel database of CSR contracting and document that CSR contracting has become more prevalent over time. We further find that the adoption of CSR contracting leads to i) an increase in long-term orientation; ii) an increase in firm value; iii) an increase in social and environmental performance; iv) a reduction in emissions; and v) an increase in green innovations. These findings are consistent with our theoretical arguments predicting that CSR contracting helps direct management’s attention to stakeholders that are less salient but financially material to the firm in the long run, thereby enhancing corporate governance. Managerial Abstract: This paper examines the effectiveness and implications of integrating environmental and social performance criteria in executive compensation (“CSR contracting”), a relatively recent practice in corporate governance. We construct a novel database of CSR contracting and document that CSR contracting has become more prevalent over time―which echoes the increased public scrutiny on companies’ behavior in the real economy. We further show that the adoption of CSR contracting mitigates corporate short-termism and improves business performance. Firms that adopted CSR contracting experienced a significant increase in firm value. This increase in firm value foreshadowed an increase in operating profits that materialized within three years. We unpack the reasons for these improvements in performance, and find that firms that adopted CSR contracting improved their environmental and social performance, especially with respect to the natural environment and local communities. For example, they reduced their emissions and increased innovations in green technologies. Overall, the findings of this study suggest that CSR contracting helps direct management’s attention to stakeholders that are less salient but financially material to the firm in the long run, thereby improving a firm’s governance as well as its impact on society and the natural environment. Accordingly, they are of foremost relevance to the IRRC Institute Research Award objective.

2
Corporate Governance and the Rise of Integrating Corporate Social Responsibility Criteria in Executive Compensation: Effectiveness and Implications for Firm Outcomes
Keywords: corporate governance; corporate social responsibility; executive compensation; managerial incentives; long-term orientation.
______________________
* We thank Ruth Aguilera, Pratima Bansal, Guoli Chen, Olga Hawn, Jiao Luo, Chris Marquis, Mary-Hunter McDonnell, Aldo Musacchio, as well as seminar participants at Korea Advanced Institute of Science & Technology (KAIST), University of British Columbia, University of California Santa Barbara (UCSB), University of Amsterdam, University of Groningen, the 2016 Wharton People and Organizations Conference, the 2016 Institutions and Innovation Conference (Harvard Business School), the 2017 Academy of Management Annual Meeting, the 2017 Alliance for Research on Corporate Sustainability Conference (Erasmus), the 2017 Behavioral Perspectives on Corporate Governance Conference (INSEAD), the 2017 Economics of Social Sector Organisations Conference (LSE/Chicago Booth), the 2017 PRI Academic Network Conference, the 2017 Society for Institutional & Organizational Economics Conference (Columbia University), and the 2017 Milan Strategic Management Society Special Conference (Bocconi University) for helpful comments and suggestions. We are grateful to Hanny Chen, Blossom Lin, Sarah Morrison, Zahra Naqvi, and Charlotte Zhen for excellent research assistance, and Deepak Hegde for sharing his patent data.

3
Corporate Governance and the Rise of Integrating Corporate Social Responsibility Criteria in Executive Compensation: Effectiveness and Implications for Firm Outcomes
INTRODUCTION
A recent development in corporate governance is the integration of corporate social responsibility (CSR) criteria in executive compensation—that is, linking executive compensation to social and environmental performance (e.g., CO2 emission targets, employee satisfaction targets, compliance with ethical standards in developing countries). Practitioners commonly refer to this incentive provision as “CSR contracting” or “pay for social and environmental performance” (as opposed to the traditional “pay for (financial) performance”). While this incentive provision has become increasingly prevalent, little is known about this new phenomenon and how it affects firm-level outcomes. Anecdotal accounts abound with examples of companies―e.g., Alcoa, American Electric Power, Intel, Novo Nordisk, and Xcel Energy―that have adopted CSR contracting, and view the incorporation of CSR criteria in executive compensation as good governance (GreenBiz, 2012; Harvard Business Review, 2015; Wall Street Journal, 2008). For example, Xcel Energy includes a so-called “sustainability quotient” in its salary reviews and bonus allocations. While 75% of its incentives continue to be based on earnings per share growth, the remaining 25% include environmental footprint and decreases in carbon emissions (Forbes, 2010). Similarly, Intel ties executive compensation to corporate sustainability goals such as the energy efficiency of its products, reductions in greenhouse gas emissions and energy use, and improvements in environmental leadership reputation (GreenBiz, 2012). Xcel and Intel are not the only companies that include CSR criteria in their executive compensation structure; others have introduced similar compensation structures in an attempt to improve their governance and contribute to long-term value creation.1 In their view, and as Lars Rebien Sørensen—CEO of Novo Nordisk and recently named the “Best-Performing CEO of the World” by Harvard Business Review—stated: “corporate social responsibility is nothing but maximizing the value of your company over a long period of time, because in the long term, social and environmental issues become financial issues” (Harvard Business Review, 2015).
Apart from anecdotal evidence, little is known about CSR contracting. In this paper, we aim to fill this void in the literature. To do so, we construct a novel database that compiles information on CSR contracting from the compensation information that companies report in their proxy statements filed with the Securities and Exchange Commission (SEC). Our sample covers all S&P 500 firms during a 10-year period (2004-2013). To the best of our knowledge, this database is the first longitudinal database of CSR contracting.
We then explore theoretically and empirically how CSR contracting affects firm outcomes. From a theoretical perspective, our main argument is that CSR contracting helps direct managers’
1 The view that CSR contracting is good governance is also reflected in the recent change in ranking methodology of Harvard Business Review’s annual “Best Performing CEOs in the World” assessment, which shifted away from only looking at “hard stock market numbers” towards also considering each company’s environmental, social and governance (ESG) performance. The journal states that the revised ranking methodology aims to “account for the many aspects of leadership that go beyond mere market performance” (Harvard Business Review, 2015).

4
Corporate Governance and the Rise of Integrating Corporate Social Responsibility Criteria in Executive Compensation: Effectiveness and Implications for Firm Outcomes
attention to stakeholders that are less salient but financially material to the firm in the long run, thereby enhancing corporate governance.
In the empirical analysis, we start by documenting a series of stylized facts pertaining to CSR contracting. First, we show that the integration of CSR criteria in executive compensation is more prevalent in emission-intensive industries (e.g., mining, oil extraction, transportation). Second, we document a strong trend towards more CSR contracting over time. While only 12% of the S&P 500 companies had adopted CSR contracting by 2004, this ratio increased to 37% by 2013. We then examine how CSR contracting affects firm-level outcomes. We find that the adoption of CSR contracting leads to i) an increase in long-term orientation (measured by the long-term index of Flammer and Bansal, 2017); ii) an increase in firm value (measured by Tobin’s Q); iii) an increase in social and environmental performance (measured by the KLD-index), especially with respect to less salient stakeholders such as the natural environment and communities; iv) a reduction in emissions (measured by the toxic release inventory (TRI)); and v) an increase in green patents. These findings support our theoretical arguments that CSR contracting enhances the governance of a company by incentivizing managers to adopt a longer time horizon and shift their attention towards stakeholders that are less salient, but contribute to long-term value creation.
Moreover, we explore the moderating role of the substantiveness of CSR contracting. We find that our results are stronger i) when companies specify the amount of CSR-based compensation (i.e., when they are specific instead of vague), and ii) when the share of CSR-based compensation is larger. This suggests that CSR contracting is a more effective governance tool if it is substantive.
These findings are robust to a large number of robustness checks. In particular, we address the potential endogeneity of CSR contracting by using the enactment of state-level constituency statutes as instrumental variable (IV) for CSR contracting. Constituency statutes allow directors to consider stakeholders’ interests when making business decisions (Flammer, 2017; Flammer and Kacperczyk, 2016) and hence provide exogenous shifts in companies’ propensity to adopt CSR contracting.
This study makes two main contributions to the literature. To the best of our knowledge, it is the first to provide a longitudinal analysis of CSR contracting. As such, it establishes several facts pertaining to CSR contracting, and documents the increasing prevalence of CSR contracting as a new phenomenon in corporate governance. Second, this paper sheds light on how the adoption of CSR contracting affects firm-level outcomes, and highlights a novel mechanism that boards of directors can use to enhance their governance―the integration of CSR criteria in executive compensation. Such criteria incentivize managers to direct their attention to stakeholders that are less salient, but financially material to a firm’s operating context and long-term success.
In the remainder of this paper, we develop the theoretical arguments in detail, describe the data and methodology, present the empirical results, and conclude by discussing the implications and limitations of our findings.

5
Corporate Governance and the Rise of Integrating Corporate Social Responsibility Criteria in Executive Compensation: Effectiveness and Implications for Firm Outcomes
THEORY
Incentives for stakeholder engagement
Stakeholders are defined as “any group or individual who can affect or is affected by the achievement of an organization’s purpose” (Freeman, 1984, p. 53)—e.g., employees, customers, the environment, and the community at large.2 A large literature argues that stakeholders can be essential for sustaining a firm’s competitiveness and long-term growth. For example, by treating their employees well, firms can enhance employee engagement (Flammer and Luo, 2017), innovative productivity (Flammer and Kacperczyk, 2016), and ultimately improve firm performance (e.g., Edmans, 2011, 2012). In addition, customers are responsive to companies’ stakeholder engagement. Indeed, stakeholder engagement can serve as valuable signal of the seller’s quality and non-opportunistic behavior, generating goodwill, sales, and profits (e.g., Du, Bhattacharya, and Sen, 2011; Elfenbein, Fisman, and McManus, 2012; Kotler, Hessekiel, and Lee, 2012; Luo and Bhattacharya, 2006). Relatedly, companies’ actions pertaining to communities and the natural environment have been shown to affect financial performance (e.g., Flammer, 2013; Hamilton, 1995; Klassen and McLaughlin, 1996). In particular, by improving their environmental footprint, companies can benefit from a better reputation and cleaner work environment, enhancing the satisfaction of employees and consumers (e.g., Bansal and Roth, 2000; Delmas and Pekovic, 2013; Hart, 1995; Russo and Fouts, 1997). Conversely, eco-harmful behavior can hurt a firm’s bottom line if, e.g., the firm lacks the social license to operate, stricter government regulations are imposed, or the firm is targeted by a boycott (e.g., Harvard Business Review, 2015; Henisz, Dorobantu, and Nartey, 2014).3 In sum, a large literature suggests that stakeholder engagement (or the lack thereof) influences firms’ competitiveness and long-term value creation.4
While managers may well perceive the relevance of stakeholder engagement for long-term value creation, they may be reluctant to address all stakeholder claims. First, stakeholder interests are heterogenous and may conflict with each other. For example, customers may have short-term claims about pricing, while local communities have long-term claims about the firm’s social engagement. In this example, the interests of the “customer” stakeholder collide against the interests of the “community” stakeholder. Managers have to balance these conflicting interests (in terms of allocating financial, cognitive, and other resources) and may give preferences to some
2 In this paper, we use the expressions “stakeholder engagement” and “investments in CSR” interchangeably. As such, CSR includes any corporate initiative pertaining to the firm’s stakeholders (and hence is not limited to philanthropic initiatives). For a similar terminology see, e.g., Barnett and Salomon (2006), Flammer and Bansal (2017), and Graves and Waddock (2000). 3 A prime example is the Keystone XL Pipeline project that was supposed to transport carbon-heavy petroleum from the Canadian oil sands to the Gulf Coast. While economically promising, it faced strong resistance from local communities and environmental activists. After a seven-year review, President Obama rejected the Keystone project due to its negative impact on the natural environment (New York Times, 2015). 4 Note that an increase in firm value need not imply that profits increase in the short run. Indeed, value-enhancing projects can entail a temporal separation between (short-term) costs and (long-term) benefits, with a positive net effect on firm value (see, e.g., Flammer and Bansal, 2017).

6
Corporate Governance and the Rise of Integrating Corporate Social Responsibility Criteria in Executive Compensation: Effectiveness and Implications for Firm Outcomes
stakeholders over others. Second, a large literature in psychology and economics examines individuals’
intertemporal decision-making (e.g., Ainslie 1975; Frederick, Loewenstein, and O’Donoghue, 2002; Loewenstein and Prelec, 1992; O’Donoghue and Rabin, 1999; Thaler and Shefrin, 1981). This literature finds that individuals are so-called “hyperbolic discounters,” that is, individuals have an excessive preference for the present, preferring short-term rewards over long-term rewards, even if the latter are substantially higher. For executives, this preference for short-term results is reinforced by short-term pressures―such as career concerns (e.g., Gibbons and Murphy, 1992), the provision of short-term executive compensation (e.g., Stein, 1989), and pressures to meet or beat analysts’ quarterly earnings expectations (e.g., DeGeorge et al., 1999)―leading managers to favor investments that pay off in the short run at the expense of long-term investments (e.g., Flammer and Bansal, 2017; Graham et al. 2005; Holmstrom, 1999; Stein, 1988, 1989). In this vein, perhaps the most striking evidence is provided in a survey by Graham et al. (2005), who find that 78% of the surveyed executives would sacrifice projects with positive net present value (NPV) if adopting them resulted in the firm missing quarterly earnings expectations. Accordingly, managers are likely to focus their attention on those stakeholder claims that help in meeting managers’ short-term earnings targets.
Taken together, the above arguments suggest that managers have a propensity to give priority to salient stakeholders that contribute to short-term performance (e.g., Eesley and Lenox, 2006; Mitchell, Agle, and Wood, 1997), as opposed to stakeholders that might be less salient but financially material to the firm in the long run.
To redirect managers’ attention towards stakeholders that contribute to long-term value creation, boards of directors need to provide proper incentives to their managers. In this vein, a relatively recent corporate governance practice is the integration of CSR criteria in executive compensation—i.e., linking executive compensation to social and environmental performance. Yet, whether or not the adoption of CSR criteria in executive compensation serves as an effective governance tool—that is, a tool that influences corporate actions and contributes to value creation—is far from obvious. Indeed, the extant literature suggests that some governance mechanisms are ineffective as they lack substance and are merely symbolic (e.g., Westphal and Zajac, 1994; Zajac and Westphal, 1995). Moreover, CSR-based compensation may only represent a very small fraction of the overall compensation a manager receives and hence be too incremental to effectively shape managerial incentives. In the following, we discuss the effectiveness of CSR contracting and the implications for firm-level outcomes.
Implications for organizational time horizon and long-term value creation
From the perspective of agency theory, the inclusion of nonfinancial performance measures in executive compensation contracts can increase their effectiveness if the nonfinancial performance measures contain additional information about a manager’s effort beyond that of financial measures (Holmstrom, 1979). This holds even if the primary objective is improving stock market performance and managers are already incentivized with stock-based compensation (Feltham and

7
Corporate Governance and the Rise of Integrating Corporate Social Responsibility Criteria in Executive Compensation: Effectiveness and Implications for Firm Outcomes
Xie, 1994). While financial measures can serve as a reasonable measure of competence in managing a
firm’s current operations, they do not reflect the benefits of many longer-term strategies, such as investments in new growth opportunities or new product development (Bushman et al., 1996). In contrast, nonfinancial performance measures (e.g., customer satisfaction, employee satisfaction, environmental footprint) are likely indicative of longer-term benefits. Consistent with this argument, several articles document a link between customer satisfaction and long-term financial performance (e.g., Banker, Potter, and Srinivasan, 2000; Behn and Riley, 1999; Ittner and Larcker, 1998; Sen and Bhattacharya, 2001). Similarly, employee satisfaction (e.g., Edmans, 2011, 2012; Flammer, 2015a) and environmental performance (e.g., Flammer, 2013; Klassen and McLaughlin, 1996) have been shown to increase firm value. Accordingly, to the extent that nonfinancial performance measures are predictive of long-term value creation, the inclusion of such measures will likely improve the effectiveness of executive compensation contracts.5
Given that the achievement of superior social and environmental performance is typically the outcome of long-term efforts that require a long-term orientation (Eccles, Ioannou, and Serafeim, 2014; Flammer and Bansal, 2017), we expect that providing incentives based on social and environmental performance is likely to shift managers’ attention towards a longer-term orientation and ultimately increase the value of the firm.6 This leads to the following hypotheses:
Hypothesis 1. The adoption of CSR criteria in executive compensation has a positive impact on organizational time horizons.
Hypothesis 2. The adoption of CSR criteria in executive compensation has a positive impact on firm value.
Heterogeneity across stakeholders
The aim of integrating CSR criteria in executive compensation is to incentivize managers to improve the firm’s social and environmental performance in order to create long-term shareholder value. Naturally―assuming that managers are responsive to incentives―we expect managers to expand their stakeholder engagement following the adoption of CSR contracting.
That being said, there might be considerable heterogeneity across stakeholder groups. For example, consumers and employees are key stakeholders that directly contribute to a firm’s bottom line. These stakeholders have direct claims, as they are in a formal contractual relationship with the firm and have the necessary “power” (Mitchell et al., 1997) to make their claims heard by the
5 Consistent with this view, Ittner, Larcker, and Rajan (1997) find that the use of nonfinancial measures increases with the extent to which a firm pursues innovation- and quality-oriented strategies. 6 We define “organizational time horizon” as the executive team’s attention to long-term firm value. Slawinski and Bansal (2012) argue that an organization’s time orientation is reflected by its discourse. In this spirit, in the empirical analysis, we follow Flammer and Bansal (2017) and construct an index of long-term orientation based on the organization’s discourse.

8
Corporate Governance and the Rise of Integrating Corporate Social Responsibility Criteria in Executive Compensation: Effectiveness and Implications for Firm Outcomes
management. Hence, there might be less of a need to incentivize managers to address the claims of these stakeholders.
In contrast, the natural environment and the communities in which a firm operates are more likely to benefit from the integration of CSR criteria in executive compensation. This is because neither of these stakeholders have an immediate effect on the company’s bottom line, and hence on meeting managers’ short-term earnings targets. Moreover, and importantly, they lack the necessary power to make their claims heard as they are “dependent” on the advocacy of other stakeholders (Mitchell et al., 1997)—such as environmentalists, community activists, shareholder activists, advocacy groups, and other entities that are concerned about the long run and the firm’s CSR activities.7 As a result, the claims of these “dependent stakeholders” are less salient (Mitchell et al., 1997), and managers may ignore them absent proper incentives.
The recent years have witnessed dramatic environmental, regulatory, and societal developments. These developments have likely increased the pressure faced by boards of directors to engage with dependent stakeholders. In particular, the prevalence of social media has facilitated the mobilization of social movements (Van Laer and Van Aelst, 2010), exacerbating their potential impact on a firm’s financial performance (e.g., King and Soule, 2007; Pruitt and Friedman, 1986).8 Moreover, shareholder activism demanding improved sustainable practices and a longer-term orientation has increased substantially over the years (Flammer, 2013, 2015a; Flammer and Bansal, 2017), pressuring boards to take action with respect to the environment and local communities.9 Taken together, these recent developments suggest that stakeholder advocacy in support of dependent stakeholders has become more powerful, pressuring boards of directors to take action. Boards may respond by adopting CSR contracting to incentivize managers to engage with the natural environment and local communities.
In sum, the above arguments suggest that CSR contracting is especially effective with respect to the “dependent” stakeholders, that is, the natural environment and local communities. This motivates the following hypothesis:
7 Mitchell et al. (1997) call this stakeholder group “dependent stakeholders” due to their dependency on the advocacy by others. 8 In this vein, Eesley and Lenox (2006) examine the conditions under which community activists, advocacy groups, and others can elicit positive firm responses and advance their interests. 9 In parallel, governments are increasingly taking actions to curb climate change and impose stricter environmental regulations (e.g., Allen and Shonnard, 2011). For example, at the recent 2015 United Nations Climate Change Conference, 195 nations reached an agreement (the Paris Agreement) that aims to limit global warming to well below two degrees Celsius—which is regarded as the danger zone for climate change when droughts get even worse and low-lying islands disappear. By April 2016, 175 countries had signed the agreement and began adopting it within their own legal systems (CNN, 2016; United Nations, 2016). More generally, (the threat of) stricter environmental regulations can induce firms to reduce emissions (Maxwell, Lyon, and Hackett, 2000), and send a strong signal to investors of carbon-intensive companies. Indeed, a low-carbon future creates a long-term challenge to their business model, even if the financial impact may not be felt immediately. For example, a major financial risk faced by energy companies pertains to so-called “stranded assets”—coal, oil, and gas reserves that companies list as part of their assets, but might in fact be worthless, since those reserves may never be drilled and instead become left stranded by tougher regulations to curb climate change (e.g., Financial Times, 2015; Fortune, 2015).

9
Corporate Governance and the Rise of Integrating Corporate Social Responsibility Criteria in Executive Compensation: Effectiveness and Implications for Firm Outcomes
Hypothesis 3. The adoption of CSR criteria in executive compensation has a positive impact on stakeholder engagement, especially with respect to the natural environment and local communities.
Sustainable practices and the development of green innovations
In the previous section, we argued that the integration of CSR criteria in executive compensation enhances the governance of a company by incentivizing managers to improve the firm’s CSR performance, especially with regard to the less salient (or “dependent”) stakeholders such as the environment and local communities. In this section, we discuss potential mechanisms through which companies may do so. These mechanisms fall into two broad categories: 1) minimizing detrimental effects on the less salient stakeholders, and 2) increasing their benefits.
First, companies may take actions that reduce the detrimental impact (e.g., emissions) on the natural environment and the local communities in which they operate. As previously mentioned, eco-harmful behavior can negatively impact a firm’s financial performance—e.g., if the firm loses its social license to operate, stricter government regulations are imposed, fines are levied, or the firm is boycotted following eco-harmful behavior (e.g., Flammer, 2013; Harvard Business Review, 2015; Henisz et al., 2014; Klassen and McLaughlin, 1996). In particular, Flammer (2013) shows that the detrimental impact of eco-harmful behavior on a firm’s financial performance has become more substantial over the past decades. Accordingly, managers—when properly incentivized—may take actions to improve their environmental footprint. For example, they may reduce their use of pesticides, reduce energy consumption, introduce recycling programs, engage their employees in community cleanups and greening initiatives, upgrade their facilities to prevent oil spills and other industrial accidents, construct “green buildings,” shift towards using renewable energy and clean fuels, or source from eco-friendly and socially responsible suppliers. Many of these initiatives (e.g., resource efficiency and waste management) are “low-hanging fruits” as they are relatively incremental, require few financial resources, take little time to implement, and pay off relatively quickly (e.g., Clelland et al., 2000; Rusinko, 2007; Russo and Harrison, 2005). Arguably, CSR contracting may induce managers to exploit these low-hanging fruits and, as a result, reduce the firm’s emissions.
Second, companies may take actions that benefit the less salient stakeholders. For example, companies can develop “green” products and environmentally-friendly production processes that benefit both the environment and local communities. Such innovations require substantial time and resources to develop and bring to the market. More generally, innovative activities are characterized by long gestation periods, substantial resource commitments, and a high rate of failure (e.g., Aghion and Tirole, 1994; Griliches, 1990; Hall, Jaffe, and Trajtenberg, 2005). Despite these challenges—or rather due to these challenges—we expect CSR contracting to foster the pursuit of green innovations. Indeed, as discussed above, CSR contracting is likely to shift managers’ attention towards a longer-term orientation, which is essential for innovation (e.g., Aghion, Van Reenen, and Zingales, 2013; Azoulay, Graff Zivin, and Manso, 2011; Flammer and

10
Corporate Governance and the Rise of Integrating Corporate Social Responsibility Criteria in Executive Compensation: Effectiveness and Implications for Firm Outcomes
Bansal, 2017). Moreover, stakeholder orientation can foster a work environment that is more tolerant of failure, thereby encouraging experimentation and enhancing employees’ innovative productivity (Flammer and Kacperczyk, 2016).
In sum, we expect that CSR contracting incentivizes managers to i) engage in more sustainable practices that reduce emissions, and ii) increase their efforts in developing “green innovations.” This leads to the following hypothesis:
Hypothesis 4. The adoption of CSR criteria in executive compensation incentivizes managers to i) reduce emissions, and ii) increase their green innovations.
Symbolic versus substantive adoption of CSR contracting
The previous arguments suggest that the adoption of CSR criteria in executive compensation serves as an effective governance tool that influences corporate strategy and increases firm value. In this section, we explore the moderating role of the substantiveness of CSR contracting.
The extant literature suggests that some governance mechanisms may lack substance and be merely symbolic. In particular, Westphal and Zajac (1994) show that companies may announce the adoption of pay-for-(financial) performance incentive plans but only implement them incrementally, if at all, suggesting a potential separation of substance and symbol in executive compensation. Arguably, the extent to which an incentive plan is implemented plays a defining role in whether it influences managers’ decision-making and ultimately affects value creation. The same may apply to CSR contracting—CSR-based compensation may only represent a very small fraction of the overall compensation and hence be too incremental to be an effective incentive tool.
Moreover, the adoption of CSR criteria may be a PR strategy instead of an incentive scheme. In this vein, the extant literature suggests that external pressures can result in decoupling processes whereby firms’ responses to external demands vary in the extent to which they are symbolic or substantive (Marquis and Qian, 2014; Meyer and Rowan, 1977; Okhmatovskiy and David, 2012). For example, Marquis and Qian (2014) examine whether firms comply with government pressure to issue CSR reports only symbolically (i.e., by issuing vague, uninformative reports), or whether they comply by providing substantive details. They find that, in certain situations (i.e., when the risk of government monitoring is low), the reporting of CSR activities might be symbolic rather than substantive. In this spirit—following the increased stakeholder advocacy in support of the natural environment and local communities—boards of directors’ responses may vary in the degree to which the incorporation of CSR criteria in executive compensation is symbolic (i.e., vague) or substantive (i.e., specific).
Relatedly—and in contrast to measuring financial performance—quantifying and tracking a firm’s social and environmental impact is non-trivial (see, e.g., The Guardian, 2011). For example, it is unclear how to quantify and compare employees’ volunteering efforts, a company-led training program in sustainable production for suppliers, or recycling efforts. This challenge makes an assessment of the actual CSR target completion difficult and, in turn, may induce boards

11
Corporate Governance and the Rise of Integrating Corporate Social Responsibility Criteria in Executive Compensation: Effectiveness and Implications for Firm Outcomes
of directors to remain vague in the description of CSR performance targets and remuneration. As a result, no clear guidance—and hence incentive—is provided to managers.
Taken together, the above arguments suggest that firms that are specific in the formulation of CSR-based executive compensation, and provide a higher share of CSR-based compensation, are more likely to influence managers’ corporate actions and hence serve as an effective governance tool. Accordingly, we expect that the substantiveness of CSR contracting positively moderates the relationship between CSR contracting and firm-level outcomes.
Hypothesis 5. The adoption of CSR criteria in executive compensation serves as a less effective governance tool, i) if it lacks the indication of a specific CSR compensation amount, and ii) the smaller the extent of CSR compensation (compared to total compensation).
DATA
Data and variable definitions
CSR contracting
To construct a database of executive compensation incentives for CSR, we manually collect executive compensation data from annual proxy statements filed with the Securities and Exchange Commission (SEC) for each firm in the Standard & Poor’s 500 Index (S&P 500) for the years 2004 through 2013. Our sample consists of 4,533 firm-year observations for which we could retrieve proxy statements (SEC Form DEF 14A) from the SEC’s Electronic Data Gathering, Analysis, and Retrieval (EDGAR) database.
Proxy statements provide descriptive information regarding the structure of managerial compensation contracts (e.g., salary, bonus, stock-based compensation) for the top five executives of the firm, including the performance metrics used for performance-based compensation. To identify the provision of incentives for CSR, we manually searched through the description of each executive’s compensation to identify performance metrics that were linked to social and environmental performance. Those included the following: community, compliance with ethical standards, corporate social responsibility, diversity, employee well-being, energy efficiency, environmental compliance, environmental goals, environmental performance, environmental projects, greenhouse gas emissions reductions, health, performance relative to a corporate responsibility index (e.g., Dow Jones Sustainability Index), product safety, reduced injury rates, safety, and sustainability. If incentives were provided that were linked to CSR, the executive was coded with a dummy variable equal to one for that year.
For example, Freeport-McMoRan Copper & Gold Inc. bases a significant portion of its executives’ performance-based compensation on safety, environmental, and social responsibility metrics. More specifically, according to its 2013 Proxy Statement, the Annual Incentive Plan (AIP) bases 25% of the aggregate award on the achievement of pre-established safety (15%),

12
Corporate Governance and the Rise of Integrating Corporate Social Responsibility Criteria in Executive Compensation: Effectiveness and Implications for Firm Outcomes
environmental and social responsibility performance (10%) goals. Similarly, Valero Energy’s AIP rewards safe operations and environmental responsibility. According to its 2013 Proxy Statement, 13.33% of executives’ AIP is based on the achievement of health, safety, and environmental goals.
To construct a firm-level measure of CSR-based incentives (CSR contracting) we compute the percentage of executives whose compensation includes CSR criteria for that year. CSR contracting is essentially binary—almost all companies that use CSR-based criteria do so for all executives.10
Dependent variables
To test our hypotheses, we regress various dependent variables on the adoption of CSR contracting. In the following, we describe each dependent variable.
Time horizon. To measure time horizons, we use the long-term index (“LT-index”) of Flammer and Bansal (2017). The LT-index is obtained by conducting a textual analysis of the companies’ annual reports. The rationale behind this index is that an organization’s time orientation is reflected by its discourse (Slawinski and Bansal, 2012)—companies that use long-term keywords more frequently in their discourse are more likely to have a longer-term orientation. To construct this index, we perform a textual analysis of the firms’ 10-K filings, which are obtained from the SEC’s EDGAR database, and count the number of keywords referring to the short term (“short run,” “short-run,” “short term,” “short-term”) and long term (“long run,” “long-run,” “long term,” “long-term”), respectively. We then compute the LT-index as the ratio of the number of long-term keywords to the sum of long- and short-term keywords.
Firm value. We use Tobin’s Q to measure firm value. Tobin’s Q is constructed from Compustat as the ratio of the market value of total assets (obtained as the book value of total assets plus the market value of common stock minus the sum of the book value of common stock and balance sheet deferred taxes) to the book value of total assets. To mitigate the impact of outliers, Tobin’s Q is winsorized at the 5th and 95th percentiles of its empirical distribution.
CSR performance. The CSR data are obtained from the Kinder, Lydenberg, and Domini (KLD) database. KLD is an independent social choice investment advisory firm that compiles ratings of how companies address the needs of their stakeholders. For each stakeholder group, strengths and concerns are measured to evaluate positive and negative aspects of corporate actions toward stakeholders. These ratings are compiled from multiple data sources including annual questionnaires sent to companies’ investor relations offices, firms’ financial statements, annual and quarterly reports, general press releases, government surveys, and academic publications (see KLD, 2010). KLD ratings are widely used in CSR studies (e.g., Chatterji and Toffel, 2010; Flammer, 2015b). We construct a composite KLD-index by adding up the number of CSR strengths with respect to employees, customers, the natural environment, and communities. In the
10 More precisely, this is the case for 94% of the firms that use CSR contracting. For ease of exposition, we will interpret CSR contracting as a binary variable that indicates whether the company uses CSR-based incentives.

13
Corporate Governance and the Rise of Integrating Corporate Social Responsibility Criteria in Executive Compensation: Effectiveness and Implications for Firm Outcomes
analysis, we also consider subindices based on specific stakeholder groups.11 Emissions. To measure emissions, we use the Toxic Release Inventory (TRI) data
maintained by the U.S. Environmental Protection Agency (EPA). The TRI database contains annual data on emissions of over 650 toxic chemicals from thousands of facilities in the U.S. To create a measure of toxic emissions, we first weigh each chemical by its toxicity. Toxicity-weighted emissions are calculated by multiplying the quantity of each chemical emitted by the inverse of its reportable quantity, following the method used by King and Lenox (2000). Then, toxicity-weighted emissions of each chemical are summed up at the facility level, and ultimately the firm level. The final dependent variable used in the regressions is the logarithm of one plus the toxicity-weighted emissions at the firm level (log(TRI)).
Green patents. We obtain the patent data from the NBER patent database, which contains annual information on the patent assignee name, the technology class, the number of citations, and the year of patent.12 To identify green patents, we use the classification of Amore and Bennedsen (2016, p. 68).13 The final dependent variable is the ratio of the number of green patents divided by the total number of patents filed by the company that year (green patents). In auxiliary analyses, we further distinguish between green patents pertaining to i) pollution and recycling, and ii) renewable energies.
Control variables
In the regressions, we control for a vector of firm- and compensation-level characteristics that may affect the adoption of CSR contracting and the dependent variables of interest.
All firm-level controls are constructed from Compustat. Size is the natural logarithm of the book value of total assets. Return on assets (ROA) is the ratio of operating income before depreciation to the book value of total assets. Leverage is the ratio of debt (long-term debt plus debt in current liabilities) to the book value of total assets. Cash holdings is the ratio of cash and short-term investments to the book value of total assets. To mitigate the impact of outliers, all ratios are winsorized at the 5th and 95th percentiles of their empirical distribution.
The compensation-level controls are obtained from Execucomp. Log(total compensation)
11 In addition to CSR strengths, the KLD database also contains a list of CSR weaknesses, labeled “concerns.” Accordingly, an alternative approach is to construct a “net” KLD-index by subtracting the number of concerns from the number of strengths. In robustness checks, we show that our results are similar if we use this net KLD-index instead. 12 The NBER patent database ends in 2006, but can be extended using the raw files of the U.S Patent and Trademark Office (USPTO). We thank Deepak Hegde for sharing the 2007-2013 data with us. 13 The relevant categories are as follows: air pollution control (USPTO codes 015, 044, 060, 110, 123, 422, 423); alternative energy (049, 062, 204, 222, 228, 242, 248, 425, 428, 708, 976); alternative energy sources (062, 222, 425); geothermal energy (060, 436); recycling (060, 075, 099, 100, 106, 162, 164, 198, 201, 205, 210, 216, 229, 264, 266, 422, 425, 431, 432, 460, 502, 523, 525, 536, 902); solid waste control (034, 060, 065, 075, 099, 106, 118, 119, 122, 137, 162, 165, 203, 205, 209, 210, 239, 241, 266, 405, 422, 423, 431, 435, 976); solid waste disposal (122, 137, 239, 241, 405, 523, 588, 976); solid waste prevention (065, 119, 137, 165, 205, 210, 405, 435); water pollution (203, 210, 405); wind energy (073, 104, 180, 242, 280, 340, 343, 374, 422, 440).

14
Corporate Governance and the Rise of Integrating Corporate Social Responsibility Criteria in Executive Compensation: Effectiveness and Implications for Firm Outcomes
is the natural logarithm of total executive pay.14 The other controls capture the composition of executive pay: % cash compensation is the share of cash-based compensation (i.e., salary and bonus), % stock-based compensation the share of stock-based compensation; % option-based compensation the share of option-based compensation, and % other compensation the share of the miscellaneous compensation (e.g., perquisites and other personal benefits).15
Summary statistics and trends in CSR contracting
Table 1 provides descriptive statistics for the variables used in this paper, along with the corresponding correlation matrix. Note that the mean of CSR contracting is 0.238, which indicates that about 24% of the S&P 500 companies use CSR criteria in executive compensation.16
------Insert Table 1 about here------
CSR contracting across industries
Table 2 provides summary statistics on the prevalence of CSR contracting across industry sectors (partitioned according to SIC major groups). As can be seen, CSR contracting is more prevalent in emission-intensive industries such as “mining” (56.6%) and “transportation, electric, and gas” (45.4%).17 These results echo well with our prediction that the adoption of CSR contracting is likely to benefit “dependent” stakeholders such as the natural environment—a stakeholder that is especially important in emission-intensive industries.18
------Insert Table 2 about here------
CSR contracting over time
In Table 3, we provide summary statistics on the evolution of CSR contracting over time. As can be seen, CSR contracting is becoming increasingly more prevalent over the years. While only
14 We take the average across all executives of the firm. 15 In the regressions, % other compensation is used as the base group. 16 Note that the average executive pay is $5.3 million, out of which 41% is cash-, 34% stock-, and 20% option-based. These figures are consistent with typical statistics on executive pay that have been reported in the literature (see, e.g., Frydman and Jenter, 2010, p. 80). 17 CSR contracting appears to be very common in “agriculture, forestry, and fishing” as well. While this sector is emission-intensive, it only represents a very minor fraction of the overall sample (10 firm-year observations). 18 Managing the environmental impact and obtaining the social license to operate are key elements of business strategy in emission-intensive industries. In particular, the Sustainability Accounting Standards Board (SASB)—a non-profit organization that provides guidance to publicly-listed companies on the disclosure of material sustainability issues in mandatory SEC filings—identifies environmental issues as financially material for firms in emission-intensive industries. In fact, environmental issues are identified as the most important factor influencing financial performance in these industries (Khan, Serafeim, and Yoon, 2016). Relatedly, in their study of the mining industry, Henisz et al. (2014) find that obtaining the social license to operate is essential to conducting business and a key driver of financial performance. Accordingly, the adverse consequences of losing the social license to operate and stricter government regulations due to eco-harmful behavior are particularly pronounced in these industries.

15
Corporate Governance and the Rise of Integrating Corporate Social Responsibility Criteria in Executive Compensation: Effectiveness and Implications for Firm Outcomes
12.1% of the S&P 500 companies had adopted CSR contracting by 2004, this ratio increased to 36.7% by 2013. As discussed above, the recent years have witnessed dramatic environmental, regulatory, and societal developments, which likely increased the pressure on boards of directors to take action with respect to stakeholder engagement, e.g., through the adoption of CSR contracting. The trend in Table 3 is consistent with these arguments.
------Insert Table 3 about here------
METHODOLOGY
Ordinary least squares (OLS) regressions
To examine whether the adoption of CSR contracting affects firm-level outcomes, we estimate the following regression:
yit = αi + αt + β × CSR contractingit–1 + γ’Xit–1 + εit, (1)
where i indexes firms; t indexes years; αi and αt are firm and year fixed effects, respectively; y is the dependent variable of interest; CSR contracting is the CSR contracting variable in the preceding year; X is the vector of control variables (size, ROA, leverage, cash holdings, total executive pay, and the breakdown of executive pay into its components) in the preceding year; ε is the error term. To account for dependence across firms within the same industry, we cluster standard errors at the 2-digit SIC industry level. The coefficient of interest is β, which captures the change in y following the adoption of CSR criteria in executive compensation (i.e., when CSR contracting switches from 0 to 1).
The inclusion of control variables mitigates the possibility that our findings are driven by omitted variables. For example, it could be that more profitable companies are more likely to adopt CSR contracting (since they can more easily afford to devote resources to stakeholder engagement), while at the same time they are more likely to generate, e.g., green patents (since they might be better able to invest in R&D). Controlling for profitability (ROA) addresses this potential confound. Similarly, it could be that boards of directors redesign the executives’ entire compensation package when incorporating CSR performance criteria. If, for some reason, boards systematically adjust other components of executive pay (e.g., stock options) when implementing CSR criteria, such adjustments may confound our findings. The inclusion of compensation-level controls (e.g., the share of option-based compensation) alleviates this possibility. In addition, the inclusion of firm fixed effects accounts for any time-invariant firm characteristics that may affect both the adoption of CSR contracting and firm-level outcomes. Finally, the inclusion of year fixed effects accounts for economy-wide factors that could affect both CSR contracting and the outcome variables of interest.

16
Corporate Governance and the Rise of Integrating Corporate Social Responsibility Criteria in Executive Compensation: Effectiveness and Implications for Firm Outcomes
Two-stage least squares (2SLS) regressions
While the controls and fixed effects help address potential confounds, they do not fully rule out the possibility that unobservable time-varying firm characteristics may drive a spurious relationship between CSR contracting and y. In other words, equation (1) is subject to a standard endogeneity problem―the adoption of CSR-based criteria in executive compensation is not random and can correlate with unobservables that may also affect the outcome variables of interest. In such cases, the estimate of β would be inconsistent.
To obtain a consistent estimate of β, we need an instrument for CSR contracting—that is, a variable that triggers exogenous shifts in the propensity to adopt CSR-based criteria in executive compensation. The specific instrument that we exploit in this paper is the enactment of state-level constituency statutes. This follows the methodology of Flammer and Kacperczyk (2016) and Flammer (2017), who use constituency statutes to study the effect of stakeholder orientation on corporate innovation and the allocation of procurement contracts, respectively.
Constituency statutes
Constituency statutes allow corporate officers and directors to take into account the interests of a variety of corporate stakeholders in carrying out their fiduciary duties to the corporation. The statutes suggest that a corporation should, or at least may, be run in the interests of more groups than just shareholders. Hence, under these statutes, a corporation’s officers and directors are allowed to consider the interests of employees, customers, suppliers, the environment, the local community, and any other potentially affected constituency (e.g., Orts 1992). Prior to the enactment of stakeholder statutes, corporate directors were not explicitly permitted by written law to consider stakeholders’ interests in their decision-making. Therefore, the enactment of constituency statutes sent a strong signal and provided corporate leaders with a mechanism for considering stakeholder interests without breaching their fiduciary obligations to shareholders. Proponents of those statutes sought to reflect their belief that corporations are more than just investment vehicles for owners of financial capital in corporate law (Bainbridge, 1992). For example, the Pennsylvania statute reads:
“In discharging the duties of their respective positions, the board of directors, committees of the board and individual directors of a domestic corporation may, in considering the best interests of the corporation, consider the effects of any action upon employees, upon suppliers and customers of the corporation and upon communities in which offices or other establishments of the corporation are located, and all other pertinent factors.” (15 Pa. Cons. Stat. § 516(a))
Though the language may be state-specific, the core content of the legislation remains the same: constituency statutes emphasize the importance of considering the interests of nonfinancial stakeholders and hence pursuing interests that are not restricted to the bottom line. In fact, most statutes give corporate leaders permission to consider stakeholder interests in any circumstance,

17
Corporate Governance and the Rise of Integrating Corporate Social Responsibility Criteria in Executive Compensation: Effectiveness and Implications for Firm Outcomes
including any structural and operational decisions, or whenever corporate leaders wish to consider them.
To date, a total of 35 states in the U.S. have adopted constituency statutes (see Karpoff and Wittry, 2015). Two of them adopted a constituency statute during the sample period—Texas in 2006 and Nebraska in 2007. Accordingly, we can exploit these two legislations to obtain a 2SLS estimate of the impact of CSR contracting on firm-level outcomes. Importantly, because the enactment of the statutes does not reflect any firm’s strategic decision, such “treatments” offer plausibly exogenous variation in a firm’s propensity to use CSR criteria in executive compensation.
First-stage regression
In the first-stage regression, we regress CSR contracting on the enactment of constituency statutes. Specifically, we estimate the following regression:
CSR contractingit = ai + at + b × constituency statuteit + c’Xit + eit, (2)
where constituency statute is the “treatment dummy,” which is equal to one if firm i is incorporated in a state that has enacted a constituency statute by year t.19 The other variables are the same as in equation (1). Effectively, equation (2) is a difference-in-differences specification, that is, the coefficient b measures the change in the probability of adopting CSR contracting after the treatment (first difference) in the treatment versus control groups (second difference).
In their evaluation of the difference-in-differences methodology, Bertrand, Duflo, and Mullainathan (2003) recommend that standard errors be clustered at the dimension of the treatment. Accordingly, when estimating equation (2), we cluster standard errors at the state of incorporation level. (We obtain similar results if standard errors are clustered at the 2-digit SIC level.)
Second-stage regression
The predicted values from equation (2) provide CSR contracting (instrumented)―that is, the exogenous component of CSR contracting. In the second-stage regression, we then re-estimate equation (1) using CSR contracting (instrumented) instead of CSR contracting:
yit = αi + αt + β2SLS × CSR contracting (instrumented)it–1 + γ’Xit–1 + εit. (3)
19 States of incorporation are obtained from Compustat. A caveat is that Compustat only reports the state of incorporation for the latest available year. Nevertheless, this caveat is unlikely to matter for our results. Indeed, prior research suggests that changes in states of incorporation are very rare (e.g., Cheng, Nagar, and Rajan, 2004; Romano, 1993).

18
Corporate Governance and the Rise of Integrating Corporate Social Responsibility Criteria in Executive Compensation: Effectiveness and Implications for Firm Outcomes
The coefficient β2SLS then provides a consistent estimate of the effect of CSR contracting on y.
RESULTS
CSR contracting and firm-level outcomes
OLS regressions
In Table 4, we regress firm-level outcomes on CSR contracting. The underlying specification is equation (1)—that is, each regression includes controls as well as firm and year fixed effects. All right-hand side variables are lagged by one year.
------Insert Table 4 about here------
Time horizons. In column (1), the dependent variable is the long-term index (LT-index). Following the adoption of CSR contracting, the LT-index increases by 1.2 percentage points (t = 3.01). These findings are in line with Hypothesis 1 stating that the adoption of CSR contracting has a positive impact on organizational time horizons.
Firm value. In column (2), we find that the adoption of CSR contracting is value-enhancing. Following the adoption of CSR contracting, Tobin’s Q increases by 0.062 (t = 2.00). Since the average Tobin’s Q is 1.984 (see Table 1), this corresponds to an increase in firm value by 3.1%.20 This evidence is supportive of Hypothesis 2 according to which CSR contracting is value-enhancing.21
CSR performance. In column (3), we examine how the adoption of CSR contracting affects the KLD-index. As is shown, the KLD-index increases by 0.2 index points (t = 1.91)—since the
20 A 3.1% increase in firm value is economically large. It is in the ballpark of the value implications of other governance mechanisms. For example, Cuñat, Giné, and Guadalupe (2012) find that the removal of antitakeover provisions (e.g., poison pills, classified boards) leads to a 2.8% increase in shareholder value; Cuñat, Giné, and Guadalupe (2016) find that the adoption of “say on pay” increases value by 5.8%. Similarly, our estimate is in the ballpark of the value gains associated with higher CSR. In particular, Flammer (2015a) finds that the adoption of CSR provisions increases shareholder value by 1.8%; Edmans (2012) finds that companies listed in the “100 Best Companies to Work For in America” achieve higher valuations by 2.3% to 3.8%. 21 Formally, firm value V is the sum of the discounted expected future cash flows, i.e., ∑ E , where
r is the discount rate and Ct is the firm’s cash flow (“profits”) at time t. Mechanically, an increase in long-term profits increases V. In Appendix Table A6, we explicitly distinguish between firm value (Tobin’s Q) and firm profits (ROA), and study the dynamics of the effect of CSR contracting on both outcomes. Specifically, we re-estimate our baseline regression, but using as dependent variables Tobin’s Qt, Tobin’s Qt+1, Tobin’s Qt+2, as well as ROAt, ROAt+1, ROAt+2. (Since CSR contracting is measured at t–1, this captures the effect of CSR contracting 1, 2, and 3 years, respectively, after the adoption of CSR contracting.) As can be seen, Tobin’s Q already increases in year t (and remains high in the subsequent years). In contrast, ROA does not increase in the short run (year t), it increases marginally in year t+1, and it is only in year t+2 that the increase is large and statistically significant. This suggests that it takes a few years for CSR contracting to translate into higher profits. This increase in long-term profits is reflected in an increase in firm value (V in the above formula). Note that this pattern is consistent with what has been found in the CSR literature. For example, Flammer (2015a) finds that the adoption of CSR initiatives leads to an increase in profitability (ROA) in the long run, yet firm value (Tobin’s Q) already increases within a year.

19
Corporate Governance and the Rise of Integrating Corporate Social Responsibility Criteria in Executive Compensation: Effectiveness and Implications for Firm Outcomes
average KLD-index is 3.84, this implies that CSR performance increases by 5.2%. In columns (4)-(5) we further distinguish between the less salient stakeholders (the natural environment and communities) and the more salient ones (employees and customers). As is shown, the increase in CSR performance is more pronounced for the less salient stakeholders. This finding lends support to Hypothesis 3.
Emissions. In column (6), we use the TRI data to examine the relationship between CSR contracting and emissions. As can be seen, we find that emissions decrease by 8.7% (t = 3.63) following the adoption of CSR contracting. This evidence is supportive of Hypothesis 4 according to which CSR contracting incentivizes managers to reduce emissions.
Green patents. In columns (7)-(9), we examine how CSR contracting affects the pursuit of green innovations. In column (7), we find that the ratio of green patents to total patents increases by 2.8 percentage points (t = 2.33) following the adoption of CSR contracting, which is consistent with Hypothesis 4. The increase is especially pronounced for green patents pertaining to pollution and recycling (column (8)) as opposed to renewable energies (column (9)).
2SLS regressions
As discussed in the methodology section, a caveat of the analysis presented in Table 4 is the potential endogeneity of CSR contracting with respect to the firm-level outcomes of interest. The inclusion of controls as well as firm and year fixed effects helps mitigate this caveat, but does not fully rule it out. In the following, we further address this point by using the enactment of constituency statutes as an instrument for the adoption of CSR contracting.
The first-stage regression is provided in Appendix Table A1. As can be seen, the enactment of constituency statutes triggers a significant increase in the propensity to adopt CSR contracting. On average, firms incorporated in the treated states are 14.4% more likely to adopt CSR criteria in executive compensation following the enactment of constituency statutes. The F-statistic of the instrument is 47.0, which lies well above Staiger and Stock’s (1997) threshold for “strong” instruments (F-statistic > 10).
The second-stage regressions are provided in Table 5. As is shown, the results mirror very closely those in Table 4. Note that the significance is generally lower in Table 5. This is not surprising given that only two states adopted a constituency statute during the sample period—i.e., relatively few observations contribute to the identification. As such, the second-stage regressions presented in Table 5 have less power. Importantly, however, the point estimates remain similar to the baseline estimates in Table 4.
------Insert Table 5 about here------
Robustness
In the Appendix (and Appendix Tables A1-A5), we present several robustness checks that are variants of the baseline specifications used in Tables 4 and 5. In a nutshell, we show that our results

20
Corporate Governance and the Rise of Integrating Corporate Social Responsibility Criteria in Executive Compensation: Effectiveness and Implications for Firm Outcomes
are robust when we i) estimate our regressions without controls; ii) include state × year fixed effects to account for unobservable trends at the regional level; iii) include lagged dependent variables as controls and use the GMM estimator of Arellano and Bond (1991); and iv) use alternative measures of social and environmental performance.
Symbol versus substance
In the analysis so far, we studied CSR contracting as a binary outcome—i.e., whether companies adopt CSR contracting or not. However, there is considerable heterogeneity in how CSR criteria are formulated. In particular, some companies are vague (simply stating in general terms that CSR performance is taken into account), while other companies are specific (indicating the amount of compensation that is linked to CSR performance). Arguably, the latter is more substantive and might be a more effective governance tool.
We examine this question in Table 6. Specifically, we re-estimate our baseline regressions from Tables 4 and 5, but interacting CSR contracting with a dummy variable that indicates whether the company specifically indicates the amount of compensation that is linked to CSR performance (specific). As can be seen, we indeed find that our results are significantly stronger when companies are specific in the formulation of their CSR-based compensation.22
------Insert Table 6 about here------ In addition, for those companies that specify the amount of CSR compensation, we can use
the dollar amount of CSR-based compensation as another measure of “substantiveness.” More precisely, we compute the share of CSR compensation, which is defined as the ratio of CSR-based compensation to total compensation. The average of this ratio is 4.2% (the standard deviation is 5.3%). We then re-estimate our baseline regressions, but using the continuous variable share of CSR compensation instead of the binary variable CSR contracting.23
The results are presented in Table 7. As can be seen, the results based on the continuous measure are consistent with our baseline results—an increase in the share of CSR-based compensation leads to a significant increase in time horizons, firm value, CSR performance (especially with respect to the less salient stakeholders), and green patenting (especially with respect to pollution and recycling), along with a significant reduction in emissions. The results are economically significant as well. For example, a one-standard deviation increase in the share of CSR compensation leads to an increase in firm value by 2.9%. 24 Similarly, a one-standard deviation increase in the share of CSR compensation leads to an increase in the LT-index by 0.9
22 The effect on the salient stakeholders and renewable energies remain insignificant (see columns (5) and (9), respectively), which is consistent with our baseline results. 23 In the regressions, we set the share of CSR compensation to zero if the company does not use CSR contracting. Companies that use CSR contracting, but do not specify the amount (so that the share of CSR compensation cannot be computed) are excluded from this analysis. 24 The coefficient in column (2) of the upper panel is 1.090. Since the average Tobin’s Q is 1.984, and the standard deviation of the share of CSR compensation is 0.053, this implies that a one-standard deviation increase in the share of CSR compensation increases firm value by 0.053 × 1.090 / 1.984 = 2.9%. Similarly, the coefficient in column (2) of the bottom panel implies an increase in firm value by 0.053 × 1.084 / 1.984 = 2.9%.
21
Corporate Governance and the Rise of Integrating Corporate Social Responsibility Criteria in Executive Compensation: Effectiveness and Implications for Firm Outcomes
percentage point, an increase in the KLD-index by 5.6%, a reduction in TRI by 4.9%, and an increase in green patenting by 3.9 percentage points. Overall, the results in Tables 6 and 7 indicate that CSR contracting is a more effective governance tool if it is substantive, which lends support to Hypothesis 5.
------Insert Table 7 about here------
DISCUSSION AND CONCLUSION
A recent phenomenon in corporate governance is the inclusion of CSR criteria in executive compensation. In this study, we shed light on this new phenomenon by constructing a novel database that compiles information on CSR contracting covering all S&P 500 firms during a 10-year period (2004-2013). We start by documenting a series of stylized facts pertaining to CSR contracting. First, we show that CSR contracting is more prevalent in emission-intensive industries. Second, we show that CSR contracting has become more prevalent over time.
We then examine how the adoption of CSR contracting affects firm-level outcomes. Our results indicate that the adoption of CSR contracting leads to i) an increase in organizational time horizons, ii) an increase in firm value, iii) an increase in CSR performance (especially with respect to the less salient stakeholders such as the natural environment and local communities), iv) a reduction in emissions, and v) higher engagement in the development of “green” innovations. Overall, these results are consistent with our arguments that CSR contracting helps direct managers’ attention to stakeholders that are less salient but financially material to the firm in the long run, thereby enhancing corporate governance.
Finally, we find that our results are stronger i) when companies specify the amount of CSR-based compensation (that is, when they are specific instead of vague), and ii) when the share of CSR-based compensation is higher. This suggests that CSR contracting as a governance tool is more effective when it is substantive.
Our study contributes to the literature in several ways. First, to the best of our knowledge, this study is the first to explore the rising phenomenon of integrating CSR criteria in executive compensation. This analysis is made possible by the novel database we compiled for this study. As such, our study establishes several key results pertaining to CSR contracting—its evolution over time, its prevalence across industries, and how it affects firm-level outcomes.
Second, this study highlights a new lever in executive compensation that boards of directors can use to influence managerial incentives. As such, our study adds a new dimension—environmental and societal considerations—to the large literature that explores the optimal design of executive compensation (for recent surveys, see Edmans and Gabaix, 2016; Edmans, Gabaix, and Jenter, 2017).
Third, this study explores whether and under what conditions CSR contracting helps improve the governance of a company by shifting managerial attention towards stakeholders that are less salient, yet financially material to the firm in the long run. As such, the insights of this study contribute to the multi-disciplinary dialogue on the role of time horizons and intertemporal

22
Corporate Governance and the Rise of Integrating Corporate Social Responsibility Criteria in Executive Compensation: Effectiveness and Implications for Firm Outcomes
decision-making in organizations (e.g., Flammer and Bansal, 2017; Laverty, 1996, 2004; Slawinski and Bansal, 2015; Souder and Bromiley, 2012), and to the few but notable studies at the intersection of corporate governance and CSR practices (e.g., Aguilera and Jackson, 2003; Aguilera et al., 2006; Amore and Bennedsen, 2016; Berrone and Gomez-Mejia, 2009; Hong, Li, and Minor, 2016; Walls, Berrone, and Phan, 2012). Specifically, while extant work has viewed corporate governance in a traditional sense (i.e., distinct from stakeholder engagement) and examined its relation to CSR practices, we take a fundamentally different approach—we argue that managers’ degree of attention to different stakeholders is part of corporate governance.
Fourth, we contribute to the corporate governance literature that examines the symbolism and substance of governance mechanisms (e.g., Westphal and Zajac, 1994; Zajac and Westphal, 1995). This literature suggests that some governance mechanisms may lack substance and be merely symbolic. In this vein, our results indicate that CSR contracting as a governance tool is more likely to be effective when it is substantive (e.g., if the amount of CSR-based compensation is specified), which highlights the importance of the design of CSR contracting.
Our study is subject to several limitations. First, while the enactment of constituency statutes helps address the potential endogeneity of CSR contracting (e.g., companies may adopt CSR contracting in anticipation of future changes in investment decisions or stricter environmental regulations), we caveat that this instrument is only based on a few states (i.e., a few “treatments”) during our sample period—a challenge for future research is to find instruments with broader validity. Second, our data only cover S&P 500 companies, that is, the largest firms in the U.S. Whether our findings generalize to smaller companies and companies outside the U.S., respectively, remains to be established. Third, our study examines CSR incentives of the company’s executives. An open question is how these incentives propagate within the corporate hierarchy (e.g., at the level of the middle management). Shedding light on this question would require detailed micro data on the firm’s organizational structure, along with the detailed compensation information.
Lastly, our study has relevant managerial and policy implications. Our findings indicate that CSR contracting helps direct managers’ attention to less salient stakeholders that are financially material to the company in the long run. As such, CSR contracting provides an additional tool in the “bundle” of governance mechanisms that boards of directors can use to incentivize managers to take value-enhancing actions.25 From a broader perspective, it is important to note that—although CSR contracting leads to improvements in social and environmental performance—the provision of such private incentives need not lead to the global optimum from a societal perspective. For example, while private incentives may improve firms’ environmental footprint (e.g., through more green innovations), managers are unlikely to internalize the full extent
25 Another tool in the bundle of governance mechanisms that may be effective in this context is the provision of long-term executive pay. In this vein, Flammer and Bansal (2017) show that the adoption of long-term executive compensation—such as restricted stocks, restricted stock options, and the so-called LTIPs (long-term incentive plans)—is value-enhancing.

23
Corporate Governance and the Rise of Integrating Corporate Social Responsibility Criteria in Executive Compensation: Effectiveness and Implications for Firm Outcomes
of the firm’s negative (and positive) externalities in their decision-making. As a result, private incentives are unlikely to be sufficient to tackle grand challenges such as climate change. Other mechanisms, such as effective government regulations (e.g., carbon pricing), are needed. Exploring these issues is an exciting avenue for future research.
REFERENCES
Aghion P, Tirole J. 1994. The management of innovation. Quarterly Journal of Economics 109(4): 1185–1209.
Aghion P, Van Reenen J, Zingales L. 2013. Innovation and institutional ownership. American Economic Review 103(1): 277–304.
Aguilera RV, Jackson G. 2003. The cross-national diversity of corporate governance: dimensions and determinants. Academy of Management Journal 28(3): 447–465.
Aguilera RV, Williams CA, Conley JM, Rupp DE. 2006. Corporate governance and social responsibility: a comparative analysis of the UK and the US. Corporate Governance: An International Review 14(3): 147–158.
Allen DT, Shonnard DR. 2011. Sustainable engineering: Concepts, Design and Case Studies. Prentice Hall: Upper Saddle River, NJ.
Amore MD, Bennedsen M. 2016. Corporate governance and green innovation. Journal of Environmental Economics and Management 75(1): 54–72.
Arellano M, Bond S. 1991. Some tests of specification for panel data: Monte Carlo evidence and an application to employment equations. Review of Economic Studies 58(2): 277–297.
Azoulay P, Graff Zivin JS, Manso G. 2011. Incentives and creativity: evidence from the academic life sciences. RAND Journal of Economics 42(3): 527–554.
Bainbridge SM. 1992. Interpreting nonshareholder constituency statutes. Pepperdine Law Review 19(3): 971–1025.
Banker RD, Potter G, Srinivasan D. 2000. An empirical investigation of an incentive plan that includes nonfinancial performance measures. Accounting Review 75(1): 65–92.
Bansal P, Roth K. 2000. Why companies go green: a model of ecological responsiveness. Academy of Management Journal 43(4): 717‒736.
Barnett ML, Salomon RM. 2006. Beyond dichotomy: the curvilinear relationship between social responsibility and financial performance. Strategic Management Journal 27(11): 1101–1122.
Behn BK, Riley RA. 1999. Using nonfinancial information to predict financial performance: the case of the US airline industry. Journal of Accounting, Auditing, and Finance 14(1), 29–56.
Berrone P, Gomez-Mejia LR. 2009. Environmental performance and executive compensation: an integrated agency-institutional perspective. Academy of Management Journal 52(1): 103–126.
Bertrand M, Duflo E, Mullainathan S. 2004. How much should we trust differences-in-differences estimates? Quarterly Journal of Economics 119(1): 249–275.
Bertrand M, Mullainathan S. 2003. Enjoying the quiet life? Corporate governance and managerial preferences. Journal of Political Economy 111(5): 1043–1075.
Bushman RM, Indjejikian RJ, Smith A. 1996. CEO compensation: the role of individual performance evaluation. Journal of Accounting and Economics 21(2): 161–193.

24
Corporate Governance and the Rise of Integrating Corporate Social Responsibility Criteria in Executive Compensation: Effectiveness and Implications for Firm Outcomes
Chatterji AK, Toffel MW. 2010. How firms respond to being rated. Strategic Management Journal 31(9): 917‒945.
Cheng S, Nagar V, Rajan MV. 2004. Identifying control motives in managerial ownership: evidence from antitakeover legislation. Review of Financial Studies 18(2): 637–672.
Clelland IJ, Dean TJ, Douglas TJ. 2000. Stepping towards sustainable business: An evaluation of waste minimization practices in U.S. manufacturing. Interfaces 30(3): 107–124.
CNN. 2016. 175 countries sign landmark climate agreement. CNN 22 April. Cuñat V, Giné M, Guadalupe M. 2012. The vote is cast: the effect of corporate governance on
shareholder value. Journal of Finance 67(5), 1943‒1977. Cuñat V, Giné M, Guadalupe M. 2016. “Say” pays! Shareholder voice and firm performance.
Review of Finance, forthcoming. DeGeorge F, Patel J, Zeckhauser R. 1999. Earnings management to exceed thresholds. Journal of
Business 72(1): 1‒33. Delmas MA, Pekovic S. 2013. Environmental standards and labor productivity: understanding the
mechanisms that sustain sustainability. Journal of Organizational Behavior 34(2): 230–252. Du S, Bhattacharya CB, Sen S. 2011. Corporate social responsibility and competitive advantage:
overcoming the trust barrier. Management Science 57(9): 319–335. Eccles RG, Ioannou I, Serafeim G. 2014. The impact of corporate sustainability on organizational
processes and performance. Management Science 60(11): 2835–2857. Edmans A. 2011. Does the stock market fully value intangibles? Employee satisfaction and equity
prices. Journal of Financial Economics 101(3): 621‒640. Edmans A. 2012. The link between job satisfaction and firm value, with implications for corporate
social responsibility. Academy of Management Perspectives 26(4): 1‒19. Edmans A, Gabaix X. 2016. Executive compensation: a modern primer. Journal of Economic
Literature, forthcoming. Edmans A, Gabaix X, Jenter D. 2017. Executive compensation: a survey of theory and evidence.
NBER working paper 23596, National Bureau of Economic Research, Cambridge, MA. Eesley C, Lenox MJ. 2006. Firm responses to secondary stakeholder action. Strategic Management
Journal 27(8): 765‒781. Elfenbein DW, Fisman R, McManus B. 2012. Charity as a substitute for reputation: evidence from
an online marketplace. Review of Economic Studies 79(4): 1441‒1468. Feltham GA, Xie J. 1994. Performance measure congruity and diversity in multi-task
principal/agent relations. Accounting Review 69(3): 429‒453. Financial Times. 2011. Bonuses: targets are linked to pay by early adopters. Financial Times 7
June. Financial Times. 2015. Mark Carney warns investors face ‘huge’ climate change losses. Financial
Times 29 September. Flammer C. 2013. Corporate social responsibility and shareholder reaction: the environmental
awareness of investors. Academy of Management Journal 56(3): 758‒781. Flammer C. 2015a. Does corporate social responsibility lead to superior financial performance? A
regression discontinuity approach. Management Science, 61(11): 2549‒2568. Flammer C. 2015b. Does product market competition foster corporate social responsibility?
Evidence from trade liberalization. Strategic Management Journal 36(10): 1469–1485. Flammer C. 2017. Competing for government procurement contracts: the role of corporate social
responsibility. Working paper, Boston University, Boston, MA.

25
Corporate Governance and the Rise of Integrating Corporate Social Responsibility Criteria in Executive Compensation: Effectiveness and Implications for Firm Outcomes
Flammer C, Bansal P. 2017. Does long-term orientation create value? Evidence from a regression discontinuity. Strategic Management Journal 38(9): 1827‒1847.
Flammer C, Kacperczyk A. 2016. The impact of stakeholder orientation on innovation: evidence from a natural experiment. Management Science 62(7): 1982‒2001.
Flammer C, Luo J. 2017. Corporate social responsibility as an employee governance tool: evidence from a quasi-experiment. Strategic Management Journal 38(2): 163‒183.
Forbes. 2010. Executive bonuses and corporate responsibility. Forbes 20 May. Fortune. 2015. Energy companies face big risks from Paris climate deal. Fortune 17 December. Freeman RE. 1984. Strategic Management: A Stakeholder Approach. Pitman: Boston, MA. Frydman C, Jenter D. 2010. CEO Compensation. Annual Review of Financial Economics 2(1):
75–102. Gibbons R, Murphy KJ. 1992. Optimal incentive contracts in the presence of career concerns:
theory and evidence. Journal of Political Economy 100(3): 468–505. Graham JR, Harvey CR, Rajgopal S. 2005. The economic implications of corporate financial
reporting. Journal of Accounting and Economics 40(1–3): 3–73. Graves SB, Waddock SA. 2000. Beyond built to last ... stakeholder relations in “built-to-last”
companies. Business and Society Review 105(4): 393–418. GreenBiz. 2012. Why it’s time to link compensation with sustainability. GreenBiz 26 April. Griliches Z. 1990. Patent statistics as economic indicators: a survey. Journal of Economic
Literature 28(4): 1661–1707. Hall BH, Jaffe AB, Trajtenberg M. 2005. Market value and patent citations. RAND Journal
Economics 36(1): 16–38. Hamilton J. 1995. Pollution as news: media and stock market reactions to the TRI data. Journal of
Environmental Economics and Management 28(1): 98–113. Hart SL. 1995. A natural-resource-based view of the firm. Academy of Management Review 20(4):
986–1014. Harvard Business Review. 2015. The best-performing CEOs in the world. Harvard Business
Review 93(11): 49–59. Henisz WJ, Dorobantu S, Nartey LJ. 2014. Spinning gold: the financial returns to stakeholder
engagement. Strategic Management Journal 35(12): 1727–1748. Holmstrom B. 1979. Moral hazard and observability. Bell Journal of Economics 10(1): 74–91. Holmstrom B. 1999. Managerial incentive problems: a dynamic perspective. Review of Economic
Studies 66(1): 169–182. Hong B, Li Z, Minor D. 2016. Corporate governance and executive compensation for corporate
social responsibility. Journal of Business Ethics 136(1): 199–213. Ittner CD, Larcker DF. 1998. Are nonfinancial measures leading indicators of financial
performance? An analysis of customer satisfaction. Journal of Accounting Research 36(Supplement): 1‒35.
Ittner CD, Larcker DF, Rajan MV. 1997. The choice of performance measures in annual bonus contracts. Accounting Review 72(2): 231‒255.
Jensen MC. 1986. Agency costs of free cash flow, corporate finance, and takeovers. American Economic Review 76(2): 323–329.
Karpoff JM, Wittry MD. 2015, Institutional and political economy considerations in natural experiments: the case of state antitakeover laws. Working paper, University of Washington: Seattle, WA.

26
Corporate Governance and the Rise of Integrating Corporate Social Responsibility Criteria in Executive Compensation: Effectiveness and Implications for Firm Outcomes
Khan M, Serafeim G, Yoon A. 2016. Corporate sustainability: first evidence on materiality. Accounting Review, forthcoming.
King AA, Lenox MJ. 2000. Industry self-regulation without sanctions: the chemical industry’s responsible care program. Academy of Management Journal 43(4): 698–716.
King BG, Soule SA. 2007. Social movements as extra-institutional entrepreneurs: the effect of protests on stock price returns. Administrative Science Quarterly 52(3): 413–442.
Klassen RD, McLaughlin CP. 1996. The impact of environmental management on firm performance. Management Science 42(8): 1199‒1214.
KLD. 2010. How to Use KLD Stats & ESG Ratings Definitions. RiskMetrics Group: Boston, MA. Kotler P, Hessekiel D, Lee N. 2012. GoodWorks!: Marketing and Corporate Initiatives that Build
a Better World … and the Bottom Line. Wiley: Hoboken, NJ. Laverty KJ. 1996. Economic “short-termism”: the debate, the unresolved issues, and the
implications for management practice and research. Academy of Management Review 21(3): 825–860.
Laverty KJ. 2004. Managerial myopia or systemic short-termism? The importance of managerial systems in valuing the long term. Management Decision 42(8): 949–962.
Luo X, Bhattacharya CB. 2006. Corporate social responsibility, customer satisfaction, and market value. Journal of Marketing 70(4): 1–18.
Marquis C, Qian C. 2014. Corporate social responsibility reporting in China: symbol or substance? Organization Science 25(1): 127–148.
Maxwell JW, Lyon TP, Hackett SC. 2000. Self-regulation and social welfare: the political economy of corporate environmentalism. Journal of Law and Economics 43(2): 583‒618.
Meyer JW, Rowan B. 1977. Institutionalized organizations: formal structure as myth and ceremony. American Journal of Sociology 83(2): 340–363.
Mitchell RK, Agle BR, Wood DJ. 1997. Toward a theory of stakeholder identification and salience: defining the principle of who and what really counts. Academy of Management Review 22(4): 853–886.
New York Times. 2015. Citing climate change, Obama rejects construction of Keystone XL oil pipeline. New York Times 6 November.
Okhmatovskiy I, David RJ. 2012. Setting your own standards: internal corporate governance codes as a response to institutional pressure. Organization Science 23(1): 155–176.
Orts EW. 1992. Beyond shareholders: interpreting corporate constituency statutes. George Washington Law Rev. 61(1): 14–135
Pruitt SW, Friedman M. 1986. Determining the effectiveness of consumer boycotts: a stock price analysis of their impact on corporate targets. Journal of Consumer Policy 9(4): 375-387.
Romano R. 1993. Competition for corporate charters and the lesson of takeover statutes. Fordham Law Review 61(4): 843–864.
Rusinko CA. 2007. Green manufacturing: an evaluation of environmentally sustainable manufacturing practices and their impact on competitive outcomes. IEEE Transactions on Engineering Management 54(3): 445–454.
Russo MV, Fouts PA. 1997. A resource-based perspective on corporate environmental performance and profitability. Academy of Management Journal 40(3): 534–559.
Russo MV, Harrison NS. 2005. Organizational design and environmental performance: clues from the electronics industry. Academy of Management Journal 48(4): 582–593.
Sen S, Bhattacharya CB. 2001. Does doing good always lead to doing better? Consumer reactions

27
Corporate Governance and the Rise of Integrating Corporate Social Responsibility Criteria in Executive Compensation: Effectiveness and Implications for Firm Outcomes
to corporate social responsibility. Journal of Marketing Research 38(2): 225–243. Slawinski N, Bansal P. 2015. Short on time: intertemporal tensions in business sustainability.
Organization Science 26(2): 531–549. Souder D, Bromiley P. 2012. Explaining temporal orientation: evidence from the durability of
firms’ capital investments. Strategic Management Journal 33(5): 550–569. Staiger D, Stock JH. 1997. Instrumental variables regression with weak instruments. Econometrica
65(3): 557–586. Stein JC. 1988. Takeover threats and managerial myopia. Journal of Political Economy 96(1): 61–
80. Stein JC. 1989. Efficient capital markets, inefficient firms: a model of myopic corporate behavior.
Quarterly Journal of Economics 104(4): 655‒669. The Guardian. 2011. Measuring social performance is difficult but essential. The Guardian 2
September. United Nations. 2016. ‘Today is an historic day,’ says Ban, as 175 countries sign Paris climate
accord. United Nations 22 April. Van Laer J, Van Aelst P. 2010. Internet and social movement action repertoires. Information,
Communication & Society 13(8): 1146–1171. Wall Street Journal. 2008. Environmentalism sprouts up on corporate boards. Wall Street Journal
11 August. Wall Street Journal. 2015. Clinton gets it right on short-termism. Wall Street Journal 29 July. Walls JL, Berrone P, Phan PH. 2012. Corporate governance and environmental performance: is
there really a link? Strategic Management Journal 33(8): 885–913. Westphal JD, Zajac EJ. 1994. Substance and symbolism in CEO’s long-term incentive plans.
Administrative Science Quarterly 39(3): 367–390. Zajac EJ, Westphal JD. 1995. Accounting for the explanations of CEO compensation: substance
and symbolism. Administrative Science Quarterly 40(2): 283–308.

28
Corporate Governance and the Rise of Integrating Corporate Social Responsibility Criteria in Executive Compensation: Effectiveness and Implications for Firm Outcomes
Table 1. Summary statistics
Notes. This table reports means, standard deviations, and Pearson correlation coefficients. The sample includes all firm-year observations for companies in the S&P 500 Index from 2004-2013.
N Mean Std. dev. 1 2 3 4 5 6 7 8 9 10 11 12 13 14
1 CSR contracting 4,533 0.238 0.4232 LT-index 4,533 0.752 0.149 0.093 KLD-index 3,154 3.841 3.545 0.14 0.014 Log(1 + TRI) 4,533 0.265 1.283 0.07 0.05 0.015 Green patents 716 0.232 0.235 0.10 0.14 -0.17 0.096 Tobinʼs Q 3,478 1.984 1.147 -0.21 -0.18 -0.06 -0.03 -0.237 ROA 4,152 0.038 0.021 -0.10 0.02 -0.01 0.04 -0.10 0.638 Size 4,519 9.495 1.427 0.17 -0.04 0.45 -0.04 -0.01 -0.51 -0.449 Leverage 4,283 0.228 0.149 0.09 0.22 0.04 0.00 0.20 -0.28 -0.18 0.08
10 Cash holdings 4,519 0.120 0.121 -0.14 -0.22 0.03 -0.04 -0.40 0.57 0.25 -0.25 -0.3511 Total compensation ($1,000) 4,533 5,318 3,902 0.07 0.04 0.27 -0.03 -0.06 -0.04 -0.01 0.39 -0.02 0.0412 % Cash compensation 4,533 0.411 0.148 -0.05 -0.02 -0.14 0.03 0.14 -0.03 0.02 -0.08 0.04 -0.09 -0.1813 % Stock-based compensation 4,533 0.337 0.184 0.12 0.05 0.14 -0.01 -0.02 -0.13 -0.10 0.16 0.03 -0.02 0.14 -0.5114 % Option-based compensation 4,533 0.202 0.161 -0.10 -0.04 -0.01 -0.01 -0.10 0.22 0.12 -0.14 -0.09 0.14 0.03 -0.29 -0.6115 % Other compensation 4,533 0.050 0.064 0.04 0.01 -0.02 -0.02 -0.01 -0.10 -0.07 0.07 0.07 -0.09 -0.03 -0.12 -0.15 -0.12

29
Corporate Governance and the Rise of Integrating Corporate Social Responsibility Criteria in Executive Compensation: Effectiveness and Implications for Firm Outcomes
Table 2. CSR contracting across industries
Notes. The sample includes all firm-year observations for companies in the S&P 500 Index from 2004-2013 (N = 4,533).
Major SIC sector N Mean Std. dev.
Agriculture, forestry, and fishing 10 0.500 0.527Construction 59 0.275 0.431Finance, insurance, and real estate 796 0.114 0.317Manufacturing 1,819 0.220 0.410Mining 281 0.566 0.497Retail trade 383 0.091 0.289Services 477 0.180 0.378Transportation, communications, electric, gas, and sanitary services 631 0.454 0.494Wholesale trade 77 0.026 0.160
All 4,533 0.238 0.423
% Firms with CSR contracting

30
Corporate Governance and the Rise of Integrating Corporate Social Responsibility Criteria in Executive Compensation: Effectiveness and Implications for Firm Outcomes
Table 3. CSR contracting over time
Notes. The sample includes all firm-year observations for companies in the S&P 500 Index from 2004-2013 (N = 4,533).
Year Mean Std. dev.
2004 0.121 0.3212005 0.151 0.3542006 0.206 0.3962007 0.246 0.4222008 0.285 0.4442009 0.227 0.4202010 0.234 0.4242011 0.241 0.4282012 0.261 0.4392013 0.367 0.483
All 0.238 0.423
% Firms with CSR contracting

31
Corporate Governance and the Rise of Integrating Corporate Social Responsibility Criteria in Executive Compensation: Effectiveness and Implications for Firm Outcomes
Table 4. CSR contracting and firm outcomes
Notes. All right-hand side variables are lagged by one year. Standard errors (clustered at the 2-digit SIC industry level) are reported in parentheses.
Long-term Firm
orientation value Emissions
Dependent variable: LT-index Tobinʼs Q KLD-index KLD-index KLD-index Log(1 + TRI) Green patents Green patents Green patents(environment (employees (pollution & (renewable
& communities) & customers) recycling) energies)
(1) (2) (3) (4) (5) (6) (7) (8) (9)
CSR contracting 0.012 0.062 0.208 0.130 0.079 -0.087 0.028 0.018 0.010(0.004) (0.031) (0.109) (0.061) (0.079) (0.024) (0.012) (0.010) (0.016)
Controls
Size -0.001 -0.313 -0.208 -0.238 0.029 -0.012 -0.003 -0.027 0.024(0.005) (0.040) (0.127) (0.071) (0.106) (0.023) (0.032) (0.028) (0.027)
ROA 0.227 7.342 3.152 -0.583 3.735 0.370 -0.147 0.255 -0.402(0.111) (1.375) (2.787) (1.544) (2.331) (0.573) (0.271) (0.345) (0.352)
Leverage 0.044 -0.430 0.169 0.457 -0.288 0.013 -0.044 -0.137 0.093(0.027) (0.188) (0.483) (0.261) (0.362) (0.073) (0.062) (0.098) (0.114)
Cash 0.000 1.249 -1.602 -0.960 -0.642 -0.137 0.156 0.109 0.047(0.026) (0.298) (0.760) (0.345) (0.594) (0.144) (0.093) (0.106) (0.078)
Log(total compensation) -0.004 0.037 0.128 0.003 0.125 0.029 -0.015 0.004 -0.020(0.003) (0.032) (0.086) (0.044) (0.063) (0.015) (0.021) (0.019) (0.014)
% Cash compensation 0.025 0.262 -0.765 -0.222 -0.543 0.050 0.100 0.089 0.011(0.018) (0.167) (0.643) (0.348) (0.588) (0.082) (0.111) (0.138) (0.099)
% Stock-based compensation 0.018 0.186 -0.149 0.130 -0.279 0.047 0.139 0.101 0.038(0.017) (0.158) (0.671) (0.368) (0.612) (0.091) (0.104) (0.122) (0.115)
% Option-based compensation 0.007 0.084 -0.103 0.186 -0.289 0.051 0.085 0.066 0.019(0.020) (0.173) (0.632) (0.359) (0.555) (0.087) (0.098) (0.131) (0.122)
Year fixed effects Yes Yes Yes Yes Yes Yes Yes Yes YesFirm fixed effects Yes Yes Yes Yes Yes Yes Yes Yes Yes
R-squared 0.53 0.87 0.84 0.79 0.79 0.93 0.84 0.81 0.60Observations 3,891 2,996 2,689 2,689 2,689 3,891 592 592 592
Green patentsCSR performance

32
Corporate Governance and the Rise of Integrating Corporate Social Responsibility Criteria in Executive Compensation: Effectiveness and Implications for Firm Outcomes
Table 5. CSR contracting and firm outcomes—2SLS regressions
Notes. All right-hand side variables are lagged by one year. Standard errors (clustered at the 2-digit SIC industry level) are reported in parentheses.
Long-term Firm
orientation value Emissions
Dependent variable: LT-index Tobinʼs Q KLD-index KLD-index KLD-index Log(1 + TRI) Green patents Green patents Green patents(environment (employees (pollution & (renewable
& communities) & customers) recycling) energies)
(1) (2) (3) (4) (5) (6) (7) (8) (9)
CSR contracting (instr.) 0.012 0.062 0.211 0.129 0.082 -0.087 0.028 0.018 0.010(0.005) (0.034) (0.122) (0.065) (0.090) (0.042) (0.013) (0.011) (0.024)
Controls
Size -0.001 -0.311 -0.203 -0.234 0.031 -0.014 -0.002 -0.027 0.024(0.006) (0.034) (0.114) (0.055) (0.086) (0.018) (0.016) (0.016) (0.028)
ROA 0.225 7.327 3.103 -0.614 3.716 0.390 -0.154 0.251 -0.404(0.085) (0.609) (1.966) (0.801) (1.949) (0.316) (0.397) (0.208) (0.417)
Leverage 0.042 -0.442 0.130 0.433 -0.303 0.030 -0.049 -0.141 0.092(0.029) (0.121) (0.576) (0.323) (0.299) (0.150) (0.077) (0.069) (0.114)
Cash -0.000 1.246 -1.613 -0.966 -0.647 -0.132 0.154 0.108 0.046(0.015) (0.244) (0.527) (0.312) (0.434) (0.057) (0.110) (0.059) (0.096)
Log(total compensation) -0.004 0.037 0.128 0.003 0.125 0.030 -0.015 0.004 -0.020(0.003) (0.032) (0.092) (0.040) (0.065) (0.009) (0.019) (0.019) (0.016)
% Cash compensation 0.024 0.259 -0.774 -0.228 -0.546 0.053 0.099 0.089 0.010(0.016) (0.206) (0.850) (0.221) (0.776) (0.060) (0.057) (0.089) (0.078)
% Stock-based compensation 0.018 0.186 -0.150 0.129 -0.279 0.048 0.139 0.101 0.038(0.014) (0.125) (0.767) (0.226) (0.711) (0.064) (0.069) (0.091) (0.080)
% Option-based compensation 0.006 0.080 -0.116 0.178 -0.294 0.057 0.084 0.065 0.019(0.016) (0.167) (0.803) (0.217) (0.750) (0.076) (0.079) (0.117) (0.100)
Year fixed effects Yes Yes Yes Yes Yes Yes Yes Yes YesFirm fixed effects Yes Yes Yes Yes Yes Yes Yes Yes Yes
R-squared 0.53 0.87 0.84 0.79 0.79 0.93 0.84 0.81 0.60Observations 3,891 2,996 2,689 2,689 2,689 3,891 592 592 592
CSR performance Green patents

33
Corporate Governance and the Rise of Integrating Corporate Social Responsibility Criteria in Executive Compensation: Effectiveness and Implications for Firm Outcomes
Table 6. Specific versus vague CSR criteria
Notes. All right-hand side variables are lagged by one year. Standard errors (clustered at the 2-digit SIC industry level) are reported in parentheses.
Long-term Firm
orientation value Emissions
Dependent variable: LT-index Tobinʼs Q KLD-index KLD-index KLD-index Log(1 + TRI) Green patents Green patents Green patents(environment (employees (pollution & (renewable
& communities) & customers) recycling) energies)
(1) (2) (3) (4) (5) (6) (7) (8) (9)
a. OLS regressions
CSR contracting 0.010 0.052 0.189 0.110 0.079 -0.074 0.024 0.014 0.010(0.005) (0.030) (0.102) (0.058) (0.075) (0.020) (0.014) (0.011) (0.014)
CSR contracting × Specific 0.007 0.018 0.112 0.102 0.010 -0.069 0.021 0.020 0.001(0.003) (0.008) (0.036) (0.028) (0.026) (0.019) (0.008) (0.009) (0.014)
Controls Yes Yes Yes Yes Yes Yes Yes Yes YesYear fixed effects Yes Yes Yes Yes Yes Yes Yes Yes YesFirm fixed effects Yes Yes Yes Yes Yes Yes Yes Yes Yes
R-squared 0.53 0.87 0.84 0.79 0.79 0.93 0.84 0.81 0.60Observations 3,891 2,996 2,689 2,689 2,689 3,891 592 592 592
b. 2SLS regressions
CSR contracting (instr.) 0.010 0.051 0.191 0.110 0.081 -0.076 0.024 0.015 0.009(0.005) (0.030) (0.108) (0.061) (0.083) (0.041) (0.014) (0.012) (0.022)
CSR contracting (instr.) × Specific 0.007 0.026 0.115 0.100 0.015 -0.066 0.023 0.021 0.002(0.004) (0.014) (0.051) (0.036) (0.041) (0.030) (0.011) (0.010) (0.016)
Controls Yes Yes Yes Yes Yes Yes Yes Yes YesYear fixed effects Yes Yes Yes Yes Yes Yes Yes Yes YesFirm fixed effects Yes Yes Yes Yes Yes Yes Yes Yes Yes
R-squared 0.53 0.87 0.84 0.79 0.79 0.93 0.84 0.81 0.60Observations 3,891 2,996 2,689 2,689 2,689 3,891 592 592 592
CSR performance Green patents
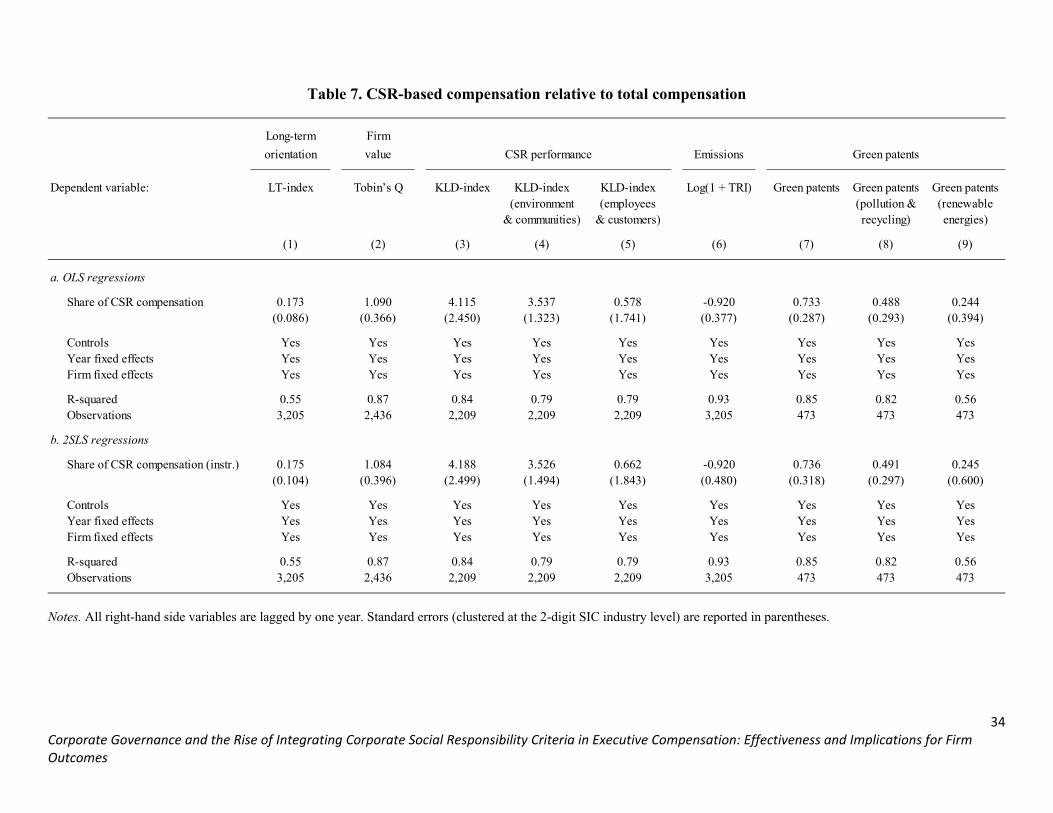
34
Corporate Governance and the Rise of Integrating Corporate Social Responsibility Criteria in Executive Compensation: Effectiveness and Implications for Firm Outcomes
Table 7. CSR-based compensation relative to total compensation
Notes. All right-hand side variables are lagged by one year. Standard errors (clustered at the 2-digit SIC industry level) are reported in parentheses.
Long-term Firm
orientation value Emissions
Dependent variable: LT-index Tobinʼs Q KLD-index KLD-index KLD-index Log(1 + TRI) Green patents Green patents Green patents(environment (employees (pollution & (renewable
& communities) & customers) recycling) energies)
(1) (2) (3) (4) (5) (6) (7) (8) (9)
a. OLS regressions
Share of CSR compensation 0.173 1.090 4.115 3.537 0.578 -0.920 0.733 0.488 0.244(0.086) (0.366) (2.450) (1.323) (1.741) (0.377) (0.287) (0.293) (0.394)
Controls Yes Yes Yes Yes Yes Yes Yes Yes YesYear fixed effects Yes Yes Yes Yes Yes Yes Yes Yes YesFirm fixed effects Yes Yes Yes Yes Yes Yes Yes Yes Yes
R-squared 0.55 0.87 0.84 0.79 0.79 0.93 0.85 0.82 0.56Observations 3,205 2,436 2,209 2,209 2,209 3,205 473 473 473
b. 2SLS regressions
Share of CSR compensation (instr.) 0.175 1.084 4.188 3.526 0.662 -0.920 0.736 0.491 0.245(0.104) (0.396) (2.499) (1.494) (1.843) (0.480) (0.318) (0.297) (0.600)
Controls Yes Yes Yes Yes Yes Yes Yes Yes YesYear fixed effects Yes Yes Yes Yes Yes Yes Yes Yes YesFirm fixed effects Yes Yes Yes Yes Yes Yes Yes Yes Yes
R-squared 0.55 0.87 0.84 0.79 0.79 0.93 0.85 0.82 0.56Observations 3,205 2,436 2,209 2,209 2,209 3,205 473 473 473
CSR performance Green patents

35
Corporate Governance and the Rise of Integrating Corporate Social Responsibility Criteria in Executive Compensation: Effectiveness and Implications for Firm Outcomes
APPENDIX
This section presents various robustness checks. All tests are variants of the specifications used in Tables 4 and 5 (henceforth “baseline specifications”).
Specifications without controls. In Appendix Table A2, we re-estimate our baseline regressions without controls. As can be seen, the results are very similar to our baseline results, indicating that they are not sensitive to the inclusion of controls.
Specifications with state by year fixed effects. In Appendix Table A3, we include state by year fixed effects to account for the possibility that regional trends may correlate with both the dependent variables and CSR contracting (and the constituency statutes, respectively). To identify the company’s state, we use the state of location of the company’s headquarters from Compustat (as opposed to the state of incorporation where the constituency statutes apply). Due to the lack of congruence between states of incorporation and states of location, we can run the IV regression while controlling for state × year fixed effects. Effectively, this specification compares companies that are located in the same state, but some are incorporated in a treated state (i.e., a state that passes a constituency statute) and others are not.
Alternative model specifications. Our baseline specification is a panel regression with firm and year fixed effects. Due to the inclusion of firm fixed effects, the coefficients are estimated “within firm”—that is, effectively we measure how a change in CSR contracting (i.e., when CSR contracting switches from 0 to 1) induces changes in the dependent variables (e.g., changes in the LT-index, firm value, etc.). In the upper panel of Appendix Table A4, we further account for the dynamic structure of our panel by including the lagged dependent variable as additional control. One concern with this specification is that, by construction, the lagged dependent variable is likely endogenous with respect to the dependent variable itself. To mitigate this concern, in the bottom panel, we use the GMM estimator of Arellano and Bond (1991) that uses lag values of all variables as instruments. As can be seen, our results are robust in both specifications.
Alternative measure of social and environmental performance. Finally, in Appendix Table A5, we provide a variant of the analysis in columns (3)-(5) of Tables 4 and 5, in which we use the “net” KLD-index (i.e., the number of KLD strengths net of the number of KLD concerns) instead of the KLD-index based on the number of KLD strengths. As can be seen, the estimates are very similar to those in Tables 4 and 5.
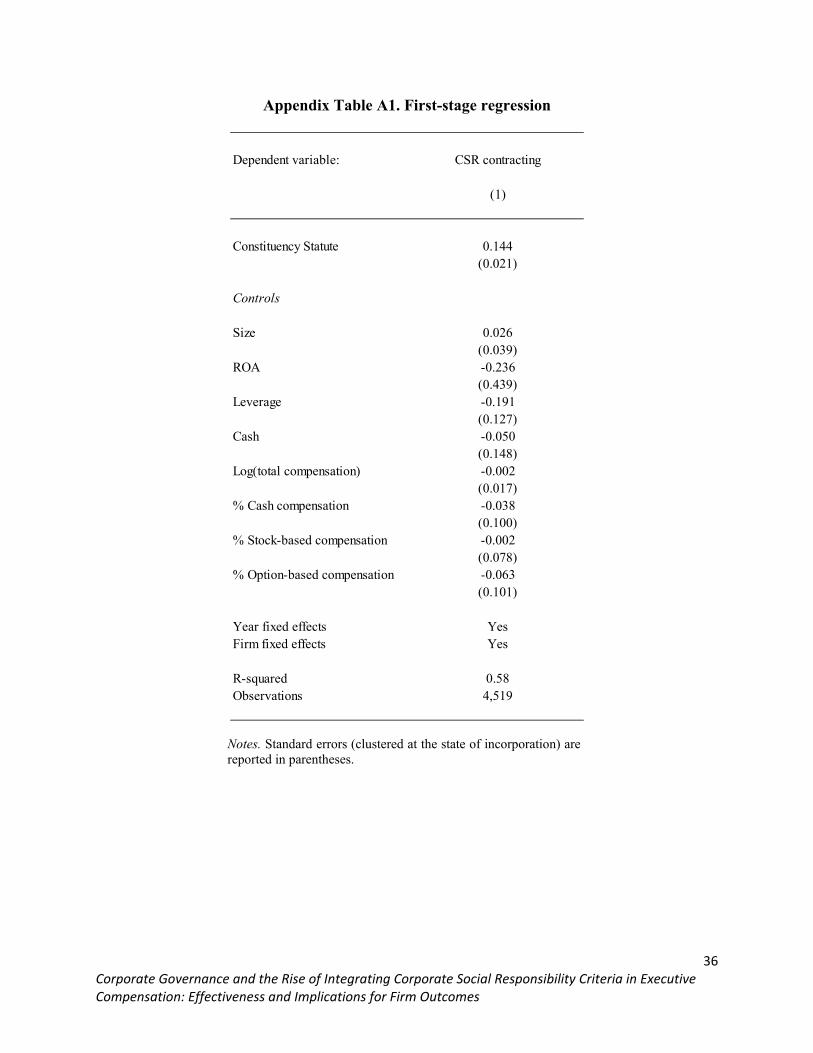
36
Corporate Governance and the Rise of Integrating Corporate Social Responsibility Criteria in Executive Compensation: Effectiveness and Implications for Firm Outcomes
Appendix Table A1. First-stage regression
Notes. Standard errors (clustered at the state of incorporation) are reported in parentheses.
Dependent variable: CSR contracting
(1)
Constituency Statute 0.144(0.021)
Controls
Size 0.026(0.039)
ROA -0.236(0.439)
Leverage -0.191(0.127)
Cash -0.050(0.148)
Log(total compensation) -0.002(0.017)
% Cash compensation -0.038(0.100)
% Stock-based compensation -0.002(0.078)
% Option-based compensation -0.063(0.101)
Year fixed effects YesFirm fixed effects Yes
R-squared 0.58Observations 4,519
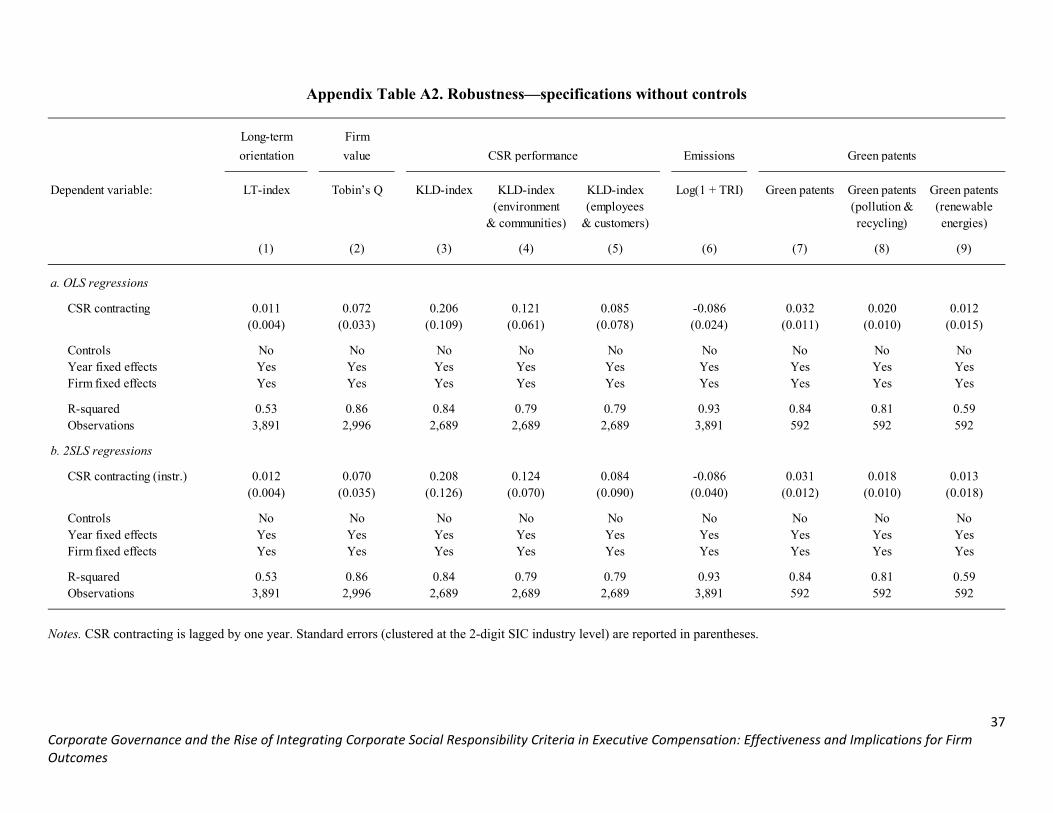
37
Corporate Governance and the Rise of Integrating Corporate Social Responsibility Criteria in Executive Compensation: Effectiveness and Implications for Firm Outcomes
Appendix Table A2. Robustness—specifications without controls
Notes. CSR contracting is lagged by one year. Standard errors (clustered at the 2-digit SIC industry level) are reported in parentheses.
Long-term Firm
orientation value Emissions
Dependent variable: LT-index Tobinʼs Q KLD-index KLD-index KLD-index Log(1 + TRI) Green patents Green patents Green patents(environment (employees (pollution & (renewable
& communities) & customers) recycling) energies)
(1) (2) (3) (4) (5) (6) (7) (8) (9)
a. OLS regressions
CSR contracting 0.011 0.072 0.206 0.121 0.085 -0.086 0.032 0.020 0.012(0.004) (0.033) (0.109) (0.061) (0.078) (0.024) (0.011) (0.010) (0.015)
Controls No No No No No No No No NoYear fixed effects Yes Yes Yes Yes Yes Yes Yes Yes YesFirm fixed effects Yes Yes Yes Yes Yes Yes Yes Yes Yes
R-squared 0.53 0.86 0.84 0.79 0.79 0.93 0.84 0.81 0.59Observations 3,891 2,996 2,689 2,689 2,689 3,891 592 592 592
b. 2SLS regressions
CSR contracting (instr.) 0.012 0.070 0.208 0.124 0.084 -0.086 0.031 0.018 0.013(0.004) (0.035) (0.126) (0.070) (0.090) (0.040) (0.012) (0.010) (0.018)
Controls No No No No No No No No NoYear fixed effects Yes Yes Yes Yes Yes Yes Yes Yes YesFirm fixed effects Yes Yes Yes Yes Yes Yes Yes Yes Yes
R-squared 0.53 0.86 0.84 0.79 0.79 0.93 0.84 0.81 0.59Observations 3,891 2,996 2,689 2,689 2,689 3,891 592 592 592
CSR performance Green patents

38
Corporate Governance and the Rise of Integrating Corporate Social Responsibility Criteria in Executive Compensation: Effectiveness and Implications for Firm Outcomes
Appendix Table A3. Robustness—specifications accounting for local trends
Notes. All right-hand side variables are lagged by one year. Standard errors (clustered at the 2-digit SIC industry level) are reported in parentheses.
Long-term Firm
orientation value Emissions
Dependent variable: LT-index Tobinʼs Q KLD-index KLD-index KLD-index Log(1 + TRI) Green patents Green patents Green patents(environment (employees (pollution & (renewable
& communities) & customers) recycling) energies)
(1) (2) (3) (4) (5) (6) (7) (8) (9)
a. OLS regressions
CSR contracting 0.012 0.054 0.265 0.160 0.105 -0.081 0.034 0.024 0.010(0.004) (0.032) (0.122) (0.074) (0.095) (0.029) (0.008) (0.006) (0.006)
Controls Yes Yes Yes Yes Yes Yes Yes Yes YesState-year fixed effects Yes Yes Yes Yes Yes Yes Yes Yes YesFirm fixed effects Yes Yes Yes Yes Yes Yes Yes Yes Yes
R-squared 0.54 0.90 0.88 0.83 0.85 0.93 0.91 0.90 0.86Observations 3,891 2,996 2,689 2,689 2,689 3,891 592 592 592
b. 2SLS regressions
CSR contracting (instr.) 0.012 0.057 0.266 0.161 0.105 -0.081 0.033 0.026 0.008(0.004) (0.033) (0.127) (0.077) (0.098) (0.038) (0.009) (0.007) (0.008)
Controls Yes Yes Yes Yes Yes Yes Yes Yes YesState-year fixed effects Yes Yes Yes Yes Yes Yes Yes Yes YesFirm fixed effects Yes Yes Yes Yes Yes Yes Yes Yes Yes
R-squared 0.54 0.90 0.88 0.83 0.85 0.93 0.91 0.90 0.86Observations 3,891 2,996 2,689 2,689 2,689 3,891 592 592 592
CSR performance Green patents

39
Corporate Governance and the Rise of Integrating Corporate Social Responsibility Criteria in Executive Compensation: Effectiveness and Implications for Firm Outcomes
Appendix Table A4. Robustness—alternative model specifications
Notes. All right-hand side variables are lagged by one year. Standard errors (clustered at the 2-digit SIC industry level) are reported in parentheses.
Long-term Firm
orientation value Emissions
Dependent variable: LT-index Tobinʼs Q KLD-index KLD-index KLD-index Log(1 + TRI) Green patents Green patents Green patents(environment (employees (pollution & (renewable
& communities) & customers) recycling) energies)
(1) (2) (3) (4) (5) (6) (7) (8) (9)
a. Models with lagged dependent variable as control
CSR contracting 0.009 0.063 0.184 0.113 0.070 -0.051 0.036 0.025 0.011(0.004) (0.026) (0.091) (0.056) (0.071) (0.022) (0.012) (0.015) (0.019)
Controls Yes Yes Yes Yes Yes Yes Yes Yes YesYear fixed effects Yes Yes Yes Yes Yes Yes Yes Yes YesFirm fixed effects Yes Yes Yes Yes Yes Yes Yes Yes Yes
R-squared 0.56 0.90 0.86 0.82 0.81 0.95 0.78 0.72 0.61Observations 3,891 2,812 2,630 2,630 2,630 3,891 505 505 505
b. Arellano-Bond GMM estimator
CSR contracting 0.010 0.067 0.171 0.105 0.066 -0.092 0.038 0.027 0.011(0.005) (0.032) (0.103) (0.053) (0.088) (0.027) (0.017) (0.014) (0.016)
Controls Yes Yes Yes Yes Yes Yes Yes Yes YesYear fixed effects Yes Yes Yes Yes Yes Yes Yes Yes YesFirm fixed effects Yes Yes Yes Yes Yes Yes Yes Yes Yes
Observations 3,275 2,275 2,184 2,184 2,184 3,275 374 374 374
CSR performance Green patents

40
Corporate Governance and the Rise of Integrating Corporate Social Responsibility Criteria in Executive Compensation: Effectiveness and Implications for Firm Outcomes
Appendix Table A5. Robustness—alternative measures of social and environmental performance
Notes. All right-hand side variables are lagged by one year. Standard errors (clustered at the 2-digit SIC industry level) are reported in parentheses.
Dependent variable: Net KLD-index Net KLD-index Net KLD-index(environment (employees
& communities) & customers)
(1) (2) (3)
a. OLS regresssions
CSR contracting 0.266 0.177 0.089(0.145) (0.085) (0.096)
Controls Yes Yes YesYear fixed effects Yes Yes YesFirm fixed effects Yes Yes Yes
R-squared 0.79 0.76 0.74Observations 2,689 2,689 2,689
b. 2SLS regressions
CSR contracting (instr.) 0.269 0.177 0.092(0.146) (0.086) (0.099)
Controls Yes Yes YesYear fixed effects Yes Yes YesFirm fixed effects Yes Yes Yes
R-squared 0.79 0.76 0.74Observations 2,689 2,689 2,689

41
Corporate Governance and the Rise of Integrating Corporate Social Responsibility Criteria in Executive Compensation: Effectiveness and Implications for Firm Outcomes
Appendix Table A6. Dynamics
Notes. All right-hand side variables are lagged by one year. Standard errors (clustered at the 2-digit SIC industry level) are reported in parentheses.
Dependent variable: Tobinʼs Q (t ) Tobinʼs Q (t + 1) Tobinʼs Q (t + 2) ROA (t ) ROA (t + 1) ROA (t + 2)
(1) (2) (3) (4) (5) (5)
a. OLS regressions
CSR contracting 0.062 0.072 0.074 0.0002 0.0012 0.0017(0.031) (0.033) (0.034) (0.0007) (0.0008) (0.0008)
Controls Yes Yes Yes Yes Yes YesYear fixed effects Yes Yes Yes Yes Yes YesFirm fixed effects Yes Yes Yes Yes Yes Yes
R-squared 0.87 0.87 0.88 0.76 0.77 0.78Observations 2,996 2,512 2,212 3,587 3,029 2,685
b. 2SLS regressions
CSR contracting (instr.) 0.062 0.075 0.076 0.0003 0.0011 0.0017(0.034) (0.038) (0.039) (0.0008) (0.0010) (0.0010)
Controls Yes Yes Yes Yes Yes YesYear fixed effects Yes Yes Yes Yes Yes YesFirm fixed effects Yes Yes Yes Yes Yes Yes
R-squared 0.87 0.87 0.88 0.76 0.77 0.78Observations 2,996 2,512 2,212 3,587 3,029 2,685
Firm value Operating performance

42
Corporate Governance and the Rise of Integrating Corporate Social Responsibility Criteria in Executive Compensation: Effectiveness and Implications for Firm Outcomes
AUTHORS’ BIOGRAPHICAL SKETCH
Caroline Flammer, PhD, is an assistant professor of strategy and innovation at Boston University’s Questrom School of Business. She specializes in corporate governance, corporate social responsibility, and impact investing. She has published in leading management journals such as the Academy of Management Journal, Management Science, and the Strategic Management Journal. Caroline was awarded the 2015 Alliance for Research on Corporate Sustainability (ARCS) Emerging Scholar Award. She is also the recipient of the 2013 Moskowitz Prize of Berkeley’s Center for Responsible Business, the 2015 FIR─PRI (Principles for Responsible Investment-French Social Investment Forum) Award for Best Published Paper in Finance and Sustainability, and most recently the 2016 Investor Responsibility Research Center (IRRC) Institute Research Award. Before joining Boston University, she was a faculty at Ivey Business School and a postdoctoral researcher at MIT Sloan School of Management. She holds a PhD in economics from the University of St. Gallen. Her website is at http://sites.bu.edu/cflammer/.
Bryan Hong, PhD, is an assistant professor of strategy at Ivey Business School of the University of Western Ontario, and is currently a visiting professor at New York University’s Stern School of Business. Bryan’s research investigates how a firm’s strategy, the design of its organization, and the incentives of its managers interact to influence its socially responsible behavior and other performance outcomes. His most recent work examines how executive compensation contracts can help to solve the problem of short-termism in managerial decision-making. In other work, Bryan is studying how firms can deal with strategic uncertainty about the future, such as disruption, to gain an advantage over their competition. He has previously worked in investment banking, corporate strategic planning and strategy consulting. Bryan received his Ph.D. in Business Administration from the University of California, Berkeley. For more information, see https://www.ivey.uwo.ca/faculty/directory/bryan-hong/.
Dylan Minor, PhD, is an assistant professor of managerial economics & decision sciences at Northwestern University’s Kellogg School of Management. Dylan started professionally in the field of investment management. After a number of years at Morgan Stanley and then Wells Fargo, Dylan decided to start his own private wealth management firm, which still operates today. All the while, Dylan became increasingly interested and involved in investment research. He soon started investigating Socially Responsible Investing, intrigued by the challenge of integrating financial and ethical choices. This led to his desire to acquire greater tools for such analysis, which soon meant completing a PhD program at UC Berkeley. Through his process of becoming an economist Dylan became interested in the question of how to integrate financial and ethical choices more generally beyond simply investment decisions. Now at Kellogg, he researches and teaches in this growing field more generally dubbed Business & Society. For more information, see http://www.kellogg.northwestern.edu/faculty/directory/minor_dylan.aspx.