Corporate Governance and Acquisitions: Acquirer Wealth ...€¦ · Corporate Governance and...
48
Corporate Governance and Acquisitions: Acquirer Wealth Effects in the Netherlands Abe de Jong RSM Erasmus University Marieke van der Poel RSM Erasmus University Michiel Wolfswinkel Van der Moolen Holding NV and RSM Erasmus University May 2007 Corresponding author: Abe de Jong, Department of Financial Management, Room T9-53 P.O. Box 1738, 3000 DR Rotterdam, The Netherlands. Phone: +31 10 408 1022, Fax: +31 10 408 9017, Email: [email protected] . Opinions expressed in this article represent the authors strictly personal views and opinions and cannot in any way be construed as statements or views of Van der Moolen Holding NV.
Transcript of Corporate Governance and Acquisitions: Acquirer Wealth ...€¦ · Corporate Governance and...

Corporate Governance and Acquisitions: Acquirer Wealth Effects in the Netherlands
Abe de Jong RSM Erasmus University
Marieke van der Poel
RSM Erasmus University
Michiel Wolfswinkel Van der Moolen Holding NV and RSM Erasmus University
May 2007 Corresponding author: Abe de Jong, Department of Financial Management, Room T9-53 P.O. Box 1738, 3000 DR Rotterdam, The Netherlands. Phone: +31 10 408 1022, Fax: +31 10 408 9017, Email: [email protected]. Opinions expressed in this article represent the authors� strictly personal views and opinions and cannot in any way be construed as statements or views of Van der Moolen Holding NV.

2
1. Introduction
This paper examines acquirer wealth effects around acquisition announcements by Dutch firms.
In the Netherlands the market for corporate control is virtually absent. Dutch firms can use
several types of defense mechanisms as a protection against hostile takeovers and as a restriction
of shareholders� influence. As a result, shielded by defense mechanisms, Dutch managers can
exercise more discretion in their corporate investment decisions than their counterparts in Anglo-
Saxon countries.
Several studies examine acquirer wealth effects of US firms during the days around their
acquisition announcements. The evidence of these studies is mixed. Some studies find zero or
positive shareholder returns around acquisition announcements (e.g., Morck, Shleifer and
Vishny, 1990; Lang, Stulz and Walkling, 1991; Moeller, Schlingemann and Stulz 2004, 2005;
Masulis, Wang and Xie, 2006), whereas other studies find negative returns (e.g., Franks, Harris
and Titman, 1991; Mulherin and Boone, 2000; Andrade, Mitchell and Stafford, 2001). When
taking the change in dollar value into account, the results of Moeller, Schlingemann and Stulz
(2004, 2005) suggest that overall shareholders lose money. In the 1980s shareholders lost a total
of $7 billion, while in the period 1991-2001 the loss amounts to $216 billion. Strikingly, in 1998-
2001 period dollar returns add up to a loss of $240 billion, which is mainly the result of a small
number of large losses by firms with high market valuations. The acquisition literature knows a
few studies on shareholder wealth effects of European acquiring firms. The studies on European
acquisitions find on average positive shareholder returns for acquiring firms (Goergen and
Renneboog, 2004; Martynova and Renneboog, 2006).
3
Even though several studies find on average positive returns around acquisition announcements,
the percentage of shareholders experiencing negative returns is still high. A widely proposed
explanation for the negative shareholder returns is agency problems as a result of the separation
between ownership and control (Berle and Means, 1932; Jensen and Meckling, 1976). Managers
rather make non-value maximizing acquisitions to build their empire than pay out excess cash to
shareholders (Jensen, 1986). In other words, by pursuing their own objectives and thereby
increasing their own utility rather than maximizing shareholders� wealth, managers invest beyond
the optimal size. A possible consequence of this overinvestment problem is that managers
overpay for targets that provide private benefits (Morck, Shleifer and Vishny, 1990), such as
entrenchment benefits (Shleifer and Vishny, 1989), which result in negative returns for the
acquiring firm�s shareholders. In a recent contribution to the agency literature Jensen (2005)
argues that managers may be motivated to acquire by high stock prices. Agency costs of
overvalued equity arise in case managers make poor acquisitions in order to aim to fulfill
unrealistic expectations of the stock market.
Adequate corporate governance should diminish agency problems in acquisition decisions. One
of the forces that discourage managers from empire building is the market for corporate control in
the sense that firms making value-decreasing acquisitions are more likely to be acquired later
(Mitchell and Lehn, 1990). However, takeover defenses decrease the probability of being taken
over, which could lead to an insulation of managers from the discipline of the market for
corporate control (Bebchuk, Coates and Subramanian, 2002; Field and Karpoff, 2002). Previous
studies find takeover defenses to negatively influence firm value and long-run stock performance
(Gompers, Ishii and Metrick, 2003; Bebchuk, Cohen and Ferrell, 2005). Specifically, Gompers,
Ishii and Metrick (2003) construct a governance index, which is a score for the number of

4
takeover defenses and other anti-shareholder provisions out of a set of 24 provisions. The authors
find firms with weaker shareholder rights have a lower firm value, make more acquisitions, are
less profitable and have lower sales growth. Bebchuk, Cohen and Ferrell (2005) refine this study
by investigating which provisions from the governance index are the main drivers that negatively
influence firm value. Their study suggests that just six out of the 24 provisions play a key role in
explaining firm value. The six provisions consist of four provisions that limit shareholder voting
power � i.e. staggered boards, limits to shareholder amendments of the bylaws, supermajority
requirements for mergers and supermajority requirements for charter amendments � and two
provisions that prevent hostile takeovers � i.e. poison pills and golden parachute arrangements.
Although these studies contribute the negative relation to agency problems, they do not specify
the reasons behind the negative impact. Masulis, Wang and Xie (2006) go one step further and
examine the impact of takeover defenses of US firms on shareholder returns around acquisition
announcements. They find that firms with more anti-takeover defenses exhibit lower shareholder
returns around acquisition announcements relative to firms with less defenses. These findings
suggest that managers, who are insulated from the market for corporate control by incorporating
takeover defenses, are more likely to make non-value maximizing acquisition decisions.
In this paper, we describe the acquisition activity of Dutch industrial firms and the related wealth
effects of the acquiring firms� shareholders for the period from 1993 until 2004. We are
especially interested in the impact of corporate governance on shareholders� wealth changes
following acquisition announcements by Dutch firms. As Dutch firms deploy several types of
defense mechanisms (Kabir, Cantrijn and Jeunink, 1997; De Jong, Kabir, Marra and Röell, 2001;
De Jong, DeJong, Mertens and Wasley, 2005; Renneboog and Szilagyi, 2006), managers can
exercise more discretion with their acquisition decisions. In particular, firms that reach a certain

5
size are required to adopt the structured regime, as a result of which qualifying firms are obliged
to set up a supervisory board. This supervisory board inherits many powers, which are otherwise
held by shareholders. Apart from the structured regime, Dutch firms can introduce three types of
securities that restrict shareholders� influence on company decisions and act as defense
mechanism against hostile takeovers. First, certificates through which holders have the same
rights as holders of common shares with the exception of voting rights. Second, Dutch firms can
install the option to sell preference shares to friendly shareholders during takeover threats, which
is equivalent to US firms using poison pills as a takeover defense. Third, through priority shares,
firms can provide friendly shareholders with special rights such as merger approval, new public
offerings, nomination of board members, charter amendments and company liquidation. Corhay
and Tourani Rad (2000) also examine abnormal returns of acquisition announcements disclosed
by Dutch firms, however, focus exclusively on cross-border acquisitions. Besides, the authors do
not relate corporate governance characteristics to acquirer�s returns. On the contrary, our study
relates specific details of the corporate governance mechanisms of acquiring firms with
shareholders� wealth of these firms. We expect firms that are well governed to make value
enhancing acquisition decisions. We also distinguish between deals in which shareholders
experience large losses and deals without such large losses. Moeller, Schlingemann and Stulz
(2005) suggest that wealth destructing deals are more likely to take place when managerial
discretion plays a larger role. The authors find firms with high valuations to be more likely to
make losses of more than one billion dollar when announcing an acquisition. However, they do
not provide direct evidence of the impact of corporate governance on the likelihood of these
deals. We investigate whether good corporate governance mechanisms prevent firms from
performing wealth-destructing acquisitions.

6
Our findings suggest a minor influence of corporate governance on acquisition announcements in
the Netherlands. On average, acquirer returns are 1.1% and the average increase in shareholders�
wealth is �18 million. In explaining acquirer returns, we find just one governance variable to be
statistically significant, i.e. the structured regime dummy. The regression coefficient suggests
1.0% lower acquirer returns following acquisition announcements of firms that operate under the
structured regime as compared to firms that do not operate under such a regime. This is in line
with the notion that shareholders have limited power over firm�s decisions when these firms
adopt a structured regime. We find the same striking result as Moeller, Schlingemann and Stulz
(2005) that during 2001 and 2002 average acquirer percentage returns are positive, whereas the
total euro wealth effect for shareholders is negative. Consequently, we investigate which firms
are more likely to make wealth destructing deals. A binary logit analysis suggests that managers
of firms that provide room for exercising discretion in their acquisition decisions are more likely
to make deals in which shareholders lose more than �150 million. Specifically, a firm�s Tobin�s
q, leverage and firm size increase the probability of making large losses during acquisition
announcements. A higher likelihood of making value-destructing acquisitions of firms with more
leverage may seem counterintuitive; however, managers of Dutch firms avoid the disciplining
role of debt, especially when they overinvest (De Jong, 2002). Therefore, shareholders of firms
with high leverage can perceive acquisition announcements as highly risky, which may bring
about a stronger negative response resulting in large loss deals. In line with our expectations, a
smaller relative size of the executive board and firms that have priority shares are more likely to
make value-destructing acquisitions. However, preference shares decreases the likelihood of
value-destructing acquisitions.

7
The structure of this paper is as follows. Section 2 describes the Dutch situation and previous
findings of factors that influence shareholders� wealth effects. Subsequently, Section 3 discusses
the research design. Section 4 describes the empirical results and we end the paper by providing a
conclusion in Section 5.
2. Literature review
This section first provides a description of the Dutch setting. Subsequently, we briefly discuss
previous studies on the factors that influence shareholder returns around acquisition
announcements.
2.1. The Dutch situation
The basis of Dutch corporate law is the shareholder-controlled firm with a management board
and supervisory board. Shareholders� rights consist of electing members of the management
board and supervisory board, formally approving dividend policy and the annual accounts.
Shareholders are also allowed to vote on major decisions, such as mergers and acquisitions.
However, firms that are incorporated within the Netherlands are able to severely restrict the
power of shareholders in four ways.1
Firms with a book value of shareholders� equity of at least �11.4 million, with more than 100
persons employed within the Netherlands and the legal obligation to set up a works council are
required to adopt the structured regime. These firms are obliged to set up a supervisory board that
takes over several powers from shareholders, including the authority over major decisions, the
election of the management and supervisory board and the establishment and approval of annual
accounts. It is important to note that shareholders retain their right to vote on mergers and

8
acquisitions. Multinationals with more than half of its employees abroad are exempted from the
requirement of adopting a structured regime. However, they can operate under this regime on a
voluntary basis which is applied by most multinationals.
Apart from the structured regime, firms can implement three types of securities that restrict
shareholders� influence on company decisions and act as takeover defenses. First, Dutch firms
can set up a trust office that holds the firm�s shares and issues certificates to the investors.
Although certificate holders retain their dividend rights, they can freely trade their certificates
and attend the General Meeting of Shareholders. However, they cannot vote. The trust office
takes over all voting rights and is normally friendly to the incumbent managers. In practice,
certificates enable managers to pursue their own objectives and provide a defense against firms
that are willing to acquire the firm. Second, when firms experience a takeover threat, they can sell
preference shares to friendly shareholders or a trust office. The main purpose of preference shares
is to change the balance of power between shareholders as preference shares carry full voting
rights, even though they may not be fully paid-up. The shareholders have to pay 25% of the
nominal value upfront and the maximum amount of preference shares that can be issued is 50%
or 100% of the current outstanding nominal capital. To be able to issue preference shares without
shareholders� consent, firms set up a trust office with an option on these shares. Third, Dutch
firms may have priority shares that carry special rights, such as merger approval, new public
offerings, nomination of board members, charter amendments and company liquidation, to
friendly shareholders as takeover defense. As shareholders� power with firms are severely
restricted and Dutch firms widely implement these takeover defenses, the provisions of Euronext
Amsterdam since 1989 allow firms to only use two types out of the latter three takeover defenses.

9
The use of these takeover defenses has implications for firm value. Consistent with previous
research on takeover defenses, De Jong, DeJong, Mertens and Wasley (2005) find all four
takeover defense mechanisms to be negatively related to firm performance, measured by Tobin�s
q. A possible reason for the lower Tobin�s q is the minor influence shareholders can exert on
firms� decisions. De Jong, Mertens and Roosenboom (2004) provide evidence that the use of
certificates, priority shares and the adoption of a structured regime decreases the probability that
shareholders vote against proposals during General Meetings of Shareholders. On the other hand,
their results show a positive relation between the use of preference shares and the probability of
votes against proposals. Renneboog and Szilagyi (2006) also show that shareholders of Dutch
firms have a weak position, as they find that firms adopting the structured regime and firms that
use preference shares relax their dividend policy.
Other noticeable governance characteristics of Dutch firms include ownership structure, cross-
listings in the US and UK and the low disciplining impact of leverage. First, the ownership
structure of Dutch firms is relatively concentrated (Kabir, Cantrijn and Jeunink, 1997; De Jong,
Kabir, Marra and Röell, 2001), while the voting rights in Dutch firms are more concentrated than
ownership rights. This unequal distribution is due to the takeover mechanisms in which blocks of
shares are controlled by trust offices (De Jong, Kabir, Marra and Röell, 2001). Furthermore,
Dutch firms with a less concentrated ownership structure are more likely to adopt takeover
defenses (Kabir, Cantrijn and Jeunink, 1997). Many Dutch firms have a cross-listing in the US,
the UK or in both countries. In our sample, this holds for 32% of the firms. By means of a cross-
listing in one of these two countries, firms can bond themselves in terms of legal liability
exposure and reputation (Coffee Jr, 1999, 2002). In other words, a cross-listing in the US or UK
leaves less room for discretionary behavior (De Jong, Mertens and Van der Poel, 2006). Leverage

10
is another device to discipline managers to make value-maximizing decisions (Jensen, 1986).
However, De Jong (2002) finds that this does not apply for managers of Dutch firms. The author
provides evidence that in case managers are most likely to overinvest, they avoid the disciplining
role of debt.
2.2. Acquirer wealth effects around acquisition announcements
As previously mentioned, studies on the shareholder wealth effects of acquiring firms directly
around acquisition announcements provide mixed results. These wealth effects depend on firm
and deal specific characteristics.
According to Jensen (1986), managers rather make non value-maximizing acquisitions than pay
out excess cash to shareholders. In line with this overinvestment hypothesis, Lang, Stulz and
Walkling (1989) and Servaes (1991) show that acquisitions by firms with a low Tobin�s q
negatively influence shareholders� wealth. Besides, as firms with a low Tobin�s q are not likely to
have positive net present value projects, the probability that managers of these firms make non
value-maximizing acquisitions increases when having enough free cash flow (Jensen, 1986).
Lang, Stulz and Walkling (1991) provide empirical evidence that is consistent with this theory.
Bidders with a high Tobin�s q increase shareholders� wealth when acquiring low q targets (Lang,
Stulz and Walkling, 1989; Servaes, 1991). These studies interpret high q firms as well managed
firms that acquire poorly managed firms (i.e. low q firms).
A recent theory by Jensen (2005) is based on observed acquisition behavior of highly valued
firms (i.e. high q firms). In these firms agency problems due to overvalued equity bring about
more managerial discretion, increasing the probability of bad acquisitions when firms have run

11
out of good ones. Jensen�s argument is that in case the stock market attaches unrealistic high
stock prices to firms, managers will under normal business practice not be able to deliver the
performance implies by the pricing. This leads to �managerial heroin�, i.e. using the overvalued
equity to make long run value-destroying acquisitions.
According to financial economic theory, the disciplining role of leverage has a positive impact on
the acquirer returns (Maloney, McCormick and Mitchell, 1993). Debt serves as a monitoring
device, providing less leeway for managers in making acquisition decisions (Jensen, 1986).
Hence, leverage increases the probability of value enhancing acquisitions. Moeller,
Schlingemann and Stulz (2004) find that firm size is negatively associated with shareholder
returns of acquisition announcements. The authors relate the size effect with the difference of
deal (e.g. equity/cash payment, private/public target) and firm characteristics (e.g. Tobin�s q and
leverage) between small and large firms.
In terms of deal characteristics, previous studies find that US firms that fully finance their
acquisitions with cash experience higher abnormal returns than equity financed deals (e.g.,
Servaes, 1991; Franks, Harris and Titman, 1991; Moeller, Schlingemann and Stulz, 2004).
Acquiring firms finance with equity to force target shareholders in sharing the risk that the price
for the target was too high (Hansen, 1987). An alternative explanation is that the acquiring firms
are overvalued and aim to decrease their overvaluation by acquiring less overvalued targets with
cheap equity (Shleifer and Vishny, 2003). However, Goergen and Renneboog (2004) show
opposite results for European firms. Acquirer returns of European firms that pay with equity are
higher than that of European firms that pay with cash. The returns for both payment methods are
significantly positive. A possible explanation for this opposite result is that European firms
12
acquire private firms more often, which is in line with US evidence that equity payments with the
acquisition of private firms yield positive abnormal returns, whereas equity payments with the
acquisition of public firms yield negative abnormal returns (Chang, 1998; Moeller, Schlingemann
and Stulz, 2004). Overall, firms experience a positive shareholders� reaction in case they
announce an acquisition of a private firm and a negative shareholders� reaction in case of a public
firm in both the US and in Europe (Moeller, Schlingemann and Stulz, 2004; Martynova and
Renneboog, 2006).
More diversified firms trade at a discount, due to amongst others inefficient investment and
cross-subsidization (Berger and Ofek, 1995; Rajan, Servaes and Zingales, 2000; Scharfstein and
Stein, 2000). As a result, diversifying acquisitions negatively contribute to shareholders� wealth.
This negative impact applies to US firms (Morck, Shleifer and Vishny, 1990), European firms
(Martynova and Renneboog, 2006) and, more specifically, to Dutch firms (Corhay and Tourani
Rad, 2000). Global diversification seems to have a similar impact on acquisitions as industrial
diversification. In particular, the excess value of more globally diversified firms is smaller than
less globally diversified firms (Denis, Denis and Yost, 2002). Besides, cross-border acquisitions
provides lower abnormal returns than domestic acquisitions in the US (Moeller and
Schlingemann, 2005). The impact of cross-border deals by European firms provides mixed
results. Consistent with results for US firms, Martynova and Renneboog (2006) find larger
acquirer returns for domestic acquisition announcements relative to cross-border announcements
for a sample of 2,419 European acquisitions. However, Goergen and Renneboog (2004) examine
the returns of 228 acquisitions with a value of at least 100 million dollars and find the opposite
result. The latter results are mainly driven by UK acquirers. In contrast to Continental Europe, the
UK knows a highly active market for corporate control and has a high degree of shareholder

13
protection (La Porta, Lopez-de-Silanes, Shleifer and Vishny, 1998). Corhay and Tourani Rad
(2000) examine cross-border acquisitions by Dutch firms and find small average positive
abnormal returns for acquisitions in Western Europe (1.44% for 11 days around the
announcement) and the US (0.25% for 5 days after the announcement and 4.83% for 91 days
around the announcement), but no significant abnormal returns for acquisitions in Eastern
Europe.
3. Research design
This section first discusses the data selection procedure, followed by a description of variables
that we use for the analysis. Finally, we will describe our empirical models.
3.1. Dataset
Our data collection starts with all Dutch exchange-listed firms over the period 1993-2004. We
focus on industrial firms, i.e. we exclude financial and service companies. In total, we study the
acquisition announcements of 90 firms. For each firm we search the electronic version of the
Dutch financial daily, Het Financieele Dagblad. We retrieve all newspaper articles with the
company names in the title or the body of the text and manually identify articles with the initial
announcements of acquisitions. In total, we include 865 acquisition announcements by 64 firms.
For the 64 firms (in 312 firm years) we collect financial and corporate governance characteristics
from several sources. We obtain stock and index returns from Datastream. Financial data is
obtained from the REACH database (Review and Analysis of Companies in Holland by Bureau
Van Dijk) and Handboek Nederlandse Beursfondsen. Board and ownership data is taken from the
Handboek Nederlandse Beursfondsen, Jaarboek Nederlandse Ondernemingen and yearly

14
overviews of WMZ notifications in Het Financieele Dagblad.2 Takeover defenses and cross-
listings are taken from the Effectengids, a yearly guide with all exchange-listed securities in
Amsterdam. The information on the application of the structured regime is obtained from the
Monitoring Report 1997 and firm�s annual reports. In order for a firm-year to be included we
require that data is available for all items.
3.2. Variables definition
This section defines the firm and deal variables that we use in our empirical analysis. The Tobin�s
q is the market value of the firm divided by the replacement value of the assets as calculated in
De Jong, DeJong, Mertens and Wasley (2005). In the Netherlands, firms base the value of their
assets either on its replacement value or on its historical costs. In case of the replacement value,
no change was necessary. In case of historical costs, we adjust this value towards its replacement
value. We measure free cash flow similar to Lehn and Poulsen (1989), i.e. operating income
before depreciation minus total income taxes plus deferred taxes from the previous year to the
current year minus gross interest expense on debt minus dividends paid divided by book value of
total assets. The return on assets is calculated as the firm�s operating profits standardized by the
book value of total assets. Leverage is total debt divided by the book value of total assets and
firm size is the natural log of a firm�s book value of total assets. The relative size of the board is
the number of executive board members divided by the total number of board members (i.e. both
executive and supervisory board members). The percentage of block shareholdings is the
percentage of shares held in a block outside the firm. A blockholding is defined as a stake of at
least 5%. Insider ownership is the percentage blockholdings by insiders, supervisory and
executive board members. We define a dummy that takes on the value of one for firms with a
cross-listing in the US or the UK, and zero otherwise. To control for takeover defenses, we define

15
four dummy variables that take on the value of one if the firm has preference shares, if the firm
has priority shares, if the firm has certificates and if the firm operates under the restricted regime.
To examine the overall impact of takeover defenses, we also define a takeover defense index,
which aggregates all four takeover defense dummies.
In terms of the deal characteristics, we construct a dummy for deals in which firms use equity in
their payments. Note that mixed payments (i.e. both cash and equity) are also included in this
dummy. Furthermore, we define a dummy for observations in which we know that the target is
listed. Acquisitions are classified as diversifying and focus shifting, based on the description of
the announcement in the newspaper. The relative size of the acquisition is calculated twofold. If
firms disclose the transaction value, we calculate the relative size as the transaction value divided
by the market capitalization of the acquirer. However, if the transaction value is not available, the
relative size is the ratio of target sales to acquirer sales.
3.3. Market reaction model
We measure the acquirer�s cumulative abnormal returns (CAR) around acquisition
announcements using the abnormal returns generated by a market model as described by
MacKinlay (1997). Our estimation window runs from day -120 to day -20. We aggregate the
abnormal returns over a period of five days, starting two days prior to the acquisition
announcement until two days after the acquisition announcement. Apart from the percentage
returns, we also calculate the euro wealth effects by multiplying the five days CAR by the
beginning of the year�s market value of the acquirer�s equity.

16
Next, we investigate the determinants of the aggregated acquirer returns by means of an ordinary
least squares (OLS) regression in which we explain the five days CAR by the acquirer Tobin�s q,
free cash flows, return on assets, leverage, ln(size), a dummy for equity payment, a dummy for
listed target, a dummy for diversifying acquisition, a dummy for domestic target, a dummy for
European target, a dummy for US target, relative size of the acquisition, relative size of the
executive board, block shareholders, insider ownership, a dummy for cross-listing US/UK, a
dummy for priority shares, a dummy for preference shares, a dummy for certificates and a
dummy for restricted regime. The model incorporates year fixed effects and industry fixed
effects, based on five major industry groups according to two-digit SIC industry codes. All
regression p-values are based on White�s heteroskedasticity corrected standard errors.
3.4. Wealth destructing deals model
We classify acquisitions as wealth destructing if shareholders lose more than 150 million euros
during the acquisition announcement. To investigate what type of firms make wealth destructing
acquisition announcements, we estimate the following binary logit regression, in which we
explain whether the deal is wealth destructing by the acquirer Tobin�s q, free cash flows, return
on assets, leverage, ln(size), a dummy for equity payment, a dummy for listed target, a dummy
for diversifying acquisition, a dummy for domestic target, a dummy for European target, a
dummy for US target, relative size of the acquisition, relative size of the executive board, block
shareholders, insider ownership, a dummy for cross-listing US/UK, a dummy for priority shares,
a dummy for preference shares, a dummy for certificates and a dummy for restricted regime. The
model incorporates year fixed effects and industry fixed effects, based on five major industry
groups according to two-digit SIC industry codes. All regression p-values are based on
Huber/White�s heteroskedasticity corrected standard errors.

17
4. Results
This section first provides a description of the sample. Statistics of firm and deal variables and
the features of shareholders� wealth change around acquisition announcements will be discussed.
Subsequently, we examine the factors that influence shareholders� wealth change and conclude
with an analysis of deals with which shareholders lose more than �150 million.
4.1. Sample description
As previously mentioned, our dataset consists of 312 firm years in which 64 firms announce 865
acquisitions. Table 1 panel A shows more detailed information about the characteristics of these
firm years.
- Insert Table 1 about here �
Our sample represents the larger industrial firms within the Netherlands, with an average market
capitalization of 3.08 billion euros. They show good performance, as the average return on assets
is 33.6% and the average Tobin�s q is 1.548. However, the return on assets exhibits a large
variation across the sample as its standard deviation is relatively high. The mean free cash flow is
positive, indicating that firms are able to spend internal funds on additional investments. With an
average of 27.9%, the leverage of Dutch firms is low as compared to US firms. In terms of
corporate governance, the board consists for 63.8% of executives. Specifically, the median
number of executive board members is six, whereas the median number of supervisory board
members is just three. The data on blockholders confirm the concentrated ownership structure
within the Netherlands. The largest outside blockholder owns on average 17% of the firm. Taking
into account all blockholders, the average ownership is 29.1%. Although the median percentage

18
insider ownership is zero, the average is 5.8%. Furthermore, 31.7% of the sample firms have a
cross-listing in the US and or in the UK, suggesting that managers of these firms exercise less
discretion in their decisions (De Jong, Mertens and Van der Poel, 2006). Takeover defense
mechanisms in the Netherlands severely restrict shareholders� power within the firm. Consistent
with previous studies about the Dutch governance situation, the results indicate that Dutch firms
widely implement takeover defenses in terms of priority shares (43.3%), preferred shares
(67.3%), certificates (37.2%) and the adoption of the structured regime (67.9%). Aggregating all
takeover defenses within a firm, the median Dutch firm adopts two out of the four mechanisms.
Panel B of Table 1 provides the deal characteristics of our sample. Firms release the transaction
value of their deals only 152 out of the 865 times. These 152 deals show an average transaction
value of 521 million euros. The median is only one sixth of the average value, which implies that
the dataset includes some very large deals. Besides, the transaction value varies considerably as
the standard deviation is relatively high. This also applies for the transaction value relative to the
acquiring firm�s market capitalization and the ratio of target to acquirer sales. The results also
show that Dutch firms acquire public firms in 7.2% of all acquisitions. Compared to the sample
of European firms in Martynova and Renneboog (2006), in which 36.8% of all acquisitions
concern listed targets, this percentage is rather low. Furthermore, firms announce a diversifying
deal in 20.5% of the sample and a shift in focus in 4.9% of the sample. The high percentage of
diversifying acquisition announcements is remarkable, as previous studies find diversifying
acquisitions to be value-decreasing (Morck, Shleifer and Vishny, 1990; Corhay and Tourani Rad,
2000; Martynova and Renneboog, 2006). Firms finance their target with a combination of cash
and equity in 3.6% of our sample. In 5.9% of the acquisitions, firms announce to pay with equity.
Note that this percentage also includes the mixed payments. The low percentage may be caused

19
by the low amount of listed target firms. In 19.1% of the acquisitions, firms announce to finance
their deal with cash. In all other cases, firms do not disclose how they finance their target. In line
with Corhay and Tourani Rad (2000), Dutch firms know a strong international orientation. They
make domestic acquisitions only in 24% of all sample deals, whereas in 44.5% of the deals the
target comes from another European country and in 19.2% of the deals the target is located in the
US.3
To get an impression about the shareholders� wealth effects around acquisition announcements,
Table 2 provides statistics of the percentage abnormal returns (panel A) and the euro wealth
transfers (panel B) for different event windows.
- Insert Table 2 about here �
Panel A of the table shows significantly positive abnormal returns around acquisition
announcements for four out of the six event periods, indicating that acquisitions in the
Netherlands on average enhance shareholder wealth. During the five days around the acquisition
announcement, shareholders experience a significant increase of 1.07% in their returns. The share
price does not experience a significant change from 20 days until 3 days prior to the acquisition
announcement and 3 days until 20 days after the announcement, suggesting that the information
about the acquisition is discounted into the market price immediately around the release of the
information.
Panel B provides the abnormal euro returns around acquisition announcements. Shareholders
experience an average significant increase in their wealth of �17.89 million during the five days

20
around an acquisition announcement. Wealth changes in the other event windows are not
significantly different from zero. Note that the standard deviation of the euro returns are
extremely large, suggesting both large gains and losses for shareholders of acquiring firms. The
extreme values provide support for this suggestion. For instance, the minimum value for the five
days window indicates a loss of about �2.7 billion and the maximum value indicates a gain of
about �1.8 billion. The extreme values of the other event windows are even larger.
As Table 2 suggests that most of the announcement returns occur during the five days around the
acquisition announcement, Figure 1 provides the average development of the share price over the
forty days around the announcement and Figure 2 shows the distribution of the cumulative
abnormal returns over the five days event window.
- Insert Figure 1 and 2 about here �
Figure 1 shows a slight price run-up prior to the acquisition announcement, which does not differ
significantly from zero. The sharp increase in average abnormal returns starts at two days prior to
the announcement day and lasts for about five days. Afterwards, the cumulative abnormal returns
remain relatively stable around the 1.2%. Figure 2 shows that the distribution of the cumulative
abnormal returns appears to be normally distributed. Besides, acquisition announcements are
more often value increasing than value decreasing. The results further show that the distribution
of abnormal returns is somewhat skewed towards positive returns.

21
When disclosing a planned acquisition, firms usually provide reasons why they take over another
firm. As the motivation behind acquisitions is important information for the market, table 3 lists
the stated motivations, the frequency of these motivations and the related acquirer returns.
- Insert Table 3 about here �
We categorize the motives into seven groups; 1) cost reduction, 2) geographic expansion, 3)
broadening the firm�s product line, 4) increasing the firm�s market share, 5) diversification, 6)
another motive, which do not belong to the first five groups, and 7) no motive provided. The
most common motives are an increase in market share that occurs in 37% of all announcements
and geographic expansion that occurs in 17% of all announcements. Both motives yield
significantly positive abnormal returns (1.21% and 1.19%, respectively), indicating that these
types of acquisitions are value enhancing for shareholders. The acquisitions in which firms can
reduce their costs in the form of economies of scale or access to low wage labor also provides
positive abnormal returns (1.32%). A remarkable result is that shareholders respond positively to
diversifying reasons, while previous studies find diversifying acquisitions to be negatively related
with the market reaction. The abnormal returns are 1.56%, which is the highest percentage
compared to all other reasons. Note that in 3% of all acquisition announcements, firms state that
the prime motive to acquire a firm is to diversify, whereas 20.5% of all acquisitions are
diversifying acquisitions. Furthermore, firms do not provide a motive for their acquisition in 27%
of the sample, yet the abnormal returns are significantly positive. The data do not show a
significant response to firms that aim to broaden their product line or give another motive. The
main conclusion from Table 3 is that the stated motive does seem to explain the acquirer�s wealth
change, as shareholders respond significantly to some of the stated motives and not to others.

22
The market response and total wealth effects around acquisitions depend on the period in which
the acquisition takes place (Harford, 2005; Moeller, Schlingemann and Stulz, 2005). In particular,
the abnormal returns are higher at the beginning of merger waves than later during the merger
wave. Table 4 presents the percentage abnormal returns and the euro wealth effects per year. A
more visual overview can be drawn from Figure 3.
- Insert Table 4 and Figure 3 about here �
The results indicate that during the first half of the nineties, several value decreasing acquisitions
take place. Though not statistically significant, the years 1994 and 1995 show zero and small
negative abnormal returns and large negative wealth effects for the shareholders. During these
years, the least amount of positive reactions to acquisition announcements occur. Afterwards,
shareholders experience an increase in their wealth, with 1999 as most successful year. In that
year, the total wealth gain due to acquisition announcements is �7.7 billion and the average
abnormal return is 2.2%. The economic downturn started halfway 2000. The consequences of this
downturn appear in 2001, which shows a decrease in the number of acquisitions. The total wealth
losses are �660.2 million and �4.7 million in the year after. Strikingly, the average abnormal
returns are positive during these years. These results suggest that, consistent with Moeller,
Schlingemann and Stulz (2004, 2005), the negative wealth effects are a result of a few extremely
large losses. Moeller, Schlingemann and Stulz (2005) argue that managers of highly valued firms
can exercise more discretion and hence, are more likely to make value-destroying acquisitions.
Firm size can also drive the results (Moeller, Schlingemann and Stulz, 2004). Acquisitions by
small firms are generally value enhancing, but the euro gains are small as well. On the contrary,

23
larger firms make larger acquisitions that can result in large euro losses. Both effects together can
result in positive returns and negative wealth effects at the same time. In Section 4.3, we examine
the value-destructing deals into more detail. Finally, in the last two years of our sample the
number of acquisitions is still low, yet the acquisition announcements that take place do yield
positive abnormal returns.
4.2. Explaining wealth effects
So far, we discussed the characteristics and abnormal returns of our sample of acquisition
announcements by means of a univariate analysis. This section discusses the factors that
influence shareholders� wealth around an acquisition announcement. Table 5 shows the results of
four ordinary least squares regressions with the five days abnormal returns as the dependent
variable.
- Insert Table 5 about here �
Consistent with Moeller, Schlingemann and Stulz (2004), the first regression indicates that larger
firms are more likely to make value reducing acquisitions. Furthermore, firms that finance their
deal with equity experience 2.2% higher abnormal returns than firms that do not use equity as
payment. Although this result is not in line with previous research on US firms, Goergen and
Renneboog (2004) find similar results for European firms. A possible explanation for the positive
relation is the high amount of private targets that get acquired. The results further show that the
target�s country of origin does not influence shareholders� wealth. None of the country dummies
is significant. Firm and deal characteristics that do not influence acquirer returns are the firm�s

24
Tobin�s q, free cash flow, return on assets, leverage, whether the target is listed and whether the
deal is diversifying.
The size of the target relative to the acquirer firm size is an indication for the impact of the deal
for the acquiring firm. Unfortunately, few firms disclose the price they pay for the target (152 out
of 865) and we do not know the target sales of all deals (555). To examine the impact of the deal
size, we construct the variable �relative size of acquisition� in which we set the value to the
relative price paid, calculated as price paid for the target divided by the market value of the
acquirer firm�s equity. If this value is not available, we take the ratio of target sales to acquirer
sales. Regression 2 of Table 5 includes the relative size of the acquisition. We find the relative
size to be positively related with acquirer returns, suggesting that larger acquisitions are more
likely to be firm value enhancing. Another effect of including this relative size is that the equity
payment dummy loses its significance, which may a result of the smaller sample size. However,
when running regression 1 with the same observations as regression 2 (results are not tabulated),
the equity payment dummy remains significant, implying that the dummy is an artifact of the
relative size of an acquisition. Firms that acquire relatively large targets are more likely not to
have enough cash available, increasing the probability to pay with equity. A comparison between
the R-squared of regression 1 (with 644 observations) and regression 2 implies a significant
increase in explanatory power (p=0.000).
To examine the impact of corporate governance on shareholders� wealth around acquisition
announcements, Regression 3 includes the variables relative size of the board, percentage of
block shareholders, percentage insider ownership, a dummy for being cross-listed in the US or
UK and the takeover defense index. We expect a better governance structure within a firm to

25
bring about less discretion for managers, resulting in higher abnormal returns. The results suggest
a marginal impact of corporate governance on firm�s decisions as only the coefficient for
takeover defense index is significant. In line with Masulis, Wang and Xie (2006) and in line with
our expectations, the coefficient is negative. Ceteris paribus, for each implemented takeover
defense mechanism, shareholders� wealth decreases with 0.4%. To investigate which of the
takeover defense mechanisms drive the negative effect, we include the four defense dummies in
regression 4. The restricted regime dummy appears to mainly drive the takeover defense effect.
In particular, the abnormal returns around acquisition announcements are 1.0% lower for firms
that have adopted a structured regime as compared to firms that have not adopted such a regime.
Comparing the 1.0% with the average of 1.07% abnormal returns for the whole sample, the
impact of a structured regime is high.
4.3. Which firms make wealth-destructing deals?
As previously mentioned, our results suggest that a small number of acquisitions drive down the
total shareholders� wealth around acquisition announcements. In this section, we investigate
whether firm and deal characteristics differ for wealth-destructing deals versus non-wealth
destructing deals. In particular, we expect these wealth-destructing deals to occur in firms where
managers are able to exercise discretion and make acquisitions that maximize their own utility.
Corporate governance should prevent managers from making large loss deals. Moeller,
Schlingemann and Stulz (2005) examine wealth-destructing deals with a loss of at least $1 billion
disclosed by US firms. We focus on deals with losses of more than �150 million, because our
sample exclusively consists of Dutch firms that are on average smaller than US firms and we aim
to construct a sample that is large enough to draw robust conclusions.4 From our sample of 865
acquisition announcements, 80 acquisitions announced by 9 firms are wealth-destructing. The
26
total wealth destruction of these 80 acquisition announcements is �38 billion. Table 6 presents
descriptives and mean comparisons of the sample with and without these wealth-destructing
deals.
- Insert Table 6 about here �
Panel A provides the firm characteristics. Consistent with Moeller, Schlingemann and Stulz
(2005), firms that make value-destroying acquisitions are larger (market capitalization of �12.0
billion vs. �1.5 billion) and have a higher Tobin�s q (2.067 vs. 1.459). The higher Tobin�s q is in
line with the arguments that a high valuation of firms increases the likelihood of managers to act
in their own interest (Jensen, 2005; Moeller, Schlingemann and Stulz, 2005). According to
Jensen (1986), managers in firms with excess free cash flows are more likely to make value
reducing acquisitions. However, this theory does not apply to wealth-destructing acquisitions, as
firm years in which wealth-destructing acquisitions occur do not have significantly more free
cash flows. Governance characteristics also provide some significant results. Although both the
supervisory board and the executive board are larger in firms with wealth-destructing deals, the
relative size of the executive board is smaller (60.4% versus 64.4%). The smaller relative number
of executives in the board implies better monitoring and therefore a lower probability to make
large losses. Moreover, the percentage of outside blockholders that are other monitoring agents is
lower within firm years with wealth-destructing deals (20.7% vs. 30.5%). Insider ownership
should increase the incentives of managers to act firm value maximizing and hence not to make
large losses around acquisition announcements. Insider ownership of 1.1% for firm years with
wealth-destructing acquisitions and of 6.6% for firm years without such deals is evidence that is
consistent with this line of reasoning. A remarkable result is that firms making wealth-destructing

27
deals are more often cross-listed in the US and/or the UK (73.9% vs. 24.4%). A cross-listing is
amongst others a bonding mechanism for managers to act value-maximizing (Coffee Jr., 1999,
2002), however, the results suggest the opposite. An alternative explanation comes from the fact
that Dutch firms with a cross-listing in the US and/or UK are typically larger. The significant
difference may be an artifact of firm size. Another surprising result is the lower amount of
takeover defense mechanisms in firm years with value-destructing deals (1.8 vs. 2.2).
Distinguishing between the different takeover defense mechanisms gives 21.7% of all firm years
with wealth-destructing acquisitions have certificates, 39.1% have adopted the structured regime,
58.7% have preference shares and 65.2% have priority shares. For firm years without the wealth-
destructing deals, these percentages are 39.8%, 72.9%, 68.8% and 39.5%, respectively.
Therefore, only the relatively high application of priority shares for firm years with wealth-
destructing deals as compared to firms without such deals meets our expectations.
Panel B provides the differences in deal characteristics between wealth-destructing deals and non
wealth-destructing deals. As wealth-destructing deals have a large impact on the euro value of
firms, we expect the transaction value for these deals to be larger as well. The table shows a
higher transaction value for value-destructing deals, yet the difference is not statistically
significant. This also applies for the transaction value standardized by the market value of equity
of the acquirer. Unexpectedly, the ratio of target sales to acquirer sales, which is also a proxy for
the size of the deal, is smaller for value-destroying deals (3.8% vs. 9.9%). Moeller, Schlingemann
and Stulz (2005) suggest that the absolute change of returns around acquisition announcements
reflect both the net present value of the acquisition itself and the information that is revealed
about the firm by announcing an acquisition. The large loss deals may be a reflection of the
information about the firm beyond the acquisition announcement. Furthermore, targets of value-

28
destructing deals are more often listed (15% vs. 6.4%) and located in the US (30% vs. 18.1%). In
contrast to Moeller, Schlingemann and Stulz (2005), we find less equity payments in wealth-
destructing deals. In particular, 1.3% of the wealth-destructing deals are financed with equity,
whereas this is 6.4% for non wealth-destructing deals (this is 0% vs. 3.9% for mixed payment
methods).
Now that we know the characteristics of firms announcing wealth-destructing deals and the
characteristics of such a deal itself, we aim to predict the likelihood that a wealth-destructing
acquisition occurs. In a logit regression with exclusively a dummy for the firm being in its
highest valuation year, Moeller, Schlingemann and Stulz (2005) find that firms make wealth
destructing deals when their valuation is high. This result is consistent with the arguments of
Jensen (2005), who reasons that a high valuation of firms increases the likelihood of managers to
act in their own interest. Apart from the Tobin�s q, we include additional firm, governance and
deal variables in the regression in which the dependent variable that takes on the value of one if
the deal is value-destructing and zero otherwise. We are particularly interested in whether good
corporate governance structures provide more protection for shareholders.
- Insert Table 7 about here �
With a McFadden R-squared of 35.68%, the model can reasonably predict the likelihood that
firms make value-destructing acquisitions. The significantly positive Tobin�s q is in line with the
theory that managers of highly valued firms are more likely to make value decreasing decisions.
Leverage shows a significantly positive coefficient, suggesting that firms with more leverage are
more likely to make value-decreasing acquisitions in spite of the fact that leverage acts as a

29
monitoring device (Jensen, 1986). As De Jong (2002) argues that Dutch managers are not
disciplined by leverage, shareholders can perceive acquisition announcements of firms with high
leverage as highly risky and hence respond negatively to the announcement. Furthermore, larger
firms are also more likely to make wealth-destructing deals. This result is consistent with
Moeller, Schlingemann and Stulz (2004), who find a size effect in explaining acquirer returns
around acquisition announcements. As larger firms make larger deals, they are also more likely to
make larger losses. The governance variables suggest that the relative size of the board, priority
shares and preference shares influence the likelihood of a wealth-destructing deal. In line with
our expectations, a larger proportion of executives on the board give the executives more
possibilities to exercise discretion, increasing the probability to make value-destroying
acquisitions. Furthermore, firms with priority shares, providing friendly shareholders with special
rights such as merger approval, are better protected against takeover defenses and therefore more
likely to make wealth-destructing deals. On the other hand, preference shares, another takeover
defense mechanism, negatively influence the probability of wealth-destructing acquisitions. The
other governance variables � i.e. block shareholders, insider ownership, being cross-listed in the
US or UK, certificates and structured regime � do not show a significant impact. Free cash flows,
return on assets and none of the deal characteristics influence the probability of value-destructing
deals either. In sum, the significant coefficients of firms� Tobin�s q, leverage and size imply that
managers exercise discretion in their acquisition decisions resulting in a higher probability of
making wealth-destructing acquisitions. Corporate governance does have an effect on acquirer
wealth gains in acquisitions; however, the results suggest a rather minor effect.

30
5. Conclusion
This paper provides an extensive description of the acquisition market within the Netherlands for
the period starting in 1993 until 2004. We investigate the change in shareholders� wealth during
the days around acquisition announcements and the impact of a firm�s governance structure on
shareholders� wealth change. From an international perspective, the Netherlands provides an
interesting setting, as the market for corporate control is virtually absent. Dutch firms can
implement four types of defense mechanisms � priority shares, preference shares, certificates,
adoption of structured regime � that severely restrict shareholders� power. Limited shareholder
power leaves much room for managers to exercise discretion in their acquisition decisions. We
examine shareholders� wealth change in terms of the percentage abnormal returns and the
absolute euro change.
We investigate a sample of 865 acquisitions in the period 1993-2004 and find that, even though
shareholders have limited power, their average wealth increases around acquisition
announcements. We also find that an adequate corporate governance structure has a minor
influence on acquisition announcements. In explaining acquirer returns, only one governance
factor provides significant results. Specifically, firms that adopt the structured regime have lower
acquirer returns, which is in line with managers exercising discretion when shareholders� power
is low.
In addition to returns expressed as the corrected percentage stock price change, we also measure
the changes in the market values of the firm�s equity in euros. We find the same striking result as
Moeller, Schlingemann and Stulz (2005) that during 2001 and 2002 average acquirer returns are
positive, whereas the total euro wealth effect for shareholders is negative. In order to shed light

31
on this counter-intuitive finding, we examine which firms are more likely to announce deals that
result in a wealth loss of more than �150 million. Our results indicate that high q firms, firms
with high leverage and larger firms are more likely to make value-destructing acquisitions. The
finding that high q firms are dominantly present among the group of wealth destructing
companies is in line with Jensen�s (2005) prediction of agency problems resulting from
overvalued equity. The positive impact of leverage on the likelihood of managers to announce
value-destructing deals is in line with the results of De Jong (2002), who finds Dutch managers to
avoid the disciplining role of leverage, especially when they overinvest. Once more, the results
on explaining the likelihood of wealth destructing deals suggest a minor impact of corporate
governance. A smaller relative amount of executive board members and firms that do not have
priority shares decrease the likelihood of value-destructing acquisitions.

32
References
Andrade, G., M. L. Mitchell, and E. Stafford, 2001. New evidence and perspectives on mergers.
Journal of Economic Perspectives 15, 103-120.
Bebchuk, L., J. C. Coates, and G. Subramanian, 2002. The powerful antitakover force of staggerd
boards: Theory, evidence, and policy. Stanford Law Review 54, 887-951.
Bebchuk, L., A. Cohen, and A. Ferrell, 2005. What matters in corporate governance?
Unpublished working paper. Harvard Law School, Boston.
Berger, P. G., and E. Ofek, 1995. Diversification's effect on firm value. Journal of Financial
Economics 37, 39-65.
Berle, A. A. J., and G. C. Means, 1932. The modern corporation and private property. Macmillan,
New York.
Chang, S., 1998. Takeovers of privately held targets, methods of payment, and bidder returns.
The Journal of Finance 53, 773-784.
Coffee Jr., J. C., 1999. The future as history: The prospects for global convergence in corporate
governance and its implications. Northwestern University Law Review 93, 641-708.
Coffee Jr., J. C., 2002. Racing towards the top?: The impact of cross-listings and stock market
competition on international corporate governance. Columbia Law Review 102, 1757-
1831.
Corhay, A., and A. Tourani Rad, 2000. International acquisitions and shareholder wealth:
Evidence from the Netherlands. International Review of Financial Analysis 9, 163-174.
De Jong, A., 2002. The disciplining role of leverage in Dutch firms. European Finance Review 6,
31-62.

33
De Jong, A., D. V. DeJong, G. M. H. Mertens, and C. E. Wasley, 2005. The role of self-
regulation in corporate governance: Evidence and implications from The Netherlands.
Journal of Corporate Finance 11, 473-503.
De Jong, A., R. Kabir, T. Marra, and A. Röell, 2001. Ownership and control in the Netherlands.
In: The control of corporate Europe, ed.: Fabrizio Barca, and Marco Becht (Oxford
University Press, New York).188-206
De Jong, A., G. M. H. Mertens, and P. Roosenboom, 2004. Shareholders' voting at general
meetings: Evidence from the Netherlands. Unpublished working paper. RSM Erasmus
University, Rotterdam.
De Jong, A., G. M. H. Mertens, and M. Van der Poel, 2006. The impact of managerial discretion
on management earnings forecasts. Unpublished working paper. RSM Erasmus
University, Rotterdam
Denis, D. J., D. K. Denis, and K. Yost, 2002. Global diversification, industrial diversification,
and firm value. The Journal of Finance 57, 1951-1979.
Field, L. C., and J. M. Karpoff, 2002. Takeover defenses of IPO firms. The Journal of Finance
57, 1857-1889.
Franks, J., R. Harris, and S. Titman, 1991. The postmerger share-price performance of acquiring
firms. Journal of Financial Economics 29, 81-96.
Goergen, M., and L. Renneboog, 2004. Shareholder wealth effects of European domestic and
cross-border takeover bids. European Financial Management 10, 9-45.
Gompers, P. A., J. L. Ishii, and A. Metrick, 2003. Corporate governance and equity prices.
Quarterly Journal of Economics 118, 107-155.
Hansen, R. G., 1987. A theory for the choice of exchange medium in mergers and acquisitions.
The Journal of Business 60, 75-95.

34
Harford, J., 2005. What drives merger waves? Journal of Financial Economics 77, 529-560.
Jensen, M. C., 1986. Agency costs of free cash flow, corporate finance, and takeovers. The
American Economic Review 76, 323-329.
Jensen, M. C., 2005. Agency costs of overvalued equity. Financial Management 34, 5-19.
Jensen, M. C., and W. H. Meckling, 1976. Theory of the firm: Managerial behavior, agency cost
and ownership structure. Journal of Financial Economics 3, 305-360.
Kabir, R., D. Cantrijn, and A. Jeunink, 1997. Takeover defenses, ownership structure and stock
returns in the Netherlands: An empirical analysis. Strategic Management Journal 18, 97-
109.
La Porta, R., F. Lopez-de-Silanes, A. Shleifer, and R. W. Vishny, 1998. Law and finance. Journal
of Political Economy 106, 1113-1155.
Lang, L. H. P., R. M. Stulz, and R. A. Walkling, 1989. Managerial performance, Tobin's q, and
the gains from successful tender offers. Journal of Financial Economics 24, 137-154.
Lang, L. H. P., R. M. Stulz, and R. A. Walkling, 1991. A test of the free cash flow hypothesis.
Journal of Financial Economics 29, 315-335.
Lehn, K., and A. Poulsen, 1989. Free cash flow and stockholder gains in going private
transactions. The Journal of Finance 44, 771-787.
MacKinlay, A. G., 1997. Event studies in economics and finance. Journal of Economic Literature
35, 13-39.
Maloney, M. T., R. E. McCormick, and M. L. Mitchell, 1993. Managerial decisions making and
capital structure. The Journal of Business 66, 189-217.
Martynova, M., and L. Renneboog, 2006. Mergers and acquisitions in Europe. In: Advances in
corporate finance and asset pricing, ed.: Luc Renneboog (Elsevier, Amsterdam).16-75

35
Masulis, R. W., C. Wang, and F. Xie, 2006. Corporate governance and acquirer returns.
Unpublished working paper. Vanderbilt University, Nashville.
Mitchell, M. L., and K. Lehn, 1990. Do bad bidders become good targets? The Journal of
Political Economy 98, 372-398.
Moeller, S. B., and F. P. Schlingemann, 2005. Global diversification and bidder gains: A
comparison between cross-border and domestic acquisitions. Journal of Banking &
Finance 29, 533-564.
Moeller, S. B., F. P. Schlingemann, and R. M. Stulz, 2004. Firm size and the gains from
acquisitions. Journal of Financial Economics 73, 201-228.
Moeller, S. B., F. P. Schlingemann, and R. M. Stulz, 2005. Wealth destruction on a massive
scale? A study of acquiring-firm returns in the recent merger wave. The Journal of
Finance 60, 757-782.
Morck, R., A. Shleifer, and R. W. Vishny, 1990. Do managerial objectives drive bad
acquisitions? The Journal of Finance 45, 31-48.
Mulherin, H. J., and A. L. Boone, 2000. Comparing acquisitions and divestitures. Journal of
Corporate Finance 6, 117-139.
Rajan, R., H. Servaes, and L. Zingales, 2000. The cost of diversity: The diversification discount
and inefficient investment. The Journal of Finance 55, 35-80.
Renneboog, L., and P. G. Szilagyi, 2006. How relevant is dividend policy under low shareholder
protection? Unpublished working paper. Tilburg University, Tilburg.
Scharfstein, D. S., and J. C. Stein, 2000. The dark side of internal capital markets: Divisional
rent-seeking in inefficient investment. The Journal of Finance 55, 2537-2564.
Servaes, H., 1991. Tobin's q and the gains from takeovers. The Journal of Finance 46, 409-419.

36
Shleifer, A., and R. W. Vishny, 1989. Management entrenchment: The case of manager-specific
investments. Journal of Financial Economics 25, 123-139.
Shleifer, A., and R. W. Vishny, 2003. Stock market driven acquisitions. Journal of Financial
Economics 70, 295-311.

37
Table 1: Descriptive statistics of acquirer and deal characteristics The table presents the means, medians, standard deviations and the number of observations of firm and deal variables. The market capitalization is the beginning of the year market value of equity. The return on assets is calculated as operating profits standardized by book value of total assets. We measure the Tobin�s q as the ratio of a firm�s market value to replacement value of assets as calculated in De Jong, DeJong, Mertens and Wasley (2005). We calculate free cash flow as in Lehn and Poulsen (1989). Leverage is total debt divided by book value of total assets. The relative size of the board is the number of executive board members divided by total number of board members. The takeover index is the aggregate value of all four takeover defense dummies (i.e. priority shares, preference shares, certificates and structured regime). The transaction value is the amount paid for the target. Panel A: Acquirer characteristics at a firm year level
Mean Median St.dev. NFinancial characteristics
Market capitalization (� thousands) 3,081,620 593,857 7,776,843 312Return on assets 0.336 0.108 3.737 312Tobin's q 1.548 1.344 0.769 312Free cash flow/total assets 0.032 0.034 0.035 312Leverage 0.279 0.245 0.188 312
Governance characteristicsNumber of supervisory board members 3.510 3.000 1.645 312Number of executive board members 6.048 6.000 2.205 312Relative size of executive board 0.638 0.636 0.108 312Percentage largest outside blockholder 0.170 0.090 0.182 312Total percentage outside blockholders 0.291 0.225 0.237 312Total percentage inside blockholders 0.058 0.000 0.141 312Dummy cross listing US and/or UK 0.317 0.000 0.466 312Takeover defense index 2.157 2.000 1.007 312
Dummy priority shares 0.433 0.000 0.496 312Dummy preference shares 0.673 1.000 0.470 312Dummy certificates 0.372 0.000 0.484 312Dummy structured regime 0.679 1.000 0.467 312
Panel B: Deal characteristics at a deal level
Mean Median St.dev. NTransaction value (� thousands) 520,761 90,756 1,201,059 152Transaction value/market capitalization 0.136 0.031 0.255 152Sales target/sales acquirer 0.094 0.015 0.291 555Dummy listed target 0.072 0.000 0.259 865Dummy diversifying acquisition 0.205 0.000 0.404 865Dummy focus shifting acquisition 0.049 0.000 0.215 865Dummy payment in cash and equity 0.036 0.000 0.186 865Dummy payment in equity 0.059 0.000 0.236 865Dummy payment in cash 0.191 0.000 0.393 865Dummy domestic acquisition 0.240 0.000 0.428 865Dummy European acquisition (excluding NL) 0.445 0.000 0.497 865Dummy US acquisition 0.192 0.000 0.394 865
all deals
all deals

38
Table 2: Acquirer returns around acquisition announcements for different event windows This table presents the descriptive statistics of the percentage abnormal returns and the wealth transfer in millions of euros for different event windows. The acquisition announcement day is day zero. Abnormal returns are calculated by using the market model as described in MacKinlay (1997), with the estimation window running from day -120 to day -20. We aggregate the abnormal returns for the different event windows. The euro wealth transfer is the cumulative abnormal returns for the event window times the acquirer�s market capitalization at the beginning of the fiscal year. The table shows *, ** and *** for values that are significantly different from zero at a 10%, 5% and 1% level, respectively. Panel A: Descriptives of the market reaction to acquisition announcements for different event windows
[-20, 20] [-10, 10] [-5, 5] [-2,2] [-20,-3] [3,20]Mean 1.30% *** 0.96% *** 1.13% *** 1.07% *** 0.08% 0.15%Minimum -55.76% -68.33% -36.09% -22.48% -66.47% -39.07%25% -6.16% -3.97% -2.63% -1.45% -4.31% -3.85%Median 1.00% 0.45% 0.54% 0.61% -0.16% -0.15%75% 7.29% 5.40% 4.43% 3.31% 4.37% 4.16%Maximum 68.22% 71.17% 40.39% 39.27% 32.57% 50.23%Standard deviation 12.42% 9.04% 6.78% 4.95% 7.86% 7.69%N 865 865 865 865 865 865 Panel B: Descriptives of the wealth transfer in � millions around acquisition announcements for different event windows
[-20, 20] [-10, 10] [-5, 5] [-2,2] [-20,-3] [3,20]Mean 23.04 1.89 6.57 17.89 * -28.70 33.84Minimum -9,040.49 -6,377.08 -5,144.17 -2,726.24 -6,545.32 -3,646.4425% -66.75 -55.36 -41.87 -20.13 -51.37 -54.05Median 3.05 1.49 1.49 2.22 -0.37 -0.4275% 87.75 52.87 51.62 37.06 53.80 47.92Maximum 16,146.15 9,302.80 3,717.78 1,790.41 7,199.73 11,871.74Standard deviation 1,033.73 665.18 482.74 294.73 673.89 839.78N 865 865 865 865 865 865
Event window
Event window

39
Table 3: Stated motives for acquisitions and the related abnormal returns This table presents the frequency of acquirers� motives for the acquisition as disclosed in their acquisition announcements. Cost reduction consists of economies of scale, synergy, efficiency and access to low wage labor. The table also provides the average cumulative abnormal returns over five days surrounding the acquisition announcements per stated motive. The table shows *, ** and *** for CAR values that are significantly different from zero at a 10%, 5% and 1% level, respectively.
Stated motives for acquisitions Number Percentage CARCost reduction 60 7% 1.32% *Geographic expansion 150 17% 1.19% ***Broadening product line 61 7% 0.93%Increasing market share 321 37% 1.21% ***Diversification/vertical integration 22 3% 1.56% *Other motive 19 2% 0.86%No motive 232 27% 0.74% **Total 865 100% 1.07% ***

40
Table 4: The characteristics of shareholders� wealth effects per year The table shows descriptives of the cumulative abnormal returns over five days surrounding acquisition announcements and the related euro wealth effects per year. The euro wealth effects are the cumulative abnormal returns for the event window times the acquirer�s market capitalization at the beginning of the fiscal year. The table shows *, ** and *** for values that are significantly different from zero at a 10%, 5% and 1% level, respectively.
year n Mean Median % positive Total Mean Median1993 61 1.42% *** 1.03% 69% 1,075.61 17.63 *** 2.031994 83 -0.05% -0.26% 41% -1,190.58 -14.34 -2.551995 97 0.00% -0.32% 42% -1,602.75 -16.52 -2.061996 86 1.09% *** 0.73% 59% 749.88 8.72 2.211997 89 1.66% *** 0.78% 57% 2,820.43 31.69 1.541998 102 0.85% 0.72% 64% 839.57 8.23 3.681999 116 2.20% *** 1.93% 61% 7,756.35 66.87 * 5.912000 83 1.10% * 1.19% 59% 4,103.12 49.44 11.842001 44 1.31% * 1.79% 66% -660.20 -15.00 4.582002 44 0.80% 0.56% 52% -4.66 -0.11 5.452003 27 1.22% 2.34% 59% 468.61 17.36 9.752004 33 1.31% *** 1.47% 73% 1,123.02 34.03 3.73ALL 865 1.07% 0.61% 57% 15,478.40 17.89 2.22
Wealth effects in � millionsCAR [-2,2]

41
Table 5: Regression analysis of acquirer return around acquisition announcements The table provides the results of ordinary least squares regressions that explain the abnormal returns during five days around acquisition announcements. All variables in this table are defined in Table 1. All regressions include year and industry dummies. P-values are documented in parentheses and based on White�s heteroskedasticity corrected standard errors. The table shows *, ** and *** for values that are significantly different from zero at a 10%, 5% and 1% level, respectively.
(1) (2) (3) (4)Coefficient Coefficient Coefficient Coefficient
Intercept 0.111 *** 0.114 *** 0.106 *** 0.097 ***(0.000) (0.001) (0.003) (0.009)
Tobin's q -0.001 -0.004 0.000 0.000(0.611) (0.172) (0.895) (0.890)
Free cash flow/total assets -0.011 0.144 -0.023 -0.003(0.915) (0.209) (0.822) (0.973)
Return on assets 0.000 0.000 0.000 0.000(0.779) (0.378) (0.835) (0.841)
Leverage -0.004 0.003 -0.003 0.002(0.762) (0.833) (0.805) (0.863)
ln(size) -0.006 *** -0.003 ** -0.006 *** -0.005 ***(0.000) (0.021) (0.002) (0.006)
Dummy equity payment 0.022 ** 0.000 0.023 ** 0.023 **(0.044) (0.964) (0.035) (0.033)
Dummy listed target 0.002 -0.010 0.000 0.000(0.826) (0.186) (0.977) (0.975)
Dummy diversifying -0.005 -0.003 -0.005 -0.005(0.229) (0.536) (0.269) (0.228)
Dummy Domestic target -0.002 0.000 0.001 0.001(0.752) (0.962) (0.839) (0.807)
Dummy European target, but not Dutch -0.008 -0.003 -0.006 -0.006(0.101) (0.584) (0.216) (0.211)
Dummy US target -0.001 0.004 0.001 0.001(0.822) (0.562) (0.930) (0.931)
Relative size of acquisition 0.058 ***(0.000)
Relative size of the board 0.013 0.017(0.468) (0.362)
Block shareholders 0.003 0.003(0.730) (0.703)
Insider ownership -0.011 -0.008(0.526) (0.656)
Dummy cross-listing US or UK -0.001 -0.003(0.767) (0.486)
Takeover defense index -0.004 *(0.060)
Dummy priority shares -0.005(0.241)
Dummy preference shares 0.001(0.910)
Dummy certificates -0.001(0.779)
Dummy structured regime -0.010 *(0.086)
Number of observations 865 644 865 865Adjusted R -squared 5.11% 12.03% 4.66% 4.99%* significant at 10%; ** significant at 5%, *** significant at 1%

Table 6: Differences between wealth-destructing deals and non-wealth-destructing deals This table presents the means, medians, standard deviations and the number of observations of firm years with wealth-destructing deals and firm years without wealth-destructing deals in panel A. The last two columns show the mean difference and the p-value of the mean difference between the two types of firm years. Panel B provides these statistics for wealth-destructing deals and non-wealth-destructing deals. A deal is classified as wealth-destructing when the negative wealth effect is more than �150 million. All variables in this table are defined in Table 1. The table shows *, ** and *** for mean differences that are significantly different from zero at a 10%, 5% and 1% level, respectively. Panel A: Acquirer characteristics at a firm year level
Difference Mean (1) Median St.dev. N Mean (2) Median St.dev. N (1)-(2) p -valueFinancial characteristics
Market capitalization (� thousands) 1,542,605 423,689 6,037,254 266 11,981,138 8,434,009 10,410,379 46 -10,438,533 0.000Leverage 0.274 0.247 0.187 266 0.310 0.239 0.195 46 -0.036 0.248Tobin's q 1.459 1.302 0.664 266 2.067 1.805 1.081 46 -0.609 0.000Free cash flow/total assets 0.031 0.034 0.036 266 0.039 0.037 0.032 46 -0.007 0.171Return on assets 0.197 0.107 3.795 266 1.142 0.114 3.300 46 -0.945 0.113
Governance characteristicsNumber of supervisory board members 3.271 3.000 1.588 266 4.891 5.000 1.251 46 -1.621 0.000Number of executive board members 5.801 6.000 2.171 266 7.478 7.000 1.847 46 -1.678 0.000Relative size of executive board 0.644 0.667 0.114 266 0.604 0.600 0.059 46 0.041 0.018Percentage largest outside blockholder 0.171 0.100 0.182 266 0.163 0.090 0.184 46 0.008 0.789Total percentage outside blockholders 0.305 0.240 0.242 266 0.207 0.150 0.185 46 0.098 0.009Total percentage inside blockholders 0.066 0.000 0.148 266 0.011 0.000 0.074 46 0.055 0.014Dummy cross listing US and/or UK 0.244 0.000 0.431 266 0.739 1.000 0.444 46 -0.495 0.000Takeover defense index 2.211 2.000 1.014 266 1.848 2.000 0.918 46 0.363 0.018
Dummy priority shares 0.395 0.000 0.490 266 0.652 1.000 0.482 46 -0.257 0.001Dummy preference shares 0.688 1.000 0.464 266 0.587 1.000 0.498 46 0.101 0.179Dummy certificates 0.398 0.000 0.491 266 0.217 0.000 0.417 46 0.181 0.019Dummy structured regime 0.729 1.000 0.445 266 0.391 0.000 0.493 46 0.338 0.000
Excl. firmyrs with wealth-destructing deals Firmyrs with wealth-destructing deals
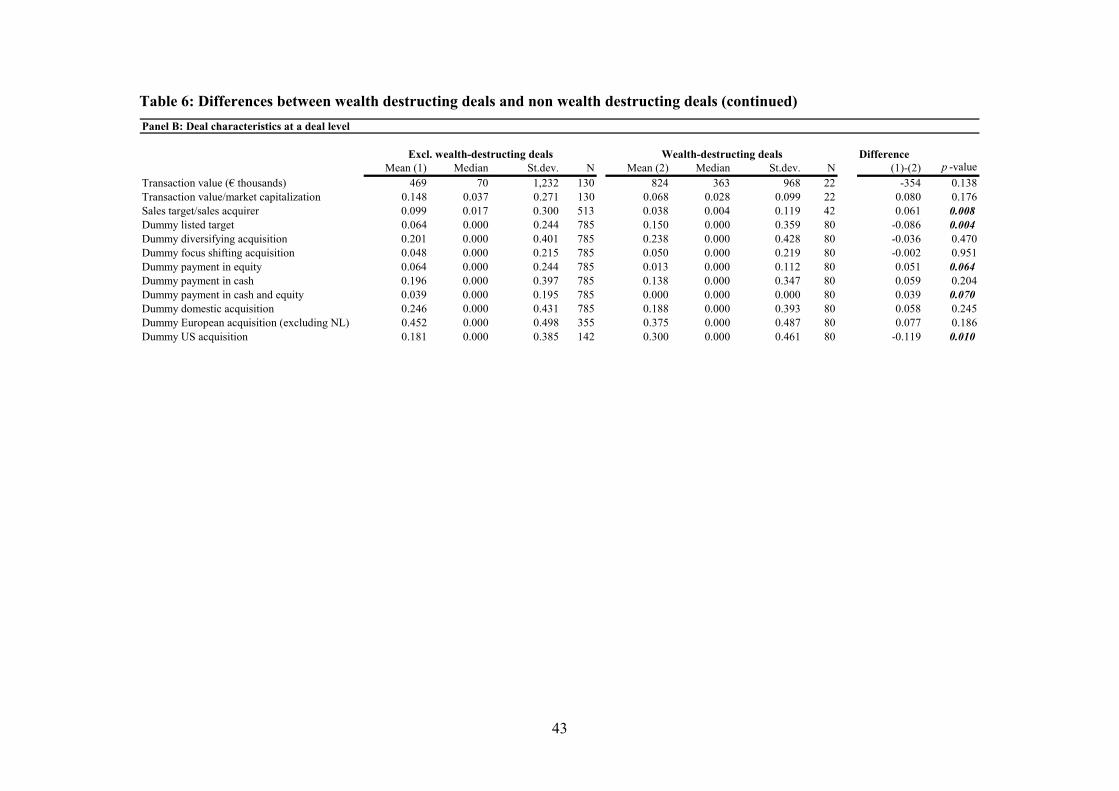
43
Table 6: Differences between wealth destructing deals and non wealth destructing deals (continued) Panel B: Deal characteristics at a deal level
Difference Mean (1) Median St.dev. N Mean (2) Median St.dev. N (1)-(2) p -valueTransaction value (� thousands) 469 70 1,232 130 824 363 968 22 -354 0.138Transaction value/market capitalization 0.148 0.037 0.271 130 0.068 0.028 0.099 22 0.080 0.176Sales target/sales acquirer 0.099 0.017 0.300 513 0.038 0.004 0.119 42 0.061 0.008Dummy listed target 0.064 0.000 0.244 785 0.150 0.000 0.359 80 -0.086 0.004Dummy diversifying acquisition 0.201 0.000 0.401 785 0.238 0.000 0.428 80 -0.036 0.470Dummy focus shifting acquisition 0.048 0.000 0.215 785 0.050 0.000 0.219 80 -0.002 0.951Dummy payment in equity 0.064 0.000 0.244 785 0.013 0.000 0.112 80 0.051 0.064Dummy payment in cash 0.196 0.000 0.397 785 0.138 0.000 0.347 80 0.059 0.204Dummy payment in cash and equity 0.039 0.000 0.195 785 0.000 0.000 0.000 80 0.039 0.070Dummy domestic acquisition 0.246 0.000 0.431 785 0.188 0.000 0.393 80 0.058 0.245Dummy European acquisition (excluding NL) 0.452 0.000 0.498 355 0.375 0.000 0.487 80 0.077 0.186Dummy US acquisition 0.181 0.000 0.385 142 0.300 0.000 0.461 80 -0.119 0.010
Excl. wealth-destructing deals Wealth-destructing deals

Table 7: Regression analysis explaining the likelihood of a wealth-destructing acquisition
announcement The table provides the results of a binary logit regression that explains the likelihood of an acquisition announcement to be wealth destructing. A deal is classified as wealth-destructing when the negative wealth effect is more than �150 million. All variables in this table are defined in Table 1. The regression includes year and industry dummies. P-values are documented in parentheses and based on Huber/White�s heteroskedasticity corrected standard errors. The table shows *, ** and *** for values that are significantly different from zero at a 10%, 5% and 1% level, respectively.
Coefficient(p -value)
Intercept -28.020 ***(0.000)
Tobin's q 0.995 ***(0.000)
Free cash flow/total assets 4.451(0.634)
Return on assets 0.059(0.393)
Leverage 3.696 ***(0.005)
ln(size) 1.509 ***(0.000)
Dummy equity payment -1.105(0.298)
Dummy listed target 0.472(0.279)
Dummy diversifying 0.455(0.194)
Dummy European target, but not Dutch 0.339(0.452)
Dummy Domestic target 0.841(0.131)
Dummy US target 0.329(0.521)
Relative size of the board -3.981 *(0.079)
Block shareholders 0.720(0.553)
Insider ownership 0.986(0.744)
Dummy cross-listing US or UK 0.700(0.215)
Dummy priority shares 0.995 *(0.056)
Dummy preference shares -0.899 *(0.072)
Dummy certificates 0.193(0.715)
Dummy structured regime -0.163(0.774)
Number of observations 865McFadden R -squared 35.68%* significant at 10%; ** significant at 5%, *** significant at 1%

45
Figure 1: The development of abnormal returns around acquisition announcements This figure shows the cumulative average abnormal returns of the days around acquisition announcements. The day of the announcement is day zero.
Development of abnormal returns around announcement day
-0.20%
0.00%
0.20%
0.40%
0.60%
0.80%
1.00%
1.20%
1.40%
-20 -18 -16 -14 -12 -10 -8 -6 -4 -2 0 2 4 6 8 10 12 14 16 18 20
Day
CA
AR

46
Figure 2: The distribution of abnormal returns This figure provides the distribution of the five days cumulative abnormal returns around acquisition announcements. The horizontal axis shows the five days cumulative abnormal returns and the vertical axis shows the frequency in which this return occurs.
Frequency of CAR[-2:2]
0
20
40
60
80
100
120
<-20
%
-18%
-16%
-14%
-12%
-10% -8%
-6%
-4%
-2% 0% 2% 4% 6% 8% 10%
12%
14%
16%
18%
>20%
CAR[-2:2]
Freq
uenc
y

47
Figure 3: The number of acquisition announcements and the total wealth effects per year This figure shows the number of acquisitions and the total aggregated wealth effects over five days around acquisition announcements per announcement year. The left vertical axis provides the number of acquisitions, the right vertical axis shows the total wealth effects in millions of euros and the horizontal axis shows the announcement year.
61
83
9786 89
102
116
83
44 44
2733
-50
-30
-10
10
30
50
70
90
110
1993 1994 1995 1996 1997 1998 1999 2000 2001 2002 2003 2004
Num
ber
of a
cqui
sitio
ns
-4,000
-2,000
0
2,000
4,000
6,000
8,000
10,000
Tot
al w
ealth
effe
ct in
� m
illio
ns
Number of acquisitions Total wealth effect

48
Endnotes
1 De Jong, Kabir, Marra and Röell (2001) provide an extensive description about the ownership
and control of listed firms in the Netherlands.
2 The 1996 Act on Disclosure of Holdings in Listed Companies, provides that any person, who
directly or indirectly, acquires or disposes of an interest in the capital and/or the voting right of
public limited liability company incorporated under Dutch law with an official listing on a stock
exchange, must give a written notice of such acquisition or disposal, if as a result of such
acquisition or disposal the percentage of capital interest or voting rights held by such person falls
within another percentage range held by such person prior to the acquisition or disposal. The
relevant percentage ranges referred to in the Disclosure of Holdings Act are 0% to 5%; 5% to
10%; 10% to 25%; 25% to 50%; 50% to 66%; and over 66%.
3 Most of the takeover activity is concentrated in Europe and the US. For example, only 4.1% of
the deals concern Asian targets, 1.2% are acquisitions of African firms and 2.7% concern non-US
companies from the American continents.
4 Our sample includes eight deals with shareholders� losses of more than �1 billion.
![Mergers, Acquisitions and Wealth Creation - [email protected] Dubai](https://static.fdocuments.in/doc/165x107/6207516f49d709492c303bb8/mergers-acquisitions-and-wealth-creation-emailprotected-dubai.jpg)