
Corporate Financial Leverage, Asset Utilization and ... · PDF fileCorporate Financial...
34
The Lahore Journal of Economics 22 : 1 (Summer 2017): pp. 37–70 Corporate Financial Leverage, Asset Utilization and Nonperforming Loans in Pakistan Ijaz Hussain* Abstract This study applies panel least squares and fixed effects to a sample of 40 banks for the period 2006–14 to identify the key determinants of nonperforming loans (NPLs) in Pakistan. The findings suggest that, in addition to some macroeconomic and bank-specific variables, the corporate debt–equity ratio and financial burden have a positive, significant impact on NPLs, while corporate asset utilization and the diversification of bank activities significantly reduce the volume of NPLs. This has policy implications not only for the federal government, but also for bank managers, regulators and policy advisors. Keywords: nonperforming loans, bank asset quality, diversification, Pakistan. JEL classification: G00, G21, G28. 1. An Overview of Nonperforming Loans in Pakistan Although the volume of nonperforming loans (NPLs) as a share of gross advances in Pakistan has declined from a peak of 16.2 percent in 2011, this ratio remains higher than the regional and world averages – 12.5 percent in 2014 compared to 7.0 percent for South Asia and 4.5 percent globally (Figures 1 and 2). The State Bank of Pakistan reveals that lending to the corporate sector alone accounts for almost 65.6 percent of gross advances for investment in noncurrent assets, working capital and trade financing. The corporate sector’s contribution to the total volume of NPLs was alarmingly high at almost 70 percent in 2014 (Table 1). More than 94 percent of all bank credit is channeled to urban areas. The share of rural areas has never been more than 6 percent (Table 2). * Assistant Professor, School of Liberal Arts and Social Sciences, Beaconhouse National University, Lahore, Pakistan.
Transcript of Corporate Financial Leverage, Asset Utilization and ... · PDF fileCorporate Financial...

The Lahore Journal of Economics 22 : 1 (Summer 2017): pp. 37–70
Corporate Financial Leverage, Asset Utilization and
Nonperforming Loans in Pakistan
Ijaz Hussain*
Abstract
This study applies panel least squares and fixed effects to a sample of 40 banks for the period 2006–14 to identify the key determinants of nonperforming loans (NPLs) in Pakistan. The findings suggest that, in addition to some macroeconomic and bank-specific variables, the corporate debt–equity ratio and financial burden have a positive, significant impact on NPLs, while corporate asset utilization and the diversification of bank activities significantly reduce the volume of NPLs. This has policy implications not only for the federal government, but also for bank managers, regulators and policy advisors.
Keywords: nonperforming loans, bank asset quality, diversification, Pakistan.
JEL classification: G00, G21, G28.
1. An Overview of Nonperforming Loans in Pakistan
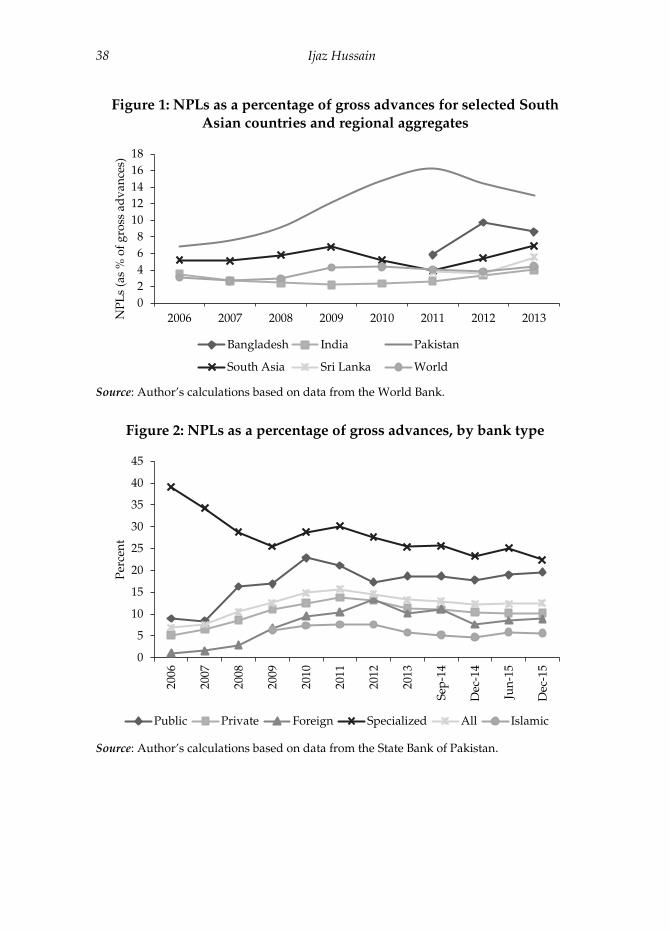
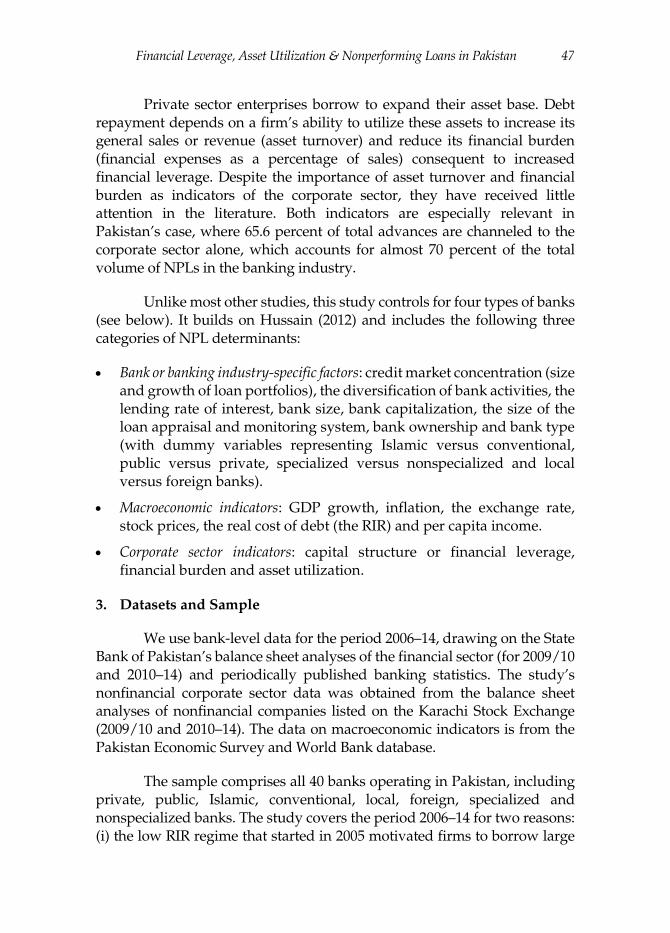
Although the volume of nonperforming loans (NPLs) as a share of gross advances in Pakistan has declined from a peak of 16.2 percent in 2011, this ratio remains higher than the regional and world averages – 12.5 percent in 2014 compared to 7.0 percent for South Asia and 4.5 percent globally (Figures 1 and 2). The State Bank of Pakistan reveals that lending to the corporate sector alone accounts for almost 65.6 percent of gross advances for investment in noncurrent assets, working capital and trade financing. The corporate sector’s contribution to the total volume of NPLs was alarmingly high at almost 70 percent in 2014 (Table 1). More than 94 percent of all bank credit is channeled to urban areas. The share of rural areas has never been more than 6 percent (Table 2).
* Assistant Professor, School of Liberal Arts and Social Sciences, Beaconhouse National University,
Lahore, Pakistan.
Ijaz Hussain 38
Figure 1: NPLs as a percentage of gross advances for selected South
Asian countries and regional aggregates
Source: Author’s calculations based on data from the World Bank.
Figure 2: NPLs as a percentage of gross advances, by bank type
Source: Author’s calculations based on data from the State Bank of Pakistan.
0
2
4
6
8
10
12
14
16
18
2006 2007 2008 2009 2010 2011 2012 2013NP
Ls
(as
% o
f g
ross
ad
van
ces)
Bangladesh India Pakistan
South Asia Sri Lanka World
0
5
10
15
20
25
30
35
40
45
200
6
200
7
200
8
200
9
201
0
201
1
201
2
201
3
Sep
-14
Dec
-14
Jun
-15
Dec
-15
Per
cen
t
Public Private Foreign Specialized All Islamic

Financial Leverage, Asset Utilization & Nonperforming Loans in Pakistan 39
Table 1: Distribution of NPLs, by finance segment, 2014
Gross advances NPLs
Segment PRs billion % Share PRs billion % Share
Corporate 3,060.2 65.6 415.8 69.9
SME 264.5 5.7 89.7 15.1
Agriculture 245.6 5.3 36.4 6.1
Consumer 288.2 6.2 35.8 6.0
Commodity 570.8 12.2 4.6 0.8
Other 145.9 3.1 11.6 2.0
Total 4,661.8 100.0 595.3 100.0
Source: Author’s calculations based on data from the State Bank of Pakistan.
Table 2: Distribution of bank credit, by area and segment, June 2015
Segment Rural Urban Total
Trust 0.6% 99.4% 100.0%
Other 5.0% 95.0% 100.0%
NBFC 0.0% 100.0% 100.0%
Personal 10.8% 89.2% 100.0%
NFPSE 0.0% 100.0% 100.0%
Government 0.0% 100.0% 100.0%
Private sector 5.6% 94.4% 100.0%
Foreign 0.0% 0.0% 0.0%
Total 4.6% 95.4% 100.0%
Note: NBFC = nonbanking financial company, NFPSE = nonfinancial public sector enterprise. Source: Author’s calculations based on data from the State Bank of Pakistan.
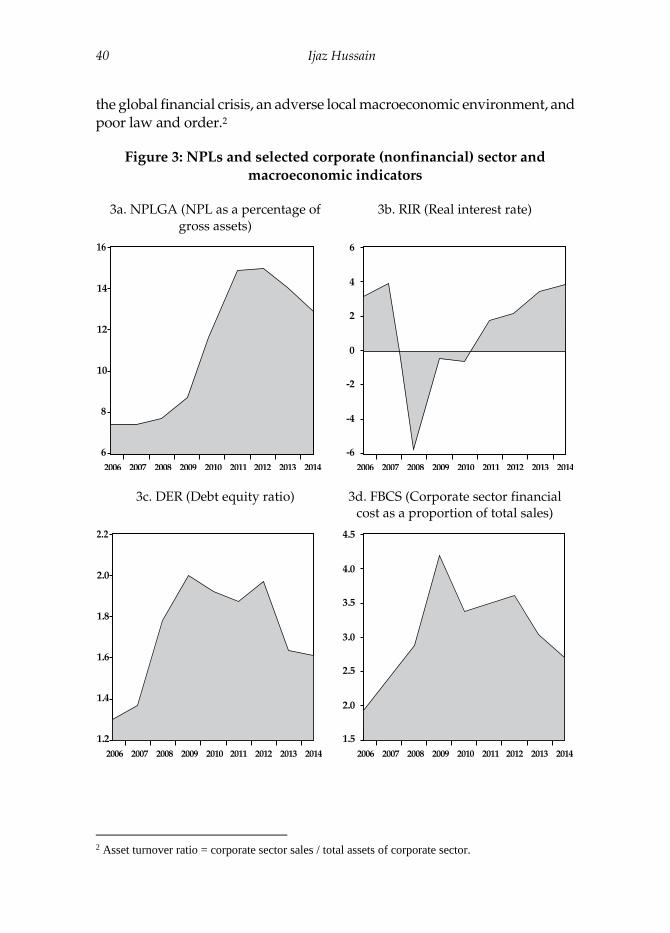
Motivated by the negative or very low real interest rate (RIR), which has never exceeded 4 percent, the nonfinancial corporate sector has borrowed on a large scale, significantly raising its debt–equity ratio (DER) and financial burden during the period 2006–10. This borrowing was used to expand the asset base – primarily noncurrent assets such as machinery and equipment – and to invest in speculative or nonproductive assets such as real estate (see Figure A1 in the Appendix).1
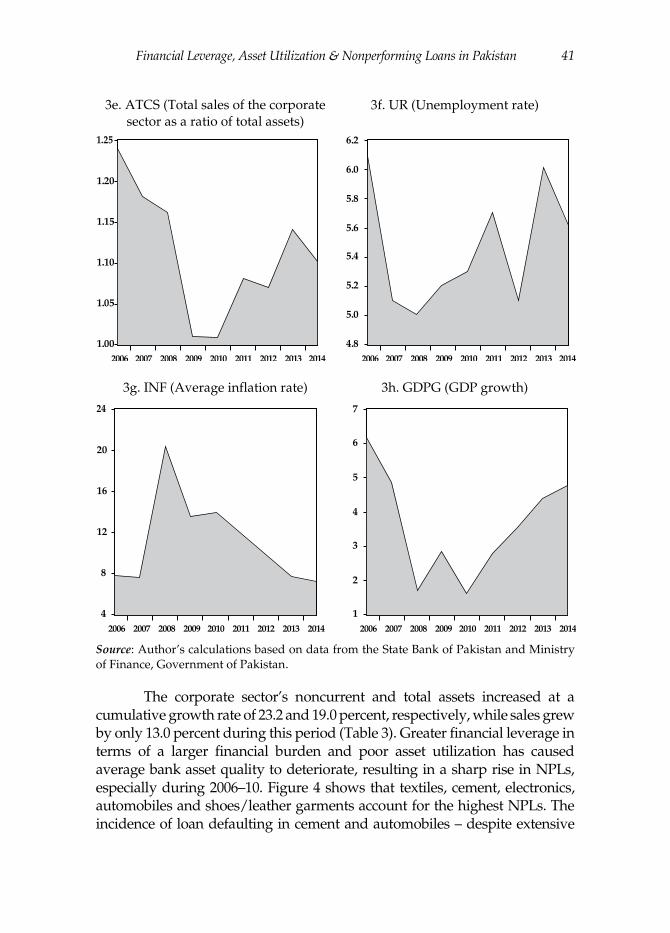
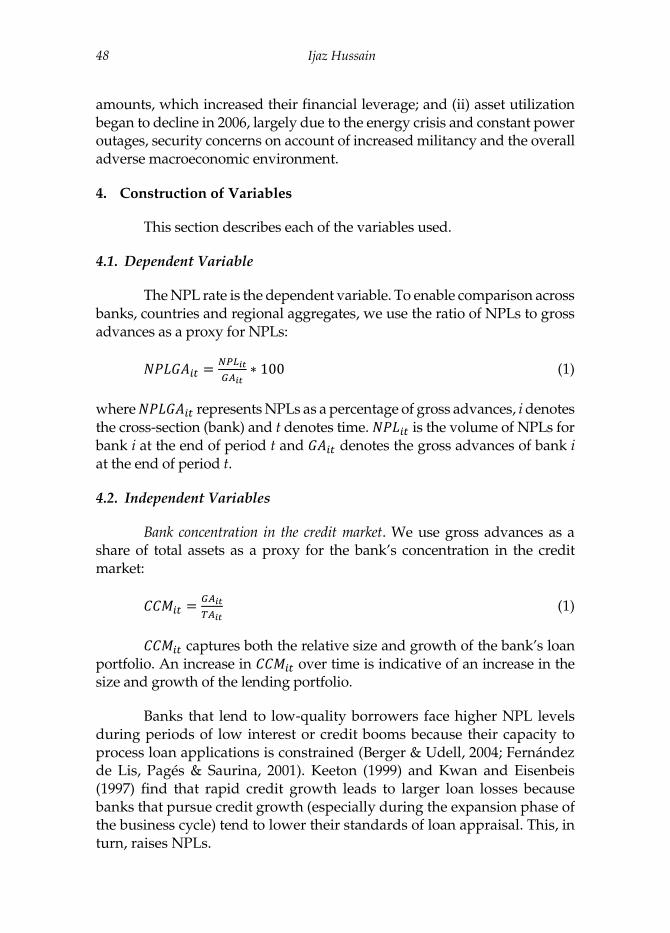
However, several factors have led to a sharp decline in asset turnover (corporate asset utilization), especially during 2006–10 (Figures 3a–h). These include severe energy shortfalls (Pakistan having been unable to expand its capacity to generate enough electricity and gas), expansions in the asset base,
1 There is evidence that some cash-rich companies or groups of companies were even able to develop
housing societies during this period.
Ijaz Hussain 40
the global financial crisis, an adverse local macroeconomic environment, and poor law and order.2
Figure 3: NPLs and selected corporate (nonfinancial) sector and
macroeconomic indicators
3a. NPLGA (NPL as a percentage of gross assets)
3b. RIR (Real interest rate)
3c. DER (Debt equity ratio) 3d. FBCS (Corporate sector financial cost as a proportion of total sales)
2 Asset turnover ratio = corporate sector sales / total assets of corporate sector.
14
12
10
8
6
2006 2007 2008 2009 2010 2011 2012 2013 2014
6
4
2
0
-2
-4
-6
2006 2007 2008 2009 2010 2011 2012 2013 2014
2.0
1.8
1.6
1.4
1.2
2006 2007 2008 2009 2010 2011 2012 2013 2014
4.5
4.0
3.5
3.0
2.5
2.0
1.5
2006 2007 2008 2009 2010 2011 2012 2013 2014
Financial Leverage, Asset Utilization & Nonperforming Loans in Pakistan 41
3e. ATCS (Total sales of the corporate sector as a ratio of total assets)
3f. UR (Unemployment rate)
3g. INF (Average inflation rate) 3h. GDPG (GDP growth)
Source: Author’s calculations based on data from the State Bank of Pakistan and Ministry of Finance, Government of Pakistan.
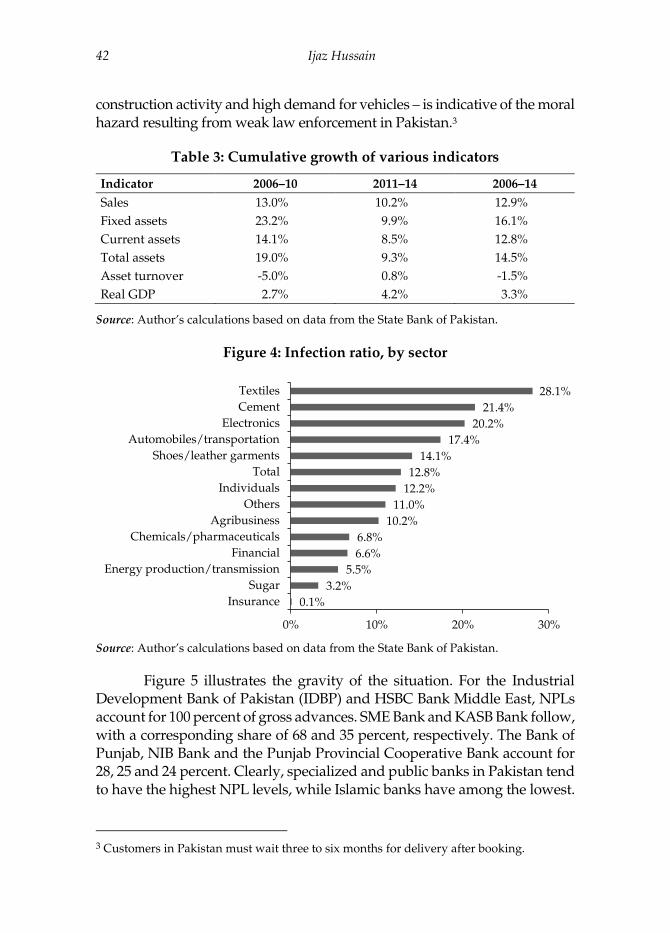
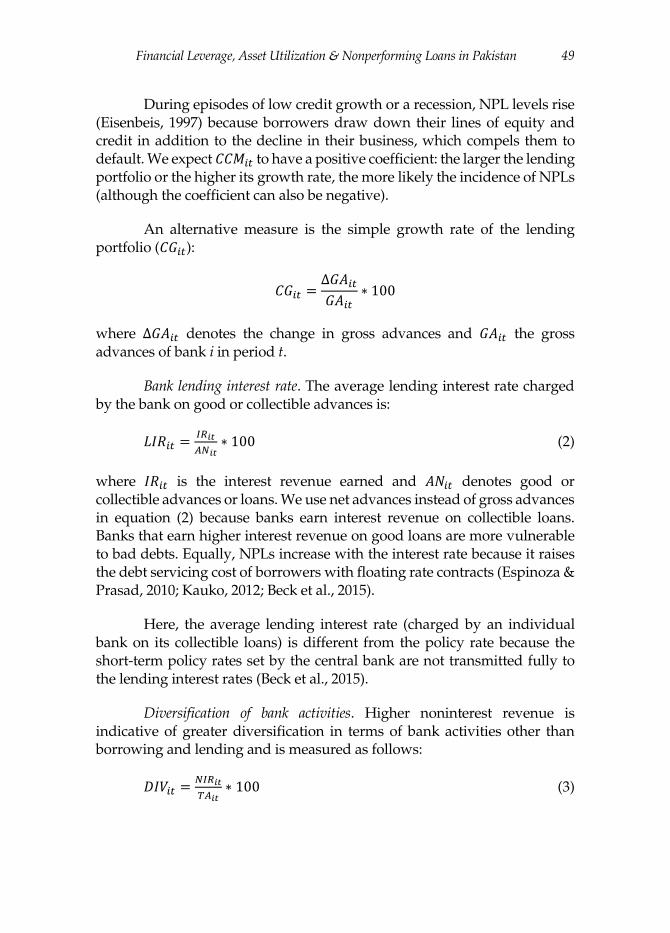
The corporate sector’s noncurrent and total assets increased at a cumulative growth rate of 23.2 and 19.0 percent, respectively, while sales grew by only 13.0 percent during this period (Table 3). Greater financial leverage in terms of a larger financial burden and poor asset utilization has caused average bank asset quality to deteriorate, resulting in a sharp rise in NPLs, especially during 2006–10. Figure 4 shows that textiles, cement, electronics, automobiles and shoes/leather garments account for the highest NPLs. The incidence of loan defaulting in cement and automobiles – despite extensive
1.20
1.15
1.10
1.05
1.00
2006 2007 2008 2009 2010 2011 2012 2013 2014
6.2
5.8
5.6
5.4
5.2
5.0
4.8
2006 2007 2008 2009 2010 2011 2012 2013 2014
6.0
20
16
12
8
4
2006 2007 2008 2009 2010 2011 2012 2013 2014
7
5
4
3
2
1
2006 2007 2008 2009 2010 2011 2012 2013 2014
6
Ijaz Hussain 42
construction activity and high demand for vehicles – is indicative of the moral hazard resulting from weak law enforcement in Pakistan.3
Table 3: Cumulative growth of various indicators
Indicator 2006–10 2011–14 2006–14
Sales 13.0% 10.2% 12.9%
Fixed assets 23.2% 9.9% 16.1%
Current assets 14.1% 8.5% 12.8%
Total assets 19.0% 9.3% 14.5%
Asset turnover -5.0% 0.8% -1.5%
Real GDP 2.7% 4.2% 3.3%
Source: Author’s calculations based on data from the State Bank of Pakistan.
Figure 4: Infection ratio, by sector
Source: Author’s calculations based on data from the State Bank of Pakistan.
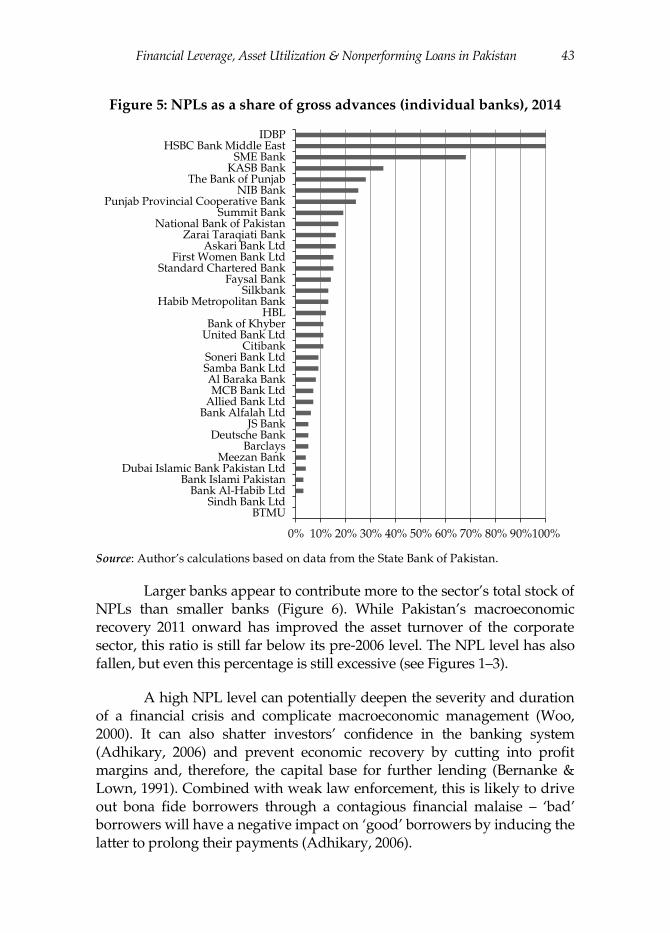
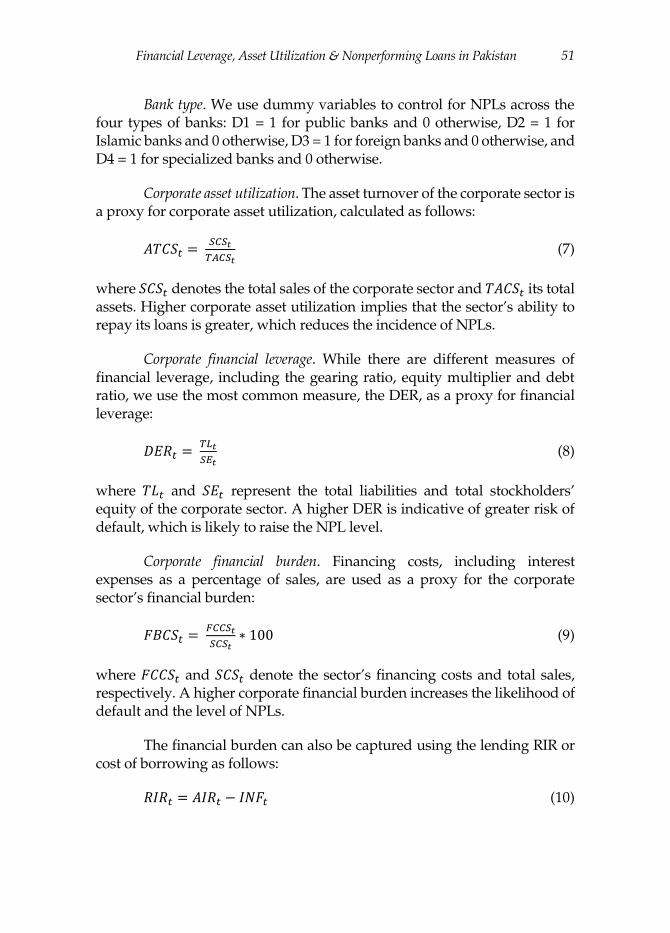
Figure 5 illustrates the gravity of the situation. For the Industrial Development Bank of Pakistan (IDBP) and HSBC Bank Middle East, NPLs account for 100 percent of gross advances. SME Bank and KASB Bank follow, with a corresponding share of 68 and 35 percent, respectively. The Bank of Punjab, NIB Bank and the Punjab Provincial Cooperative Bank account for 28, 25 and 24 percent. Clearly, specialized and public banks in Pakistan tend to have the highest NPL levels, while Islamic banks have among the lowest.
3 Customers in Pakistan must wait three to six months for delivery after booking.
0.1%
3.2%
5.5%
6.6%
6.8%
10.2%
11.0%
12.2%
12.8%
14.1%
17.4%
20.2%
21.4%
28.1%
0% 10% 20% 30%
Insurance
Sugar
Energy production/transmission
Financial
Chemicals/pharmaceuticals
Agribusiness
Others
Individuals
Total
Shoes/leather garments
Automobiles/transportation
Electronics
Cement
Textiles
Financial Leverage, Asset Utilization & Nonperforming Loans in Pakistan 43
Figure 5: NPLs as a share of gross advances (individual banks), 2014
Source: Author’s calculations based on data from the State Bank of Pakistan.
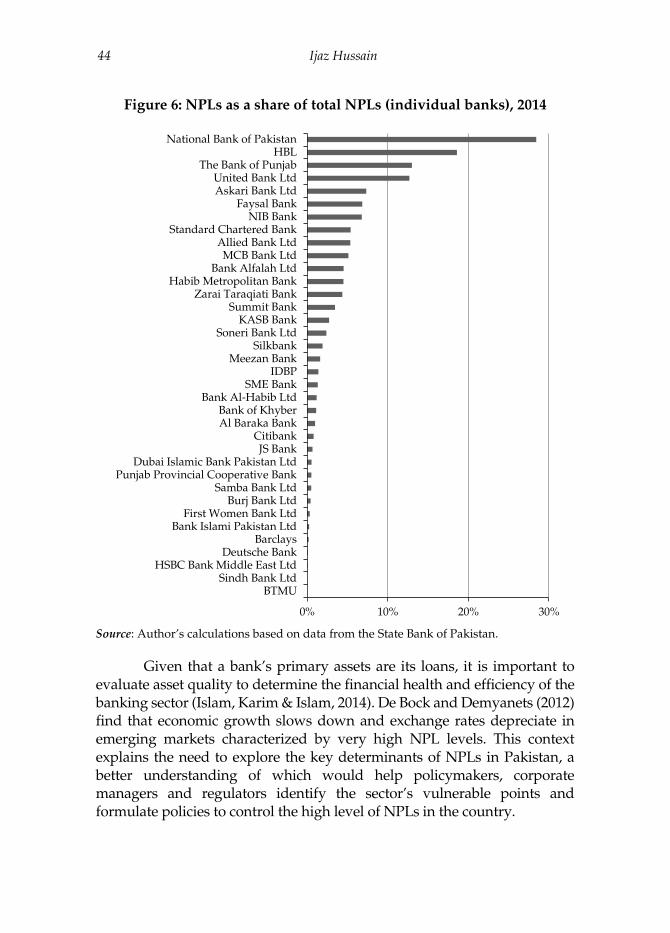
Larger banks appear to contribute more to the sector’s total stock of NPLs than smaller banks (Figure 6). While Pakistan’s macroeconomic recovery 2011 onward has improved the asset turnover of the corporate sector, this ratio is still far below its pre-2006 level. The NPL level has also fallen, but even this percentage is still excessive (see Figures 1–3).
A high NPL level can potentially deepen the severity and duration of a financial crisis and complicate macroeconomic management (Woo, 2000). It can also shatter investors’ confidence in the banking system (Adhikary, 2006) and prevent economic recovery by cutting into profit margins and, therefore, the capital base for further lending (Bernanke & Lown, 1991). Combined with weak law enforcement, this is likely to drive out bona fide borrowers through a contagious financial malaise – ‘bad’ borrowers will have a negative impact on ‘good’ borrowers by inducing the latter to prolong their payments (Adhikary, 2006).
0% 10% 20% 30% 40% 50% 60% 70% 80% 90%100%
BTMUSindh Bank Ltd
Bank Al-Habib LtdBank Islami Pakistan
Dubai Islamic Bank Pakistan LtdMeezan Bank
BarclaysDeutsche Bank
JS BankBank Alfalah Ltd
Allied Bank LtdMCB Bank Ltd
Al Baraka BankSamba Bank LtdSoneri Bank Ltd
CitibankUnited Bank LtdBank of Khyber
HBLHabib Metropolitan Bank
SilkbankFaysal Bank
Standard Chartered BankFirst Women Bank Ltd
Askari Bank LtdZarai Taraqiati Bank
National Bank of PakistanSummit Bank
Punjab Provincial Cooperative BankNIB Bank
The Bank of PunjabKASB Bank
SME BankHSBC Bank Middle East
IDBP
Ijaz Hussain 44
Figure 6: NPLs as a share of total NPLs (individual banks), 2014
Source: Author’s calculations based on data from the State Bank of Pakistan.
Given that a bank’s primary assets are its loans, it is important to evaluate asset quality to determine the financial health and efficiency of the banking sector (Islam, Karim & Islam, 2014). De Bock and Demyanets (2012) find that economic growth slows down and exchange rates depreciate in emerging markets characterized by very high NPL levels. This context explains the need to explore the key determinants of NPLs in Pakistan, a better understanding of which would help policymakers, corporate managers and regulators identify the sector’s vulnerable points and formulate policies to control the high level of NPLs in the country.
0% 10% 20% 30%
BTMUSindh Bank Ltd
HSBC Bank Middle East LtdDeutsche Bank
BarclaysBank Islami Pakistan Ltd
First Women Bank LtdBurj Bank Ltd
Samba Bank LtdPunjab Provincial Cooperative Bank
Dubai Islamic Bank Pakistan LtdJS Bank
CitibankAl Baraka BankBank of Khyber
Bank Al-Habib LtdSME Bank
IDBPMeezan Bank
SilkbankSoneri Bank Ltd
KASB BankSummit Bank
Zarai Taraqiati BankHabib Metropolitan Bank
Bank Alfalah LtdMCB Bank Ltd
Allied Bank LtdStandard Chartered Bank
NIB BankFaysal Bank
Askari Bank LtdUnited Bank Ltd
The Bank of PunjabHBL
National Bank of Pakistan
Financial Leverage, Asset Utilization & Nonperforming Loans in Pakistan 45
In identifying the determinants of NPLs, the literature tends to neglect the role of aggregate corporate sector indicators and the diversification of bank activities. The study seeks to address this gap, using panel least squares and fixed effects (FE) to examine a sample of 40 banks in Pakistan for the period 2006–14. We find that bank-specific variables and corporate sector indicators explain the variation in NPLs better than the state of the macroeconomic environment.
The study’s findings suggest that the concentration of the credit market, the lending rate, the cost of living, stock prices, bank size, public sector ownership, specialized banking, the DER and financial burden have a positive and significant impact on NPLs. Factors that significantly reduce NPLs include the diversification of bank activities, the scale of loan appraisal and monitoring systems, Islamic banking, corporate asset turnover and a favorable macroeconomic environment. Foreign banking and nominal exchange rate movements have an insignificant impact, given that bank lending to foreign borrowers is nil.
The remaining paper is organized as follows. Section 2 provides a comprehensive review of the literature on bank asset quality and its determinants. Sections 3–5 describe the study’s dataset, methodology and research design. Section 6 presents the study’s findings and Section 7 concludes the study with a set of policy implications.
2. A Review of the Literature
Çifter (2015) uses the generalized method of moments and instrumental variable approach to examine the short- and long-run effects of bank concentration on NPLs across 10 Central and Eastern European countries. The study employs a fully modified ordinary least squares (OLS) model and finds that bank concentration has an insignificant impact on NPLs both in the short run and long run. However, the individual fully modified OLS results reveal that bank concentration reduces NPLs in Estonia, Latvia and Slovakia, and increases NPLs in Bulgaria, Croatia, Lithuania, Poland and Slovenia in the long run.
Klein (2013) observes that macroeconomic conditions have greater explanatory power than bank-specific factors, with a strong feedback effect from NPLs to the real economy in Central, Eastern and Southeastern Europe over the period 1998–2011. The study suggests that unemployment, inflation and the exchange rate have a positive and significant effect on NPLs. Among bank-level variables, the capital ratio and returns on equity have a negative
Ijaz Hussain 46
impact, while financial leverage has a positive impact on NPLs. Looking at consumer, business and mortgage loans separately, Louzis, Vouldis and Metaxas (2012) find that NPLs in Greece are determined chiefly by macro-fundamentals (GDP, the unemployment rate and interest rates) and management quality.
In a cross-country study of 75 countries, Beck, Jakubik and Piloiu (2015) identify GDP growth, the exchange rate, the lending interest rate and stock prices as the key macroeconomic determinants of NPLs. GDP growth is indicative of more employment opportunities and boosts economic activity, which in turn directly influences the ability of borrowers to repay their debt, thus reducing the volume of NPLs. Higher stock prices tend to lower housing prices, which reduces the quality of housing loans. Higher lending interest rates raise the cost of borrowing and, therefore, the likelihood of default or NPLs.
Using an FE model for a panel dataset, Khemraj and Pasha (2009) note that the real effective exchange rate, bank size, rapid credit growth and higher interest rates have a positive effect on NPLs. Boudriga, Taktak and Jellouli (2010) conclude that higher bank capitalization and prudent provisioning policy, private ownership, foreign participation and bank concentration reduce the volume of NPLs. Siddiqui, Malik and Shah (2012) find that interest rates are significantly – but not solely – responsible for NPLs in Pakistan. Based on a sample of Spanish banks, Salas and Saurina (2002) find that NPLs are influenced by individual bank-level variables such as bank size, the net interest margin, the capital ratio and market power in addition to real GDP growth. Beck, Demirgüç-Kunt and Merrouche (2013) suggest that Islamic bank stocks perform better than conventional stocks, based on their asset quality and capitalization.
Using bank-level data for a sample of 26 commercial banks over the period 2001–10, Hussain (2012) finds that previous NPLs, credit growth, interest margins, foreign and public sector bank ownership, corporate gearing, currency depreciation and the real cost of debt have a positive and significant impact on the volume of NPLs. Bank size and profitability, industrial growth and profitability, GDP growth and per capita income have a negative impact in this case. Finally, Glen and Mondragón-Vélez (2011) identify real GDP growth, private sector leverage and insufficient capitalization within the banking system as the key determinants of loan loss provision in 22 developing economies during 1996–2008.
Financial Leverage, Asset Utilization & Nonperforming Loans in Pakistan 47
Private sector enterprises borrow to expand their asset base. Debt repayment depends on a firm’s ability to utilize these assets to increase its general sales or revenue (asset turnover) and reduce its financial burden (financial expenses as a percentage of sales) consequent to increased financial leverage. Despite the importance of asset turnover and financial burden as indicators of the corporate sector, they have received little attention in the literature. Both indicators are especially relevant in Pakistan’s case, where 65.6 percent of total advances are channeled to the corporate sector alone, which accounts for almost 70 percent of the total volume of NPLs in the banking industry.
Unlike most other studies, this study controls for four types of banks (see below). It builds on Hussain (2012) and includes the following three categories of NPL determinants:
Bank or banking industry-specific factors: credit market concentration (size and growth of loan portfolios), the diversification of bank activities, the lending rate of interest, bank size, bank capitalization, the size of the loan appraisal and monitoring system, bank ownership and bank type (with dummy variables representing Islamic versus conventional, public versus private, specialized versus nonspecialized and local versus foreign banks).
Macroeconomic indicators: GDP growth, inflation, the exchange rate, stock prices, the real cost of debt (the RIR) and per capita income.
Corporate sector indicators: capital structure or financial leverage, financial burden and asset utilization.
3. Datasets and Sample
We use bank-level data for the period 2006–14, drawing on the State Bank of Pakistan’s balance sheet analyses of the financial sector (for 2009/10 and 2010–14) and periodically published banking statistics. The study’s nonfinancial corporate sector data was obtained from the balance sheet analyses of nonfinancial companies listed on the Karachi Stock Exchange (2009/10 and 2010–14). The data on macroeconomic indicators is from the Pakistan Economic Survey and World Bank database.
The sample comprises all 40 banks operating in Pakistan, including private, public, Islamic, conventional, local, foreign, specialized and nonspecialized banks. The study covers the period 2006–14 for two reasons: (i) the low RIR regime that started in 2005 motivated firms to borrow large
Ijaz Hussain 48
amounts, which increased their financial leverage; and (ii) asset utilization began to decline in 2006, largely due to the energy crisis and constant power outages, security concerns on account of increased militancy and the overall adverse macroeconomic environment.
4. Construction of Variables
This section describes each of the variables used.
4.1. Dependent Variable
The NPL rate is the dependent variable. To enable comparison across banks, countries and regional aggregates, we use the ratio of NPLs to gross advances as a proxy for NPLs:
𝑁𝑃𝐿𝐺𝐴𝑖𝑡 =𝑁𝑃𝐿𝑖𝑡
𝐺𝐴𝑖𝑡∗ 100 (1)
where 𝑁𝑃𝐿𝐺𝐴𝑖𝑡 represents NPLs as a percentage of gross advances, i denotes the cross-section (bank) and t denotes time. 𝑁𝑃𝐿𝑖𝑡 is the volume of NPLs for bank i at the end of period t and 𝐺𝐴𝑖𝑡 denotes the gross advances of bank i at the end of period t.
4.2. Independent Variables
Bank concentration in the credit market. We use gross advances as a share of total assets as a proxy for the bank’s concentration in the credit market:
𝐶𝐶𝑀𝑖𝑡 =𝐺𝐴𝑖𝑡
𝑇𝐴𝑖𝑡 (1)
𝐶𝐶𝑀𝑖𝑡 captures both the relative size and growth of the bank’s loan portfolio. An increase in 𝐶𝐶𝑀𝑖𝑡 over time is indicative of an increase in the size and growth of the lending portfolio.
Banks that lend to low-quality borrowers face higher NPL levels during periods of low interest or credit booms because their capacity to process loan applications is constrained (Berger & Udell, 2004; Fernández de Lis, Pagés & Saurina, 2001). Keeton (1999) and Kwan and Eisenbeis (1997) find that rapid credit growth leads to larger loan losses because banks that pursue credit growth (especially during the expansion phase of the business cycle) tend to lower their standards of loan appraisal. This, in turn, raises NPLs.
Financial Leverage, Asset Utilization & Nonperforming Loans in Pakistan 49
During episodes of low credit growth or a recession, NPL levels rise (Eisenbeis, 1997) because borrowers draw down their lines of equity and credit in addition to the decline in their business, which compels them to default. We expect 𝐶𝐶𝑀𝑖𝑡 to have a positive coefficient: the larger the lending portfolio or the higher its growth rate, the more likely the incidence of NPLs (although the coefficient can also be negative).
An alternative measure is the simple growth rate of the lending portfolio (𝐶𝐺𝑖𝑡):
𝐶𝐺𝑖𝑡 =∆𝐺𝐴𝑖𝑡
𝐺𝐴𝑖𝑡∗ 100
where ∆𝐺𝐴𝑖𝑡 denotes the change in gross advances and 𝐺𝐴𝑖𝑡 the gross advances of bank i in period t.
Bank lending interest rate. The average lending interest rate charged by the bank on good or collectible advances is:
𝐿𝐼𝑅𝑖𝑡 =𝐼𝑅𝑖𝑡
𝐴𝑁𝑖𝑡∗ 100 (2)
where 𝐼𝑅𝑖𝑡 is the interest revenue earned and 𝐴𝑁𝑖𝑡 denotes good or collectible advances or loans. We use net advances instead of gross advances in equation (2) because banks earn interest revenue on collectible loans. Banks that earn higher interest revenue on good loans are more vulnerable to bad debts. Equally, NPLs increase with the interest rate because it raises the debt servicing cost of borrowers with floating rate contracts (Espinoza & Prasad, 2010; Kauko, 2012; Beck et al., 2015).
Here, the average lending interest rate (charged by an individual bank on its collectible loans) is different from the policy rate because the short-term policy rates set by the central bank are not transmitted fully to the lending interest rates (Beck et al., 2015).
Diversification of bank activities. Higher noninterest revenue is indicative of greater diversification in terms of bank activities other than borrowing and lending and is measured as follows:
𝐷𝐼𝑉𝑖𝑡 =𝑁𝐼𝑅𝑖𝑡
𝑇𝐴𝑖𝑡∗ 100 (3)

Ijaz Hussain 50
where 𝑁𝐼𝑅𝑖𝑡 represents the bank’s noninterest revenue and 𝑇𝐴𝑖𝑡 its total assets. Greater diversification is likely to reduce the level of NPLs, but is rarely included as a determinant in the literature.
Size of loan appraisal and monitoring system. While administrative expenses are often used as a proxy for cost efficiency (see Berger & DeYoung, 1997; Podpiera & Weill, 2008), this study broadens the indicator by looking at the level and growth of a bank’s administrative expenses to measure the size of its loan appraisal and monitoring system:
𝑆𝐴𝑀𝑆𝑖𝑡 = log(𝐴𝐸𝑖𝑡) (4)
A larger loan appraisal and monitoring system is indicative of the bank’s capacity for appraising and monitoring loan applications and is, therefore, likely to reduce the level of NPLs.
Bank capitalization. Bank capitalization is the ratio of stockholders‘ equity to the bank’s total assets:
𝐶𝑅𝑖𝑡 = 𝑆𝐸𝑖𝑡
𝑇𝐴𝑖𝑡 (5)
where 𝑆𝐸𝑖𝑡 denotes shareholders’ equity and 𝑇𝐴𝑖𝑡 the bank’s total assets. Higher bank capitalization reduces NPLs as financially strong banks are less likely to invest in risky projects (Boudriga et al., 2010; Louzis et al., 2012; Klein, 2013).
Bank size. Bank size is measured as a bank’s total assets in proportion to the banking industry’s total assets:
𝐵𝑆𝑖𝑡 =𝑇𝐴𝑖𝑡
∑ 𝑇𝐴𝑖𝑡𝑛𝑖=1
∗ 100 (6)
where 𝑇𝐴𝑖𝑡 represents the total assets of bank i in period t while ∑ 𝑇𝐴𝑖𝑡𝑛𝑖=1 is
the sum of total assets owned by n banks in period t.
Bank size is also indicative of a bank’s market power, which may be associated with higher NPLs: larger banks are more likely to be interested in cornering a larger share of the market by investing in risky projects with a higher incidence of NPLs (Khemraj & Pasha, 2009). That said, larger banks are also likely to have better loan appraisal and monitoring systems in place, which would reduce their NPLs (Louzis et al., 2012; Salas & Saurina, 2002).
Financial Leverage, Asset Utilization & Nonperforming Loans in Pakistan 51
Bank type. We use dummy variables to control for NPLs across the four types of banks: D1 = 1 for public banks and 0 otherwise, D2 = 1 for Islamic banks and 0 otherwise, D3 = 1 for foreign banks and 0 otherwise, and D4 = 1 for specialized banks and 0 otherwise.
Corporate asset utilization. The asset turnover of the corporate sector is a proxy for corporate asset utilization, calculated as follows:
𝐴𝑇𝐶𝑆𝑡 = 𝑆𝐶𝑆𝑡
𝑇𝐴𝐶𝑆𝑡 (7)
where 𝑆𝐶𝑆𝑡 denotes the total sales of the corporate sector and 𝑇𝐴𝐶𝑆𝑡 its total assets. Higher corporate asset utilization implies that the sector’s ability to repay its loans is greater, which reduces the incidence of NPLs.
Corporate financial leverage. While there are different measures of financial leverage, including the gearing ratio, equity multiplier and debt ratio, we use the most common measure, the DER, as a proxy for financial leverage:
𝐷𝐸𝑅𝑡 = 𝑇𝐿𝑡
𝑆𝐸𝑡 (8)
where 𝑇𝐿𝑡 and 𝑆𝐸𝑡 represent the total liabilities and total stockholders’ equity of the corporate sector. A higher DER is indicative of greater risk of default, which is likely to raise the NPL level.
Corporate financial burden. Financing costs, including interest expenses as a percentage of sales, are used as a proxy for the corporate sector’s financial burden:
𝐹𝐵𝐶𝑆𝑡 = 𝐹𝐶𝐶𝑆𝑡
𝑆𝐶𝑆𝑡∗ 100 (9)
where 𝐹𝐶𝐶𝑆𝑡 and 𝑆𝐶𝑆𝑡 denote the sector’s financing costs and total sales, respectively. A higher corporate financial burden increases the likelihood of default and the level of NPLs.
The financial burden can also be captured using the lending RIR or cost of borrowing as follows:
𝑅𝐼𝑅𝑡 = 𝐴𝐼𝑅𝑡 − 𝐼𝑁𝐹𝑡 (10)

Ijaz Hussain 52
where 𝐴𝐼𝑅𝑡 and 𝐼𝑁𝐹𝑡 are the average lending interest rate and inflation rate, respectively. A higher RIR (the real cost of debt servicing) is likely to raise the probability of default and the NPL level.
Inflation. We use the consumer price index as a measure of inflation, which affects the ability of both individuals and institutions to repay their debts. Borrowers tend to benefit from a fixed rather than varying inflation rate, which implies that higher inflation can increase the NPL level (Klein, 2013). However, it may also improve loan repayment by making loans cheaper to repay (Anastasiou, Lourie & Tsionas, 2016), thus reducing the level of NPLs.
Macroeconomic environment. Real GDP growth, measured by log (𝑅𝐺𝐷𝑃𝑡), and per capita income (𝑃𝐶𝐼𝑡) are tested separately in alternative specifications to capture the effect of the macroeconomic environment on NPLs. The unemployment rate can also be used for this purpose (see Klein, 2013). An adverse macroeconomic environment is likely to raise NPLs and vice versa (Klein, 2013; Messai & Jouini, 2013; Beck et al., 2015; Anastasiou et al., 2016).
Nominal exchange rate. Movements in the nominal exchange rate 𝑁𝐸𝑅𝑡 capture the impact of global changes on NPLs. Depending on a country’s foreign assets and liabilities, the nominal exchange rate can affect NPLs either positively or negatively (Klein, 2013; Beck et al., 2015). Exchange rates can also influence NPLs through trade finance (Beck et al., 2015).
Stock prices. The KSE-100 index (𝐾𝑆𝐸𝐻𝑡) is used to measure stock price movements. Since stock prices are correlated with housing (and other asset) prices, they have an indirect impact on the value of collateral and, therefore, on the quality of loans (Beck et al., 2015).
Proportion of lending to the textiles sector. We control for the impact of the largest share of lending by using the percentage of bank lending to the textiles sector (𝐿𝑃𝑇𝑆𝑡). This is likely to have a positive effect on potential defaults, given the sector’s political influence.
Global financial crisis. The impact of the global financial crisis on NPLs is captured by a dummy variable (D5), where D5 = 1 for 2009 and 0 otherwise.
Share of bank lending to the corporate sector. We control for the impact of the share of bank lending to the corporate sector by introducing a dummy
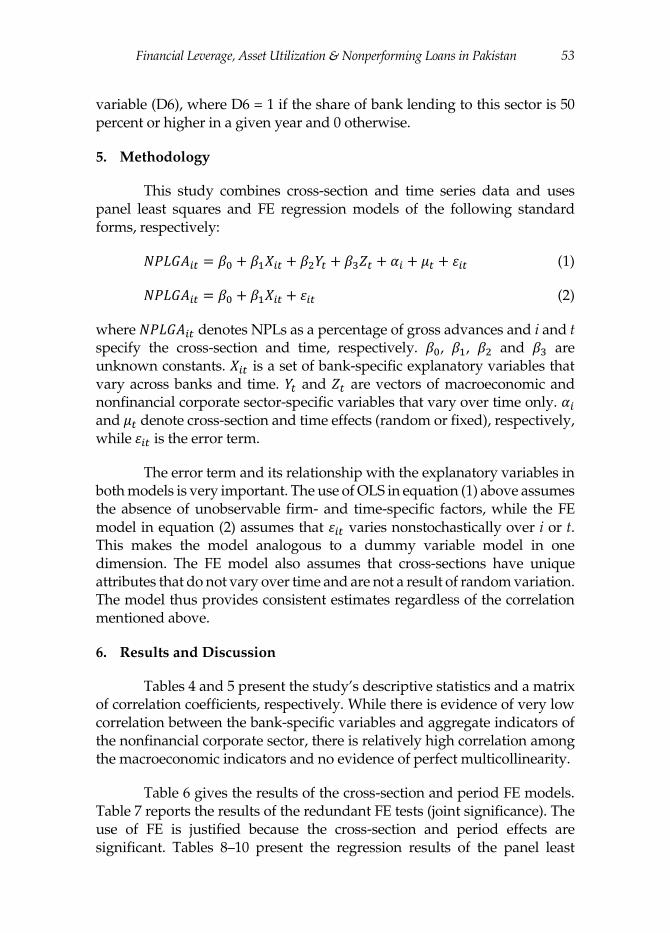
Financial Leverage, Asset Utilization & Nonperforming Loans in Pakistan 53
variable (D6), where D6 = 1 if the share of bank lending to this sector is 50 percent or higher in a given year and 0 otherwise.
5. Methodology
This study combines cross-section and time series data and uses panel least squares and FE regression models of the following standard forms, respectively:
𝑁𝑃𝐿𝐺𝐴𝑖𝑡 = 𝛽0 + 𝛽1𝑋𝑖𝑡 + 𝛽2𝑌𝑡 + 𝛽3𝑍𝑡 + 𝛼𝑖 + 𝜇𝑡 + 𝜀𝑖𝑡 (1)
𝑁𝑃𝐿𝐺𝐴𝑖𝑡 = 𝛽0 + 𝛽1𝑋𝑖𝑡 + 𝜀𝑖𝑡 (2)
where 𝑁𝑃𝐿𝐺𝐴𝑖𝑡 denotes NPLs as a percentage of gross advances and i and t specify the cross-section and time, respectively. 𝛽0, 𝛽1, 𝛽2 and 𝛽3 are unknown constants. 𝑋𝑖𝑡 is a set of bank-specific explanatory variables that vary across banks and time. 𝑌𝑡 and 𝑍𝑡 are vectors of macroeconomic and nonfinancial corporate sector-specific variables that vary over time only. 𝛼𝑖 and 𝜇𝑡 denote cross-section and time effects (random or fixed), respectively, while 𝜀𝑖𝑡 is the error term.
The error term and its relationship with the explanatory variables in both models is very important. The use of OLS in equation (1) above assumes the absence of unobservable firm- and time-specific factors, while the FE model in equation (2) assumes that 𝜀𝑖𝑡 varies nonstochastically over i or t. This makes the model analogous to a dummy variable model in one dimension. The FE model also assumes that cross-sections have unique attributes that do not vary over time and are not a result of random variation. The model thus provides consistent estimates regardless of the correlation mentioned above.
6. Results and Discussion
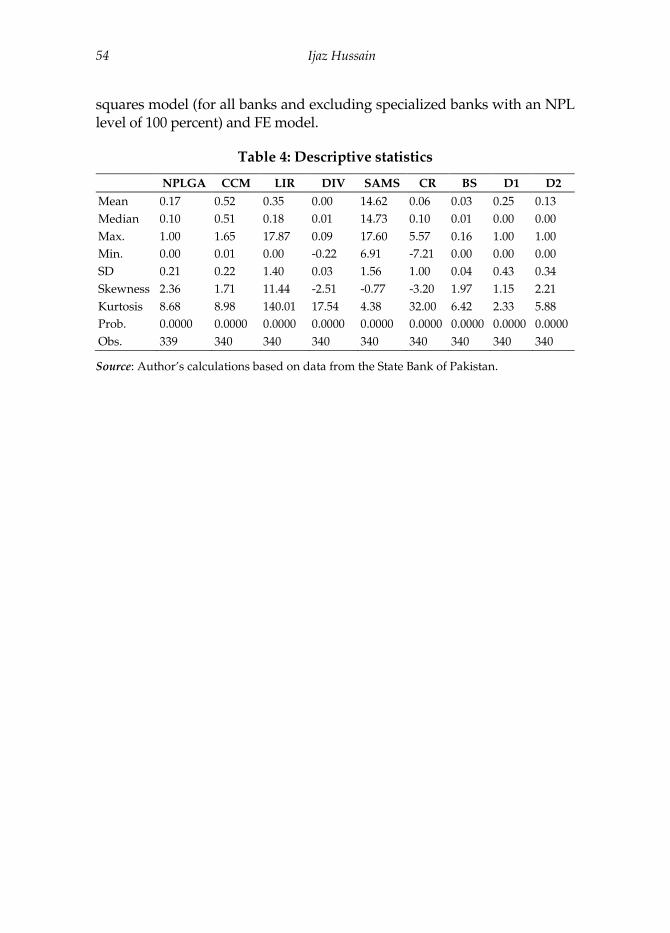
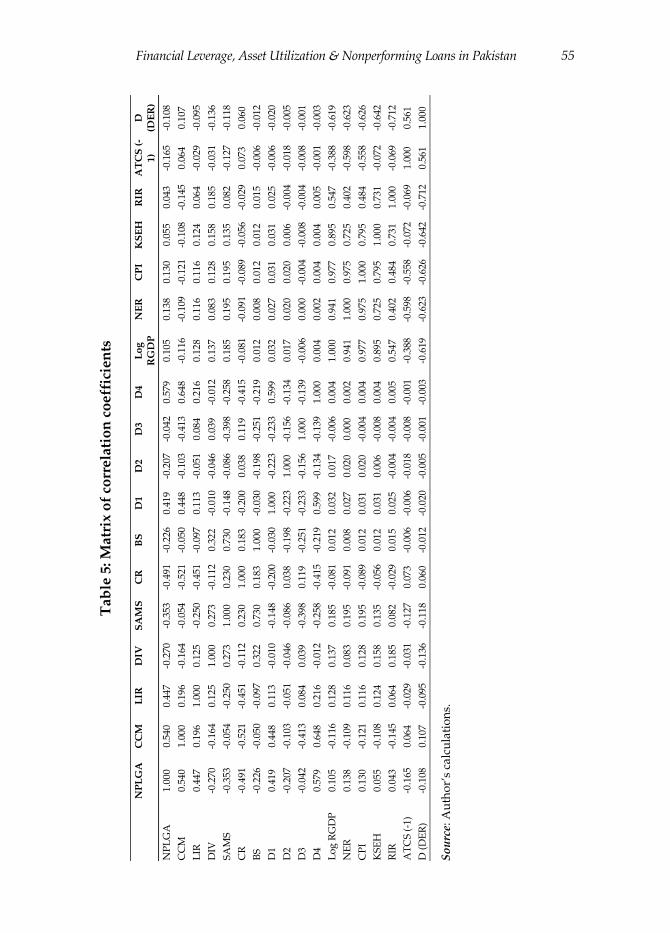
Tables 4 and 5 present the study’s descriptive statistics and a matrix of correlation coefficients, respectively. While there is evidence of very low correlation between the bank-specific variables and aggregate indicators of the nonfinancial corporate sector, there is relatively high correlation among the macroeconomic indicators and no evidence of perfect multicollinearity.
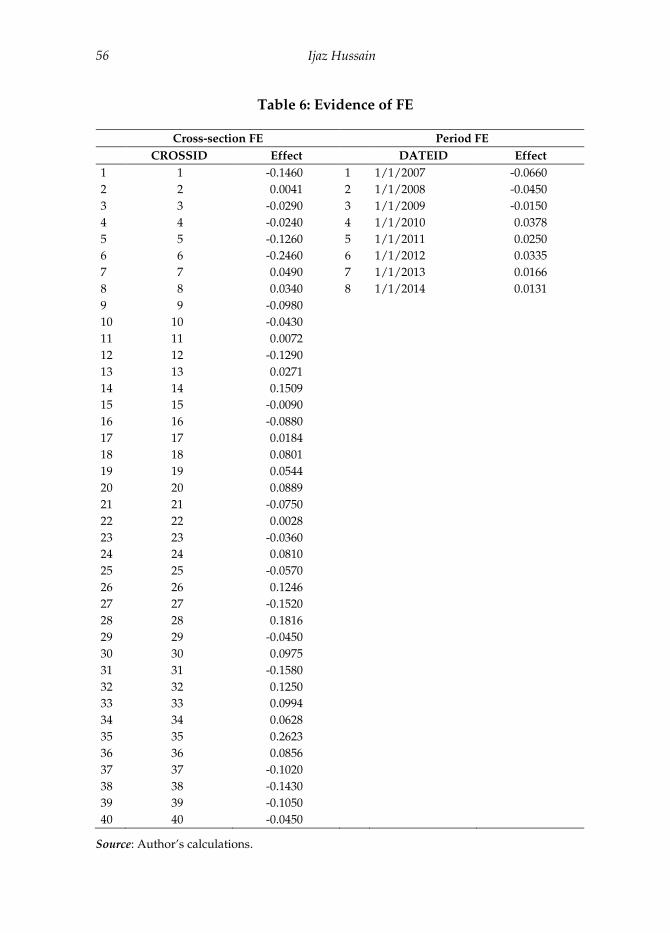
Table 6 gives the results of the cross-section and period FE models. Table 7 reports the results of the redundant FE tests (joint significance). The use of FE is justified because the cross-section and period effects are significant. Tables 8–10 present the regression results of the panel least
Ijaz Hussain 54
squares model (for all banks and excluding specialized banks with an NPL level of 100 percent) and FE model.
Table 4: Descriptive statistics
NPLGA CCM LIR DIV SAMS CR BS D1 D2
Mean 0.17 0.52 0.35 0.00 14.62 0.06 0.03 0.25 0.13
Median 0.10 0.51 0.18 0.01 14.73 0.10 0.01 0.00 0.00
Max. 1.00 1.65 17.87 0.09 17.60 5.57 0.16 1.00 1.00
Min. 0.00 0.01 0.00 -0.22 6.91 -7.21 0.00 0.00 0.00
SD 0.21 0.22 1.40 0.03 1.56 1.00 0.04 0.43 0.34
Skewness 2.36 1.71 11.44 -2.51 -0.77 -3.20 1.97 1.15 2.21
Kurtosis 8.68 8.98 140.01 17.54 4.38 32.00 6.42 2.33 5.88
Prob. 0.0000 0.0000 0.0000 0.0000 0.0000 0.0000 0.0000 0.0000 0.0000
Obs. 339 340 340 340 340 340 340 340 340
Source: Author’s calculations based on data from the State Bank of Pakistan.
Financial Leverage, Asset Utilization & Nonperforming Loans in Pakistan 55
Ta
ble
5:
Matr
ix o
f co
rrela
tio
n c
oeff
icie
nts
N
PL
GA
C
CM
L
IR
DIV
S
AM
S
CR
B
S
D1
D2
D3
D4
Lo
g
RG
DP
N
ER
C
PI
KS
EH
R
IR
AT
CS
(-
1)
D
(DE
R)
NP
LG
A
1.0
00
0.5
40
0.4
47
-0.2
70
-0.3
53
-0.4
91
-0.2
26
0.4
19
-0.2
07
-0.0
42
0.5
79
0.1
05
0.1
38
0.1
30
0.0
55
0.0
43
-0.1
65
-0.1
08
CC
M
0.5
40
1.0
00
0.1
96
-0.1
64
-0.0
54
-0.5
21
-0.0
50
0.4
48
-0.1
03
-0.4
13
0.6
48
-0.1
16
-0.1
09
-0.1
21
-0.1
08
-0.1
45
0.0
64
0.1
07
LIR
0
.44
7 0
.19
6 1
.00
0 0
.12
5 -0
.250
-0
.451
-0
.097
0
.11
3 -0
.051
0
.08
4 0
.21
6 0
.12
8 0
.11
6 0
.11
6 0
.12
4 0
.06
4 -0
.029
-0
.095
DIV
-0
.270
-0
.164
0
.12
5 1
.00
0 0
.27
3 -0
.112
0
.32
2 -0
.010
-0
.046
0
.03
9 -0
.012
0
.13
7 0
.08
3 0
.12
8 0
.15
8 0
.18
5 -0
.031
-0
.136
SA
MS
-0
.353
-0
.054
-0
.250
0
.27
3 1
.00
0 0
.23
0 0
.73
0 -0
.148
-0
.086
-0
.398
-0
.258
0
.18
5 0
.19
5 0
.19
5 0
.13
5 0
.08
2 -0
.127
-0
.118
CR
-0
.491
-0
.521
-0
.451
-0
.112
0
.23
0 1
.00
0 0
.18
3 -0
.200
0
.03
8 0
.11
9 -0
.415
-0
.081
-0
.091
-0
.089
-0
.056
-0
.029
0
.07
3 0
.06
0
BS
-0
.226
-0
.050
-0
.097
0
.32
2 0
.73
0 0
.18
3 1
.00
0 -0
.030
-0
.198
-0
.251
-0
.219
0
.01
2 0
.00
8 0
.01
2 0
.01
2 0
.01
5 -0
.006
-0
.012
D1
0.4
19
0.4
48
0.1
13
-0.0
10
-0.1
48
-0.2
00
-0.0
30
1.0
00
-0.2
23
-0.2
33
0.5
99
0.0
32
0.0
27
0.0
31
0.0
31
0.0
25
-0.0
06
-0.0
20
D2
-0.2
07
-0.1
03
-0.0
51
-0.0
46
-0.0
86
0.0
38
-0.1
98
-0.2
23
1.0
00
-0.1
56
-0.1
34
0.0
17
0.0
20
0.0
20
0.0
06
-0.0
04
-0.0
18
-0.0
05
D3
-0.0
42
-0.4
13
0.0
84
0.0
39
-0.3
98
0.1
19
-0.2
51
-0.2
33
-0.1
56
1.0
00
-0.1
39
-0.0
06
0.0
00
-0.0
04
-0.0
08
-0.0
04
-0.0
08
-0.0
01
D4
0.5
79
0.6
48
0.2
16
-0.0
12
-0.2
58
-0.4
15
-0.2
19
0.5
99
-0.1
34
-0.1
39
1.0
00
0.0
04
0.0
02
0.0
04
0.0
04
0.0
05
-0.0
01
-0.0
03
Lo
g R
GD
P
0.1
05
-0.1
16
0.1
28
0.1
37
0.1
85
-0.0
81
0.0
12
0.0
32
0.0
17
-0.0
06
0.0
04
1.0
00
0.9
41
0.9
77
0.8
95
0.5
47
-0.3
88
-0.6
19
NE
R
0.1
38
-0.1
09
0.1
16
0.0
83
0.1
95
-0.0
91
0.0
08
0.0
27
0.0
20
0.0
00
0.0
02
0.9
41
1.0
00
0.9
75
0.7
25
0.4
02
-0.5
98
-0.6
23
CP
I 0
.13
0 -0
.121
0
.11
6 0
.12
8 0
.19
5 -0
.089
0
.01
2 0
.03
1 0
.02
0 -0
.004
0
.00
4 0
.97
7 0
.97
5 1
.00
0 0
.79
5 0
.48
4 -0
.558
-0
.626
KS
EH
0
.05
5 -0
.108
0
.12
4 0
.15
8 0
.13
5 -0
.056
0
.01
2 0
.03
1 0
.00
6 -0
.008
0
.00
4 0
.89
5 0
.72
5 0
.79
5 1
.00
0 0
.73
1 -0
.072
-0
.642
RIR
0
.04
3 -0
.145
0
.06
4 0
.18
5 0
.08
2 -0
.029
0
.01
5 0
.02
5 -0
.004
-0
.004
0
.00
5 0
.54
7 0
.40
2 0
.48
4 0
.73
1 1
.00
0 -0
.069
-0
.712
AT
CS
(-1
) -0
.165
0
.06
4 -0
.029
-0
.031
-0
.127
0
.07
3 -0
.006
-0
.006
-0
.018
-0
.008
-0
.001
-0
.388
-0
.598
-0
.558
-0
.072
-0
.069
1
.00
0 0
.56
1
D (
DE
R)
-0.1
08
0.1
07
-0.0
95
-0.1
36
-0.1
18
0.0
60
-0.0
12
-0.0
20
-0.0
05
-0.0
01
-0.0
03
-0.6
19
-0.6
23
-0.6
26
-0.6
42
-0.7
12
0.5
61
1.0
00
So
urc
e: A
uth
or’
s ca
lcu
lati
on
s.
Ijaz Hussain 56
Table 6: Evidence of FE
Cross-section FE Period FE CROSSID Effect DATEID Effect
1 1 -0.1460 1 1/1/2007 -0.0660
2 2 0.0041 2 1/1/2008 -0.0450
3 3 -0.0290 3 1/1/2009 -0.0150
4 4 -0.0240 4 1/1/2010 0.0378
5 5 -0.1260 5 1/1/2011 0.0250
6 6 -0.2460 6 1/1/2012 0.0335
7 7 0.0490 7 1/1/2013 0.0166
8 8 0.0340 8 1/1/2014 0.0131
9 9 -0.0980
10 10 -0.0430
11 11 0.0072
12 12 -0.1290
13 13 0.0271
14 14 0.1509
15 15 -0.0090
16 16 -0.0880
17 17 0.0184
18 18 0.0801
19 19 0.0544
20 20 0.0889
21 21 -0.0750
22 22 0.0028
23 23 -0.0360
24 24 0.0810
25 25 -0.0570
26 26 0.1246
27 27 -0.1520
28 28 0.1816
29 29 -0.0450
30 30 0.0975
31 31 -0.1580
32 32 0.1250
33 33 0.0994
34 34 0.0628
35 35 0.2623
36 36 0.0856
37 37 -0.1020
38 38 -0.1430
39 39 -0.1050
40 40 -0.0450
Source: Author’s calculations.
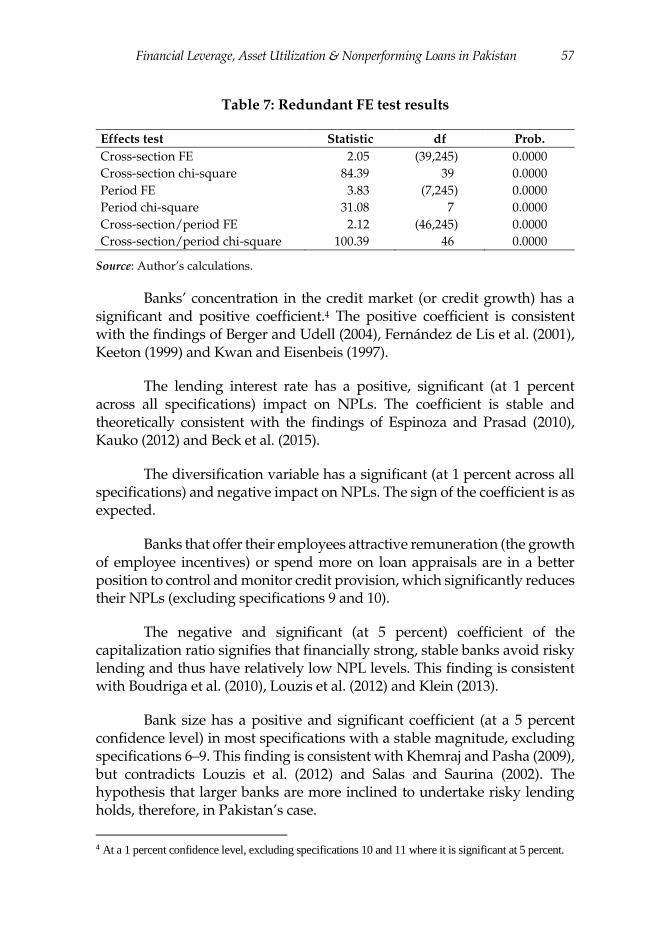
Financial Leverage, Asset Utilization & Nonperforming Loans in Pakistan 57
Table 7: Redundant FE test results
Effects test Statistic df Prob.
Cross-section FE 2.05 (39,245) 0.0000
Cross-section chi-square 84.39 39 0.0000
Period FE 3.83 (7,245) 0.0000
Period chi-square 31.08 7 0.0000
Cross-section/period FE 2.12 (46,245) 0.0000
Cross-section/period chi-square 100.39 46 0.0000
Source: Author’s calculations.
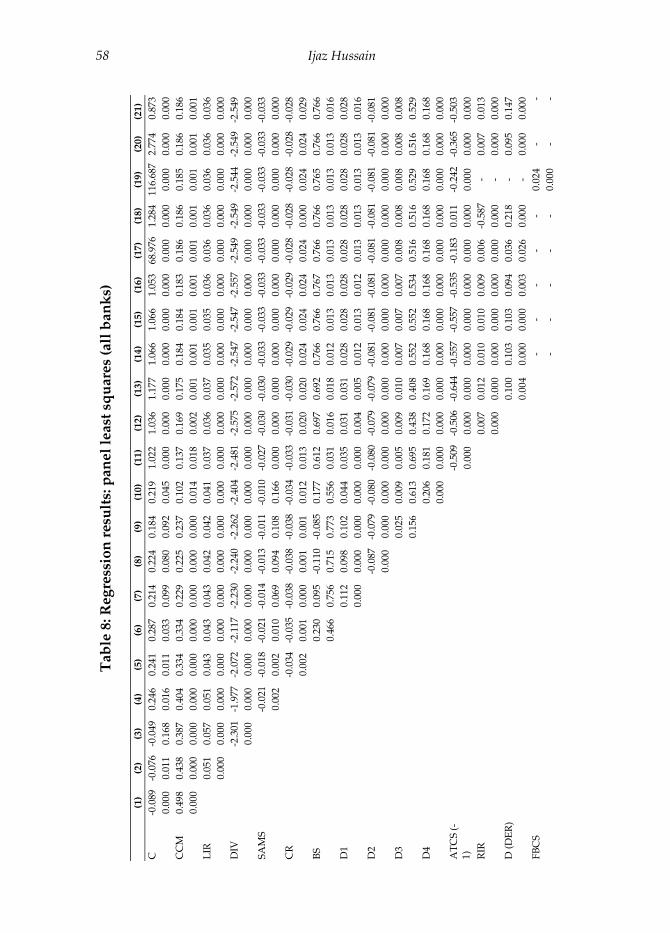
Banks’ concentration in the credit market (or credit growth) has a significant and positive coefficient.4 The positive coefficient is consistent with the findings of Berger and Udell (2004), Fernández de Lis et al. (2001), Keeton (1999) and Kwan and Eisenbeis (1997).
The lending interest rate has a positive, significant (at 1 percent across all specifications) impact on NPLs. The coefficient is stable and theoretically consistent with the findings of Espinoza and Prasad (2010), Kauko (2012) and Beck et al. (2015).
The diversification variable has a significant (at 1 percent across all specifications) and negative impact on NPLs. The sign of the coefficient is as expected.
Banks that offer their employees attractive remuneration (the growth of employee incentives) or spend more on loan appraisals are in a better position to control and monitor credit provision, which significantly reduces their NPLs (excluding specifications 9 and 10).
The negative and significant (at 5 percent) coefficient of the capitalization ratio signifies that financially strong, stable banks avoid risky lending and thus have relatively low NPL levels. This finding is consistent with Boudriga et al. (2010), Louzis et al. (2012) and Klein (2013).
Bank size has a positive and significant coefficient (at a 5 percent confidence level) in most specifications with a stable magnitude, excluding specifications 6–9. This finding is consistent with Khemraj and Pasha (2009), but contradicts Louzis et al. (2012) and Salas and Saurina (2002). The hypothesis that larger banks are more inclined to undertake risky lending holds, therefore, in Pakistan’s case.
4 At a 1 percent confidence level, excluding specifications 10 and 11 where it is significant at 5 percent.
Ijaz Hussain 58
Ta
ble
8: R
eg
ress
ion
res
ult
s: p
an
el
least
sq
uar
es
(all
ban
ks)
(1
) (2
) (3
) (4
) (5
) (6
) (7
) (8
) (9
) (1
0)
(11
) (1
2)
(13
) (1
4)
(15
) (1
6)
(17
) (1
8)
(19
) (2
0)
(21
)
C
-0.0
89
-0.0
76
-0.0
49
0.2
46
0.2
41
0.2
87
0.2
14
0.2
24
0.1
84
0.2
19
1.0
22
1.0
36
1.1
77
1.0
66
1.0
66
1.0
53
68.
976
1
.28
4 1
16.6
87
2.7
74
0.8
73
0
.00
0 0
.01
1 0
.16
8 0
.01
6 0
.01
1 0
.03
3 0
.09
9 0
.08
0 0
.09
2 0
.04
5 0
.00
0 0
.00
0 0
.00
0 0
.00
0 0
.00
0 0
.00
0 0
.00
0 0
.00
0 0
.00
0 0
.00
0 0
.00
0
CC
M
0.4
98
0.4
38
0.3
87
0.4
04
0.3
34
0.3
34
0.2
29
0.2
25
0.2
37
0.1
02
0.1
37
0.1
69
0.1
75
0.1
84
0.1
84
0.1
83
0.1
86
0.1
86
0.1
85
0.1
86
0.1
86
0
.00
0 0
.00
0 0
.00
0 0
.00
0 0
.00
0 0
.00
0 0
.00
0 0
.00
0 0
.00
0 0
.01
4 0
.01
8 0
.00
2 0
.00
1 0
.00
1 0
.00
1 0
.00
1 0
.00
1 0
.00
1 0
.00
1 0
.00
1 0
.00
1
LIR
0.0
51
0.0
57
0.0
51
0.0
43
0.0
43
0.0
43
0.0
42
0.0
42
0.0
41
0.0
37
0.0
36
0.0
37
0.0
35
0.0
35
0.0
36
0.0
36
0.0
36
0.0
36
0.0
36
0.0
36
0.0
00
0.0
00
0.0
00
0.0
00
0.0
00
0.0
00
0.0
00
0.0
00
0.0
00
0.0
00
0.0
00
0.0
00
0.0
00
0.0
00
0.0
00
0.0
00
0.0
00
0.0
00
0.0
00
0.0
00
DIV
-2
.301
-1
.977
-2
.072
-2
.117
-2
.230
-2
.240
-2
.262
-2
.404
-2
.481
-2
.575
-2
.572
-2
.547
-2
.547
-2
.557
-2
.549
-2
.549
-2
.544
-2
.549
-2
.549
0
.00
0 0
.00
0 0
.00
0 0
.00
0 0
.00
0 0
.00
0 0
.00
0 0
.00
0 0
.00
0 0
.00
0 0
.00
0 0
.00
0 0
.00
0 0
.00
0 0
.00
0 0
.00
0 0
.00
0 0
.00
0 0
.00
0
SA
MS
-0.0
21
-0.0
18
-0.0
21
-0.0
14
-0.0
13
-0.0
11
-0.0
10
-0.0
27
-0.0
30
-0.0
30
-0.0
33
-0.0
33
-0.0
33
-0.0
33
-0.0
33
-0.0
33
-0.0
33
-0.0
33
0.0
02
0.0
02
0.0
10
0.0
69
0.0
94
0.1
08
0.1
66
0.0
00
0.0
00
0.0
00
0.0
00
0.0
00
0.0
00
0.0
00
0.0
00
0.0
00
0.0
00
0.0
00
CR
-0
.034
-0
.035
-0
.038
-0
.038
-0
.038
-0
.034
-0
.033
-0
.031
-0
.030
-0
.029
-0
.029
-0
.029
-0
.028
-0
.028
-0
.028
-0
.028
-0
.028
0
.00
2 0
.00
1 0
.00
0 0
.00
1 0
.00
1 0
.01
2 0
.01
3 0
.02
0 0
.02
0 0
.02
4 0
.02
4 0
.02
4 0
.02
4 0
.00
0 0
.02
4 0
.02
4 0
.02
9
BS
0.2
30
0.0
95
-0.1
10
-0.0
85
0.1
77
0.6
12
0.6
97
0.6
92
0.7
66
0.7
66
0.7
67
0.7
66
0.7
66
0.7
65
0.7
66
0.7
66
0.4
66
0.7
56
0.7
15
0.7
73
0.5
56
0.0
31
0.0
16
0.0
18
0.0
12
0.0
13
0.0
13
0.0
13
0.0
13
0.0
13
0.0
13
0.0
16
D1
0.1
12
0.0
98
0.1
02
0.0
44
0.0
35
0.0
31
0.0
31
0.0
28
0.0
28
0.0
28
0.0
28
0.0
28
0.0
28
0.0
28
0.0
28
0
.00
0 0
.00
0 0
.00
0 0
.00
0 0
.00
0 0
.00
4 0
.00
5 0
.01
2 0
.01
3 0
.01
2 0
.01
3 0
.01
3 0
.01
3 0
.01
3 0
.01
6
D2
-0
.087
-0
.079
-0
.080
-0
.080
-0
.079
-0
.079
-0
.081
-0
.081
-0
.081
-0
.081
-0
.081
-0
.081
-0
.081
-0
.081
0.0
00
0.0
00
0.0
00
0.0
00
0.0
00
0.0
00
0.0
00
0.0
00
0.0
00
0.0
00
0.0
00
0.0
00
0.0
00
0.0
00
D3
0.0
25
0.0
09
0.0
05
0.0
09
0.0
10
0.0
07
0.0
07
0.0
07
0.0
08
0.0
08
0.0
08
0.0
08
0.0
08
0
.15
6 0
.61
3 0
.69
5 0
.43
8 0
.40
8 0
.55
2 0
.55
2 0
.53
4 0
.51
6 0
.51
6 0
.52
9 0
.51
6 0
.52
9
D4
0
.20
6 0
.18
1 0
.17
2 0
.16
9 0
.16
8 0
.16
8 0
.16
8 0
.16
8 0
.16
8 0
.16
8 0
.16
8 0
.16
8
0.0
00
0.0
00
0.0
00
0.0
00
0.0
00
0.0
00
0.0
00
0.0
00
0.0
00
0.0
00
0.0
00
0.0
00
AT
CS
(-
1)
-0.5
09
-0.5
06
-0.6
44
-0.5
57
-0.5
57
-0.5
35
-0.1
83
0.0
11
-0.2
42
-0.3
65
-0.5
03
0.0
00
0.0
00
0.0
00
0.0
00
0.0
00
0.0
00
0.0
00
0.0
00
0.0
00
0.0
00
0.0
00
RIR
0.0
07
0.0
12
0.0
10
0.0
10
0.0
09
0.0
06
-0.5
87
- 0
.00
7 0
.01
3
0.0
00
0.0
00
0.0
00
0.0
00
0.0
00
0.0
00
0.0
00
- 0
.00
0 0
.00
0
D (
DE
R)
0.1
00
0.1
03
0.1
03
0.0
94
0.0
36
0.2
18
- 0
.09
5 0
.14
7
0
.00
4 0
.00
0 0
.00
0 0
.00
3 0
.02
6 0
.00
0 -
0.0
00
0.0
00
FB
CS
- -
- -
- 0
.02
4 -
-
- -
- -
- 0
.00
0 -
-
Financial Leverage, Asset Utilization & Nonperforming Loans in Pakistan 59
Ta
ble
8: R
eg
ress
ion
res
ult
s: p
an
el
least
sq
uar
es
(all
ban
ks)
(C
on
tin
ued
)
(1
) (2
) (3
) (4
) (5
) (6
) (7
) (8
) (9
) (1
0)
(11
) (1
2)
(13
) (1
4)
(15
) (1
6)
(17
) (1
8)
(19
) (2
0)
(21
)
CP
I
0.0
01
0.0
01
0.0
01
0.0
06
0.0
03
0.0
10
0.0
02
-0.0
01
0.0
00
0.0
28
0.3
19
0.0
00
0.0
00
0.0
00
0.0
04
0.2
07
KS
EH
0
.00
0 0
.00
0 0
.00
0 0
.00
0 0
.00
0 0
.00
0 0
.00
0
0
.99
8 0
.82
4 0
.00
0 0
.01
1 0
.00
0 0
.00
0 0
.08
6
NE
R
0
.00
0 0
.00
0 -0
.006
-0
.001
0
.00
0 0
.00
4
0.6
35
0.9
35
0.0
00
0.3
20
0.7
10
0.0
12
LP
TS
2.8
58
-
0
.00
0
-
Lo
g
RG
DP
-2.3
09
- -3
.916
-
-
0
.00
0 -
0.0
00
- -
PC
I
-
- -
-0.0
00
-
-
- -
0.0
00
-
D5
-0.0
40
0
.00
0
Per
iod
s 9
9 9
9 9
9 9
9 9
9 8
8 8
8 8
8 8
8 8
8 8
Cro
ss-
sect
ion
s 4
0 4
0 4
0 4
0 4
0 4
0 4
0 4
0 4
0 4
0 4
0 4
0 4
0 4
0 4
0 4
0 4
0 4
0 4
0 4
0 4
0
Ob
s.
339
3
39
339
3
39
339
3
39
339
3
39
339
3
39
300
3
00
300
3
00
300
3
00
300
3
00
300
3
00
300
R2
0.2
800
0
.39
19
0.4
750
0
.49
62
0.5
102
0
.51
09
0.5
537
0
.57
15
0.5
726
0
.61
10
0.6
424
0
.65
21
0.6
543
0
.65
67
0.6
567
0
.65
67
0.6
573
0
.65
73
0.6
572
0
.65
73
0.6
573
Ad
j. R
2 0
.27
79
0.3
883
0
.47
03
0.4
901
0
.50
29
0.5
021
0
.54
43
0.5
611
0
.56
09
0.5
992
0
.62
87
0.6
376
0
.63
86
0.6
398
0
.63
86
0.6
373
0
.63
66
0.6
366
0
.63
79
0.6
366
0
.63
66
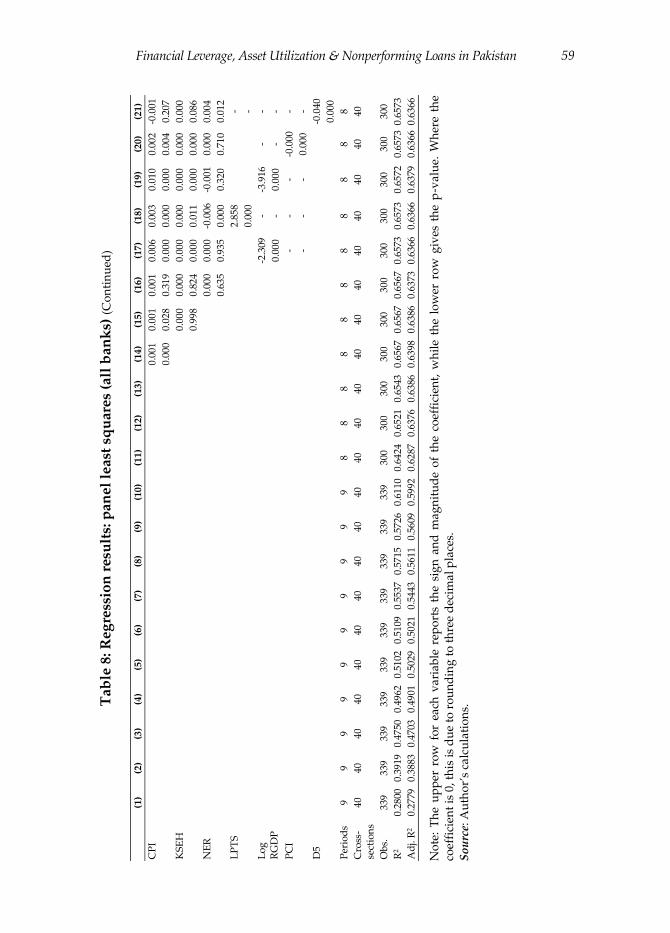
No
te:
Th
e u
pp
er r
ow
fo
r ea
ch v
ari
ab
le r
epo
rts
the
sig
n a
nd
ma
gn
itu
de
of
the
coef
fici
ent,
wh
ile
the
low
er r
ow
giv
es t
he
p-v
alu
e. W
her
e th
e co
effi
cien
t is
0,
this
is
du
e to
ro
un
din
g t
o t
hre
e d
ecim
al
pla
ces.
S
ou
rce:
Au
tho
r’s
calc
ula
tio
ns.
Ijaz Hussain 60
Ta
ble
9: R
eg
ress
ion
res
ult
s: p
an
el
least
sq
uar
es
(excl
ud
ing
sp
eci
aliz
ed
ba
nk
s)
(1
) (2
) (3
) (4
) (5
) (6
) (7
) (8
) (9
) (1
0)
(11
) (1
2)
(13
) (1
4)
(15
)
C
0.1
565
0
.11
78
0.0
871
0
.06
03
0.0
200
-0
.111
2 -0
.085
2 0
.04
06
0.0
643
0
.50
54
0.5
005
0
.57
74
0.4
926
9
.02
73
0.3
744
0.0
000
0
.00
02
0.0
063
0
.35
93
0.7
636
0
.23
29
0.3
230
0
.57
44
0.4
211
0
.00
00
0.0
000
0
.00
00
0.0
000
0
.66
67
0.9
861
CG
0
.00
01
0.0
001
0
.00
06
0.0
006
0
.00
06
0.0
006
0
.00
04
0.0
006
0
.00
05
0.0
004
0
.00
04
0.0
004
0
.00
04
0.0
004
0
.00
04
0
.78
35
0.6
597
0
.03
35
0.0
305
0
.02
68
0.0
002
0
.00
26
0.0
003
0
.00
51
0.0
298
0
.02
92
0.0
351
0
.03
54
0.0
415
0
.03
03
LIR
0.1
879
0
.35
46
0.3
612
0
.35
64
0.3
960
0
.32
58
0.4
511
0
.44
76
0.3
457
0
.34
34
0.3
193
0
.31
89
0.3
181
0
.47
16
0.1
854
0
.00
32
0.0
013
0
.00
14
0.0
000
0
.00
00
0.0
000
0
.00
00
0.0
006
0
.00
08
0.0
026
0
.00
26
0.0
032
0
.00
20
DIV
-3
.258
3 -3
.289
2 -3
.271
1 -2
.889
6 -2
.864
2 -2
.647
2 -2
.712
7 -2
.810
2 -2
.818
9 -2
.839
1 -2
.839
1 -2
.843
6 -2
.910
2
0.0
000
0
.00
00
0.0
000
0
.00
00
0.0
000
0
.00
00
0.0
000
0
.00
00
0.0
000
0
.00
00
0.0
000
0
.00
00
0.0
000
SA
MS
0.0
017
0
.00
47
0.0
113
0
.01
17
0.0
024
0
.00
11
-0.0
007
-0.0
011
-0.0
010
-0.0
011
-0.0
011
-0.0
105
0.7
138
0
.36
08
0.1
366
0
.10
55
0.6
919
0
.86
58
0.9
050
0
.84
65
0.8
609
0
.85
35
0.8
579
0
.14
48
CR
-0.0
037
0.0
007
-0
.023
6 -0
.022
3 -0
.012
9 -0
.010
5 -0
.005
4 -0
.004
9 -0
.005
0 -0
.005
1 -0
.005
2 -0
.006
5
0
.68
60
0.9
456
0
.02
49
0.0
231
0
.07
63
0.1
202
0
.51
99
0.5
718
0
.56
07
0.5
571
0
.54
12
0.4
945
BS
-0
.148
8 -0
.356
2 -0
.525
1 -0
.485
2 -0
.441
8 -0
.398
1 -0
.386
9 -0
.388
4 -0
.387
1 -0
.387
0 -0
.095
3
0.4
457
0
.15
60
0.0
341
0
.01
94
0.0
249
0
.02
80
0.0
363
0
.03
47
0.0
352
0
.03
51
0.5
410
D1
0
.14
09
0.1
276
0
.11
18
0.1
105
0
.10
86
0.1
082
0
.10
82
0.1
082
0
.10
82
0.0
937
0
.00
00
0.0
000
0
.00
00
0.0
000
0
.00
00
0.0
000
0
.00
00
0.0
000
0
.00
00
0.0
000
D2
-0
.069
1 -0
.082
8 -0
.083
9 -0
.087
3 -0
.087
6 -0
.088
0 -0
.088
1 -0
.088
0 -0
.092
9
0.0
000
0
.00
00
0.0
000
0
.00
00
0.0
000
0
.00
00
0.0
000
0
.00
00
0.0
000
D3
-0
.076
7 -0
.076
6 -0
.070
8 -0
.071
1 -0
.068
8 -0
.068
8 -0
.068
6 -0
.065
4
0
.00
00
0.0
000
0
.00
00
0.0
000
0
.00
00
0.0
000
0
.00
00
0.0
000
D5
-0.0
320
-0.0
115
-0.0
119
-0.0
149
-0.0
256
-0.0
358
-0.0
354
0
.00
25
0.0
022
0
.00
33
0.0
016
0
.00
02
0.1
612
0
.07
48
AT
CS
(-1
)
-0.3
601
-0.3
499
-0.4
204
-0.3
658
-0.2
504
-0.2
782
0.0
000
0
.00
00
0.0
000
0
.00
00
0.2
746
0
.15
26
RIR
0
.00
05
0.0
030
0
.00
28
0.0
084
0
.00
49
0
.53
51
0.0
297
0
.04
58
0.5
769
0
.74
44
D(D
ER
)
0.0
544
0
.04
37
0.0
348
0
.04
36
0.0
031
0
.02
61
0.0
000
0
.00
00
FB
CS
0
.00
85
0.0
002
0
.01
69
0
.00
56
0.9
933
0
.51
61
Financial Leverage, Asset Utilization & Nonperforming Loans in Pakistan 61
Ta
ble
9: R
eg
ress
ion
res
ult
s: p
an
el
least
sq
uar
es
(excl
ud
ing
sp
eci
aliz
ed
ban
ks)
(C
on
tin
ued
)
(1
) (2
) (3
) (4
) (5
) (6
) (7
) (8
) (9
) (1
0)
(11
) (1
2)
(13
) (1
4)
(15
)
Lo
g R
GD
P
-0
.289
0 0
.00
11
0.6
836
0
.99
87
D6
0.0
900
0.0
000
Per
iod
s 7
7 7
7 7
7 7
7 7
7 7
7 7
7 7
Cro
ss-s
ecti
on
s 3
8 3
8 3
8 3
8 3
8 3
8 3
8 3
8 3
8 3
8 3
8 3
8 3
8 3
8 3
8
Ob
serv
ati
on
s 2
46
246
2
46
246
2
46
246
2
46
246
2
46
246
2
46
246
2
46
246
2
46
R2
0.0
091
0
.21
14
0.2
120
0
.21
20
0.2
129
0
.36
71
0.3
916
0
.40
36
0.4
100
0
.42
50
0.4
740
0
.47
57
0.4
758
0
.47
57
0.5
479
Ad
just
ed R
2 0
.00
09
0.2
017
0
.19
89
0.1
956
0
.19
31
0.3
485
0
.37
10
0.3
809
0
.38
49
0.3
980
0
.44
69
0.4
463
0
.44
40
0.4
416
0
.51
33
No
te:
Th
e u
pp
er r
ow
fo
r ea
ch v
ari
ab
le r
epo
rts
the
sig
n a
nd
ma
gn
itu
de
of
the
coef
fici
ent,
wh
ile
the
low
er r
ow
giv
es t
he
p-v
alu
e.
So
urc
e: A
uth
or’
s ca
lcu
lati
on
s.
Ijaz Hussain 62
Table 10: Regression results: FE model
1 2 3 4 5 6 7
C 0.1007 0.1106 0.1241 0.1253 0.1697 0.2376 0.8007 0.0001 0.1729 0.1105 0.1173 0.0086 0.0014 0.0067
NPLGA (-1) 0.4536 0.4516 0.3915 0.3527 0.3488 0.3345 0.3158 0.0043 0.0054 0.0191 0.0333 0.0339 0.0407 0.0460
CCM -0.0185 -0.0396 -0.0306 -0.1119 -0.1179 -0.0591 0.8883 0.7606 0.8168 0.2621 0.2443 0.6275
LIR 0.0192 0.0235 0.0221 0.0220 0.0194 0.0525 0.0012 0.0043 0.0041 0.0055
DIV -1.6211 -1.6576 -1.6256 -1.6316 0.0000 0.0000 0.0000 0.0000
CR -0.0512 -0.0503 -0.0408 0.0026 0.0019 0.0100
BS -2.3295 -0.6726 0.0001 0.5098
SAMS -0.0430 0.0697
Periods 8 8 8 8 8 8 8
Cross-sections 40 40 40 40 40 40 40
Observations 299 299 299 299 299 299 299
R2 0.7750 0.7750 0.7873 0.8026 0.8061 0.8085 0.8187
Adj. R2 0.7328 0.7318 0.7454 0.7628 0.7661 0.7680 0.7795
Note: The upper row for each variable reports the sign and magnitude of the coefficient, while the lower row gives the p-value. Source: Author’s calculations.
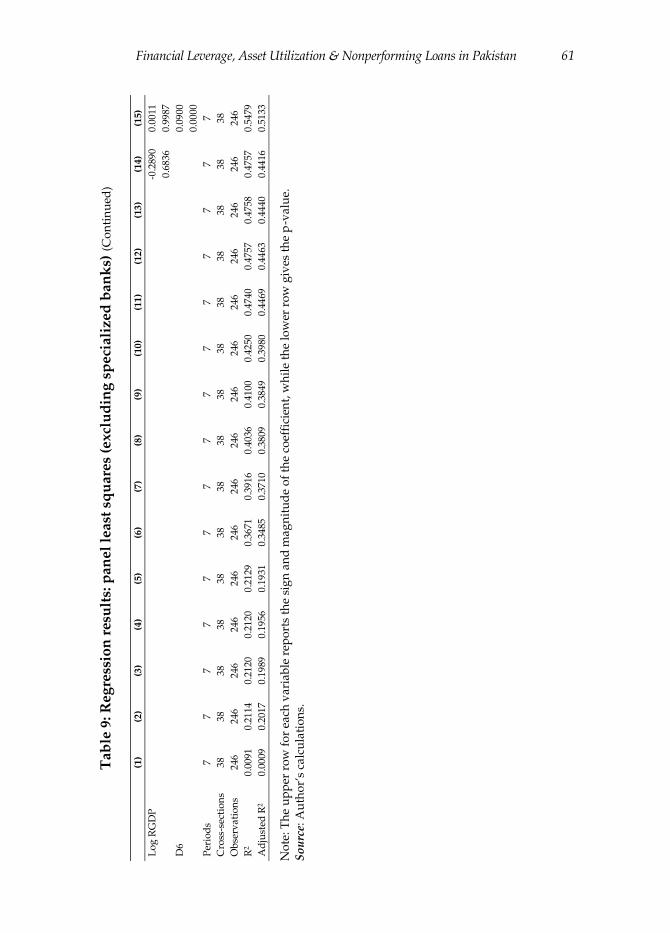
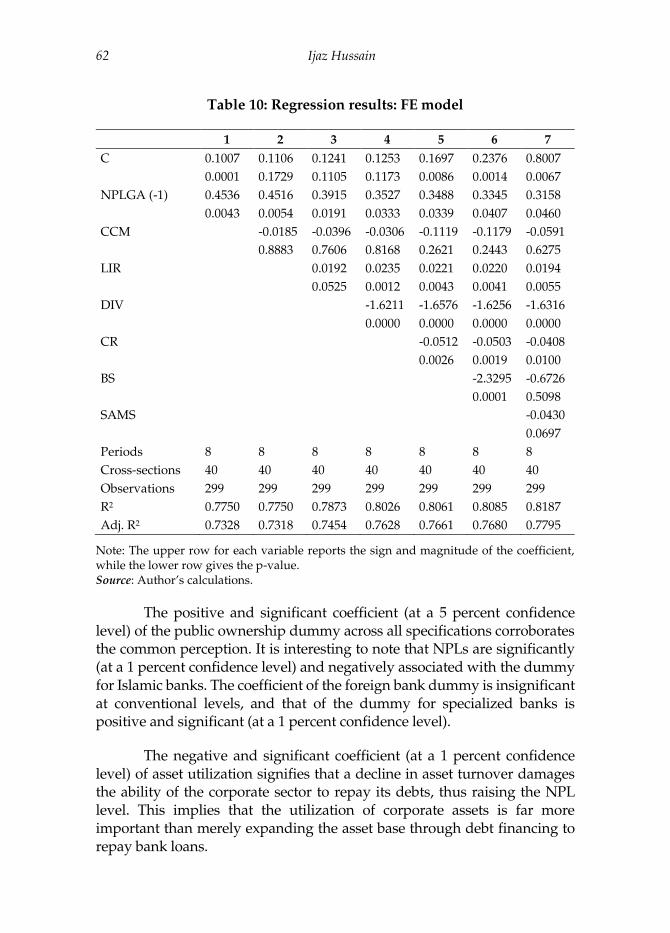
The positive and significant coefficient (at a 5 percent confidence level) of the public ownership dummy across all specifications corroborates the common perception. It is interesting to note that NPLs are significantly (at a 1 percent confidence level) and negatively associated with the dummy for Islamic banks. The coefficient of the foreign bank dummy is insignificant at conventional levels, and that of the dummy for specialized banks is positive and significant (at a 1 percent confidence level).
The negative and significant coefficient (at a 1 percent confidence level) of asset utilization signifies that a decline in asset turnover damages the ability of the corporate sector to repay its debts, thus raising the NPL level. This implies that the utilization of corporate assets is far more important than merely expanding the asset base through debt financing to repay bank loans.
Financial Leverage, Asset Utilization & Nonperforming Loans in Pakistan 63
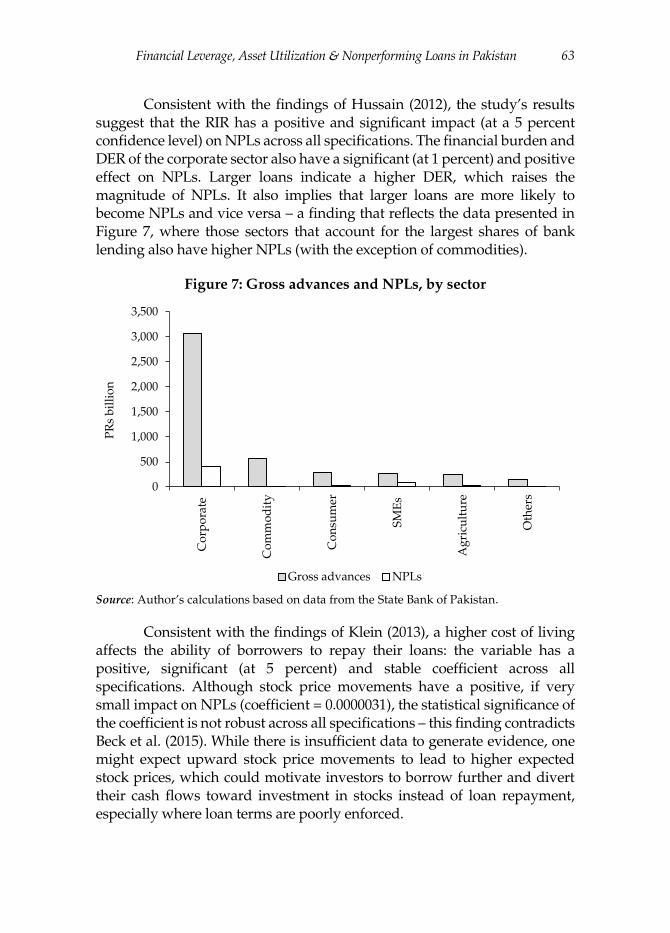
Consistent with the findings of Hussain (2012), the study’s results suggest that the RIR has a positive and significant impact (at a 5 percent confidence level) on NPLs across all specifications. The financial burden and DER of the corporate sector also have a significant (at 1 percent) and positive effect on NPLs. Larger loans indicate a higher DER, which raises the magnitude of NPLs. It also implies that larger loans are more likely to become NPLs and vice versa – a finding that reflects the data presented in Figure 7, where those sectors that account for the largest shares of bank lending also have higher NPLs (with the exception of commodities).
Figure 7: Gross advances and NPLs, by sector
Source: Author’s calculations based on data from the State Bank of Pakistan.
Consistent with the findings of Klein (2013), a higher cost of living affects the ability of borrowers to repay their loans: the variable has a positive, significant (at 5 percent) and stable coefficient across all specifications. Although stock price movements have a positive, if very small impact on NPLs (coefficient = 0.0000031), the statistical significance of the coefficient is not robust across all specifications – this finding contradicts Beck et al. (2015). While there is insufficient data to generate evidence, one might expect upward stock price movements to lead to higher expected stock prices, which could motivate investors to borrow further and divert their cash flows toward investment in stocks instead of loan repayment, especially where loan terms are poorly enforced.
0
500
1,000
1,500
2,000
2,500
3,000
3,500
Co
rpo
rate
Co
mm
od
ity
Co
nsu
mer
SM
Es
Ag
ricu
ltu
re
Oth
ers
PR
s b
illi
on
Gross advances NPLs
Ijaz Hussain 64
The impact of movements in the exchange rate is insignificant. An adverse macroeconomic environment (a lower real GDP growth rate) raises NPLs and vice versa. This finding is consistent with Klein (2013), Messai and Jouini (2013), Beck et al. (2015) and Anastasiou et al. (2016). It is worth noting that the share of bank lending channeled to the textiles sector (and the fact that this share has increased) has a significant and positive impact on NPLs. This can be interpreted as a positive association between political connectedness or influence and NPLs.
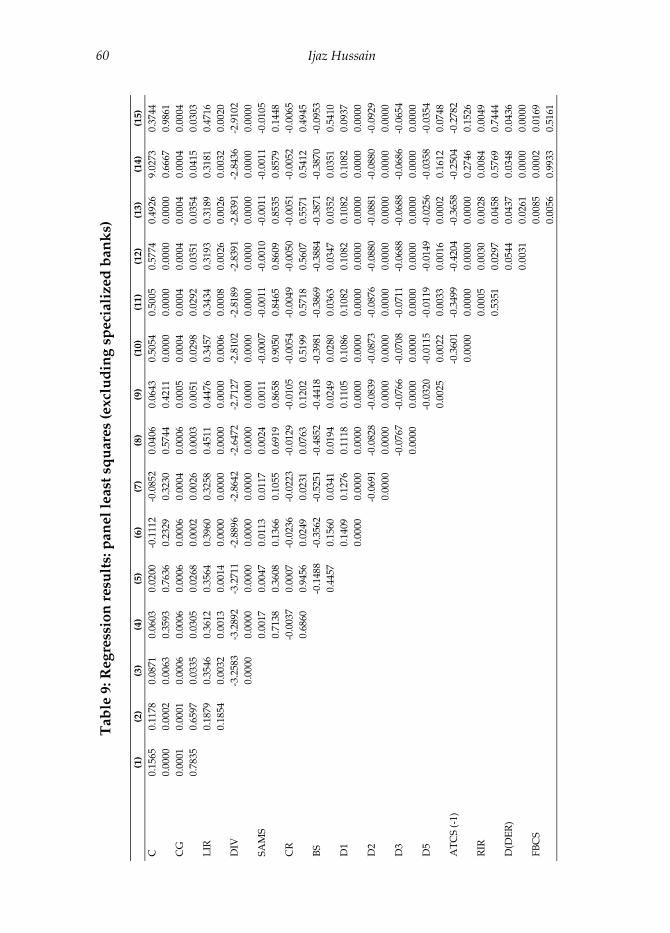
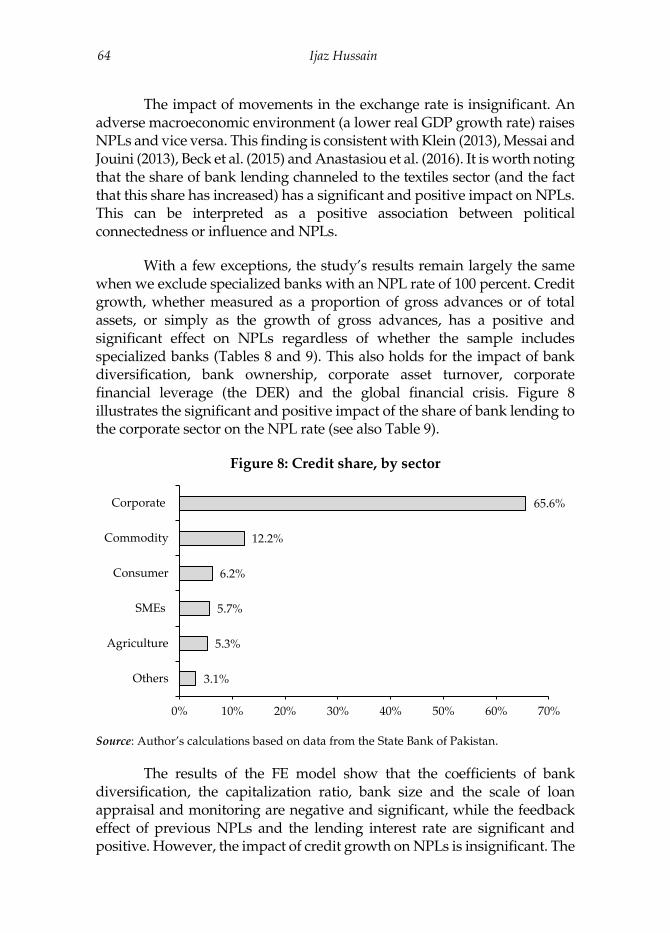
With a few exceptions, the study’s results remain largely the same when we exclude specialized banks with an NPL rate of 100 percent. Credit growth, whether measured as a proportion of gross advances or of total assets, or simply as the growth of gross advances, has a positive and significant effect on NPLs regardless of whether the sample includes specialized banks (Tables 8 and 9). This also holds for the impact of bank diversification, bank ownership, corporate asset turnover, corporate financial leverage (the DER) and the global financial crisis. Figure 8 illustrates the significant and positive impact of the share of bank lending to the corporate sector on the NPL rate (see also Table 9).
Figure 8: Credit share, by sector
Source: Author’s calculations based on data from the State Bank of Pakistan.
The results of the FE model show that the coefficients of bank diversification, the capitalization ratio, bank size and the scale of loan appraisal and monitoring are negative and significant, while the feedback effect of previous NPLs and the lending interest rate are significant and positive. However, the impact of credit growth on NPLs is insignificant. The
3.1%
5.3%
5.7%
6.2%
12.2%
65.6%
0% 10% 20% 30% 40% 50% 60% 70%
Others
Agriculture
SMEs
Consumer
Commodity
Corporate
Financial Leverage, Asset Utilization & Nonperforming Loans in Pakistan 65
sign and significance of most of the bank-specific variables are robust across the two models, with the exception of bank size and credit growth.
7. Conclusion and Policy Implications
The regression results suggest that credit market concentration or credit growth, the lending rate, the cost of living, the bank’s market power (bank size), public sector ownership, specialized banking, the DER and financial burden have a positive and significant impact on NPLs. The diversification of bank activities, the scale of loan appraisal and monitoring, Islamic banking, corporate asset turnover and a favorable macroeconomic environment significantly reduce the NPL rate. Stock price movements have a very small positive (0.0000031) effect that is significant across some, but not all, specifications. The impact of foreign banking and nominal exchange rate movements is insignificant because bank lending to foreign borrowers is negligible.
An important finding is that bank-specific indicators have greater explanatory power with respect to the variation in NPLs than corporate sector indicators. Macroeconomic indicators have the least (almost negligible) explanatory power: their addition to the model has little or no impact on the R2 term. Moreover, the results for the key variables remain similar regardless of whether we include or exclude specialized banks with a 100 percent NPL rate. Finally, the relatively large share of bank lending to the corporate sector clearly increases NPLs.
The study’s findings have several policy implications:
If regulators and policy advisors are to manage the NPL rate better, they need to take into account the relevant corporate sector indicators – in addition to bank-specific and macroeconomic variables – when assessing the vulnerable points of the banking and financial sectors.
The State Bank of Pakistan should focus on strengthening loan appraisal and monitoring systems, especially in conventional and specialized banking. It also needs to ensure that bank credit penetrates segments other than the corporate sector. This entails limiting the pace of credit growth and loan size in the corporate sector’s case, given that (i) its financial burden and DER have a positive effect on NPLs and (ii) larger loans are more likely to become NPLs. Giving banks incentive to diversify their activities could also help reduce the NPL rate.

Ijaz Hussain 66
The Competition Commission of Pakistan should take measures to reduce the market power of larger banks by promoting competition in the sector.
Finally, corporate managers need to diversify bank activities and monitor their asset turnover, capital structure and financial burden in addition to other indicators, especially when lending to corporate entities.
Financial Leverage, Asset Utilization & Nonperforming Loans in Pakistan 67
References
Adhikary, B. K. (2006). Nonperforming loans in the banking sector of Bangladesh: Realities and challenges. Ritsumeikan Journal of Asia Pacific Studies, 21, 75–95.
Anastasiou, D., Lourie, H., & Tsionas, M. (2016). Determinants of nonperforming loans: Evidence from Euro-area countries. Finance Research Letters, 18, 116–119.
Beck, R., Jakubik, P., & Piloiu, A. (2015). Key determinants of nonperforming loans: New evidence from a global sample. Open Economies Review, 26(3), 525–550.
Beck, T., Demirgüç-Kunt, A., & Merrouche, O. (2013). Islamic vs. conventional banking: Business model, efficiency and stability. Journal of Banking and Finance, 37(2), 433–447.
Berger, A. N., & DeYoung, R. (1997). Problem loans and cost efficiency in commercial banks. Journal of Banking and Finance, 21(6), 849–870.
Berger, A. N., & Udell, G. F. (2004). The institutional memory hypothesis and the pro-cyclicality of bank lending behavior. Journal of Financial Intermediation, 13(4), 458–495.
Bernanke, B. S., & Lown, C. S. (1991). The credit crunch. Brookings Papers on Economic Activity, 2, 205–247.
Boudriga, A., Taktak, N. B., & Jellouli, S. (2010). Bank-specific, business and institutional environment determinants of banks’ nonperforming loans: Evidence from MENA countries (Working Paper No. 547). Giza, Egypt: Economic Research Forum.
Çifter, A. (2015). Bank concentration and nonperforming loans in Central and Eastern European countries. Journal of Business Economics and Management, 16(1), 117–137.
De Bock, R., & Demyanets, A. (2012). Bank asset quality in emerging markets: Determinants and spillovers (Working Paper No. 71). Washington, DC: International Monetary Fund.
Eisenbeis, R. A. (1997). Bank deposits and credit as sources of systemic risk. Economic Review (Federal Reserve Bank of Atlanta), 82(3), 4–19.
Ijaz Hussain 68
Espinoza, R., & Prasad, A. (2010). Nonperforming loans in the GCC banking system and their macroeconomic effects (Working Paper No. 224). Washington, DC: International Monetary Fund.
Fernández de Lis, S., Pagés, J. M., & Saurina, J. (2001). Credit growth, problem loans and credit risk provisioning in Spain. In Marrying the macro- and micro-prudential dimensions of financial stability (vol. 1, pp. 331–353). Basel: Bank for International Settlements.
Glen, J., & Mondragón-Vélez, C. (2011). Business cycle effects on commercial bank loan portfolio performance in developing economies. Review of Development Finance, 1(2), 150–165.
Hussain, I. (2012). Growth, corporate gearing and nonperforming loans in Pakistan. International Journal of Applied Business and Economic Research, 10(2), 255–267.
Islam, M. A., Karim, L., & Islam, M. R. (2014). A comparative study of prudential regulation on loan classification and provisioning of the Southeast Asian countries. Journal of Management Research, 6(1), 25–51.
Kauko, K. (2012). External deficits and nonperforming loans in the recent financial crisis. Economics Letters, 115(2), 196–199.
Keeton, W. R. (1999). Does faster loan growth lead to higher loan losses? Economic Review (Federal Reserve Bank of Kansas City), 84(2), 57–75.
Khemraj, T., & Pasha, S. (2009, May). The determinants of nonperforming loans: An econometric case study of Guyana. Paper presented at the 3rd Biennial Conference on Business, Banking and Finance, Caribbean Centre for Money and Finance, St Augustine, Trinidad.
Klein, N. (2013). Nonperforming loans in CESEE: Determinants and impact on macroeconomic performance (Working Paper No. 72). Washington, DC: International Monetary Fund.
Kwan, S., & Eisenbeis, R. A. (1997). Bank risk, capitalization and operating efficiency. Journal of Financial Services Research, 12(2–3), 117–131.
Louzis, D. P., Vouldis, A. T., & Metaxas, V. L. (2012). Macroeconomic and bank-specific determinants of nonperforming loans in Greece: A comparative study of mortgage, business and consumer loan portfolios. Journal of Banking and Finance, 36(4), 1012–1027.
Financial Leverage, Asset Utilization & Nonperforming Loans in Pakistan 69
Messai, A. S., & Jouini, F. (2013). Micro and macro determinants of nonperforming loans. International Journal of Economics and Financial Issues, 3(4), 852–860.
Podpiera, J., & Weill, L. (2008). Bad luck or bad management? Emerging banking market experience. Journal of Financial Stability, 4(2), 135–148.
Salas, V., & Saurina, J. (2002). Credit risk in two institutional regimes: Spanish commercial and savings banks. Journal of Financial Services Research, 22(3), 203–224.
Siddiqui, S., Malik, K. S., & Shah, S. Z. (2012). Impact of interest rate volatility on nonperforming loans in Pakistan. International Research Journal of Finance and Economics, 84, 66–75.
Woo, D. (2000). Two approaches to resolving nonperforming assets during financial crises (Working Paper No. 33). Washington, DC: International Monetary Fund.

Ijaz Hussain 70
Appendix
Figure A1: Impact of low or negative RIR regime on imports of
machinery and mechanical appliances, 2006–09
Source: Author’s calculations based on data from the State Bank of Pakistan.
0
100,000
200,000
300,000
400,000
500,000
600,000
700,000
800,000Ju
l-03
Jan
-04
Jul-
04Ja
n-0
5Ju
l-05
Jan
-06
Jul-
06Ja
n-0
7Ju
l-07
Jan
-08
Jul-
08Ja
n-0
9Ju
l-09
Jan
-10
Jul-
10Ja
n-1
1Ju
l-11
Jan
-12
Jul-
12Ja
n-1
3Ju
l-13
Jan
-14
Jul-
14Ja
n-1
5Ju
l-15
Jan
-16
(R)
US
$ '0
00