CORPORATE ENERGY & EMISSIONS PLAN 2009
92
EGIONAL DISTRICT SUNSHINE COAST CORPORATE ENERGY & EMISSIONS PLAN 2009 REGIONAL DISTRICT For the 2008 inventory year
Transcript of CORPORATE ENERGY & EMISSIONS PLAN 2009
R E G I O N A L D I S T R I C T
SUNSHINE COAST
CORPORATE ENERGY & EMISSIONS PLAN
2009
R E G I O N A L D I S T R I C T
For the 2008 inventory year

R E G I O N A L D I S T R I C T SUNSHINE COAST
CORPORATE ENERGY & EMISSIONS PLAN
2009
Hyla Environmental Services Ltd.R.D. Haycock
400 Capilano Drive, #1708Port Moody, BC V3H 0E1
(604) [email protected]
May 2009
Prepared for:
Sunshine Coast Regional District1975 Field Road
Sechelt, B.C. V0N 3A1

About Hyla Environmental Services Ltd.HES Ltd. specializes in developing corporate and community energy and emissions plans for local government and departments within senior levels of government (regional, provincial, and federal). With over 13 years of dedicated experience to emissions management, HES’ work extends to corporate and community sustainability plans, including integrated community sustainability plans. HES has developed proprietary software, Energy and Emissions Reporting and Monitoring System™ (EEMRS™), which is used to calculate emissions, develop emissions forecasts, and integrate account-level management to produce accurate, cost effective emissions management strategies. HES is a leader in this field having completed over 105 corporate energy and emissions inventories and 21 emissions management strategies. As well, HES produces community-wide energy and emissions inventories for all local government (189) in British Columbia on behalf of the Province of British Columbia’s Ministry of Environment.
HES Ltd. is proud to be a founding reporter of The Climate Registry.

ACRONYMS
CO2 – Carbon Dioxide
CO2e– Carbon Dioxide Equivalent
SCRD – Sunshine Coast Regional District
EEMRS™ – Energy and Emissions Monitoring and Reporting System™
GHG – Greenhouse Gas
HES – Hyla Environmental Services Ltd.
Copyright © 2009, Sunshine Coast Regional District
All rights reserved. No part of this publication may be reproduced, recorded or transmitted in any form or by any means, electronic, mechanical, photographic, sound, magnetic or other, without advance written permission from the owner.
Sunshine Coast Regional District staff are gratefully acknowledged for their efforts in the development of this plan.
Photos provided by Sunshine Coast Regional District
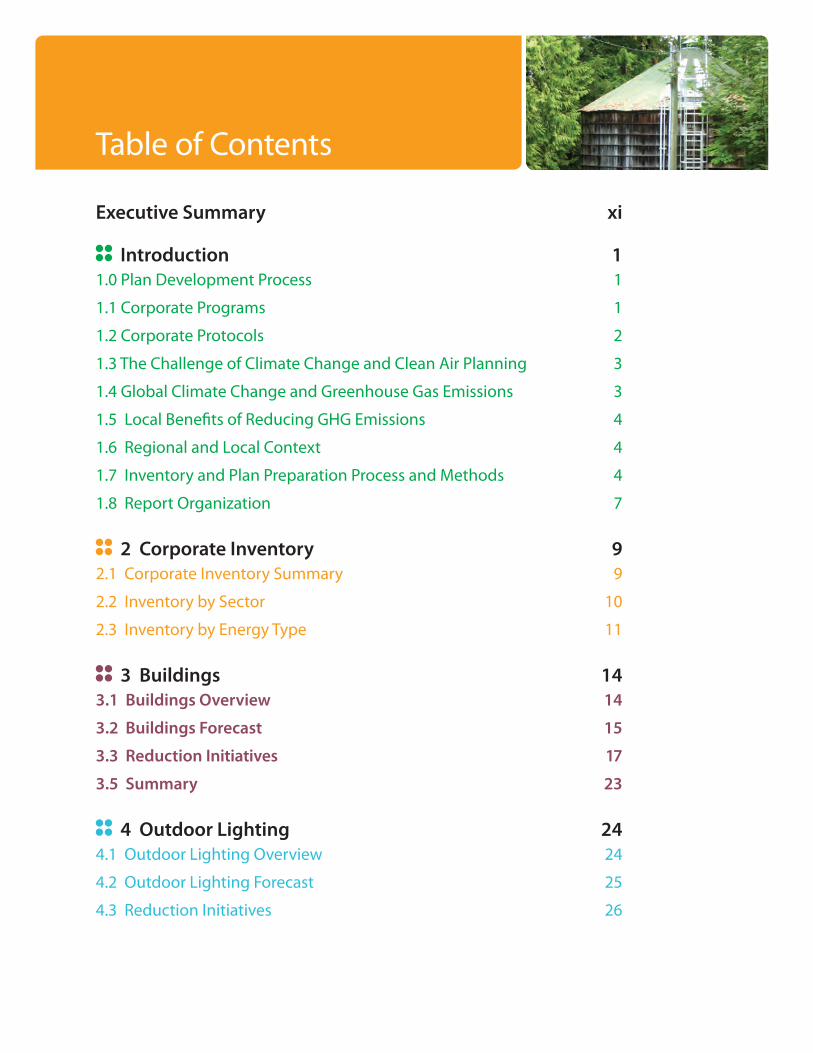
Table of Contents
Executive Summary xi
Introduction 11.0 Plan Development Process 1
1.1 Corporate Programs 1
1.2 Corporate Protocols 2
1.3 The Challenge of Climate Change and Clean Air Planning 3
1.4 Global Climate Change and Greenhouse Gas Emissions 3
1.5 Local Benefits of Reducing GHG Emissions 4
1.6 Regional and Local Context 4
1.7 Inventory and Plan Preparation Process and Methods 4
1.8 Report Organization 7
2 Corporate Inventory 92.1 Corporate Inventory Summary 9
2.2 Inventory by Sector 10
2.3 Inventory by Energy Type 11
3 Buildings 143.1 Buildings Overview 14
3.2 Buildings Forecast 15
3.3 Reduction Initiatives 17
3.5 Summary 23
4 Outdoor Lighting 244.1 Outdoor Lighting Overview 24
4.2 Outdoor Lighting Forecast 25
4.3 Reduction Initiatives 26

5 Water and Wastewater 275.1 Water & Wastewater Overview 27
5.2 Water and Wastewater Forecast 28
5.3 Reduction Initiatives 29
6 Vehicle Fleet 316.1 Vehicle Fleet Overview 31
6.2 Vehicle Fleet Forecast 33
6.3 Reduction Initiatives 34
7 Corporate Solid Waste 377.1 Reduction Initiatives 37
8 Summary 38Summary of Corporate Emission Reductions 38
Reduction Target Statement: 38
Glossary of Terms (IPCC 2006) 39
Appendix I - Detailed GHG Emissions Inventory (2008) 40
Appendix II - Detailed GHG Emissions Inventory (2008) - Transit Buses 55
Appendix III - Detailed GHG Emissions Inventory (2008) By Department 56

List of Tables
Table 2.1 – Energy, Costs, and Greenhouse Gas Emissions by Sector (2008) 9
Table 2.3.1 – Sources of Corporate Energy & Costs (2008) 11
Table 2.3.3 – Sources of Corporate Emissions (2008) 13
Table 3.1.1 – Summary of Buildings Sector Emissions (2008) 14
Table 3.1.2 – Buildings Ranked by Energy Consumption (2008) 14
Table 3.2.1 – Predicted Buildings Growth 16
Table 3.2.2 – Forecast of Buildings Consumption 16
Table 3.2.3 – Forecast of Buildings Costs 16
Table 3.2.4 – Forecast of Buildings GHG Emissions 17
Table 3.3.1 – Proposed Reduction Initiatives in the Buildings Sector 17
Table 3.5 – Prioritized Implementation in the Buildings Sector by CO2e Reduced 23
Table 4.1.1 – Summary of Outdoor Lighting Sector Emissions (2008) 24
Table 4.1.2 – Outdoor Lighting Ranked by Energy Consumption (2008) 24
Table 4.2.1 – Forecast of Lighting Consumption 25
Table 4.2.2 – Forecast of Lighting Costs 25
Table 4.2.3 – Forecast of Emissions 26
Table 4.3 – Summary of Proposed Reduction Initiatives for the Outdoor Lighting Sector 26
Table 5.1.1 – Summary of Water and Wastewater Sector Emissions (2008) 27
Table 5.1.2 – Water and Wastewater Ranked by Energy Consumption (2008) 28
Table 5.2.1 – Predicted Growth by Sector 29
Table 5.2.2 – Forecast of Water and Wastewater Consumption 29
Table 5.2.3 – Forecast of Water and Wastewater Costs 29
Table 5.2.4 – Forecast of Emissions 29
Table 5.3 – Summary of Proposed Reduction Initiatives for the Water and Wastewater Sector 30
Table 6.1.1 – Summary of Vehicle Fleet Sector Emissions (2008) 31
Table 6.1.2 – Ranking of Vehicle Fleet (2008) 31
Table 6.2.1 – Predicted Growth in the Vehicle Fleet Sector 33
Table 6.2.2 – Forecast of Vehicle Fleet Consumption 33
Table 6.2.3 – Forecast of Vehicle Fleet Costs 33
Table 6.2.4 – Forecast of Vehicle Fleet Emissions 34
Table 6.3.1 – Proposed Reduction Initiatives in the Vehicle Fleet Sector 34
Table 8.1 – Inventory Summary 38
Table 8.2 – Summary of Estimated Impact of Reduction Measures on the Corporate Sectors 38

List of Figures
Figure 1.6 – Local Context for the Sunshine Coast Regional District, British Columbia 5
Figure 2.1 – GHG Emissions (CO2e tonnes) by Sector (2008) 9
Figure 2.2.1 – Consumption by Sector 10
Figure 2.2.2 – Costs by Sector 10
Figure 2.2.3 – GHG Emissions by Sector 11
Figure 2.3.1 – Energy (GJ) by Type 12
Figure 2.3.2 – Costs by Type 12
Figure 2.3.3 – GHG Emissions (tonnes CO2e) by Type 13
Figure 3.1.1 – Costs for Energy in the Building Subsectors (2008) 15
Figure 4.1.1 – Costs for Energy in the Outdoor Lighting Subsectors (2008) 25
Figure 5.1.1 – Costs for Energy in the Water and Wastewater Subsectors (2008) 27
Figure 6.1.1 – Costs for Energy in the Vehicle Fleet Subsectors (2008) 32

This page intentionally blank

Executive Summary
The recommendations within the Sunshine Coast Regional District Corpo-rate Energy & Emissions Plan 2009 constitute the proposed greenhouse gas (GHG) emissions reduction strategy for the Sunshine Coast Regional District (SCRD). Based on the inventory of greenhouse gases completed and the proposed recommendations made, the SCRD can meet the GHG emissions reduction targets described in this report.
Energy use, energy costs and GHG emissions were calculated for the base year (2008) and forecast year (2018) to determine the SCRD’s total potential GHG emissions reduction.
In the base year, the SCRD produced 1,806 tonnes CO2e and consumed
52,230 GJ at a total cost of $988,569 (see table below).
Inventory Summary
Parameter 2008
Energy Consumption 52,230 GJEnergy Costs $988,569Emissions 1,806 tonnes CO2e
Reduction Target Statement:
The Sunshine Coast Regional District can reduce GHG emissions by 27 percent by reducing its 2008 base year emissions quantity by 563 tonnes CO2e by 2018.
Reduction Target SummaryThe reduction target for the SCRD is based on a ten-year period in accor-dance with the Federation of Canadian Municipalities’ Partners for Climate Protection Program. The ten-year reduction targets for the SCRD are pre-sented in the table and figure that follows.
xi

Sector2008 Base
Year Emissions (tonnes CO2e)
2018 Emissions Projection
(tonnes CO2e)
Reductions from 2010-2018
Implementation
Emissions after
Reductions (2018)
Overall Percent
Reduction (2018)
Buildings 1,123 1,179 469 710 -37%
Outdoor Lighting1 7 8 1 7 0%
Water and Wastewater2 81 85 5 80 -1%
Vehicle Fleet 440 444 72 372 -15%
Corporate Solid Waste3 155 159 16 143 -8%
Totals 1,806 1,875 563 1,312 -27%
1 Lighting includes all overhead streetlights owned by the SCRD, sportsfield lighting, parking lots, etc.
2 The estimate in the water and wastewater sector is qualitative
3 Solid waste from all SCRD facilities
Note: the emissions quantities in the graphical representation above for the Business as Usual Emissions Growth (fore-cast) and the Management Program Results (reductions) are hypothetical.
The targets for the building sector are aggressive, with a proposed reduction of 469 tonnes. The majority of this reduction could be achieved through a heat reclamation project that would reduce the amount of natural gas used to heat pool water at the Sechelt Aquatic Centre (note: the estimated reduction for the heat reclamation project is approximately 343 tonnes whereas the total reduction including all reduction initiatives is 408 tonnes).
Greenhouse gas emissions from outdoor lighting are insignificant relative to other sectors due to the low carbon emissions from hydroelectric power in British Columbia. A practical reduction initiative is to install dimmers and/or timers on overhead street lighting grids. LED technology, which offers savings ranging from 30 to 40 percent for over-head street lights, may become economical to implement in the near future and staff should keep apprised of the opportunities during the project period.
The water and wastewater sector will grow over the next ten years, but the majority of the additions to this sector will result in increased electricity consumption, which will not significantly affect the overall greenhouse gas emissions projection due to the low carbon emissions associated with electricity supplied by BC Hydro. The increases in emis-sions in this sector result from the proposed addition to the Chapman Creek Water Treatment Plant.
SUN
SHIN
E C
OA
ST R
EGIO
NA
L D
ISTR
ICT
CO
RPO
RATE
EN
ERG
Y A
ND
EM
ISSI
ON
S PL
AN
200
9
xii

The SCRD is a large area and staff must drive long distances to service rural parts of the district. This makes it difficult to achieve reductions in fuel consumption. The Administration Building and the public works yard could benefit from video conference systems to reduce travel to and from each building. Driver training and reducing the vehicle kilo-metres travelled may be the only practical solution in the short term until newer electric technologies are available from automobile manufacturers.
The SCRD has already implemented several initiatives to reduce corporate solid waste, although further reductions of waste to the landfill may be possible by increasing the types of waste from corporate facilities that can be recycled and composted.
Depending on when the initiatives are implemented, if the SCRD adopts the recommendations outlined in this report, savings of approximately $188,500 per year could be realized by investing approximately $1.85 million. Note that the payback for natural gas is based on the 2008 rate of $12 per GJ (note: includes all charges per GJ of natural gas consumed). As the price of natural gas rises over time, the payback period becomes shorter and, overall, the pro-posed reduction initiatives will result in a higher rate of return.
The table that follows provides a simple summary of capital investment, savings and simple payback.
SectorFive Year Capital
Investment(2010-2018)1
Annual Savings(2008 $)2
Simple Payback (2008 $)
Annual Emissions Reductions (2018)
Buildings $1,350,000 $160,000 8.4 469
Outdoor Lighting3 $250,000 $11,000 22.7 1
Water and Wastewater $150,000 17,500 8.6 5
Vehicle Fleet $80,000 N/A4 - 72
Corporate Solid Waste5 $15,000 N/A - 16
Total $1.85 Million $188,500 9.8 years 563 t
1 Projects to be approved as part of the regular budget cycle2 Savings are valued in 2008 dollars and are therefore conservative 3 Lighting measures include LED technology for streetlights, but a coarse estimate for capital costs is provided 4 Minor savings are anticipated as electric plug-in vehicles are implemented over time, although, there are very few vehicles that are appro-
priate for replacement with an electric vehicle, and those savings will be overshadowed by increasing fuel costs. Capital costs for vehicle replacements are not included. Currently, biodiesel fuel is more expensive than diesel fuel
5 Includes $10,000 for a solid waste audit
Implementing the following recommendations will enable the SCRD to reduce GHG emissions by 27 percent and achieve $188,500 in annual savings in energy costs.
Recommendations
1 Buildings and Miscellaneous Facilities
Explore, refine and incorporate energy and emissions reductions measures into existing capital projects, as de-•scribed in the table that follows and within section 3
The Sechelt Aquatic Centre is the highest priority for implementing the proposed reduction measures. with an •estimated 408 tonnes CO
2e in possible reductions. However, because this facility is new, energy projections (and
therefore energy consumption reductions) are estimates and actual implementation of the reduction initiatives at this facility cannot occur until all construction deficiencies, if any, are addressed and energy consumption patterns are firmly established.
xiii

Rank Account Account Address Capital Cost to Implement
Energy Costs Reduced
Simple Payback (years)
CO2e (tonnes) Reduced
1 Sechelt Aquatic Centre 55 0 0 S h o r n c l i f f e Avenue $559,600 $97,868 5.7 408
2 Gibsons and Area Aquatic Centre 951 Gibsons Way $79,775 $14,845 5.4 32
3 Pender Harbour Aquatic and Fit-ness Centre
13639 Sunshine Coast Hwy $363,627 $19,961 18.2 7
4 Administration Building 1975 Field Road $305,827 $17,078 12.8 6
5 Sunshine Coast Arena 5986 Shoal Ave $9,100 $2,474 3.7 6
6 Transit Building and Works Yard 5920 Mason Road $15,000 $1,864 8.0 5
7 Miscellaneous Buildings# various N/A $3,000 N/A 4
8 Gibsons and Area Community Centre# 700 Park Road N/A $1,106 N/A 1
TOTALS $1,332,929 $158,196 8.4 469
1 Eric Cardinal Hall; Granthams Landing Community Hall; Coopers Green Hall; Chaster House; Gibsons Fire Hall; Halfmoon bay VFD; Roberts Creek Fire Hall; Frank West Fire Hall and Community Hall; and, Edgmont and District Fire Hall
2 This is a new building and has been constructed to be as energy efficient as possible. Walkthrough audits did not reveal additional reduc-tion initiatives beyond a no cost ‘turn it off’ initiative in common areas and office space.
2 Outdoor Lighting
Incorporate dimmers and timers on overhead streetlights to reduce energy costs and associated emissions and •continue to keep apprised of costs associated with LED technologies to replace high pressure sodium and metal halide overhead street lights
3 Water and Wastewater
Ensure that the addition to the Chapman Creek Water Treatment Plant is as energy efficient as possible•
Increase the capital budget accordingly to accelerate the replacement of aging motors to take advantage of the •15 to 25 percent gain in efficiency of new motors
4 Vehicle Fleet
Propose a Board resolution to purchase fuel-efficient vehicles as a priority over price point •
Centralize the fleet to provide a consistent approach to vehicle purchases and allow the fleet manager to implement •policy that incorporates fuel efficiency into the purchasing and ongoing maintenance of vehicles. This initiative is to ensure that the fleet manager can integrate fuel efficiency with regular fleet maintenance
Increase the capital budget for the vehicle fleet to continuously improve the fuel efficiency of vehicles on their •re-placement schedules and to introduce new technologies to reduce fuel consumption
SUN
SHIN
E C
OA
ST R
EGIO
NA
L D
ISTR
ICT
CO
RPO
RATE
EN
ERG
Y A
ND
EM
ISSI
ON
S PL
AN
200
9
xiv

Undertake a number of programs to educate staff on methods to increase fuel efficiency. These programs include •energy aware driver training and promoting employee awareness ways to increase fuel efficiency while driving/operating vehicles
5 Recycling and Corporate Solid Waste
Increase the number of recycling receptacles and initiate a comprehensive recycling program at SCRD facilities so •that staff can recycle the same wastes that are recycled through the existing curbside recycling program
Implement an organics composting program at the Administration Building •
Initiate a solid waste audit at corporate facilities •
6 Community Energy Planning
Although not discussed in the body of the report, the SCRD should develop a region-wide community energy and •emissions plan and explore energy efficient construction standards for new and existing community buildings
Provincial Carbon Neutral Voluntary Commitment:If the Sunshine Coast Regional District Board endorsed the purchase of carbon credits to offset its corporate GHG emissions, this would require an Investment of $27,090 to reduce the carbon footprint to zero based on the 2008 emissions quantity of 1,806 tonnes CO
2e.
In 2018, if the reduction initiatives described in this report were successfully implemented, and the 2018 greenhouse gas emissions forecasts remain intact, it would cost the Sunshine Coast Regional District $19,680 to become carbon neutral.
xv
This page intentionally blank
SUN
SHIN
E C
OA
ST R
EGIO
NA
L D
ISTR
ICT
CO
RPO
RATE
EN
ERG
Y A
ND
EM
ISSI
ON
S PL
AN
200
9
xvi

Plan Development Process:
Acquire energy consump-1. tion data and direct GHG emissions dataIdentify accounts2. Develop draft energy and 3. GHG emissions inventoryConduct interviews and 4. walkthrough audits of buildings and engineering assetsDevelop the GHG emis-5. sions forecastDevelop the GHG emis-6. sions reduction initiativesDevelop the capital costs 7. for implementationDevelop the overall GHG 8. emissions reduction quan-tity
Introduction
The Sunshine Coast Regional District (SCRD) has demonstrated a commit-ment to addressing issues of climate change including policies and pro-grams relating to sustainable community development, energy efficiency and conservation, as well as greenhouse gas (GHG) emissions reductions. Establishing a current inventory of energy consumption and GHG emis-sions and developing reduction initiatives and an implementation strategy will support ongoing energy conservation and GHG emissions reductions management into the future.
In December 2007, the SCRD endorsed participation in the Federation of Canadian Municipalities (FCM) Partners for Climate Protection (PCP). Although this report complies with PCP inventory requirements, newly emerging international protocols are being introduced in the near future and the SCRD will need to update the inventory accordingly.
The SCRD has also chosen to sign the BC Climate Action Charter, which in part, is a voluntary commitment to work towards carbon neutral opera-tions by 2012. A Corporate Climate Change Plan with detailed reduction targets and reduction measures is the next step in order to fulfil ongoing voluntary requirements of both programs.
1.0 Plan Development ProcessThe development of this plan is follows a logical progression of steps that results in a strategy that is easy to follow and easy to repeat by SCRD staff in the future (see inset).
Hyla Environmental Services Ltd. (HES) was hired to develop an energy and emissions management plan. Staff from the Regional District assisted in the identification of energy consumption accounts and gathered all other energy consumption and direct emissions data. Forecasts of GHG emissions were estimated through discussions with staff and reduction initiatives were assigned to corporate assets after walkthorugh audits of buildings and engineering assets were undertaken. See section 1.9 for more details on the inventory development process.
1.1 Corporate ProgramsLocal government in B.C. have many reasons to develop corporate energy and emissions plans that extend beyond fiscal responsibility. Even in chal-lenging economic times, the social responsibilities of remaining sensitive to the impacts greenhouse gas emissions have on our changing climate is still front and centre.
There are two programs that are relevant to local government in B.C.: the Partners for Climate Protection Program; and, the Provincial Climate Action Charter.
1

Federation of Canadian Municipalities’ Partners for Climate Protection Milestones
Milestone One:
Complete GHG and energy use inventories and forecasts for both operations and the community as a whole (depending upon which plan(s) is being developed).
Milestone Two:
Set Reduction Targets. PCP tar-gets vary for each local govern-ment, but must be presented in a 10 year project period.
Milestone Three:
Develop a Management Plan. Develop a plan that sets out how emissions and energy use in local government operations and the community will be reduced.
Milestone Four:
Implement the Plan. Create strong collaborations between departments and maximize benefits from greenhouse gas reductions.
Milestone Five:
Monitor and Report Progress. Maintain support by monitoring, verifying, and reporting green-house gas reductions.
Partners for Climate Protection
The Partners for Climate Protection (PCP) is an umbrella initiative that fosters municipal participation in greenhouse gas emission reduction initiatives and overall sustainability. Its goal is to assist municipalities with their greenhouse gas management initiatives by providing tools and logistical support. The PCP initiative not only focuses on reducing existing greenhouse gas emissions, but also encourages municipalities to influence future greenhouse gas emissions at a community scale through a variety of mechanisms such as land use and transportation planning, building codes, and permitting. By participating in the PCP initiative, municipalities receive up-to-date information on global cli-mate change and important information regarding strategies to reduce greenhouse gas emissions, including innovative financing strategies and sample action plans. Participating municipalities also make a commit-ment to complete five milestones (see inset).
Climate Action Charter
The Climate Action Charter is a provincial initiative signed by the Prov-ince, the Union of BC Municipalities (UBCM) and local government in which signatories commit to a goal of becoming carbon neutral in cor-porate operations by 2012. Local governments pledge to measure and report their community’s greenhouse gas emissions profile and work to create compact, more energy efficient communities. The Climate Action Charter recognizes the need to take action on climate change and reduce greenhouse gas emissions and the important role that the Provincial Government and Local Governments can play in affecting change.
1.2 Corporate ProtocolsBeyond programs that local government can use as a framework to de-velop their own climate action strategies, protocols to calculate green-house gas (GHG) emissions must be adhered to so the inventories and the resulting action strategy is credible.
Emerging ICLEI Protocol
The Partners for Climate Protection is Canada’s implementation of ICLEI–Local Governments for Sustainability’s Cities for Climate Protec-tion (CCP). Although the FCM released a protocol for PCP inventories in the spring of 20081, new protocols for local government corporate and community inventories are emerging from ICLEI USA. These emerging protocols are more comprehensive than the existing PCP protocol since the later has historically focused on GHG emissions that were policy relevant to local government. For example, corporate inventories have focused on buildings and engineering assets owned and operated by local governments. Other emissions sources that have not been tracked in the past include presumably insignificant sources such as emissions from sanitary sewer collection pipes and fugitive emissions from refrig-eration systems.
1 FCM (2008), Developing Greenhouse Gas Emissions and Energy Con-sumption Inventories: A Standards and Guidance Document for Canadian Municipalities. Federation of Canadian Municipalities: Ottawa. 59pp.
SUN
SHIN
E C
OA
ST R
EGIO
NA
L D
ISTR
ICT
CO
RPO
RATE
EN
ERG
Y A
ND
EM
ISSI
ON
S PL
AN
200
9
2

New protocols will also add lower priority GHG emission sources such as emissions from employee travel on business, employee commute, contracted services such as solid waste collection and road building, and upstream and down-stream emissions from the purchase of supplies and materials. Although it will not be mandatory to report these emissions, local government will be encouraged to begin to establish internal tracking systems to be able to develop comprehensive, data rich GHG emissions inventories.
1.3 The Challenge of Climate Change and Clean Air PlanningThe SCRD has taken a multi-faceted approach to creating a lower-carbon economy, including energy efficient build-ing design. As the Regional District moves into the next phase of its corporate climate change plan, it faces new challenges, namely more aggressive GHG emissions reduction targets and rising energy costs. An important part of managing these new challenges is the ability to measure and evaluate the impacts of climate change across all sec-tors of its operations through a credible energy and GHG emissions inventory.
Environmental accounting for GHG inventories and ongoing management is becoming a critical component of corporate and community planning worldwide. The GHG inventory provides a starting point, essential in generat-ing relevant reduction measures to help guide the SCRD through the remainder of its GHG emissions management strategy. As well, SCRD staff must identify the economic implications of reducing those emissions.
1.4 Global Climate Change and Greenhouse Gas EmissionsThe global trend toward more aggressive greenhouse gas emission reduction targets will inevitably affect the amount of detail in climate change plans that local government develop. At the beginning of post-Kyoto climate change talks in Bali, Indonesia in 2007, to determine the global climate change regime after 2012, delegates have called for not only stricter GHG reduction targets but also stricter enforcement measures. The tougher stance on emission reductions echoes the G8 summit in Germany in June 2007, where leaders of the G8 nations introduced more aggressive targets for greenhouse gas emission reductions, agreeing to halve current levels by 2050.
The meeting of world leaders followed the release by the United Nations of its toughest critique on climate change in the Intergovernmental Panel on Climate Change (IPCC) 4th Assessment Report - Climate Change 2007. Written by over 2500 top scientists, the report concludes that there is “unequivocal” evidence that climate change is real and happening faster than expected. Notably, it calls on nations to increase their efforts in the areas of climate change adaptation, mitigation and technology.
At the federal level, the Canadian government has committed to taking ‘real action’ in its most recent climate change plan, setting GHG emission reductions at 20 percent by 2012 while imposing mandatory reduction targets on indus-try. To support efforts to reduce air pollution and greenhouse gas emissions, the Canada EcoTrust for Clean Air and Climate Change was introduced in February 2007 to co-fund with the provinces technology development, energy efficiency, and related projects.
British Columbia has received $199.2 million of the $1.5 billion in initial funding from the EcoTrust fund to put to-wards its provincial GHG reduction initiatives, which are some of the toughest in North America. Notably, BC is the first Canadian province to adopt California’s tough motor vehicle emissions reduction targets—30 percent by 2016. Together with thirty-nine U.S. states, nine Canadian provinces, six Mexican states, three native sovereign nations, and the District of Columbia, the province has become a founding member of the North American Climate Registry, a greenhouse gas emissions reporting system.
The province of British Columbia continues to take a national leadership role on climate change with the introduction of the British Columbia Climate Action Charter. Municipal signatories to the charter have agreed to achieve carbon neutral operations by 2012, measure and report GHG emissions and develop energy efficient building, transit, and energy projects (see section 1.1).
The stepped up actions on emission reductions at the global and regional levels have direct implications for local governments whose emission reduction initiatives are a key part of the global climate change solution. The Govern-ment of Canada can play an important role by providing strong leadership to ensure that any federal plan speaks to actions that can be implemented at the local level. These actions will be further supported by direct funding for the development of GHG reduction projects, conservation efforts and educational programs.
3
Since the signing of the United Nations Framework Convention on Climate Change in 1992, countries have worked toward meeting the GHG emission reduction targets set at the first Earth Summit in Rio de Janeiro, Brazil. Under the Kyoto Protocol--the agreement that sets out the targets and options available to countries to achieve them--Canada’s target is to reduce its GHG emissions to six percent below 1990 levels in the period 2008 to 2012.
1.5 Local Benefits of Reducing GHG EmissionsAlthough the co-benefits of reducing energy use and greenhouse gases are varied and dependent upon the man-ner in which energy is consumed, a managed approach to implementation of reduction measures will have positive effects on air pollution, job creation, and energy expenditures.
For local government, reducing operating costs, improving public transit and traffic mobility, enhancing open spaces, improving livability and promoting local economic development are additional co-benefits when implementing greenhouse gas emission action plans. Many of the strategies that reduce greenhouse gas emissions affect other cost and livability factors throughout the community at large. For example, less money spent on electricity and fuel costs translates into more disposable income available to the local economy and potentially lower tax increases.
Reducing greenhouse gas emissions has the additional benefit of reducing particulate matter, nitrous oxides, sulphur oxides and volatile organic compounds–all common air contaminants that contribute to the degradation of air qual-ity.
1.6 Regional and Local ContextStretching from Port Mellon to Earls Cove, the Sunshine Coast Regional District (SCRD) provides regional government services to nearly 28,000 residents. There are five electoral areas in the Regional District, and three municipalities as follows: Area A - Egmont/Pender Harbour; Area B - Halfmoon Bay; Area D - Roberts Creek; Area E - Eliphinstone; Area F - West Howe Sound; District of Sechelt; Sechelt Indian Government District; and, Town of Gibsons.
1.7 Inventory and Plan Preparation Process and MethodsBy joining the PCP initiative, municipalities make a voluntary commitment to complete 5 milestones (see inset page 2). In order to implement an effective strategy to reduce greenhouse gas emissions it is necessary to develop an in-ventory of the emissions. In its absence, local government lack a starting point from which progress can be measured. Further, they will not be able to forecast future emissions and predict the benefits of proposed reduction measures.
The emissions inventory provides an analysis for all activities and operations that consume energy. This report pertains to the corporate emissions and related reduction initiatives only. The base year emissions quantity is 2008 and the project period is from 2010 to 2017 with the energy and emissions forecast extending to 2018. A review of emissions by sector allows an analysis of the activity or operation responsible for various emissions. Corporate emis-sions by sector include those resulting from buildings, fleet vehicles and other motorized equipment, street lighting, potable water, storm and sanitary sewers, and solid waste generated at facilities.
A review of emissions by source allows an analysis of the origin of various emissions. The origin of the emission is attributed to the type of fuel burned while carrying out the activity or operation. Major sources of greenhouse gas emissions include electricity, natural gas, propane, diesel fuel, and gasoline. Greenhouse gases are emitted as these fuels are burned. Methane from the decomposition of waste in landfills is also a major source of greenhouse gas emissions, but is a direct emission, as apposed to the emissions from burning fossil fuels.
From the energy consumed by various local government operations, the mass of greenhouse gas emissions are cal-culated. This information forms the data from which the overall program goal is derived, and upon which evaluation of progress can be measured in the future. Local government staff assisted with the collection of energy consump-tion data.
The SCRD’s electricity provider, BC Hydro, provided consumption data for accounts owned by the SCRD. Terasen Inc. provided consumption data and costs for consumption of natural gas for the inventory year of 2008. Vehicle fleet data was compiled from internal records while solid waste generated from operations was derived from the volume of bins at corporate facilities and the frequency of pick-up of the bins.
SUN
SHIN
E C
OA
ST R
EGIO
NA
L D
ISTR
ICT
CO
RPO
RATE
EN
ERG
Y A
ND
EM
ISSI
ON
S PL
AN
200
9
4

Figure 1.6 – Local Context for the Sunshine Coast Regional District, British Columbia
5

Data was imported into the Energy and Emissions module of Hyla Environmental Services Ltd.’s Energy & Emissions Monitoring and Reporting System™. The emissions calculator within this software conforms to the methods de-scribed in the International Panel on Climate Change Greenhouse Gas Inventory Reference Manual2, the principles provided in the International Standards Organization (ISO) Draft International Standard for Greenhouse Gases3, and the general guidance within the FCM’s guidance document for the preparation of PCP inventories. Emissions coef-ficients are found in the IPCC document for liquid and gaseous fuels.
The emissions factor for BC Hydro-supplied electricity for the year 2007 has been used to calculate GHG emissions (0.022 kg CO
2e/kWh) because the emissions factor for 2008 is not yet available from BC Hydro.
Energy and emissions are calculated at the account level (e.g., an asset that consumes energy, such as a building or pumping facility, represents an account in the software). A detailed summary of the energy and emissions inventory is provided in Appendix I. The emissions forecast is accomplished using estimates of growth in each sector that will be provided by staff and discussed amongst the project team. Energy costs were estimated by price projections from Nesbitt Burns (http://www.bmonesbittburns.com/default.asp) and the US Energy Agency’s Fuel Economy website (http://www.fueleconomy.gov/).
Forecasting Energy Consumption and Emissions Overview
In order for this report to be recognized by the PCP Secretariat as fulfilling Milestone One of the PCP program, a forecast must be developed 10 years subsequent to the base year inventory. Accordingly, a forecast was estimated based on anticipated changes to individual accounts or new accounts that will be added during the ten year forecast period. The forecast was derived from HES’ interviews with staff. The emissions forecast is presented in the sections for each sector.
Forecasts and Their Contribution to Reduction Targets
The forecasts of energy consumption, costs, and GHG emissions is the projected growth in these parameters from the base year through to the forecast period. Forecasts allow us to understand future energy consumption, costs of con-sumption, and emissions. As stated earlier, the forecast is an essential component of the calculation of the reduction targets. However, forecasts should be considered a work in progress as new information can change the forecast and therefore the reduction targets. Since all the parameters used to calculate the reduction targets are subject to change, targets are essentially ‘moving’ as new information is gathered.
The reduction target is equal to the percent difference between the base year inventory and the forecast year inven-tory. Since reduction targets are absolute and not based on per capita emissions, to achieve an actual reduction, the total reductions achieved during the project period must be greater than the growth in emissions.
Regardless of any overall increase in emissions during the project period, implementing reduction initiatives will, at a minimum, decrease the amount of growth in emissions if the business as usual scenario is allowed to continue. The reduction initiatives that the Regional District selected are summarized in the sections for each sector.
The Reduction Quantity and Reduction Measures
To calculate the overall reduction quantity contained in this report, reduction initiatives have been selected that reduce energy consumption and greenhouse gas emissions from the existing infrastructure (i.e., base year energy and emissions).
Although reduction amounts are considered estimates, careful consideration has been given to the effect each reduction initiative will have on energy consumption. For each sector, the GHG reductions estimated for each reduc-tion initiative have been calculated based on HES’ estimates of the reductions that may result from implementation of various measures in the buildings, lighting, water and wastewater, and vehicle fleet sectors.
Estimates of reduction quantities are provided for energy consumption, cost for consumption, and GHG emissions. Each reduction initiative for each building and/or engineering asset is listed in the Technical Compendium of Poten-tial Reduction Initiatives and summarized herein.
2 IPCC (2006), IPCC Guidelines for National Greenhouse Gas Inventories, Prepared by the National. Greenhouse Gas Inventories Programme, Eggleston H.S., Buendia L., Miwa K., Ngara T. and Tanabe K. (eds). Published: IGES, Japan. 3 ISO (2006), Draft International Standard ISO/TC 207 WG5 N162. Greenhouse Gases - Part 1: Specification with guidance at the organization level for quantification and reporting of greenhouse gas emissions and removals. 28pp.
SUN
SHIN
E C
OA
ST R
EGIO
NA
L D
ISTR
ICT
CO
RPO
RATE
EN
ERG
Y A
ND
EM
ISSI
ON
S PL
AN
200
9
6
A Technical Compendium of Potential Reduction Initiatives has been provided to staff that lists all the reduction initia-tives that have been applied to each account in the energy inventory. Reduction measures are not appropriate for some very small accounts (e.g., pumps that consume <5,000 kWh/year). For other accounts, there are no reduction initiatives that are possible (e.g., flat rate accounts for irrigation systems with existing rain sensors and timers). Within this document, accounts are grouped in the same manner in which they appear in the detailed energy and emissions inventory presented in Appendix I. Estimates of energy, costs for energy, and greenhouse gas emission reductions are provided for each reduction initiative for each account. Further, capital costs, simple payback, and costs per kilotonne reduced is also provided in the compendium. Staff must refer to the compendium to review the specific reduction initiatives that have been applied to individual accounts.
Report Organization
1 Introduction
2 Corporate Inventory
3 Buildings
4 Outdoor Lighting
5 Water and Wastewater
6 Vehicle Fleet
7 Corporate Solid Waste
8 Summary
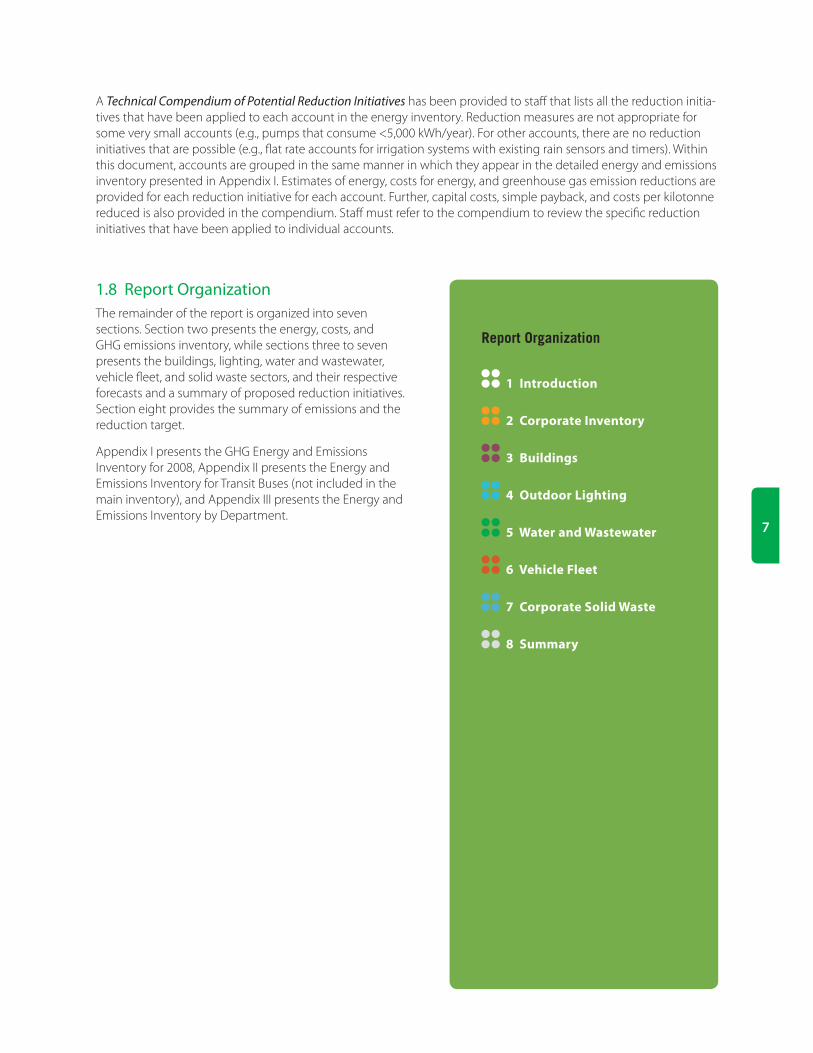
1.8 Report OrganizationThe remainder of the report is organized into seven sections. Section two presents the energy, costs, and GHG emissions inventory, while sections three to seven presents the buildings, lighting, water and wastewater, vehicle fleet, and solid waste sectors, and their respective forecasts and a summary of proposed reduction initiatives. Section eight provides the summary of emissions and the reduction target.
Appendix I presents the GHG Energy and Emissions Inventory for 2008, Appendix II presents the Energy and Emissions Inventory for Transit Buses (not included in the main inventory), and Appendix III presents the Energy and Emissions Inventory by Department.
7

This page intentionally blank
SUN
SHIN
E C
OA
ST R
EGIO
NA
L D
ISTR
ICT
CO
RPO
RATE
EN
ERG
Y A
ND
EM
ISSI
ON
S PL
AN
200
9
8
PROTOCOL FOLLOWED
The greenhouse gas emissions inventory con-tained in this report is based on current Federation of Canadian Municipalities’ Partners for Climate Protection protocols. Emerging guidance from the Province of BC may be more comprehensive and contain inventory information that has not been included in PCP inventories in the past.
2 Corporate Inventory
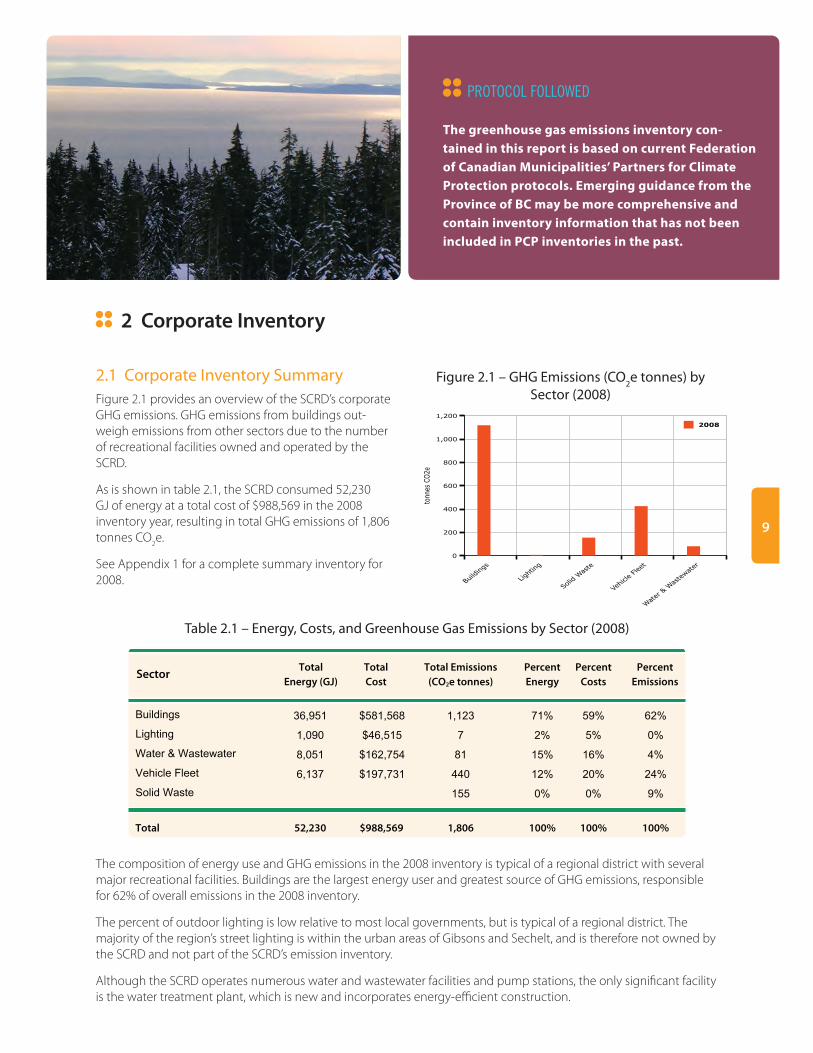
2.1 Corporate Inventory SummaryFigure 2.1 provides an overview of the SCRD’s corporate GHG emissions. GHG emissions from buildings out-weigh emissions from other sectors due to the number of recreational facilities owned and operated by the SCRD.
As is shown in table 2.1, the SCRD consumed 52,230 GJ of energy at a total cost of $988,569 in the 2008 inventory year, resulting in total GHG emissions of 1,806 tonnes CO
2e.
See Appendix 1 for a complete summary inventory for 2008.
Figure 2.1 – GHG Emissions (CO2e tonnes) by Sector (2008)
Build
ings
Ligh
ting
Solid
Was
te
Vehi
cle
Flee
t
Wat
er &
Was
tewat
er
0
200
400
600
800
1,000
1,200
tonnes
CO
2e
2008
Table 2.1 – Energy, Costs, and Greenhouse Gas Emissions by Sector (2008)
Total Emissions(CO2e tonnes)
TotalEnergy (GJ)
TotalCost
PercentEnergy
PercentCosts
SectorPercent
Emissions
36,951 $581,568 1,123Buildings 71% 59% 62%
1,090 $46,515 7Lighting 2% 5% 0%
8,051 $162,754 81Water & Wastewater 15% 16% 4%
6,137 $197,731 440Vehicle Fleet 12% 20% 24%
155Solid Waste 0% 0% 9%
100% 100% 100%Total 52,230 $988,569 1,806
The composition of energy use and GHG emissions in the 2008 inventory is typical of a regional district with several major recreational facilities. Buildings are the largest energy user and greatest source of GHG emissions, responsible for 62% of overall emissions in the 2008 inventory.
The percent of outdoor lighting is low relative to most local governments, but is typical of a regional district. The majority of the region’s street lighting is within the urban areas of Gibsons and Sechelt, and is therefore not owned by the SCRD and not part of the SCRD’s emission inventory.
Although the SCRD operates numerous water and wastewater facilities and pump stations, the only significant facility is the water treatment plant, which is new and incorporates energy-efficient construction.
9

2.2 Inventory by SectorConsumption by Sector
The buildings sector consumed the most energy at 36,951 GJ (71 percent), followed by the water and wastewater sector at 8,051 GJ (15 percent). The vehicle fleet consumed 6,137 GJ (12 percent), while outdoor lighting accounted for 1,090 GJ (two percent).
Illustrations of energy consumption, costs and greenhouse gas emissions by sector allow for a quick visualization of which sec-tors consume the majority of energy, incur the most costs for energy, and whose operations result in the majority of greenhouse gas emissions.
Although these types of illustrations direct attention to the larger pieces of the pie, reduction initiatives are not always practically applied relative to these proportions. Sections three through seven outline prac-tical reduction initiatives that are possible in each sector.
Figure 2.2.1 – Consumption by Sector
36,951 GJ(70.7%)
1,090 GJ(2.1%)
6,137 GJ(11.8%)
8,051 GJ(15.4%)
Buildings
Lighting
Vehicle Fleet
Water & Wastewater
Costs by Sector
The buildings sector had the highest energy costs at $581,568 (59 percent), followed by the vehicle fleet at $197,731 (20 percent). Energy costs for water and wastewater and outdoor lighting were $162,754 (16 percent) and $46,515 respectively (five percent). See figure 2.2.2
Figure 2.2.2 – Costs by Sector
$581,568 (58.8%)
$46,515 (4.7%)
$197,731 (20.0%)
$162,754 (16.5%)
Buildings
Lighting
Vehicle Fleet
Water & Wastewater
SUN
SHIN
E C
OA
ST R
EGIO
NA
L D
ISTR
ICT
CO
RPO
RATE
EN
ERG
Y A
ND
EM
ISSI
ON
S PL
AN
200
9
10

Emissions by Sector
Together, the buildings sector and the fleet sector were responsible for approximately 86 percent of all emissions at 1,123 tonnes CO
2e and 440
tonnes CO2e respectively. Solid waste, water and wastewater, and outdoor
lighting followed with 155 tonnes CO2e, 81 tonnes CO
2e and 7 tonnes
CO2e respectively.
Figure 2.2.3 – GHG Emissions by Sector
1,123 t(62.2%)
7 t(0.4%)
440 t(24.4%)
81 t(4.5%)
155 t(8.6%)
Buildings
Lighting
Vehicle Fleet
Water & Wastewater
Solid Waste
2.3 Inventory by Energy TypeAs is shown in table 2.3.1, the SCRD consumes six types of energy: electricity, natural gas, fuel oil, propane, gasoline and diesel fuel (note: propane is listed for buildings as ‘propaen’ and for vehicle fleet as ‘Mbl Propane’).
Table 2.3.1 – Sources of Corporate Energy & Costs (2008)T 2.1 T 2.1.4 T 2.1.5
100%
49%
Total 100%
EnergyType
TotalEnergy (GJ)Total Use Total CostUnits
Percent TotalEnergy by Source
Percent TotalCosts by Source
52,230 $988,569
$496,4767,096,344kWh 25,547
$285,07020,251GJ 20,251
$1,9011,584litres 61
$108,47394,468litres 3,274
$84,97270,511litres 2,727
9,238litres 234 $7,390
5,358litres 136 $4,286
Electricity
NaturalGas
FuelOil
Gasoline
Diesel Fuel
Propane
PropaneMbl
39%
0%
0%
6%
5%
0%
50%
29%
0%
1%
11%
9%
0%
11
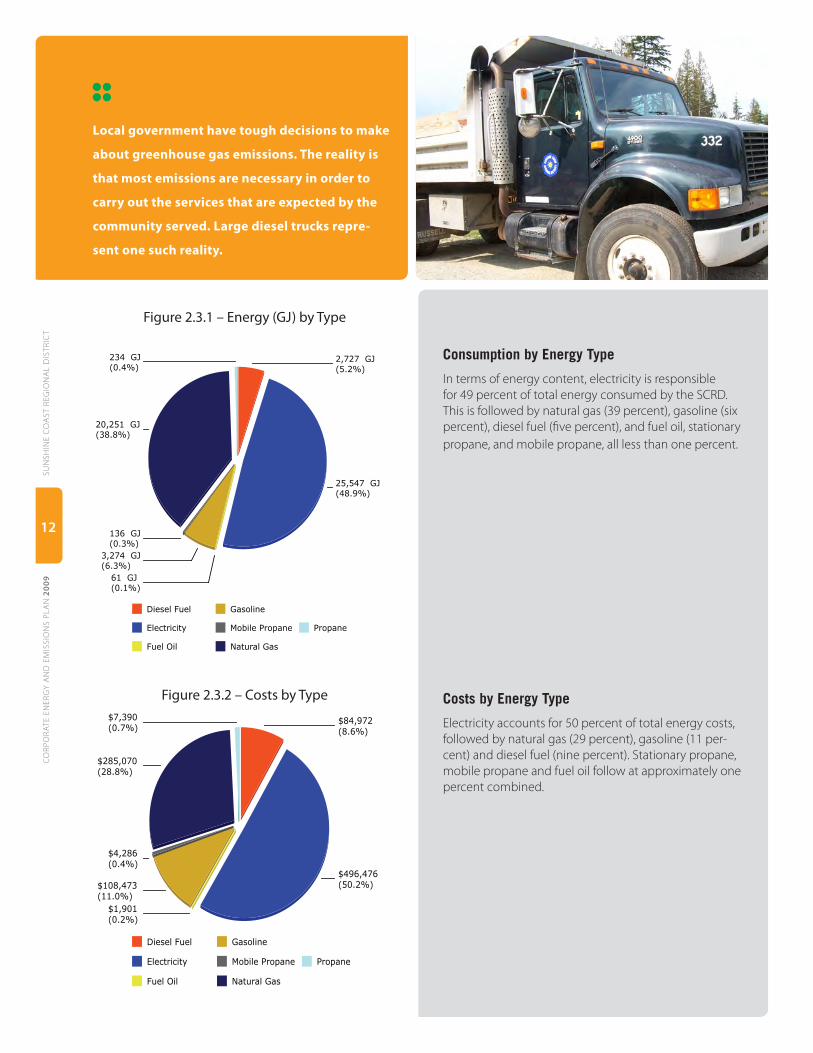
Local government have tough decisions to make
about greenhouse gas emissions. The reality is
that most emissions are necessary in order to
carry out the services that are expected by the
community served. Large diesel trucks repre-
sent one such reality.
Figure 2.3.1 – Energy (GJ) by Type
2,727 GJ(5.2%)
25,547 GJ(48.9%)
61 GJ(0.1%)
3,274 GJ(6.3%)
136 GJ(0.3%)
20,251 GJ(38.8%)
234 GJ(0.4%)
Diesel Fuel
Electricity
Fuel Oil
Gasoline
Mobile Propane
Natural Gas
Propane
Figure 2.3.2 – Costs by Type
$84,972 (8.6%)
$496,476 (50.2%)
$1,901 (0.2%)
$108,473 (11.0%)
$4,286 (0.4%)
$285,070 (28.8%)
$7,390 (0.7%)
Diesel Fuel
Electricity
Fuel Oil
Gasoline
Mobile Propane
Natural Gas
Propane
Consumption by Energy Type
In terms of energy content, electricity is responsible for 49 percent of total energy consumed by the SCRD. This is followed by natural gas (39 percent), gasoline (six percent), diesel fuel (five percent), and fuel oil, stationary propane, and mobile propane, all less than one percent.
Costs by Energy Type
Electricity accounts for 50 percent of total energy costs, followed by natural gas (29 percent), gasoline (11 per-cent) and diesel fuel (nine percent). Stationary propane, mobile propane and fuel oil follow at approximately one percent combined.
SUN
SHIN
E C
OA
ST R
EGIO
NA
L D
ISTR
ICT
CO
RPO
RATE
EN
ERG
Y A
ND
EM
ISSI
ON
S PL
AN
200
9
12

Sources of Corporate Emissions
The greatest source of emissions in 2008 was from the combustion of natural gas (57 percent of total emissions), followed by gasoline (13 percent), diesel fuel (11 percent), solid waste (nine percent) and electricity (nine percent). Stationary propane, mobile propane and fuel oil produce less than one percent of the SCRD’s total emissions. Table 2.3.3 and the accompanying illustration show the contribution of each major energy source to total emissions.
Table 2.3.3 – Sources of Corporate Emissions (2008)
9%
Total 100%1,805.7
7,096,344kWh 156.1
20,251GJ 1,035.8
1,584litres 4.5
94,468litres 235.9
70,511litres 196.0
9,238litres 14.2
5,358litres 8.1
Electricity
Natural Gas
Fuel Oil
Gasoline
Diesel Fuel
Propane
PropaneMbl
57%
0%
1%
13%
11%
0%
Solid Waste 155.0 9%
EnergyType
Total UseUnitsTotal Emissions(CO2e tonnes)
Percent bySource
T 2.1 T 2.1.4 T 2.1.5
Figure 2.3.3 – GHG Emissions (tonnes CO2e) by Type
196 t(10.9%)
156 t(8.6%)
4 t(0.2%)
236 t(13.1%)
8 t(0.4%)
1,036 t(57.4%)
14 t(0.8%)
155 t(8.6%)
Diesel Fuel
Electricity
Fuel Oil
Gasoline
Mobile Propane
Natural Gas
Propane
Solid Waste
13

3 Buildings
3.1 Buildings OverviewThe SCRD owns 29 buildings across the district. The total energy consumed in all buildings in 2008 was 36,951 GJ, which is shared by four energy types: electricity (17,106 GJ), natural gas (19,550 GJ), propane (234 GJ) and fuel oil (61 GJ). This resulted in energy costs of $581,568 and total emissions of 1,123 tonnes CO
2e (Table 3.1.1). Table 3.1.2 ranks
the top ten energy consumers in the buildings sector.
In 2008, the SCRD acquired the Gibsons and Area Aquatic Facility and the Sechelt Aquatic Centre, and a new facility, the Gibsons and Area Community Centre, began operations. Each of these facilities represents a significant addition to the SCRD’s emissions inventory. Section 3.2 presents an emissions inventory forecast that includes the energy consumption and emissions from these facilities.
Table 3.1.1 – Summary of Buildings Sector Emissions (2008) T 2.1 T 2.1.4 T 2.1.5
36,951 $581,568 1,123
$299,4664,751,566kWhElectricity 17,106 104.5
$272,81119,550GJNatural Gas 19,550 1,000.0
$1,9011,584litres 61 4.5FuelOil
Propane 9,238litres 234 $7,390 14.2
Buildings
Sector
Totals
Energy Type& Units
Total Energy(GJ)
TotalCO2e (t)
TotalCosts
Total Use Fuel Efficiency
Table 3.1.2 – Buildings Ranked by Energy Consumption (2008)
2008
: Top Energy ConsumersBuildings CO2eCostsEnergy
Sechelt Aquatic Centre - 5500 Shorncliffe Avenue 16,829 GJ $234,590 664.6 t
Gibsons And Area Community Centre - 700 Park Rd Ice 6,008 GJ $96,030 118.8 t
Gibsons And Area Aquatic Facility - 951 Gibsons Way 4,135 GJ $61,840 184.0 t
Sunshine Coast Arena - 5986 Shoal Way 3,093 GJ $53,503 49.0 t
Pender Harbour Aquatic And Fitness Centre - 13639 Sunshine Coast
Highway
1,990 GJ $32,441 12.2 t
Administration Building - 1975 Field Rd 1,719 GJ $31,703 10.5 t
Transit Building And Works Yard - 5920 Mason Rd 1,159 GJ $23,945 31.1 t
Gibsons Fire Hall - 790 North Rd 354 GJ $7,535 10.3 t
Parks Hut - 5920 Mason Rd 222 GJ $4,447 10.3 t
Halfmoon Bay Fire Hall - 8972 Redrooffs Rd 213 GJ $4,823 1.3 t
Eric Cardinal Hall - Shirley Macey Park Chamberlin Rd 192 GJ $3,931 8.0 t
Roberts Creek Fire Hall - 1302 Roberts Creek Rd 176 GJ $3,996 1.1 t
Sechelt Landfill - 4901 Dusty Road 168 GJ $4,643 10.2 t
Katherine Lake Campground - Garden Bay Rd 109 GJ $2,582 0.7 t
Chaster House - 1549 Ocean Beach Esp 85 GJ $2,066 4.7 t
Granthams Landing Community Hall - 846 Church Rd 73 GJ $1,689 0.4 t
Frank West Fire Hall - 1226 Chaster Rd 62 GJ $1,457 0.4 t
Coopers Green Hall - Redrooffs Rd P164l 56 GJ $1,313 0.3 t
Gibsons And Area Community Centre - 700 Park Rd Temp 43 GJ $951 0.3 t
Frank West Hall - 1224 Chaster Rd 40 GJ $945 0.2 t
Halfmoon Bay Fire Hall Satellite Station - 7884 Fawn Rd 36 GJ $699 0.2 t
Egmont And District Fire Hall Temporary Account - 5592 Egmont Rd 35 GJ $857 0.2 t
1
2
3
4
5
6
7
8
9
10
2007 Rank
Account Energy Costs CO2e
SUN
SHIN
E C
OA
ST R
EGIO
NA
L D
ISTR
ICT
CO
RPO
RATE
EN
ERG
Y A
ND
EM
ISSI
ON
S PL
AN
200
9
14
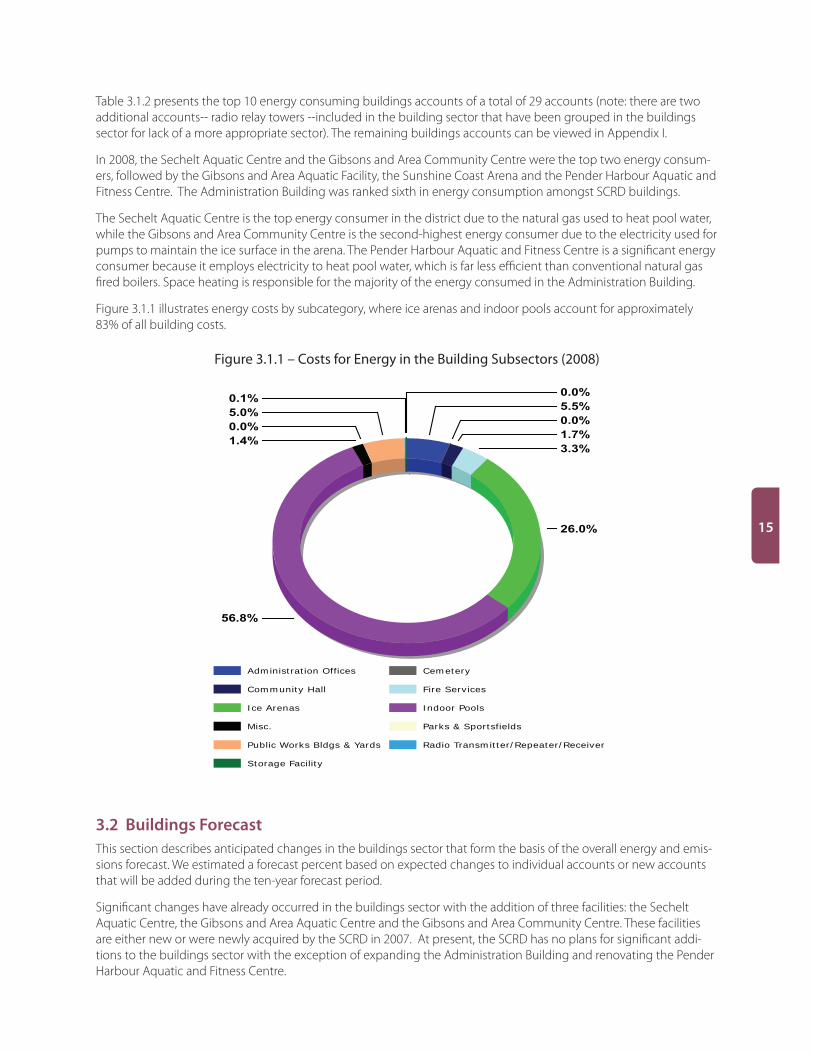
Table 3.1.2 presents the top 10 energy consuming buildings accounts of a total of 29 accounts (note: there are two additional accounts-- radio relay towers --included in the building sector that have been grouped in the buildings sector for lack of a more appropriate sector). The remaining buildings accounts can be viewed in Appendix I.
In 2008, the Sechelt Aquatic Centre and the Gibsons and Area Community Centre were the top two energy consum-ers, followed by the Gibsons and Area Aquatic Facility, the Sunshine Coast Arena and the Pender Harbour Aquatic and Fitness Centre. The Administration Building was ranked sixth in energy consumption amongst SCRD buildings.
The Sechelt Aquatic Centre is the top energy consumer in the district due to the natural gas used to heat pool water, while the Gibsons and Area Community Centre is the second-highest energy consumer due to the electricity used for pumps to maintain the ice surface in the arena. The Pender Harbour Aquatic and Fitness Centre is a significant energy consumer because it employs electricity to heat pool water, which is far less efficient than conventional natural gas fired boilers. Space heating is responsible for the majority of the energy consumed in the Administration Building.
Figure 3.1.1 illustrates energy costs by subcategory, where ice arenas and indoor pools account for approximately 83% of all building costs.
Figure 3.1.1 – Costs for Energy in the Building Subsectors (2008)
5.5%
0.0%
1.7%
3.3%
26.0%
56.8%
1.4%
0.0%
5.0%
0.1%0.0%
Administration Offices Cemetery
Community Hall Fire Services
Ice Arenas Indoor Pools
Misc. Parks & Sportsfields
Public Works Bldgs & Yards Radio Transmitter/Repeater/Receiver
Storage Facility
text
3.2 Buildings ForecastThis section describes anticipated changes in the buildings sector that form the basis of the overall energy and emis-sions forecast. We estimated a forecast percent based on expected changes to individual accounts or new accounts that will be added during the ten-year forecast period.
Significant changes have already occurred in the buildings sector with the addition of three facilities: the Sechelt Aquatic Centre, the Gibsons and Area Aquatic Centre and the Gibsons and Area Community Centre. These facilities are either new or were newly acquired by the SCRD in 2007. At present, the SCRD has no plans for significant addi-tions to the buildings sector with the exception of expanding the Administration Building and renovating the Pender Harbour Aquatic and Fitness Centre.
15

Table 3.2.1 provides an overall forecast for energy consumption in the buildings sector. Insignificant volumes of fuel oil, diesel fuel for generators and propane consumed in the buildings sector do not form part of the forecast. A nomi-nal growth in emissions (0.5 percent per year) has been included for energy consumption to account for extended hours of operation in buildings over time.
Table 3.2.1 – Predicted Buildings Growth
Sector Deletions and Additions from 2008 to 2018
BuildingsAdministration Building (70,000 kWh, 150 GJ Nat Gas)
Pender Harbour Aquatic and Fitness Centre (100,000 kWh Electricity)
Nominal increases for electricity and natural gas consumption were added to the forecast for the planned expan-sion of the Administration Building and an increase in electricity was added to the forecast for the renovation of the Pender Harbour Aquatic and Fitness Centre.
Table 3.2.2 – Forecast of Buildings Consumption
Energy Type/Unit Consumption Energy
(GJ)Forecasted
ConsumptionForecasted
Percent Forecasted Energy (GJ)
Forecasted Total Energy
(GJ)2008 2018
Electricity (kWh) 4,751,566 17,106 4,989,144 105 % 17,961 38,489
Nat Gas (GJ) 19,550 19,550 20,527 105 % 20,528
Local governments are paying particular attention to forecasts of energy costs to help them better prepare for future budgets. Although it is difficult to predict future energy costs, these costs will certainly increase during the forecast period. Conservative estimates of energy cost increases are provided. Table 3.2.2 provides a forecast of projected energy consumption to 2018. Table 3.2.3 provides a forecast of projected costs for energy consumption to 2018.
Table 3.2.3 – Forecast of Buildings Costs
Energy Type/Unit Consumption Unit cost Costs Forecasted
ConsumptionForecasted
Unit cost Forecasted
CostsForecasted Total Costs
2008 2018
Electricity (kWh) 4,751,566 $0.061 $299,466 4,989,144 $0.08 $399,132 $707,044
Nat Gas (GJ) 19,550 $12 $272,811 20,528 $15 $307,913
SUN
SHIN
E C
OA
ST R
EGIO
NA
L D
ISTR
ICT
CO
RPO
RATE
EN
ERG
Y A
ND
EM
ISSI
ON
S PL
AN
200
9
16

Table 3.2.4 – Forecast of Buildings GHG Emissions
Energy Type/Unit
Emissions CO2e (t) Total CO2e (t) Forecasted Emissions
CO2e (t)Total Emissions
CO2e (t)
2008 2018
Electricity (kWh) 104
1,119
110
1,175Nat Gas (GJ) 1,000 1,050
other sources 15 15
Based on predicted increases from 2008 to 2018, energy consumption is forecast to increase from 36,656 GJ to 38,489 GJ. Incorporating the cost per unit of energy into the forecast, energy costs are expected to increase from $572,277 to $707,044 and GHG emissions are forecast to increase from 1,120 tonnes CO
2e to 1,175 tonnes CO
2e, an increase of 5
percent.
3.3 Reduction InitiativesThere are many ways for the SCRD to reduce energy consumption and related GHG emissions in regional district-owned buildings. Beyond the specific reduction initiatives proposed for the buildings evaluated, awareness programs such as ‘turn it off’ should also be implemented.
The following subsections summarize the potential energy reduction initiatives for the highest energy-consuming buildings in the SCRD. See the Technical Compendium of Reduction Initiatives for a detailed listing of reduction initia-tives.
Initiatives Completed and/or Underway
Rooftop units in most buildings have been upgraded and/or replaced over time, although it is difficult to track the resulting energy reductions. Most buildings have had T12 fluorescent fixtures replaced with T8 fixtures and most magnetic ballasts have been upgraded to electronic ballasts. As expected, smaller, older buildings have not been retrofitted.
Proposed Reduction Initiatives
Table 3.3.1 shows the estimated reductions in energy use, energy costs and GHG emissions for the proposed reduc-tion initiatives (as approved by the Board on an annual basis).
Table 3.3.1 – Proposed Reduction Initiatives in the Buildings SectorReduction Measures Affecting Base Year Energy/Emissions
BuildingsConsumption CO2e (t)
Annual Savings
Costs Three Years Seven Years
Simple Payback Period
Five Years
10,746 GJ 468 t$158,416TOTAL THIS SECTOR:
SUBTOTALS 511,503 kWh8,868 GJ
$37,830 11 t$119,628 454 t
956 L $958 3 tFuel OilNatural GasElectricity $113,491
$358,884$2,875
$189,151$598,139$4,791
$264,812$837,395$6,707
17

It is estimated that approximately 11,000 GJ of energy can be saved by implementing building retrofits, resulting in energy savings of approximately $158,000. These initiatives would also reduce emissions by approximately 469 tonnes CO
2e (Note: due to rounding errors, table 3.3.1 reflects a total annual CO
2e savings of 468 t, whereas we report 469
tonnes throughout the remainder of the report).
Technology
Technology will play an important role in the actual reductions achieved during the project period. The rate of intro-duction of new technologies that increase energy efficiency -- and the availability of alternative energy sources and new technologies for energy production -- are key to achieving significant reductions in the future.
Generally, reduction initiatives do not include technologies that are not commercially viable today or that are not cur-rently cost effective.
The remainder of this section describes the results of the walk-through building audits. Each subsection summarizes the estimates of the annual energy consumption, energy costs and CO
2e savings that would result from implement-
ing the reduction measures. Capital costs and simple payback are also provided. This information is also summarized in table 3.5 and ranked by the quantity of CO
2e reduced. See the Technical Compendium of Reduction Initiatives for a
detailed listing of reduction initiatives.
Administration Building
The Administration Building only consumes electricity but would benefit from ground-source heat pumps to reduce inefficient rooftop units that are currently being used to heat and cool the building. Since an expansion of the Admin-istration Building is proposed, ground-source heat pumps should be evaluated as part of the design. A heat recovery ventilator is proposed and there is a small opportunity to reclaim heat from the server room. Solar power for domestic hot water and heating is possible and should also be explored as part of the expansion design. The estimated cost to implement reduction initiatives is ~$306,000 with a simple payback period of 13 years (see table 3.5).
Reduction Measures Affecting Base Year
Buildings 2008 - All
Administration Offices
Administration Building -1975 Field Rd
249,106 kWh $17,078 5.5
Consumption CO2e (t)
Reductions
Costs Simple Payback
(yrs)Capital Cost Ph
Affect on 2ndary Energy
Type
Cost per Kt
reduced749,663 $45,149kwh
2008 Electricity Consumption and Estimates of Reductions
16
Consumption CO2e (t)Costs
2008 Inventory
‘TURN IT OFF ‘PROGRAM1. 47,758 $3,274 1.1kWh $0 $0.0 Yes
CHANGE HEAT PUMP REFRIGERANT2. 0 $0 0.0kWh $0 $0.0 Yes
GEOEXCHANGE SYSTEM3. -76,413 $-5,239 -1.7kWh $0 $0.0 Yes
AUTO COMPUTER SHUTDOWN4. 3,152 $216 0.1kWh 1.2$250 $3.6 Yes
SOLAR HEATING - HOT WATER5. 23,879 $1,637 0.5kWh 2.1$3,500 $6.7 Yes
HEAT RECOVERY VENTILATOR6. 83,577 $5,730 1.8kWh 3.8$21,801 $11.9 Yes
GEOEXCHANGE SYSTEM7. 167,153 $11,459 3.7kWh 24.5$280,276 $76.2 Yes
ELECTRICITY SUBTOTAL 249,106 kWh $17,078 5.5 t
897 GJ 5.5 t$17,078
17.9$305,827
249,106 kWh $17,078 5.5 tElectricity
897 GJ 5.5 t$17,078
ACCOUNT SUBTOTAL 17.9$305,827
249,106 kWh $17,078 5.5 tElectricity
897 GJ 5 t$17,078
SUBCATEGORY TOTAL
1All
SUN
SHIN
E C
OA
ST R
EGIO
NA
L D
ISTR
ICT
CO
RPO
RATE
EN
ERG
Y A
ND
EM
ISSI
ON
S PL
AN
200
9
18

Sechelt Aquatic Centre
Implementing the proposed reduction measures at the Sechelt Aquatic Centre is the highest priority, as these initia-tives will result an estimated reduction of 408 tonnes CO
2e. Because this facility is new, energy projections (and there-
fore energy consumption reductions) are rough estimates. Actual implementation at this facility cannot occur until all construction deficiencies, if any, are addressed and energy consumption patterns are firmly established. Vending misers should be installed through the agreement with the vending machine supplier. The estimated cost to imple-ment reduction initiatives is ~$560,000 with a simple payback period of 5.7 years (see table 3.5).
Indoor Pools
Pender Harbour Aquatic And Fitness Centre -13639 Sunshine Coast Highway
315,100 kWh $19,961 6.9
Consumption CO2e (t)
Reductions
Costs Simple Payback
(yrs)Capital Cost Ph
Affect on 2ndary Energy
Type
Cost per Kt
reduced876,530 $47,086kwh
2008 Electricity Consumption and Estimates of Reductions
19
Consumption CO2e (t)Costs
2008 Inventory
‘TURN IT OFF ‘PROGRAM47. 82,899 $5,252 1.8kWh $0 $0.0 Yes
GEOEXCHANGE FEASIBILITY48. -92,294 $-5,847 -2.0kWh $0 $0.0 Yes
DISCONNECT PARASITIC49. 5,527 $350 0.1kWh 0.1$25 $0.2 Yes
VENDING MISERS (WT)50. 4,974 $315 0.1kWh 1.9$600 $5.5 Yes
HEAT RECOVERY VENTILATOR51. 96,716 $6,127 2.1kWh 3.7$22,633 $10.6 Yes
SOLAR HOT WATER52. 14,547 $922 0.3kWh 4.9$4,500 $14.1 Yes
SOLAR HEATING - AIR53. 29,230 $1,852 0.6kWh 5.4$10,000 $15.6 Yes
LED EXIT LAMP RETROFIT KIT54. 1,105 $70 0.0kWh 6.4$447 $18.4 Yes
CONVERT TO LEDS55. 1,072 $68 0.0kWh 6.6$447 $19.0 Yes
REDESIGN HID AND T12 (WT)56. 33,160 $2,101 0.7kWh 16.7$35,000 $48.0 Yes
GEOEXCHANGE FEASIBILITY57. 138,165 $8,753 3.0kWh 33.1$290,000 $95.4 Yes
ELECTRICITY SUBTOTAL 315,100 kWh $19,961 6.9 t
1,134 GJ 6.9 t$19,961
18.2$363,652
315,100 kWh $19,961 6.9 tElectricity
1,134 GJ 6.9 t$19,961
ACCOUNT SUBTOTAL 18.2$363,652
Sechelt Aquatic Centre -5500 Shorncliffe Avenue
8,057 GJ $107,753 412.2
Consumption CO2e (t)
Reductions
Costs Simple Payback
(yrs)Capital Cost Ph
Affect on 2ndary Energy
Type
Cost per Kt
reduced12,473 $166,800GJ
2008 Natural Gas Consumption and Estimates of Reductions
638
Consumption CO2e (t)Costs
2008 Inventory
SOLAR HOT WATER58. 200 $2,669 10.2GJ 3.4$9,000 $0.9 Yes
SOLAR HEATING - AIR59. 998 $13,344 51.0GJ 3.7$50,000 $1.0 Yes
HEAT RECLAMATION60. 6,860 $91,740 351.0GJ 5.5$500,000 $1.4 Yes
NATURAL GAS SUBTOTAL 8,057 GJ $107,753 412.2 t
8,057 GJ 412.2 t$107,753
5.2$559,000
8All
-175,839 kWh $-9,885 -3.9
Consumption CO2e (t)
Reductions
Costs Simple Payback
(yrs)Capital Cost Ph
Affect on 2ndary Energy
Type
Cost per Kt
reduced1,992,461 $98,409kwh
2008 Electricity Consumption and Estimates of Reductions
44
Consumption CO2e (t)Costs
2008 Inventory
‘TURN IT OFF ‘PROGRAM61. 121,018 $6,803 2.7kWh $0 $0.0 Yes
HEAT RECLAMATION62. -302,545 $-17,007 -6.7kWh $0 $0.0 Yes
VENDING MISERS (WT)63. 5,688 $320 0.1kWh 1.9$600 $4.8 Yes
ELECTRICITY SUBTOTAL -175,839 kWh $-9,885 -3.9 t
-633 GJ -3.9 t-$9,885
-0.1$600
-175,839 kWh $-9,885 -3.9 tElectricity
8,057 GJ $107,753 412.2 tNatural Gas
7,424 GJ 408.4 t$97,868
ACCOUNT SUBTOTAL 5.7$559,600
Gibsons And Area Aquatic Facility -951 Gibsons Way
581 GJ $7,924 29.7
Consumption CO2e (t)
Reductions
Costs Simple Payback
(yrs)Capital Cost Ph
Affect on 2ndary Energy
Type
Cost per Kt
reduced6,039 $77,512GJ
2008 Natural Gas Consumption and Estimates of Reductions
309
Consumption CO2e (t)Costs
2008 Inventory
SOLAR HOT WATER64. 53 $720 2.7GJ 6.2$4,500 $1.7 Yes
SOLAR HEATING - AIR65. 529 $7,204 27.0GJ 6.9$50,000 $1.8 Yes
NATURAL GAS SUBTOTAL 581 GJ $7,924 29.7 t
581 GJ 29.7 t$7,924
6.9$54,500
85,012 kWh $6,921 1.9
Consumption CO2e (t)
Reductions
Costs Simple Payback
(yrs)Capital Cost Ph
Affect on 2ndary Energy
Type
Cost per Kt
reduced263,126 $20,507kwh
2008 Electricity Consumption and Estimates of Reductions
6
Consumption CO2e (t)Costs
2008 Inventory
‘TURN IT OFF ‘PROGRAM66. 25,453 $2,072 0.6kWh $0 $0.0 Yes
HEAT RECOVERY VENTILATOR67. 59,389 $4,835 1.3kWh 5.1$24,675 $18.9 Yes
VENDING MISERS (WT)68. 170 $14 0.0kWh 43.4$600 $160.7 Yes
ELECTRICITY SUBTOTAL 85,012 kWh $6,921 1.9 t
306 GJ 1.9 t$6,921
3.7$25,275
85,012 kWh $6,921 1.9 tElectricity
581 GJ $7,924 29.7 tNatural Gas
887 GJ 31.6 t$14,845
ACCOUNT SUBTOTAL 5.4$79,775
224,273 kWh $16,997 4.9 tElectricity
8,639 GJ $115,677 442.0 tNatural Gas
9,446 GJ 447 t$132,675
SUBCATEGORY TOTAL
9All
19

Pender Harbour Aquatic and Fitness Centre
The Pender Harbour Aquatic and Fitness Centre will undergo a major renovation that will incorporate lighting ef-ficiency upgrades. This facility is relatively inefficient as it uses electricity rather than natural gas to heat pool water. Proposed measures include ground-source heat pumps, although the efficiency of this system would need further evaluation. Electrical energy consumption can also be reduced by implementing a ‘turn it off’ program, retrofitting overhead lighting, eliminating parasitic electrical losses and replacing all existing incandescent lights in office spaces, washrooms and storage areas with compact fluorescent luminaires. The estimated cost to implement reduction initia-tives is $364,000 with a simple payback period of 18 years (see table 3.5).
Indoor Pools
Pender Harbour Aquatic And Fitness Centre -13639 Sunshine Coast Highway
315,100 kWh $19,961 6.9
Consumption CO2e (t)
Reductions
Costs Simple Payback
(yrs)Capital Cost Ph
Affect on 2ndary Energy
Type
Cost per Kt
reduced876,530 $47,086kwh
2008 Electricity Consumption and Estimates of Reductions
19
Consumption CO2e (t)Costs
2008 Inventory
‘TURN IT OFF ‘PROGRAM47. 82,899 $5,252 1.8kWh $0 $0.0 Yes
GEOEXCHANGE FEASIBILITY48. -92,294 $-5,847 -2.0kWh $0 $0.0 Yes
DISCONNECT PARASITIC49. 5,527 $350 0.1kWh 0.1$25 $0.2 Yes
VENDING MISERS (WT)50. 4,974 $315 0.1kWh 1.9$600 $5.5 Yes
HEAT RECOVERY VENTILATOR51. 96,716 $6,127 2.1kWh 3.7$22,633 $10.6 Yes
SOLAR HOT WATER52. 14,547 $922 0.3kWh 4.9$4,500 $14.1 Yes
SOLAR HEATING - AIR53. 29,230 $1,852 0.6kWh 5.4$10,000 $15.6 Yes
LED EXIT LAMP RETROFIT KIT54. 1,105 $70 0.0kWh 6.4$447 $18.4 Yes
CONVERT TO LEDS55. 1,072 $68 0.0kWh 6.6$447 $19.0 Yes
REDESIGN HID AND T12 (WT)56. 33,160 $2,101 0.7kWh 16.7$35,000 $48.0 Yes
GEOEXCHANGE FEASIBILITY57. 138,165 $8,753 3.0kWh 33.1$290,000 $95.4 Yes
ELECTRICITY SUBTOTAL 315,100 kWh $19,961 6.9 t
1,134 GJ 6.9 t$19,961
18.2$363,652
315,100 kWh $19,961 6.9 tElectricity
1,134 GJ 6.9 t$19,961
ACCOUNT SUBTOTAL 18.2$363,652
Sechelt Aquatic Centre -5500 Shorncliffe Avenue
8,057 GJ $107,753 412.2
Consumption CO2e (t)
Reductions
Costs Simple Payback
(yrs)Capital Cost Ph
Affect on 2ndary Energy
Type
Cost per Kt
reduced12,473 $166,800GJ
2008 Natural Gas Consumption and Estimates of Reductions
638
Consumption CO2e (t)Costs
2008 Inventory
SOLAR HOT WATER58. 200 $2,669 10.2GJ 3.4$9,000 $0.9 Yes
SOLAR HEATING - AIR59. 998 $13,344 51.0GJ 3.7$50,000 $1.0 Yes
HEAT RECLAMATION60. 6,860 $91,740 351.0GJ 5.5$500,000 $1.4 Yes
NATURAL GAS SUBTOTAL 8,057 GJ $107,753 412.2 t
8,057 GJ 412.2 t$107,753
5.2$559,000
8All
SUN
SHIN
E C
OA
ST R
EGIO
NA
L D
ISTR
ICT
CO
RPO
RATE
EN
ERG
Y A
ND
EM
ISSI
ON
S PL
AN
200
9
20

Gibsons and Area Aquatic Centre
Solar heating for hot water and air would reduce energy consumption at this facility by 581 GJ. A heat recovery ventilator, ‘turn it off’ program, and vending misers could save an additional 306 GJ of energy. The estimated cost to implement reduction initiatives is ~$80,000 with a simple payback period of 5.4 years (see table 3.5).
-175,839 kWh $-9,885 -3.9
Consumption CO2e (t)
Reductions
Costs Simple Payback
(yrs)Capital Cost Ph
Affect on 2ndary Energy
Type
Cost per Kt
reduced1,992,461 $98,409kwh
2008 Electricity Consumption and Estimates of Reductions
44
Consumption CO2e (t)Costs
2008 Inventory
‘TURN IT OFF ‘PROGRAM61. 121,018 $6,803 2.7kWh $0 $0.0 Yes
HEAT RECLAMATION62. -302,545 $-17,007 -6.7kWh $0 $0.0 Yes
VENDING MISERS (WT)63. 5,688 $320 0.1kWh 1.9$600 $4.8 Yes
ELECTRICITY SUBTOTAL -175,839 kWh $-9,885 -3.9 t
-633 GJ -3.9 t-$9,885
-0.1$600
-175,839 kWh $-9,885 -3.9 tElectricity
8,057 GJ $107,753 412.2 tNatural Gas
7,424 GJ 408.4 t$97,868
ACCOUNT SUBTOTAL 5.7$559,600
Gibsons And Area Aquatic Facility -951 Gibsons Way
581 GJ $7,924 29.7
Consumption CO2e (t)
Reductions
Costs Simple Payback
(yrs)Capital Cost Ph
Affect on 2ndary Energy
Type
Cost per Kt
reduced6,039 $77,512GJ
2008 Natural Gas Consumption and Estimates of Reductions
309
Consumption CO2e (t)Costs
2008 Inventory
SOLAR HOT WATER64. 53 $720 2.7GJ 6.2$4,500 $1.7 Yes
SOLAR HEATING - AIR65. 529 $7,204 27.0GJ 6.9$50,000 $1.8 Yes
NATURAL GAS SUBTOTAL 581 GJ $7,924 29.7 t
581 GJ 29.7 t$7,924
6.9$54,500
85,012 kWh $6,921 1.9
Consumption CO2e (t)
Reductions
Costs Simple Payback
(yrs)Capital Cost Ph
Affect on 2ndary Energy
Type
Cost per Kt
reduced263,126 $20,507kwh
2008 Electricity Consumption and Estimates of Reductions
6
Consumption CO2e (t)Costs
2008 Inventory
‘TURN IT OFF ‘PROGRAM66. 25,453 $2,072 0.6kWh $0 $0.0 Yes
HEAT RECOVERY VENTILATOR67. 59,389 $4,835 1.3kWh 5.1$24,675 $18.9 Yes
VENDING MISERS (WT)68. 170 $14 0.0kWh 43.4$600 $160.7 Yes
ELECTRICITY SUBTOTAL 85,012 kWh $6,921 1.9 t
306 GJ 1.9 t$6,921
3.7$25,275
85,012 kWh $6,921 1.9 tElectricity
581 GJ $7,924 29.7 tNatural Gas
887 GJ 31.6 t$14,845
ACCOUNT SUBTOTAL 5.4$79,775
224,273 kWh $16,997 4.9 tElectricity
8,639 GJ $115,677 442.0 tNatural Gas
9,446 GJ 447 t$132,675
SUBCATEGORY TOTAL
9All
21

Sunshine Coast Arena
Reduction initiatives to consider include expanding the existing heat recovery system and heating makeup air with a solar wall. Vending misers should be installed through the agreement with the vending machine supplier. The esti-mated cost to implement reduction initiatives is $9,100 with a simple payback period of 3.7 years (see table 3.5).
Ice Arenas
Sunshine Coast Arena -5986 Shoal Way
107 GJ $1,668 5.5
Consumption CO2e (t)
Reductions
Costs Simple Payback
(yrs)Capital Cost Ph
Affect on 2ndary Energy
Type
Cost per Kt
reduced1,140 $17,103GJ
2008 Natural Gas Consumption and Estimates of Reductions
58
Consumption CO2e (t)Costs
2008 Inventory
SOLAR HEATING - AIR44. 107 $1,668 5.5GJ 2.1$3,500 $0.6 Yes
EXPAND EXISTING HEAT RECOVERY45. 0 $0 0.0GJ ?$5,000 ? Yes
NATURAL GAS SUBTOTAL 107 GJ $1,668 5.5 t
107 GJ 5.5 t$1,668
5.1$8,500
6,733 kWh $806 0.1
Consumption CO2e (t)
Reductions
Costs Simple Payback
(yrs)Capital Cost Ph
Affect on 2ndary Energy
Type
Cost per Kt
reduced1,014,976 $57,674kwh
2008 Electricity Consumption and Estimates of Reductions
22
Consumption CO2e (t)Costs
2008 Inventory
VENDING MISERS (WT)46. 6,733 $806 0.1kWh 0.7$600 $4.1 Yes
ELECTRICITY SUBTOTAL 6,733 kWh $806 0.1 t
24 GJ 0.1 t$806
0.7$600
6,733 kWh $806 0.1 tElectricity
107 GJ $1,668 5.5 tNatural Gas
131 GJ 5.6 t$2,474
ACCOUNT SUBTOTAL 3.7$9,100
6,733 kWh $806 0.1 tElectricity
107 GJ $1,668 5.5 tNatural Gas
131 GJ 6 t$2,474
SUBCATEGORY TOTAL
7All
Gibsons and Area Community Centre
The Gibsons and Area Community Centre is a new building that has been constructed to be as energy efficient as possible. Walkthrough audits did not reveal additional reduction initiatives beyond a no cost ‘turn it off’ program in common areas and office space. Other minor retrofits include replacing incandescent overhead spot lighting in office areas with LED lighting strips. Vending misers should be installed through an agreement with the vending machine supplier. Costs to implement reduction initiatives have not been estimated for this building (see table 3.5).
Ice Arenas
Sunshine Coast Arena -5986 Shoal Way
107 GJ $1,668 5.5
Consumption CO2e (t)
Reductions
Costs Simple Payback
(yrs)Capital Cost Ph
Affect on 2ndary Energy
Type
Cost per Kt
reduced1,140 $17,103GJ
2008 Natural Gas Consumption and Estimates of Reductions
58
Consumption CO2e (t)Costs
2008 Inventory
SOLAR HEATING - AIR44. 107 $1,668 5.5GJ 2.1$3,500 $0.6 Yes
EXPAND EXISTING HEAT RECOVERY45. 0 $0 0.0GJ ?$5,000 ? Yes
NATURAL GAS SUBTOTAL 107 GJ $1,668 5.5 t
107 GJ 5.5 t$1,668
5.1$8,500
6,733 kWh $806 0.1
Consumption CO2e (t)
Reductions
Costs Simple Payback
(yrs)Capital Cost Ph
Affect on 2ndary Energy
Type
Cost per Kt
reduced1,014,976 $57,674kW
h
2008 Electricity Consumption and Estimates of Reductions
22
Consumption CO2e (t)Costs
2008 Inventory
VENDING MISERS (WT)46. 6,733 $806 0.1kWh 0.7$600 $4.1 Yes
ELECTRICITY SUBTOTAL 6,733 kWh $806 0.1 t
24 GJ 0.1 t$806
0.7$600
6,733 kWh $806 0.1 tElectricity
107 GJ $1,668 5.5 tNatural Gas
131 GJ 5.6 t$2,474
ACCOUNT SUBTOTAL 3.7$9,100
Gibsons And Area Community Centre -700 Park Rd Ice
16,782 kWh $1,106 0.4
Consumption CO2e (t)
Reductions
Costs Simple Payback
(yrs)Capital Cost Ph
Affect on 2ndary Energy
Type
Cost per Kt
reduced1,162,688 $68,700kW
h
2008 Electricity Consumption and Estimates of Reductions
26
Consumption CO2e (t)Costs
2008 Inventory
‘TURN IT OFF ‘PROGRAM47. 13,952 $919 0.3kWh $0 $0.0 Yes
CONVERT OVERHEAD HALOGENS TO LED48. 2,830 $186 0.1kWh 26.8$5,000 $80.3 Yes
ELECTRICITY SUBTOTAL 16,782 kWh $1,106 0.4 t
60 GJ 0.4 t$1,106
4.5$5,000
16,782 kWh $1,106 0.4 tElectricity
60 GJ 0.4 t$1,106
ACCOUNT SUBTOTAL 4.5$5,000
23,515 kWh $1,912 0.5 tElectricity
107 GJ $1,668 5.5 tNatural Gas
192 GJ 6 t$3,580
SUBCATEGORY TOTAL
7All
SUN
SHIN
E C
OA
ST R
EGIO
NA
L D
ISTR
ICT
CO
RPO
RATE
EN
ERG
Y A
ND
EM
ISSI
ON
S PL
AN
200
9
22

Transit Building and Works Yard
Reduction initiatives are limited at the Transit Building and Works Yard. Options include insulating bay doors, installing door interlocks and repairing leaks and drafts. However, heating is a problem in the main vehicle bay and staff cur-rently exercise care with the doors, particularly in colder weather conditions. Implementing these energy reduction initiatives will save approximately $1,800 in energy costs and lead to a reduction of approximately 5 tonnes CO
2e.
Estimated costs to implement reduction initiatives is $15,000 with a simple payback period of eight years.
Miscellaneous Buildings
As part of the Green Buildings BC project, walkthrough audits were conducted by the Community Energy Association on a number of smaller buildings , including: Eric Cardinal Hall, Granthams Landing Community Hall, Coopers Green Hall, Chaster House, Gibsons Fire Hall, Halfmoon Bay VFD, Roberts Creek Fire Hall, Frank West Fire Hall and Community Hall, and Egmont and District Fire Hall.
The total estimated savings in these buildings is approximately 3 tonnes CO2e and $3,000 dollars in energy costs.
Costs for individual reduction initiatives were not provided since the variability in pricing of local contractors makes cost estimates difficult to estimate and most initiatives can be undertaken by SCRD staff.
3.5 SummaryTable 3.5 ranks reduction measures throughout the SCRD’s building stock based on tonnes of greenhouse gases reduced. Implementation for each building would be considered by the Board on an annual basis.
Values for capital costs are estimated, and values for costs reduced and simple payback are calculated at the 2008 unit cost for energy. As the unit cost for energy increases over time, the simple payback associated with the project de-creases accordingly. The values for CO
2e saved that include electricity are calculated using the 2007 electricity
emissions factor provided by BC Hydro, as emissions factors for 2008 are not currently available.
Table 3.5 – Prioritized Implementation in the Buildings Sector by CO2e Reduced
Rank Account Account Address
Capital Cost to Implement
Energy Costs
Reduced
Simple Payback (years)
CO2e (tonnes) Reduced
1 Sechelt Aquatic Centre 5500 Shorncliffe Avenue $559,600 $97,868 5.7 408
2 Gibsons and Area Aquatic Centre 9 51 G i b s o n s Way $79,775 $14,845 5.4 32
3 Pender Harbour Aquatic and Fitness Centre
13639 Sunshine Coast Hwy $363,627 $19,961 18.2 7
4 Administration Building 1975 Field Road $305,827 $17,078 12.8 6
5 Sunshine Coast Arena 5986 Shoal Ave $9,100 $2,474 3.7 6
6 Transit Building and Works Yard 5 9 2 0 M a s o n Road $15,000 $1,864 8.0 5
7 Miscellaneous Buildings# various N/A $3,000 N/A 4
8 Gibsons a nd A rea Commu nit y Centre# 700 Park Road N/A $1,106 N/A <1
TOTALS $1,332,929 $158,196 8.4 469
1 Eric Cardinal Hall; Granthams Landing Community Hall; Coopers Green Hall; Chaster House; Gibsons Fire Hall; Halfmoon bay VFD; Roberts Creek Fire Hall; Frank West Fire Hall and Community Hall; and, Edgmont and District Fire Hall
23

4 Outdoor Lighting
4.1 Outdoor Lighting OverviewThe SCRD’s outdoor lighting consumed 1,090 GJ of electricity (302,901 kWh), resulting in the production of 7 tonnes of CO
2e at a cost of $46,515 (Table 4.1.1). Outdoor lighting accounted for one percent of corporate emissions (Table
2.1). Table 4.1.2 ranks the significant energy-consuming accounts in the lighting sector and figure 4.1.1 illustrates the break-down of all categories.
Table 4.1.1 – Summary of Outdoor Lighting Sector Emissions (2008) T 2.1 T 2.1.4 T 2.1.5
1,090 $46,515 7
$46,515302,901kWhElectricity 1,090 6.7Lighting
Sector
Totals
Energy Type& Units
Total Energy(GJ)
TotalCO2e (t)
TotalCosts
Total Use Fuel Efficiency
Table 4.1.2 – Outdoor Lighting Ranked by Energy Consumption (2008)
The highest energy-consuming outdoor lighting account in the SCRD is the parking lot lights at the Sunshine Coast Arena. Although the consumption of these lights is typical, the total energy consumption is insignificant relative to the accounts in other sectors. Table 4.1.2 presents the top 10 energy consuming outdoor lighting accounts of a total of 32 accounts. The remaining outdoor lighting accounts, which can be viewed in Appendix I, are streetlights, playing field lighting and small dock and pole lights.
Figure 4.1.1 illustrates energy costs by subcategory, where overhead streetlights and parking lot lights account for approximately 94 percent of all outdoor lighting costs.
: Top Energy ConsumersLighting CO2eCostsEnergy
Sunshine Coast Arena - 5986 Shoal Way 313 GJ $7,056 1.9 t
Sunshine Coast Arena - Sun Cst Hwy 268 GJ $6,069 1.6 t
Gibsons And Area Aquatic Facility - 951 Gibsons Way Pool 75 GJ $1,741 0.5 t
Langdale Regional Street Lighting - Overhead Street Ltg F 61 GJ $5,199 0.4 t
Sechelt [A] Regional Street Lighting - Overhead Street Ltg A 56 GJ $5,120 0.3 t
Sunshine Coast Regional District Administr Lighting - Overhead Street
Ltg D
51 GJ $4,303 0.3 t
Sechelt [B] Regional Street Lighting - Overhead Street Ltg B 42 GJ $3,617 0.3 t
Pratt Road Regional Street Lighting - Overhead Street Ltg E-Pratt Rd 39 GJ $3,409 0.2 t
Scrd Parks - Garden Bay Rd 32 GJ $804 0.2 t
Cooper’s Green Park - Redrooffs Rd 29 GJ $576 0.2 t
Cliff Gilker Park - Sun Cst Hwy 21 GJ $537 0.1 t
Woodcreek Park Local Service Area Lighting - Overhead St Ltg-Woodcreek 16 GJ $1,468 0.1 t
Granthams Landing Local Service Area Street Lighting - Overhead
Street Ltg
14 GJ $1,503 0.1 t
Langdale Local Service Area Lighting - Overhead Street Ltg 14 GJ $1,503 0.1 t
Keats Road - Keats Camp Wharf Lights On Wharf 11 GJ $309 0.1 t
Sunnyside Local Service Area Lighting - Overhead Street Ltg Sunnyside Rd 6 GJ $601 0.0 t
Keats Road - Keats Rd-8530 Pole 18 6 GJ $243 0.0 t
Hopkins Landing Port - Burns Rd 5 GJ $178 0.0 t
Shirley Macey Park - 944 Chamberlin Rd 5 GJ $170 0.0 t
Halfmoon Bay Port - Mintie Rd 3 GJ $129 0.0 t
Fircrest Road Local Service Area Lighting - Overhead Street Ltg Fircrest Rd 3 GJ $301 0.0 t
Stewart Road Local Service Lighting - Overhead Street Ltg Stewart Rd 3 GJ $301 0.0 t
1
2
3
4
5
6
7
8
9
10
2008 Rank
Account Energy Costs CO2e
SUN
SHIN
E C
OA
ST R
EGIO
NA
L D
ISTR
ICT
CO
RPO
RATE
EN
ERG
Y A
ND
EM
ISSI
ON
S PL
AN
200
9
24

Figure 4.1.1 – Costs for Energy in the Outdoor Lighting Subsectors (2008)
1.3%
61.0%
32.3%
1.2%
4.2%
Dock Light Overhead Lighting
Parking Lot Lighting (open) Playing Field Lighting
Pole Light
developer
4.2 Outdoor Lighting ForecastAn overall forecast of one percent growth is projected for the outdoor lighting sector, which forms the basis for the overall energy and emissions forecast. The forecast percent was estimated based on anticipated changes to individual accounts or new accounts that will be added during the ten-year forecast period.
Staff could not identify any anticipated changes in this sector, with the exception of increased overhead lighting for new neighbourhoods. Although the details of those new neighbourhoods are unknown at this time, an increase of 0.1% per year was applied to accommodate annual growth for a total of one percent in ten years. Table 4.2.1 provides a forecast of projected energy consumption to 2018, table 4.2.3 provides a forecast of costs for energy consumption to 2018, and table 4.2.4 provides a forecast of emissions to 2018.
Table 4.2.1 – Forecast of Lighting Consumption
Energy Type/Unit Consumption Energy (GJ)
Forecasted Percent Forecasted Energy (GJ)
2008 2018
Electricity (kWh) 302,901 1,090 1.01 1,091
Table 4.2.2 – Forecast of Lighting Costs
Energy Type/Unit Consumption Unit Cost Costs Forecasted
ConsumptionForecasted Unit Cost
Forecasted Total Costs
2008 2018
Electricity (kWh) 302,901 $0.061 $46,515 331,191 blended rates $51,167
25

Table 4.2.3 – Forecast of Emissions
Energy Type Emissions CO2e (t)
Total CO2e (t)
Forecast Percent
Forecasted Emissions CO2e (t)
2008 2018
Electricity (kWh) 7 1.01 8
With a very small annual growth rate in this sector, GHG emissions are forecast to increase by approximately 0.07 tonnes over ten years (assuming the emissions coefficient for electricity remains constant). It should be noted that LED technology for overhead street lights is currently available, although it may not be cost effective for local govern-ments to implement at this time. This is particularly true for the SCRD, which does not own a large number of street lights.
4.3 Reduction InitiativesParking lot lights and overhead street lights consume most of the energy in this sector. There are very few options for energy reductions because of the small amount of energy consumed.
Table 4.3 summarizes the estimated reductions in energy use, energy costs and GHG emissions for the proposed reduction initiatives (as approved by the Board on an annual basis).
It is estimated that a very modest 114 GJ of energy can be saved by implementing lighting retrofits, which would result in energy savings of approximately $9,000 and a reduction of CO
2e emissions of approximately one tonne.
Table 4.3 – Summary of Proposed Reduction Initiatives for the Outdoor Lighting Sector
LightingConsumption CO2e (t)
Annual Savings
Costs Three Years Seven Years
Simple Payback Period
Five Years
115 GJ 1 t$10,892TOTAL THIS SECTOR:
SUBTOTALS 31,911 kWh $10,892 1 tElectricity $32,676 $54,461 $76,245
There are very limited opportunities to reduce energy use in the outdoor lighting sector due to the low number of out-door lighting accounts that consume a significant amount of energy.
Parking Lot Lighting
The parking lot lighting in all recreational facilities could be retrofitted with dimmers and/or photocells, which would result in a small savings.
Overhead Street lights
LED technology is advancing at a rapid rate and manufacturers claim a 30 percent to 40 percent reduction in electric-ity consumption over currently available technology. With better optics and brighter LEDs, this type of technology has the potential to reduce electrical consumption for street lights even further.
SUN
SHIN
E C
OA
ST R
EGIO
NA
L D
ISTR
ICT
CO
RPO
RATE
EN
ERG
Y A
ND
EM
ISSI
ON
S PL
AN
200
9
26
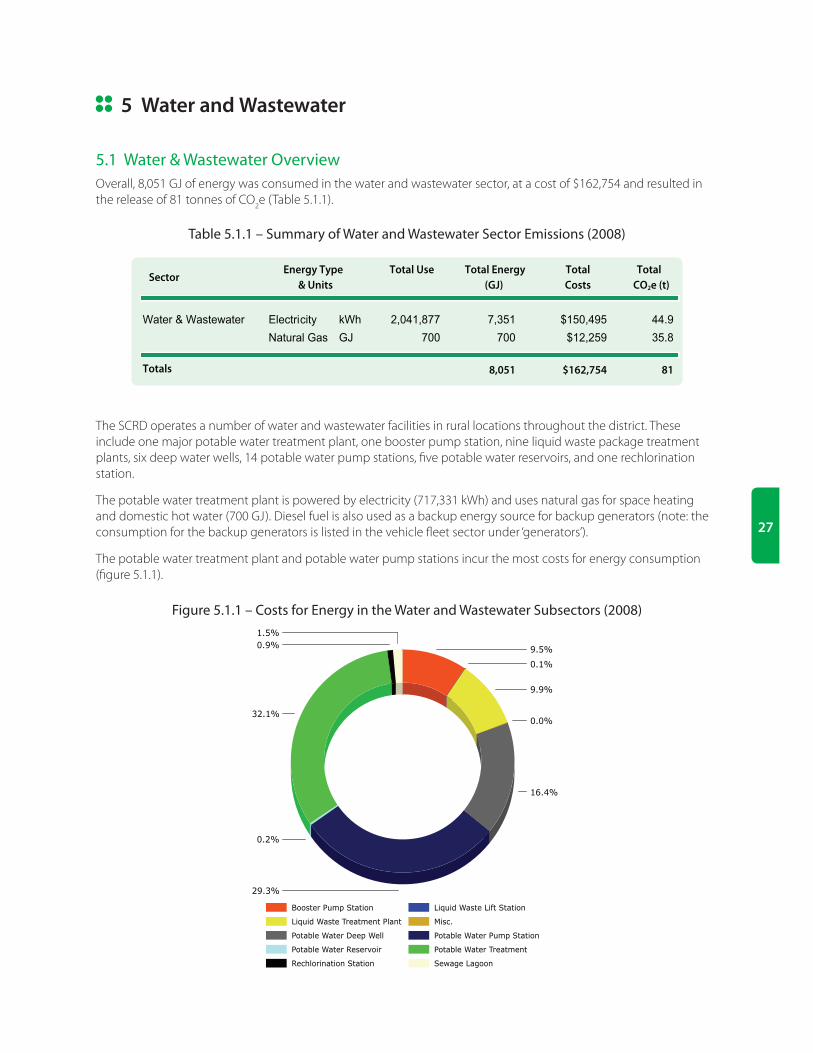
5 Water and Wastewater
5.1 Water & Wastewater OverviewOverall, 8,051 GJ of energy was consumed in the water and wastewater sector, at a cost of $162,754 and resulted in the release of 81 tonnes of CO
2e (Table 5.1.1).
Table 5.1.1 – Summary of Water and Wastewater Sector Emissions (2008)T 2.1 T 2.1.4 T 2.1.5
8,051 $162,754 81
$150,4952,041,877kWhElectricity 7,351 44.9
$12,259700GJNatural Gas 700 35.8
Water & Wastewater
Sector
Totals
Energy Type& Units
Total Energy(GJ)
TotalCO2e (t)
TotalCosts
Total Use Fuel Efficiency
The SCRD operates a number of water and wastewater facilities in rural locations throughout the district. These include one major potable water treatment plant, one booster pump station, nine liquid waste package treatment plants, six deep water wells, 14 potable water pump stations, five potable water reservoirs, and one rechlorination station.
The potable water treatment plant is powered by electricity (717,331 kWh) and uses natural gas for space heating and domestic hot water (700 GJ). Diesel fuel is also used as a backup energy source for backup generators (note: the consumption for the backup generators is listed in the vehicle fleet sector under ‘generators’).
The potable water treatment plant and potable water pump stations incur the most costs for energy consumption (figure 5.1.1).
Figure 5.1.1 – Costs for Energy in the Water and Wastewater Subsectors (2008)
9.5%
0.1%
9.9%
0.0%
16.4%
29.3%
0.2%
32.1%
0.9%
1.5%
Booster Pump Station Liquid Waste Lift Station
Liquid Waste Treatment Plant Misc.
Potable Water Deep Well Potable Water Pump Station
Potable Water Reservoir Potable Water Treatment
Rechlorination Station Sewage Lagoon
developer
27

Table 5.1.2 – Water and Wastewater Ranked by Energy Consumption (2008)
Table 5.1.2 presents the top 10 energy consuming water and wastewater accounts of a total of 40 accounts. The remaining water and wastewater accounts can be viewed in Appendix I. The top energy consumer in the water and wastewater sector is the Chapman Creek Water Treatment Plant. Together with the related Chapman Creek Pump Sta-tion (the Booster Pump Station), the water treatment plant accounts for over half of the energy consumption, under half the energy costs and three-quarters of the emissions in this sector. The Chapman Creek Water Treatment Plant consumes a significant amount of energy relative to other accounts in the water and wastewater sector because it is the only one that uses natural gas for space heating in the treatment plant.
5.2 Water and Wastewater ForecastStaff have indicated that the capacity of the Chapman Creek Water Treatment Plant will increase in the forecast period. There are currently two treatment trains in the existing plant with one more treatment train proposed. Seven additional liquid waste treatment plants are proposed in this sector as well as additional pumps to increase capacity in some locations. The later forecast for liquid waste treatment plants is based on estimates of growth patterns in rural areas serviced by SCRD water and wastewater infrastructure.
The capacity of the Chapman Creek Water Treatment Plant will increase by one-third over the forecast period, which could increase the electricity consumption and costs in the water and wastewater sector by approximately 200,000 kWh and $14,000 annually at a rate of approximately $0.07/kWh. This increase is for motors, overhead lighting and in-creased ultraviolet lighting for disinfection. An increase in natural gas consumption for space heating is also antici-pated, but forecast at 7% relative to the amount of additional space heating required in the treatment plant.
Accordingly, the forecast percent is estimated at 11% in this sector (table 5.2.1). Table 5.2.2 provides a forecast of projected energy consumption to 2018. Table 5.2.2 provides a forecast of projected costs for energy consumption to 2018.
: Top Energy ConsumersWater & Wastewater CO2eCostsEnergy
Chapman Creek Water Treatment Plant - B-5642 Reservoir Rd 3,283 GJ $52,306 51.6 t
Chapman Creek Pump Station - 5642 Reservoir Rd A 731 GJ $15,456 4.5 t
Chaster Road Well - Chaster Road Pump Stn| Knight & V 545 GJ $10,783 3.3 t
Langdale Well - Port Mellon Hwy 488 GJ $12,303 3.0 t
Garden Bay Waterworks Dist - Garden Bay Rd 476 GJ $11,482 2.9 t
Sandy Hook Pump Station - Sechelt Inlet Rd 354 GJ $8,038 2.2 t
Payne Rd Pump Station - 1056 Reed Rd 342 GJ $7,808 2.1 t
Selma Pump Station - Patterson Rd 200 GJ $5,499 1.2 t
Emery Road Treatment Plant - 1131 Emery Rd Pump 179 GJ $4,098 1.1 t
Roberts Creek Pump Station - Sun Cst Hwy 176 GJ $4,440 1.1 t
Payne Rd Pump Station - 1056 Reed Rd 141 GJ $3,238 0.9 t
Scrd Infrastructure - 12710 Lagoon Rd Sew 107 GJ $2,470 0.7 t
Jolly Roger Sewage Treatment Plant - Jolly Roger Sewage 101 GJ $2,336 0.6 t
Secret Cove Marina Treatment Plant - 5471 Secret Cove Rd 99 GJ $2,289 0.6 t
Soames Well - Port Mellon Hwy 92 GJ $2,129 0.6 t
Woodcreek Treatment Plant - Oceanview Dr 77 GJ $1,801 0.5 t
Cove Cay Pump Station - Sun Cst Hwy 67 GJ $1,568 0.4 t
Lee Bay Treatment Plant - 4336 Orca Rd 61 GJ $1,431 0.4 t
Selma Pump Station - Patterson Rd 59 GJ $1,324 0.4 t
Rechlorination Station - Sun Cst Hwy 59 GJ $1,388 0.4 t
Square Bay Sewage Treatment Plant - 5320 Susan Way 59 GJ $1,396 0.4 t
Granthams Landing Pump Station - Marine Dr 58 GJ $1,357 0.4 t
Orca Road Pump Station - 4295 Orca Rd 53 GJ $1,261 0.3 t
1
2
3
4
5
6
7
8
9
10
2008 Rank
Account Energy Costs CO2e
SUN
SHIN
E C
OA
ST R
EGIO
NA
L D
ISTR
ICT
CO
RPO
RATE
EN
ERG
Y A
ND
EM
ISSI
ON
S PL
AN
200
9
28

Table 5.2.1 – Predicted Growth by Sector
Sector Deletions and Additions from 2008 to 2018 Forecast Percent (2018)
Water and Wastewater
Additional capacity at Chapman Creek Water Treatment Plant of 11% translates into a blended forecast of 4% for electricity (~80,000kWh) and
7% for natural gas (~80GJ). Seven additional package treatment plants to be added up to 2018 to accommodate new construction.
11%
Table 5.2.2 – Forecast of Water and Wastewater Consumption
Energy Type/Unit Consumption Energy
(GJ)Forecasted
Percent Forecasted
Consumption
Forecasted Total Energy
(GJ)2008 2018
Electricity (kWh) 2,041,877 7,351 1.04 7,645 8,394
Nat Gas (GJ) 700 700 1.07 749
Table 5.2.3 – Forecast of Water and Wastewater Costs
Energy Type/Unit Consumption Unit
Cost Costs Forecasted Consumption
Forecasted Unit Cost
Forecasted Costs
Forecasted Total Costs
2008 2018
Electricity (kWh)
2,041,877 $0.061 $150,495 2,118,877 $0.08 $169,510 $180,745
Nat Gas (GJ) 700 $12 $12,259 749 $15 $11,235
Table 5.2.4 – Forecast of Emissions
Energy Type Emissions CO2e (t)
Total CO2e (t)
Forecast Percent
Forecasted Emissions CO2e (t)
Forecasted Total Emissions CO2e (t)
2008 2018
Electricity (kWh) 4581
1.04 4785
Nat Gas (GJ) 36 1.07 39
5.3 Reduction InitiativesSmall reductions in the water and wastewater sector are possible, although quantifying these reductions is difficult since reductions will occur as older motors are replaced with newer, higher efficiency models. There are no other quantitative reduction initiatives to apply to this sector because the opportunities are limited and the payback pe-riod for new motors is generally 15 to 25 years, depending on the duty cycle of the motor and the volume of water pumped. The longer payback to replace a pump makes it difficult for SCRD staff to justify replacing a pump before its useful life has ended.
29

Initiatives Completed and/or Underway
The SCRD has completed the following initiatives:
Selecting high-efficiency motors for new pumps and pump stations or when replacing aging pumps; i.
Launching a free bathroom fixture replacement program (e.g., showerheads, faucet aerators, and dual flush ii. toilets) for residential and commercial water customers;
Rolling out a rebate program for SCRD water customers to replace older 13 litre/flush toilets with high ef-iii. ficiency toilets ($200 rebate) or low flow toilets ($100 rebate);
Providing waterwise gardening information and maintaining a demonstration garden; and,iv.
Developing a water efficiency awards program for commercial and industrial water customers.v.
Proposed Reduction Measures, Reduction Quantity, and Capital Costs
Table 5.3 summarizes the estimated reductions in energy use, energy costs and GHG emissions for the proposed reduction initiatives (as approved by the Board on an annual basis).
Table 5.3 – Summary of Proposed Reduction Initiatives for the Water and Wastewater Sector
Water & WastewaterConsumption CO2e (t)
Annual Savings
Costs Three Years Seven Years
Simple Payback Period
Five Years
753 GJ 5 t$17,481TOTAL THIS SECTOR:
SUBTOTALS 209,038 kWh $17,481 5 tElectricity $52,442 $87,403 $122,365
The following reduction initiatives are proposed:
Install low-flow toilets, dual flush toilets, waterless urinals, tankless urinals, tap sensors and other water-i. saving de-vices in corporate buildings. The estimated costs to replace all fixtures can be calculated if the regional district counts the number and type of fixtures in their facilities that require replacement;
Install meters on all corporate facilities to account for water use and eliminate any water loss. Meters vary ii. in cost from $400 to $800;
Continue with lawn-watering restrictions;iii.
Increase water conservation awareness (e.g. through school campaigns and public awareness programs);iv.
Conduct industrial/commercial water audits and implement residential water audits to reduce demand on v. potable water pumps and to conserve water.. Costs vary and must be further explored. Collaboration with the member municipalities is imperative;
Discourage garburators in new development and encourage residents to remove existing garburators to vi. reduce demand on the wastewater treatment plants and to reduce demand on sanitary pump stations; and,
Continue to replace old motors and pumps with high-efficiency models. Costs vary depending on wheth-vii. er the motor needs replacing/rewinding or the entire pump assembly needs replacement.
It is very difficult to calculate the impact of these energy reduction initiatives on the water and wastewater sector. A reduction quantity of approximately 5 tonnes CO2e is currently estimated.
SUN
SHIN
E C
OA
ST R
EGIO
NA
L D
ISTR
ICT
CO
RPO
RATE
EN
ERG
Y A
ND
EM
ISSI
ON
S PL
AN
200
9
30
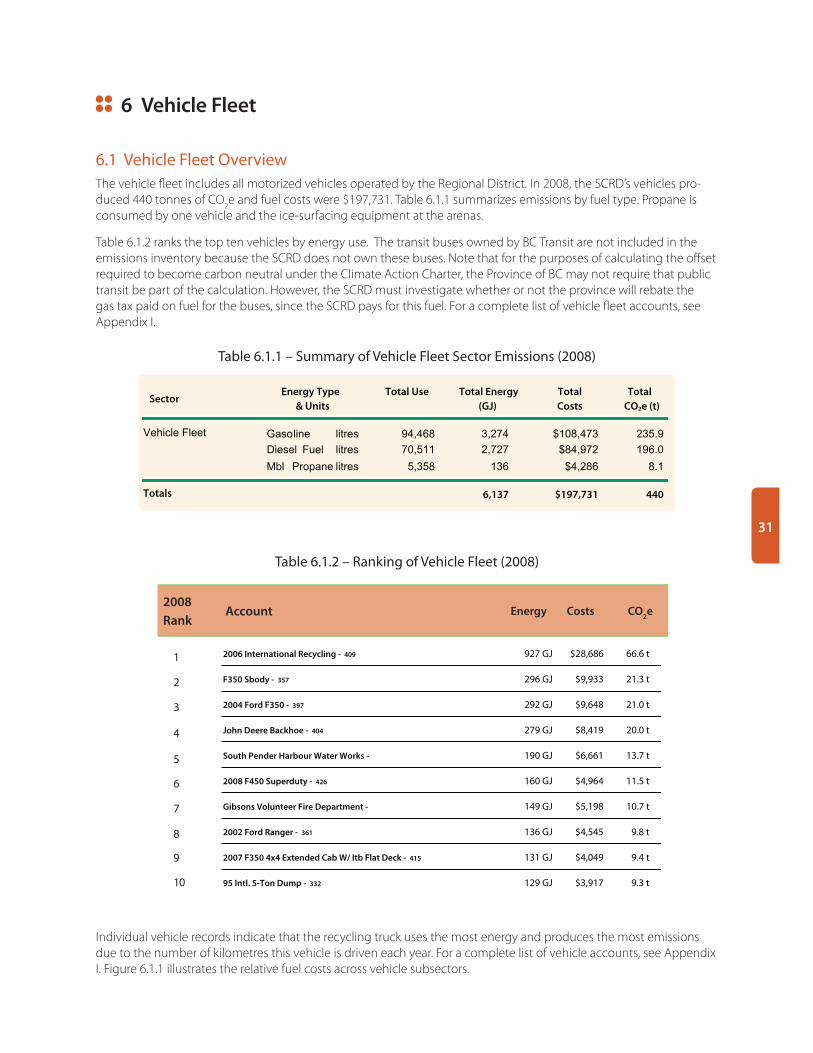
6 Vehicle Fleet
6.1 Vehicle Fleet OverviewThe vehicle fleet includes all motorized vehicles operated by the Regional District. In 2008, the SCRD’s vehicles pro-duced 440 tonnes of CO
2e and fuel costs were $197,731. Table 6.1.1 summarizes emissions by fuel type. Propane is
consumed by one vehicle and the ice-surfacing equipment at the arenas.
Table 6.1.2 ranks the top ten vehicles by energy use. The transit buses owned by BC Transit are not included in the emissions inventory because the SCRD does not own these buses. Note that for the purposes of calculating the offset required to become carbon neutral under the Climate Action Charter, the Province of BC may not require that public transit be part of the calculation. However, the SCRD must investigate whether or not the province will rebate the gas tax paid on fuel for the buses, since the SCRD pays for this fuel. For a complete list of vehicle fleet accounts, see Appendix I.
Table 6.1.1 – Summary of Vehicle Fleet Sector Emissions (2008)
6,137 $197,731 440
Gasoline $108,47394,468litres 3,274 235.9
Diesel Fuel $84,97270,511litres 2,727 196.0
5,358litres 136 $4,286 8.1PropaneMbl
Vehicle Fleet
Sector
Totals
Energy Type& Units
Total Energy(GJ)
TotalCO2e (t)
TotalCosts
Total Use Fuel Efficiency
Table 6.1.2 – Ranking of Vehicle Fleet (2008)
Individual vehicle records indicate that the recycling truck uses the most energy and produces the most emissions due to the number of kilometres this vehicle is driven each year. For a complete list of vehicle accounts, see Appendix I. Figure 6.1.1 illustrates the relative fuel costs across vehicle subsectors.
: Top Energy ConsumersVehicle Fleet CO2eCostsEnergy
2006 International Recycling - 409 927 GJ $28,686 66.6 t
F350 Sbody - 357 296 GJ $9,933 21.3 t
2004 Ford F350 - 397 292 GJ $9,648 21.0 t
John Deere Backhoe - 404 279 GJ $8,419 20.0 t
South Pender Harbour Water Works - 190 GJ $6,661 13.7 t
2008 F450 Superduty - 426 160 GJ $4,964 11.5 t
Gibsons Volunteer Fire Department - 149 GJ $5,198 10.7 t
2002 Ford Ranger - 361 136 GJ $4,545 9.8 t
2007 F350 4x4 Extended Cab W/ Itb Flat Deck - 415 131 GJ $4,049 9.4 t
95 Intl. 5-Ton Dump - 332 129 GJ $3,917 9.3 t
2000 Ford F250 - 354 120 GJ $3,527 8.6 t
2004 Chevrolet Silvr. P/Up - 411 114 GJ $3,771 8.2 t
2005 Pisten Bully Pb100 - 410 111 GJ $2,930 8.0 t
2007 F350 4x2 W/ Reading Service Body - 416 109 GJ $3,426 7.8 t
2007 Ford Ranger Flatdeck - 413 105 GJ $3,109 7.6 t
99 Ford F350 - 318 99 GJ $3,046 7.1 t
2004 Chev Trckr 4drht - 396 98 GJ $3,206 7.0 t
2000 F250 Ford - 354 93 GJ $3,146 6.7 t
North Pender Harbour Water System And Generator - 92 GJ $3,125 6.6 t
Ranger 4x4 2003 - 389 89 GJ $2,964 6.4 t
Water/Wastewater Vehicle - 389 89 GJ $2,964 6.4 t
2007 Ford Ranger Flat Deck - 413 89 GJ $3,025 6.4 t
2000 Suzuki Vitra - 353 86 GJ $2,814 6.2 t
1
2
3
4
5
6
7
8
9
10
2008 Rank
Account Energy Costs CO2e
31

Figure 6.1.1 – Costs for Energy in the Vehicle Fleet Subsectors (2008)
0.5%
29.3%
6.5%
5.1%
30.2%
10.5%
0.4%
8.4%
5.3%
2.8%
1.0%
Diesel Fuel Light Trucks, Vans & Buses Diesel Fuel Medium to Heavy Trucks
Diesel Fuel Off Road Vehicles & Equipment Fire Services
Gasoline Light Trucks, Vans, and SUVs Gasoline Medium to Heavy Trucks & Vans
Gasoline Off Road Vehicles & Equipment Gasoline Passenger Cars
Generators Misc.
Propane Equipment
Gasoline light trucks, vans and SUVs, and diesel-fuel medium to heavy trucks, each make up ~30 percent of fuel costs respectively. Other significant costs are incurred by gasoline medium to heavy trucks and vans (11 percent).
We calculated GHG emissions for two groups of vehicles that are either directly or indirectly associated with the op-erations of the SCRD, although they were not reported here as part of the total emissions.
The first group of vehicles is the public transit buses operated by the SCRD but owned by BC Transit. In accordance with existing protocols, these buses are not counted in the SCRD’s corporate inventory because they are not owned by the district. Transit buses consumed 240,000 litres of diesel fuel in 2008, resulting in approximately 670 tonnes CO
2e. (See Appendix II for the fuel consumption and resulting GHG emissions for transit buses).
The second group of vehicles is those owned by SCRD employees to commute to and from work. These vehicles are indirectly associated with the district and have been included for information only. The SCRD initiated a voluntary survey of staff to attempt to calculate GHG emissions related to employee commuting. Unfortunately, only 35 percent of staff (82 out of a total of 235 staff ) responded to the survey. Of the 82 respondents, the average fuel consumption of vehicles owned by SCRD staff that are driven to and from work was 10.7 litres/100 km, the total estimated distance driven in one year to and from work was 468,826 kilometres, and the estimated fuel consumption was 48,575 litres of gasoline and 898 litres of diesel fuel. The resulting estimates of GHG emissions was 124 tonnes CO
2e. A simplified
extrapolation of this data to estimate the total GHG emissions from employee commuting for 235 SCRD staff resulted in 339 tonnes CO
2e (note: due to a high variability in kilometres driven to and from work (range = 1 to 88 kilometres),
the resulting extrapolation should be used with caution).
SUN
SHIN
E C
OA
ST R
EGIO
NA
L D
ISTR
ICT
CO
RPO
RATE
EN
ERG
Y A
ND
EM
ISSI
ON
S PL
AN
200
9
32

6.2 Vehicle Fleet ForecastIt is difficult to forecast growth in the vehicle sector because it depends on the SCRD’s future service levels to the community. A forecast of one percent growth from the inventory year was estimated based on the number of vehicles that may be added to the fleet in the forecast period and the number of vehicles estimated to be replaced during the project period (e.g., at least 11 vehicles). These estimates are based on typical turnover periods, although actual fleet vehicle replacement depends on a decision by the fleet manager, the manager of the department that owns the vehicle and the Board. We have assumed that replacement vehicles are like-for-like replacements (e.g., a car replaces a car and a truck replaces a truck) and blended the reduction based on the fuel efficiencies of current model years with the addition of new vehicles. Lower fuel consumption rates for new vehicles will result in lower GHG emis-sions in this sector.
Table 6.2.1 – Predicted Growth in the Vehicle Fleet Sector
Sector Deletions and Additions from 2008 to 2018 Forecast Percent (2018)
Vehicle Fleet
No additions to the fleet are expected; however, fleet fuel consumption should rise with increasing service levels as the community grows. Replacing older vehicles will improve fuel efficiency over the forecast period. A 20% blend of biodiesel by 2010 has also been included in the forecast
1%
Fuel price uncertainty is an important factor in both the forecast of energy consumption (table 6.2.2) and energy costs (table 6.2.3). The price of gasoline and diesel fuel are the most difficult to predict. The prediction of $2.50/litre of gasoline and $2.25/litre of diesel fuel is considered conservative and is based on a reputable source (Nesbitt Burns Oil & Gas Research - Oil & Gas Weekly).
Forecasts of fuel prices are highly dependent on local and global economies and current politics in oil-producing countries. In late 2008 and early 2009, fuel price adjustments paralleled the declining global economy, and although the cur-rent downturn in the economy is not expected to extend through to the end of the project period (e.g., 10 years), a rise in gasoline and diesel fuel prices is still anticipated in the near future. In 2008, fuel costs were $190,230, and they are anticipated to rise to $373,515 in 2018.
Table 6.2.2 – Forecast of Vehicle Fleet Consumption
Energy Type/Unit Consumption Energy
(GJ)Forecasted
Percent Forecasted Energy (GJ)
Forecasted Total Energy (GJ)
2008 2018
Gasoline (L) 94,468 3,274 1.01 3,307
6,197 Diesel Fuel (L) 70,511 2,727 1.01 2,754
Propane (L) 5,358 136 1 136
Table 6.2.3 – Forecast of Vehicle Fleet Costs
Energy Type/Unit Consumption Unit Costs Costs Total Cost Forecasted
Unit cost Forecasted
CostsForecasted Total Costs
2008 2018
Gasoline (L) 94,468 $1.15 108,473
$197,731
$2.25 $214,679
$398,077 Diesel Fuel (L) 70,511 $1.33 $84,972 $2.5 $178,040
Propane 5,358 $0.85 $4,286 1 $5,358
33

Table 6.2.4 – Forecast of Vehicle Fleet Emissions
Energy Type
Emissions CO2e (t)
Total CO2e (t)
Forecast Percent
Forecasted Emis-sions CO2e (t)
Forecasted Total Emissions CO2e (t)
2008 2018
Gasoline (L) 236
440
1.01 238
444 Diesel Fuel (L) 196 1.01 198
Propane (L) 8 1 8
6.3 Reduction InitiativesAdministrative Recommendations
A number of administrative recommendations are suggested as follows:
1. Propose a Board Resolution to purchase fuel-efficient vehicles as a priority over price point. This initiative will en-sure that fuel efficiency is given greater priority when making vehicle purchases.
2. Centralize the fleet to provide a consistent approach to vehicle purchases and allow the fleet manager to imple-ment policies that incorporate fuel efficiency into the purchasing and ongoing maintenance of vehicles. This initiative is to ensure that the fleet manager is able to integrate fuel efficiency with regular fleet maintenance and integrate preventative maintenance practices, replacement schedules, vehicle right sizing and shared use of vehicles among staff as appropriate.
Initiatives Completed and/or Underway
Reduction measures in the vehicle fleet sector are difficult to track from year to year since vehicle use (as indicated by the kilometres travelled for individual vehicles in a given year) depends on factors that are not tracked (such as the number of projects undertaken by staff, location of projects within the regional district boundary, proximity of projects to vehicle home base, etc.).
One reduction initiative in this sector is the replacement of fleet vehicles’ fuel management system to i. ensure fuel consumption tracking and reporting.
Proposed Reduction Initiatives
Table 6.3.1 summarizes the estimated reductions in energy use, energy costs and GHG emissions for proposed reduc-tion initiatives (as approved by the Board on an annual basis).
Table 6.3.1 – Proposed Reduction Initiatives in the Vehicle Fleet Sector
Vehicle FleetConsumption CO2e (t)
Annual Savings
Costs Three Years Seven Years
Simple Payback Period
Five Years
1,074 GJ 72 t$32,198TOTAL THIS SECTOR:
SUBTOTALS 8,264 L $9,871 23 t19,511 L $22,327 49 tGasoline
Diesel Fuel $29,612$66,982
$49,353$111,637
$69,095$156,292
SUN
SHIN
E C
OA
ST R
EGIO
NA
L D
ISTR
ICT
CO
RPO
RATE
EN
ERG
Y A
ND
EM
ISSI
ON
S PL
AN
200
9
34

The following reduction initiatives are proposed:
Provide a pool of vehicles for staff use while on Regional District business. Staff should investigate estab-i. lishing a pool of fuel-efficient vehicles, or other sustainable transportation modes, available for their use on business so that they have the option of commuting to work by non-auto modes (e.g., if staff must use their personal vehicle for business, then they must drive their car to and from work);
Establish a video conference system in key SCRD buildings (such as the works yard and the Administration ii. Building) to reduce the need to travel to meetings. Staff should with ask their peer networks in other orga-nizations whether they have similar technology and encourage peer organizations to incorporate similar technology;
Ensure that vehicle purchases are not solely based on life-cycle costs and end residual value. Purchase iii. decisions must emphasize fuel efficiency (given the rising cost of fuel) and should ensure that the vehicle is right-sized for the task it is being purchased for. The fleet manager must adjust the weighting of price point so that vehicle equipment and fuel efficiency are carefully balanced according to specific vehicle use (equipment, number of crew, ancillary equipment, towing capabilities, etc.);
Establish regular and accurate fuel consumption and fuel efficiency reporting so that staff understand how iv. their vehicle is performing and how their driving behaviour affects fuel efficiency;
Provide driver training for new and existing staff;v.
Adopt an Idle Free Policy to discourage unnecessary vehicle idling across all departments, including per-vi. sonal vehicle use while on SCRD business;
Ensure that all new passenger vehicles are as fuel efficient as possible for their prescribed use. All new light vii. trucks and utility vehicles that do not have heavy load requirements should be as fuel efficient as possible. Testing of electric-gasoline hybrid vehicles is important, as is the availability of locally trained mechanics that are certified to work on such vehicles;
Inflate tires with nitrogen; viii.
Specify tier 3 emissions control equipment in tenders for medium to heavy trucks. The recycling truck ix. (vehicle # 409) should be retrofitted with a diesel oxidation catalyst;
Track maintenance costs to help establish a replacement schedule; and,x.
Replace two-stroke engines with four-stroke engines where available (e.g., small equipment).xi.
Proposed Reduction Initiatives
These reduction initiatives would result in savings of approximately 1,100 GJ of energy (e.g., 8,000 litres of diesel fuel and 19,000 litres of gasoline) at an approximate cost savings of $32,000, calculated at 2008 costs for gasoline and diesel fuel. The estimated energy reductions would result in an emissions reduction of 72 tonnes CO
2e.
The reduction estimate includes various reduction measures that have been applied to classes of similar vehicles as presented in the subsections that follow.
Diesel Fuel Fire Department Vehicles
Proposed diesel oxidation catalysts (efficient technology) for heavy fire department trucks have an insignificant effect on GHG emissions, but are included as an initiative that reduces particulate matter and nitrous oxide emissions (non-GHG emissions). An advanced fuel management system is also proposed. The total reductions in energy consump-tion, costs, and CO
2e (t) are provided in the table below.Vehicle Fleet
Consumption CO2e (t)
Annual Savings
Costs Three Years Seven Years
Simple Payback Period
Five Years
Consumption CO2e (t)
Reductions After Implementation
CostsDIESEL FUEL FIRE DEPT.
Three Year Seven Years
Simple Payback
Five Years
TOTAL THIS SUBSECTOR: 7 GJ 1 t$246
35
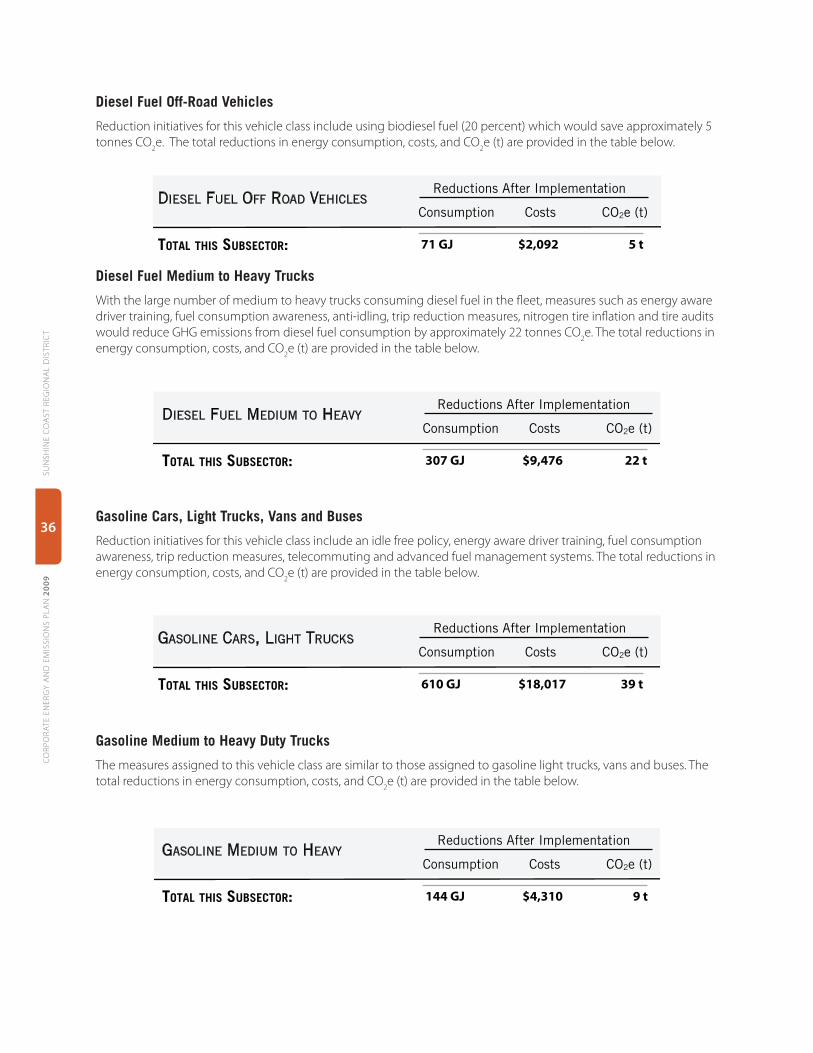
Diesel Fuel Off-Road Vehicles
Reduction initiatives for this vehicle class include using biodiesel fuel (20 percent) which would save approximately 5 tonnes CO
2e. The total reductions in energy consumption, costs, and CO
2e (t) are provided in the table below.
Consumption CO2e (t)
Reductions After Implementation
CostsDIESEL FUEL OFF ROAD VEHICLES
Three Year Seven Years
Simple Payback
Five Years
TOTAL THIS SUBSECTOR: 71 GJ 5 t$2,092
Diesel Fuel Medium to Heavy Trucks
With the large number of medium to heavy trucks consuming diesel fuel in the fleet, measures such as energy aware driver training, fuel consumption awareness, anti-idling, trip reduction measures, nitrogen tire inflation and tire audits would reduce GHG emissions from diesel fuel consumption by approximately 22 tonnes CO
2e. The total reductions in
energy consumption, costs, and CO2e (t) are provided in the table below.
Consumption CO2e (t)
Reductions After Implementation
CostsDIESEL FUEL MEDIUM TO HEAVY
Three Year Seven Years
Simple Payback
Five Years
TOTAL THIS SUBSECTOR: 307 GJ 22 t$9,476
Gasoline Cars, Light Trucks, Vans and Buses
Reduction initiatives for this vehicle class include an idle free policy, energy aware driver training, fuel consumption awareness, trip reduction measures, telecommuting and advanced fuel management systems. The total reductions in energy consumption, costs, and CO
2e (t) are provided in the table below.
Consumption CO2e (t)
Reductions After Implementation
CostsGASOLINE CARS, LIGHT TRUCKS
Three Year Seven Years
Simple Payback
Five Years
TOTAL THIS SUBSECTOR: 610 GJ 39 t$18,017
Gasoline Medium to Heavy Duty Trucks
The measures assigned to this vehicle class are similar to those assigned to gasoline light trucks, vans and buses. The total reductions in energy consumption, costs, and CO
2e (t) are provided in the table below.
Consumption CO2e (t)
Reductions After Implementation
CostsGASOLINE MEDIUM TO HEAVY
Three Year Seven Years
Simple Payback
Five Years
TOTAL THIS SUBSECTOR: 144 GJ 9 t$4,310
SUN
SHIN
E C
OA
ST R
EGIO
NA
L D
ISTR
ICT
CO
RPO
RATE
EN
ERG
Y A
ND
EM
ISSI
ON
S PL
AN
200
9
36
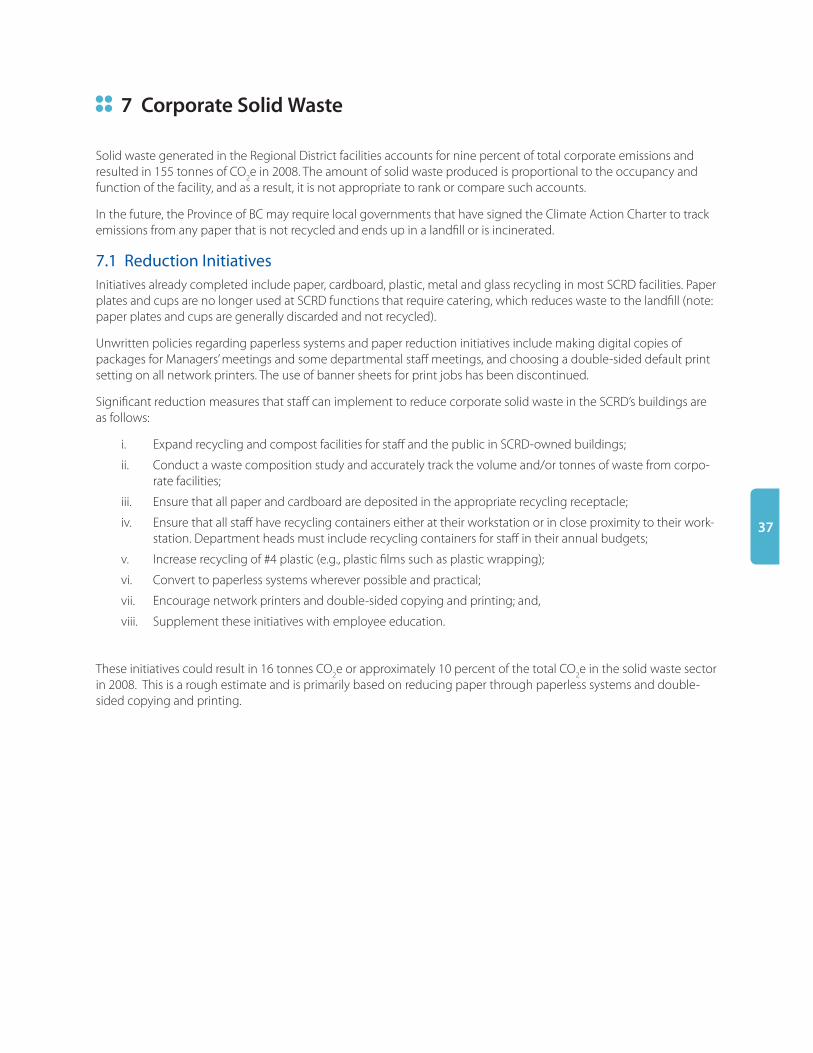
7 Corporate Solid Waste
Solid waste generated in the Regional District facilities accounts for nine percent of total corporate emissions and resulted in 155 tonnes of CO
2e in 2008. The amount of solid waste produced is proportional to the occupancy and
function of the facility, and as a result, it is not appropriate to rank or compare such accounts.
In the future, the Province of BC may require local governments that have signed the Climate Action Charter to track emissions from any paper that is not recycled and ends up in a landfill or is incinerated.
7.1 Reduction InitiativesInitiatives already completed include paper, cardboard, plastic, metal and glass recycling in most SCRD facilities. Paper plates and cups are no longer used at SCRD functions that require catering, which reduces waste to the landfill (note: paper plates and cups are generally discarded and not recycled).
Unwritten policies regarding paperless systems and paper reduction initiatives include making digital copies of packages for Managers’ meetings and some departmental staff meetings, and choosing a double-sided default print setting on all network printers. The use of banner sheets for print jobs has been discontinued.
Significant reduction measures that staff can implement to reduce corporate solid waste in the SCRD’s buildings are as follows:
Expand recycling and compost facilities for staff and the public in SCRD-owned buildings;i.
Conduct a waste composition study and accurately track the volume and/or tonnes of waste from corpo-ii. rate facilities;
Ensure that all paper and cardboard are deposited in the appropriate recycling receptacle;iii.
Ensure that all staff have recycling containers either at their workstation or in close proximity to their work-iv. station. Department heads must include recycling containers for staff in their annual budgets;
Increase recycling of #4 plastic (e.g., plastic films such as plastic wrapping);v.
Convert to paperless systems wherever possible and practical;vi.
Encourage network printers and double-sided copying and printing; and, vii.
Supplement these initiatives with employee education.viii.
These initiatives could result in 16 tonnes CO2e or approximately 10 percent of the total CO
2e in the solid waste sector
in 2008. This is a rough estimate and is primarily based on reducing paper through paperless systems and double-sided copying and printing.
37

8 Summary
In 2008, the buildings sector ranked first in total energy consumed, energy costs and GHG emissions. Following build-ings, a significant amount of energy is consumed by the vehicle fleet sector.
A summary of overall emissions is provided in table 8.1.
Table 8.1 – Inventory Summary
Parameter 2008
Energy Consumption 52,230 GJEnergy Costs $988,569Emissions 1,806 tonnes CO2e
Summary of Corporate Emission Reductions There are many opportunities for new GHG reductions within the SCRD’s operations. By implementing the initiatives described in Sections 3 through 7, and further described in the Technical Compendium of Reduction Initiatives, the SCRD would be able to reduce GHG emissions by 28 percent over the forecast period. Table 8.2 provides a summary of the potential reductions in each corporate sector.
Table 8.2 – Summary of Estimated Impact of Reduction Measures on the Corporate Sectors
Sector2008 Base
Year Emissions (tonnes CO2e)
2018 Emissions Projection
(tonnes CO2e)
Reductions from 2010-2018
Implementation
Emissions after
Reductions (2018)
Overall Percent
Reduction (2018)
Buildings 1,123 1,179 469 710 -37%
Outdoor Lighting1 7 8 1 7 0%
Water and Wastewater2 81 85 5 80 -1%
Vehicle Fleet 440 444 72 372 -15%
Corporate Solid Waste3 155 159 16 143 -8%
Totals 1,806 1,875 563 1,312 -27%
1 Lighting includes all overhead streetlights owned by the SCRD, sportsfield lighting, parking lots, etc.
2 The estimate in the water and wastewater sector is qualitative
3 Solid waste from all SCRD facilities
Reduction Target Statement:
The Sunshine Coast Regional District can reduce GHG emissions by 27 percent by reducing its 2008 base year emissions quantity by 563 tonnes CO2e by 2018.
SUN
SHIN
E C
OA
ST R
EGIO
NA
L D
ISTR
ICT
CO
RPO
RATE
EN
ERG
Y A
ND
EM
ISSI
ON
S PL
AN
200
9
38

Glossary of Terms (IPCC 2006)Carbon dioxide (CO2): A naturally occurring gas; also a byproduct of burning fossil fuels and biomass, as well as land use changes and other industrial processes. It is the principal anthropogenic greenhouse gas that affects the earth’s radiative balance. It is the reference gas against which other greenhouse gases are measured and therefore has a Global Warming Potential of 1.
Climate change: A statistically significant variation in either the mean state of the climate or in its variability, persist-ing for an extended period (typically decades or longer). Climate change may be due to natural internal processes or external forcings, or to persistent anthropogenic changes in the composition of the atmosphere or in land use.
Note that the Framework Convention on Climate Change (UNFCCC), in its Article 1, defines “climate change” as “a change of climate which is attributed directly or indirectly to human activity that alters the composition of the global atmosphere and which is in addition to natural climate variability observed over comparable time periods.” The UNFCCC thus makes a distinction between “climate change” attributable to human activities altering the atmospheric composition and “climate variability” attributable to natural causes.
Equivalent CO2 (CO2e): The concentration of CO2 that would cause the same amount of radiative forcing as a given
mixture of CO2 and other greenhouse gases.
GJ (GigaJoules): A Canadian unit of heating value equivalent to 943,213.3 Btu. The standard gas unit in Canada is the gigajoule pursuant to GISB under Order 587-A (1997). A gigajoule (GJ) is a metric term used for measuring energy use. For example, 1 GJ is equal to 277.8 kWh of electricity, 26.9 m³ of natural gas, 25.9 litres of heating oil. Similar to the energy released when burning a million wooden matches, a gigajoule of gas will cook over 2500 hamburgers, and a gigajoule of electricity will keep a 60-watt bulb continuously lit for six months.
Greenhouse gas: Gaseous constituents of the atmosphere, both natural and anthropogenic, that absorb and emit radiation at specific wavelengths within the spectrum of infrared radiation emitted by the Earth’s surface, the atmo-sphere, and clouds. This property of greenhouse gases causes the greenhouse effect. Water vapour (H
2O), carbon
dioxide (CO2), nitrous oxide (N
2O), methane (CH
4) and ozone (O
3) are the primary greenhouse gases in the Earth’s
atmosphere. Moreover, there are a number of entirely human-made greenhouse gases in the atmosphere, such as the halocarbons and other chlorine- and bromine-containing substances, dealt with under the Montreal Protocol. Besides CO
2, N
2O, and CH
4, the Kyoto Protocol deals with the greenhouse gases sulphur hexafluoride (SF
6), hydrofluorocar-
bons (HFCs), and perfluorocarbons (PFCs).
Kyoto Protocol to the United Nations Framework Convention on Climate Change (UNFCCC): The Kyoto Proto-col was adopted at the Third Session of the Conference of the Parties (COP) to the UNFCCC in 1997 in Kyoto, Japan. It contains legally binding commitments in addition to those included in the UNFCCC. Countries included in Annex B of the Protocol (Organisation for Economic Co-operation and Development countries and countries with economies in transition) agreed to reduce their anthropogenic greenhouse gas emissions (CO2, CH4, N2O, HFCs, PFCs, and SF6) by at least 5% below 1990 levels in the commitment period 2008 to 2012. The Kyoto Protocol entered into force on February 16, 2005.
Methane (CH4): An odorless, colorless, flammable gas, CH4, the major constituent of natural gas, that is used as a fuel
and is an important source of hydrogen and a wide variety of organic compounds.
Nitrous Oxide (N2O): A powerful greenhouse gas with a global warming potential most recently evaluated at 310. Major sources of nitrous oxide include soil cultivation practices, especially the use of commercial and organic fertil-izers, fossil fuel combustion, nitric acid production, and biomass burning.
United Nations Framework Convention on Climate Change (UNFCC): The Convention was adopted on May 9, 1992, in New York and signed at the 1992 Earth Summit in Rio de Janeiro by more than 150 countries and the European Community. Its ultimate objective is the “stabilisation of greenhouse gas concentrations in the atmosphere at a level that would prevent dangerous anthropogenic interference with the climate system.” It contains commit-ments for all parties. Under the Convention, parties included in Annex I aim to return greenhouse gas emissions not controlled by the Montreal Protocol to 1990 levels by the year 2000. The convention entered into force in March 1994. See: Kyoto Protocol.
39
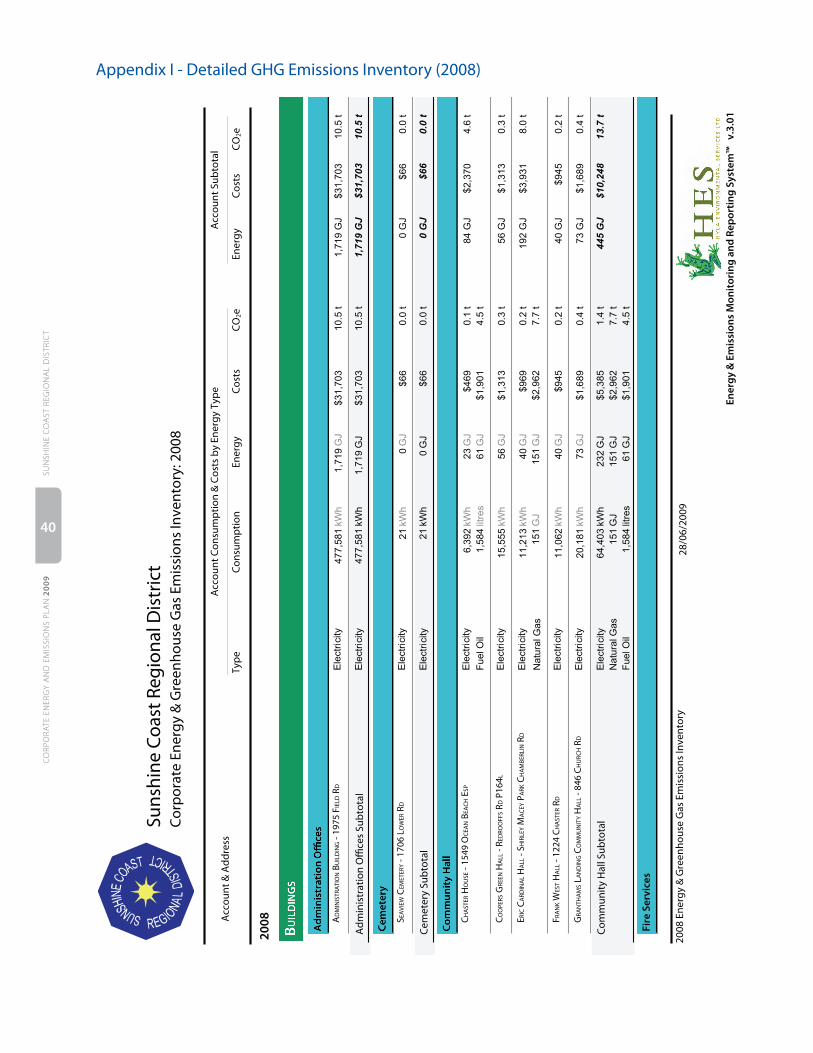
Appendix I - Detailed GHG Emissions Inventory (2008)
Cor
por
ate
Ener
gy &
Gre
enho
use
Gas
Em
issi
ons
Inve
ntor
y: 2
008
CO
2eC
osts
Ener
gyC
onsu
mp
tion
Ener
gyC
osts
CO
2eTy
pe
Acc
ount
& A
dd
ress
Acc
ount
Sub
tota
lA
ccou
nt C
onsu
mp
tion
& C
osts
by
Ener
gy T
ype
Suns
hine
Coa
st R
egio
nal D
istr
ict
2008
BU
ILD
ING
S
Ad
min
istr
atio
n O
ffice
s
AD
MIN
ISTR
ATI
ON
BU
ILD
ING
- 19
75 F
IELD
RD
$3
1,7
03
1,7
19
GJ
$3
1,7
03
10
.5 t
10
.5 t
47
7,5
81
kW
h1
,71
9G
JE
lectr
icity
Ad
min
istr
atio
n O
ffice
s Su
bto
tal
1,7
19
GJ
$3
1,7
03
10
.5 t
$3
1,7
03
47
7,5
81
kW
hE
lectr
icity
1,7
19
GJ
10
.5 t
Cem
eter
y
SEA
VIEW
CEM
ETER
Y - 1
706
LOW
ER R
D$
66
0 G
J$
66
0.0
t0
.0 t
21
kW
h0
GJ
Ele
ctr
icity
Cem
eter
y Su
bto
tal
0 G
J$
66
0.0
t$
66
21
kW
hE
lectr
icity
0G
J0
.0 t
Com
mu
nit
y H
all
CH
AST
ER H
OU
SE -
1549
OC
EAN
BEA
CH
ESP
$4
69
$1
,90
1
84
GJ
$2
,37
04
.6 t
0.1
t
4.5
t
6,3
92
kW
h
1,5
84
litre
s
23
GJ
61
GJ
Fu
elO
il
Ele
ctr
icity
CO
OPE
RS G
REEN
HA
LL -
RED
ROO
FFS R
D P
164L
$1
,31
35
6 G
J$
1,3
13
0.3
t0
.3 t
15
,55
5kW
h5
6G
JE
lectr
icity
ERIC
CA
RDIN
AL H
ALL
- SH
IRLE
Y M
AC
EY P
ARK
CH
AM
BERL
IN R
D$
96
9
$2
,96
2
19
2 G
J$
3,9
31
8.0
t0
.2 t
7.7
t
11
,21
3kW
h
15
1G
J
40
GJ
15
1G
JN
atu
ralG
as
Ele
ctr
icity
F RA
NK
WES
T HA
LL -
1224
CH
AST
ER R
D$
94
54
0 G
J$
94
50
.2 t
0.2
t1
1,0
62
kW
h4
0G
JE
lectr
icity
GRA
NTH
AM
S LA
ND
ING
CO
MM
UN
ITY
HA
LL -
846
CH
URC
H R
D$
1,6
89
73
GJ
$1
,68
90
.4 t
0.4
t2
0,1
81
kW
h7
3G
JE
lectr
icity
Com
mun
ity
Hal
l Sub
tota
l4
45
GJ
$1
0,2
48
13
.7 t
$5
,38
56
4,4
03
kW
hE
lectr
icity
23
2G
J1
.4 t
$2
,96
21
51
GJ
Na
tura
lG
as
15
1G
J7
.7 t
$1
,90
11
,58
4lit
res
61
GJ
4.5
tF
ue
lO
il
Fire
Ser
vice
s
28/0
6/20
0920
08 E
nerg
y &
Gre
enho
use
Gas
Em
issi
ons
Inve
ntor
y
Ener
gy
& E
mis
sion
s M
onit
orin
g a
nd
Rep
orti
ng
Sys
tem
™
v.3.
01
SUN
SHIN
E C
OA
ST R
EGIO
NA
L D
ISTR
ICT
CO
RPO
RATE
EN
ERG
Y A
ND
EM
ISSI
ON
S PL
AN
200
9
40
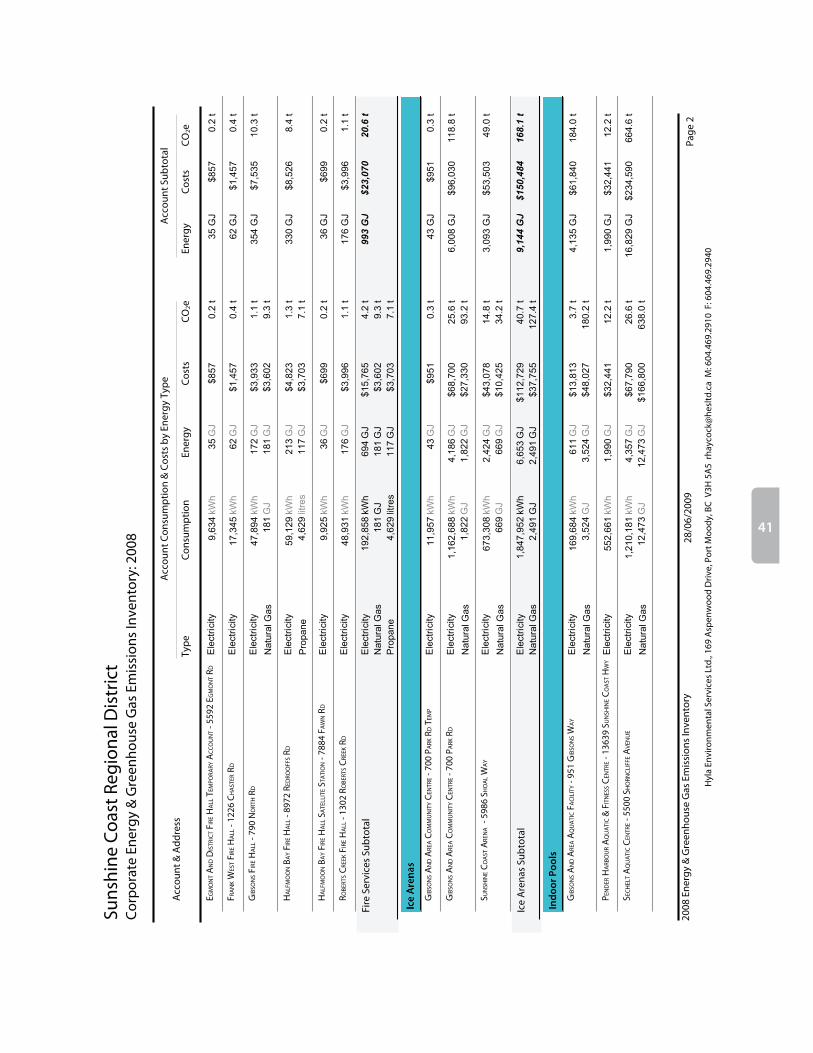
Cor
por
ate
Ener
gy &
Gre
enho
use
Gas
Em
issi
ons
Inve
ntor
y: 2
008
Suns
hine
Coa
st R
egio
nal D
istr
ict
CO
2eC
osts
Ener
gyC
onsu
mp
tion
Ener
gyC
osts
CO
2eTy
pe
Acc
ount
& A
ddre
ssA
ccou
nt S
ubto
tal
Acc
ount
Con
sum
ptio
n &
Cos
ts b
y En
ergy
Typ
e
EGM
ON
T AN
D D
ISTR
ICT F
IRE H
ALL
TEM
PORA
RY A
CC
OU
NT -
559
2 EG
MO
NT R
D$857
35 G
J$857
0.2
t0.2
t9,6
34
kW
h35
GJ
Ele
ctr
icity
FRA
NK
WES
T FIR
E HA
LL -
1226
CH
AST
ER R
D$1,4
57
62 G
J$1,4
57
0.4
t0.4
t17,3
45
kW
h62
GJ
Ele
ctr
icity
GIB
SON
S FIR
E HA
LL -
790
NO
RTH
RD
$3,9
33
$3,6
02
354 G
J$7,5
35
10.3
t1.1
t
9.3
t
47,8
94
kW
h
181
GJ
172
GJ
181
GJ
Natu
ralG
as
Ele
ctr
icity
HA
LFM
OO
N B
AY
FIRE
HA
LL -
8972
RED
ROO
FFS R
D$4,8
23
330 G
J$8,5
26
8.4
t
$3,7
03
1.3
t
7.1
t
59,1
29
kW
h
4,6
29
litre
s
213
GJ
117
GJ
Pro
pane
Ele
ctr
icity
HA
LFM
OO
N B
AY
FIRE
HA
LL S
ATE
LLIT
E STA
TIO
N -
7884
FA
WN
RD
$699
36 G
J$699
0.2
t0.2
t9,9
25
kW
h36
GJ
Ele
ctr
icity
ROBE
RTS C
REEK
FIR
E HA
LL -
1302
RO
BERT
S CRE
EK R
D$3,9
96
176 G
J$3,9
96
1.1
t1.1
t48,9
31
kW
h176
GJ
Ele
ctr
icity
Fire
Ser
vice
s Su
bto
tal
993 G
J$23,0
70
20.6
t$15,7
65
192,8
58
kW
hE
lectr
icity
694
GJ
4.2
t
$3,6
02
181
GJ
Natu
ralG
as
181
GJ
9.3
t
Pro
pane
4,6
29
litre
s117
$3,7
03
GJ
7.1
t
Ice
Are
nas
GIB
SON
S AN
D A
REA C
OM
MU
NIT
Y C
ENTR
E - 7
00 P
ARK
RD
TEM
P$951
43 G
J$951
0.3
t0.3
t11,9
57
kW
h43
GJ
Ele
ctr
icity
GIB
SON
S AN
D A
REA C
OM
MU
NIT
Y C
ENTR
E - 7
00 P
ARK
RD
$68,7
00
$27,3
30
6,0
08 G
J$96,0
30
118.8
t25.6
t
93.2
t
1,1
62,6
88
kW
h
1,8
22
GJ
4,1
86
GJ
1,8
22
GJ
Natu
ralG
as
Ele
ctr
icity
S UN
SHIN
E CO
AST
ARE
NA -
598
6 SH
OA
L WA
Y$43,0
78
$10,4
25
3,0
93 G
J$53,5
03
49.0
t14.8
t
34.2
t
673,3
08
kW
h
669
GJ
2,4
24
GJ
669
GJ
Natu
ralG
as
Ele
ctr
icity
Ice
Are
nas
Sub
tota
l9,1
44 G
J$150,4
84
168.1
t$112,7
29
1,8
47,9
52
kW
hE
lectr
icity
6,6
53
GJ
40.7
t
$37,7
55
2,4
91
GJ
Natu
ralG
as
2,4
91
GJ
127.4
t
Ind
oor P
ools
GIB
SON
S AN
D A
REA A
QU
ATI
C F
AC
ILIT
Y - 9
51 G
IBSO
NS W
AY
$13,8
13
$48,0
27
4,1
35 G
J$61,8
40
184.0
t3.7
t
180.2
t
169,6
84
kW
h
3,5
24
GJ
611
GJ
3,5
24
GJ
Natu
ralG
as
Ele
ctr
icity
P EN
DER
HA
RBO
UR
AQ
UA
TIC &
FIT
NES
S CEN
TRE -
136
39 S
UN
SHIN
E CO
AST
HW
Y$32,4
41
1,9
90 G
J$32,4
41
12.2
t12.2
t552,6
61
kW
h1,9
90
GJ
Ele
ctr
icity
SEC
HEL
T AQ
UA
TIC C
ENTR
E - 5
500
SHO
RNC
LIFF
E AVE
NU
E$67,7
90
$166,8
00
16,8
29 G
J$234,5
90
664.6
t26.6
t
638.0
t
1,2
10,1
81
kW
h
12,4
73
GJ
4,3
57
GJ
12,4
73
GJ
Natu
ralG
as
Ele
ctr
icity
28/0
6/20
09Pa
ge 2
2008
Ene
rgy
& G
reen
hous
e G
as E
mis
sion
s In
vent
ory
Hyl
a En
viro
nmen
tal S
ervi
ces
Ltd.
, 169
Asp
enw
ood
Driv
e, P
ort M
oody
, BC
V3H
5A
5 rh
ayco
ck@
hesl
td.c
a M
: 604
.469
.291
0 F
: 604
.469
.294
0
41
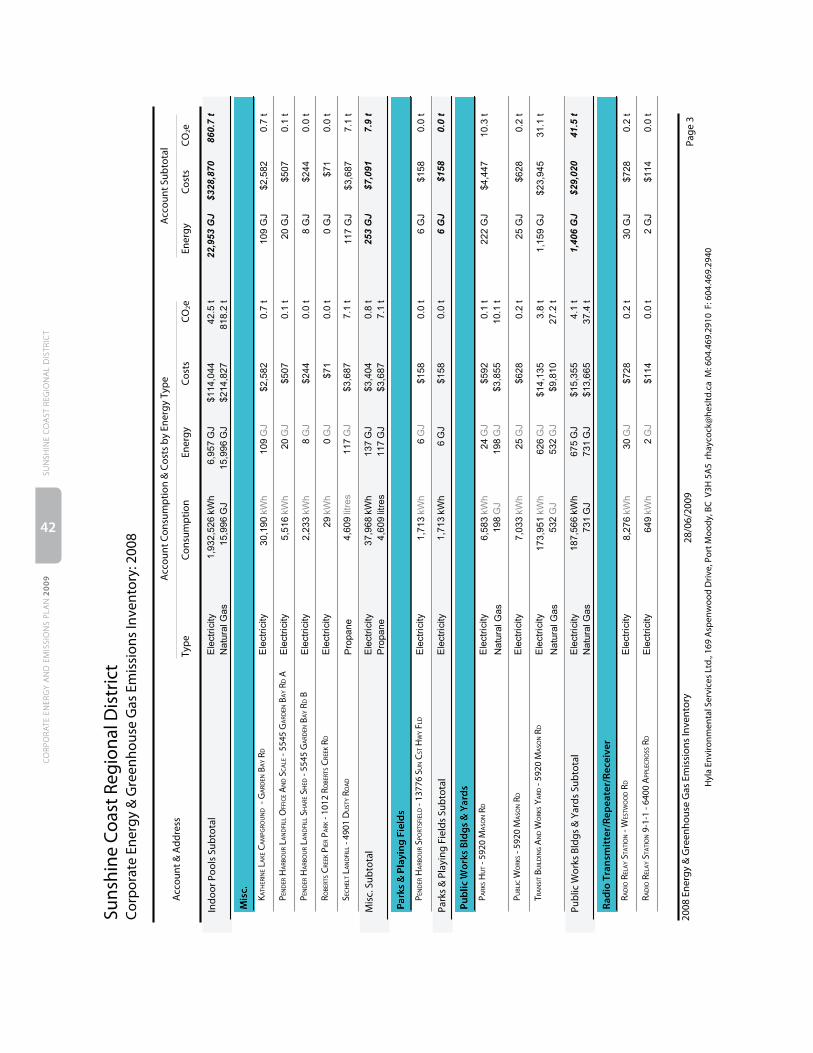
Cor
por
ate
Ener
gy &
Gre
enho
use
Gas
Em
issi
ons
Inve
ntor
y: 2
008
Suns
hine
Coa
st R
egio
nal D
istr
ict
CO
2eC
osts
Ener
gyC
onsu
mp
tion
Ener
gyC
osts
CO
2eTy
pe
Acc
ount
& A
ddre
ssA
ccou
nt S
ubto
tal
Acc
ount
Con
sum
ptio
n &
Cos
ts b
y En
ergy
Typ
e
Indo
or P
ools
Sub
tota
l22,9
53 G
J$328,8
70
860.7
t$114,0
44
1,9
32,5
26
kW
hE
lectr
icity
6,9
57
GJ
42.5
t
$214,8
27
15,9
96
GJ
Natu
ralG
as
15,9
96
GJ
818.2
t
Mis
c.
KATH
ERIN
E LA
KE C
AM
PGRO
UN
D -
GA
RDEN
BA
Y RD
$2,5
82
109 G
J$2,5
82
0.7
t0.7
t30,1
90
kW
h109
GJ
Ele
ctr
icity
PEN
DER
HA
RBO
UR
LAN
DFI
LL O
FFIC
E AN
D S
CA
LE -
5545
GA
RDEN
BA
Y RD
A$507
20 G
J$507
0.1
t0.1
t5,5
16
kW
h20
GJ
Ele
ctr
icity
PEN
DER
HA
RBO
UR
LAN
DFI
LL S
HA
RE S
HED
- 55
45 G
ARD
EN B
AY
RD B
$244
8 G
J$244
0.0
t0.0
t2,2
33
kW
h8
GJ
Ele
ctr
icity
ROBE
RTS C
REEK
PIE
R PA
RK -
1012
RO
BERT
S CRE
EK R
D$71
0 G
J$71
0.0
t0.0
t29
kW
h0
GJ
Ele
ctr
icity
SEC
HEL
T LA
ND
FILL
- 49
01 D
UST
Y RO
AD
117 G
J$3,6
87
7.1
t$3,6
87
7.1
t4,6
09
litre
s117
GJ
Pro
pane
Mis
c. S
ubto
tal
253 G
J$7,0
91
7.9
t$3,4
04
37,9
68
kW
hE
lectr
icity
137
GJ
0.8
t
Pro
pane
4,6
09
litre
s117
$3,6
87
GJ
7.1
t
Park
s &
Pla
yin
g F
ield
s
PEN
DER
HA
RBO
UR
SPO
RTSF
IELD
- 13
776
SUN
CST
HW
Y FL
D$158
6 G
J$158
0.0
t0.0
t1,7
13
kW
h6
GJ
Ele
ctr
icity
Park
s &
Pla
ying
Fie
lds
Sub
tota
l6 G
J$158
0.0
t$158
1,7
13
kW
hE
lectr
icity
6G
J0.0
t
Pub
lic W
orks
Bld
gs
& Y
ard
s
PARK
S HU
T - 5
920
MA
SON
RD
$592
$3,8
55
222 G
J$4,4
47
10.3
t0.1
t
10.1
t
6,5
83
kW
h
198
GJ
24
GJ
198
GJ
Natu
ralG
as
Ele
ctr
icity
P UBL
IC W
ORK
S - 5
920
MA
SON
RD
$628
25 G
J$628
0.2
t0.2
t7,0
33
kW
h25
GJ
Ele
ctr
icity
TRA
NSI
T BU
ILD
ING
AN
D W
ORK
S YA
RD -
5920
MA
SON
RD
$14,1
35
$9,8
10
1,1
59 G
J$23,9
45
31.1
t3.8
t
27.2
t
173,9
51
kW
h
532
GJ
626
GJ
532
GJ
Natu
ralG
as
Ele
ctr
icity
Pub
lic W
orks
Bld
gs &
Yar
ds S
ubto
tal
1,4
06 G
J$29,0
20
41.5
t$15,3
55
187,5
66
kW
hE
lectr
icity
675
GJ
4.1
t
$13,6
65
731
GJ
Natu
ralG
as
731
GJ
37.4
t
Rad
io T
ran
smit
ter/
Rep
eate
r/Re
ceiv
er
RAD
IO R
ELA
Y ST
ATI
ON
- W
ESTW
OO
D R
D$728
30 G
J$728
0.2
t0.2
t8,2
76
kW
h30
GJ
Ele
ctr
icity
RAD
IO R
ELA
Y ST
ATI
ON
9-1
-1 -
6400
APP
LEC
ROSS
RD
$114
2 G
J$114
0.0
t0.0
t649
kW
h2
GJ
Ele
ctr
icity
28/0
6/20
09Pa
ge 3
2008
Ene
rgy
& G
reen
hous
e G
as E
mis
sion
s In
vent
ory
Hyl
a En
viro
nmen
tal S
ervi
ces
Ltd.
, 169
Asp
enw
ood
Driv
e, P
ort M
oody
, BC
V3H
5A
5 rh
ayco
ck@
hesl
td.c
a M
: 604
.469
.291
0 F
: 604
.469
.294
0
SUN
SHIN
E C
OA
ST R
EGIO
NA
L D
ISTR
ICT
CO
RPO
RATE
EN
ERG
Y A
ND
EM
ISSI
ON
S PL
AN
200
9
42

Cor
por
ate
Ener
gy &
Gre
enho
use
Gas
Em
issi
ons
Inve
ntor
y: 2
008
Suns
hine
Coa
st R
egio
nal D
istr
ict
CO
2eC
osts
Ener
gyC
onsu
mp
tion
Ener
gyC
osts
CO
2eTy
pe
Acc
ount
& A
ddre
ssA
ccou
nt S
ubto
tal
Acc
ount
Con
sum
ptio
n &
Cos
ts b
y En
ergy
Typ
e
Radi
o Tr
ansm
itter
/Rep
eate
r/Re
ceiv
er S
ubto
tal
32 G
J$842
0.2
t$842
8,9
25
kW
hE
lectr
icity
32
GJ
0.2
t
Stor
age
Faci
lity
STO
RAG
E - B
ROW
NIN
G R
D$15
0 G
J$15
0.0
t0.0
t52
kW
h0
GJ
Ele
ctr
icity
Stor
age
Faci
lity
Sub
tota
l0 G
J$15
0.0
t$15
52
kW
hE
lectr
icity
0G
J0.0
t
Consum
ption
CO
e 2C
osts
Energ
y
9,2
38
36,9
51 G
J$581,5
68
1,1
23.3
t
$299,4
66
4,7
51,5
66
kW
hE
lectr
icity
17,1
06
GJ
104.5
t
$272,8
11
19,5
50
GJ
Natu
ral
Gas
19,5
50
GJ
1,0
00.0
t
$1,9
01
1,5
84
litre
s61
GJ
4.5
tF
uelO
il Pro
pane
litre
s234
$7,3
90
GJ
14.2
tS
tnry
Build
ings
Sub
tota
l
LIG
HTI
NG
Doc
k Li
gh
t
HA
LFM
OO
N B
AY
PORT
- M
INTI
E RD
$129
3 G
J$129
0.0
t0.0
t837
kW
h3
GJ
Ele
ctr
icity
HO
PKIN
S LA
ND
ING
PO
RT -
BURN
S RD
$178
5 G
J$178
0.0
t0.0
t1,4
32
kW
h5
GJ
Ele
ctr
icity
KEA
TS R
OA
D -
KEA
TS C
AM
P W
HA
RF$309
11 G
J$309
0.1
t0.1
t3,0
38
kW
h11
GJ
Ele
ctr
icity
Doc
k Li
ght S
ubto
tal
19 G
J$616
0.1
t$616
5,3
07
kW
hE
lectr
icity
19
GJ
0.1
t
Ove
rhea
d L
igh
tin
g
AU
STIN
RO
AD
STR
EETL
IGH
TIN
G -
AU
STIN
RD
$141
3 G
J$141
0.0
t0.0
t697
kW
h3
GJ
Ele
ctr
icity
BURN
S RO
AD
STR
EETL
IGH
TIN
G -
BURN
S RD
$150
1 G
J$150
0.0
t0.0
t398
kW
h1
GJ
Ele
ctr
icity
FIRC
REST
RO
AD
STR
EETL
IGH
TIN
G -
FIRC
REST
RD
$301
3 G
J$301
0.0
t0.0
t802
kW
h3
GJ
Ele
ctr
icity
GA
MBI
ER S
TREE
TLIG
HTI
NG
- G
AM
BIER
RD
$141
3 G
J$141
0.0
t0.0
t697
kW
h3
GJ
Ele
ctr
icity
GRA
NTH
AM
S LA
ND
ING
STR
EETL
IGH
TIN
G -
GRA
NTH
AM
S LA
ND
ING
$1,5
03
14 G
J$1,5
03
0.1
t0.1
t4,0
10
kW
h14
GJ
Ele
ctr
icity
HYD
AW
AY
ROA
D S
TREE
TLIG
HTI
NG
- H
YDA
WA
Y RD
$150
1 G
J$150
0.0
t0.0
t398
kW
h1
GJ
Ele
ctr
icity
28/0
6/20
09Pa
ge 4
2008
Ene
rgy
& G
reen
hous
e G
as E
mis
sion
s In
vent
ory
Hyl
a En
viro
nmen
tal S
ervi
ces
Ltd.
, 169
Asp
enw
ood
Driv
e, P
ort M
oody
, BC
V3H
5A
5 rh
ayco
ck@
hesl
td.c
a M
: 604
.469
.291
0 F
: 604
.469
.294
0
43
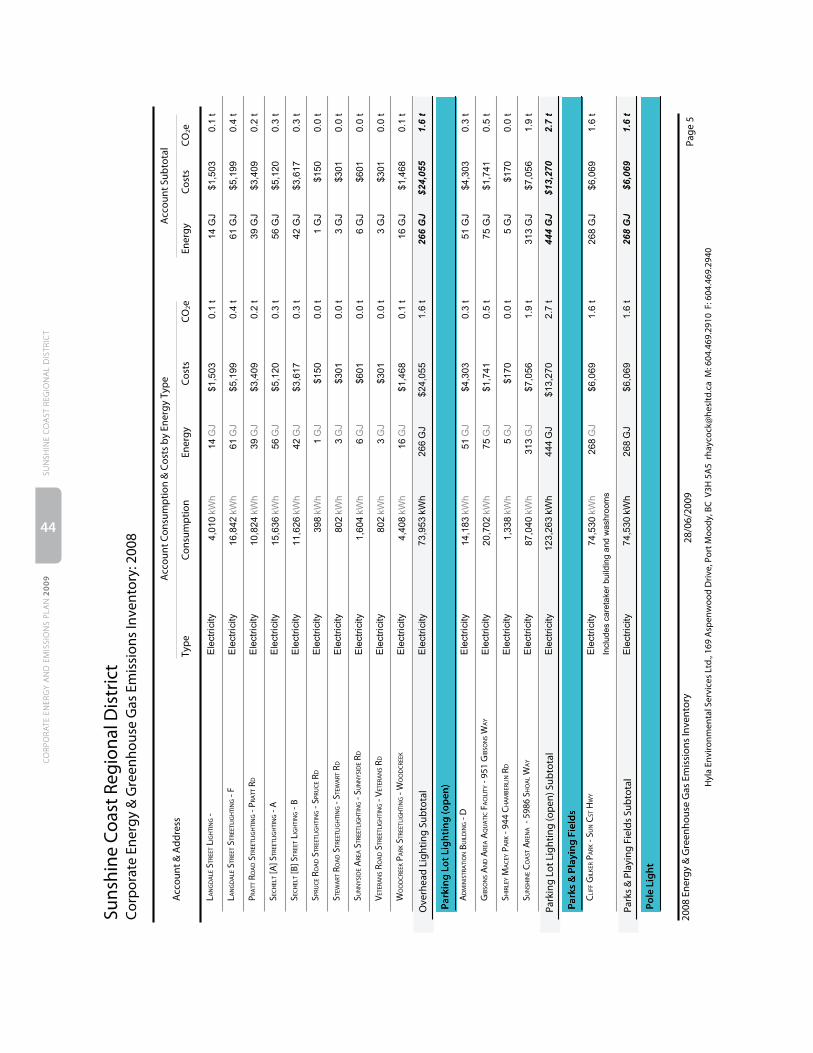
Cor
por
ate
Ener
gy &
Gre
enho
use
Gas
Em
issi
ons
Inve
ntor
y: 2
008
Suns
hine
Coa
st R
egio
nal D
istr
ict
CO
2eC
osts
Ener
gyC
onsu
mp
tion
Ener
gyC
osts
CO
2eTy
pe
Acc
ount
& A
ddre
ssA
ccou
nt S
ubto
tal
Acc
ount
Con
sum
ptio
n &
Cos
ts b
y En
ergy
Typ
e
LAN
GD
ALE
STR
EET L
IGH
TIN
G -
$1,5
03
14 G
J$1,5
03
0.1
t0.1
t4,0
10
kW
h14
GJ
Ele
ctr
icity
LAN
GD
ALE
STR
EET S
TREE
TLIG
HTI
NG
- F
$5,1
99
61 G
J$5,1
99
0.4
t0.4
t16,8
42
kW
h61
GJ
Ele
ctr
icity
PRA
TT R
OA
D S
TREE
TLIG
HTI
NG
- PR
ATT
RD
$3,4
09
39 G
J$3,4
09
0.2
t0.2
t10,8
24
kW
h39
GJ
Ele
ctr
icity
SEC
HEL
T [A
] STR
EETL
IGH
TIN
G -
A$5,1
20
56 G
J$5,1
20
0.3
t0.3
t15,6
36
kW
h56
GJ
Ele
ctr
icity
SEC
HEL
T [B]
STR
EET L
IGH
TIN
G -
B$3,6
17
42 G
J$3,6
17
0.3
t0.3
t11,6
26
kW
h42
GJ
Ele
ctr
icity
SPRU
CE R
OA
D S
TREE
TLIG
HTI
NG
- SP
RUC
E RD
$150
1 G
J$150
0.0
t0.0
t398
kW
h1
GJ
Ele
ctr
icity
STEW
ART
RO
AD
STR
EETL
IGH
TIN
G -
STEW
ART
RD
$301
3 G
J$301
0.0
t0.0
t802
kW
h3
GJ
Ele
ctr
icity
SUN
NYS
IDE A
REA S
TREE
TLIG
HTI
NG
- SU
NN
YSID
E RD
$601
6 G
J$601
0.0
t0.0
t1,6
04
kW
h6
GJ
Ele
ctr
icity
VETE
RAN
S RO
AD
STR
EETL
IGH
TIN
G -
VETE
RAN
S RD
$301
3 G
J$301
0.0
t0.0
t802
kW
h3
GJ
Ele
ctr
icity
WO
OD
CRE
EK P
ARK
STR
EETL
IGH
TIN
G -
WO
OD
CRE
EK$1,4
68
16 G
J$1,4
68
0.1
t0.1
t4,4
08
kW
h16
GJ
Ele
ctr
icity
Ove
rhea
d Li
ghtin
g Su
bto
tal
266 G
J$24,0
55
1.6
t$24,0
55
73,9
53
kW
hE
lectr
icity
266
GJ
1.6
t
Park
ing
Lot
Lig
hti
ng
(op
en)
AD
MIN
ISTR
ATI
ON
BU
ILD
ING
- D
$4,3
03
51 G
J$4,3
03
0.3
t0.3
t14,1
83
kW
h51
GJ
Ele
ctr
icity
GIB
SON
S AN
D A
REA A
QU
ATI
C F
AC
ILIT
Y - 9
51 G
IBSO
NS W
AY
$1,7
41
75 G
J$1,7
41
0.5
t0.5
t20,7
02
kW
h75
GJ
Ele
ctr
icity
SHIR
LEY
MA
CEY
PA
RK -
944
CH
AM
BERL
IN R
D$170
5 G
J$170
0.0
t0.0
t1,3
38
kW
h5
GJ
Ele
ctr
icity
SUN
SHIN
E CO
AST
ARE
NA -
598
6 SH
OA
L WA
Y$7,0
56
313 G
J$7,0
56
1.9
t1.9
t87,0
40
kW
h313
GJ
Ele
ctr
icity
Park
ing
Lot L
ight
ing
(op
en) S
ubto
tal
444 G
J$13,2
70
2.7
t$13,2
70
123,2
63
kW
hE
lectr
icity
444
GJ
2.7
t
Park
s &
Pla
yin
g F
ield
s
CLI
FF G
ILKE
R PA
RK -
SUN
CST
HW
Y$6,0
69
268 G
J$6,0
69
1.6
t1.6
t
Inclu
des c
are
taker
build
ing a
nd w
ashro
om
s
74,5
30
kW
h268
GJ
Ele
ctr
icity
Park
s &
Pla
ying
Fie
lds
Sub
tota
l268 G
J$6,0
69
1.6
t$6,0
69
74,5
30
kW
hE
lectr
icity
268
GJ
1.6
t
Pole
Lig
ht
28/0
6/20
09Pa
ge 5
2008
Ene
rgy
& G
reen
hous
e G
as E
mis
sion
s In
vent
ory
Hyl
a En
viro
nmen
tal S
ervi
ces
Ltd.
, 169
Asp
enw
ood
Driv
e, P
ort M
oody
, BC
V3H
5A
5 rh
ayco
ck@
hesl
td.c
a M
: 604
.469
.291
0 F
: 604
.469
.294
0
SUN
SHIN
E C
OA
ST R
EGIO
NA
L D
ISTR
ICT
CO
RPO
RATE
EN
ERG
Y A
ND
EM
ISSI
ON
S PL
AN
200
9
44
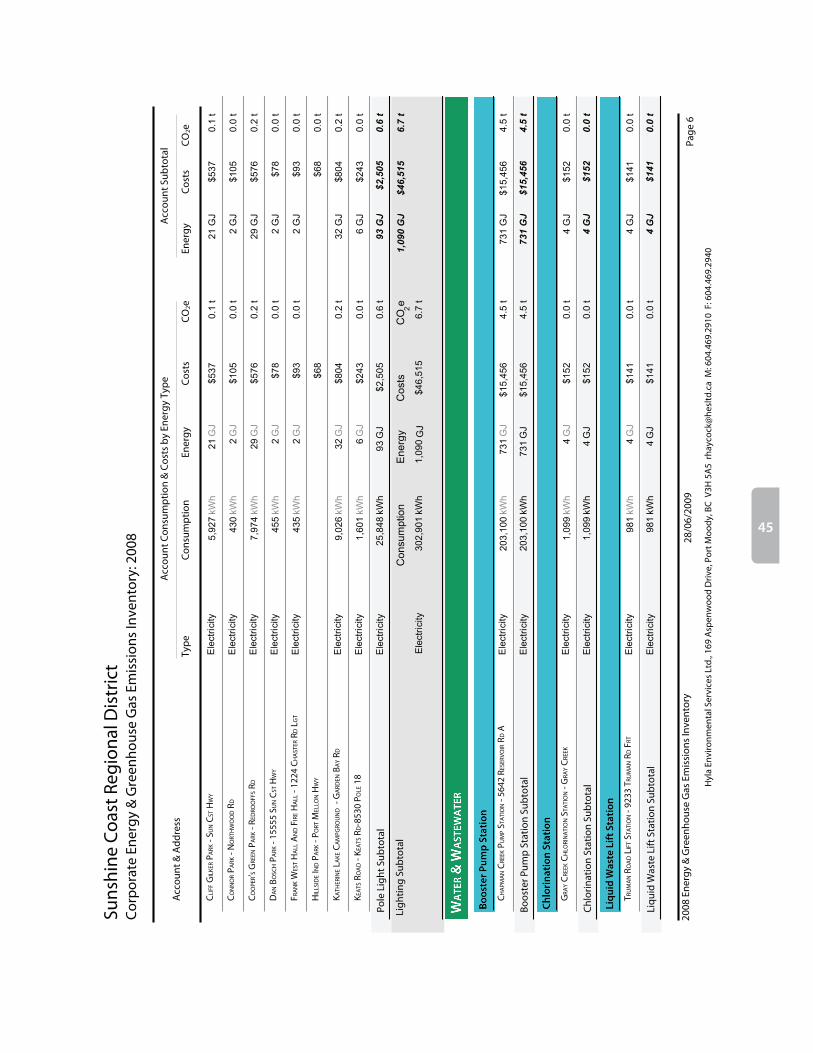
Cor
por
ate
Ener
gy &
Gre
enho
use
Gas
Em
issi
ons
Inve
ntor
y: 2
008
Suns
hine
Coa
st R
egio
nal D
istr
ict
CO
2eC
osts
Ener
gyC
onsu
mp
tion
Ener
gyC
osts
CO
2eTy
pe
Acc
ount
& A
ddre
ssA
ccou
nt S
ubto
tal
Acc
ount
Con
sum
ptio
n &
Cos
ts b
y En
ergy
Typ
e
CLI
FF G
ILKE
R PA
RK -
SUN
CST
HW
Y$537
21 G
J$537
0.1
t0.1
t5,9
27
kW
h21
GJ
Ele
ctr
icity
CO
NN
OR
PARK
- N
ORT
HW
OO
D R
D$105
2 G
J$105
0.0
t0.0
t430
kW
h2
GJ
Ele
ctr
icity
CO
OPE
R’S G
REEN
PA
RK -
RED
ROO
FFS R
D$576
29 G
J$576
0.2
t0.2
t7,9
74
kW
h29
GJ
Ele
ctr
icity
DA
N B
OSC
H P
ARK
- 15
555
SUN
CST
HW
Y$78
2 G
J$78
0.0
t0.0
t455
kW
h2
GJ
Ele
ctr
icity
FRA
NK
WES
T HA
LL A
ND
FIR
E HA
LL -
1224
CH
AST
ER R
D L
GT
$93
2 G
J$93
0.0
t0.0
t435
kW
h2
GJ
Ele
ctr
icity
HIL
LSID
E IN
D P
ARK
- PO
RT M
ELLO
N H
WY
$68
$68
0.0
t
KATH
ERIN
E LA
KE C
AM
PGRO
UN
D -
GA
RDEN
BA
Y RD
$804
32 G
J$804
0.2
t0.2
t9,0
26
kW
h32
GJ
Ele
ctr
icity
KEA
TS R
OA
D -
KEA
TS R
D-8
530
POLE
18
$243
6 G
J$243
0.0
t0.0
t1,6
01
kW
h6
GJ
Ele
ctr
icity
Pole
Lig
ht S
ubto
tal
93 G
J$2,5
05
0.6
t$2,5
05
25,8
48
kW
hE
lectr
icity
93
GJ
0.6
t
Consum
ption
CO
e 2C
osts
Energ
y1,0
90 G
J$46,5
15
6.7
t
$46,5
15
302,9
01
kW
hE
lectr
icity
1,0
90
GJ
6.7
t
Ligh
ting
Sub
tota
l
WA
TER
& W
AST
EWA
TER
Boo
ster
Pum
p S
tati
on
CH
APM
AN
CRE
EK P
UM
P ST
ATI
ON
- 56
42 R
ESER
VOIR
RD
A$15,4
56
731 G
J$15,4
56
4.5
t4.5
t203,1
00
kW
h731
GJ
Ele
ctr
icity
Boos
ter P
ump
Sta
tion
Sub
tota
l731 G
J$15,4
56
4.5
t$15,4
56
203,1
00
kW
hE
lectr
icity
731
GJ
4.5
t
Ch
lori
nat
ion
Sta
tion
GRA
Y C
REEK
CH
LORI
NA
TIO
N S
TATI
ON
- G
RAY
CRE
EK$152
4 G
J$152
0.0
t0.0
t1,0
99
kW
h4
GJ
Ele
ctr
icity
Chl
orin
atio
n St
atio
n Su
bto
tal
4 G
J$152
0.0
t$152
1,0
99
kW
hE
lectr
icity
4G
J0.0
t
Liq
uid
Was
te L
ift S
tati
on
TRU
MA
N R
OA
D L
IFT S
TATI
ON
- 92
33 T
RUM
AN
RD
FRT
$141
4 G
J$141
0.0
t0.0
t981
kW
h4
GJ
Ele
ctr
icity
Liqu
id W
aste
Lift
Sta
tion
Sub
tota
l4 G
J$141
0.0
t$141
981
kW
hE
lectr
icity
4G
J0.0
t
28/0
6/20
09Pa
ge 6
2008
Ene
rgy
& G
reen
hous
e G
as E
mis
sion
s In
vent
ory
Hyl
a En
viro
nmen
tal S
ervi
ces
Ltd.
, 169
Asp
enw
ood
Driv
e, P
ort M
oody
, BC
V3H
5A
5 rh
ayco
ck@
hesl
td.c
a M
: 604
.469
.291
0 F
: 604
.469
.294
0
45

Cor
por
ate
Ener
gy &
Gre
enho
use
Gas
Em
issi
ons
Inve
ntor
y: 2
008
Suns
hine
Coa
st R
egio
nal D
istr
ict
CO
2eC
osts
Ener
gyC
onsu
mp
tion
Ener
gyC
osts
CO
2eTy
pe
Acc
ount
& A
ddre
ssA
ccou
nt S
ubto
tal
Acc
ount
Con
sum
ptio
n &
Cos
ts b
y En
ergy
Typ
e
Liq
uid
Was
te T
reat
men
t Pla
nt
CU
RRA
N R
OA
D S
EWA
GE T
REA
TMEN
T PLA
NT -
552
1 C
URR
AN
RD
$1,0
71
45 G
J$1,0
71
0.3
t0.3
t12,4
39
kW
h45
GJ
Ele
ctr
icity
EMER
Y RO
AD
TRE
ATM
ENT P
LAN
T - 1
131
EMER
Y RD
PU
MP
$4,0
98
179 G
J$4,0
98
1.1
t1.1
t49,7
83
kW
h179
GJ
Ele
ctr
icity
JOLL
Y RO
GER
TRE
ATM
ENT P
LAN
T -$2,3
36
101 G
J$2,3
36
0.6
t0.6
t28,0
48
kW
h101
GJ
Ele
ctr
icity
LAN
GD
ALE
TRE
ATM
ENT P
LAN
T - J
AN
SEN
RD
$496
19 G
J$496
0.1
t0.1
t5,4
00
kW
h19
GJ
Ele
ctr
icity
LEE B
AY
TREA
TMEN
T PLA
NT -
433
6 O
RCA R
D$1,4
31
61 G
J$1,4
31
0.4
t0.4
t16,8
75
kW
h61
GJ
Ele
ctr
icity
LILY
LA
KE T
REA
TMEN
T PLA
NT -
127
10 L
AG
OO
N R
D$2,4
70
107 G
J$2,4
70
0.7
t0.7
t29,6
23
kW
h107
GJ
Ele
ctr
icity
MER
RILL
CRE
S TRE
ATM
ENT P
LAN
T - M
ERRI
LL R
D$1,2
17
51 G
J$1,2
17
0.3
t0.3
t14,2
35
kW
h51
GJ
Ele
ctr
icity
SEC
RET C
OVE
MA
RIN
A T
REA
TMEN
T PLA
NT -
547
1 SE
CRE
T CO
VE R
D$2,2
89
99 G
J$2,2
89
0.6
t0.6
t27,4
49
kW
h99
GJ
Ele
ctr
icity
SQU
ARE
BA
Y TR
EATM
ENT P
LAN
T - 5
320
SUSA
N W
AY
$1,3
96
59 G
J$1,3
96
0.4
t0.4
t16,4
56
kW
h59
GJ
Ele
ctr
icity
WO
OD
CRE
EK T
REA
TMEN
T PLA
NT -
OC
EAN
VIEW
DR
$1,8
01
77 G
J$1,8
01
0.5
t0.5
t21,4
86
kW
h77
GJ
Ele
ctr
icity
Liqu
id W
aste
Tre
atm
ent P
lant
Sub
tota
l798 G
J$18,6
06
4.9
t$18,6
06
221,7
95
kW
hE
lectr
icity
798
GJ
4.9
t
Mis
c.
MET
ERIN
G C
HA
MBE
R - 1
103
SUN
CST
HW
Y$63
$63
0.0
t
Mis
c. S
ubto
tal
$63
0.0
t$63
Pota
ble
Wat
er D
eep
Wel
l
CH
AST
ER R
OA
D W
ELL -
CH
AST
ER R
OA
D P
UM
P ST
ATI
ON
$10,7
83
545 G
J$10,7
83
3.3
t3.3
t151,3
82
kW
h545
GJ
Ele
ctr
icity
EAST
BOU
RNE W
ELL A
ND
WA
TER
TREA
TMEN
T FA
CIL
ITY
- GA
VIN
RD
$1,0
45
44 G
J$1,0
45
0.3
t0.3
t12,1
00
kW
h44
GJ
Ele
ctr
icity
GO
RDO
N W
ELL -
KEA
TS IS
LAN
D -
OA
K A
VE$154
4 G
J$154
0.0
t0.0
t1,1
16
kW
h4
GJ
Ele
ctr
icity
KATH
ERIN
E LA
KE P
OTA
BLE W
ELL -
GA
RDEN
BA
Y RD
$256
9 G
J$256
0.1
t0.1
t2,3
90
kW
h9
GJ
Ele
ctr
icity
LAN
GD
ALE
WEL
L - P
ORT
MEL
LON
HW
Y$12,3
03
488 G
J$12,3
03
3.0
t3.0
t135,4
80
kW
h488
GJ
Ele
ctr
icity
SOA
MES
WEL
L - P
ORT
MEL
LON
HW
Y$2,1
29
92 G
J$2,1
29
0.6
t0.6
t25,4
40
kW
h92
GJ
Ele
ctr
icity
28/0
6/20
09Pa
ge 7
2008
Ene
rgy
& G
reen
hous
e G
as E
mis
sion
s In
vent
ory
Hyl
a En
viro
nmen
tal S
ervi
ces
Ltd.
, 169
Asp
enw
ood
Driv
e, P
ort M
oody
, BC
V3H
5A
5 rh
ayco
ck@
hesl
td.c
a M
: 604
.469
.291
0 F
: 604
.469
.294
0
SUN
SHIN
E C
OA
ST R
EGIO
NA
L D
ISTR
ICT
CO
RPO
RATE
EN
ERG
Y A
ND
EM
ISSI
ON
S PL
AN
200
9
46

Cor
por
ate
Ener
gy &
Gre
enho
use
Gas
Em
issi
ons
Inve
ntor
y: 2
008
Suns
hine
Coa
st R
egio
nal D
istr
ict
CO
2eC
osts
Ener
gyC
onsu
mp
tion
Ener
gyC
osts
CO
2eTy
pe
Acc
ount
& A
ddre
ssA
ccou
nt S
ubto
tal
Acc
ount
Con
sum
ptio
n &
Cos
ts b
y En
ergy
Typ
e
Pota
ble
Wat
er D
eep
Wel
l Sub
tota
l1,1
80 G
J$26,6
69
7.2
t$26,6
69
327,9
08
kW
hE
lectr
icity
1,1
80
GJ
7.2
t
Pota
ble
Wat
er P
ump
Sta
tion
CA
LETA
PU
MP
STA
TIO
N -
SUN
CST
HW
Y$108
2 G
J$108
0.0
t0.0
t540
kW
h2
GJ
Ele
ctr
icity
CO
VE C
AY
PUM
P ST
ATI
ON
- SU
N C
ST H
WY
$1,5
68
67 G
J$1,5
68
0.4
t0.4
t18,6
85
kW
h67
GJ
Ele
ctr
icity
GA
RDEN
BA
Y W
ATE
RWO
RKS D
IST -
GA
RDEN
BA
Y RD
$11,4
82
476 G
J$11,4
82
2.9
t2.9
t132,1
16
kW
h476
GJ
Ele
ctr
icity
GRA
NTH
AM
S LA
ND
ING
PU
MP
STA
TIO
N -
MA
RIN
E DR
$1,3
57
58 G
J$1,3
57
0.4
t0.4
t15,9
91
kW
h58
GJ
Ele
ctr
icity
HO
TEL L
AKE
PU
MP
STA
TIO
N -
IRVI
NES
LD
G R
D$914
39 G
J$914
0.2
t0.2
t10,8
26
kW
h39
GJ
Ele
ctr
icity
MT.
RIC
HA
RDSO
N P
UM
P ST
ATI
ON
- 68
96 M
T RIC
HA
RDSO
N R
D$541
22 G
J$541
0.1
t0.1
t5,9
94
kW
h22
GJ
Ele
ctr
icity
ORC
A R
OA
D P
UM
P ST
ATI
ON
- 42
95 O
RCA R
D$1,2
61
53 G
J$1,2
61
0.3
t0.3
t14,8
12
kW
h53
GJ
Ele
ctr
icity
PAYN
E RD
PU
MP
STA
TIO
N -
1056
REE
D R
D$7,8
08
342 G
J$7,8
08
2.1
t2.1
t95,0
08
kW
h342
GJ
Ele
ctr
icity
PAYN
E RD
PU
MP
STA
TIO
N -
1056
REE
D R
D$3,2
38
141 G
J$3,2
38
0.9
t0.9
t39,1
10
kW
h141
GJ
Ele
ctr
icity
ROBE
RTS C
REEK
PU
MP
STA
TIO
N -
SUN
CST
HW
Y$4,4
40
176 G
J$4,4
40
1.1
t1.1
t48,8
09
kW
h176
GJ
Ele
ctr
icity
SAN
DY
HO
OK
PUM
P ST
ATI
ON
- SE
CH
ELT I
NLE
T RD
$8,0
38
354 G
J$8,0
38
2.2
t2.2
t98,3
92
kW
h354
GJ
Ele
ctr
icity
SELM
A P
UM
P ST
ATI
ON
- PA
TTER
SON
RD
$5,4
99
200 G
J$5,4
99
1.2
t1.2
t55,5
87
kW
h200
GJ
Ele
ctr
icity
SELM
A P
UM
P ST
ATI
ON
- PA
TTER
SON
RD
$1,3
24
59 G
J$1,3
24
0.4
t0.4
t16,4
91
kW
h59
GJ
Ele
ctr
icity
Pota
ble
Wat
er P
ump
Sta
tion
Sub
tota
l1,9
89 G
J$47,5
77
12.2
t$47,5
77
552,3
62
kW
hE
lectr
icity
1,9
89
GJ
12.2
t
Pota
ble
Wat
er R
eser
voir
LEE R
OA
D R
ESER
VOIR
- LE
E RO
AD
WA
TER
TOW
ER$86
1 G
J$86
0.0
t0.0
t196
kW
h1
GJ
Ele
ctr
icity
REED
RO
AD
RES
ERVO
IR -
1044
REE
D R
D$66
0 G
J$66
0.0
t0.0
t32
kW
h0
GJ
Ele
ctr
icity
TRO
UT L
AKE
RES
ERVO
IR -
TRO
UT L
AKE
RES
ERVO
IR$77
1 G
J$77
0.0
t0.0
t142
kW
h1
GJ
Ele
ctr
icity
WA
TER
TOW
ER K
EITH
RD
- C
EMET
ERY
RD$103
2 G
J$103
0.0
t0.0
t423
kW
h2
GJ
Ele
ctr
icity
Pota
ble
Wat
er R
eser
voir
Sub
tota
l3 G
J$331
0.0
t$331
793
kW
hE
lectr
icity
3G
J0.0
t
28/0
6/20
09Pa
ge 8
2008
Ene
rgy
& G
reen
hous
e G
as E
mis
sion
s In
vent
ory
Hyl
a En
viro
nmen
tal S
ervi
ces
Ltd.
, 169
Asp
enw
ood
Driv
e, P
ort M
oody
, BC
V3H
5A
5 rh
ayco
ck@
hesl
td.c
a M
: 604
.469
.291
0 F
: 604
.469
.294
0
47

Cor
por
ate
Ener
gy &
Gre
enho
use
Gas
Em
issi
ons
Inve
ntor
y: 2
008
Suns
hine
Coa
st R
egio
nal D
istr
ict
CO
2eC
osts
Ener
gyC
onsu
mp
tion
Ener
gyC
osts
CO
2eTy
pe
Acc
ount
& A
ddre
ssA
ccou
nt S
ubto
tal
Acc
ount
Con
sum
ptio
n &
Cos
ts b
y En
ergy
Typ
e
Pota
ble
Wat
er T
reat
men
t
CH
APM
AN
CRE
EK W
ATE
R TR
EATM
ENT P
LAN
T - B
-564
2 RE
SERV
OIR
RD
$40,0
47
$12,2
59
3,2
83 G
J$52,3
06
51.6
t15.8
t
35.8
t
717,3
71
kW
h
700
GJ
2,5
83
GJ
700
GJ
Natu
ralG
as
Ele
ctr
icity
Pota
ble
Wat
er T
reat
men
t Sub
tota
l3,2
83 G
J$52,3
06
51.6
t$40,0
47
717,3
71
kW
hE
lectr
icity
2,5
83
GJ
15.8
t
$12,2
59
700
GJ
Natu
ralG
as
700
GJ
35.8
t
Rech
lori
nat
ion
Sta
tion
REC
HLO
RIN
ATI
ON
STA
TIO
N -
SUN
CST
HW
Y$1,3
88
59 G
J$1,3
88
0.4
t0.4
t16,4
69
kW
h59
GJ
Ele
ctr
icity
RED
ROO
FFS R
OA
D S
TATI
ON
- RE
DRO
OFF
S RD
$65
$65
0.0
t
Rech
lorin
atio
n St
atio
n Su
bto
tal
59 G
J$1,4
53
0.4
t$1,4
53
16,4
69
kW
hE
lectr
icity
59
GJ
0.4
t
Consum
ption
CO
e 2C
osts
Energ
y8,0
51 G
J$162,7
54
80.7
t
$150,4
95
2,0
41,8
77
kW
hE
lectr
icity
7,3
51
GJ
44.9
t
$12,2
59
700
GJ
Natu
ral
Gas
700
GJ
35.8
t
Wat
er &
Was
tew
ater
Sub
tota
l
VEH
ICLE
FLE
ET
Die
sel F
uel M
ediu
m to
Hea
vy T
ruck
s
1996
INTE
RNA
TIO
NA
L 2W
HD
R - 3
99$1,0
42
35 G
J$1,0
42
2.5
t2.5
t907
litre
s35
GJ
Die
sel
Fuel
1999
4W
HD
R FO
RD F
550
- 382
$554
18 G
J$554
1.3
t1.3
t458
litre
s18
GJ
Die
sel
Fuel
2000
F35
0 F O
RD F
LATD
ECK
- 352
$2,2
60
73 G
J$2,2
60
5.3
t5.3
t1,8
92
litre
s73
GJ
Die
sel
Fuel
2005
GM
C 2
WH
DR
(RED
) - 4
00$653
21 G
J$653
1.5
t1.5
t537
litre
s21
GJ
Die
sel
Fuel
2006
I NTE
RNA
TIO
NA
L REC
YCLI
NG
- 40
9$28,6
86
927 G
J$28,6
86
66.6
t66.6
t23,9
68
litre
s927
GJ
Die
sel
Fuel
2007
F35
0 4 X
2 W
/ REA
DIN
G S
ERVI
CE B
OD
Y - 4
16$3,4
26
109 G
J$3,4
26
7.8
t7.8
t2,8
24
litre
s109
GJ
Die
sel
Fuel
2007
F35
0 4 X
4 EX
TEN
DED
CA
B W
/ ITB
FLA
T DEC
K - 4
15$4,0
49
131 G
J$4,0
49
9.4
t9.4
t3,3
97
litre
s131
GJ
Die
sel
Fuel
2008
F45
0 S U
PERD
UTY
- 42
6$4,9
64
160 G
J$4,9
64
11.5
t11.5
t4,1
29
litre
s160
GJ
Die
sel
Fuel
28/0
6/20
09Pa
ge 9
2008
Ene
rgy
& G
reen
hous
e G
as E
mis
sion
s In
vent
ory
Hyl
a En
viro
nmen
tal S
ervi
ces
Ltd.
, 169
Asp
enw
ood
Driv
e, P
ort M
oody
, BC
V3H
5A
5 rh
ayco
ck@
hesl
td.c
a M
: 604
.469
.291
0 F
: 604
.469
.294
0
SUN
SHIN
E C
OA
ST R
EGIO
NA
L D
ISTR
ICT
CO
RPO
RATE
EN
ERG
Y A
ND
EM
ISSI
ON
S PL
AN
200
9
48

Cor
por
ate
Ener
gy &
Gre
enho
use
Gas
Em
issi
ons
Inve
ntor
y: 2
008
Suns
hine
Coa
st R
egio
nal D
istr
ict
CO
2eC
osts
Ener
gyC
onsu
mp
tion
Ener
gyC
osts
CO
2eTy
pe
Acc
ount
& A
ddre
ssA
ccou
nt S
ubto
tal
Acc
ount
Con
sum
ptio
n &
Cos
ts b
y En
ergy
Typ
e
2008
FO
RD F
350
4X4
SUPE
R C
AB
- 439
$1,9
26
62 G
J$1,9
26
4.4
t4.4
t1,5
99
litre
s62
GJ
Die
sel
Fuel
94 F
ORD
F70
0 4T
ON
- 31
6$814
27 G
J$814
2.0
t2.0
t707
litre
s27
GJ
Die
sel
Fuel
95 I N
TL. 5
-TO
N D
UM
P - 3
32$3,9
17
129 G
J$3,9
17
9.3
t9.3
t3,3
35
litre
s129
GJ
Die
sel
Fuel
99 F
ORD
F35
0 - 3
18$3,0
46
99 G
J$3,0
46
7.1
t7.1
t2,5
52
litre
s99
GJ
Die
sel
Fuel
R ESC
UE T
RUC
K - 4
00$400
17 G
J$400
1.2
t1.2
t431
litre
s17
GJ
Die
sel
Fuel
Die
sel F
uel M
ediu
m to
Hea
vy T
ruck
s Su
bto
tal
1,8
08 G
J$55,7
38
129.9
tD
iesel
Fuel
$55,7
38
46,7
36
litre
s1,8
08
GJ
129.9
t
Die
sel F
uel O
ff R
oad
Veh
icle
s &
Eq
uip
men
t
1987
GA
TOR
JOH
N D
EERE
- 33
9$139
4 G
J$139
0.3
t0.3
t102
litre
s4
GJ
Die
sel
Fuel
2005
PIS
TEN
BU
LLY
PB10
0 - 4
10$2,9
30
111 G
J$2,9
30
8.0
t8.0
t2,8
77
litre
s111
GJ
Die
sel
Fuel
J OH
N D
EERE
BA
CKH
OE -
404
$8,4
19
279 G
J$8,4
19
20.0
t20.0
t7,2
11
litre
s279
GJ
Die
sel
Fuel
TRA
CTO
R - 4
01$815
24 G
J$815
1.7
t1.7
t629
litre
s24
GJ
Die
sel
Fuel
Die
sel F
uel O
ff R
oad
Vehi
cles
& E
quip
men
t Sub
tota
l418 G
J$12,3
03
30.1
tD
iesel
Fuel
$12,3
03
10,8
19
litre
s418
GJ
30.1
t
Fire
Ser
vice
s
1981
INTE
RNA
TIO
NA
L 2 W
HD
R. F
IRE T
RUC
K (Y
ELLO
W) -
405
$94
3 G
J$94
0.2
t0.2
t94
litre
s3
GJ
Gaso
line
1985
2 W
HD
R RE
D G
MC -
368
$856
25 G
J$856
1.8
t1.8
t716
litre
s25
GJ
Gaso
line
1997
FO
RD E
XPL
R 4
DRS
W -
395
$1,1
26
38 G
J$1,1
26
2.8
t2.8
t1,1
03
litre
s38
GJ
Gaso
line
1998
PU
MPE
R FR
EIG
HTL
INER
- 36
7$375
12 G
J$375
0.9
t0.9
t318
litre
s12
GJ
Die
sel
Fuel
E GM
ON
T VO
LUN
TEER
FIR
E DEP
ART
MEN
T -$766
22 G
J$766
1.6
t1.6
t638
litre
s22
GJ
Gaso
line
GIB
SON
S VO
LUN
TEER
FIR
E DEP
ART
MEN
T -$4,5
51
$4,2
29
257 G
J$8,7
80
18.5
t9.5
t
9.0
t
3,7
92
litre
s
3,2
53
litre
s
131
GJ
126
GJ
Gaso
line
Die
sel
Fuel
R OBE
RTS C
REEK
FIR
E HA
LL -
$1,2
10
35 G
J$1,2
10
2.5
t2.5
t1,0
08
litre
s35
GJ
Gaso
line
S EA
RCH
AN
D R
ESC
UE -
$458
$138
18 G
J$596
1.3
t1.0
t
0.3
t
381
litre
s
116
litre
s
13
GJ
4G
JG
aso
line
Die
sel
Fuel
28/0
6/20
09Pa
ge 1
020
08 E
nerg
y &
Gre
enho
use
Gas
Em
issi
ons
Inve
ntor
y
Hyl
a En
viro
nmen
tal S
ervi
ces
Ltd.
, 169
Asp
enw
ood
Driv
e, P
ort M
oody
, BC
V3H
5A
5 rh
ayco
ck@
hesl
td.c
a M
: 604
.469
.291
0 F
: 604
.469
.294
0
49

Cor
por
ate
Ener
gy &
Gre
enho
use
Gas
Em
issi
ons
Inve
ntor
y: 2
008
Suns
hine
Coa
st R
egio
nal D
istr
ict
CO
2eC
osts
Ener
gyC
onsu
mp
tion
Ener
gyC
osts
CO
2eTy
pe
Acc
ount
& A
ddre
ssA
ccou
nt S
ubto
tal
Acc
ount
Con
sum
ptio
n &
Cos
ts b
y En
ergy
Typ
e
Fire
Ser
vice
s Su
bto
tal
411 G
J$13,8
04
29.6
tG
aso
line
$9,0
61
7,7
33
litre
s268
GJ
19.3
t
Die
sel
Fuel
$4,7
43
3,6
87
litre
s143
GJ
10.2
t
Gas
olin
e M
ediu
m to
Hea
vy T
ruck
s &
Van
s
2004
FO
RD F
350
- 397
$9,6
48
292 G
J$9,6
48
21.0
t21.0
t8,4
17
litre
s292
GJ
Gaso
line
2007
FO
RD 5
50 R
ESC
UE T
RUC
K - 4
21$240
7 G
J$240
0.5
t0.5
t205
litre
s7
GJ
Gaso
line
2008
F35
0 4 X
4 W
ITH
SER
VIC
E BO
DY
- 436
$225
7 G
J$225
0.5
t0.5
t197
litre
s7
GJ
Gaso
line
F350
SBO
DY
- 357
$9,9
33
296 G
J$9,9
33
21.3
t21.3
t8,5
39
litre
s296
GJ
Gaso
line
Gas
olin
e M
ediu
m to
Hea
vy T
ruck
s &
Van
s Su
bto
tal
602 G
J$20,0
47
43.3
tG
aso
line
$20,0
47
17,3
58
litre
s602
GJ
43.3
t
Gas
olin
e O
ff R
oad
Veh
icle
s &
Eq
uip
men
t
2005
JO
HN
DEE
RE T
RAIL
BUC
K A
TV -
402
$17
0 G
J$17
0.0
t0.0
t12
litre
s0
GJ
Gaso
line
2006
SKA
ND
IC S
WT 5
50F S
KID
OO
- 41
7$393
14 G
J$393
1.0
t1.0
t396
litre
s14
GJ
Gaso
line
MO
WER
- 36
0$319
9 G
J$319
0.6
t0.6
t259
litre
s9
GJ
Gaso
line
Gas
olin
e O
ff R
oad
Vehi
cles
& E
quip
men
t Sub
tota
l23 G
J$728
1.7
tG
aso
line
$728
667
litre
s23
GJ
1.7
t
Gas
olin
e Pa
ssen
ger
Car
s
2000
SU
ZUKI
VIT
RA -
353
$2,8
14
86 G
J$2,8
14
6.2
t6.2
t2,4
75
litre
s86
GJ
Gaso
line
2002
FO
RD R
AN
GER
- 36
1$4,5
45
136 G
J$4,5
45
9.8
t9.8
t3,9
26
litre
s136
GJ
Gaso
line
2003
GEO
TRA
CKE
R - 3
86$869
26 G
J$869
1.8
t1.8
t739
litre
s26
GJ
Gaso
line
2003
GEO
TRA
CKE
R - 3
87$1,5
59
47 G
J$1,5
59
3.4
t3.4
t1,3
59
litre
s47
GJ
Gaso
line
2003
GEO
TRA
CKE
R - 3
88$1,7
96
54 G
J$1,7
96
3.9
t3.9
t1,5
71
litre
s54
GJ
Gaso
line
2004
CH
EV T
RCKR
4D
RHT -
396
$3,2
06
98 G
J$3,2
06
7.0
t7.0
t2,8
22
litre
s98
GJ
Gaso
line
92 T
RAC
KER
- 315
$858
26 G
J$858
1.9
t1.9
t756
litre
s26
GJ
Gaso
line
95 G
EO T
RAC
KER
- 333
$414
12 G
J$414
0.9
t0.9
t352
litre
s12
GJ
Gaso
line
Gas
olin
e Pa
ssen
ger C
ars
Sub
tota
l485 G
J$16,0
61
35.0
tG
aso
line
$16,0
61
14,0
00
litre
s485
GJ
35.0
t
28/0
6/20
09Pa
ge 1
120
08 E
nerg
y &
Gre
enho
use
Gas
Em
issi
ons
Inve
ntor
y
Hyl
a En
viro
nmen
tal S
ervi
ces
Ltd.
, 169
Asp
enw
ood
Driv
e, P
ort M
oody
, BC
V3H
5A
5 rh
ayco
ck@
hesl
td.c
a M
: 604
.469
.291
0 F
: 604
.469
.294
0
SUN
SHIN
E C
OA
ST R
EGIO
NA
L D
ISTR
ICT
CO
RPO
RATE
EN
ERG
Y A
ND
EM
ISSI
ON
S PL
AN
200
9
50

Cor
por
ate
Ener
gy &
Gre
enho
use
Gas
Em
issi
ons
Inve
ntor
y: 2
008
Suns
hine
Coa
st R
egio
nal D
istr
ict
CO
2eC
osts
Ener
gyC
onsu
mp
tion
Ener
gyC
osts
CO
2eTy
pe
Acc
ount
& A
ddre
ssA
ccou
nt S
ubto
tal
Acc
ount
Con
sum
ptio
n &
Cos
ts b
y En
ergy
Typ
e
Gen
erat
or S
tati
on
FIEL
D R
OA
D G
ENER
ATO
R -
$605
18 G
J$605
1.3
t1.3
t465
litre
s18
GJ
Die
sel
Fuel
NO
RTH
PEN
DER
HA
RBO
UR
WA
TER
SYST
EM -
$98
3 G
J$98
0.2
t0.2
t81
litre
s3
GJ
Gaso
line
NO
RTH
PEN
DER
HA
RBO
UR
WA
TER
SYST
EM A
ND
GEN
ERA
TOR
-$5,3
12
158 G
J$5,3
12
11.4
t11.4
t
Inclu
des a
n u
ndis
clo
sed v
olu
me o
f fu
el fo
r a v
ehic
le
4,0
86
litre
s158
GJ
Die
sel
Fuel
S ELM
A S
IMPS
ON
MA
XW
ELL G
ENSE
T -$122
3 G
J$122
0.2
t0.2
t89
litre
s3
GJ
Die
sel
Fuel
S OU
TH P
END
ER H
ARB
OU
R W
ATE
R W
ORK
S -$2,6
25
$4,0
36
190 G
J$6,6
61
13.7
t5.5
t
8.2
t
Inclu
des a
n u
ndis
clo
sed v
olu
me o
f fu
el fo
r a v
ehic
le
2,2
06
litre
s
2,9
46
litre
s
76
GJ
114
GJ
Gaso
line
Die
sel
Fuel
WA
TER
TREA
TMEN
T PLA
NT G
ENER
ATO
R -
$1,4
22
42 G
J$1,4
22
3.0
t3.0
t1,0
94
litre
s42
GJ
Die
sel
Fuel
Gen
erat
or S
tatio
n Su
bto
tal
415 G
J$14,2
20
29.8
tG
aso
line
$2,7
23
2,2
87
litre
s79
GJ
5.7
t
Die
sel
Fuel
$11,4
97
8,6
80
litre
s336
GJ
24.1
t
Lig
ht T
ruck
s, V
ans,
an
d S
UV
s
1979
CH
EVY
VAN
- 37
4$577
16 G
J$577
1.2
t1.2
t467
litre
s16
GJ
Gaso
line
1985
WH
DR
RED
GM
C -
368
$796
27 G
J$796
1.9
t1.9
t779
litre
s27
GJ
Gaso
line
1986
2W
HD
R RE
D G
MC -
365
$438
12 G
J$438
0.9
t0.9
t341
litre
s12
GJ
Gaso
line
1995
CH
EV S
-10
- 330
$68
3 G
J$68
0.2
t0.2
t73
litre
s3
GJ
Gaso
line
1996
FO
RD A
ERO
STA
R - 3
36$692
20 G
J$692
1.5
t1.5
t589
litre
s20
GJ
Gaso
line
1997
CH
EVRO
LET V
AN
2D
RSW
- 42
9$189
5 G
J$189
0.4
t0.4
t144
litre
s5
GJ
Gaso
line
1997
FO
RD E
XPL
OR
4DRS
W (R
ED) -
395
$1,2
47
38 G
J$1,2
47
2.7
t2.7
t1,0
86
litre
s38
GJ
Gaso
line
2000
F25
0 F O
RD -
354
$3,1
46
93 G
J$3,1
46
6.7
t6.7
t2,6
73
litre
s93
GJ
Gaso
line
2000
FO
RD F
250
- 354
$3,5
27
120 G
J$3,5
27
8.6
t8.6
t3,4
53
litre
s120
GJ
Gaso
line
2000
FO
RD R
AN
GER
- 35
1$2,1
98
65 G
J$2,1
98
4.7
t4.7
t1,8
86
litre
s65
GJ
Gaso
line
28/0
6/20
09Pa
ge 1
220
08 E
nerg
y &
Gre
enho
use
Gas
Em
issi
ons
Inve
ntor
y
Hyl
a En
viro
nmen
tal S
ervi
ces
Ltd.
, 169
Asp
enw
ood
Driv
e, P
ort M
oody
, BC
V3H
5A
5 rh
ayco
ck@
hesl
td.c
a M
: 604
.469
.291
0 F
: 604
.469
.294
0
51

Cor
por
ate
Ener
gy &
Gre
enho
use
Gas
Em
issi
ons
Inve
ntor
y: 2
008
Suns
hine
Coa
st R
egio
nal D
istr
ict
CO
2eC
osts
Ener
gyC
onsu
mp
tion
Ener
gyC
osts
CO
2eTy
pe
Acc
ount
& A
ddre
ssA
ccou
nt S
ubto
tal
Acc
ount
Con
sum
ptio
n &
Cos
ts b
y En
ergy
Typ
e
2001
FO
RD W
DST
R - 3
55$1,0
27
30 G
J$1,0
27
2.2
t2.2
t872
litre
s30
GJ
Gaso
line
2002
F15
0 4 X
2 FO
RD -
364
$2,3
96
73 G
J$2,3
96
5.2
t5.2
t2,1
00
litre
s73
GJ
Gaso
line
2003
CH
EV V
ENTU
RE V
AN
- 38
5$1,1
76
36 G
J$1,1
76
2.6
t2.6
t1,0
39
litre
s36
GJ
Gaso
line
2003
FO
RD F
250
P/U
- 36
3$2,2
61
67 G
J$2,2
61
4.8
t4.8
t1,9
34
litre
s67
GJ
Gaso
line
2004
CH
EVRO
LET S
ILVR
. P/U
P - 4
11$3,7
71
114 G
J$3,7
71
8.2
t8.2
t3,3
01
litre
s114
GJ
Gaso
line
2004
FO
RD F
250
REG
CA
B 2W
D -
394
$2,4
86
77 G
J$2,4
86
5.5
t5.5
t2,2
14
litre
s77
GJ
Gaso
line
2005
CH
EVRO
LET C
OLO
RAD
O (W
HIT
E) -
406
$1,9
47
59 G
J$1,9
47
4.2
t4.2
t1,6
94
litre
s59
GJ
Gaso
line
2005
CH
EVRO
LET C
OLO
RAD
O (W
HIT
E) -
407
$2,5
61
78 G
J$2,5
61
5.6
t5.6
t2,2
61
litre
s78
GJ
Gaso
line
2005
CH
EVRO
LET S
ILVR
PIC
K-U
P - 4
08$1,4
27
44 G
J$1,4
27
3.2
t3.2
t1,2
81
litre
s44
GJ
Gaso
line
2007
FO
RD R
AN
GER
FLA
T DEC
K - 4
13$3,0
25
89 G
J$3,0
25
6.4
t6.4
t2,5
76
litre
s89
GJ
Gaso
line
2007
FO
RD R
AN
GER
FLA
TDEC
K - 4
13$3,1
09
105 G
J$3,1
09
7.6
t7.6
t3,0
43
litre
s105
GJ
Gaso
line
2008
FO
RD R
AN
GER
P/P
- 43
0$583
17 G
J$583
1.2
t1.2
t500
litre
s17
GJ
Gaso
line
2008
FO
RD R
AN
GER
P/U
P W
/ SER
VIC
E BO
DY
- 434
$1,8
82
56 G
J$1,8
82
4.1
t4.1
t1,6
22
litre
s56
GJ
Gaso
line
2008
FO
RD R
AN
GER
P/U
P W
/ SER
VIC
E BO
DY
- 435
$1,9
93
61 G
J$1,9
93
4.4
t4.4
t1,7
51
litre
s61
GJ
Gaso
line
2008
FO
RD R
AN
GER
W/ C
AN
OPY
- 44
1$181
5 G
J$181
0.4
t0.4
t154
litre
s5
GJ
Gaso
line
2008
FO
RDF2
50 S
UPE
R C
AB
- 433
$1,4
48
42 G
J$1,4
48
3.0
t3.0
t
Costs
split
betw
een four
facili
ties1,2
12
litre
s42
GJ
Gaso
line
95 F
ORD
RA
NG
ER -
331
$689
21 G
J$689
1.5
t1.5
t619
litre
s21
GJ
Gaso
line
97 F
ORD
3/4
TO
N -
337
$692
23 G
J$692
1.6
t1.6
t589
litre
s23
GJ
Die
sel
Fuel
CH
EV S
ILVE
RAD
O 2
DR.
- 1
$2,8
03
80 G
J$2,8
03
5.8
t5.8
t2,3
10
litre
s80
GJ
Gaso
line
E150
2D
R P/
U -
356
$2,6
20
77 G
J$2,6
20
5.5
t5.5
t2,2
12
litre
s77
GJ
Gaso
line
E250
VA
N -
358
$2,4
63
72 G
J$2,4
63
5.2
t5.2
t2,0
73
litre
s72
GJ
Gaso
line
28/0
6/20
09Pa
ge 1
320
08 E
nerg
y &
Gre
enho
use
Gas
Em
issi
ons
Inve
ntor
y
Hyl
a En
viro
nmen
tal S
ervi
ces
Ltd.
, 169
Asp
enw
ood
Driv
e, P
ort M
oody
, BC
V3H
5A
5 rh
ayco
ck@
hesl
td.c
a M
: 604
.469
.291
0 F
: 604
.469
.294
0
SUN
SHIN
E C
OA
ST R
EGIO
NA
L D
ISTR
ICT
CO
RPO
RATE
EN
ERG
Y A
ND
EM
ISSI
ON
S PL
AN
200
9
52

Cor
por
ate
Ener
gy &
Gre
enho
use
Gas
Em
issi
ons
Inve
ntor
y: 2
008
Suns
hine
Coa
st R
egio
nal D
istr
ict
CO
2eC
osts
Ener
gyC
onsu
mp
tion
Ener
gyC
osts
CO
2eTy
pe
Acc
ount
& A
ddre
ssA
ccou
nt S
ubto
tal
Acc
ount
Con
sum
ptio
n &
Cos
ts b
y En
ergy
Typ
e
F250
- 43
8$257
9 G
J$257
0.6
t0.6
t253
litre
s9
GJ
Gaso
line
F ORD
ESC
APE
- 43
7$340
10 G
J$340
0.7
t0.7
t290
litre
s10
GJ
Gaso
line
F ORD
ESC
APE
- 44
0$1,1
91
35 G
J$1,1
91
2.5
t2.5
t1,0
20
litre
s35
GJ
Gaso
line
R AN
GER
4X4
2003
- 38
9$2,9
64
89 G
J$2,9
64
6.4
t6.4
t2,5
82
litre
s89
GJ
Gaso
line
Ligh
t Tru
cks,
Van
s, a
nd S
UVs
Sub
tota
l1,7
70 G
J$58,1
71
127.5
tG
aso
line
$57,4
79
50,4
03
litre
s1,7
47
GJ
125.9
t
Die
sel
Fuel
$692
589
litre
s23
GJ
1.6
t
Mis
c.
PARK
S MIS
CEL
LAN
EOU
S EQ
UIP
. - 3
41$1,1
11
32 G
J$1,1
11
2.3
t2.3
t919
litre
s32
GJ
Gaso
line
WO
RKS M
ISC
ELLA
NEO
US -
345
$1,2
63
38 G
J$1,2
63
2.7
t2.7
t1,1
01
litre
s38
GJ
Gaso
line
Mis
c. S
ubto
tal
70 G
J$2,3
74
5.0
tG
aso
line
$2,3
74
2,0
19
litre
s70
GJ
5.0
t
Prop
ane
Equi
pm
ent
FORK
LIF
T -7 G
J$218
0.4
t0.4
t272
litre
s$218
7G
JP
ropane
Mbl
S EC
HEL
T ARE
NA Z
AM
BON
I -129 G
J$4,0
68
7.7
t7.7
t5,0
86
litre
s$4,0
68
129
GJ
Pro
pane
Mbl
Prop
ane
Equi
pm
ent S
ubto
tal
136 G
J$4,2
86
8.1
t5,3
58
litre
s136
$4,2
86
GJ
8.1
tP
ropane
Mbl
Consum
ption
CO
e 2C
osts
Energ
y6,1
37 G
J$197,7
31
440.0
t
Gaso
line
$108,4
73
94,4
68
litre
s3,2
74
GJ
235.9
t
Die
sel
Fuel
$84,9
72
70,5
11
litre
s2,7
27
GJ
196.0
t
Pro
pane
5,3
58
litre
s136
$4,2
86
GJ
8.1
tM
bl
Vehi
cle
Flee
t Sub
tota
l
SOLI
D W
AST
E
Ad
min
istr
atio
n O
ffice
s
13.4
tA
DM
INIS
TRA
TIO
N B
UIL
DIN
G -
25.2
013.4
t168
cu. yds
Solid
Waste
Adm
inis
trat
ion
Offi
ces
Sub
tota
l13.4
tS
olid
Waste
168
cu. yds
25.2
013.4
t
Com
mun
ity
Cen
tre
28/0
6/20
09Pa
ge 1
420
08 E
nerg
y &
Gre
enho
use
Gas
Em
issi
ons
Inve
ntor
y
Hyl
a En
viro
nmen
tal S
ervi
ces
Ltd.
, 169
Asp
enw
ood
Driv
e, P
ort M
oody
, BC
V3H
5A
5 rh
ayco
ck@
hesl
td.c
a M
: 604
.469
.291
0 F
: 604
.469
.294
0
53
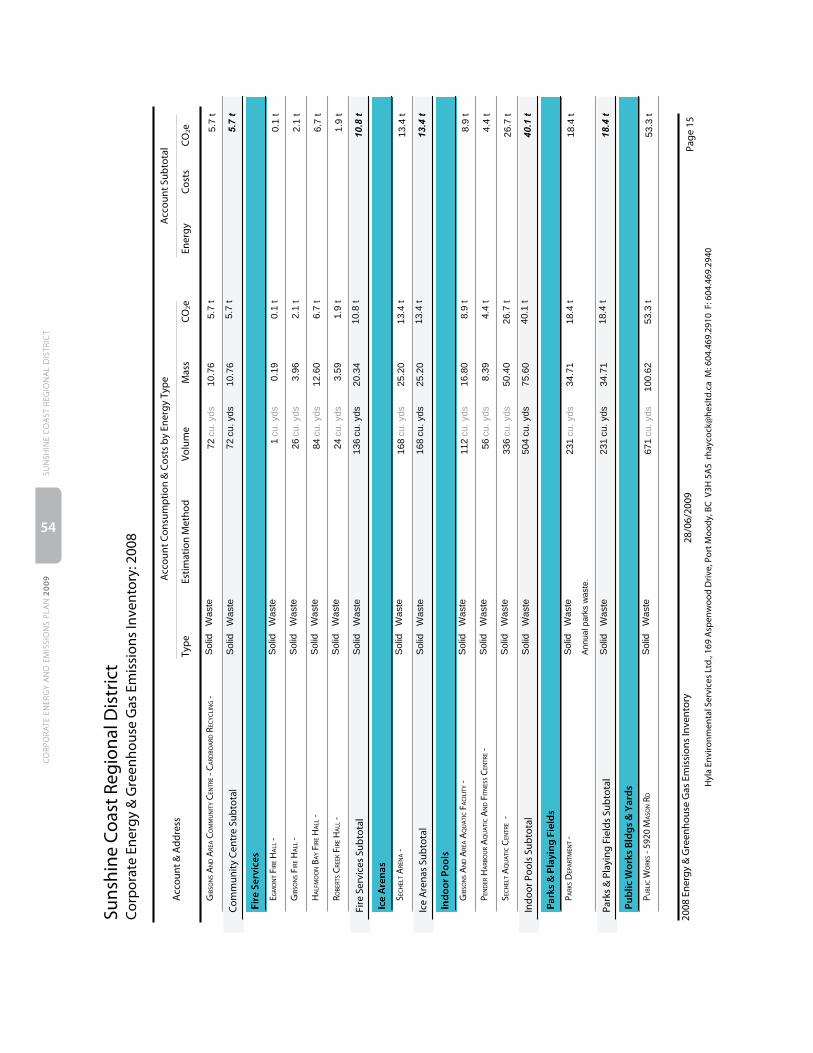
Cor
por
ate
Ener
gy &
Gre
enho
use
Gas
Em
issi
ons
Inve
ntor
y: 2
008
Suns
hine
Coa
st R
egio
nal D
istr
ict
CO
2eC
osts
Ener
gyEs
timat
ion
Met
hod
Volu
me
Mas
sC
O2e
Typ
eA
ccou
nt &
Add
ress
Acc
ount
Sub
tota
lA
ccou
nt C
onsu
mp
tion
& C
osts
by
Ener
gy T
ype
5.7
tG
IBSO
NS A
ND
ARE
A C
OM
MU
NIT
Y C
ENTR
E - C
ARD
BOA
RD R
ECYC
LIN
G -
10.7
65.7
t72
cu. yds
Solid
Waste
Com
mun
ity C
entr
e Su
bto
tal
5.7
tS
olid
Waste
72
cu. yds
10.7
65.7
t
Fire
Ser
vice
s
0.1
tE G
MO
NT F
IRE H
ALL
-0.1
90.1
t1
cu. yds
Solid
Waste
2.1
tG
IBSO
NS F
IRE H
ALL
-3.9
62.1
t26
cu. yds
Solid
Waste
6.7
tH
ALF
MO
ON
BA
Y FI
RE H
ALL
-12.6
06.7
t84
cu. yds
Solid
Waste
1.9
tR O
BERT
S CRE
EK F
IRE H
ALL
-3.5
91.9
t24
cu. yds
Solid
Waste
Fire
Ser
vice
s Su
bto
tal
10.8
tS
olid
Waste
136
cu. yds
20.3
410.8
t
Ice
Are
nas
13.4
tS E
CH
ELT A
REN
A -
25.2
013.4
t168
cu. yds
Solid
Waste
Ice
Are
nas
Sub
tota
l13.4
tS
olid
Waste
168
cu. yds
25.2
013.4
t
Ind
oor P
ools
8.9
tG
IBSO
NS A
ND
ARE
A A
QU
ATI
C F
AC
ILIT
Y -
16.8
08.9
t112
cu. yds
Solid
Waste
4.4
tP E
ND
ER H
ARB
OU
R A
QU
ATI
C A
ND
FIT
NES
S CEN
TRE -
8.3
94.4
t56
cu. yds
Solid
Waste
26.7
tS E
CH
ELT A
QU
ATI
C C
ENTR
E -
50.4
026.7
t336
cu. yds
Solid
Waste
Indo
or P
ools
Sub
tota
l40.1
tS
olid
Waste
504
cu. yds
75.6
040.1
t
Park
s &
Pla
yin
g F
ield
s
18.4
tP A
RKS D
EPA
RTM
ENT -
34.7
118.4
t
Annual park
s w
aste
.
231
cu. yds
Solid
Waste
Park
s &
Pla
ying
Fie
lds
Sub
tota
l18.4
tS
olid
Waste
231
cu. yds
34.7
118.4
t
Pub
lic W
orks
Bld
gs
& Y
ard
s
53.3
tP U
BLIC
WO
RKS -
592
0 M
ASO
N R
D100.6
253.3
t671
cu. yds
Solid
Waste
28/0
6/20
09Pa
ge 1
520
08 E
nerg
y &
Gre
enho
use
Gas
Em
issi
ons
Inve
ntor
y
Hyl
a En
viro
nmen
tal S
ervi
ces
Ltd.
, 169
Asp
enw
ood
Driv
e, P
ort M
oody
, BC
V3H
5A
5 rh
ayco
ck@
hesl
td.c
a M
: 604
.469
.291
0 F
: 604
.469
.294
0
SUN
SHIN
E C
OA
ST R
EGIO
NA
L D
ISTR
ICT
CO
RPO
RATE
EN
ERG
Y A
ND
EM
ISSI
ON
S PL
AN
200
9
54

Appendix II - Detailed GHG Emissions Inventory (2008) - Transit Buses
Corp
orat
e En
ergy
& G
reen
hous
e G
as E
mis
sion
s In
vent
ory:
200
8
CO2e
Cost
sEn
ergy
Cons
umpt
ion
Ener
gyCo
sts
CO2e
Type
Acc
ount
& A
ddre
ssA
ccou
nt S
ubto
tal
Acc
ount
Con
sum
ptio
n &
Cos
ts b
y En
ergy
Typ
e
Suns
hine
Coa
st R
egio
nal D
istr
ict
2008
VEH
ICLE
FLE
ET
Buse
s (L
ease
d - D
o N
ot C
ount
)
1995
D40
LF N
EW F
LYER
808
32,0
09 G
J144.4
t144.4
t51,9
41
litre
s2,0
09
GJ
Die
sel
Fuel
1995
D40
LF N
EW F
LYER
808
51,5
49 G
J111.3
t111.3
t40,0
48
litre
s1,5
49
GJ
Die
sel
Fuel
1995
D40
LF N
EW F
LYER
809
1995 G
J71.5
t71.5
t25,7
24
litre
s995
GJ
Die
sel
Fuel
1995
D40
LF N
EW F
LYER
809
31,7
79 G
J127.8
t127.8
t45,9
85
litre
s1,7
79
GJ
Die
sel
Fuel
1995
D40
LF N
EW F
LYER
809
41,6
14 G
J116.0
t116.0
t41,7
34
litre
s1,6
14
GJ
Die
sel
Fuel
2001
FO
RD E
350
953
193 G
J13.9
t13.9
t5,0
00
litre
s193
GJ
Die
sel
Fuel
2007
FO
RD B
US
2113
1,1
70 G
J84.1
t84.1
t30,2
55
litre
s1,1
70
GJ
Die
sel
Fuel
Buse
s (L
ease
d - D
o N
ot C
ount
) Sub
tota
l9,3
10 G
J669.0
tD
iesel
Fuel
240,6
87
litre
s9,3
10
GJ
669.0
t
Consum
ption
CO
e 2C
osts
Energ
y9,3
10 G
J669.0
t
Die
selF
uel
240,6
87
litre
s9,3
10
GJ
669.0
t
Vehi
cle
Flee
t Sub
tota
l
4/26
/200
920
08 E
nerg
y &
Gre
enho
use
Gas
Em
issi
ons
Inve
ntor
y
Ener
gy &
Em
issi
ons
Mon
itori
ng a
nd R
epor
ting
Syst
em™
v.
3.01
55

Appendix III - Detailed GHG Emissions Inventory (2008) By Department
Cor
por
ate
Ener
gy &
Gre
enho
use
Gas
Em
issi
ons
Inve
ntor
y: 2
008
CO
2eC
osts
Ener
gyC
onsu
mp
tion
Ener
gyC
osts
CO
2eTy
pe
Acc
ount
& A
ddre
ssA
ccou
nt S
ubto
tal
Acc
ount
Con
sum
ptio
n &
Cos
ts b
y En
ergy
Typ
e
Suns
hine
Coa
st R
egio
nal D
istr
ict
2008
BU
ILD
ING
S/B
YLA
W
Gas
olin
e Pa
ssen
ger
Car
s
$2
,81
48
6 G
J$
2,8
14
6.2
t6
.2 t
2,4
75
litre
s8
6G
JG
aso
line
2000
SU
ZUKI
VIT
RA. C
OST
CEN
TRE 5
20
$4
,54
51
36
GJ
$4
,54
59
.8 t
9.8
t3
,92
6lit
res
13
6G
JG
aso
line
2002
FO
RD R
AN
GER
. CO
ST C
ENTR
E 290
$1
,55
94
7 G
J$
1,5
59
3.4
t3
.4 t
1,3
59
litre
s4
7G
JG
aso
line
2003
GEO
TRA
CKE
R. C
OST
CEN
TRE 5
20
$1
,79
65
4 G
J$
1,7
96
3.9
t3
.9 t
1,5
71
litre
s5
4G
JG
aso
line
2003
GEO
TRA
CKE
R. C
OST
CEN
TRE 2
00
$3
,20
69
8 G
J$
3,2
06
7.0
t7
.0 t
2,8
22
litre
s9
8G
JG
aso
line
2004
CH
EV T
RCKR
4D
RHT.
CO
ST C
ENTR
E 520
Gas
olin
e Pa
ssen
ger C
ars
Sub
tota
l4
21
GJ
$1
3,9
20
30
.4 t
Ga
so
line
$1
3,9
20
12
,15
3lit
res
42
1G
J3
0.4
t
Lig
ht T
ruck
s, V
ans,
an
d S
UV
s
$2
,46
37
2 G
J$
2,4
63
5.2
t5
.2 t
2,0
73
litre
s7
2G
JG
aso
line
E250
VA
N. C
OST
CEN
TRE 5
20
$1
,19
13
5 G
J$
1,1
91
2.5
t2
.5 t
1,0
20
litre
s3
5G
JG
aso
line
F ORD
ESC
APE
. CO
ST C
ENTR
E 520
Ligh
t Tru
cks,
Van
s, a
nd S
UVs
Sub
tota
l1
07
GJ
$3
,65
47
.7 t
Ga
so
line
$3
,65
43
,09
3lit
res
10
7G
J7
.7 t
Co
nsu
mptio
nC
O e 2
Co
sts
En
erg
y5
28
GJ
$1
7,5
74
38
.1 t
Ga
so
line
$1
7,5
74
15
,24
6lit
res
52
8G
J3
8.1
t
Vehi
cle
Flee
t Sub
tota
l
BU
ILD
ING
MA
INTE
NA
NC
E
Die
sel F
uel M
ediu
m to
Hea
vy T
ruck
s
$1
,92
66
2 G
J$
1,9
26
4.4
t4
.4 t
1,5
99
litre
s6
2G
JD
iese
lF
ue
l20
08 F
ORD
F35
0 4X
4 SU
PER
CA
B. C
OST
CEN
TRE 3
13
28/0
6/20
0920
08 E
nerg
y &
Gre
enho
use
Gas
Em
issi
ons
Inve
ntor
y
Ener
gy
& E
mis
sion
s M
onit
orin
g a
nd
Rep
orti
ng
Sys
tem
™
v.3.
01
SUN
SHIN
E C
OA
ST R
EGIO
NA
L D
ISTR
ICT
CO
RPO
RATE
EN
ERG
Y A
ND
EM
ISSI
ON
S PL
AN
200
9
56
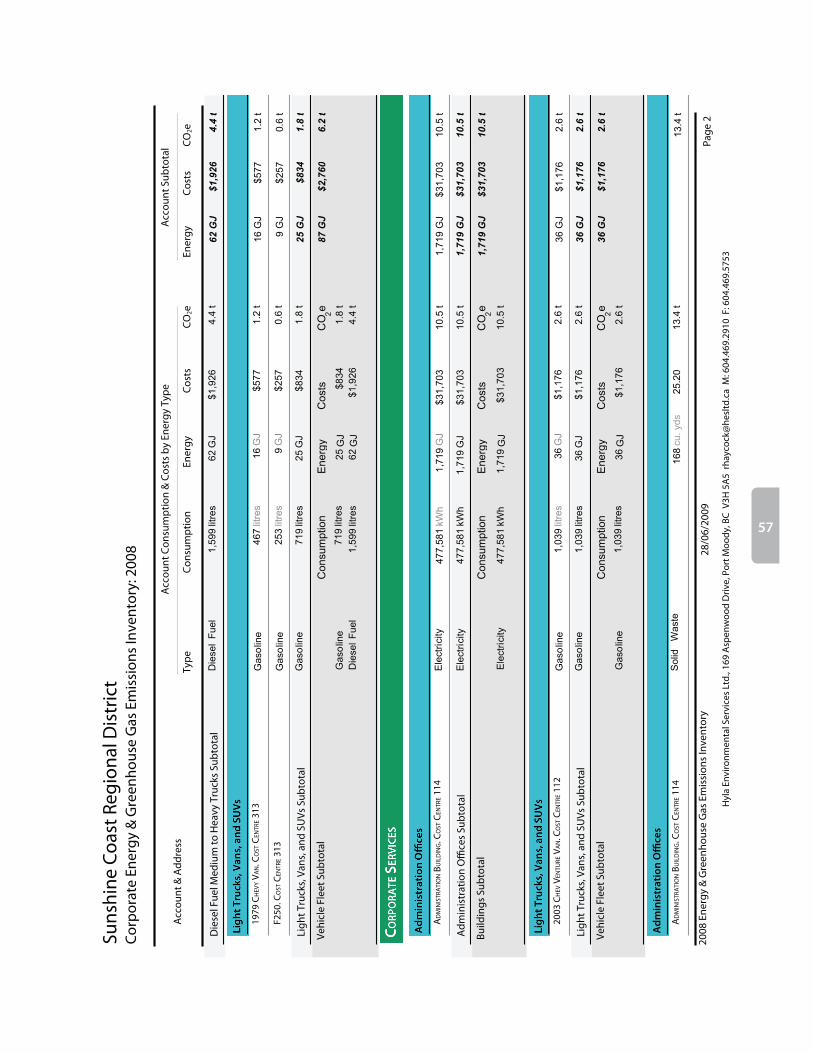
Cor
por
ate
Ener
gy &
Gre
enho
use
Gas
Em
issi
ons
Inve
ntor
y: 2
008
Suns
hine
Coa
st R
egio
nal D
istr
ict
CO
2eC
osts
Ener
gyC
onsu
mp
tion
Ener
gyC
osts
CO
2eTy
pe
Acc
ount
& A
ddre
ssA
ccou
nt S
ubto
tal
Acc
ount
Con
sum
ptio
n &
Cos
ts b
y En
ergy
Typ
e
Die
sel F
uel M
ediu
m to
Hea
vy T
ruck
s Su
bto
tal
62
GJ
$1
,92
64
.4 t
Die
se
lF
ue
l$
1,9
26
1,5
99
litre
s6
2G
J4
.4 t
Lig
ht T
ruck
s, V
ans,
an
d S
UV
s
$5
77
16
GJ
$5
77
1.2
t1
.2 t
46
7lit
res
16
GJ
Ga
so
line
1979
CH
EVY
VAN
. CO
ST C
ENTR
E 313
$2
57
9 G
J$
25
70
.6 t
0.6
t2
53
litre
s9
GJ
Ga
so
line
F250
. CO
ST C
ENTR
E 313
Ligh
t Tru
cks,
Van
s, a
nd S
UVs
Sub
tota
l2
5 G
J$
83
41
.8 t
Ga
so
line
$8
34
71
9lit
res
25
GJ
1.8
t
Co
nsu
mptio
nC
O e 2
Co
sts
En
erg
y8
7 G
J$
2,7
60
6.2
t
Ga
so
line
$8
34
71
9lit
res
25
GJ
1.8
t
Die
se
lF
ue
l$
1,9
26
1,5
99
litre
s6
2G
J4
.4 t
Vehi
cle
Flee
t Sub
tota
l
CO
RPO
RATE
SER
VIC
ES
Ad
min
istr
atio
n O
ffice
s
$3
1,7
03
1,7
19
GJ
$3
1,7
03
10
.5 t
10
.5 t
47
7,5
81
kW
h1
,71
9G
JE
lectr
icity
AD
MIN
ISTR
ATI
ON
BU
ILD
ING
. CO
ST C
ENTR
E 114
Adm
inis
trat
ion
Offi
ces
Sub
tota
l1
,71
9 G
J$
31
,70
31
0.5
t$
31
,70
34
77
,58
1kW
hE
lectr
icity
1,7
19
GJ
10
.5 t
Co
nsu
mptio
nC
O e 2
Co
sts
En
erg
y1
,71
9 G
J$
31
,70
31
0.5
t
$3
1,7
03
47
7,5
81
kW
hE
lectr
icity
1,7
19
GJ
10
.5 t
Build
ings
Sub
tota
l
Lig
ht T
ruck
s, V
ans,
an
d S
UV
s
$1
,17
63
6 G
J$
1,1
76
2.6
t2
.6 t
1,0
39
litre
s3
6G
JG
aso
line
2003
CH
EV V
ENTU
RE V
AN
. CO
ST C
ENTR
E 112
Ligh
t Tru
cks,
Van
s, a
nd S
UVs
Sub
tota
l3
6 G
J$
1,1
76
2.6
tG
aso
line
$1
,17
61
,03
9lit
res
36
GJ
2.6
t
Co
nsu
mptio
nC
O e 2
Co
sts
En
erg
y3
6 G
J$
1,1
76
2.6
t
Ga
so
line
$1
,17
61
,03
9lit
res
36
GJ
2.6
t
Vehi
cle
Flee
t Sub
tota
l
Ad
min
istr
atio
n O
ffice
s
13
.4 t
25
.20
13
.4 t
16
8cu
. yd
sS
olid
Wa
ste
AD
MIN
ISTR
ATI
ON
BU
ILD
ING
. CO
ST C
ENTR
E 114
28/0
6/20
09Pa
ge 2
2008
Ene
rgy
& G
reen
hous
e G
as E
mis
sion
s In
vent
ory
Hyl
a En
viro
nmen
tal S
ervi
ces
Ltd.
, 169
Asp
enw
ood
Driv
e, P
ort M
oody
, BC
V3H
5A
5 rh
ayco
ck@
hesl
td.c
a M
: 604
.469
.291
0 F
: 604
.469
.575
3
57
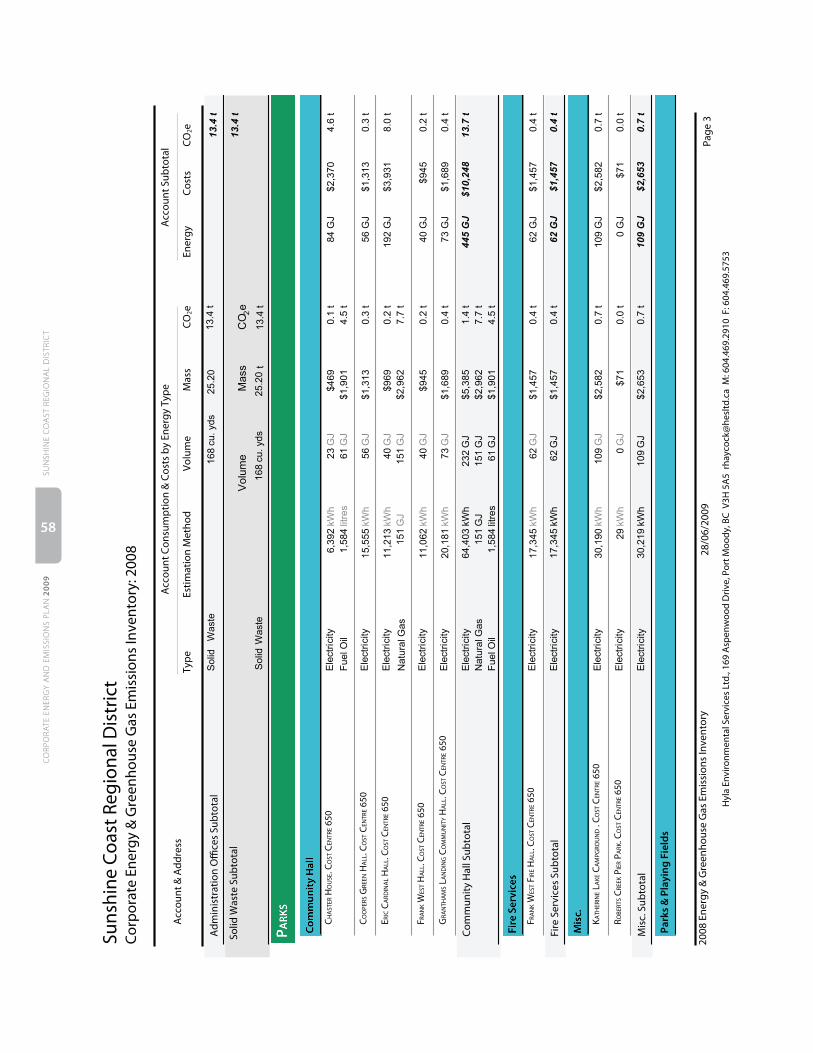
Cor
por
ate
Ener
gy &
Gre
enho
use
Gas
Em
issi
ons
Inve
ntor
y: 2
008
Suns
hine
Coa
st R
egio
nal D
istr
ict
CO
2eC
osts
Ener
gyEs
timat
ion
Met
hod
Volu
me
Mas
sC
O2e
Typ
eA
ccou
nt &
Add
ress
Acc
ount
Sub
tota
lA
ccou
nt C
onsu
mp
tion
& C
osts
by
Ener
gy T
ype
Adm
inis
trat
ion
Offi
ces
Sub
tota
l1
3.4
tS
olid
Wa
ste
16
8cu
. yd
s2
5.2
01
3.4
t
Ma
ss
Vo
lum
e1
3.4
t
So
lidW
aste
16
8cu
. yd
s2
5.2
0t
13
.4 t
Solid
Was
te S
ubto
tal
CO
e 2
PARK
S
Com
mun
ity
Hal
l
$4
69
$1
,90
1
84
GJ
$2
,37
04
.6 t
0.1
t
4.5
t
6,3
92
kW
h
1,5
84
litre
s
23
GJ
61
GJ
Fu
elO
il
Ele
ctr
icity
CH
AST
ER H
OU
SE. C
OST
CEN
TRE 6
50
$1
,31
35
6 G
J$
1,3
13
0.3
t0
.3 t
15
,55
5kW
h5
6G
JE
lectr
icity
CO
OPE
RS G
REEN
HA
LL. C
OST
CEN
TRE 6
50
$9
69
$2
,96
2
19
2 G
J$
3,9
31
8.0
t0
.2 t
7.7
t
11
,21
3kW
h
15
1G
J
40
GJ
15
1G
JN
atu
ralG
as
Ele
ctr
icity
E RIC
CA
RDIN
AL H
ALL
. CO
ST C
ENTR
E 650
$9
45
40
GJ
$9
45
0.2
t0
.2 t
11
,06
2kW
h4
0G
JE
lectr
icity
F RA
NK
WES
T HA
LL. C
OST
CEN
TRE 6
50
$1
,68
97
3 G
J$
1,6
89
0.4
t0
.4 t
20
,18
1kW
h7
3G
JE
lectr
icity
GRA
NTH
AM
S LA
ND
ING
CO
MM
UN
ITY
HA
LL. C
OST
CEN
TRE 6
50
Com
mun
ity H
all S
ubto
tal
44
5 G
J$
10
,24
81
3.7
t$
5,3
85
64
,40
3kW
hE
lectr
icity
23
2G
J1
.4 t
$2
,96
21
51
GJ
Na
tura
lG
as
15
1G
J7
.7 t
$1
,90
11
,58
4lit
res
61
GJ
4.5
tF
ue
lO
il
Fire
Ser
vice
s
$1
,45
76
2 G
J$
1,4
57
0.4
t0
.4 t
17
,34
5kW
h6
2G
JE
lectr
icity
F RA
NK
WES
T FIR
E HA
LL. C
OST
CEN
TRE 6
50
Fire
Ser
vice
s Su
bto
tal
62
GJ
$1
,45
70
.4 t
$1
,45
71
7,3
45
kW
hE
lectr
icity
62
GJ
0.4
t
Mis
c.
$2
,58
21
09
GJ
$2
,58
20
.7 t
0.7
t3
0,1
90
kW
h1
09
GJ
Ele
ctr
icity
K ATH
ERIN
E LA
KE C
AM
PGRO
UN
D .
CO
ST C
ENTR
E 650
$7
10
GJ
$7
10
.0 t
0.0
t2
9kW
h0
GJ
Ele
ctr
icity
R OBE
RTS C
REEK
PIE
R PA
RK. C
OST
CEN
TRE 6
50
Mis
c. S
ubto
tal
10
9 G
J$
2,6
53
0.7
t$
2,6
53
30
,21
9kW
hE
lectr
icity
10
9G
J0
.7 t
Park
s &
Pla
yin
g F
ield
s
28/0
6/20
09Pa
ge 3
2008
Ene
rgy
& G
reen
hous
e G
as E
mis
sion
s In
vent
ory
Hyl
a En
viro
nmen
tal S
ervi
ces
Ltd.
, 169
Asp
enw
ood
Driv
e, P
ort M
oody
, BC
V3H
5A
5 rh
ayco
ck@
hesl
td.c
a M
: 604
.469
.291
0 F
: 604
.469
.575
3
SUN
SHIN
E C
OA
ST R
EGIO
NA
L D
ISTR
ICT
CO
RPO
RATE
EN
ERG
Y A
ND
EM
ISSI
ON
S PL
AN
200
9
58
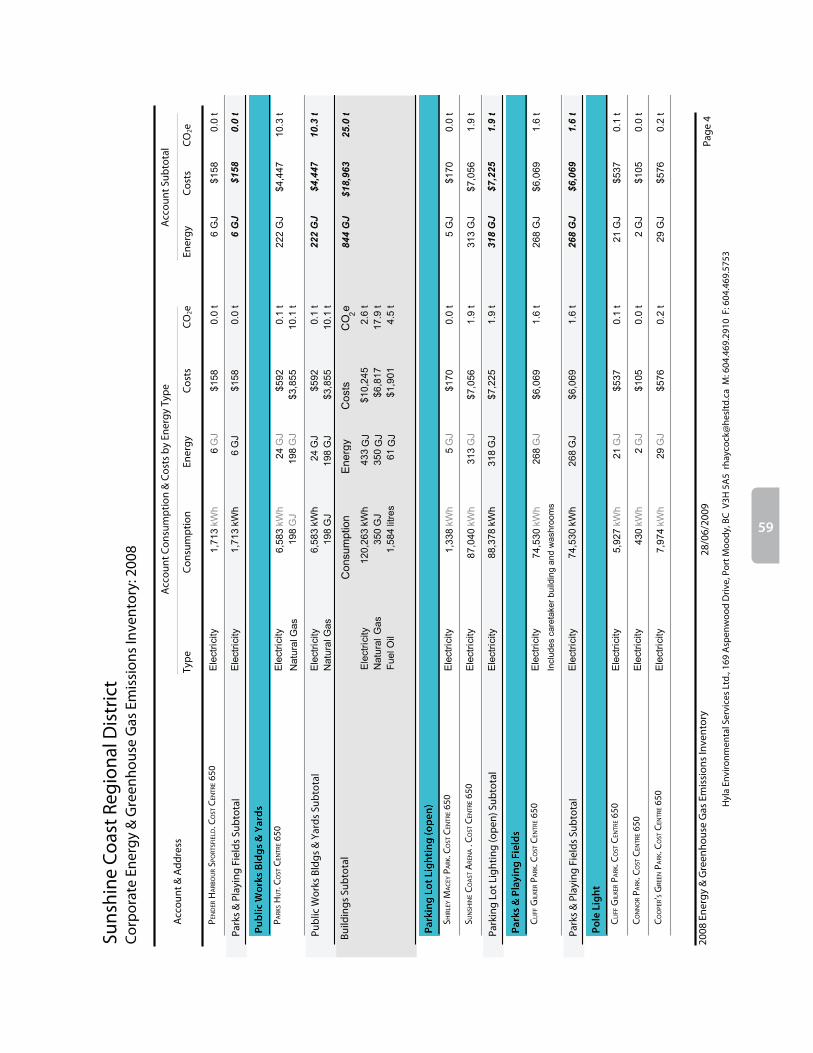
Cor
por
ate
Ener
gy &
Gre
enho
use
Gas
Em
issi
ons
Inve
ntor
y: 2
008
Suns
hine
Coa
st R
egio
nal D
istr
ict
CO
2eC
osts
Ener
gyC
onsu
mp
tion
Ener
gyC
osts
CO
2eTy
pe
Acc
ount
& A
ddre
ssA
ccou
nt S
ubto
tal
Acc
ount
Con
sum
ptio
n &
Cos
ts b
y En
ergy
Typ
e $1
58
6 G
J$
15
80
.0 t
0.0
t1
,71
3kW
h6
GJ
Ele
ctr
icity
P EN
DER
HA
RBO
UR
SPO
RTSF
IELD
. CO
ST C
ENTR
E 650
Park
s &
Pla
ying
Fie
lds
Sub
tota
l6
GJ
$1
58
0.0
t$
15
81
,71
3kW
hE
lectr
icity
6G
J0
.0 t
Pub
lic W
orks
Bld
gs
& Y
ard
s
$5
92
$3
,85
5
22
2 G
J$
4,4
47
10
.3 t
0.1
t
10
.1 t
6,5
83
kW
h
19
8G
J
24
GJ
19
8G
JN
atu
ralG
as
Ele
ctr
icity
P ARK
S HU
T. C
OST
CEN
TRE 6
50
Pub
lic W
orks
Bld
gs &
Yar
ds S
ubto
tal
22
2 G
J$
4,4
47
10
.3 t
$5
92
6,5
83
kW
hE
lectr
icity
24
GJ
0.1
t
$3
,85
51
98
GJ
Na
tura
lG
as
19
8G
J1
0.1
t
Co
nsu
mptio
nC
O e 2
Co
sts
En
erg
y8
44
GJ
$1
8,9
63
25
.0 t
$1
0,2
45
12
0,2
63
kW
hE
lectr
icity
43
3G
J2
.6 t
$6
,81
73
50
GJ
Na
tura
lG
as
35
0G
J1
7.9
t
$1
,90
11
,58
4lit
res
61
GJ
4.5
tF
ue
lO
il
Build
ings
Sub
tota
l
Park
ing
Lot
Lig
hti
ng
(op
en)
$1
70
5 G
J$
17
00
.0 t
0.0
t1
,33
8kW
h5
GJ
Ele
ctr
icity
S HIR
LEY
MA
CEY
PA
RK. C
OST
CEN
TRE 6
50
$7
,05
63
13
GJ
$7
,05
61
.9 t
1.9
t8
7,0
40
kW
h3
13
GJ
Ele
ctr
icity
S UN
SHIN
E CO
AST
ARE
NA .
CO
ST C
ENTR
E 650
Park
ing
Lot L
ight
ing
(op
en) S
ubto
tal
31
8 G
J$
7,2
25
1.9
t$
7,2
25
88
,37
8kW
hE
lectr
icity
31
8G
J1
.9 t
Park
s &
Pla
yin
g F
ield
s
$6
,06
92
68
GJ
$6
,06
91
.6 t
1.6
t
Inclu
de
s c
are
take
r b
uild
ing
an
d w
ash
roo
ms
74
,53
0kW
h2
68
GJ
Ele
ctr
icity
CLI
FF G
ILKE
R PA
RK. C
OST
CEN
TRE 6
50
Park
s &
Pla
ying
Fie
lds
Sub
tota
l2
68
GJ
$6
,06
91
.6 t
$6
,06
97
4,5
30
kW
hE
lectr
icity
26
8G
J1
.6 t
Pole
Lig
ht
$5
37
21
GJ
$5
37
0.1
t0
.1 t
5,9
27
kW
h2
1G
JE
lectr
icity
CLI
FF G
ILKE
R PA
RK. C
OST
CEN
TRE 6
50
$1
05
2 G
J$
10
50
.0 t
0.0
t4
30
kW
h2
GJ
Ele
ctr
icity
CO
NN
OR
PARK
. CO
ST C
ENTR
E 650
$5
76
29
GJ
$5
76
0.2
t0
.2 t
7,9
74
kW
h2
9G
JE
lectr
icity
CO
OPE
R’S G
REEN
PA
RK. C
OST
CEN
TRE 6
50
28/0
6/20
09Pa
ge 4
2008
Ene
rgy
& G
reen
hous
e G
as E
mis
sion
s In
vent
ory
Hyl
a En
viro
nmen
tal S
ervi
ces
Ltd.
, 169
Asp
enw
ood
Driv
e, P
ort M
oody
, BC
V3H
5A
5 rh
ayco
ck@
hesl
td.c
a M
: 604
.469
.291
0 F
: 604
.469
.575
3
59

Cor
por
ate
Ener
gy &
Gre
enho
use
Gas
Em
issi
ons
Inve
ntor
y: 2
008
Suns
hine
Coa
st R
egio
nal D
istr
ict
CO
2eC
osts
Ener
gyC
onsu
mp
tion
Ener
gyC
osts
CO
2eTy
pe
Acc
ount
& A
ddre
ssA
ccou
nt S
ubto
tal
Acc
ount
Con
sum
ptio
n &
Cos
ts b
y En
ergy
Typ
e $7
82
GJ
$7
80
.0 t
0.0
t4
55
kW
h2
GJ
Ele
ctr
icity
DA
N B
OSC
H P
ARK
. CO
ST C
ENTR
E 650
$9
32
GJ
$9
30
.0 t
0.0
t4
35
kW
h2
GJ
Ele
ctr
icity
F RA
NK
WES
T HA
LL A
ND
FIR
E HA
LL. C
OST
CEN
TRE 6
50
$8
04
32
GJ
$8
04
0.2
t0
.2 t
9,0
26
kW
h3
2G
JE
lectr
icity
K ATH
ERIN
E LA
KE C
AM
PGRO
UN
D .
CO
ST C
ENTR
E 650
Pole
Lig
ht S
ubto
tal
87
GJ
$2
,19
40
.5 t
$2
,19
42
4,2
47
kW
hE
lectr
icity
87
GJ
0.5
t
Co
nsu
mptio
nC
O e 2
Co
sts
En
erg
y6
74
GJ
$1
5,4
88
4.1
t
$1
5,4
88
18
7,1
55
kW
hE
lectr
icity
67
4G
J4
.1 t
Ligh
ting
Sub
tota
l
Die
sel F
uel O
ff R
oad
Veh
icle
s &
Eq
uip
men
t
$1
39
4 G
J$
13
90
.3 t
0.3
t1
02
litre
s4
GJ
Die
se
lF
ue
l19
87 G
ATO
R JO
HN
DEE
RE. C
OST
CEN
TRE 6
50
$2
,93
01
11
GJ
$2
,93
08
.0 t
8.0
t2
,87
7lit
res
11
1G
JD
iese
lF
ue
l20
05 P
ISTE
N B
ULL
Y PB
100.
CO
ST C
ENTR
E 680
$8
15
24
GJ
$8
15
1.7
t1
.7 t
62
9lit
res
24
GJ
Die
se
lF
ue
lTR
AC
TOR.
CO
ST C
ENTR
E 650
Die
sel F
uel O
ff R
oad
Vehi
cles
& E
quip
men
t Sub
tota
l1
40
GJ
$3
,88
41
0.0
tD
iese
lF
ue
l$
3,8
84
3,6
08
litre
s1
40
GJ
10
.0 t
Gas
olin
e O
ff R
oad
Veh
icle
s &
Eq
uip
men
t
$1
70
GJ
$1
70
.0 t
0.0
t1
2lit
res
0G
JG
aso
line
2005
JO
HN
DEE
RE T
RAIL
BUC
K A
TV. C
OST
CEN
TRE 6
50
$3
93
14
GJ
$3
93
1.0
t1
.0 t
39
6lit
res
14
GJ
Ga
so
line
2006
SKA
ND
IC S
WT 5
50F S
KID
OO
. CO
ST C
ENTR
E 680
$3
19
9 G
J$
31
90
.6 t
0.6
t2
59
litre
s9
GJ
Ga
so
line
MO
WER
. CO
ST C
ENTR
E 650
Gas
olin
e O
ff R
oad
Vehi
cles
& E
quip
men
t Sub
tota
l2
3 G
J$
72
81
.7 t
Ga
so
line
$7
28
66
7lit
res
23
GJ
1.7
t
Gas
olin
e Pa
ssen
ger
Car
s
$8
58
26
GJ
$8
58
1.9
t1
.9 t
75
6lit
res
26
GJ
Ga
so
line
92 T
RAC
KER.
CO
ST C
ENTR
E 650
Gas
olin
e Pa
ssen
ger C
ars
Sub
tota
l2
6 G
J$
85
81
.9 t
Ga
so
line
$8
58
75
6lit
res
26
GJ
1.9
t
Lig
ht T
ruck
s, V
ans,
an
d S
UV
s
$3
,14
69
3 G
J$
3,1
46
6.7
t6
.7 t
2,6
73
litre
s9
3G
JG
aso
line
2000
F25
0 F O
RD. C
OST
CEN
TRE 6
50
28/0
6/20
09Pa
ge 5
2008
Ene
rgy
& G
reen
hous
e G
as E
mis
sion
s In
vent
ory
Hyl
a En
viro
nmen
tal S
ervi
ces
Ltd.
, 169
Asp
enw
ood
Driv
e, P
ort M
oody
, BC
V3H
5A
5 rh
ayco
ck@
hesl
td.c
a M
: 604
.469
.291
0 F
: 604
.469
.575
3
SUN
SHIN
E C
OA
ST R
EGIO
NA
L D
ISTR
ICT
CO
RPO
RATE
EN
ERG
Y A
ND
EM
ISSI
ON
S PL
AN
200
9
60
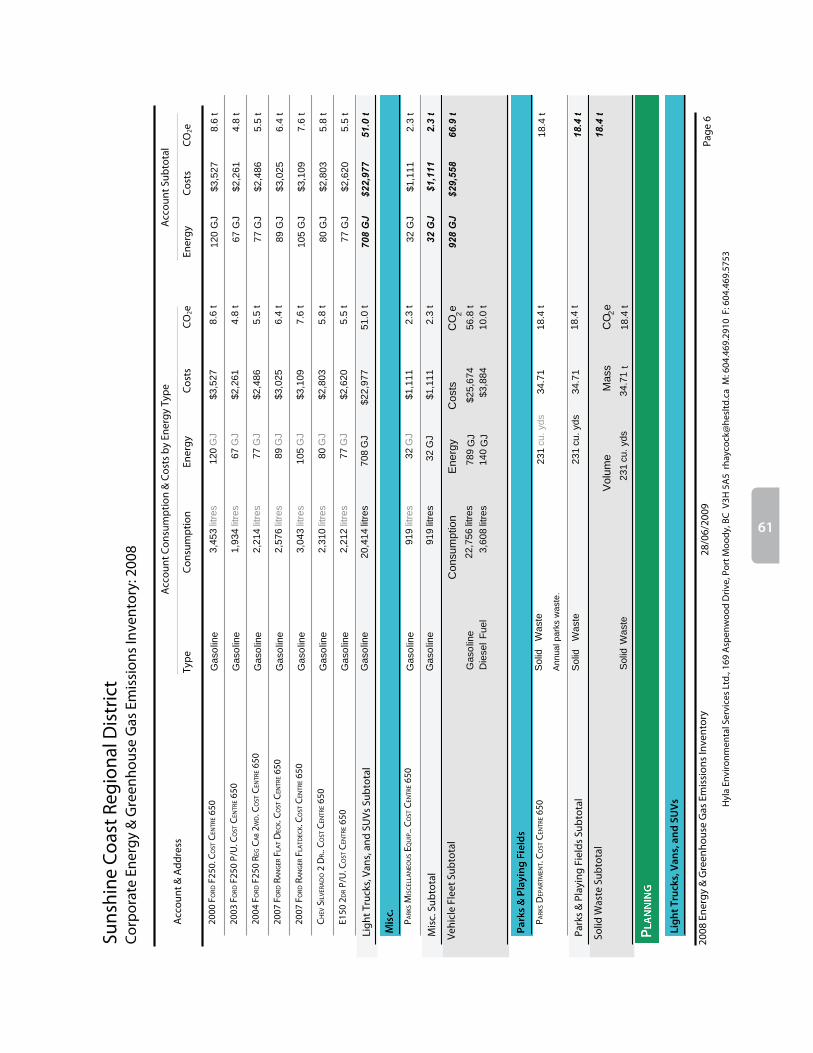
Cor
por
ate
Ener
gy &
Gre
enho
use
Gas
Em
issi
ons
Inve
ntor
y: 2
008
Suns
hine
Coa
st R
egio
nal D
istr
ict
CO
2eC
osts
Ener
gyC
onsu
mp
tion
Ener
gyC
osts
CO
2eTy
pe
Acc
ount
& A
ddre
ssA
ccou
nt S
ubto
tal
Acc
ount
Con
sum
ptio
n &
Cos
ts b
y En
ergy
Typ
e
$3
,52
71
20
GJ
$3
,52
78
.6 t
8.6
t3
,45
3lit
res
12
0G
JG
aso
line
2000
FO
RD F
250.
CO
ST C
ENTR
E 650
$2
,26
16
7 G
J$
2,2
61
4.8
t4
.8 t
1,9
34
litre
s6
7G
JG
aso
line
2003
FO
RD F
250
P/U
. CO
ST C
ENTR
E 650
$2
,48
67
7 G
J$
2,4
86
5.5
t5
.5 t
2,2
14
litre
s7
7G
JG
aso
line
2004
FO
RD F
250
REG
CA
B 2W
D. C
OST
CEN
TRE 6
50
$3
,02
58
9 G
J$
3,0
25
6.4
t6
.4 t
2,5
76
litre
s8
9G
JG
aso
line
2007
FO
RD R
AN
GER
FLA
T DEC
K. C
OST
CEN
TRE 6
50
$3
,10
91
05
GJ
$3
,10
97
.6 t
7.6
t3
,04
3lit
res
10
5G
JG
aso
line
2007
FO
RD R
AN
GER
FLA
TDEC
K. C
OST
CEN
TRE 6
50
$2
,80
38
0 G
J$
2,8
03
5.8
t5
.8 t
2,3
10
litre
s8
0G
JG
aso
line
CH
EV S
ILVE
RAD
O 2
DR.
. CO
ST C
ENTR
E 650
$2
,62
07
7 G
J$
2,6
20
5.5
t5
.5 t
2,2
12
litre
s7
7G
JG
aso
line
E150
2D
R P/
U. C
OST
CEN
TRE 6
50
Ligh
t Tru
cks,
Van
s, a
nd S
UVs
Sub
tota
l7
08
GJ
$2
2,9
77
51
.0 t
Ga
so
line
$2
2,9
77
20
,41
4lit
res
70
8G
J5
1.0
t
Mis
c.
$1
,11
13
2 G
J$
1,1
11
2.3
t2
.3 t
91
9lit
res
32
GJ
Ga
so
line
P ARK
S MIS
CEL
LAN
EOU
S EQ
UIP
.. C
OST
CEN
TRE 6
50
Mis
c. S
ubto
tal
32
GJ
$1
,11
12
.3 t
Ga
so
line
$1
,11
19
19
litre
s3
2G
J2
.3 t
Co
nsu
mptio
nC
O e 2
Co
sts
En
erg
y9
28
GJ
$2
9,5
58
66
.9 t
Ga
so
line
$2
5,6
74
22
,75
6lit
res
78
9G
J5
6.8
t
Die
se
lF
ue
l$
3,8
84
3,6
08
litre
s1
40
GJ
10
.0 t
Vehi
cle
Flee
t Sub
tota
l
Park
s &
Pla
yin
g F
ield
s
18
.4 t
34
.71
18
.4 t
An
nu
al p
ark
s w
aste
.
23
1cu
. yd
sS
olid
Wa
ste
PARK
S DEP
ART
MEN
T. C
OST
CEN
TRE 6
50
Park
s &
Pla
ying
Fie
lds
Sub
tota
l1
8.4
tS
olid
Wa
ste
23
1cu
. yd
s3
4.7
11
8.4
t
Ma
ss
Vo
lum
e1
8.4
t
So
lidW
aste
23
1cu
. yd
s3
4.7
1t
18
.4 t
Solid
Was
te S
ubto
tal
CO
e 2
PLA
NN
ING
Lig
ht T
ruck
s, V
ans,
an
d S
UV
s
28/0
6/20
09Pa
ge 6
2008
Ene
rgy
& G
reen
hous
e G
as E
mis
sion
s In
vent
ory
Hyl
a En
viro
nmen
tal S
ervi
ces
Ltd.
, 169
Asp
enw
ood
Driv
e, P
ort M
oody
, BC
V3H
5A
5 rh
ayco
ck@
hesl
td.c
a M
: 604
.469
.291
0 F
: 604
.469
.575
3
61
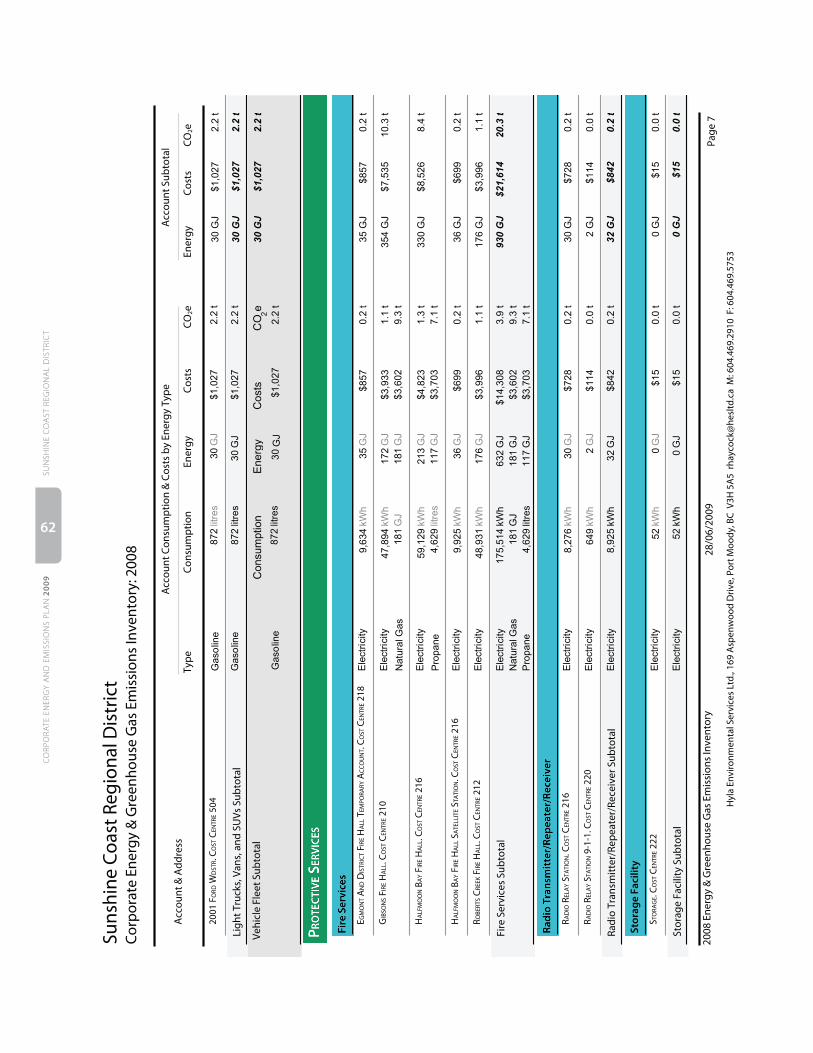
Cor
pora
te E
nerg
y &
Gre
enho
use
Gas
Em
issi
ons
Inve
ntor
y: 2
008
Suns
hine
Coa
st R
egio
nal D
istr
ict
CO
2eC
osts
Ener
gyC
onsu
mpt
ion
Ener
gyC
osts
CO
2eTy
peA
ccou
nt &
Add
ress
Acc
ount
Sub
tota
lA
ccou
nt C
onsu
mpt
ion
& C
osts
by
Ener
gy T
ype
$1
,02
73
0 G
J$
1,0
27
2.2
t2
.2 t
87
2lit
res
30
GJ
Ga
so
line
2001
FO
RD W
DST
R. C
OST
CEN
TRE 5
04
Ligh
t Tru
cks,
Van
s, a
nd S
UVs
Sub
tota
l3
0 G
J$
1,0
27
2.2
tG
aso
line
$1
,02
78
72
litre
s3
0G
J2
.2 t
Co
nsu
mptio
nC
O e 2
Co
sts
En
erg
y3
0 G
J$
1,0
27
2.2
t
Ga
so
line
$1
,02
78
72
litre
s3
0G
J2
.2 t
Vehi
cle
Flee
t Sub
tota
l
PRO
TEC
TIV
E SE
RVIC
ES
Fire
Ser
vice
s
$8
57
35
GJ
$8
57
0.2
t0
.2 t
9,6
34
kW
h3
5G
JE
lectr
icity
E GM
ON
T AN
D D
ISTR
ICT F
IRE H
ALL
TEM
PORA
RY A
CC
OU
NT.
CO
ST C
ENTR
E 218
$3
,93
3
$3
,60
2
35
4 G
J$
7,5
35
10
.3 t
1.1
t
9.3
t
47
,89
4kW
h
18
1G
J
17
2G
J
18
1G
JN
atu
ralG
as
Ele
ctr
icity
GIB
SON
S FIR
E HA
LL. C
OST
CEN
TRE 2
10
$4
,82
33
30
GJ
$8
,52
68
.4 t
$3
,70
3
1.3
t
7.1
t
59
,12
9kW
h
4,6
29
litre
s
21
3G
J
11
7G
JP
rop
an
e
Ele
ctr
icity
HA
LFM
OO
N B
AY
FIRE
HA
LL. C
OST
CEN
TRE 2
16
$6
99
36
GJ
$6
99
0.2
t0
.2 t
9,9
25
kW
h3
6G
JE
lectr
icity
HA
LFM
OO
N B
AY
FIRE
HA
LL S
ATE
LLIT
E STA
TIO
N. C
OST
CEN
TRE 2
16
$3
,99
61
76
GJ
$3
,99
61
.1 t
1.1
t4
8,9
31
kW
h1
76
GJ
Ele
ctr
icity
R OBE
RTS C
REEK
FIR
E HA
LL. C
OST
CEN
TRE 2
12
Fire
Ser
vice
s Su
btot
al9
30
GJ
$2
1,6
14
20
.3 t
$1
4,3
08
17
5,5
14
kW
hE
lectr
icity
63
2G
J3
.9 t
$3
,60
21
81
GJ
Na
tura
lGa
s1
81
GJ
9.3
t
Pro
pa
ne
4,6
29
litre
s1
17
$3
,70
3G
J7
.1 t
Rad
io T
rans
mit
ter/
Rep
eate
r/Re
ceiv
er
$7
28
30
GJ
$7
28
0.2
t0
.2 t
8,2
76
kW
h3
0G
JE
lectr
icity
R AD
IO R
ELA
Y ST
ATI
ON
. CO
ST C
ENTR
E 216
$1
14
2 G
J$
11
40
.0 t
0.0
t6
49
kW
h2
GJ
Ele
ctr
icity
R AD
IO R
ELA
Y ST
ATI
ON
9-1
-1. C
OST
CEN
TRE 2
20
Radi
o Tr
ansm
itter
/Rep
eate
r/Re
ceiv
er S
ubto
tal
32
GJ
$8
42
0.2
t$
84
28
,92
5kW
hE
lectr
icity
32
GJ
0.2
t
Stor
age
Faci
lity
$1
50
GJ
$1
50
.0 t
0.0
t5
2kW
h0
GJ
Ele
ctr
icity
S TO
RAG
E. C
OST
CEN
TRE 2
22
Stor
age
Faci
lity
Subt
otal
0 G
J$
15
0.0
t$
15
52
kW
hE
lectr
icity
0G
J0
.0 t
28/0
6/20
09Pa
ge 7
2008
Ene
rgy
& G
reen
hous
e G
as E
mis
sion
s In
vent
ory
Hyl
a En
viro
nmen
tal S
ervi
ces
Ltd.
, 169
Asp
enw
ood
Driv
e, P
ort M
oody
, BC
V3H
5A
5 rh
ayco
ck@
hesl
td.c
a M
: 604
.469
.291
0 F
: 604
.469
.575
3
SUN
SHIN
E C
OA
ST R
EGIO
NA
L D
ISTR
ICT
CO
RPO
RATE
EN
ERG
Y A
ND
EM
ISSI
ON
S PL
AN
200
9
62
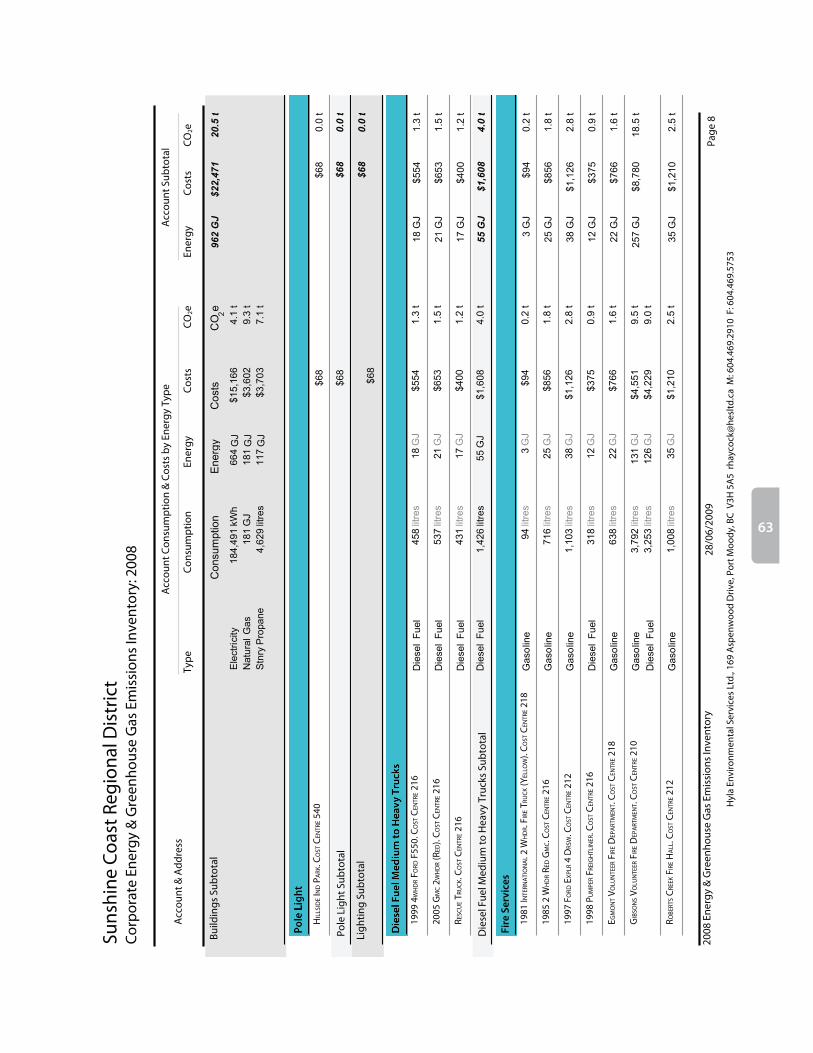
Cor
pora
te E
nerg
y &
Gre
enho
use
Gas
Em
issi
ons
Inve
ntor
y: 2
008
Suns
hine
Coa
st R
egio
nal D
istr
ict
CO
2eC
osts
Ener
gyC
onsu
mpt
ion
Ener
gyC
osts
CO
2eTy
peA
ccou
nt &
Add
ress
Acc
ount
Sub
tota
lA
ccou
nt C
onsu
mpt
ion
& C
osts
by
Ener
gy T
ype
Co
nsu
mptio
nC
O e 2
Co
sts
En
erg
y
4,6
29
96
2 G
J$
22
,47
12
0.5
t
$1
5,1
66
18
4,4
91
kW
hE
lectr
icity
66
4G
J4
.1 t
$3
,60
21
81
GJ
Na
tura
lG
as
18
1G
J9
.3 t
Pro
pa
ne
litre
s1
17
$3
,70
3G
J7
.1 t
Stn
ry
Build
ings
Sub
tota
l
Pole
Lig
ht
$6
8$
68
0.0
tH
ILLS
IDE I
ND
PA
RK. C
OST
CEN
TRE 5
40
Pole
Lig
ht S
ubto
tal
$6
80
.0 t
$6
8
$6
80
.0 t
$6
8Li
ghtin
g Su
btot
al
Die
sel F
uel M
ediu
m to
Hea
vy T
ruck
s
$5
54
18
GJ
$5
54
1.3
t1
.3 t
45
8lit
res
18
GJ
Die
se
lF
ue
l19
99 4
WH
DR
FORD
F55
0. C
OST
CEN
TRE 2
16
$6
53
21
GJ
$6
53
1.5
t1
.5 t
53
7lit
res
21
GJ
Die
se
lF
ue
l20
05 G
MC 2
WH
DR
(RED
). C
OST
CEN
TRE 2
16
$4
00
17
GJ
$4
00
1.2
t1
.2 t
43
1lit
res
17
GJ
Die
se
lF
ue
lR E
SCU
E TRU
CK.
CO
ST C
ENTR
E 216
Die
sel F
uel M
ediu
m to
Hea
vy T
ruck
s Su
btot
al5
5 G
J$
1,6
08
4.0
tD
iese
lF
ue
l$
1,6
08
1,4
26
litre
s5
5G
J4
.0 t
Fire
Ser
vice
s
$9
43
GJ
$9
40
.2 t
0.2
t9
4lit
res
3G
JG
aso
line
1981
I NTE
RNA
TIO
NA
L 2 W
HD
R. FI
RE T
RUC
K (Y
ELLO
W).
CO
ST C
ENTR
E 218
$8
56
25
GJ
$8
56
1.8
t1
.8 t
71
6lit
res
25
GJ
Ga
so
line
1985
2 W
HD
R RE
D G
MC. C
OST
CEN
TRE 2
16
$1
,12
63
8 G
J$
1,1
26
2.8
t2
.8 t
1,1
03
litre
s3
8G
JG
aso
line
1997
FO
RD E
XPL
R 4
DRS
W. C
OST
CEN
TRE 2
12
$3
75
12
GJ
$3
75
0.9
t0
.9 t
31
8lit
res
12
GJ
Die
se
lF
ue
l19
98 P
UM
PER
FREI
GH
TLIN
ER. C
OST
CEN
TRE 2
16
$7
66
22
GJ
$7
66
1.6
t1
.6 t
63
8lit
res
22
GJ
Ga
so
line
E GM
ON
T VO
LUN
TEER
FIR
E DEP
ART
MEN
T. C
OST
CEN
TRE 2
18
$4
,55
1
$4
,22
92
57
GJ
$8
,78
01
8.5
t9
.5 t
9.0
t
3,7
92
litre
s
3,2
53
litre
s
13
1G
J
12
6G
JG
aso
line
Die
se
lF
ue
l
GIB
SON
S VO
LUN
TEER
FIR
E DEP
ART
MEN
T. C
OST
CEN
TRE 2
10
$1
,21
03
5 G
J$
1,2
10
2.5
t2
.5 t
1,0
08
litre
s3
5G
JG
aso
line
R OBE
RTS C
REEK
FIR
E HA
LL. C
OST
CEN
TRE 2
12
28/0
6/20
09Pa
ge 8
2008
Ene
rgy
& G
reen
hous
e G
as E
mis
sion
s In
vent
ory
Hyl
a En
viro
nmen
tal S
ervi
ces
Ltd.
, 169
Asp
enw
ood
Driv
e, P
ort M
oody
, BC
V3H
5A
5 rh
ayco
ck@
hesl
td.c
a M
: 604
.469
.291
0 F
: 604
.469
.575
3
63
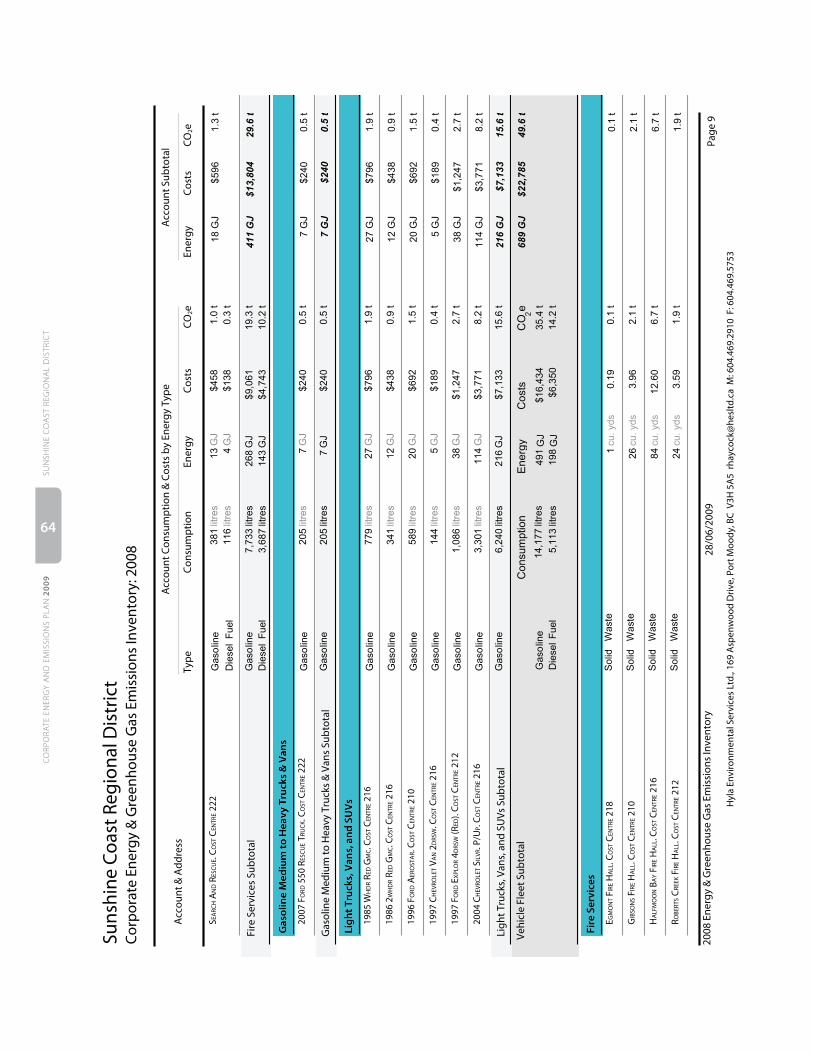
Cor
pora
te E
nerg
y &
Gre
enho
use
Gas
Em
issi
ons
Inve
ntor
y: 2
008
Suns
hine
Coa
st R
egio
nal D
istr
ict
CO
2eC
osts
Ener
gyC
onsu
mpt
ion
Ener
gyC
osts
CO
2eTy
peA
ccou
nt &
Add
ress
Acc
ount
Sub
tota
lA
ccou
nt C
onsu
mpt
ion
& C
osts
by
Ener
gy T
ype $4
58
$1
38
18
GJ
$5
96
1.3
t1
.0 t
0.3
t
38
1lit
res
11
6lit
res
13
GJ
4G
JG
aso
line
Die
se
lF
ue
l
S EA
RCH
AN
D R
ESC
UE.
CO
ST C
ENTR
E 222
Fire
Ser
vice
s Su
btot
al4
11
GJ
$1
3,8
04
29
.6 t
Ga
so
line
$9
,06
17
,73
3lit
res
26
8G
J1
9.3
t
Die
se
lF
ue
l$
4,7
43
3,6
87
litre
s1
43
GJ
10
.2 t
Gas
olin
e M
ediu
m to
Hea
vy T
ruck
s &
Van
s
$2
40
7 G
J$
24
00
.5 t
0.5
t2
05
litre
s7
GJ
Ga
so
line
2007
FO
RD 5
50 R
ESC
UE T
RUC
K. C
OST
CEN
TRE 2
22
Gas
olin
e M
ediu
m to
Hea
vy T
ruck
s &
Van
s Su
btot
al7
GJ
$2
40
0.5
tG
aso
line
$2
40
20
5lit
res
7G
J0
.5 t
Ligh
t Tru
cks,
Van
s, a
nd S
UV
s
$7
96
27
GJ
$7
96
1.9
t1
.9 t
77
9lit
res
27
GJ
Ga
so
line
1985
WH
DR
RED
GM
C. C
OST
CEN
TRE 2
16
$4
38
12
GJ
$4
38
0.9
t0
.9 t
34
1lit
res
12
GJ
Ga
so
line
1986
2W
HD
R RE
D G
MC. C
OST
CEN
TRE 2
16
$6
92
20
GJ
$6
92
1.5
t1
.5 t
58
9lit
res
20
GJ
Ga
so
line
1996
FO
RD A
ERO
STA
R. C
OST
CEN
TRE 2
10
$1
89
5 G
J$
18
90
.4 t
0.4
t1
44
litre
s5
GJ
Ga
so
line
1997
CH
EVRO
LET V
AN
2D
RSW
. CO
ST C
ENTR
E 216
$1
,24
73
8 G
J$
1,2
47
2.7
t2
.7 t
1,0
86
litre
s3
8G
JG
aso
line
1997
FO
RD E
XPL
OR
4DRS
W (R
ED).
CO
ST C
ENTR
E 212
$3
,77
11
14
GJ
$3
,77
18
.2 t
8.2
t3
,30
1lit
res
11
4G
JG
aso
line
2004
CH
EVRO
LET S
ILVR
. P/U
P. C
OST
CEN
TRE 2
16
Ligh
t Tru
cks,
Van
s, a
nd S
UVs
Sub
tota
l2
16
GJ
$7
,13
31
5.6
tG
aso
line
$7
,13
36
,24
0lit
res
21
6G
J1
5.6
t
Co
nsu
mptio
nC
O e 2
Co
sts
En
erg
y6
89
GJ
$2
2,7
85
49
.6 t
Ga
so
line
$1
6,4
34
14
,17
7lit
res
49
1G
J3
5.4
t
Die
se
lF
ue
l$
6,3
50
5,1
13
litre
s1
98
GJ
14
.2 t
Vehi
cle
Flee
t Sub
tota
l
Fire
Ser
vice
s
0.1
t0
.19
0.1
t1
cu
. yd
sS
olid
Wa
ste
EGM
ON
T FIR
E HA
LL. C
OST
CEN
TRE 2
18
2.1
t3
.96
2.1
t2
6cu
. yd
sS
olid
Wa
ste
GIB
SON
S FIR
E HA
LL. C
OST
CEN
TRE 2
10
6.7
t1
2.6
06
.7 t
84
cu
. yd
sS
olid
Wa
ste
HA
LFM
OO
N B
AY
FIRE
HA
LL. C
OST
CEN
TRE 2
16
1.9
t3
.59
1.9
t2
4cu
. yd
sS
olid
Wa
ste
ROBE
RTS C
REEK
FIR
E HA
LL. C
OST
CEN
TRE 2
12
28/0
6/20
09Pa
ge 9
2008
Ene
rgy
& G
reen
hous
e G
as E
mis
sion
s In
vent
ory
Hyl
a En
viro
nmen
tal S
ervi
ces
Ltd.
, 169
Asp
enw
ood
Driv
e, P
ort M
oody
, BC
V3H
5A
5 rh
ayco
ck@
hesl
td.c
a M
: 604
.469
.291
0 F
: 604
.469
.575
3
SUN
SHIN
E C
OA
ST R
EGIO
NA
L D
ISTR
ICT
CO
RPO
RATE
EN
ERG
Y A
ND
EM
ISSI
ON
S PL
AN
200
9
64
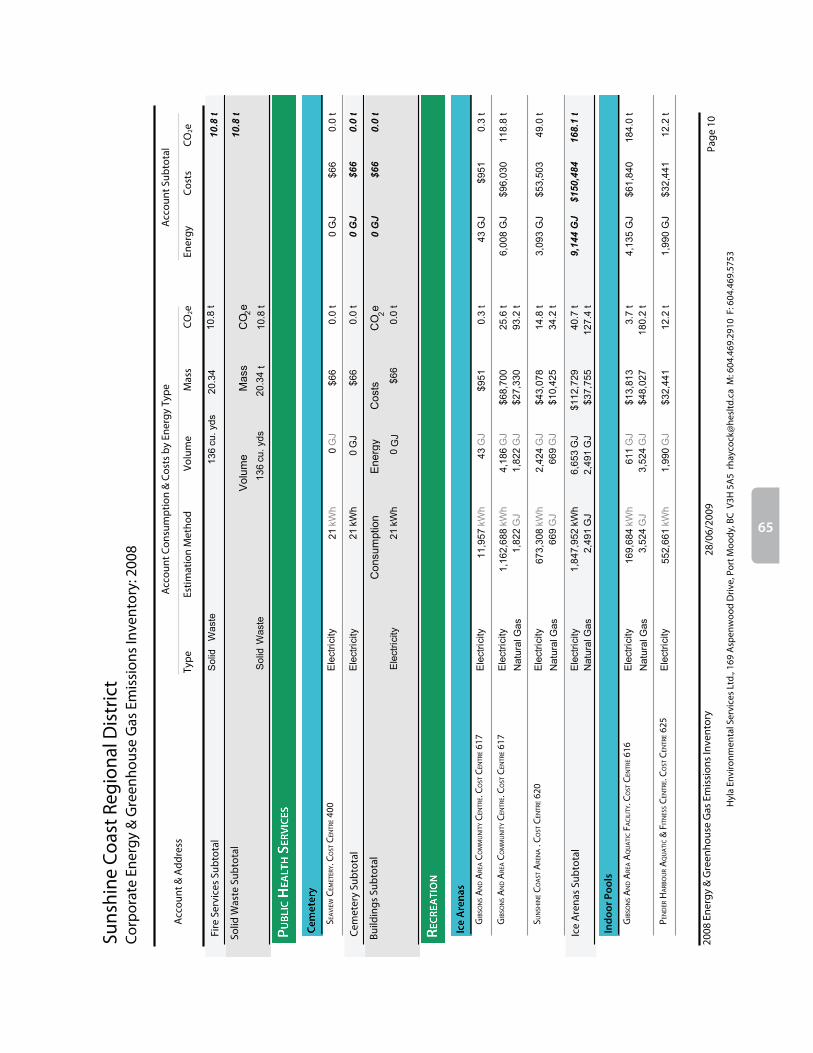
Cor
pora
te E
nerg
y &
Gre
enho
use
Gas
Em
issi
ons
Inve
ntor
y: 2
008
Suns
hine
Coa
st R
egio
nal D
istr
ict
CO
2eC
osts
Ener
gyEs
timat
ion
Met
hod
Volu
me
Mas
sC
O2e
Type
Acc
ount
& A
ddre
ssA
ccou
nt S
ubto
tal
Acc
ount
Con
sum
ptio
n &
Cos
ts b
y En
ergy
Typ
e
Fire
Ser
vice
s Su
btot
al1
0.8
tS
olid
Wa
ste
13
6cu
. yd
s2
0.3
41
0.8
t
Ma
ss
Vo
lum
e1
0.8
t
So
lidW
aste
13
6cu
. yd
s2
0.3
4t
10
.8 t
Solid
Was
te S
ubto
tal
CO
e 2
PUB
LIC
HEA
LTH
SER
VIC
ES
Cem
eter
y
$6
60
GJ
$6
60
.0 t
0.0
t2
1kW
h0
GJ
Ele
ctr
icity
S EA
VIEW
CEM
ETER
Y. C
OST
CEN
TRE 4
00
Cem
eter
y Su
btot
al0
GJ
$6
60
.0 t
$6
62
1kW
hE
lectr
icity
0G
J0
.0 t
Co
nsu
mptio
nC
O e 2
Co
sts
En
erg
y0
GJ
$6
60
.0 t
$6
62
1kW
hE
lectr
icity
0G
J0
.0 t
Build
ings
Sub
tota
l
REC
REA
TIO
N
Ice
Are
nas
$9
51
43
GJ
$9
51
0.3
t0
.3 t
11
,95
7kW
h4
3G
JE
lectr
icity
GIB
SON
S AN
D A
REA C
OM
MU
NIT
Y C
ENTR
E. C
OST
CEN
TRE 6
17
$6
8,7
00
$2
7,3
30
6,0
08
GJ
$9
6,0
30
11
8.8
t2
5.6
t
93
.2 t
1,1
62
,68
8kW
h
1,8
22
GJ
4,1
86
GJ
1,8
22
GJ
Na
tura
lGa
s
Ele
ctr
icity
GIB
SON
S AN
D A
REA C
OM
MU
NIT
Y C
ENTR
E. C
OST
CEN
TRE 6
17
$4
3,0
78
$1
0,4
25
3,0
93
GJ
$5
3,5
03
49
.0 t
14
.8 t
34
.2 t
67
3,3
08
kW
h
66
9G
J
2,4
24
GJ
66
9G
JN
atu
ralG
as
Ele
ctr
icity
S UN
SHIN
E CO
AST
ARE
NA .
CO
ST C
ENTR
E 620
Ice
Are
nas
Subt
otal
9,1
44
GJ
$1
50
,48
41
68
.1 t
$1
12
,72
91
,84
7,9
52
kW
hE
lectr
icity
6,6
53
GJ
40
.7 t
$3
7,7
55
2,4
91
GJ
Na
tura
lGa
s2
,49
1G
J1
27
.4 t
Ind
oor P
ools
$1
3,8
13
$4
8,0
27
4,1
35
GJ
$6
1,8
40
18
4.0
t3
.7 t
18
0.2
t
16
9,6
84
kW
h
3,5
24
GJ
61
1G
J
3,5
24
GJ
Na
tura
lGa
s
Ele
ctr
icity
GIB
SON
S AN
D A
REA A
QU
ATI
C F
AC
ILIT
Y. C
OST
CEN
TRE 6
16
$3
2,4
41
1,9
90
GJ
$3
2,4
41
12
.2 t
12
.2 t
55
2,6
61
kW
h1
,99
0G
JE
lectr
icity
P EN
DER
HA
RBO
UR
AQ
UA
TIC &
FIT
NES
S CEN
TRE.
CO
ST C
ENTR
E 625
28/0
6/20
09Pa
ge 1
020
08 E
nerg
y &
Gre
enho
use
Gas
Em
issi
ons
Inve
ntor
y
Hyl
a En
viro
nmen
tal S
ervi
ces
Ltd.
, 169
Asp
enw
ood
Driv
e, P
ort M
oody
, BC
V3H
5A
5 rh
ayco
ck@
hesl
td.c
a M
: 604
.469
.291
0 F
: 604
.469
.575
3
65
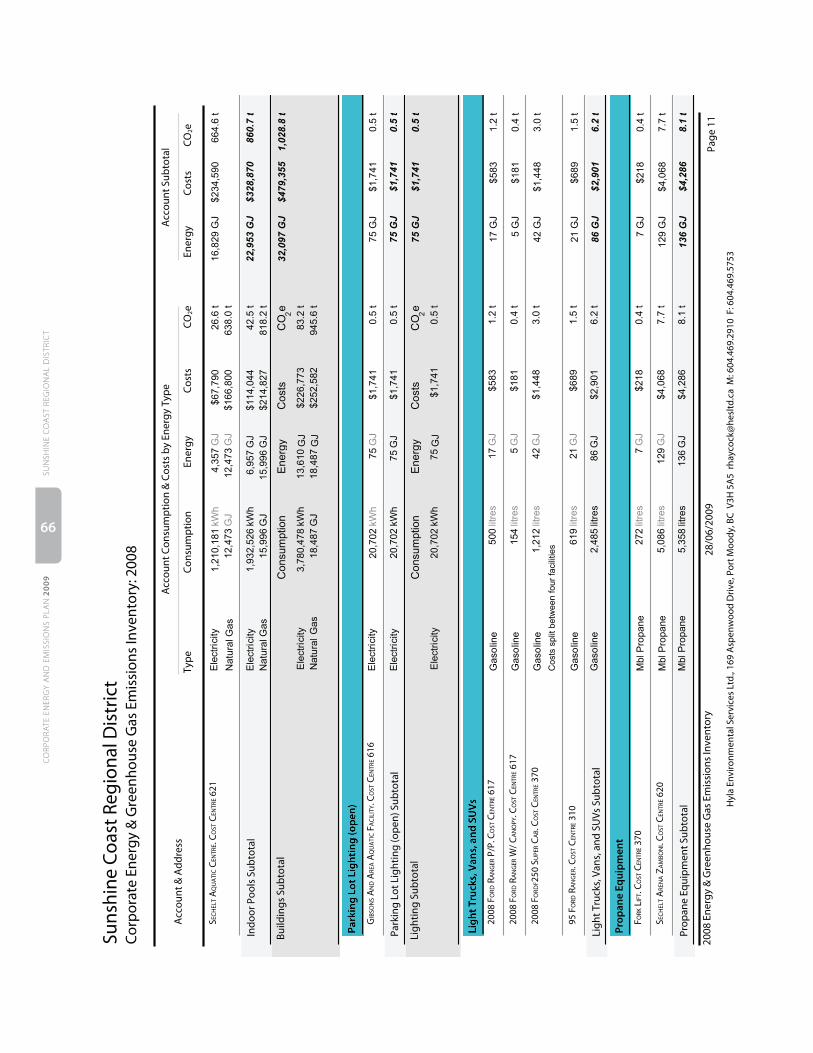
Cor
pora
te E
nerg
y &
Gre
enho
use
Gas
Em
issi
ons
Inve
ntor
y: 2
008
Suns
hine
Coa
st R
egio
nal D
istr
ict
CO
2eC
osts
Ener
gyC
onsu
mpt
ion
Ener
gyC
osts
CO
2eTy
peA
ccou
nt &
Add
ress
Acc
ount
Sub
tota
lA
ccou
nt C
onsu
mpt
ion
& C
osts
by
Ener
gy T
ype
$6
7,7
90
$1
66
,80
0
16
,82
9 G
J$
23
4,5
90
66
4.6
t2
6.6
t
63
8.0
t
1,2
10
,18
1kW
h
12
,47
3G
J
4,3
57
GJ
12
,47
3G
JN
atu
ralG
as
Ele
ctr
icity
S EC
HEL
T AQ
UA
TIC C
ENTR
E. C
OST
CEN
TRE 6
21
Indo
or P
ools
Sub
tota
l2
2,9
53
GJ
$3
28
,87
08
60
.7 t
$1
14
,04
41
,93
2,5
26
kW
hE
lectr
icity
6,9
57
GJ
42
.5 t
$2
14
,82
71
5,9
96
GJ
Na
tura
lGa
s1
5,9
96
GJ
81
8.2
t
Co
nsu
mptio
nC
O e 2
Co
sts
En
erg
y3
2,0
97
GJ
$4
79
,35
51
,02
8.8
t
$2
26
,77
33
,78
0,4
78
kW
hE
lectr
icity
13
,61
0G
J8
3.2
t
$2
52
,58
21
8,4
87
GJ
Na
tura
lG
as
18
,48
7G
J9
45
.6 t
Build
ings
Sub
tota
l
Park
ing
Lot L
ight
ing
(op
en)
$1
,74
17
5 G
J$
1,7
41
0.5
t0
.5 t
20
,70
2kW
h7
5G
JE
lectr
icity
GIB
SON
S AN
D A
REA A
QU
ATI
C F
AC
ILIT
Y. C
OST
CEN
TRE 6
16
Park
ing
Lot L
ight
ing
(ope
n) S
ubto
tal
75
GJ
$1
,74
10
.5 t
$1
,74
12
0,7
02
kW
hE
lectr
icity
75
GJ
0.5
t
Co
nsu
mptio
nC
O e 2
Co
sts
En
erg
y7
5 G
J$
1,7
41
0.5
t
$1
,74
12
0,7
02
kW
hE
lectr
icity
75
GJ
0.5
t
Ligh
ting
Subt
otal
Ligh
t Tru
cks,
Van
s, a
nd S
UV
s
$5
83
17
GJ
$5
83
1.2
t1
.2 t
50
0lit
res
17
GJ
Ga
so
line
2008
FO
RD R
AN
GER
P/P
. CO
ST C
ENTR
E 617
$1
81
5 G
J$
18
10
.4 t
0.4
t1
54
litre
s5
GJ
Ga
so
line
2008
FO
RD R
AN
GER
W/ C
AN
OPY
. CO
ST C
ENTR
E 617
$1
,44
84
2 G
J$
1,4
48
3.0
t3
.0 t
Co
sts
sp
lit b
etw
ee
n f
ou
r fa
cili
tie
s1,2
12
litre
s4
2G
JG
aso
line
2008
FO
RDF2
50 S
UPE
R C
AB.
CO
ST C
ENTR
E 370
$6
89
21
GJ
$6
89
1.5
t1
.5 t
61
9lit
res
21
GJ
Ga
so
line
95 F
ORD
RA
NG
ER. C
OST
CEN
TRE 3
10
Ligh
t Tru
cks,
Van
s, a
nd S
UVs
Sub
tota
l8
6 G
J$
2,9
01
6.2
tG
aso
line
$2
,90
12
,48
5lit
res
86
GJ
6.2
t
Prop
ane
Equi
pm
ent
7 G
J$
21
80
.4 t
0.4
t2
72
litre
s$
21
87
GJ
Pro
pa
ne
Mb
lF O
RK L
IFT.
CO
ST C
ENTR
E 370
12
9 G
J$
4,0
68
7.7
t7
.7 t
5,0
86
litre
s$
4,0
68
12
9G
JP
rop
an
eM
bl
S EC
HEL
T ARE
NA Z
AM
BON
I. C
OST
CEN
TRE 6
20
Prop
ane
Equi
pmen
t Sub
tota
l1
36
GJ
$4
,28
68
.1 t
5,3
58
litre
s1
36
$4
,28
6G
J8
.1 t
Pro
pa
ne
Mb
l
28/0
6/20
09Pa
ge 1
120
08 E
nerg
y &
Gre
enho
use
Gas
Em
issi
ons
Inve
ntor
y
Hyl
a En
viro
nmen
tal S
ervi
ces
Ltd.
, 169
Asp
enw
ood
Driv
e, P
ort M
oody
, BC
V3H
5A
5 rh
ayco
ck@
hesl
td.c
a M
: 604
.469
.291
0 F
: 604
.469
.575
3
SUN
SHIN
E C
OA
ST R
EGIO
NA
L D
ISTR
ICT
CO
RPO
RATE
EN
ERG
Y A
ND
EM
ISSI
ON
S PL
AN
200
9
66

Cor
pora
te E
nerg
y &
Gre
enho
use
Gas
Em
issi
ons
Inve
ntor
y: 2
008
Suns
hine
Coa
st R
egio
nal D
istr
ict
CO
2eC
osts
Ener
gyC
onsu
mpt
ion
Ener
gyC
osts
CO
2eTy
peA
ccou
nt &
Add
ress
Acc
ount
Sub
tota
lA
ccou
nt C
onsu
mpt
ion
& C
osts
by
Ener
gy T
ype
Co
nsu
mptio
nC
O e 2
Co
sts
En
erg
y2
22
GJ
$7
,18
71
4.4
t
Ga
so
line
$2
,90
12
,48
5lit
res
86
GJ
6.2
t
Pro
pa
ne
5,3
58
litre
s1
36
$4
,28
6G
J8
.1 t
Mb
l
Vehi
cle
Flee
t Sub
tota
l
Com
mun
ity
Cen
tre
5.7
t1
0.7
65
.7 t
72
cu
. yd
sS
olid
Wa
ste
GIB
SON
S AN
D A
REA C
OM
MU
NIT
Y C
ENTR
E - C
ARD
BOA
RD R
ECYC
LIN
G. C
OST
C61
7C
omm
unity
Cen
tre
Subt
otal
5.7
tS
olid
Wa
ste
72
cu
. yd
s1
0.7
65
.7 t
Ice
Are
nas
13
.4 t
25
.20
13
.4 t
16
8cu
. yd
sS
olid
Wa
ste
SEC
HEL
T ARE
NA. C
OST
CEN
TRE 6
20
Ice
Are
nas
Subt
otal
13
.4 t
So
lidW
aste
16
8cu
. yd
s2
5.2
01
3.4
t
Ind
oor P
ools
8.9
t1
6.8
08
.9 t
11
2cu
. yd
sS
olid
Wa
ste
GIB
SON
S AN
D A
REA A
QU
ATI
C F
AC
ILIT
Y. C
OST
CEN
TRE 6
16
4.4
t8
.39
4.4
t5
6cu
. yd
sS
olid
Wa
ste
PEN
DER
HA
RBO
UR
AQ
UA
TIC A
ND
FIT
NES
S CEN
TRE.
CO
ST C
ENTR
E 625
26
.7 t
50
.40
26
.7 t
33
6cu
. yd
sS
olid
Wa
ste
SEC
HEL
T AQ
UA
TIC C
ENTR
E . C
OST
CEN
TRE 6
21
Indo
or P
ools
Sub
tota
l4
0.1
tS
olid
Wa
ste
50
4cu
. yd
s7
5.6
04
0.1
t
Ma
ss
Vo
lum
e5
9.1
t
So
lidW
aste
74
4cu
. yd
s1
11
.56
t5
9.1
t
Solid
Was
te S
ubto
tal
CO
e 2
SOLI
D W
AST
E
Mis
c.
$5
07
20
GJ
$5
07
0.1
t0
.1 t
5,5
16
kW
h2
0G
JE
lectr
icity
P EN
DER
HA
RBO
UR
LAN
DFI
LL O
FFIC
E AN
D S
CA
LE. C
OST
CEN
TRE 3
51
$2
44
8 G
J$
24
40
.0 t
0.0
t2
,23
3kW
h8
GJ
Ele
ctr
icity
P EN
DER
HA
RBO
UR
LAN
DFI
LL S
HA
RE S
HED
. CO
ST C
ENTR
E 351
11
7 G
J$
3,6
87
7.1
t$
3,6
87
7.1
t4
,60
9lit
res
11
7G
JP
rop
an
eS E
CH
ELT L
AN
DFI
LL. C
OST
CEN
TRE 3
52
28/0
6/20
09Pa
ge 1
220
08 E
nerg
y &
Gre
enho
use
Gas
Em
issi
ons
Inve
ntor
y
Hyl
a En
viro
nmen
tal S
ervi
ces
Ltd.
, 169
Asp
enw
ood
Driv
e, P
ort M
oody
, BC
V3H
5A
5 rh
ayco
ck@
hesl
td.c
a M
: 604
.469
.291
0 F
: 604
.469
.575
3
67

Cor
pora
te E
nerg
y &
Gre
enho
use
Gas
Em
issi
ons
Inve
ntor
y: 2
008
Suns
hine
Coa
st R
egio
nal D
istr
ict
CO
2eC
osts
Ener
gyC
onsu
mpt
ion
Ener
gyC
osts
CO
2eTy
peA
ccou
nt &
Add
ress
Acc
ount
Sub
tota
lA
ccou
nt C
onsu
mpt
ion
& C
osts
by
Ener
gy T
ype
Mis
c. S
ubto
tal
14
5 G
J$
4,4
38
7.3
t$
75
17
,74
9kW
hE
lectr
icity
28
GJ
0.2
t
Pro
pa
ne
4,6
09
litre
s1
17
$3
,68
7G
J7
.1 t
Co
nsu
mptio
nC
O e 2
Co
sts
En
erg
y
4,6
09
14
5 G
J$
4,4
38
7.3
t
$7
51
7,7
49
kW
hE
lectr
icity
28
GJ
0.2
t
Pro
pa
ne
litre
s1
17
$3
,68
7G
J7
.1 t
Stn
ry
Build
ings
Sub
tota
l
Die
sel F
uel M
ediu
m to
Hea
vy T
ruck
s
$1
,04
23
5 G
J$
1,0
42
2.5
t2
.5 t
90
7lit
res
35
GJ
Die
se
lF
ue
l19
96 I N
TERN
ATI
ON
AL 2
WH
DR.
CO
ST C
ENTR
E 353
$2
8,6
86
92
7 G
J$
28
,68
66
6.6
t6
6.6
t2
3,9
68
litre
s9
27
GJ
Die
se
lF
ue
l20
06 I N
TERN
ATI
ON
AL R
ECYC
LIN
G. C
OST
CEN
TRE 3
53
Die
sel F
uel M
ediu
m to
Hea
vy T
ruck
s Su
btot
al9
62
GJ
$2
9,7
28
69
.1 t
Die
se
lF
ue
l$
29
,72
82
4,8
75
litre
s9
62
GJ
69
.1 t
Ligh
t Tru
cks,
Van
s, a
nd S
UV
s
$6
83
GJ
$6
80
.2 t
0.2
t7
3lit
res
3G
JG
aso
line
1995
CH
EV S
-10.
CO
ST C
ENTR
E 351
$1
,94
75
9 G
J$
1,9
47
4.2
t4
.2 t
1,6
94
litre
s5
9G
JG
aso
line
2005
CH
EVRO
LET C
OLO
RAD
O (W
HIT
E). C
OST
CEN
TRE 3
52
Ligh
t Tru
cks,
Van
s, a
nd S
UVs
Sub
tota
l6
1 G
J$
2,0
15
4.4
tG
aso
line
$2
,01
51
,76
7lit
res
61
GJ
4.4
t
Co
nsu
mptio
nC
O e 2
Co
sts
En
erg
y1
,02
3 G
J$
31
,74
37
3.6
t
Ga
so
line
$2
,01
51
,76
7lit
res
61
GJ
4.4
t
Die
se
lF
ue
l$
29
,72
82
4,8
75
litre
s9
62
GJ
69
.1 t
Vehi
cle
Flee
t Sub
tota
l
TRA
NSP
ORT
ATI
ON
SER
VIC
ES
Pub
lic W
orks
Bld
gs &
Yar
ds
$1
4,1
35
$9
,81
0
1,1
59
GJ
$2
3,9
45
31
.1 t
3.8
t
27
.2 t
17
3,9
51
kW
h
53
2G
J
62
6G
J
53
2G
JN
atu
ralG
as
Ele
ctr
icity
TRA
NSI
T BU
ILD
ING
AN
D W
ORK
S YA
RD. C
OST
CEN
TRE 3
10, 3
12
Publ
ic W
orks
Bld
gs &
Yar
ds S
ubto
tal
1,1
59
GJ
$2
3,9
45
31
.1 t
$1
4,1
35
17
3,9
51
kW
hE
lectr
icity
62
6G
J3
.8 t
$9
,81
05
32
GJ
Na
tura
lGa
s5
32
GJ
27
.2 t
28/0
6/20
09Pa
ge 1
320
08 E
nerg
y &
Gre
enho
use
Gas
Em
issi
ons
Inve
ntor
y
Hyl
a En
viro
nmen
tal S
ervi
ces
Ltd.
, 169
Asp
enw
ood
Driv
e, P
ort M
oody
, BC
V3H
5A
5 rh
ayco
ck@
hesl
td.c
a M
: 604
.469
.291
0 F
: 604
.469
.575
3
SUN
SHIN
E C
OA
ST R
EGIO
NA
L D
ISTR
ICT
CO
RPO
RATE
EN
ERG
Y A
ND
EM
ISSI
ON
S PL
AN
200
9
68

Cor
pora
te E
nerg
y &
Gre
enho
use
Gas
Em
issi
ons
Inve
ntor
y: 2
008
Suns
hine
Coa
st R
egio
nal D
istr
ict
CO
2eC
osts
Ener
gyC
onsu
mpt
ion
Ener
gyC
osts
CO
2eTy
peA
ccou
nt &
Add
ress
Acc
ount
Sub
tota
lA
ccou
nt C
onsu
mpt
ion
& C
osts
by
Ener
gy T
ype
Co
nsu
mptio
nC
O e 2
Co
sts
En
erg
y1
,15
9 G
J$
23
,94
53
1.1
t
$1
4,1
35
17
3,9
51
kW
hE
lectr
icity
62
6G
J3
.8 t
$9
,81
05
32
GJ
Na
tura
lG
as
53
2G
J2
7.2
t
Build
ings
Sub
tota
l
Doc
k Li
ght
$1
29
3 G
J$
12
90
.0 t
0.0
t8
37
kW
h3
GJ
Ele
ctr
icity
HA
LFM
OO
N B
AY
PORT
. CO
ST C
ENTR
E 345
$1
78
5 G
J$
17
80
.0 t
0.0
t1
,43
2kW
h5
GJ
Ele
ctr
icity
HO
PKIN
S LA
ND
ING
PO
RT. C
OST
CEN
TRE 3
45
$3
09
11
GJ
$3
09
0.1
t0
.1 t
3,0
38
kW
h1
1G
JE
lectr
icity
K EA
TS R
OA
D. C
OST
CEN
TRE 3
45
Doc
k Li
ght S
ubto
tal
19
GJ
$6
16
0.1
t$
61
65
,30
7kW
hE
lectr
icity
19
GJ
0.1
t
Ove
rhea
d L
ight
ing
$1
41
3 G
J$
14
10
.0 t
0.0
t6
97
kW
h3
GJ
Ele
ctr
icity
AU
STIN
RO
AD
STR
EETL
IGH
TIN
G. C
OST
CEN
TRE 3
20
$1
50
1 G
J$
15
00
.0 t
0.0
t3
98
kW
h1
GJ
Ele
ctr
icity
B URN
S RO
AD
STR
EETL
IGH
TIN
G. C
OST
CEN
TRE 3
40
$3
01
3 G
J$
30
10
.0 t
0.0
t8
02
kW
h3
GJ
Ele
ctr
icity
F IRC
REST
RO
AD
STR
EETL
IGH
TIN
G. C
OST
CEN
TRE 3
32
$1
41
3 G
J$
14
10
.0 t
0.0
t6
97
kW
h3
GJ
Ele
ctr
icity
GA
MBI
ER S
TREE
TLIG
HTI
NG
. CO
ST C
ENTR
E 320
$1
,50
31
4 G
J$
1,5
03
0.1
t0
.1 t
4,0
10
kW
h1
4G
JE
lectr
icity
GRA
NTH
AM
S LA
ND
ING
STR
EETL
IGH
TIN
G .
CO
ST C
ENTR
E 324
$1
50
1 G
J$
15
00
.0 t
0.0
t3
98
kW
h1
GJ
Ele
ctr
icity
HYD
AW
AY
ROA
D S
TREE
TLIG
HTI
NG
. CO
ST C
ENTR
E 334
$1
,50
31
4 G
J$
1,5
03
0.1
t0
.1 t
4,0
10
kW
h1
4G
JE
lectr
icity
L AN
GD
ALE
STR
EET L
IGH
TIN
G. C
OST
CEN
TRE 3
20
$5
,19
96
1 G
J$
5,1
99
0.4
t0
.4 t
16
,84
2kW
h6
1G
JE
lectr
icity
L AN
GD
ALE
STR
EET S
TREE
TLIG
HTI
NG
. CO
ST C
ENTR
E 322
$3
,40
93
9 G
J$
3,4
09
0.2
t0
.2 t
10
,82
4kW
h3
9G
JE
lectr
icity
P RA
TT R
OA
D S
TREE
TLIG
HTI
NG
. CO
ST C
ENTR
E 320
$5
,12
05
6 G
J$
5,1
20
0.3
t0
.3 t
15
,63
6kW
h5
6G
JE
lectr
icity
S EC
HEL
T [A
] STR
EETL
IGH
TIN
G. C
OST
CEN
TRE 3
20
$3
,61
74
2 G
J$
3,6
17
0.3
t0
.3 t
11
,62
6kW
h4
2G
JE
lectr
icity
S EC
HEL
T [B]
STR
EET L
IGH
TIN
G. C
OST
CEN
TRE 3
20
$1
50
1 G
J$
15
00
.0 t
0.0
t3
98
kW
h1
GJ
Ele
ctr
icity
S PRU
CE R
OA
D S
TREE
TLIG
HTI
NG
. CO
ST C
ENTR
E 328
$3
01
3 G
J$
30
10
.0 t
0.0
t8
02
kW
h3
GJ
Ele
ctr
icity
S TEW
ART
RO
AD
STR
EETL
IGH
TIN
G. C
OST
CEN
TRE 3
42
28/0
6/20
09Pa
ge 1
420
08 E
nerg
y &
Gre
enho
use
Gas
Em
issi
ons
Inve
ntor
y
Hyl
a En
viro
nmen
tal S
ervi
ces
Ltd.
, 169
Asp
enw
ood
Driv
e, P
ort M
oody
, BC
V3H
5A
5 rh
ayco
ck@
hesl
td.c
a M
: 604
.469
.291
0 F
: 604
.469
.575
3
69
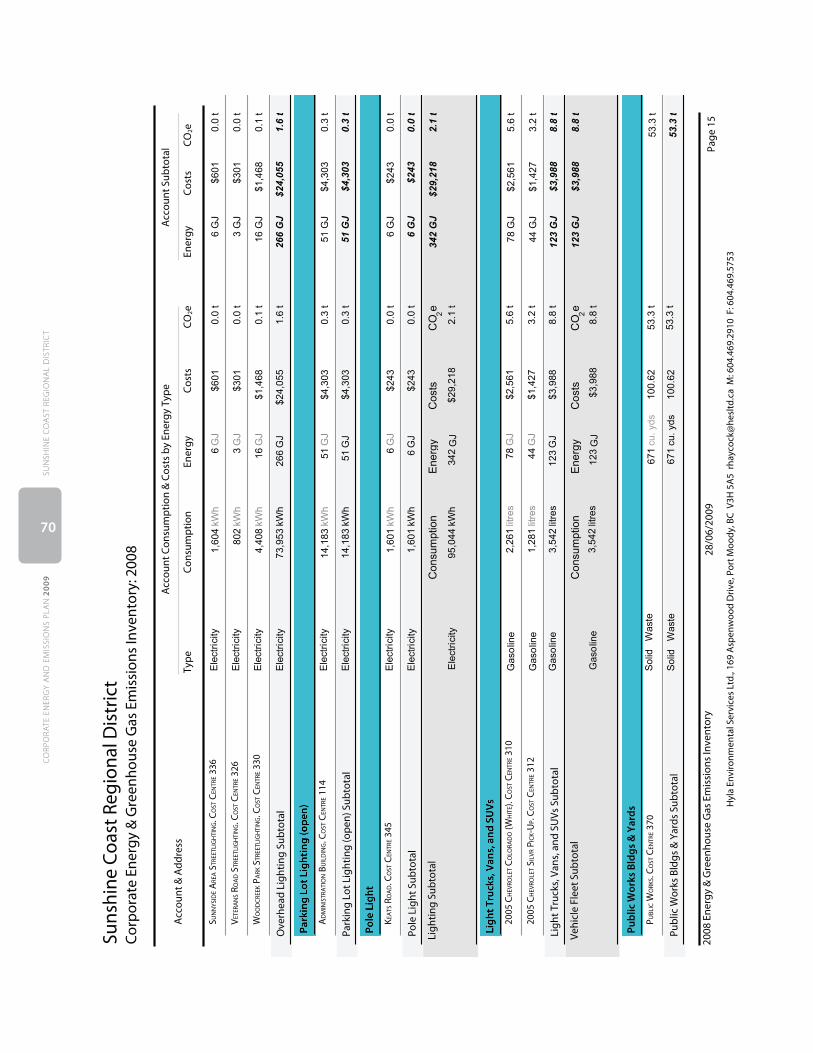
Cor
pora
te E
nerg
y &
Gre
enho
use
Gas
Em
issi
ons
Inve
ntor
y: 2
008
Suns
hine
Coa
st R
egio
nal D
istr
ict
CO
2eC
osts
Ener
gyC
onsu
mpt
ion
Ener
gyC
osts
CO
2eTy
peA
ccou
nt &
Add
ress
Acc
ount
Sub
tota
lA
ccou
nt C
onsu
mpt
ion
& C
osts
by
Ener
gy T
ype $6
01
6 G
J$
60
10
.0 t
0.0
t1
,60
4kW
h6
GJ
Ele
ctr
icity
S UN
NYS
IDE A
REA S
TREE
TLIG
HTI
NG
. CO
ST C
ENTR
E 336
$3
01
3 G
J$
30
10
.0 t
0.0
t8
02
kW
h3
GJ
Ele
ctr
icity
V ETE
RAN
S RO
AD
STR
EETL
IGH
TIN
G. C
OST
CEN
TRE 3
26
$1
,46
81
6 G
J$
1,4
68
0.1
t0
.1 t
4,4
08
kW
h1
6G
JE
lectr
icity
WO
OD
CRE
EK P
ARK
STR
EETL
IGH
TIN
G. C
OST
CEN
TRE 3
30
Ove
rhea
d Li
ghtin
g Su
btot
al2
66
GJ
$2
4,0
55
1.6
t$
24
,05
57
3,9
53
kW
hE
lectr
icity
26
6G
J1
.6 t
Park
ing
Lot L
ight
ing
(op
en)
$4
,30
35
1 G
J$
4,3
03
0.3
t0
.3 t
14
,18
3kW
h5
1G
JE
lectr
icity
AD
MIN
ISTR
ATI
ON
BU
ILD
ING
. CO
ST C
ENTR
E 114
Park
ing
Lot L
ight
ing
(ope
n) S
ubto
tal
51
GJ
$4
,30
30
.3 t
$4
,30
31
4,1
83
kW
hE
lectr
icity
51
GJ
0.3
t
Pole
Lig
ht
$2
43
6 G
J$
24
30
.0 t
0.0
t1
,60
1kW
h6
GJ
Ele
ctr
icity
K EA
TS R
OA
D. C
OST
CEN
TRE 3
45
Pole
Lig
ht S
ubto
tal
6 G
J$
24
30
.0 t
$2
43
1,6
01
kW
hE
lectr
icity
6G
J0
.0 t
Co
nsu
mptio
nC
O e 2
Co
sts
En
erg
y3
42
GJ
$2
9,2
18
2.1
t
$2
9,2
18
95
,04
4kW
hE
lectr
icity
34
2G
J2
.1 t
Ligh
ting
Subt
otal
Ligh
t Tru
cks,
Van
s, a
nd S
UV
s
$2
,56
17
8 G
J$
2,5
61
5.6
t5
.6 t
2,2
61
litre
s7
8G
JG
aso
line
2005
CH
EVRO
LET C
OLO
RAD
O (W
HIT
E). C
OST
CEN
TRE 3
10
$1
,42
74
4 G
J$
1,4
27
3.2
t3
.2 t
1,2
81
litre
s4
4G
JG
aso
line
2005
CH
EVRO
LET S
ILVR
PIC
K-U
P. C
OST
CEN
TRE 3
12
Ligh
t Tru
cks,
Van
s, a
nd S
UVs
Sub
tota
l1
23
GJ
$3
,98
88
.8 t
Ga
so
line
$3
,98
83
,54
2lit
res
12
3G
J8
.8 t
Co
nsu
mptio
nC
O e 2
Co
sts
En
erg
y1
23
GJ
$3
,98
88
.8 t
Ga
so
line
$3
,98
83
,54
2lit
res
12
3G
J8
.8 t
Vehi
cle
Flee
t Sub
tota
l
Pub
lic W
orks
Bld
gs &
Yar
ds
53
.3 t
10
0.6
25
3.3
t6
71
cu
. yd
sS
olid
Wa
ste
PUBL
IC W
ORK
S. C
OST
CEN
TRE 3
70
Publ
ic W
orks
Bld
gs &
Yar
ds S
ubto
tal
53
.3 t
So
lidW
aste
67
1cu
. yd
s1
00
.62
53
.3 t
28/0
6/20
09Pa
ge 1
520
08 E
nerg
y &
Gre
enho
use
Gas
Em
issi
ons
Inve
ntor
y
Hyl
a En
viro
nmen
tal S
ervi
ces
Ltd.
, 169
Asp
enw
ood
Driv
e, P
ort M
oody
, BC
V3H
5A
5 rh
ayco
ck@
hesl
td.c
a M
: 604
.469
.291
0 F
: 604
.469
.575
3
SUN
SHIN
E C
OA
ST R
EGIO
NA
L D
ISTR
ICT
CO
RPO
RATE
EN
ERG
Y A
ND
EM
ISSI
ON
S PL
AN
200
9
70

Cor
pora
te E
nerg
y &
Gre
enho
use
Gas
Em
issi
ons
Inve
ntor
y: 2
008
Suns
hine
Coa
st R
egio
nal D
istr
ict
CO
2eC
osts
Ener
gyEs
timat
ion
Met
hod
Volu
me
Mas
sC
O2e
Type
Acc
ount
& A
ddre
ssA
ccou
nt S
ubto
tal
Acc
ount
Con
sum
ptio
n &
Cos
ts b
y En
ergy
Typ
e Ma
ss
Vo
lum
e5
3.3
t
So
lidW
aste
67
1cu
. yd
s1
00
.62
t5
3.3
t
Solid
Was
te S
ubto
tal
CO
e 2
WA
TER/
WA
STEW
ATE
R
Pub
lic W
orks
Bld
gs &
Yar
ds
$6
28
25
GJ
$6
28
0.2
t0
.2 t
7,0
33
kW
h2
5G
JE
lectr
icity
P UBL
IC W
ORK
S. C
OST
CEN
TRE 3
70
Publ
ic W
orks
Bld
gs &
Yar
ds S
ubto
tal
25
GJ
$6
28
0.2
t$
62
87
,03
3kW
hE
lectr
icity
25
GJ
0.2
t
Co
nsu
mptio
nC
O e 2
Co
sts
En
erg
y2
5 G
J$
62
80
.2 t
$6
28
7,0
33
kW
hE
lectr
icity
25
GJ
0.2
t
Build
ings
Sub
tota
l
Boo
ster
Pum
p S
tati
on
$1
5,4
56
73
1 G
J$
15
,45
64
.5 t
4.5
t2
03
,10
0kW
h7
31
GJ
Ele
ctr
icity
CH
APM
AN
CRE
EK P
UM
P STA
TIO
N. C
OST
CEN
TRE 3
79
Boos
ter P
ump
Stat
ion
Subt
otal
73
1 G
J$
15
,45
64
.5 t
$1
5,4
56
20
3,1
00
kW
hE
lectr
icity
73
1G
J4
.5 t
Chl
orin
atio
n St
atio
n
$1
52
4 G
J$
15
20
.0 t
0.0
t1
,09
9kW
h4
GJ
Ele
ctr
icity
GRA
Y C
REEK
CH
LORI
NA
TIO
N S
TATI
ON
. CO
ST C
ENTR
E 375
Chl
orin
atio
n St
atio
n Su
btot
al4
GJ
$1
52
0.0
t$
15
21
,09
9kW
hE
lectr
icity
4G
J0
.0 t
Liq
uid
Was
te L
ift S
tati
on
$1
41
4 G
J$
14
10
.0 t
0.0
t9
81
kW
h4
GJ
Ele
ctr
icity
TRU
MA
N R
OA
D L
IFT S
TATI
ON
. CO
ST C
ENTR
E 387
Liqu
id W
aste
Lift
Sta
tion
Subt
otal
4 G
J$
14
10
.0 t
$1
41
98
1kW
hE
lectr
icity
4G
J0
.0 t
Liq
uid
Was
te T
reat
men
t Pla
nt
$1
,07
14
5 G
J$
1,0
71
0.3
t0
.3 t
12
,43
9kW
h4
5G
JE
lectr
icity
CU
RRA
N R
OA
D S
EWA
GE T
REA
TMEN
T PLA
NT.
CO
ST C
ENTR
E 391
$4
,09
81
79
GJ
$4
,09
81
.1 t
1.1
t4
9,7
83
kW
h1
79
GJ
Ele
ctr
icity
E MER
Y RO
AD
TRE
ATM
ENT P
LAN
T. C
OST
CEN
TRE 3
92
$2
,33
61
01
GJ
$2
,33
60
.6 t
0.6
t2
8,0
48
kW
h1
01
GJ
Ele
ctr
icity
J OLL
Y RO
GER
TRE
ATM
ENT P
LAN
T. C
OST
CEN
TRE 3
84
28/0
6/20
09Pa
ge 1
620
08 E
nerg
y &
Gre
enho
use
Gas
Em
issi
ons
Inve
ntor
y
Hyl
a En
viro
nmen
tal S
ervi
ces
Ltd.
, 169
Asp
enw
ood
Driv
e, P
ort M
oody
, BC
V3H
5A
5 rh
ayco
ck@
hesl
td.c
a M
: 604
.469
.291
0 F
: 604
.469
.575
3
71

Cor
pora
te E
nerg
y &
Gre
enho
use
Gas
Em
issi
ons
Inve
ntor
y: 2
008
Suns
hine
Coa
st R
egio
nal D
istr
ict
CO
2eC
osts
Ener
gyC
onsu
mpt
ion
Ener
gyC
osts
CO
2eTy
peA
ccou
nt &
Add
ress
Acc
ount
Sub
tota
lA
ccou
nt C
onsu
mpt
ion
& C
osts
by
Ener
gy T
ype $4
96
19
GJ
$4
96
0.1
t0
.1 t
5,4
00
kW
h1
9G
JE
lectr
icity
L AN
GD
ALE
TRE
ATM
ENT P
LAN
T. C
OST
CEN
TRE 3
88
$1
,43
16
1 G
J$
1,4
31
0.4
t0
.4 t
16
,87
5kW
h6
1G
JE
lectr
icity
L EE B
AY
TREA
TMEN
T PLA
NT.
CO
ST C
ENTR
E 386
$2
,47
01
07
GJ
$2
,47
00
.7 t
0.7
t2
9,6
23
kW
h1
07
GJ
Ele
ctr
icity
L ILY
LA
KE T
REA
TMEN
T PLA
NT.
CO
ST C
ENTR
E 375
$1
,21
75
1 G
J$
1,2
17
0.3
t0
.3 t
14
,23
5kW
h5
1G
JE
lectr
icity
MER
RILL
CRE
S TRE
ATM
ENT P
LAN
T. C
OST
CEN
TRE 3
90
$2
,28
99
9 G
J$
2,2
89
0.6
t0
.6 t
27
,44
9kW
h9
9G
JE
lectr
icity
S EC
RET C
OVE
MA
RIN
A T
REA
TMEN
T PLA
NT.
CO
ST C
ENTR
E 385
$1
,39
65
9 G
J$
1,3
96
0.4
t0
.4 t
16
,45
6kW
h5
9G
JE
lectr
icity
S QU
ARE
BA
Y TR
EATM
ENT P
LAN
T. C
OST
CEN
TRE 3
87
$1
,80
17
7 G
J$
1,8
01
0.5
t0
.5 t
21
,48
6kW
h7
7G
JE
lectr
icity
WO
OD
CRE
EK T
REA
TMEN
T PLA
NT.
CO
ST C
ENTR
E 382
Liqu
id W
aste
Tre
atm
ent P
lant
Sub
tota
l7
98
GJ
$1
8,6
06
4.9
t$
18
,60
62
21
,79
5kW
hE
lectr
icity
79
8G
J4
.9 t
Mis
c.
$6
3$
63
0.0
tM
ETER
ING
CH
AM
BER.
CO
ST C
ENTR
E 375
Mis
c. S
ubto
tal
$6
30
.0 t
$6
3
Pota
ble
Wat
er D
eep
Wel
l
$1
0,7
83
54
5 G
J$
10
,78
33
.3 t
3.3
t1
51
,38
2kW
h5
45
GJ
Ele
ctr
icity
CH
AST
ER R
OA
D W
ELL.
CO
ST C
ENTR
E 375
$1
,04
54
4 G
J$
1,0
45
0.3
t0
.3 t
12
,10
0kW
h4
4G
JE
lectr
icity
E AST
BOU
RNE W
ELL A
ND
WA
TER
TREA
TMEN
T FA
CIL
ITY.
CO
ST C
ENTR
E 375
$1
54
4 G
J$
15
40
.0 t
0.0
t1
,11
6kW
h4
GJ
Ele
ctr
icity
GO
RDO
N W
ELL -
KEA
TS IS
LAN
D. C
OST
CEN
TRE 3
75
$2
56
9 G
J$
25
60
.1 t
0.1
t2
,39
0kW
h9
GJ
Ele
ctr
icity
K ATH
ERIN
E LA
KE P
OTA
BLE W
ELL.
CO
ST C
ENTR
E 375
$1
2,3
03
48
8 G
J$
12
,30
33
.0 t
3.0
t1
35
,48
0kW
h4
88
GJ
Ele
ctr
icity
L AN
GD
ALE
WEL
L. C
OST
CEN
TRE 3
75
$2
,12
99
2 G
J$
2,1
29
0.6
t0
.6 t
25
,44
0kW
h9
2G
JE
lectr
icity
S OA
MES
WEL
L. C
OST
CEN
TRE 3
75
Pota
ble
Wat
er D
eep
Wel
l Sub
tota
l1
,18
0 G
J$
26
,66
97
.2 t
$2
6,6
69
32
7,9
08
kW
hE
lectr
icity
1,1
80
GJ
7.2
t
Pota
ble
Wat
er P
ump
Sta
tion
$1
08
2 G
J$
10
80
.0 t
0.0
t5
40
kW
h2
GJ
Ele
ctr
icity
CA
LETA
PU
MP S
TATI
ON
. CO
ST C
ENTR
E 375
$1
,56
86
7 G
J$
1,5
68
0.4
t0
.4 t
18
,68
5kW
h6
7G
JE
lectr
icity
CO
VE C
AY
PUM
P STA
TIO
N. C
OST
CEN
TRE 3
75
28/0
6/20
09Pa
ge 1
720
08 E
nerg
y &
Gre
enho
use
Gas
Em
issi
ons
Inve
ntor
y
Hyl
a En
viro
nmen
tal S
ervi
ces
Ltd.
, 169
Asp
enw
ood
Driv
e, P
ort M
oody
, BC
V3H
5A
5 rh
ayco
ck@
hesl
td.c
a M
: 604
.469
.291
0 F
: 604
.469
.575
3
SUN
SHIN
E C
OA
ST R
EGIO
NA
L D
ISTR
ICT
CO
RPO
RATE
EN
ERG
Y A
ND
EM
ISSI
ON
S PL
AN
200
9
72
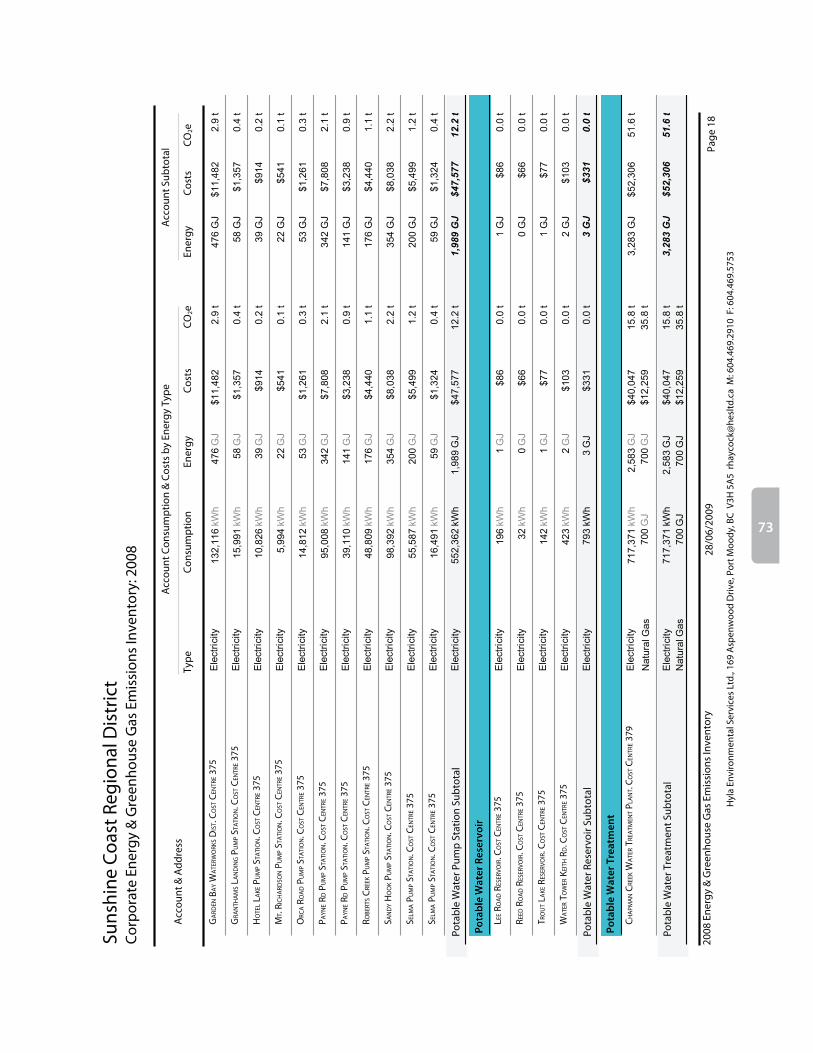
Cor
pora
te E
nerg
y &
Gre
enho
use
Gas
Em
issi
ons
Inve
ntor
y: 2
008
Suns
hine
Coa
st R
egio
nal D
istr
ict
CO
2eC
osts
Ener
gyC
onsu
mpt
ion
Ener
gyC
osts
CO
2eTy
peA
ccou
nt &
Add
ress
Acc
ount
Sub
tota
lA
ccou
nt C
onsu
mpt
ion
& C
osts
by
Ener
gy T
ype
$1
1,4
82
47
6 G
J$
11
,48
22
.9 t
2.9
t1
32
,11
6kW
h4
76
GJ
Ele
ctr
icity
GA
RDEN
BA
Y W
ATE
RWO
RKS D
IST.
CO
ST C
ENTR
E 375
$1
,35
75
8 G
J$
1,3
57
0.4
t0
.4 t
15
,99
1kW
h5
8G
JE
lectr
icity
GRA
NTH
AM
S LA
ND
ING
PU
MP S
TATI
ON
. CO
ST C
ENTR
E 375
$9
14
39
GJ
$9
14
0.2
t0
.2 t
10
,82
6kW
h3
9G
JE
lectr
icity
HO
TEL L
AKE
PU
MP S
TATI
ON
. CO
ST C
ENTR
E 375
$5
41
22
GJ
$5
41
0.1
t0
.1 t
5,9
94
kW
h2
2G
JE
lectr
icity
MT.
RIC
HA
RDSO
N P
UM
P STA
TIO
N. C
OST
CEN
TRE 3
75
$1
,26
15
3 G
J$
1,2
61
0.3
t0
.3 t
14
,81
2kW
h5
3G
JE
lectr
icity
ORC
A R
OA
D P
UM
P STA
TIO
N. C
OST
CEN
TRE 3
75
$7
,80
83
42
GJ
$7
,80
82
.1 t
2.1
t9
5,0
08
kW
h3
42
GJ
Ele
ctr
icity
P AYN
E RD
PU
MP S
TATI
ON
. CO
ST C
ENTR
E 375
$3
,23
81
41
GJ
$3
,23
80
.9 t
0.9
t3
9,1
10
kW
h1
41
GJ
Ele
ctr
icity
P AYN
E RD
PU
MP S
TATI
ON
. CO
ST C
ENTR
E 375
$4
,44
01
76
GJ
$4
,44
01
.1 t
1.1
t4
8,8
09
kW
h1
76
GJ
Ele
ctr
icity
R OBE
RTS C
REEK
PU
MP S
TATI
ON
. CO
ST C
ENTR
E 375
$8
,03
83
54
GJ
$8
,03
82
.2 t
2.2
t9
8,3
92
kW
h3
54
GJ
Ele
ctr
icity
S AN
DY
HO
OK
PUM
P STA
TIO
N. C
OST
CEN
TRE 3
75
$5
,49
92
00
GJ
$5
,49
91
.2 t
1.2
t5
5,5
87
kW
h2
00
GJ
Ele
ctr
icity
S ELM
A P
UM
P STA
TIO
N. C
OST
CEN
TRE 3
75
$1
,32
45
9 G
J$
1,3
24
0.4
t0
.4 t
16
,49
1kW
h5
9G
JE
lectr
icity
S ELM
A P
UM
P STA
TIO
N. C
OST
CEN
TRE 3
75
Pota
ble
Wat
er P
ump
Stat
ion
Subt
otal
1,9
89
GJ
$4
7,5
77
12
.2 t
$4
7,5
77
55
2,3
62
kW
hE
lectr
icity
1,9
89
GJ
12
.2 t
Pota
ble
Wat
er R
eser
voir
$8
61
GJ
$8
60
.0 t
0.0
t1
96
kW
h1
GJ
Ele
ctr
icity
L EE R
OA
D R
ESER
VOIR
. CO
ST C
ENTR
E 375
$6
60
GJ
$6
60
.0 t
0.0
t3
2kW
h0
GJ
Ele
ctr
icity
R EED
RO
AD
RES
ERVO
IR. C
OST
CEN
TRE 3
75
$7
71
GJ
$7
70
.0 t
0.0
t1
42
kW
h1
GJ
Ele
ctr
icity
TRO
UT L
AKE
RES
ERVO
IR. C
OST
CEN
TRE 3
75
$1
03
2 G
J$
10
30
.0 t
0.0
t4
23
kW
h2
GJ
Ele
ctr
icity
WA
TER
TOW
ER K
EITH
RD
. CO
ST C
ENTR
E 375
Pota
ble
Wat
er R
eser
voir
Subt
otal
3 G
J$
33
10
.0 t
$3
31
79
3kW
hE
lectr
icity
3G
J0
.0 t
Pota
ble
Wat
er T
reat
men
t
$4
0,0
47
$1
2,2
59
3,2
83
GJ
$5
2,3
06
51
.6 t
15
.8 t
35
.8 t
71
7,3
71
kW
h
70
0G
J
2,5
83
GJ
70
0G
JN
atu
ralG
as
Ele
ctr
icity
CH
APM
AN
CRE
EK W
ATE
R TR
EATM
ENT P
LAN
T. C
OST
CEN
TRE 3
79
Pota
ble
Wat
er T
reat
men
t Sub
tota
l3
,28
3 G
J$
52
,30
65
1.6
t$
40
,04
77
17
,37
1kW
hE
lectr
icity
2,5
83
GJ
15
.8 t
$1
2,2
59
70
0G
JN
atu
ralG
as
70
0G
J3
5.8
t
28/0
6/20
09Pa
ge 1
820
08 E
nerg
y &
Gre
enho
use
Gas
Em
issi
ons
Inve
ntor
y
Hyl
a En
viro
nmen
tal S
ervi
ces
Ltd.
, 169
Asp
enw
ood
Driv
e, P
ort M
oody
, BC
V3H
5A
5 rh
ayco
ck@
hesl
td.c
a M
: 604
.469
.291
0 F
: 604
.469
.575
3
73
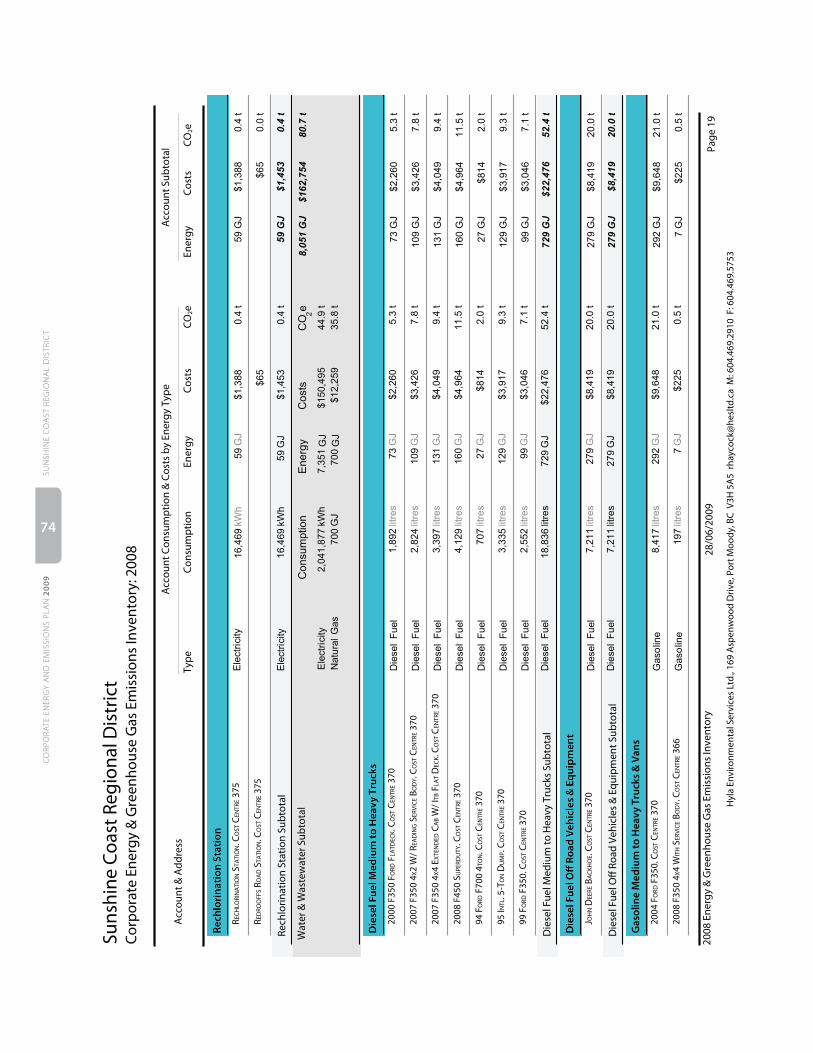
Cor
pora
te E
nerg
y &
Gre
enho
use
Gas
Em
issi
ons
Inve
ntor
y: 2
008
Suns
hine
Coa
st R
egio
nal D
istr
ict
CO
2eC
osts
Ener
gyC
onsu
mpt
ion
Ener
gyC
osts
CO
2eTy
peA
ccou
nt &
Add
ress
Acc
ount
Sub
tota
lA
ccou
nt C
onsu
mpt
ion
& C
osts
by
Ener
gy T
ype
Rech
lori
nati
on S
tati
on
$1
,38
85
9 G
J$
1,3
88
0.4
t0
.4 t
16
,46
9kW
h5
9G
JE
lectr
icity
R EC
HLO
RIN
ATI
ON
STA
TIO
N. C
OST
CEN
TRE 3
75
$6
5$
65
0.0
tRE
DRO
OFF
S RO
AD
STA
TIO
N. C
OST
CEN
TRE 3
75
Rech
lorin
atio
n St
atio
n Su
btot
al5
9 G
J$
1,4
53
0.4
t$
1,4
53
16
,46
9kW
hE
lectr
icity
59
GJ
0.4
t
Co
nsu
mptio
nC
O e 2
Co
sts
En
erg
y8
,05
1 G
J$
16
2,7
54
80
.7 t
$1
50
,49
52
,04
1,8
77
kW
hE
lectr
icity
7,3
51
GJ
44
.9 t
$1
2,2
59
70
0G
JN
atu
ral
Ga
s7
00
GJ
35
.8 t
Wat
er &
Was
tew
ater
Sub
tota
l
Die
sel F
uel M
ediu
m to
Hea
vy T
ruck
s
$2
,26
07
3 G
J$
2,2
60
5.3
t5
.3 t
1,8
92
litre
s7
3G
JD
iese
lF
ue
l20
00 F
350
F ORD
FLA
TDEC
K. C
OST
CEN
TRE 3
70
$3
,42
61
09
GJ
$3
,42
67
.8 t
7.8
t2
,82
4lit
res
10
9G
JD
iese
lF
ue
l20
07 F
350
4 X2
W/ R
EAD
ING
SER
VIC
E BO
DY.
CO
ST C
ENTR
E 370
$4
,04
91
31
GJ
$4
,04
99
.4 t
9.4
t3
,39
7lit
res
13
1G
JD
iese
lF
ue
l20
07 F
350
4 X4
EXTE
ND
ED C
AB
W/ I
TB F
LAT D
ECK.
CO
ST C
ENTR
E 370
$4
,96
41
60
GJ
$4
,96
41
1.5
t1
1.5
t4
,12
9lit
res
16
0G
JD
iese
lF
ue
l20
08 F
450
S UPE
RDU
TY. C
OST
CEN
TRE 3
70
$8
14
27
GJ
$8
14
2.0
t2
.0 t
70
7lit
res
27
GJ
Die
se
lF
ue
l94
FO
RD F
700
4TO
N. C
OST
CEN
TRE 3
70
$3
,91
71
29
GJ
$3
,91
79
.3 t
9.3
t3
,33
5lit
res
12
9G
JD
iese
lF
ue
l95
I NTL
. 5-T
ON
DU
MP.
CO
ST C
ENTR
E 370
$3
,04
69
9 G
J$
3,0
46
7.1
t7
.1 t
2,5
52
litre
s9
9G
JD
iese
lF
ue
l99
FO
RD F
350.
CO
ST C
ENTR
E 370
Die
sel F
uel M
ediu
m to
Hea
vy T
ruck
s Su
btot
al7
29
GJ
$2
2,4
76
52
.4 t
Die
se
lF
ue
l$
22
,47
61
8,8
36
litre
s7
29
GJ
52
.4 t
Die
sel F
uel O
ff R
oad
Veh
icle
s &
Eq
uip
men
t
$8
,41
92
79
GJ
$8
,41
92
0.0
t2
0.0
t7
,21
1lit
res
27
9G
JD
iese
lF
ue
lJ O
HN
DEE
RE B
AC
KHO
E. C
OST
CEN
TRE 3
70
Die
sel F
uel O
ff R
oad
Vehi
cles
& E
quip
men
t Sub
tota
l2
79
GJ
$8
,41
92
0.0
tD
iese
lF
ue
l$
8,4
19
7,2
11
litre
s2
79
GJ
20
.0 t
Gas
olin
e M
ediu
m to
Hea
vy T
ruck
s &
Van
s
$9
,64
82
92
GJ
$9
,64
82
1.0
t2
1.0
t8
,41
7lit
res
29
2G
JG
aso
line
2004
FO
RD F
350.
CO
ST C
ENTR
E 370
$2
25
7 G
J$
22
50
.5 t
0.5
t1
97
litre
s7
GJ
Ga
so
line
2008
F35
0 4 X
4 W
ITH
SER
VIC
E BO
DY.
CO
ST C
ENTR
E 366
28/0
6/20
09Pa
ge 1
920
08 E
nerg
y &
Gre
enho
use
Gas
Em
issi
ons
Inve
ntor
y
Hyl
a En
viro
nmen
tal S
ervi
ces
Ltd.
, 169
Asp
enw
ood
Driv
e, P
ort M
oody
, BC
V3H
5A
5 rh
ayco
ck@
hesl
td.c
a M
: 604
.469
.291
0 F
: 604
.469
.575
3
SUN
SHIN
E C
OA
ST R
EGIO
NA
L D
ISTR
ICT
CO
RPO
RATE
EN
ERG
Y A
ND
EM
ISSI
ON
S PL
AN
200
9
74
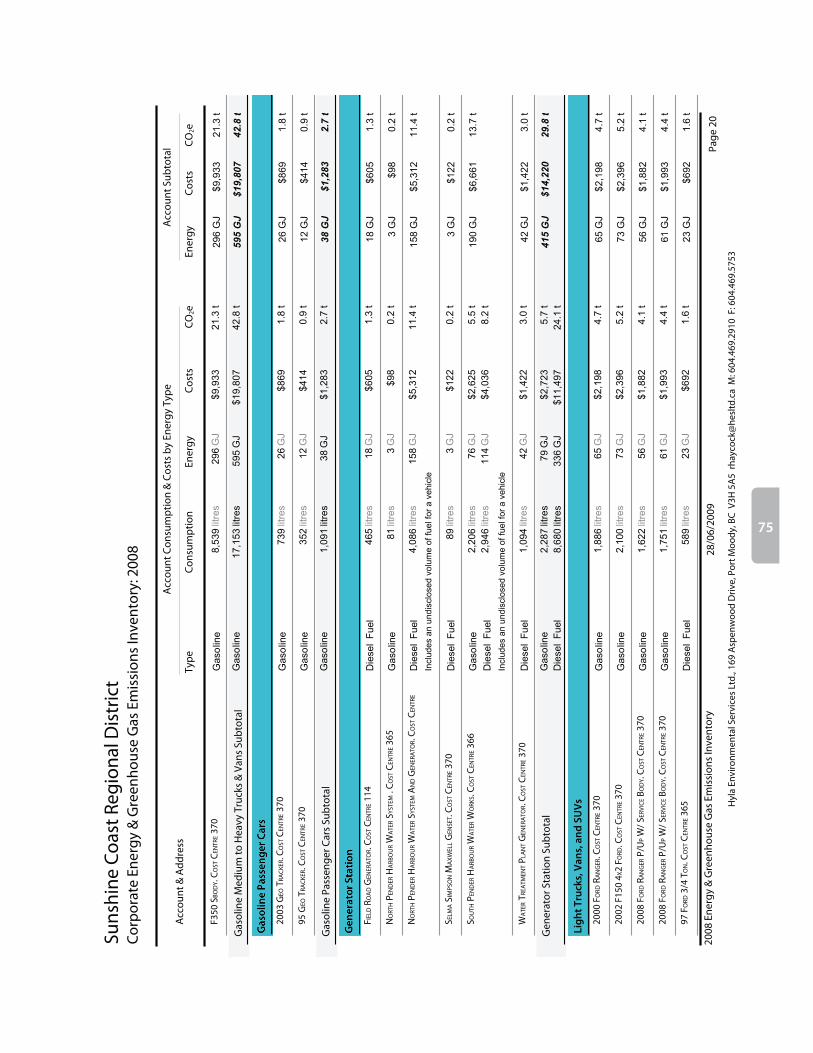
Cor
pora
te E
nerg
y &
Gre
enho
use
Gas
Em
issi
ons
Inve
ntor
y: 2
008
Suns
hine
Coa
st R
egio
nal D
istr
ict
CO
2eC
osts
Ener
gyC
onsu
mpt
ion
Ener
gyC
osts
CO
2eTy
peA
ccou
nt &
Add
ress
Acc
ount
Sub
tota
lA
ccou
nt C
onsu
mpt
ion
& C
osts
by
Ener
gy T
ype
$9
,93
32
96
GJ
$9
,93
32
1.3
t2
1.3
t8
,53
9lit
res
29
6G
JG
aso
line
F350
SBO
DY.
CO
ST C
ENTR
E 370
Gas
olin
e M
ediu
m to
Hea
vy T
ruck
s &
Van
s Su
btot
al5
95
GJ
$1
9,8
07
42
.8 t
Ga
so
line
$1
9,8
07
17
,15
3lit
res
59
5G
J4
2.8
t
Gas
olin
e Pa
ssen
ger C
ars
$8
69
26
GJ
$8
69
1.8
t1
.8 t
73
9lit
res
26
GJ
Ga
so
line
2003
GEO
TRA
CKE
R. C
OST
CEN
TRE 3
70
$4
14
12
GJ
$4
14
0.9
t0
.9 t
35
2lit
res
12
GJ
Ga
so
line
95 G
EO T
RAC
KER.
CO
ST C
ENTR
E 370
Gas
olin
e Pa
ssen
ger C
ars
Subt
otal
38
GJ
$1
,28
32
.7 t
Ga
so
line
$1
,28
31
,09
1lit
res
38
GJ
2.7
t
Gen
erat
or S
tati
on
$6
05
18
GJ
$6
05
1.3
t1
.3 t
46
5lit
res
18
GJ
Die
se
lF
ue
lF I
ELD
RO
AD
GEN
ERA
TOR.
CO
ST C
ENTR
E 114
$9
83
GJ
$9
80
.2 t
0.2
t8
1lit
res
3G
JG
aso
line
NO
RTH
PEN
DER
HA
RBO
UR
WA
TER
SYST
EM .
CO
ST C
ENTR
E 365
$5
,31
21
58
GJ
$5
,31
21
1.4
t1
1.4
t
Inclu
de
s a
n u
nd
isclo
se
d v
olu
me
of
fue
l fo
r a
ve
hic
le
4,0
86
litre
s1
58
GJ
Die
se
lF
ue
lN
ORT
H P
END
ER H
ARB
OU
R W
ATE
R SY
STEM
AN
D G
ENER
ATO
R. C
OST
CEN
TRE
365
$1
22
3 G
J$
12
20
.2 t
0.2
t8
9lit
res
3G
JD
iese
lF
ue
lS E
LMA S
IMPS
ON
MA
XW
ELL G
ENSE
T. C
OST
CEN
TRE 3
70
$2
,62
5
$4
,03
61
90
GJ
$6
,66
11
3.7
t5
.5 t
8.2
t
Inclu
de
s a
n u
nd
isclo
se
d v
olu
me
of
fue
l fo
r a
ve
hic
le
2,2
06
litre
s
2,9
46
litre
s
76
GJ
11
4G
JG
aso
line
Die
se
lF
ue
l
S OU
TH P
END
ER H
ARB
OU
R W
ATE
R W
ORK
S. C
OST
CEN
TRE 3
66
$1
,42
24
2 G
J$
1,4
22
3.0
t3
.0 t
1,0
94
litre
s4
2G
JD
iese
lF
ue
lW
ATE
R TR
EATM
ENT P
LAN
T GEN
ERA
TOR.
CO
ST C
ENTR
E 370
Gen
erat
or S
tatio
n Su
btot
al4
15
GJ
$1
4,2
20
29
.8 t
Ga
so
line
$2
,72
32
,28
7lit
res
79
GJ
5.7
t
Die
se
lF
ue
l$
11
,49
78
,68
0lit
res
33
6G
J2
4.1
t
Ligh
t Tru
cks,
Van
s, a
nd S
UV
s
$2
,19
86
5 G
J$
2,1
98
4.7
t4
.7 t
1,8
86
litre
s6
5G
JG
aso
line
2000
FO
RD R
AN
GER
. CO
ST C
ENTR
E 370
$2
,39
67
3 G
J$
2,3
96
5.2
t5
.2 t
2,1
00
litre
s7
3G
JG
aso
line
2002
F15
0 4 X
2 FO
RD. C
OST
CEN
TRE 3
70
$1
,88
25
6 G
J$
1,8
82
4.1
t4
.1 t
1,6
22
litre
s5
6G
JG
aso
line
2008
FO
RD R
AN
GER
P/U
P W/ S
ERVI
CE B
OD
Y. C
OST
CEN
TRE 3
70
$1
,99
36
1 G
J$
1,9
93
4.4
t4
.4 t
1,7
51
litre
s6
1G
JG
aso
line
2008
FO
RD R
AN
GER
P/U
P W/ S
ERVI
CE B
OD
Y. C
OST
CEN
TRE 3
70
$6
92
23
GJ
$6
92
1.6
t1
.6 t
58
9lit
res
23
GJ
Die
se
lF
ue
l97
FO
RD 3
/4 T
ON
. CO
ST C
ENTR
E 365
28/0
6/20
09Pa
ge 2
020
08 E
nerg
y &
Gre
enho
use
Gas
Em
issi
ons
Inve
ntor
y
Hyl
a En
viro
nmen
tal S
ervi
ces
Ltd.
, 169
Asp
enw
ood
Driv
e, P
ort M
oody
, BC
V3H
5A
5 rh
ayco
ck@
hesl
td.c
a M
: 604
.469
.291
0 F
: 604
.469
.575
3
75

Cor
pora
te E
nerg
y &
Gre
enho
use
Gas
Em
issi
ons
Inve
ntor
y: 2
008
Suns
hine
Coa
st R
egio
nal D
istr
ict
CO
2eC
osts
Ener
gyC
onsu
mpt
ion
Ener
gyC
osts
CO
2eTy
peA
ccou
nt &
Add
ress
Acc
ount
Sub
tota
lA
ccou
nt C
onsu
mpt
ion
& C
osts
by
Ener
gy T
ype $3
40
10
GJ
$3
40
0.7
t0
.7 t
29
0lit
res
10
GJ
Ga
so
line
F ORD
ESC
APE
. CO
ST C
ENTR
E 370
$2
,96
48
9 G
J$
2,9
64
6.4
t6
.4 t
2,5
82
litre
s8
9G
JG
aso
line
R AN
GER
4X4
2003
. CO
ST C
ENTR
E 370
Ligh
t Tru
cks,
Van
s, a
nd S
UVs
Sub
tota
l3
77
GJ
$1
2,4
65
27
.2 t
Ga
so
line
$1
1,7
72
10
,23
1lit
res
35
5G
J2
5.6
t
Die
se
lF
ue
l$
69
25
89
litre
s2
3G
J1
.6 t
Misc.
$1
,26
33
8 G
J$
1,2
63
2.7
t2
.7 t
1,1
01
litre
s3
8G
JG
aso
line
WO
RKS M
ISC
ELLA
NEO
US.
CO
ST C
ENTR
E 370
Mis
c. S
ubto
tal
38
GJ
$1
,26
32
.7 t
Ga
so
line
$1
,26
31
,10
1lit
res
38
GJ
2.7
t
Co
nsu
mptio
nC
O e 2
Co
sts
En
erg
y2
,47
0 G
J$
79
,93
21
77
.7 t
Ga
so
line
$3
6,8
49
31
,86
4lit
res
1,1
04
GJ
79
.6 t
Die
se
lF
ue
l$
43
,08
43
5,3
17
litre
s1
,36
6G
J9
8.2
t
Vehi
cle
Flee
t Sub
tota
l
Co
nsu
mptio
nTo
tal
CO
e 2C
osts
En
erg
y
Ma
ss
Vo
lum
e
9,2
38
52
,23
0 G
J$
98
8,5
69
1,8
05
.7 t
$4
96
,47
67
,09
6,3
44
kW
hE
lectr
icity
25
,54
7G
J1
56
.1 t
$2
85
,07
02
0,2
51
GJ
Na
tura
lG
as
20
,25
1G
J1
,03
5.8
t
$1
,90
11
,58
4lit
res
61
GJ
4.5
tF
ue
lOil
Ga
so
line
$1
08
,47
39
4,4
68
litre
s3
,27
4G
J2
35
.9 t
Die
se
lF
ue
l$
84
,97
27
0,5
11
litre
s2
,72
7G
J1
96
.0 t
So
lidW
aste
1,9
50
cu
. yd
s2
92
.43
t1
55
.0 t
Pro
pa
ne
litre
s2
34
$7
,39
0G
J1
4.2
t
Pro
pa
ne
5,3
58
litre
s1
36
$4
,28
6G
J8
.1 t
Mb
l
Stn
ry
CO
e 2
Type
28/0
6/20
09Pa
ge 2
120
08 E
nerg
y &
Gre
enho
use
Gas
Em
issi
ons
Inve
ntor
y
Hyl
a En
viro
nmen
tal S
ervi
ces
Ltd.
, 169
Asp
enw
ood
Driv
e, P
ort M
oody
, BC
V3H
5A
5 rh
ayco
ck@
hesl
td.c
a M
: 604
.469
.291
0 F
: 604
.469
.575
3
SUN
SHIN
E C
OA
ST R
EGIO
NA
L D
ISTR
ICT
CO
RPO
RATE
EN
ERG
Y A
ND
EM
ISSI
ON
S PL
AN
200
9
76