Corporate Credit Rating Leasing · Corporate Credit Rating (Annual Review) Leasing *Affirmed by...
16
TURKEY Publication Date: June 17, 2015 “Global Knowledge supported by Local Experience” Copyright © 2007 by JCR Eurasia Rating. 19 Mayıs Mah., 19 Mayıs Cad., Nova Baran Plaza No:4 Kat: 12 Şişli -İSTANBUL Telephone: +90.212.352.56.73 Fax: +90 (212) 352.56.75 Reproduction is prohibited except by permission. All rights reserved. All information has been obtained from sources JCR Eurasia Rating believes to be reliable. However, JCR Eurasia Rating does not guarantee the truth, accuracy and adequacy of this information. JCR Eurasia Rating ratings are objective and independent opinions as to the creditworthiness of a security and issuer and not to be considered a recommendation to buy, hold or sell any security or to issue a loan. This rating report has been composed within the methodologies registered with and certified by the SPK (CMB-Capital Markets Board of Turkey), BDDK (BRSA-Banking Regulation and Supervision Agency) and internationally accepted rating principles and guidelines but is not covered by NRSRO regulations. http://www.jcrer.com.tr Corporate Credit Rating (Annual Review) Leasing *Affirmed by Japan Credit Rating Agency, JCR on July 11, 2014 Senior Analyst: Gökhan IYIGUN/+90 212 352 56 74 [email protected] Long Term Short Term International Foreign Currency BBB- A-3 Local Currency BBB- A-3 Outlook FC Stable Stable LC Stable Stable National Local Rating BBB+ (Trk) A–2 (Trk) Outlook Stable Stable Sponsor Support 2 - Stand Alone AB - Sovereign* Foreign Currency BBB- - Local Currency BBB- - Outlook FC Stable - LC Stable - ŞEKER FİNANSAL KİRALAMA A.Ş. and ITS SUBSIDIARY F i n a n c i a l D a t a 1Q2015 2014* 2013* 2012* 2011* 2010* Total Assets (000 USD) 151,508 172,788 187,097 156,994 111,105 125,951 Total Assets (000 TRY) 395,950 400,677 398,592 279,073 209,867 193,662 Equity (000 TRY) 56,693 54,956 49,365 44,150 40,454 35,491 Net Profit (000 TRY) 1,731 5,590 5,248 3,546 4,956 4,301 Market Share (%) 1.12 1.23 1.40 1.38 1.13 1.23 ROAA (%) 0.14 0.80 1.91 1.81 1.84 1.19 ROAE (%) 1.06 6.13 13.87 10.48 9.79 6.37 Equity/Assets (%) 14.32 13.72 12.38 15.82 19.28 18.33 NPL (%) 14.71 14.46 10.17 12.22 16.43 17.59 Growth Rate (%) -3.57 0.52 42.83 32.98 8.37 19.78 *End of year Overview Şeker Finansal Kiralama A.Ş. (hereinafter referred to as Şeker Leasing, or the Company) is a partially owned subsidiary of Şekerbank T.A.Ş. (the Bank) with a 54.13% stake. The mid-scale commercial bank was assigned a long-term national rating of ‘AA- (Trk)’ on June 27, 2014 by JCR Eurasia Rating. Şeker Leasing was founded in 1997 and listed on the BIST in 2004. As of 1Q2015, the free float rate was 15.80% of the TRY 45mn paid capital. The Company performs its activities through its headquarters and regional offices in Ankara, Izmir and Gaziantep as well as in the widespread branch network of Şekerbank T.A.Ş. and employed a staff force of 30 people as of March 31, 2015. Şeker Leasing, with a total asset size of TRY 395.95mn, had a 1.12% market share in the leasing sector worth a total of TRY 35.21bn as of 1Q2015. The Company’s subsidiary Sekar Oto Kiralama Turizm Kargo Taşımacılık Hizmeti ve Tic. Ltd.Şti. is fully consolidated in its financial statements. Strengths Continuously above sector income generation capacities of average total assets and equity through above average interest margin keeping the profit generation capacity alive Long term weighted term structure of borrowings, in contrast to the general sector composition, together with continuing bond issuances relieving liquidity management and lowering risk level Remarkably high collateral level and relatively high collection capability of overdue loans, reducing the pressure on asset quality and generating potential of positive contribution to future profitability figures Relatively high compliance level to corporate governance principals as one of the few publicly traded leasing companies Strong and reputable shareholding structure together with benefits of being a subsidiary of bank regarding funding alternatives & costs, customer base and network Rising sponsor support level of the Turkish Leasing Sector Constraints Remarkably below sector annual and first quarter growths leading to shrinking market share in line with the Company’s cautious management strategy Deteriorating above sector average NPL ratio against improving sector figure along with overdue loans exceeding equity level, suppressing asset quality and ascending risk level Continuously below sector pre-tax profit generation capacity of total income due to above sector average patterns in operating and financial expenses together with remarkable deterioration in the last year via increasing provisions, restraining profitability figures Characteristic of bank related companies, continuously below sector average standard ratio despite meeting legal requirements Volatility potential on future profitability figures derived from increasing share of other operating income in total income Highly competitive and challenging market conditions that might pressure profit margins via worsening debt-service capabilities of real sector firms 1.23 1.40 1.38 1.13 1.23 0 2 Market Share (%) 0.5 42.8 33.0 8.4 19.8 0 50 Growth Rate (%) 0.80 1.91 1.81 1.84 1.19 0 5 ROAA (%) 6.13 13.87 10.48 9.79 6.37 0 20 ROAE (%) 13.7 12.4 15.8 19.3 18.3 0 50 2014 2013 2012 2011 2010 Equity/Assets (%) 14.5 10.2 12.2 16.4 17.6 0 20 2014 2013 2012 2011 2010 NPL (%)
Transcript of Corporate Credit Rating Leasing · Corporate Credit Rating (Annual Review) Leasing *Affirmed by...
TURKEY
Publication Date: June 17, 2015 “Global Knowledge supported by Local Experience” Copyright © 2007 by JCR Eurasia Rating. 19 Mayıs Mah., 19 Mayıs Cad., Nova Baran Plaza No:4 Kat: 12 Şişli-İSTANBUL Telephone: +90.212.352.56.73 Fax: +90 (212) 352.56.75
Reproduction is prohibited except by permission. All rights reserved. All information has been obtained from sources JCR Eurasia Rating believes to be reliable. However, JCR
Eurasia Rating does not guarantee the truth, accuracy and adequacy of this information. JCR Eurasia Rating ratings are objective and independent opinions as to the
creditworthiness of a security and issuer and not to be considered a recommendation to buy, hold or sell any security or to issue a loan. This rating report has been composed within
the methodologies registered with and certified by the SPK (CMB-Capital Markets Board of Turkey), BDDK (BRSA-Banking Regulation and Supervision Agency) and
internationally accepted rating principles and guidelines but is not covered by NRSRO regulations. http://www.jcrer.com.tr
Corporate Credit Rating (Annual Review)
Leasing
*Affirmed by Japan Credit Rating Agency, JCR on July 11, 2014
Senior Analyst: Gökhan IYIGUN/+90 212 352 56 74
Long Term
Short Term
Inte
rnatio
nal Foreign Currency BBB- A-3
Local Currency BBB- A-3
Outlook FC Stable Stable
LC Stable Stable
Natio
nal
Local Rating BBB+ (Trk) A–2 (Trk)
Outlook Stable Stable
Sponsor Support 2 -
Stand Alone AB -
So
vere
ign
*
Foreign Currency BBB- -
Local Currency BBB- -
Outlook FC Stable -
LC Stable -
ŞEKER FİNANSAL KİRALAMA A.Ş. and ITS SUBSIDIARY
F i n a n c i a l D a t a 1Q2015 2014* 2013* 2012* 2011* 2010*
Total Assets (000 USD) 151,508 172,788 187,097 156,994 111,105 125,951
Total Assets (000 TRY) 395,950 400,677 398,592 279,073 209,867 193,662
Equity (000 TRY) 56,693 54,956 49,365 44,150 40,454 35,491
Net Profit (000 TRY) 1,731 5,590 5,248 3,546 4,956 4,301
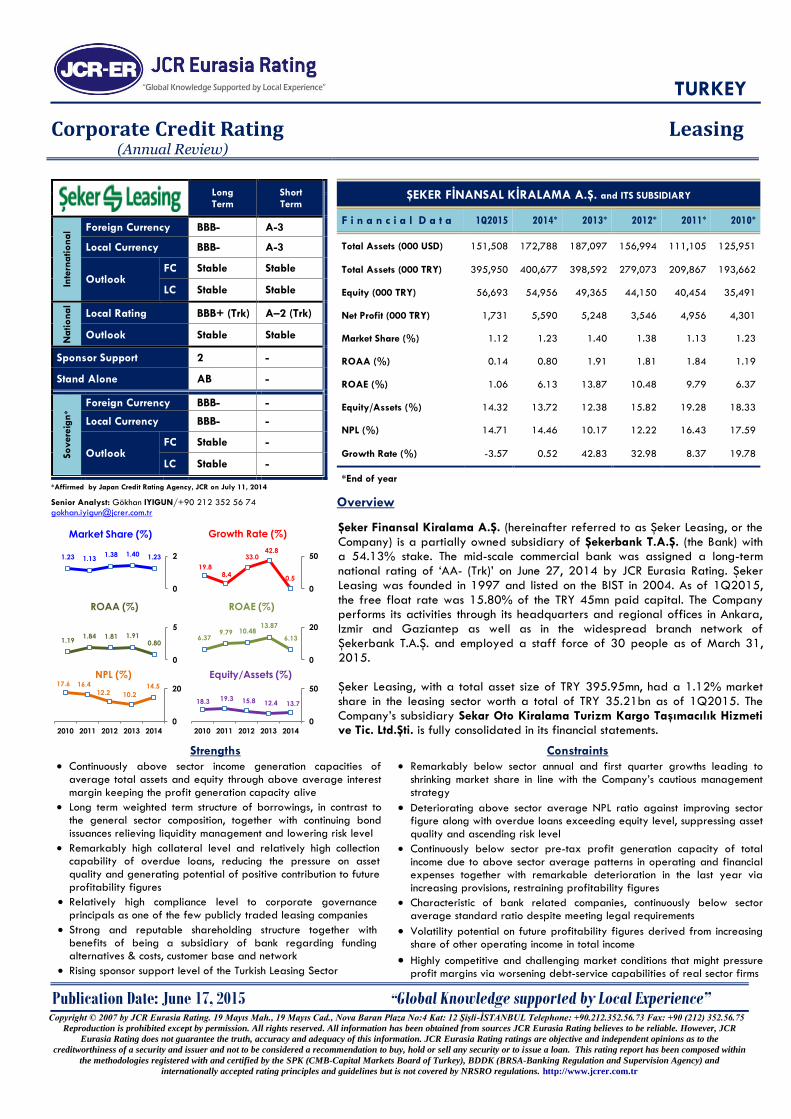
Market Share (%) 1.12 1.23 1.40 1.38 1.13 1.23
ROAA (%) 0.14 0.80 1.91 1.81 1.84 1.19
ROAE (%) 1.06 6.13 13.87 10.48 9.79 6.37
Equity/Assets (%) 14.32 13.72 12.38 15.82 19.28 18.33
NPL (%) 14.71 14.46 10.17 12.22 16.43 17.59
Growth Rate (%) -3.57 0.52 42.83 32.98 8.37 19.78
*End of year
Overview
Şeker Finansal Kiralama A.Ş. (hereinafter referred to as Şeker Leasing, or the Company) is a partially owned subsidiary of Şekerbank T.A.Ş. (the Bank) with a 54.13% stake. The mid-scale commercial bank was assigned a long-term national rating of ‘AA- (Trk)’ on June 27, 2014 by JCR Eurasia Rating. Şeker Leasing was founded in 1997 and listed on the BIST in 2004. As of 1Q2015, the free float rate was 15.80% of the TRY 45mn paid capital. The Company performs its activities through its headquarters and regional offices in Ankara, Izmir and Gaziantep as well as in the widespread branch network of Şekerbank T.A.Ş. and employed a staff force of 30 people as of March 31, 2015. Şeker Leasing, with a total asset size of TRY 395.95mn, had a 1.12% market share in the leasing sector worth a total of TRY 35.21bn as of 1Q2015. The Company’s subsidiary Sekar Oto Kiralama Turizm Kargo Taşımacılık Hizmeti ve Tic. Ltd.Şti. is fully consolidated in its financial statements.
Strengths
Continuously above sector income generation capacities of average total assets and equity through above average interest margin keeping the profit generation capacity alive
Long term weighted term structure of borrowings, in contrast to the general sector composition, together with continuing bond issuances relieving liquidity management and lowering risk level
Remarkably high collateral level and relatively high collection capability of overdue loans, reducing the pressure on asset quality and generating potential of positive contribution to future profitability figures
Relatively high compliance level to corporate governance principals as one of the few publicly traded leasing companies
Strong and reputable shareholding structure together with benefits of being a subsidiary of bank regarding funding alternatives & costs, customer base and network
Rising sponsor support level of the Turkish Leasing Sector
Constraints
Remarkably below sector annual and first quarter growths leading to shrinking market share in line with the Company’s cautious management strategy
Deteriorating above sector average NPL ratio against improving sector figure along with overdue loans exceeding equity level, suppressing asset quality and ascending risk level
Continuously below sector pre-tax profit generation capacity of total income due to above sector average patterns in operating and financial expenses together with remarkable deterioration in the last year via increasing provisions, restraining profitability figures
Characteristic of bank related companies, continuously below sector average standard ratio despite meeting legal requirements
Volatility potential on future profitability figures derived from increasing share of other operating income in total income
Highly competitive and challenging market conditions that might pressure profit margins via worsening debt-service capabilities of real sector firms
1.23 1.40 1.38 1.13 1.23
0
2
Market Share (%)
0.5
42.8 33.0
8.4 19.8
0
50
Growth Rate (%)
0.80 1.91 1.81 1.84
1.19
0
5
ROAA (%)
6.13
13.87 10.48 9.79
6.37
0
20
ROAE (%)
13.7 12.4 15.8 19.3 18.3
0
50
20142013201220112010
Equity/Assets (%) 14.5
10.2 12.2
16.4 17.6
0
20
20142013201220112010
NPL (%)
LEASING
Şeker Finansal Kiralama A.Ş. and Its Subsidiary 2
1. Rating Rationale
The Turkish Leasing Sector has been regulated and supervised by the Banking Regulation and Supervision Agency (BRSA) since 2006. The ‘Financial Leasing, Factoring and Financing Companies Law’ No. 6361 came into effect on December 13, 2012. Moreover, the Regulation regarding organization and operating principals of financial leasing, factoring and financing companies entered into force on April 24, 2013. According to BRSA statistics updated May 14, 2015, the total asset size of the Turkish Leasing Sector was TRY 35.21bn and involved 30 leasing companies, five of which were listed on the Borsa Istanbul (BIST) National Market, as of the report date.
The Company’s consolidated independent audit reports prepared in conformity with BRSA regulations, BRSA’s year-end sectoral data updated on February 13, 2015, BRSA’s first quarter sectoral data promulgated on May 14, 2015, JCR Eurasia Rating’s own studies and records, information and clarifications provided by the Company and non-financial figures constitute the major basis of Şeker Leasing’s ratings. In the assignment of Şeker Leasing’s ratings, quantitative and qualitative assessments regarding profitability figures, asset quality, equity level, liquidity profile, efficiency and risk management practices, the main shareholders’ financial and non-financial positions along with expected support, growth strategy and market shares have been taken into consideration. Prominent Rating Considerations are; Rising Sponsor Support Level of the Turkish Leasing Sector Upon the application filed by the Financial Institutions Association (FKB) to Takasbank (Istanbul Settlement and Custody Bank), Leasing, Factoring and Finance Companies will become members in the Clearing System and entitled to enter into borrowing/lending transactions in the Takasbank Money Market (TPP) based on certain limits and identified collaterals beginning with the enactment of the Takasbank Money Market Regulation and Procedure on April 10, 2015. Moreover, the sector’s transaction volume was supported through new products recently rendered possible by law and
the new sell & lease back product formed approximately 28% of the sector’s 2014 annual turnover. Relieved Liquidity Management The Company ratio of ‘short-term borrowings to total assets’ exhibited an ongoing below sector average pattern over the years. Moreover, unlike the sector composition, the Company had a long-term structure in funding of its assets through continuing debt instrument issuances over the last three years despite deterioration in the last year with a year-end value of 44.61% against the sector figure of 70.37%. Moreover, the Company satisfied its short-term funding need of TRY 47.57mn as of 1Q2015 through a TRY 50mn debt instrument issuance realized at the end of May. Additionally, the Company had sufficient funding reserves with a cash free line amounting to TRY 226.06mn. as of June 1, 2015. Both the above stated issues relieved the liquidity management and positively contributed to risk level.
Continuously Above Sector Income Generation Capacities of Average Total Assets and Equity The income generation capacity of the Company’s average total assets and equity remained above the sector figures over the years, mainly due to the interest margin persistently standing above the sector figure and increasing contribution of other operating income particularly over the last two years as well as comparatively low equity level. Although the above sector interest margin of the Company exhibited a downward trend since 2010, it materialized a year-end figure of 4.16% against the sector average of 3.66%. Additionally, the other operating income mainly composed of gains on FX position and collections from overdue loans contributed remarkably to total income through a 74.88% increase from TRY 8.62mn to
TRY 15.08mn. Remarkably High Collateral Level The Company had a collateral amount of TRY 1.1bn composed of 78.37% bills, 16.44% mortgage and 4.28% pledges and 0.92% letter of guarantees against its TRY 353.78mn gross receivables as of FYE2014. Accordingly, the Company’s ‘collateral-to-total receivables’ ratio realized a value of 264.12% as of FYE2014 with an almost straight trend over the last years, fairly above the sector average of approximately 65%. Moreover, the Company envisages an approximately 65% collection capability for overdue loans through their collaterals mostly composed of mortgages, reducing the pressure on asset quality and generating potential of positive contribution to future profitability. Strong and Credible Shareholder Structure along with Benefits of Being a Bank Related Company Şekerbank T.A.Ş., a mid-scale commercial bank, is the majority shareholder of the Company with a stake of 54.13%. The Company uses its benefits as a bank-related company regarding funding alternatives, term and costs, customer base and network externalities through its 312 domestic branches. High Compliance to Corporate Governance Principles The Company is one of the few publicly traded leasing companies. Accordingly, as a publicly traded company since 2004, the Company had a comparatively high compliance to Corporate Governance Principles. The Company’s board
composition containing seven members, two of which are independent, along with the presence of the committees of audit, corporate governance and early detection of risk structured under the board, the existence of an effective shareholders relation unit and the comprehensive content of website regarding principles are the main factors of the stated high compliance level, positively contributing to risk level through improved transparency level. Descending Market Share The Company realized a 0.52% annual and -1.18% quarterly asset growths over the last year and first quarter of 2015 against sector figures of 14.42% and 8.06%, respectively. Accordingly, the market share of the Company decreased from the 2013 year-end figure of 1.40% to 1.23% as of FYE2014 and 1.12% as of 1Q2015 through a remarkable decrease of almost to half in transaction volume in line with the Company’s cautious management strategy preferred following 2013 in which a jump was realized in the sector trading volume thanks to new sell & lease back product and volatile market conditions exercised recently.
LEASING
Şeker Finansal Kiralama A.Ş. and Its Subsidiary 3
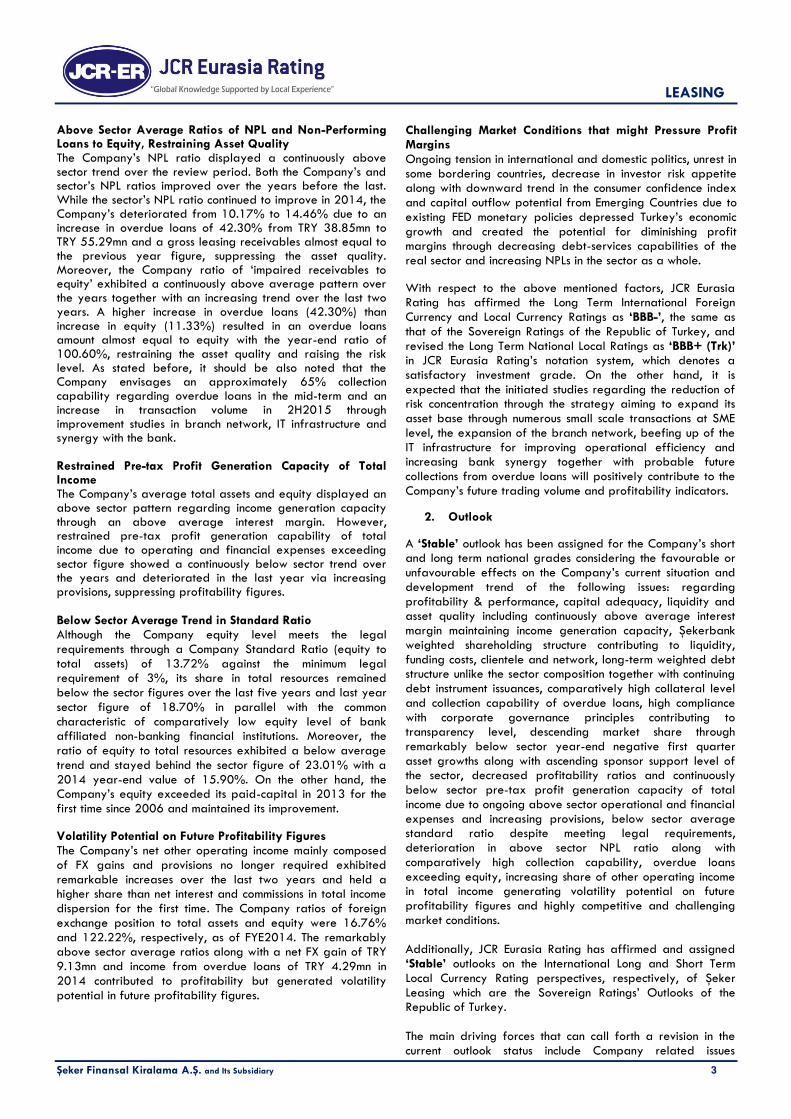
Above Sector Average Ratios of NPL and Non-Performing Loans to Equity, Restraining Asset Quality The Company’s NPL ratio displayed a continuously above sector trend over the review period. Both the Company’s and sector’s NPL ratios improved over the years before the last. While the sector’s NPL ratio continued to improve in 2014, the Company’s deteriorated from 10.17% to 14.46% due to an increase in overdue loans of 42.30% from TRY 38.85mn to TRY 55.29mn and a gross leasing receivables almost equal to the previous year figure, suppressing the asset quality. Moreover, the Company ratio of ‘impaired receivables to equity’ exhibited a continuously above average pattern over the years together with an increasing trend over the last two years. A higher increase in overdue loans (42.30%) than increase in equity (11.33%) resulted in an overdue loans amount almost equal to equity with the year-end ratio of 100.60%, restraining the asset quality and raising the risk level. As stated before, it should be also noted that the Company envisages an approximately 65% collection capability regarding overdue loans in the mid-term and an increase in transaction volume in 2H2015 through improvement studies in branch network, IT infrastructure and synergy with the bank. Restrained Pre-tax Profit Generation Capacity of Total Income The Company’s average total assets and equity displayed an above sector pattern regarding income generation capacity through an above average interest margin. However, restrained pre-tax profit generation capability of total income due to operating and financial expenses exceeding sector figure showed a continuously below sector trend over the years and deteriorated in the last year via increasing provisions, suppressing profitability figures. Below Sector Average Trend in Standard Ratio Although the Company equity level meets the legal requirements through a Company Standard Ratio (equity to total assets) of 13.72% against the minimum legal requirement of 3%, its share in total resources remained below the sector figures over the last five years and last year sector figure of 18.70% in parallel with the common characteristic of comparatively low equity level of bank affiliated non-banking financial institutions. Moreover, the ratio of equity to total resources exhibited a below average
trend and stayed behind the sector figure of 23.01% with a 2014 year-end value of 15.90%. On the other hand, the Company’s equity exceeded its paid-capital in 2013 for the first time since 2006 and maintained its improvement.
Volatility Potential on Future Profitability Figures The Company’s net other operating income mainly composed of FX gains and provisions no longer required exhibited remarkable increases over the last two years and held a higher share than net interest and commissions in total income dispersion for the first time. The Company ratios of foreign exchange position to total assets and equity were 16.76% and 122.22%, respectively, as of FYE2014. The remarkably above sector average ratios along with a net FX gain of TRY 9.13mn and income from overdue loans of TRY 4.29mn in 2014 contributed to profitability but generated volatility potential in future profitability figures.
Challenging Market Conditions that might Pressure Profit Margins
Ongoing tension in international and domestic politics, unrest in some bordering countries, decrease in investor risk appetite along with downward trend in the consumer confidence index and capital outflow potential from Emerging Countries due to existing FED monetary policies depressed Turkey’s economic growth and created the potential for diminishing profit margins through decreasing debt-services capabilities of the real sector and increasing NPLs in the sector as a whole.
With respect to the above mentioned factors, JCR Eurasia Rating has affirmed the Long Term International Foreign Currency and Local Currency Ratings as ‘BBB-’, the same as
that of the Sovereign Ratings of the Republic of Turkey, and revised the Long Term National Local Ratings as ‘BBB+ (Trk)’ in JCR Eurasia Rating’s notation system, which denotes a satisfactory investment grade. On the other hand, it is expected that the initiated studies regarding the reduction of risk concentration through the strategy aiming to expand its asset base through numerous small scale transactions at SME level, the expansion of the branch network, beefing up of the IT infrastructure for improving operational efficiency and increasing bank synergy together with probable future collections from overdue loans will positively contribute to the Company’s future trading volume and profitability indicators.
2. Outlook
A ‘Stable’ outlook has been assigned for the Company’s short and long term national grades considering the favourable or unfavourable effects on the Company’s current situation and development trend of the following issues: regarding profitability & performance, capital adequacy, liquidity and asset quality including continuously above average interest margin maintaining income generation capacity, Şekerbank weighted shareholding structure contributing to liquidity, funding costs, clientele and network, long-term weighted debt structure unlike the sector composition together with continuing debt instrument issuances, comparatively high collateral level and collection capability of overdue loans, high compliance with corporate governance principles contributing to transparency level, descending market share through remarkably below sector year-end negative first quarter
asset growths along with ascending sponsor support level of the sector, decreased profitability ratios and continuously below sector pre-tax profit generation capacity of total income due to ongoing above sector operational and financial expenses and increasing provisions, below sector average standard ratio despite meeting legal requirements, deterioration in above sector NPL ratio along with comparatively high collection capability, overdue loans exceeding equity, increasing share of other operating income in total income generating volatility potential on future profitability figures and highly competitive and challenging market conditions. Additionally, JCR Eurasia Rating has affirmed and assigned ‘Stable’ outlooks on the International Long and Short Term Local Currency Rating perspectives, respectively, of Şeker Leasing which are the Sovereign Ratings’ Outlooks of the Republic of Turkey. The main driving forces that can call forth a revision in the current outlook status include Company related issues

LEASING
Şeker Finansal Kiralama A.Ş. and Its Subsidiary 4
affecting asset quality, liability profile and profitability, along with Turkey’s sovereign rating which is highly responsive to domestic and foreign political and economic uncertainties, tensions and developments.
3. Sponsor Support & Stand Alone Assessment
Sponsor support grades and their risk identifications and estimations reflect the financial and non-financial state and expected support of the Company’s major controlling shareholder, Şekerbank T.A.Ş., and the sector’s support level by public authorities. It is reasoned that Şeker Leasing’s main shareholder, as a mid-scale commercial bank in Turkey with a domestic network of 312 branches, has the adequate power,
experience and equipment to provide financial and efficient operational support as and when required. In this regard, together with the sector’s support level falling behind the banking sector despite the improvements made through recent legislative regulations and implementations, JCR Eurasia Rating has affirmed the Sponsor Support Grade of ‘2’ reflecting the financial and non-financial states and expected support by the shareholders. The Stand-Alone Grade has been constituted with respect to the Company’s asset size and quality, equity structure, market shares, growth rates, risk management practices, operating history, track records and the development of existing risks in the markets and business environment. Within this context, the Stand Alone Grade of the Company has been affirmed as ‘AB’ in JCR Eurasia Rating’s notation system, with the opinion that Şeker Leasing has the level of strong experience and facilities to manage the incurred risks on its balance sheet without any assistance from its shareholders provided that it improves its market efficiency and pre-tax profit generation capacity.
4. Company Profile
a) History & Activities
Şeker Leasing was founded by Şekerbank in 1997 and has been publicly traded since 2004 under the code SEKFK. It was one of five leasing companies listed on the BIST national market and had a 15.80% free float of its paid-capital of
TRY 45mn as of 1Q2015.
The Company offers leasing services of investment support for domestic and international assets and capital goods needed by SMEs via its headquarters and regional offices in Ankara, Izmir and Gaziantep and the widespread branches of Şekerbank T.A.Ş.. Machinery & equipment, tourism equipment and real estate held the major shares in the Company’s 2014 year-end leasing receivables dispersion based on commodity groups.
b) Organization & Employees
The Company’s organizational chart covers nine subunits and positions, five of which (credit, IT, operating and insurance, accounting and financing, support personnel) report to the financial and administrative affairs directorate, three (marketing, legal consultancy, financial crimes specialist) to the general manager and one (internal audit) directly to the Board.
Şeker Leasing’s Board has 7 members, including one executive and two independent members. Audit, Corporate Governance and Early Detection of Risk & Credit committees have been established under the authority of the Board. The actual labor force of the headquarters and regional offices involved 30 people as of March 31, 2015.
c) Shareholders, Subsidiaries & Affiliates The following table provides the Company’s 1Q2015 shareholder structure and realized changes over time. The Company’s paid capital amount had no change since 2009. The Company’s majority shareholder was Şekerbank T.A.Ş, with an issued capital of TRY 1.08bn and a solo asset size of
TRY 21.55bn as of 1Q2015.
ŞekerBank was established in 1953 as Pancar Kooperatifleri Bankası A.Ş. and changed its trade name to Şekerbank in 1956. The bank is a medium-scale bank operating in retail and private banking as well as corporate, commercial and small business banking through its 312 domestic branches as of 1Q2015. Bank shares have been publicly traded since 1997 with a free float rate of 33.76%. The Company has a subsidiary with a 99% stake, Sekar Oto Kiralama Turizm Kargo Taşımacılık Hizmeti ve Tic. Ltd.Şti. (Sekar). Sekar, consolidated in the Company’s audit reports, had a TRY 17.78mn assets size as of 1Q2015 and offers long term car rental services primarily to Şekerbank T.A.Ş.
d) Corporate Governance As a publicly traded company, Şeker Leasing had a comparatively high compliance to Corporate Governance
Principles. The Board of Şeker Leasing consists of 7 members, one of which is executive and two independent. Audit, Corporate Governance and Early Detection of Risk & Credit committees have been established under the authority of the Board. Company shares are traded on the BIST and there is no limitation on share transfers. The Company’s web site provides sufficient information and disclosed documentation in terms of transparency, such as, the shareholder structure, audit reports, annual reports, articles of association, general assembly meeting documents, disclosure policy, mission/vision, code of ethics, trade register documents and newspaper, internal directive, privileged shares and prospectuses and circulars related to bond issues. Moreover, the Company had a Shareholder Relations Unit established within the scope of compliance to corporate governance principles reporting directly to the Board. On the other hand, some of the Company shares have privileges written into the articles of association, such as the right to nominate the majority of the board. Additionally, the Company’s remuneration policy regarding board members
1Q2015 2014 2013 2012
Şekerbank T.A.Ş. 54.13 54.13 54.13 50.95
Şekerbank T.A.S. Personel Munzam Sosyal Güvenlik ve
Yardımlaşma Vakfı15.89 15.89 15.89 15.89
Şekerbank T.A.S. Personeli Sosyal Güvenlik ve
Yardımlaşma Sandığı Vakfı8.11 8.11 8.11 8.11
Seker Yatırım Menkul Değerler A.Ş. 6.07 7.01 3.96 3.85
SS. Eskişehir Pancar Ekicileri Kooperatifi - - - 1.65
Public 15.80 14.86 17.91 19.55
TOTAL 100.00 100.00 100.00 100.00
Paid Capital (TRY/000)
Şeker Finanasal Kiralama A.Ş.
Shareholders Structure
Share %
45,000

LEASING
Şeker Finansal Kiralama A.Ş. and Its Subsidiary 5
and executive managers has not been disclosed and the dividend policy and board members’ and executive managers’ CVs are not published on the Company web site. Within the context of social responsibility, the Company contributes to the social responsibility projects carried out in the Group along with a need of greater contribution to the community through educational, charitable, cultural, social and sporting events.
e) The Company & Its Group Strategies The Company aims to grow its portfolio by reaching out to companies in the SME scale which holds an important place in the sector through using distribution channels of Şekerbank
along with a prudential and efficient lending policy. Moreover, the strong and dynamic structure, solution-oriented quality service approach and widespread service network are the other main issues on which the Company has placed emphasis.
5. Sector Overview & Operational Environment
The Leasing Sector facilitates the mid or long-term acquisition of properties such as plants and office buildings, production machines, work and construction vehicles, land, sea and air vehicles. The Sector acts as a supplement to the Banking Sector and works under the supervision and audit of the Banking Regulation and Supervision Agency (BRSA).
THE KEY INDICATORS OF TURKISH FINANCIAL LEASING SECTOR
TRY (000.000) 1Q2015 2014 2013 2012 2011 2010 2009
Asset Size-TRY 35,209 32,584 28,478 20,260 18,604 15,749 14,641
Asset Size-USD 13,472 14,051 13,309 11,398 9,849 10,459 9,721
Equity-TRY 6,320 6,094 5,351 4,604 4,177 3,853 3,494
P/L-TRY 238 526 457 443 510 466 583
ROAA % 0.89 2.19 2.33 2.98 3.40 3.45 1.92
ROAE % 4.88 11.69 11.40 13.17 14.54 14.26 9.40
NPL Ratio% 6.18 6.71 6.82 8.00 8.57 12.20 12.25
Equity / T. Sources 17.95 18.70 18.79 22.73 22.45 24.47 23.87
Following the most recent regulations, improvements have been seen in the Sector’s comparative structure, quality and standardization of financial reporting, transparency and challenge equality, the introduction of new leasing products may be highly beneficial for the Sector’s transaction volume. In addition, the increasing attention of global companies in the Leasing Sector serves as an essential driver behind the expansion of the Sector’s activity field and operational advantages.
Leasing applications in Turkey began under the regulation and audit of the Undersecretariat of the Treasury in 1983 and the first leasing company was established in 1986. With the Banking Law of 2005, supervision of the Leasing Sector was transferred to the BRSA. According to BRSA data, there were 30 leasing companies in the Leasing Sector as of 2014. All headquarters are located in Istanbul. The Leasing Sector is considered a supplement to the Banking Sector in both Turkey and globally. The Turkish Leasing Sector held a small portion of the overall financial system in Turkey. Since 2006, around 60 leasing corporations’ official authorisations were cancelled
due to violations of BRSA regulations, mergers or through their own discretion. The Sector showed a rapid improvement since its inception until the tax regulations materialized in the final days of 2008. Penetration rates, defined as the share of total leases excluding immovable assets among fixed capital investments of private sector, are quite low in the Leasing Sector in Turkey. While the leasing rate of total fixed capital investments is about 15-20% in industrially improved countries, this rate stands at about 2% in Turkey. However, Turkey can be considered to have great potential for improvement.
Leasing service provides assistance and financing opportunities to companies regarding efficiency and cost management issues by making the leasing of production and investment instruments instead of buying. Leasing is a financing method that gives the lessee the operating rights of a property for a previously determined rent, while the lessor retains the ownership rights and transfers the ownership of the property at a clearly stated value at the end of the lease period. With this method, companies have essential financial advantages and use their capitals much more effectively. Asset size of the Leasing Companies in Turkey was TRY32.5bn and equity TRY6.09bn as of FYE2014. The Sector showed a positive development until 2008 before declining by 14.23% due to new tax regulations in 2009 and regaining its expansion. Between 2004 and 2014 the Sector had a cumulative asset growth rate of 386.32%.
The risk concentration of Leasing Companies focused on production such as textiles and the metal industry with a rate of 45.28% as of 2014. In terms of service sectors, the primary concentration occurred in construction, transportation, storage, communication, wholesale and retail, commercial vehicle and tourism sector, respectively. Leasing receivables constituted the highest portion of Sector assets with a share of 90.92% while short term credits constituted the highest part of the resources at a rate of 69.19%. The Sector addressed funding needs mostly with short term credits provided from banks and the shortage in diversity in funding sources was the main characteristic of the sector accordingly. The total Sector equity was 18.70% of total resources and cannot associate with asset growth.
64%
37% 25% -14%
7% 18% 9%
40% 15% -9%
49%
105%
156%
119% 135%
178%
202%
323%
386%
-100%
0%
100%
200%
300%
400%
500%
2005 2006 2007 2008 2009 2010 2011 2012 2013 2014
Turkish Leasing Sector Asset Growth Rate
Annual Cumulative
LEASING
Şeker Finansal Kiralama A.Ş. and Its Subsidiary 6
The Sector’s nonperforming receivables ratio (NPL) was 6.68% as of 2014, three times that of the Banking Sector. The ratio of nonperforming receivables to total equity of 34.78% increased the risk perception in that field and suppressed asset quality.
Profitability indicators of the Leasing Sector were lower than those of the Banking Sector in 2014. ROA (av.) and ROE (av) of the Banking Sector were 1.69% and 14.82%, respectively, while they stood at 2.19% and 11.76%, respectively, in the Leasing Sector. Likewise, interest coverage ratio and net or gross profit margin ratios were also lower than those of the Banking Sector. However, the equity to total assets ratio was
higher in the Leasing Sector at 18.70%, compared to 11.64% in the Banking Sector in 2014. Asset and transaction volume concentration rates were very high amongst the 30 leasing companies. Companies which contain banks in their shareholder structure constituted the major concentration in the Sector.
6. Financial Foundation
a) Financial Indicators & Performance
Indices Relating to Size The table below shows the percent dispersion of the activities of Şeker Leasing and its consolidated subsidiary (Sekar) in terms of assets, liabilities and profit/loss. The Contribution of leasing activities, with above 95% shares in assets and liabilities, in P/L improved to 95.67% in 2014 from 81.16% in 2013.
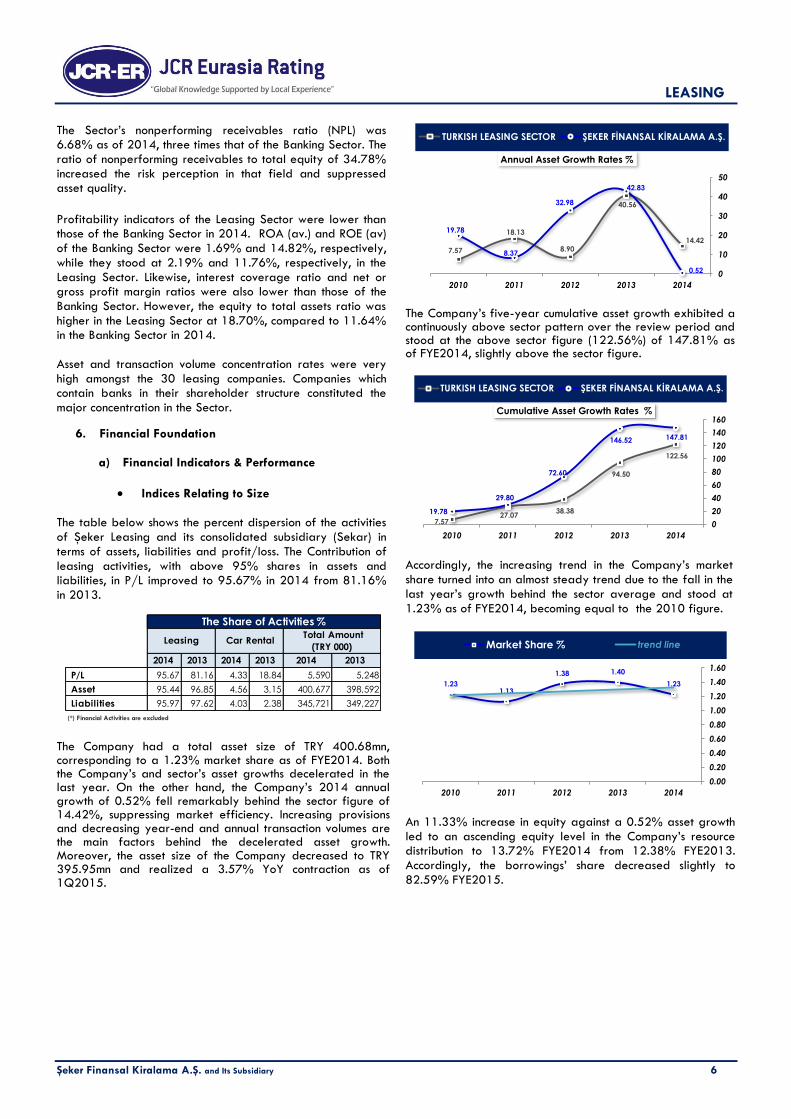
The Company had a total asset size of TRY 400.68mn, corresponding to a 1.23% market share as of FYE2014. Both the Company’s and sector’s asset growths decelerated in the last year. On the other hand, the Company’s 2014 annual growth of 0.52% fell remarkably behind the sector figure of 14.42%, suppressing market efficiency. Increasing provisions and decreasing year-end and annual transaction volumes are the main factors behind the decelerated asset growth. Moreover, the asset size of the Company decreased to TRY 395.95mn and realized a 3.57% YoY contraction as of 1Q2015.
The Company’s five-year cumulative asset growth exhibited a continuously above sector pattern over the review period and stood at the above sector figure (122.56%) of 147.81% as of FYE2014, slightly above the sector figure.
Accordingly, the increasing trend in the Company’s market share turned into an almost steady trend due to the fall in the last year’s growth behind the sector average and stood at 1.23% as of FYE2014, becoming equal to the 2010 figure.
An 11.33% increase in equity against a 0.52% asset growth led to an ascending equity level in the Company’s resource distribution to 13.72% FYE2014 from 12.38% FYE2013. Accordingly, the borrowings’ share decreased slightly to 82.59% FYE2015.
2014 2013 2014 2013 2014 2013
P/L 95.67 81.16 4.33 18.84 5,590 5,248
Asset 95.44 96.85 4.56 3.15 400,677 398,592
Liabilities 95.97 97.62 4.03 2.38 345,721 349,227
(*) Financial Activities are excluded
The Share of Activities %
Leasing Car Rental Total Amount
(TRY 000)
14.42
40.56
8.90
18.13
7.57
0.52
42.83
32.98
8.37
19.78
0
10
20
30
40
50
20142013201220112010
Annual Asset Growth Rates %
TURKISH LEASING SECTOR ŞEKER FİNANSAL KİRALAMA A.Ş.
122.56
94.50
38.38 27.07
7.57
147.81 146.52
72.60
29.80
19.78
0
20
40
60
80
100
120
140
160
20142013201220112010
Cumulative Asset Growth Rates %
TURKISH LEASING SECTOR ŞEKER FİNANSAL KİRALAMA A.Ş.
1.23
1.401.38
1.131.23
0.00
0.20
0.40
0.60
0.80
1.00
1.20
1.40
1.60
20142013201220112010
Market Share % trend line

LEASING
Şeker Finansal Kiralama A.Ş. and Its Subsidiary 7
Indices Relating to Profitability The Company’s profitability ratios ROAA and ROAE both exhibited an improving trend between 2010 and 2013 despite their mostly below sector average standings, with the exception of the ROAE in 2013. On the other hand, the stated ratios materialised a rapid decrease in the last year, falling below the 2010 figures, mainly due to provisions for impaired receivables amounting to TRY 12.54mn in 2014. Accordingly, a 50.64% decrease in pre-tax profit against 17.94% and 11.56% increases in average assets and equity, respectively, resulted in a remarkable deterioration in the Company’s 2014 year-end ROAA and ROAE ratios with the rates of 0.80% and 6.13%, respectively.
Both the Company’s and sector’s interest margin deteriorated in the last year due to increasing interest expenses for costly liabilities. The interest margin of Şeker Leasing progressively
stood above the sector averages over the last five years and 3.69% (sector average 2.71%) as of FYE2014. Although both the Company interest rates for earning assets and costly liabilities stood at above sector averages, the higher spread for earning assets led to the above sector interest margin in 2014.
The Company’s total income was composed of 46.11% net interest and commission income and 52.81% net other operating income as of FYE2014. Other operating income which was mainly composed of gains on FX positions and provisions no longer required exhibited an ongoing increasing trend over the review period and realized a higher share than net interest and commission income for the first time in 2014, generating volatility potential on future total income level.
The Company ratio of ‘financial expenses to interest and net commissions’ displayed a continuously above sector pattern over the review period, suppressing the profit generation capacity. By the end of 2014, a 40.04% increase in financial expenses and a 6.64% decrease in net interest service income resulted in an increase in the Company’s stated ratio from 57.44% to 66.94%, in line with the sector trend.
The share of the operating expenses in the Company’s total income exhibited an ongoing above sector average pattern over the years. Moreover, while the sector figure improved, the Company figure increased to 43.81% as of FYE2014, almost two fold of the sector figure of 22.83%, suppressing profit generation capacity.
2.543.852.862.284.58
82.5982.9181.0678.1176.81
13.7212.3815.8219.2818.33
0%
20%
40%
60%
80%
100%
20142013201220112010
Resource Distribution %
Equity Other Borrowing Payables
0.801.911.811.841.19
2.192.332.983.403.45
6.13
13.87
10.489.79
6.37
11.6911.40
13.1714.5414.26
0
2
4
6
8
10
12
14
16
20142013201220112010
ROAA & ROAE Comparison %
ROAA ŞEKER FİNANSAL KİRALAMA A.Ş.
ROAA TURKISH LEASING SECTOR
ROAE ŞEKER FİNANSAL KİRALAMA A.Ş.
ROAE TURKISH LEASING SECTOR
7.76
6.56 6.68 6.78 6.63
11.4611.04
12.1312.2912.72
3.69 4.47
5.45 5.50 6.09
2.71 3.25 3.05 3.42
4.47
0
2
4
6
8
10
12
14
20142013201220112010
Interest Margin %
Interest Rate for Costly Liabilities (avg.) %
Interest Rate for Earning Assets (avg.) %
Margin %
Sector Margin %
46.11
59.33
76.2877.45
86.56
52.81
36.27
20.0517.176.99 0
20
40
60
80
100
20142013201220112010
Total Income Distribution %
Net Interest and Commission
Net Other Operating Income
50.60
43.9646.50
42.46
35.37
66.94
57.4452.4051.16
48.59
0
10
20
30
40
50
60
70
80
20142013201220112010
Financial Expenses/Interest and Net Commission %
TURKISH LEASING SECTOR ŞEKER FİNANSAL KİRALAMA A.Ş.
22.8326.27
19.37
39.21
26.52
43.8139.42
47.6344.1044.70
0
10
20
30
40
50
60
20142013201220112010
Total Operating Expenses/Total Income %
TURKISH LEASING SECTOR ŞEKER FİNANSAL KİRALAMA A.Ş.
LEASING
Şeker Finansal Kiralama A.Ş. and Its Subsidiary 8
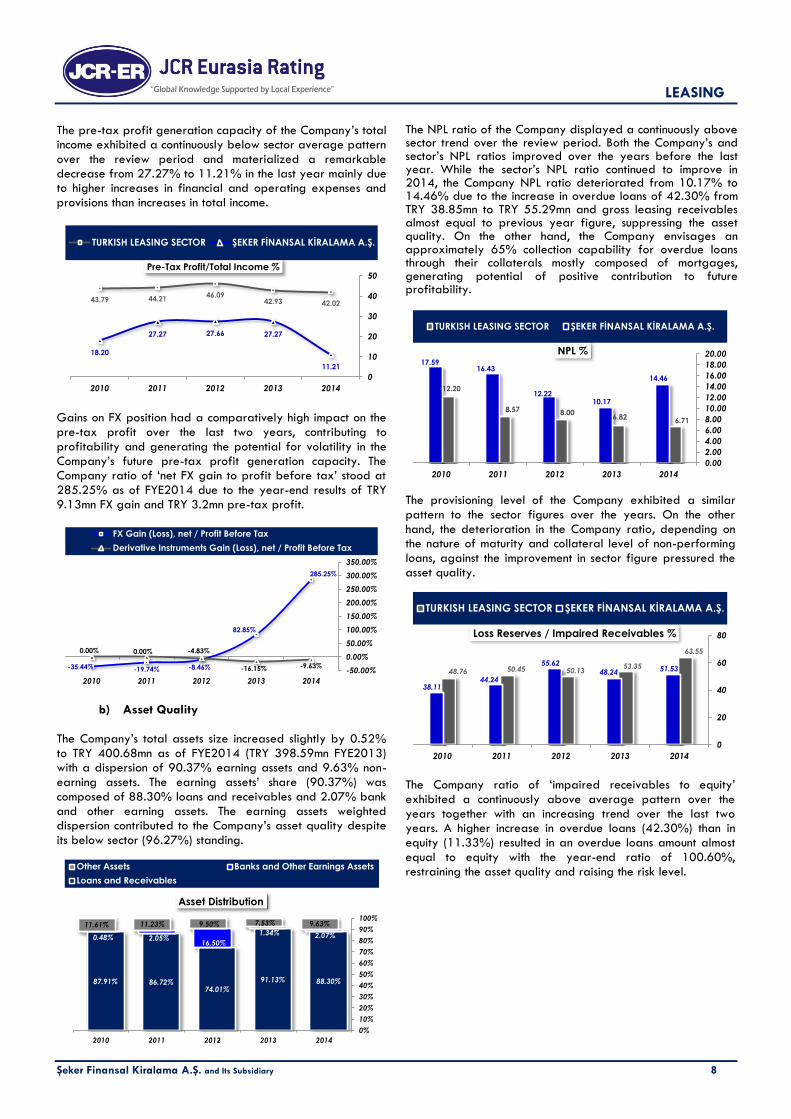
The pre-tax profit generation capacity of the Company’s total income exhibited a continuously below sector average pattern over the review period and materialized a remarkable decrease from 27.27% to 11.21% in the last year mainly due to higher increases in financial and operating expenses and provisions than increases in total income.
Gains on FX position had a comparatively high impact on the pre-tax profit over the last two years, contributing to profitability and generating the potential for volatility in the Company’s future pre-tax profit generation capacity. The Company ratio of ‘net FX gain to profit before tax’ stood at 285.25% as of FYE2014 due to the year-end results of TRY 9.13mn FX gain and TRY 3.2mn pre-tax profit.
b) Asset Quality The Company’s total assets size increased slightly by 0.52% to TRY 400.68mn as of FYE2014 (TRY 398.59mn FYE2013) with a dispersion of 90.37% earning assets and 9.63% non-earning assets. The earning assets’ share (90.37%) was composed of 88.30% loans and receivables and 2.07% bank and other earning assets. The earning assets weighted dispersion contributed to the Company’s asset quality despite its below sector (96.27%) standing.
The NPL ratio of the Company displayed a continuously above sector trend over the review period. Both the Company’s and sector’s NPL ratios improved over the years before the last year. While the sector’s NPL ratio continued to improve in 2014, the Company NPL ratio deteriorated from 10.17% to 14.46% due to the increase in overdue loans of 42.30% from TRY 38.85mn to TRY 55.29mn and gross leasing receivables almost equal to previous year figure, suppressing the asset quality. On the other hand, the Company envisages an approximately 65% collection capability for overdue loans through their collaterals mostly composed of mortgages, generating potential of positive contribution to future profitability.
The provisioning level of the Company exhibited a similar pattern to the sector figures over the years. On the other hand, the deterioration in the Company ratio, depending on the nature of maturity and collateral level of non-performing loans, against the improvement in sector figure pressured the asset quality.
The Company ratio of ‘impaired receivables to equity’ exhibited a continuously above average pattern over the years together with an increasing trend over the last two years. A higher increase in overdue loans (42.30%) than in equity (11.33%) resulted in an overdue loans amount almost equal to equity with the year-end ratio of 100.60%, restraining the asset quality and raising the risk level.
42.0242.9346.09
44.2143.79
11.21
27.2727.6627.27
18.20
0
10
20
30
40
50
20142013201220112010
Pre-Tax Profit/Total Income %
TURKISH LEASING SECTOR ŞEKER FİNANSAL KİRALAMA A.Ş.
285.25%
82.85%
-8.46%-19.74%-35.44% -9.63%-16.15%
-4.83%0.00%0.00%
-50.00%
0.00%
50.00%
100.00%
150.00%
200.00%
250.00%
300.00%
350.00%
20142013201220112010
FX Gain (Loss), net / Profit Before Tax
Derivative Instruments Gain (Loss), net / Profit Before Tax
88.30%91.13%
74.01%86.72%87.91%
2.07%1.34%
16.50%2.05%0.48%
9.63%7.53%9.50%11.23%11.61%
0%
10%
20%
30%
40%
50%
60%
70%
80%
90%
100%
20142013201220112010
Asset Distribution
Other Assets Banks and Other Earnings Assets
Loans and Receivables
6.71 6.82
8.00 8.57
12.20
14.46
10.17 12.22
16.43 17.59
0.00
2.00
4.00
6.00
8.00
10.00
12.00
14.00
16.00
18.00
20.00
20142013201220112010
NPL %
TURKISH LEASING SECTOR ŞEKER FİNANSAL KİRALAMA A.Ş.
63.55
53.35 50.13 50.45 48.76 51.53 48.24
55.62
44.24 38.11
0
20
40
60
80
20142013201220112010
Loss Reserves / Impaired Receivables %
TURKISH LEASING SECTOR ŞEKER FİNANSAL KİRALAMA A.Ş.

LEASING
Şeker Finansal Kiralama A.Ş. and Its Subsidiary 9
Leasing companies obtain sufficient collateral where
appropriate while commodities subject to leasing transactions form the basic guarantee of the Company’s undertaken risk. The Company’s ‘collateral-to-total receivables’ ratio showed an on-going above sector trend over the review period and stood at 264.12% as of FYE2014, almost four fold that of the sector figure, lessening the adverse effects of above sector NPL on asset quality. The Company’s collaterals were composed of collateral bills, mortgages, pledges and guarantee letters.
The share of provisions in total income maintained its increasing trend starting in 2013 and stood at 43.90% as of FYE2014. A 82.42% increase in provisions along with a 20.11% rise in total income led to deterioration in the stated ratio, restraining the profit generation capacity.
c) Funding & Adequacy of Capital BRSA regulations cover a provision regarding the equity ratio (standard ratio) stating that the ratio of the non-banking financial company’s equity to total assets should be at least 3%. The Company materialized a below sector average (18.70%) standard ratio of 13.72% as of FYE2014. The Company’s standard ratio increased from 12.38% to 13.72% in 2014 due to a 11.33% increase in equity against a 0.52%
increase in total assets, meeting the legal requirement but posing a higher risk level than that of the sector figure.
The below sector average equity level or the comparatively high leverage ratio, common characteristics of bank-related companies stemming from their shareholding structure and relatively low cost funding opportunities, also held true for the Company. The Company’s equity to total resources ratio exhibited an ongoing below sector pattern along with an improvement in the last year due to increasing equity and almost equal level of total resources with the previous year figure.
Although the short-term weighted borrowing structure is a common characteristic of the sector, the Company’s ratio of ‘short-term borrowings to total assets’ showed a continuously below sector pattern over the years and turned into a long-term weighted configuration in 2013 through the bond
issuances starting in 2012. Although the stated ratio increased in the last year, it maintained a long-term weighted borrowing structure with a year-end short-term borrowing to total assets ratio of 44.61%, relieving the liquidity management and lowering risk level.
34.78 34.16 32.34 33.90 38.62
100.60
78.70
61.35
79.69
90.45
0
20
40
60
80
100
120
20142013201220112010
Impaired Receivables / Equity %
TURKISH LEASING SECTOR ŞEKER FİNANSAL KİRALAMA A.Ş.
66.6960.4366.1470.7386.01
264.12241.44
272.94253.35
223.59
0.00
50.00
100.00
150.00
200.00
250.00
300.00
20122011201020092008
Collaterals / Total Receivables %
TURKISH LEASING SECTOR ŞEKER FİNANSAL KİRALAMA A.Ş.
43.90%
28.91%
21.03%23.26%
30.65%
16.78%
0%
10%
20%
30%
40%
50%
201420132012201120102009
Provisions / Total Income
3.00
10.72
9.38
12.82
16.2815.3316.29
13.72 12.38
15.82
19.28 18.33 19.29
0
5
10
15
20
25
201420132012201120102009
Min. Standard Ratio (Equity / Total Assets) %
Free Equity / Total Assets Ratio %
Realized Standart Ratio (Equity / Total Assets) %
23.01 23.14
29.41 28.96
32.39 31.35
15.90 14.14
18.79
23.88 22.44
23.89
0.00
5.00
10.00
15.00
20.00
25.00
30.00
35.00
201420132012201120102009
Equity / Total Resources %
TURKISH LEASING SECTOR ŞEKER FİNANSAL KİRALAMA A.Ş.
70.3770.6469.7373.3072.26
44.61
29.66
39.05
53.6561.75
0.00
20.00
40.00
60.00
80.00
20142013201220112010
Short Term Borrowings / Total Assets (%)
TURKISH LEASING SECTOR ŞEKER FİNANSAL KİRALAMA A.Ş.

LEASING
Şeker Finansal Kiralama A.Ş. and Its Subsidiary 10
7. Risk Profiles & Management
a) Risk Management Organization & Its Function – General Informatıon
The Company is exposed to credit, liquidity, market and operational risks derived from its leasing activities. The risk management organization and practices of the Company have not been changed since the last year. The Treasury and Finance departments of the Group are responsible for providing steady access to domestic and foreign financial markets and monitoring and management of financial risk exposures associated with the activities of the Group through intra-Group risk reports. The Company is audited by third
party institutions in the matters of independent audit, information technologies and tax legislation. Moreover, the Company is also supervised by the Inspection Board of major shareholder, Şekerbank T.A.Ş., and its Internal Control Department. The Company reports to risk management committee on monthly basis.
b) Credit Risk
The Credit department, early detection of risk & credit committee and Board of Directors of Şeker Leasing are responsible for the follow-up of lease receivables. All lending decisions are approved within the credit committee or the Board. In addition, the Company has an internal scoring analysis system. According to their results, the Company’s risk levels of leasing receivables was concentrated in the “A-” (well) scoring categories at a rate of 20.28% as of 1Q2015. Moreover, the concentration in the “A+” (excellent) stood at 14.34%. In all, 60.29% of the leasing receivables were in the scoring categories of ‘B+’ (satisfactory) or higher. The Company manages its credit risk by limiting transactions regarding some specific sectors as well as the continuous control and reevaluation of debtor credibility. Additionally, the Company also tries to take into account the sector and regional concentration in managing its credit risk. Moreover, the Company obtains additional security for its receivables if possible. The Company had a collateral amount of TRY 1.2bn
against its TRY 382.27mn gross receivables as of FYE2014. Accordingly, the Company’s ‘collateral-to-total receivables’ ratio realized a value of 264.12% as of FYE2014, almost four fold the sector average of approximately 66%. The Company’s leasing receivables are spread across diverse sectors. The Company had a sector dispersion of 18.07% in tourism, 14.24% in construction, 12.49% in machinery and equipment, 11.66% in mining, metals & chemistry and 11.45% in finance as of 1Q2015. The figures in all brackets stayed within the acceptable level of national reference indices.
The Company’s top 10 customers, including two group companies, composed 39.46% (47.41% and 43.02% as of FYE2013 and FYE2012, respectively) of the total receivables portfolio as of FYE2014, 64.24% (69.06% FYE2013) the top 20 and 86.79% (85.17% FYE2013) the top 50. The figures in all brackets stayed above the acceptable level of national reference indices, pressuring asset quality.
c) Market Risk The Company is exposed to interest rate risk due to its financial assets and liabilities mainly composed of leasing receivables, borrowings and bond issuances. The Company had no floating interest rated financial assets as of FYE2014. The Company tries to minimize the interest rate risk through efforts to ensure an appropriate mix of fixed and floating rated payables. While all of the Company’s financial assets were fixed rated, 32.15% of the Company financial liabilities were floating rated as of FYE2014. Moreover, the Company’s financial statement had a variance range of (+/-) TRY 631k (FYE2013: (+/-) TRY 23k) in the case of 100bp increase or decrease in interest rates as of FYE2014.
The Company is exposed to foreign currency risk due to assets and liabilities denominated in foreign currency and had a net FX position of TRY 67.17mn as of FYE2014 (FYE2013: TRY 43.25mn). Accordingly, the Company’s financial statement had an increasing variance range of (+/-) TRY 6.72mn in the case of increases or decreases of 10% (the administrative expectation of possible change in foreign exchange rates) in exchange rates as of FYE2014 (FYE2013: (+/-) TRY 4.35mn).
d) Liquidity Risk The funding unit of the Group reports expected cash flows on a daily basis. Liquidity management is performed through coordination with the asset and liability committee (ALCO) in monthly meetings. The Company manages its liquidity risk by maintaining adequate funding and borrowing sources through regular following of forecast and actual cash flow and matching efforts of assets and liabilities. Within this scope, funding through bond issuances continues. As of June 1, 2015, cash credit lines worth TRY 359.31mn were extended to Şeker Leasing by 20 (in previous report 18) different financial institutions and 37.08% of this total line was utilized, with a cash free line amounting to TRY 226.06mn. Additionally, a TRY 27.5mn borrowing/lending limit was extended to the Company to transact in the Takasbank Money Market (TPP). Moreover, there 9 cases with the total amount TRY 1.16mn that may affect the Company’s future financial position.
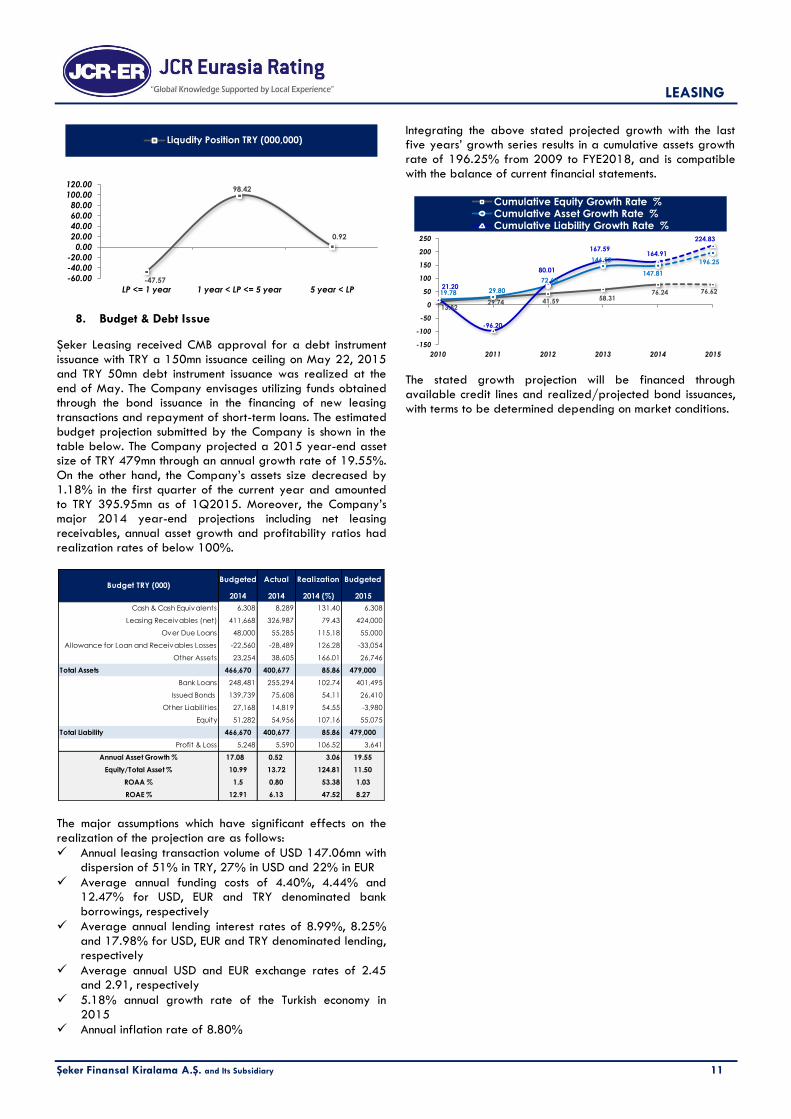
The Leasing Sector is exposed to maturity mismatch risk due to the long-term maturity structure of lease receivables against the short-term borrowing structure. By the end of 2014, while the Company’s lease receivables had an average maturity of 842 days, its average borrowings term was 281 days. Accordingly, the Company had a short-term funding need of TRY 47.57mn as of 1Q2015. Correspondingly, CMB approval for a debt instrument issuance with a TRY 150mn issuance ceiling was received on May 22, 2015 and a TRY 50mn debt instrument issuance was realized at the end of May.
LEASING
Şeker Finansal Kiralama A.Ş. and Its Subsidiary 11
8. Budget & Debt Issue
Şeker Leasing received CMB approval for a debt instrument issuance with TRY a 150mn issuance ceiling on May 22, 2015 and TRY 50mn debt instrument issuance was realized at the end of May. The Company envisages utilizing funds obtained through the bond issuance in the financing of new leasing transactions and repayment of short-term loans. The estimated budget projection submitted by the Company is shown in the table below. The Company projected a 2015 year-end asset size of TRY 479mn through an annual growth rate of 19.55%. On the other hand, the Company’s assets size decreased by 1.18% in the first quarter of the current year and amounted to TRY 395.95mn as of 1Q2015. Moreover, the Company’s major 2014 year-end projections including net leasing receivables, annual asset growth and profitability ratios had realization rates of below 100%.
The major assumptions which have significant effects on the realization of the projection are as follows:
Annual leasing transaction volume of USD 147.06mn with dispersion of 51% in TRY, 27% in USD and 22% in EUR
Average annual funding costs of 4.40%, 4.44% and 12.47% for USD, EUR and TRY denominated bank borrowings, respectively
Average annual lending interest rates of 8.99%, 8.25% and 17.98% for USD, EUR and TRY denominated lending, respectively
Average annual USD and EUR exchange rates of 2.45 and 2.91, respectively
5.18% annual growth rate of the Turkish economy in 2015
Annual inflation rate of 8.80%
Integrating the above stated projected growth with the last five years’ growth series results in a cumulative assets growth rate of 196.25% from 2009 to FYE2018, and is compatible with the balance of current financial statements.
The stated growth projection will be financed through available credit lines and realized/projected bond issuances, with terms to be determined depending on market conditions.
-47.57
98.42
0.92
-60.00
-40.00
-20.00
0.00
20.00
40.00
60.00
80.00
100.00
120.00
LP <= 1 year 1 year < LP <= 5 year 5 year < LP
Liqudity Position TRY (000,000)
Budgeted Actual Realization Budgeted
2014 2014 2014 (%) 2015
Cash & Cash Equivalents 6,308 8,289 131.40 6,308
Leasing Receivables (net) 411,668 326,987 79.43 424,000
Over Due Loans 48,000 55,285 115.18 55,000
Allowance for Loan and Receivables Losses -22,560 -28,489 126.28 -33,054
Other Assets 23,254 38,605 166.01 26,746
Total Assets 466,670 400,677 85.86 479,000
Bank Loans 248,481 255,294 102.74 401,495
Issued Bonds 139,739 75,608 54.11 26,410
Other Liabilit ies 27,168 14,819 54.55 -3,980
Equity 51,282 54,956 107.16 55,075
Total Liability 466,670 400,677 85.86 479,000
Profit & Loss 5,248 5,590 106.52 3,641
Annual Asset Growth % 17.08 0.52 3.06 19.55
Equity/Total Asset % 10.99 13.72 124.81 11.50
ROAA % 1.5 0.80 53.38 1.03
ROAE % 12.91 6.13 47.52 8.27
Budget TRY (000)
13.82 29.74 41.59 58.31
76.24 76.62 19.78 29.80
72.60
146.52
147.81
196.25
21.20
-96.20
80.01
167.59 164.91
224.83
-150
-100
-50
0
50
100
150
200
250
2010 2011 2012 2013 2014 2015
Cumulative Equity Growth Rate %Cumulative Asset Growth Rate %Cumulative Liability Growth Rate %

LEASING
Şeker Finansal Kiralama A.Ş. and Its Subsidiary 12
(Year-end) (Year-end) (Year-end) (Year-end) (Year-end) (Year-end) (Year-end) (Year-end) As % of As % of As % of
ŞEKER FİNANSAL KİRALAMA A.Ş. and ITS SUBSIDIARY 2014 2014 2014 2013 2013 2012 2012 2011 2014 2013 2012 2014 2013 2012
BALANCE SHEET - ASSET USD TRY TRY TRY TRY TRY TRY TRY Assets Assets Assets Growth Growth Growth
TRY (000) (Converted) (Original) (Average) (Original) (Average) (Original) (Average) (Original) (Original) (Original) (Original) Rate Rate Rate
A-TOTAL EARNING ASSETS (I+II+III) 156,139.55 362,072.00 365,330.50 368,589.00 310,579.50 252,570.00 219,433.50 186,297.00 90.37 92.47 90.50 -1.77 45.94 35.57
I- LOANS AND RECEIVABLES (net) 152,565.01 353,783.00 358,511.50 363,240.00 284,885.50 206,531.00 194,262.00 181,993.00 88.30 91.13 74.01 -2.60 75.88 13.48
a) Factoring Receivables 0.00 0.00 0.00 0.00 0.00 0.00 0.00 0.00 n.a n.a n.a n.a n.a n.a
b) Financing Loans 0.00 0.00 0.00 0.00 0.00 0.00 0.00 0.00 n.a n.a n.a n.a n.a n.a
c) Lease Receivables 141,009.53 326,987.00 335,059.50 343,132.00 268,821.50 194,511.00 179,263.00 164,015.00 81.61 86.09 69.70 -4.71 76.41 18.59
d) Over Due Loans 23,841.05 55,285.00 47,067.50 38,850.00 32,968.50 27,087.00 29,663.00 32,239.00 13.80 9.75 9.71 42.30 43.43 -15.98
e) Others 0.00 0.00 0.00 0.00 0.00 0.00 0.00 0.00 n.a n.a n.a n.a n.a n.a
f) Receivable from Customer due to Brokerage Activities 0.00 0.00 0.00 0.00 0.00 0.00 0.00 0.00 n.a n.a n.a n.a n.a n.a
g) Allowance for Loan and Receivables Losses (-) -12,285.57 -28,489.00 -23,615.50 -18,742.00 -16,904.50 -15,067.00 -14,664.00 -14,261.00 -7.11 -4.70 -5.40 52.01 24.39 5.65
II-BANKS AND OTHER EARNING ASSETS 3,574.54 8,289.00 6,819.00 5,349.00 25,694.00 46,039.00 25,171.50 4,304.00 2.07 1.34 16.50 54.96 -88.38 969.68
a) Banks 3,574.54 8,289.00 6,819.00 5,349.00 25,694.00 46,039.00 25,171.50 4,304.00 2.07 1.34 16.50 54.96 -88.38 969.68
b) Other 0.00 0.00 0.00 0.00 0.00 0.00 0.00 0.00 n.a n.a n.a n.a n.a n.a
c) Balance With Banks-Current Accounts 0.00 0.00 0.00 0.00 0.00 0.00 0.00 0.00 n.a n.a n.a n.a n.a n.a
III-SECURITIES AT FAIR VALUE THROUGH P/L 0.00 0.00 0.00 0.00 0.00 0.00 0.00 0.00 n.a n.a n.a n.a n.a n.a
a) Treasury Bills and Government Bonds 0.00 0.00 0.00 0.00 0.00 0.00 0.00 0.00 n.a n.a n.a n.a n.a n.a
b) Other Investment 0.00 0.00 0.00 0.00 0.00 0.00 0.00 0.00 n.a n.a n.a n.a n.a n.a
c) Repurchase Agreement 0.00 0.00 0.00 0.00 0.00 0.00 0.00 0.00 n.a n.a n.a n.a n.a n.a
B- INVESTMENTS IN ASSOCIATES (net)+EQUITY SHARE 0.00 0.00 0.00 0.00 0.00 0.00 0.00 0.00 n.a n.a n.a n.a n.a n.a
a) Investments in Associates (net) 0.00 0.00 0.00 0.00 0.00 0.00 0.00 0.00 n.a n.a n.a n.a n.a n.a
b) Equity Share 0.00 0.00 0.00 0.00 0.00 0.00 0.00 0.00 n.a n.a n.a n.a n.a n.a
C-NON-EARNING ASSETS 16,647.98 38,605.00 34,304.00 30,003.00 28,253.00 26,503.00 25,036.50 23,570.00 9.63 7.53 9.50 28.67 13.21 12.44
a) Cash and Cash Equivalents 0.00 0.00 0.00 0.00 0.00 0.00 0.00 0.00 n.a n.a n.a n.a n.a n.a
b) Financial Assets at Fair Value through P/L 0.00 0.00 0.00 0.00 0.00 0.00 0.00 0.00 n.a n.a n.a n.a n.a n.a
c) Asset Held For Sale And Discontinued Operations (net) 384.67 892.00 892.00 892.00 556.00 220.00 144.50 69.00 0.22 0.22 0.08 0.00 305.45 218.84
d) Other 16,263.31 37,713.00 33,412.00 29,111.00 27,697.00 26,283.00 24,892.00 23,501.00 9.41 7.30 9.42 29.55 10.76 11.84
- Intangible Assets 0.86 2.00 2.50 3.00 8.00 13.00 27.00 41.00 0.00 0.00 0.00 -33.33 -76.92 -68.29
- Property and Equipment 7,132.69 16,540.00 14,152.50 11,765.00 10,048.00 8,331.00 7,195.00 6,059.00 4.13 2.95 2.99 40.59 41.22 37.50
- Deferred Tax 6,407.78 14,859.00 13,691.50 12,524.00 12,987.50 13,451.00 13,946.00 14,441.00 3.71 3.14 4.82 18.64 -6.89 -6.86
- Other 2,721.98 6,312.00 5,565.50 4,819.00 4,653.50 4,488.00 3,724.00 2,960.00 1.58 1.21 1.61 30.98 7.38 51.62
TOTAL ASSETS 172,787.53 400,677.00 399,634.50 398,592.00 338,832.50 279,073.00 244,470.00 209,867.00 100.00 100.00 100.00 0.52 42.83 32.98

LEASING
Şeker Finansal Kiralama A.Ş. and Its Subsidiary 13
(Year-end) (Year-end) (Year-end) (Year-end) (Year-end) (Year-end) (Year-end) (Year-end) As % of As % of As % of
ŞEKER FİNANSAL KİRALAMA A.Ş. and ITS SUBSIDIARY 2014 2014 2014 2013 2013 2012 2012 2011 2014 2013 2012 2014 2013 2012
BALANCE SHEET-LIABILITIES+EQUITY USD TRY TRY TRY TRY TRY TRY TRY Assets Assets Assets Growth Growth Growth
TRY (000) (Converted) (Original) (Average) (Original) (Average) (Original) (Average) (Original) (Original) (Original) (Original) Rate Rate Rate
C- COST BEARING RESOURCES (I+II) 147,093.88 341,096.00 343,454.50 345,813.00 290,010.00 234,207.00 201,459.00 168,711.00 85.13 86.76 83.92 -1.36 47.65 38.82
I-PAYABLES 4,396.05 10,194.00 12,771.50 15,349.00 11,670.00 7,991.00 6,386.00 4,781.00 2.54 3.85 2.86 -33.59 92.08 67.14
a) Factoring Payables 0.00 0.00 0.00 0.00 0.00 0.00 0.00 0.00 n.a n.a n.a n.a n.a n.a
b) Lease Payables 0.00 0.00 0.00 0.00 0.00 0.00 0.00 0.00 n.a n.a n.a n.a n.a n.a
c) Other 4,396.05 10,194.00 12,771.50 15,349.00 11,670.00 7,991.00 6,386.00 4,781.00 2.54 3.85 2.86 -33.59 92.08 67.14
II-BORROWING FUNDING LOANS & OTHER 142,697.83 330,902.00 330,683.00 330,464.00 278,340.00 226,216.00 195,073.00 163,930.00 82.59 82.91 81.06 0.13 46.08 38.00
a) Fund Borrowed-Short Term 72,688.34 168,557.00 135,718.00 102,879.00 101,936.50 100,994.00 104,405.50 107,817.00 42.07 25.81 36.19 63.84 1.87 -6.33
b) Fund Borrowed-Long Term 37,404.37 86,737.00 98,936.50 111,136.00 68,978.00 26,820.00 41,466.50 56,113.00 21.65 27.88 9.61 -21.95 314.38 -52.20
c ) Marketable Securities For Issued (net) 32,605.11 75,608.00 96,028.50 116,449.00 107,425.50 98,402.00 49,201.00 0.00 18.87 29.22 35.26 -35.07 18.34 n.a
d) Securities Sold Under Repurchase Agreements 0.00 0.00 0.00 0.00 0.00 0.00 0.00 0.00 n.a n.a n.a n.a n.a n.a
e) Subordinated Loans 0.00 0.00 0.00 0.00 0.00 0.00 0.00 0.00 n.a n.a n.a n.a n.a n.a
D- NON COST BEARING RESOURCES 1,994.48 4,625.00 4,019.50 3,414.00 2,065.00 716.00 709.00 702.00 1.15 0.86 0.26 35.47 376.82 1.99
a) Provisions 1,728.41 4,008.00 3,171.00 2,334.00 1,311.50 289.00 240.50 192.00 1.00 0.59 0.10 71.72 707.61 50.52
b) Current & Deferred Tax Liabilities 266.07 617.00 642.00 667.00 525.50 384.00 447.00 510.00 0.15 0.17 0.14 -7.50 73.70 -24.71
c) Trading Liabilities (Derivatives) 0.00 0.00 206.50 413.00 228.00 43.00 21.50 0.00 n.a 0.10 0.02 -100.00 860.47 n.a
d) Other Liabilities 0.00 0.00 0.00 0.00 0.00 0.00 0.00 0.00 n.a n.a n.a n.a n.a n.a
E- TOTAL LIABILITIES 149,088.36 345,721.00 347,474.00 349,227.00 292,075.00 234,923.00 202,168.00 169,413.00 86.28 87.62 84.18 -1.00 48.66 38.67
F- MINORITY INTEREST 0.00 0.00 0.00 0.00 n.a n.a n.a n.a n.a n.a
F- EQUITY 23,699.17 54,956.00 52,160.50 49,365.00 46,757.50 44,150.00 42,302.00 40,454.00 13.72 12.38 15.82 11.33 11.81 9.14
a) Prior Year's Equity 21,288.11 49,365.00 46,757.50 44,150.00 42,302.00 40,454.00 37,972.50 35,491.00 12.32 11.08 14.50 11.81 9.14 13.98
b) Equity (Internal & external resources added during the year) -18.54 -43.00 -59.50 -76.00 20.50 117.00 45.00 -27.00 -0.01 -0.02 0.04 -43.42 -164.96 -533.33
c) Minority Interest 18.97 44.00 43.50 43.00 38.00 33.00 33.50 34.00 0.01 0.01 0.01 2.33 30.30 -2.94
d) Profit & Loss 2,410.63 5,590.00 5,419.00 5,248.00 4,397.00 3,546.00 4,251.00 4,956.00 1.40 1.32 1.27 6.52 48.00 -28.45
TOTAL LIABILITY+EQUITY 172,787.53 400,677.00 399,634.50 398,592.00 338,832.50 279,073.00 244,470.00 209,867.00 100.00 100.00 100.00 0.52 42.83 32.98
USD 1 = TRY 2.3189 2.1304 1.7776 1.8889
LEASING
Şeker Finansal Kiralama A.Ş. and Its Subsidiary 14
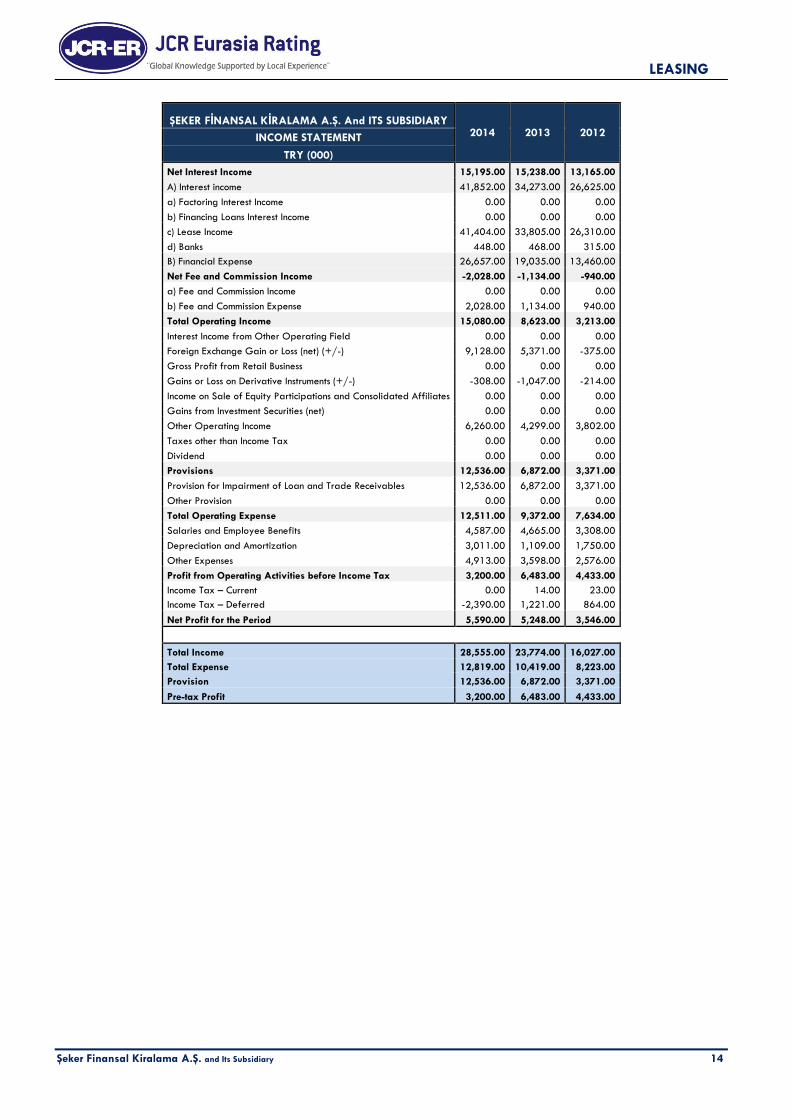
ŞEKER FİNANSAL KİRALAMA A.Ş. And ITS SUBSIDIARY 2014 2013 2012 INCOME STATEMENT
TRY (000)
Net Interest Income 15,195.00 15,238.00 13,165.00
A) Interest income 41,852.00 34,273.00 26,625.00
a) Factoring Interest Income 0.00 0.00 0.00
b) Financing Loans Interest Income 0.00 0.00 0.00
c) Lease Income 41,404.00 33,805.00 26,310.00
d) Banks 448.00 468.00 315.00
B) Fınancial Expense 26,657.00 19,035.00 13,460.00
Net Fee and Commission Income -2,028.00 -1,134.00 -940.00
a) Fee and Commission Income 0.00 0.00 0.00
b) Fee and Commission Expense 2,028.00 1,134.00 940.00
Total Operating Income 15,080.00 8,623.00 3,213.00
Interest Income from Other Operating Field 0.00 0.00 0.00
Foreign Exchange Gain or Loss (net) (+/-) 9,128.00 5,371.00 -375.00
Gross Profit from Retail Business 0.00 0.00 0.00
Gains or Loss on Derivative Instruments (+/-) -308.00 -1,047.00 -214.00
Income on Sale of Equity Participations and Consolidated Affiliates 0.00 0.00 0.00
Gains from Investment Securities (net) 0.00 0.00 0.00
Other Operating Income 6,260.00 4,299.00 3,802.00
Taxes other than Income Tax 0.00 0.00 0.00
Dividend 0.00 0.00 0.00
Provisions 12,536.00 6,872.00 3,371.00
Provision for Impairment of Loan and Trade Receivables 12,536.00 6,872.00 3,371.00
Other Provision 0.00 0.00 0.00
Total Operating Expense 12,511.00 9,372.00 7,634.00
Salaries and Employee Benefits 4,587.00 4,665.00 3,308.00
Depreciation and Amortization 3,011.00 1,109.00 1,750.00
Other Expenses 4,913.00 3,598.00 2,576.00
Profit from Operating Activities before Income Tax 3,200.00 6,483.00 4,433.00
Income Tax – Current 0.00 14.00 23.00
Income Tax – Deferred -2,390.00 1,221.00 864.00
Net Profit for the Period 5,590.00 5,248.00 3,546.00
Total Income 28,555.00 23,774.00 16,027.00
Total Expense 12,819.00 10,419.00 8,223.00
Provision 12,536.00 6,872.00 3,371.00
Pre-tax Profit 3,200.00 6,483.00 4,433.00

LEASING
Şeker Finansal Kiralama A.Ş. and Its Subsidiary 15
ŞEKER FİNANSAL KİRALAMA A.Ş. and ITS SUBSIDIARY
2014 2013 2012 FINANCIAL RATIO %
I. PROFITABILITY & PERFORMANCE
1. ROA - Pre-tax Profit / Total Assets (avg.) 0.80 1.91 1.81
2. ROE - Pre-tax Profit / Equity (avg.) 6.13 13.87 10.48
3. Total Income / Equity (avg.) 54.74 50.85 37.89
4. Total income / Total Assets (avg.) 7.15 7.02 6.56
5. Provisions / Total Income 43.90 28.91 21.03
6. Total Expense / Total Resources (avg.) 3.69 3.57 4.07
7. Net Profit for the Period / Total Assets (avg.) 1.40 1.55 1.45
8. Total Income / Total Expenses 222.76 228.18 194.90
9. Non Cost Bearing Liabilities + Equity- Non Earning Assets / Assets 5.24 5.71 6.58
10. Non Cost Bearing Liabilities - Non Earning Assets / Assets -8.48 -6.67 -9.24
11. Total Operating Expenses / Total Income 43.81 39.42 47.63
12. Interest Margin 4.16 4.91 6.00
13. Operating ROAA = Operating Net Incomes / Assets (avg.) 7.47 7.53 7.32
14. Operating ROAE = Operating Net Incomes / Equity Capital (avg.) 57.24 54.58 42.30
15. Interest Coverage – EBIT / Interest Expenses 112.00 134.06 132.93
16. Net Profit Margin 19.58 22.07 22.13
17. Gross Profit Margin 11.21 27.27 27.66
18. Market Share 1.23 1.40 1.38
19. Growth Rate 0.52 42.83 32.98
II. CAPITAL ADEQUACY (year-end)
1. Equity Generation / Prior Year’s Equity -0.09 -0.17 0.29
2. Internal Equity Generation / Previous Year’s Equity 11.32 11.89 8.77
3. Equity / Total Assets (Standard Ratio) 13.72 12.38 15.82
4. Equity / Total Liabilities 15.90 14.14 18.79
5. Free Equity / Total Receivables Ratio 10.86 10.35 17.34
6. Tangible Assets / Total Assets 4.13 2.95 2.99
7. Intangible Assets / Total Assets 0.00 0.00 0.00
8. Total Guarantees and Commitments / Equity 21.78 84.45 68.00
III. LIQUIDITY (year-end)
1. Liquid Assets + Marketable Securities / Total Assets 2.07 1.34 16.50
2. Liquid Assets + Marketable Securities / Total Liabilities 2.40 1.53 19.60
3. Short Term Borrowings / Total Assets 44.61 29.66 39.05
4. Net Interest and Commission / Total Assets 3.29 3.54 4.38 5. Liquid Assets + Marketable Securities / Equity 15.08 10.84 104.28
IV. ASSET QUALITY
1. Loan and Receivable’s Loss Provisions / Total Loans and Receivables 7.45 4.91 6.80
2. Total Provisions / Profit Before Provision and Tax 79.66 51.46 43.20
3. Impaired Receivables / Gross Receivables 14.46 10.17 12.22
4. Impaired Receivables / Equity 100.60 78.70 61.35
5. Loss Reserves for Receivables / Impaired Receivables 51.53 48.24 55.62
6. Collaterals / Total Receivables 264.12 241.44 272.94
7. Total FX Position / Total Assets 16.76 10.85 6.87
8. Total FX Position / Equity 122.22 87.61 43.40
9. Total Guarantees and Commitments / Assets 2.99 10.46 10.76

LEASING
Şeker Finansal Kiralama A.Ş. and Its Subsidiary 16
Long Term Short Term Long Term Short Term Long Term Short Term Long Term Short Term Long Term Short Term Long Term Short Term
BB B BB B BB B BB B BBB- A-3 BBB- A-3
BB B BB B BB B BB B BBB- A-3 BBB- A-3
FC Stable Stable Stable Stable Stable Stable Stable Stable Stable Stable Stable Stable
LC Stable Stable Stable Stable Stable Stable Positive Stable Stable Stable Stable Stable
BBB (Trk) A-3 (Trk) BBB+ (Trk) A-2 (Trk) BBB+ (Trk) A-1 (Trk) A- (Trk) A-1 (Trk) A- (Trk) A-1 (Trk) A- (Trk) A-1 (Trk)
Stable Stable Stable Stable Positive Stable Stable Stable Stable Stable Stable Stable
2 - 2 - 2 - 2 - 2 - 2 -
AB - AB - AB - AB - AB - AB -
Foreign
CurrencyBB B BB B BB B BB B BBB- - BBB- -
Local
CurrencyBB B BB B BB B BB B BBB- - BBB- -
FC Stable Stable Stable Stable Stable Stable Stable Stable Stable - Stable -
LC Stable Stable Stable Stable Stable Stable Positive Stable Stable - Stable -
(*):Affirmed by JCR on
February 21, 2011
(*):Affirmed by JCR on
June 28, 2012
(*):Assigned by JCR on
May 23, 2013
(*):Assigned by JCR on
May 23, 2013
Stand Alone
So
ve
reig
n*
Outlook
(*):Affirmed by JCR on
February 01, 2010
(*):Affirmed by JCR on
February 21, 2011
2013 2014
Inte
rna
tio
na
l
Local Currency
Outlook
Sponsor Support
Foreign Currency
March 30, May 16,
The Historical Development of the Company's Credit Rating Notes
May 30,
Local Rating
September 15, April 25,
2010 2011
Na
tio
n
al
Outlook
May 29,
2012 2013