CORPORATE ASSET MANAGEMENT PLAN 2015 - … · 3. Asset Management Governance ... friendly movement...
37
CORPORATE ASSET MANAGEMENT PLAN 2015-2025 Page 1
Transcript of CORPORATE ASSET MANAGEMENT PLAN 2015 - … · 3. Asset Management Governance ... friendly movement...
C O R P O R A T E A S S E T M A N A G E M E N T P L A N 2 0 1 5 - 2 0 2 5
Page 1
C O R P O R A T E A S S E T M A N A G E M E N T P L A N 2 0 1 5 - 2 0 2 5
Page 2
Contents 1. Executive Summary ........................................................................................... 3
2. Introduction ........................................................................................................ 6
3. Asset Management Governance .................................................................... 10
4. Asset Inventory ................................................................................................ 16
5. Asset Valuation ................................................................................................ 20
6. Life Cycle Management ................................................................................... 27
7. Future Demand ................................................................................................ 34
8. Contacts ........................................................................................................... 36
C O R P O R A T E A S S E T M A N A G E M E N T P L A N 2 0 1 5 - 2 0 2 5
Page 3
1. Executive Summary
The City of Perth is a proud custodian of its diverse asset portfolio within the boundaries of Perth, the Capital City of Western Australia. It is critical that Asset Management as a discipline is developed and embedded across the whole organisation to ensure assets are managed in a manner which allows maximum performance to support the many services delivered to the City’s residents, business owners and operators, workers and visitors.
This Corporate Plan presents information across key aspects such as the City’s Asset Management Governance arrangements; Asset Inventory; Asset Valuations; Age Profile of Individual Asset Classes; and Opportunities for the Future. This Plan in underpinned by ten (10) individual Asset Class Plans of which three are newly developed in 2014/15 and a dedicated Asset Management Section supported by nominated technical Asset Custodians throughout the organisation.
As Asset Management is a multi-field discipline that brings together engineering, financial, information technology and knowledge management functions; the highlights of this third annual Plan for 2014/15 are summarised in these broad components: Asset Management Governance:
• Creation of two new Policies and supporting Procedures for: Disposal of Property (9.14) and Contributed Assets(9.15); in addition to a renewal of the Asset Hierarchy and Asset Management Policy(9.12);
• Three (3) new individual Asset Class Plans developed: Infrastructure Riverbank, Infrastructure Drainage and Information Technology Fibre Optic;
• Ongoing consolidation toward a single corporate asset register; and • Completion of the reconciliation and uploading of Infrastructure Asset Class
Valuations into a single centralised database. Financial Management:
• Appointment of a Financial Asset Accountant located within the Asset Management Section;
• Completion of all required Asset Class Valuations/Revaluations to satisfy Local Government (Financial Management) Regulations 1996 Section 17A; and
• Valuation data represented in Section 5.1 for 15 Asset Classes (excluding Land) has a Current Replacement Cost of $1,130 M and a Depreciated Replacement Cost of $778 M.
C O R P O R A T E A S S E T M A N A G E M E N T P L A N 2 0 1 5 - 2 0 2 5
Page 4
Knowledge Management / Performance:
• The Average Asset Consumption Ratio (ACR) for 14 Asset Classes is 61.36% which is deemed an Advanced Standard (See Section 6.1.1);
• However within these 15 Classes, 3 Classes have not met a Basic Standard for the ACR: Infrastructure Roads, Infrastructure Lights and City of Perth Parking;
• The Average Asset Sustainability Ratio (ASR) for 14 Asset Classes is 101% which is deemed an Advanced Standard (See Section 6.1.1);
• The Asset Renewal Funding Ratio (ARFR) is deemed an Advanced Standard as it primarily sits between 95% and 105% for the 10 year period to 2023/24 (See Section 6.1.2); and
• The average useful life for the 15 Asset Classes presented in Section 6.4 is 37 years and the remaining life is 23 years, equating to 62% (See Section 6.4).
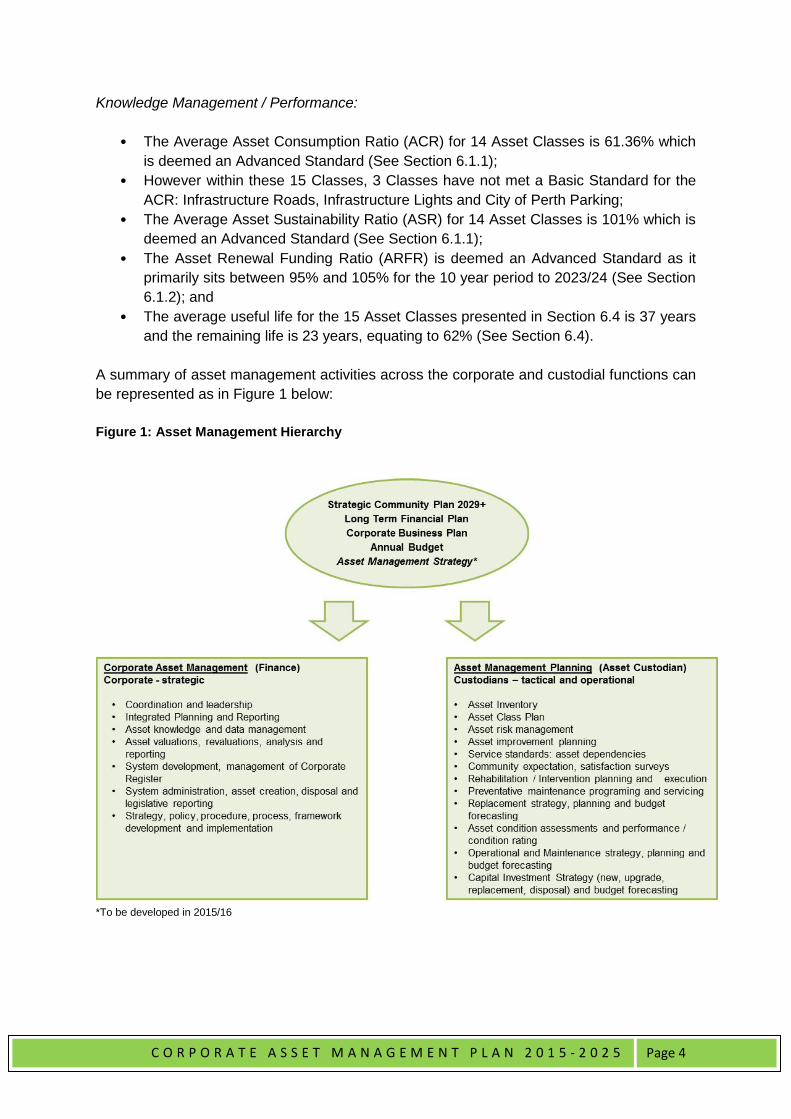
A summary of asset management activities across the corporate and custodial functions can be represented as in Figure 1 below: Figure 1: Asset Management Hierarchy
*To be developed in 2015/16
C O R P O R A T E A S S E T M A N A G E M E N T P L A N 2 0 1 5 - 2 0 2 5
Page 5
Opportunities identified to be considered for future implementation, ensuring the ongoing strengthening of the City’s stewardship of its assets portfolio includes (See Section 7.2):
• Development of an Asset Management Strategy; • Undertake community survey/s on service level expectations for all Asset Classes; • Improved forecasting for renewal and replacement of assets (ie demand forecasting); • Greater transparency and accuracy of data within the 10 Year Capital Works Plan (ie
budget and expenditure defined as new, upgrade; renewal (replacement); and expansion;
• Development of a rolling Revaluation Plan to ensure all Asset Classes are revalued in accordance to legislated requirements and aligned to internal corporate timeframes;
• Reconciliation to be attained between the General Ledger and asset management system;
• Development of a Data Migration Plan for asset registers to be consolidated into a single corporate asset register;
• Establish and verify unit rates for all key asset components; • Improve accuracy and details of whole of life cycle costs for assets: and • Aligned to the International Infrastructure Management Manual (2012) the City is
maturing towards lifecycle asset management with the objective of looking at the lowest long term cost option rather than short term savings when making decisions on asset management; thus providing significant benefits for the organisation and community (See Section 3.0 for details).

C O R P O R A T E A S S E T M A N A G E M E N T P L A N 2 0 1 5 - 2 0 2 5
Page 6
2. Introduction
Welcome to the City of Perth’s Corporate Asset Management Plan 2015 – 2029+.
The Corporate Asset Management Plan is a key component of the City’s Integrated Planning and Reporting Framework and is one of the strategic enablers activating the Strategic Community Plan ‘Vision 2029+’ and its broad vision for Perth as the Capital City of Western Australia:
The City of Perth’s inaugural Corporate Asset Management Plan was adopted by Council in June 2013 with the intention that it be reviewed on an annual basis. This Plan now builds upon previous versions whereby asset management is fundamental to ensuring the City’s assets are managed and maintained in a manner which allows maximum performance at an optimum whole of life cost to support the multitude of services delivered by the City.
Integrated Planning and Reporting Framework
The diagram below depicts the components that make up the City of Perth’s Integrated Planning and Reporting Framework (IPRF). It shows the interaction between the plans, the influence of the informing strategies and the strategic enablers, with emphasis given to a mutual informing relationship. The intent of the IPRF is to ensure the priorities and services provided by the City of Perth are aligned with our community needs and aspirations. The strategic enablers allow rigour to be applied to these, taking into account available resources to deliver the best possible results for the community.
Perth is renowned as an accessible city. It is alive with urban green networks that are safe and vibrant. As a global city, there is a diverse culture that attracts visitors. It provides city living at its best. Local and global businesses thrive here. Perth honours its past, while creating a sustainable future.

C O R P O R A T E A S S E T M A N A G E M E N T P L A N 2 0 1 5 - 2 0 2 5
Page 7
The Strategic Community Plan, Vision 2029+, is our long term strategic direction that guides the remainder of the framework. It expresses the community’s vision for the future together with the strategies that Council are intending to implement to address strategic community outcomes. This is a key document for Council to track and report on progress to the community.
This drives the City of Perth’s Corporate Business Plan, which is the detailed implementation plan for services, key projects and capital investments over the next four years. The intention is that the implementation of this plan contributes towards the delivery of the community objectives over the longer term. It contains the same themes, community outcomes and strategies as the Strategic Community Plan, to ensure we deliver services in line with community aspirations.
The City’s key strategic enablers show how we are equipped to deliver on the commitments made in the Corporate Business Plan. These key strategies are:
• Long Term Financial Plan This ten year rolling plan assists the City to set priorities in accordance with its financial resources, through the allowance of key assumption based analysis. This allows the organisation to make decisions in a financially sustainable manner.
• Workforce Plan This plan identifies the workforce requirements and strategies for current and future operations, ensuring the needs and limitations to support the delivery of the Corporate Business plan are met.
• Corporate Asset Management Plan This plan provides guidance on service provision and whole of life cycle asset management to support the City’s financial sustainability and key service levels.
The Annual Budget is based on the projected costing of year one of the Corporate Business Plan, with opportunity to review during the mid-year budget review process. The budget creation process will be continually improved on to strengthen the financial integration between the plans within the framework, with emphasis given on expanding to a robust annualised four year budget over time.
C O R P O R A T E A S S E T M A N A G E M E N T P L A N 2 0 1 5 - 2 0 2 5
Page 8
Council’s Strategic Priorities
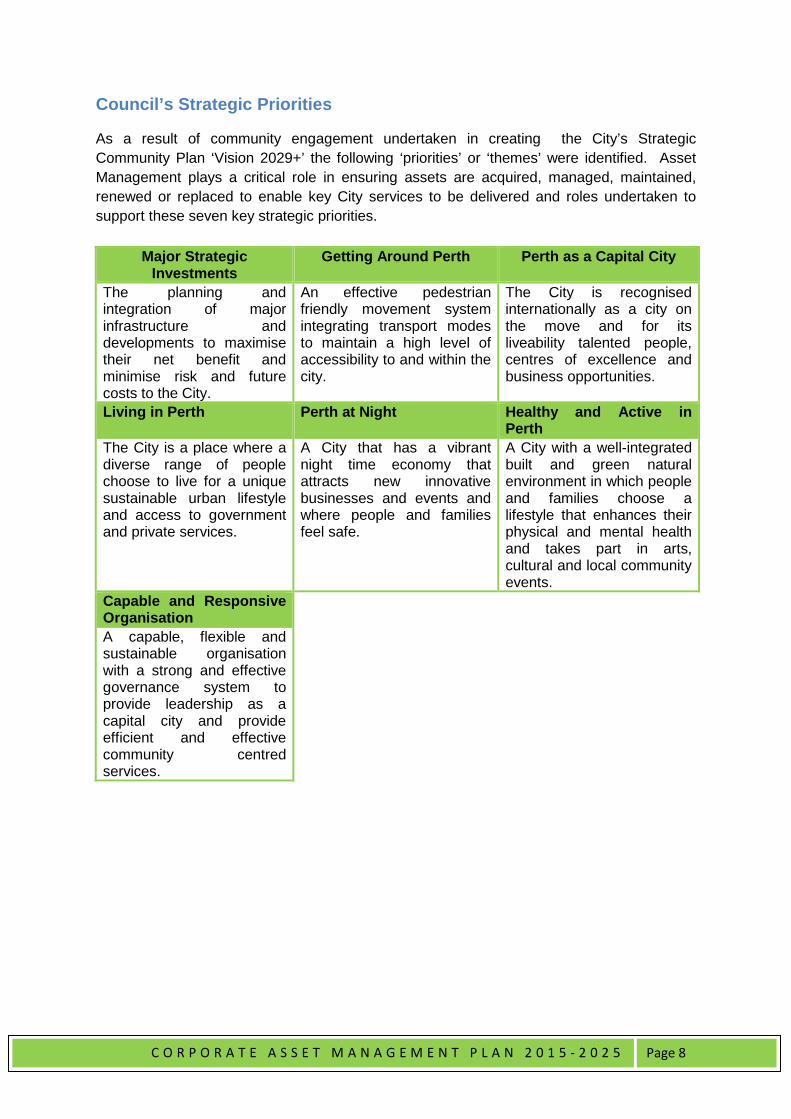
As a result of community engagement undertaken in creating the City’s Strategic Community Plan ‘Vision 2029+’ the following ‘priorities’ or ‘themes’ were identified. Asset Management plays a critical role in ensuring assets are acquired, managed, maintained, renewed or replaced to enable key City services to be delivered and roles undertaken to support these seven key strategic priorities.
Major Strategic Investments
Getting Around Perth Perth as a Capital City
The planning and integration of major infrastructure and developments to maximise their net benefit and minimise risk and future costs to the City.
An effective pedestrian friendly movement system integrating transport modes to maintain a high level of accessibility to and within the city.
The City is recognised internationally as a city on the move and for its liveability talented people, centres of excellence and business opportunities.
Living in Perth Perth at Night Healthy and Active in Perth
The City is a place where a diverse range of people choose to live for a unique sustainable urban lifestyle and access to government and private services.
A City that has a vibrant night time economy that attracts new innovative businesses and events and where people and families feel safe.
A City with a well-integrated built and green natural environment in which people and families choose a lifestyle that enhances their physical and mental health and takes part in arts, cultural and local community events.
Capable and Responsive Organisation A capable, flexible and sustainable organisation with a strong and effective governance system to provide leadership as a capital city and provide efficient and effective community centred services.
C O R P O R A T E A S S E T M A N A G E M E N T P L A N 2 0 1 5 - 2 0 2 5
Page 9
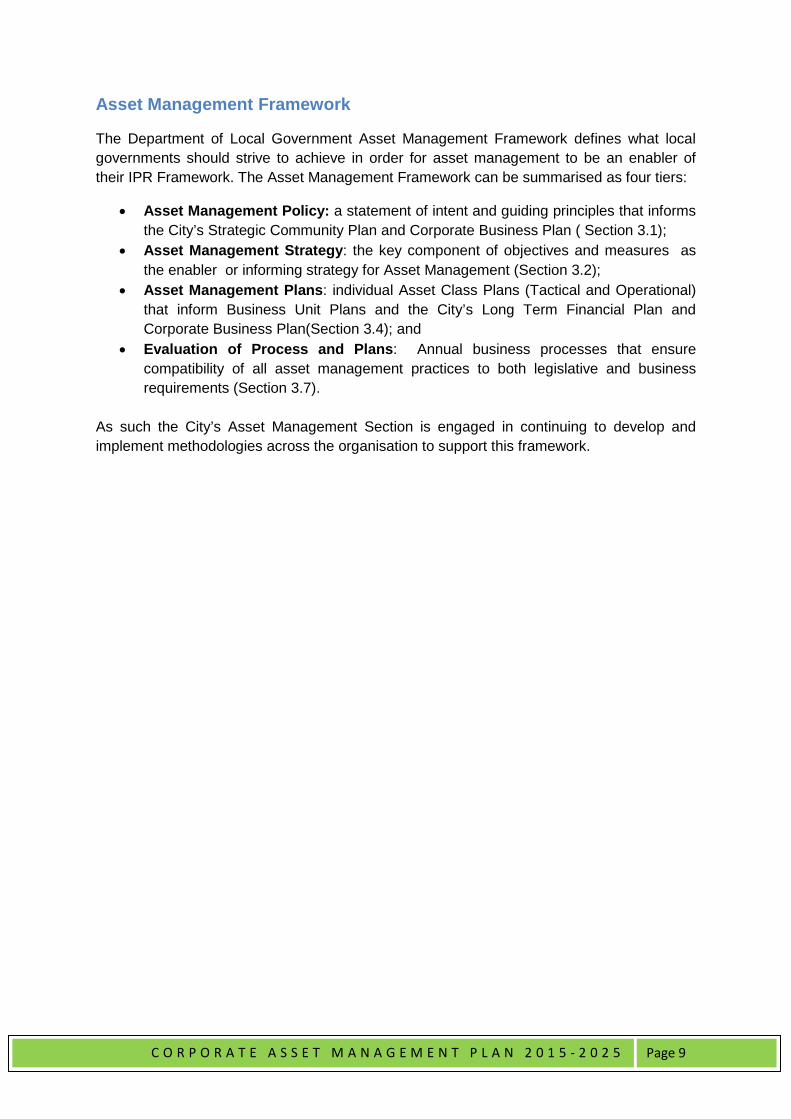
Asset Management Framework
The Department of Local Government Asset Management Framework defines what local governments should strive to achieve in order for asset management to be an enabler of their IPR Framework. The Asset Management Framework can be summarised as four tiers:
• Asset Management Policy: a statement of intent and guiding principles that informs the City’s Strategic Community Plan and Corporate Business Plan ( Section 3.1);
• Asset Management Strategy: the key component of objectives and measures as the enabler or informing strategy for Asset Management (Section 3.2);
• Asset Management Plans: individual Asset Class Plans (Tactical and Operational) that inform Business Unit Plans and the City’s Long Term Financial Plan and Corporate Business Plan(Section 3.4); and
• Evaluation of Process and Plans: Annual business processes that ensure compatibility of all asset management practices to both legislative and business requirements (Section 3.7).
As such the City’s Asset Management Section is engaged in continuing to develop and implement methodologies across the organisation to support this framework.
C O R P O R A T E A S S E T M A N A G E M E N T P L A N 2 0 1 5 - 2 0 2 5
Page 10
3. Asset Management Governance
Asset Management is a multi-field discipline that brings together engineering, financial and information technology expertise and functions allowing an organisation to manage its physical assets in the most optimal manner in fulfilling service levels demands. The City has identified specific roles and responsibilities within its Policy to support the development of the discipline, inclusive of:
• Asset Management Taskforce: is chaired by the nominated Director and is a multi- disciplinary cross-functional group of staff representing key stakeholders within the City. The Taskforce reviews individual asset management plans and provides guidance in ensuring the implementation, monitoring, evaluation and review of Asset Management Policies and procedures is aligned to legislative reporting requirements;
• Unit Managers: are responsible for the implementation, communication and compliance of all Asset Management Policies, procedures and reporting requirements within their unit. They also ensure that asset management plans and asset registers for assets under their unit’s custodianship are developed and maintained and provide operational, maintenance and capital works budget forecasts to inform the City’s long term financial planning and funding strategies;
• Asset Custodians: are appointed by nature of their expertise in the whole of life- cycle management of respective assets and are responsible for the development and implementation of asset management plans. They are responsible for the submission of respective asset management plans from which asset performances reflected in the plans is used for statutory reporting requirements and long term budget forecasts are provided;
• Asset Management Section: provides leadership in ensuring that all City assets are managed in a manner that reflects the organisation’s vision and community aspirations. They are responsible for the timely review of all Asset Management Policies, procedures and reporting requirements in addition to ensuring that all asset management plans for respective asset classes are developed by custodians and that they conform to corporate requirement. The Section facilitates the integration of the engineering, financial and information technology expertise and deliverables.
Aligned to the International Infrastructure Management Manual (2012) the City is maturing towards lifecycle asset management with the objective of looking at the lowest long term cost option, rather than short term savings when making decisions on asset management. The benefits of this approach as outlined in the IIMM (2012) are:
• Improve cost efficiency and reduce costs, by using decision making techniques that identify the lowest lifecycle cost maintenance and renewal decisions;
• Improve customer service satisfaction by better matching levels of service with what customers want and are willing to pay for;
• Have more transparency in decision making, allowing stronger governance and accountability; and
• Be more sustainable, by having long term plans that provide equitably funded services across generations.

C O R P O R A T E A S S E T M A N A G E M E N T P L A N 2 0 1 5 - 2 0 2 5
Page 11
Asset Management Policy
The City’s Asset Management Policy 9.12 was adopted by Council on 29 January 2013 and has undergone minor revision which was adopted by Council in April 2015. The Policy statement is:
“The City of Perth will utilise Asset Management principles, practices and reporting in the whole life-cycle management of assets owned and controlled by the City, and endeavours to deliver services that meet the present needs of the community, without compromising the needs of future generations”.
The objectives of this policy are to:
a. Provide the framework for adopting Asset Management into the City’s decision making processes;
b. Ensure that the City undertakes a total cost of ownership approach, as practicable, in the acquisition and management of the City’s assets. This cost includes asset design, construction, operation, maintenance, renewal and disposal;
c. Enhance transparency and accountability in the whole of life-cycle management of the City’s assets through the development, approval and implementation of asset management plans;
d. Ensure that community consultation, as necessary, is undertaken and the City endeavours to meet the community’s current and future needs through the services delivered by the City;
e. Complement and contribute to the City’s Integrated Planning and Reporting requirements via the Strategic Community Plan 2029, Corporate Business Plan, Long Term Financial Plan, in addition to the City Planning Scheme;
f. Ensure adherence to applicable laws, regulations and statutory requirements governing Asset Management reporting by the City and
g. Articulate the City’s commitment to continuous improvement and provision of resources to deliver asset management objectives.
Other policies which support asset management developed during the 2014/15 period (financial year) were the Contributed Assets Policy (Policy 9.15) and Disposal of Property Policy (Policy 9.14).
C O R P O R A T E A S S E T M A N A G E M E N T P L A N 2 0 1 5 - 2 0 2 5
Page 12
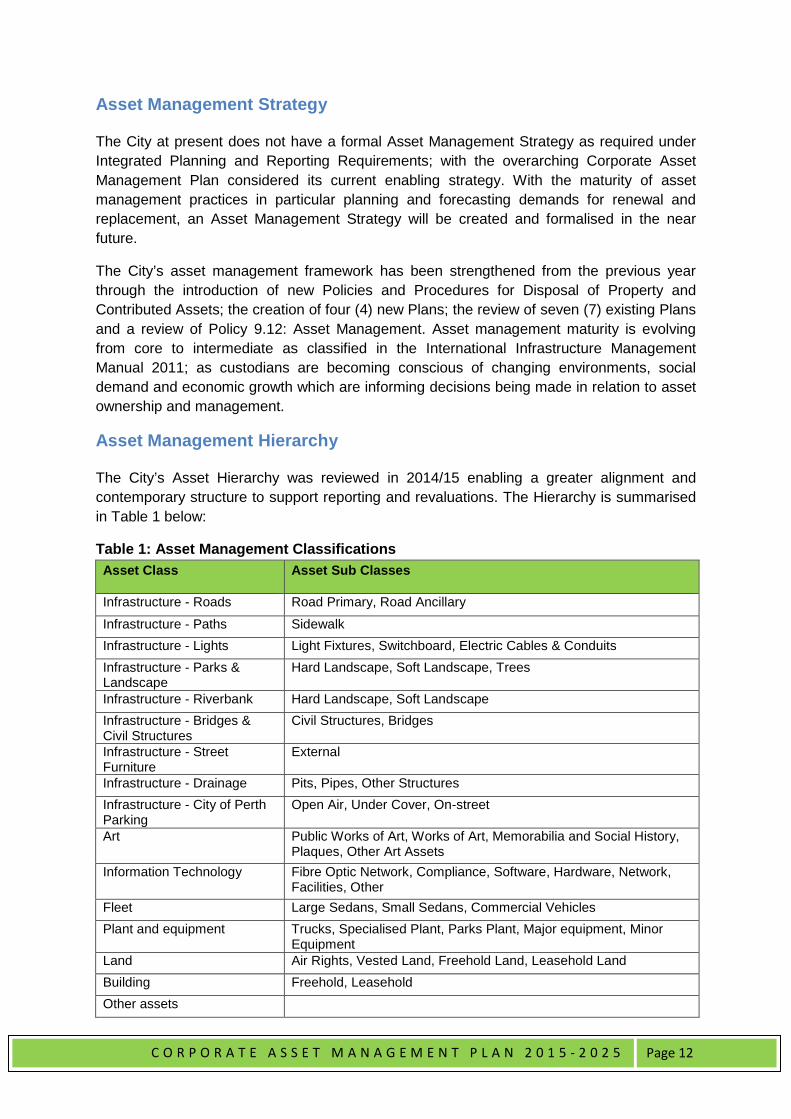
Asset Management Strategy
The City at present does not have a formal Asset Management Strategy as required under Integrated Planning and Reporting Requirements; with the overarching Corporate Asset Management Plan considered its current enabling strategy. With the maturity of asset management practices in particular planning and forecasting demands for renewal and replacement, an Asset Management Strategy will be created and formalised in the near future.
The City’s asset management framework has been strengthened from the previous year through the introduction of new Policies and Procedures for Disposal of Property and Contributed Assets; the creation of four (4) new Plans; the review of seven (7) existing Plans and a review of Policy 9.12: Asset Management. Asset management maturity is evolving from core to intermediate as classified in the International Infrastructure Management Manual 2011; as custodians are becoming conscious of changing environments, social demand and economic growth which are informing decisions being made in relation to asset ownership and management.
Asset Management Hierarchy
The City’s Asset Hierarchy was reviewed in 2014/15 enabling a greater alignment and contemporary structure to support reporting and revaluations. The Hierarchy is summarised in Table 1 below:
Table 1: Asset Management Classifications Asset Class Asset Sub Classes
Infrastructure - Roads Road Primary, Road Ancillary
Infrastructure - Paths Sidewalk Infrastructure - Lights Light Fixtures, Switchboard, Electric Cables & Conduits Infrastructure - Parks & Landscape
Hard Landscape, Soft Landscape, Trees
Infrastructure - Riverbank Hard Landscape, Soft Landscape Infrastructure - Bridges & Civil Structures
Civil Structures, Bridges
Infrastructure - Street Furniture
External
Infrastructure - Drainage Pits, Pipes, Other Structures Infrastructure - City of Perth Parking
Open Air, Under Cover, On-street
Art Public Works of Art, Works of Art, Memorabilia and Social History, Plaques, Other Art Assets
Information Technology Fibre Optic Network, Compliance, Software, Hardware, Network, Facilities, Other
Fleet Large Sedans, Small Sedans, Commercial Vehicles Plant and equipment Trucks, Specialised Plant, Parks Plant, Major equipment, Minor
Equipment Land Air Rights, Vested Land, Freehold Land, Leasehold Land Building Freehold, Leasehold Other assets
C O R P O R A T E A S S E T M A N A G E M E N T P L A N 2 0 1 5 - 2 0 2 5
Page 13
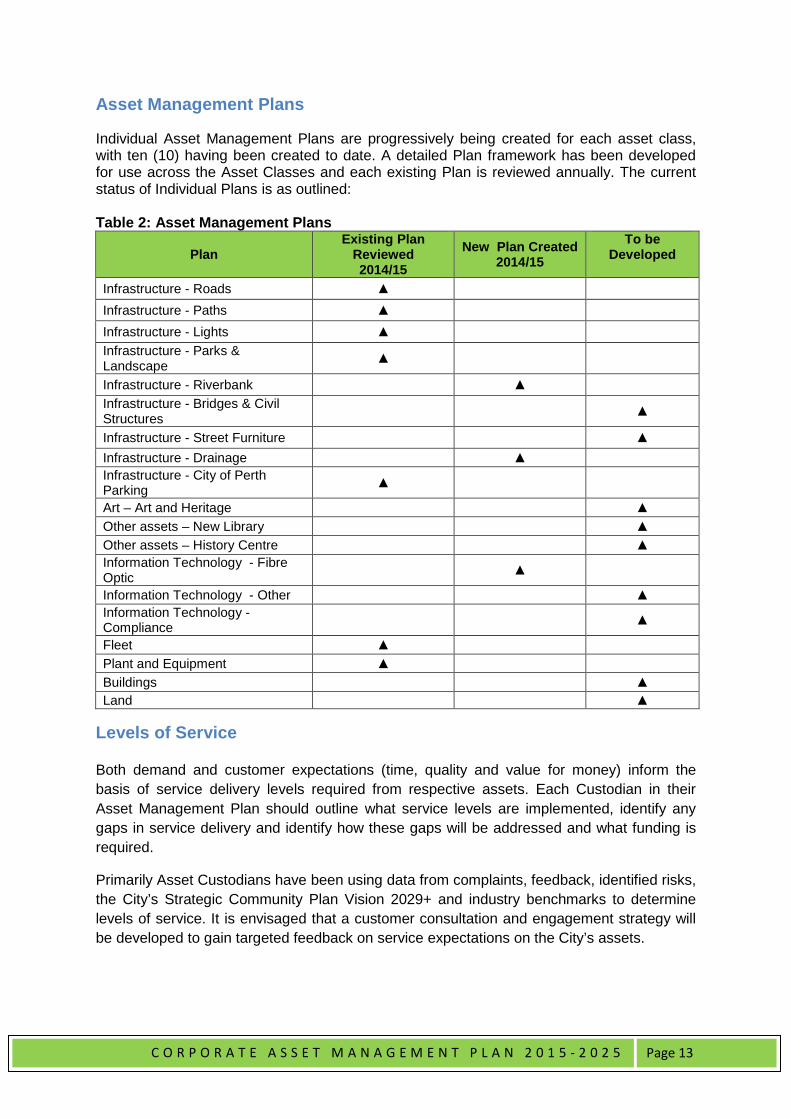
Asset Management Plans
Individual Asset Management Plans are progressively being created for each asset class, with ten (10) having been created to date. A detailed Plan framework has been developed for use across the Asset Classes and each existing Plan is reviewed annually. The current status of Individual Plans is as outlined: Table 2: Asset Management Plans
Plan Existing Plan
Reviewed 2014/15
New Plan Created 2014/15
To be Developed
Infrastructure - Roads ▲ Infrastructure - Paths ▲ Infrastructure - Lights ▲ Infrastructure - Parks & Landscape ▲
Infrastructure - Riverbank ▲ Infrastructure - Bridges & Civil Structures ▲
Infrastructure - Street Furniture ▲ Infrastructure - Drainage ▲ Infrastructure - City of Perth Parking ▲
Art – Art and Heritage ▲ Other assets – New Library ▲ Other assets – History Centre ▲ Information Technology - Fibre Optic ▲
Information Technology - Other ▲ Information Technology -Compliance ▲
Fleet ▲ Plant and Equipment ▲ Buildings ▲ Land ▲
Levels of Service
Both demand and customer expectations (time, quality and value for money) inform the basis of service delivery levels required from respective assets. Each Custodian in their Asset Management Plan should outline what service levels are implemented, identify any gaps in service delivery and identify how these gaps will be addressed and what funding is required.
Primarily Asset Custodians have been using data from complaints, feedback, identified risks, the City’s Strategic Community Plan Vision 2029+ and industry benchmarks to determine levels of service. It is envisaged that a customer consultation and engagement strategy will be developed to gain targeted feedback on service expectations on the City’s assets.
C O R P O R A T E A S S E T M A N A G E M E N T P L A N 2 0 1 5 - 2 0 2 5
Page 14
Each respective Asset Custodian will be required to identify specific service elements and preliminary service standards on which to seek community feedback. The outcome of the consultation will then reaffirm or seek change to those services standards already in place throughout the City. It may be that some service standards are too high and are not deemed to be required by the community1; or in some cases service standards may be lacking and require improvement.
Services Provided
As the Capital City of Western Australia the City of Perth currently provides a vast array of services that influence and enhances the City’s economy and vibrancy through the acquisition and management of various assets:
• Roads: road sweeping, maintenance and rehabilitation of 102 km road network; • Footpaths: footpath sweeping, pavers lifted and re-laid, and replacement of
approximately 470,000 m2 of footpath and shared paths; • Drainage: collection and disposal of stormwater through 107 km of drainage pipes,
inlets and manholes; • Parks: operations, maintenance and rehabilitation of 140 hectares of open parkland
areas and reserve inclusive of 16 major parklands and a number of smaller parks; • External Lights: maintenance, replacement and management of 3,056 external lights
throughout the city streets and parks; • Riverbank: joint management of 11.64km of river walls with the Swan River Trust; • City of Perth Parking: management and operations of 18 open air and 15 under
cover car parks as well as approximately 5,800 on-street parking bays that are currently owned and/or managed by the City of Perth;
• Fleet: management of 130 Council fleet vehicles that provide services to the community;
• Plant & Equipment: management of 64 heavy plant vehicles and 255 equipment pieces that are used to provide infrastructure maintenance throughout the city; and
• Public Art: preservation and maintenance of 457 works of art, 94 public works of art and 1,642 memorabilia and social history artefacts.
1 Community includes City residents, business owners and operators, workers and visitors.
C O R P O R A T E A S S E T M A N A G E M E N T P L A N 2 0 1 5 - 2 0 2 5
Page 15
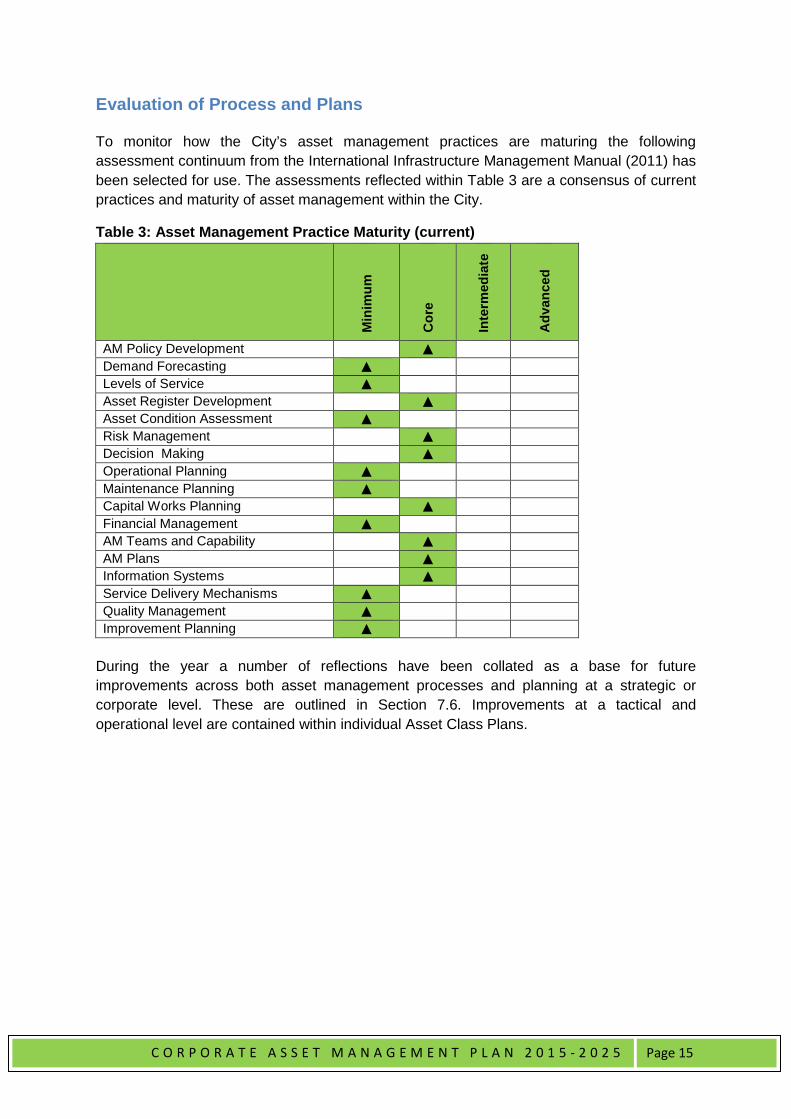
Evaluation of Process and Plans
To monitor how the City’s asset management practices are maturing the following assessment continuum from the International Infrastructure Management Manual (2011) has been selected for use. The assessments reflected within Table 3 are a consensus of current practices and maturity of asset management within the City.
Table 3: Asset Management Practice Maturity (current)
Min
imum
Cor
e
Inte
rmed
iate
Adv
ance
d
AM Policy Development ▲ Demand Forecasting ▲ Levels of Service ▲ Asset Register Development ▲ Asset Condition Assessment ▲ Risk Management ▲ Decision Making ▲ Operational Planning ▲ Maintenance Planning ▲ Capital Works Planning ▲ Financial Management ▲ AM Teams and Capability ▲ AM Plans ▲ Information Systems ▲ Service Delivery Mechanisms ▲ Quality Management ▲ Improvement Planning ▲
During the year a number of reflections have been collated as a base for future improvements across both asset management processes and planning at a strategic or corporate level. These are outlined in Section 7.6. Improvements at a tactical and operational level are contained within individual Asset Class Plans.
C O R P O R A T E A S S E T M A N A G E M E N T P L A N 2 0 1 5 - 2 0 2 5
Page 16
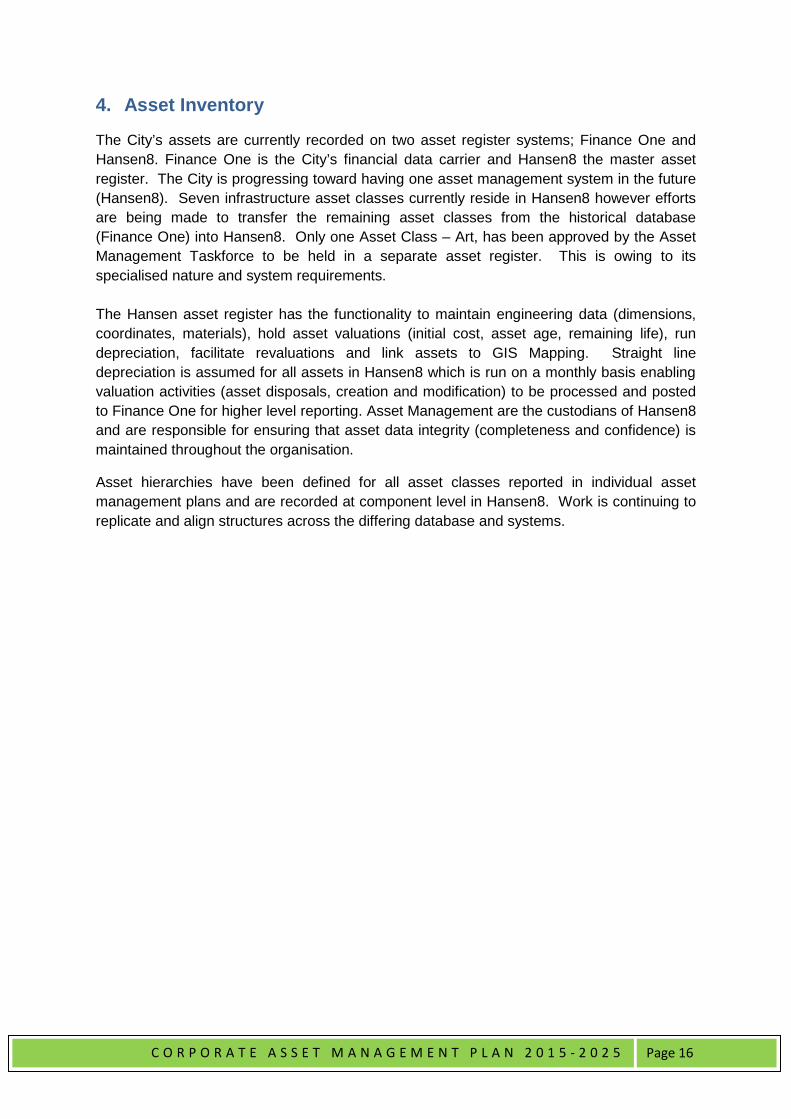
4. Asset Inventory
The City’s assets are currently recorded on two asset register systems; Finance One and Hansen8. Finance One is the City’s financial data carrier and Hansen8 the master asset register. The City is progressing toward having one asset management system in the future (Hansen8). Seven infrastructure asset classes currently reside in Hansen8 however efforts are being made to transfer the remaining asset classes from the historical database (Finance One) into Hansen8. Only one Asset Class – Art, has been approved by the Asset Management Taskforce to be held in a separate asset register. This is owing to its specialised nature and system requirements. The Hansen asset register has the functionality to maintain engineering data (dimensions, coordinates, materials), hold asset valuations (initial cost, asset age, remaining life), run depreciation, facilitate revaluations and link assets to GIS Mapping. Straight line depreciation is assumed for all assets in Hansen8 which is run on a monthly basis enabling valuation activities (asset disposals, creation and modification) to be processed and posted to Finance One for higher level reporting. Asset Management are the custodians of Hansen8 and are responsible for ensuring that asset data integrity (completeness and confidence) is maintained throughout the organisation.
Asset hierarchies have been defined for all asset classes reported in individual asset management plans and are recorded at component level in Hansen8. Work is continuing to replicate and align structures across the differing database and systems.

C O R P O R A T E A S S E T M A N A G E M E N T P L A N 2 0 1 5 - 2 0 2 5
Page 17
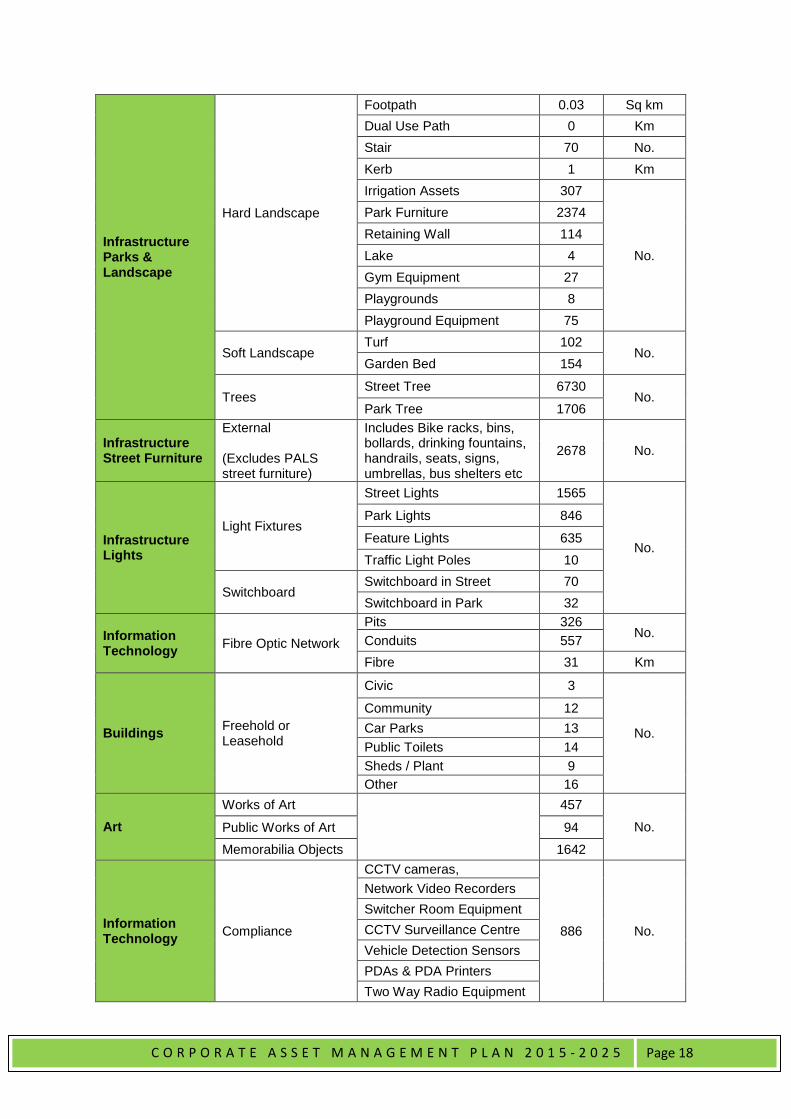
Table 4: Asset Inventory (as of 17 March 2015) Asset Class Asset Sub-Class Asset Type Qty Units
Infrastructure Roads
Road Primary Road Seal 102
Km Road Pavement 95 Road Earthwork 94
Road Ancillary Parking Bays 0.03
Sq km Median Islands 0.13 Roundabouts 0.003
Infrastructure Drainage
Pits
Manhole 2619
No.
Soak Well 18 Gully 2443 Footpath Gully 17 Overflow Pit 518 Side Entry Pit 354
Pipes Main Line 104
Km Lateral Line 3
Other Structures
Bubble Up Pit 2
No.
Concrete Apron 1 Gross Pollutant Trap 3 Spoon Drain 17 Trench Drain 0 Splitter Box 1 Open Channel 8 Catchments 11 Sub Catchments 45
Infrastructure Paths Sidewalk
Pedestrian footpath 0.41 Sq.km. Dual-use footpath 0.06 Kerbs 12 Km. Cross overs 1611 No. Kerbs 18
Km Cycle Path 0 Stairs 20 No. Footpath Pavement 0.005 Sq.km.
Infrastructure Riverbank
Hard Landscape Rock Armour 2.6
Km
Riverwall 5.1 Gabion 0.08
Soft Landscape Vegetation 1.2 Bioengineering 0.7 Beach 0.8
Infrastructure Bridges and Civil Structures
Jetty 2
No.
Underpass 3 Overpass 12 Footbridge 5 Trafficable Bridge 1
C O R P O R A T E A S S E T M A N A G E M E N T P L A N 2 0 1 5 - 2 0 2 5
Page 18
Infrastructure Parks & Landscape
Hard Landscape
Footpath 0.03 Sq km Dual Use Path 0 Km Stair 70 No. Kerb 1 Km Irrigation Assets 307
No.
Park Furniture 2374 Retaining Wall 114 Lake 4 Gym Equipment 27 Playgrounds 8 Playground Equipment 75
Soft Landscape Turf 102
No. Garden Bed 154
Trees Street Tree 6730
No. Park Tree 1706
Infrastructure Street Furniture
External (Excludes PALS street furniture)
Includes Bike racks, bins, bollards, drinking fountains, handrails, seats, signs, umbrellas, bus shelters etc
2678 No.
Infrastructure Lights
Light Fixtures
Street Lights 1565
No.
Park Lights 846
Feature Lights 635 Traffic Light Poles 10
Switchboard Switchboard in Street 70 Switchboard in Park 32
Information Technology Fibre Optic Network
Pits 326 No. Conduits 557
Fibre 31 Km
Buildings Freehold or Leasehold
Civic 3
No.
Community 12 Car Parks 13 Public Toilets 14 Sheds / Plant 9 Other 16
Art Works of Art 457
No. Public Works of Art 94 Memorabilia Objects 1642
Information Technology Compliance
CCTV cameras,
886 No.
Network Video Recorders Switcher Room Equipment CCTV Surveillance Centre Vehicle Detection Sensors PDAs & PDA Printers Two Way Radio Equipment

C O R P O R A T E A S S E T M A N A G E M E N T P L A N 2 0 1 5 - 2 0 2 5
Page 19
Fleet
Large Sedans
23
No.
Small Sedans 42
Commercial Vehicles
Medium Vans 12 Large Vans 9 Utility 3 Dual Cab 41 Trailers 12
Plant and Equipment
Trucks
Various
25
No. Specialized Plant 18 Parks Plant 16 Major Equipment 5 Minor Equipment 255
C O R P O R A T E A S S E T M A N A G E M E N T P L A N 2 0 1 5 - 2 0 2 5
Page 20
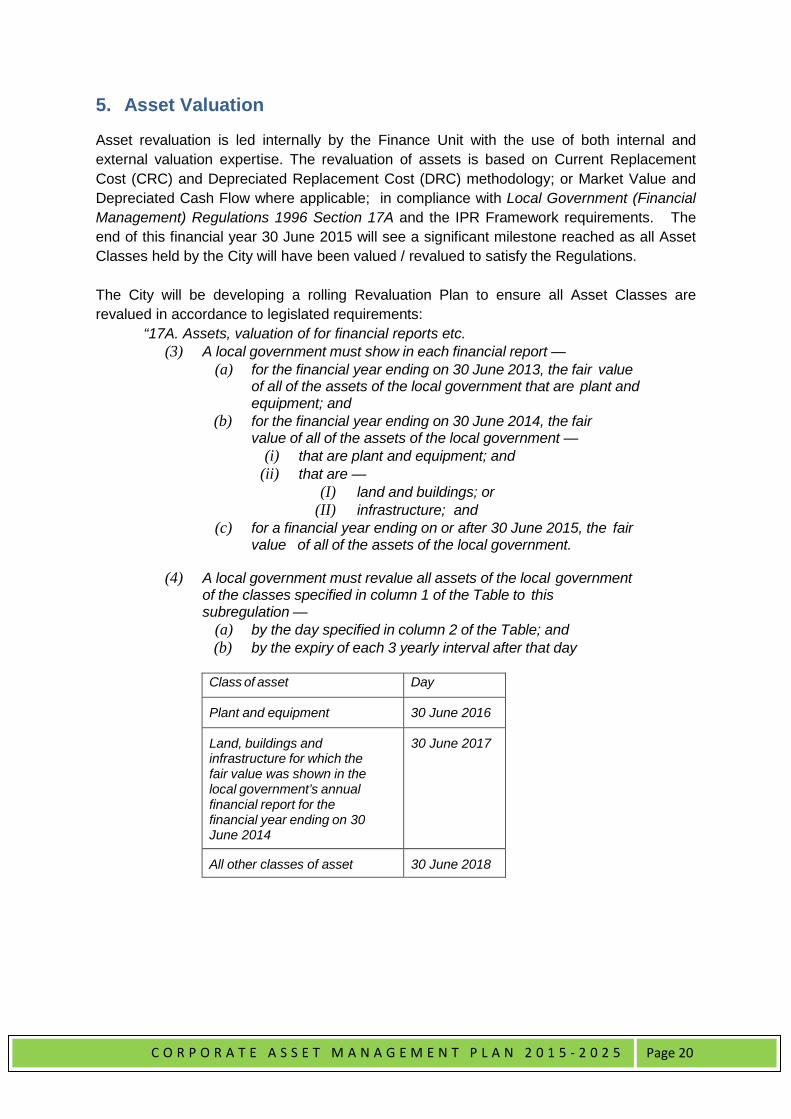
5. Asset Valuation
Asset revaluation is led internally by the Finance Unit with the use of both internal and external valuation expertise. The revaluation of assets is based on Current Replacement Cost (CRC) and Depreciated Replacement Cost (DRC) methodology; or Market Value and Depreciated Cash Flow where applicable; in compliance with Local Government (Financial Management) Regulations 1996 Section 17A and the IPR Framework requirements. The end of this financial year 30 June 2015 will see a significant milestone reached as all Asset Classes held by the City will have been valued / revalued to satisfy the Regulations. The City will be developing a rolling Revaluation Plan to ensure all Asset Classes are revalued in accordance to legislated requirements:
“17A. Assets, valuation of for financial reports etc. (3) A local government must show in each financial report —
(a) for the financial year ending on 30 June 2013, the fair value of all of the assets of the local government that are plant and equipment; and
(b) for the financial year ending on 30 June 2014, the fair value of all of the assets of the local government —
(i) that are plant and equipment; and (ii) that are —
(I) land and buildings; or (II) infrastructure; and
(c) for a financial year ending on or after 30 June 2015, the fair value of all of the assets of the local government.
(4) A local government must revalue all assets of the local government of the classes specified in column 1 of the Table to this subregulation —
(a) by the day specified in column 2 of the Table; and (b) by the expiry of each 3 yearly interval after that day
Class of asset Day
Plant and equipment 30 June 2016
Land, buildings and infrastructure for which the fair value was shown in the local government’s annual financial report for the financial year ending on 30 June 2014
30 June 2017
All other classes of asset 30 June 2018
C O R P O R A T E A S S E T M A N A G E M E N T P L A N 2 0 1 5 - 2 0 2 5
Page 21
Summary of Asset Class Valuations
The following table summarizes the current status of Asset Class valuations for both timing of valuation and total value. Given the progressive creation of Asset Management Plans through into 2015/16, the most recent valuation data pertaining to Land, Buildings, Art, Street Furniture and Bridges Asset Classes is presented in subsequent sections in detail for reference. Based on the valuation data represented below over 15 Asset Classes, these City Assets (excluding Land Assets) have an estimated Current Replacement Cost of $1,130 M and a Depreciated Replacement Cost of $778 M.

C O R P O R A T E A S S E T M A N A G E M E N T P L A N 2 0 1 5 - 2 0 2 5
Page 22
Table 5: Asset Valuation Summary (as of June 2015)
Asset Class Date of
Valuation Data
Source Current
Replacement Cost (CRC) $ M
Depreciated Replacement Cost
(DRC) $ M
Infrastructure – Roads* May 2013 Hansen8
$332,891,007 $216,975,656
Infrastructure – Paths* May 2013 Hansen8
$125,547,690 $64,551,641
Infrastructure – Lights* May 2013 Hansen8
$32,682,168 $15,339,996
Infrastructure - Parks & Landscape* May 2013 Hansen
8 $151,857,542 $118,241,233
Infrastructure – Riverbank* May 2013 Hansen8
$40,147,878 $25,404,679
Infrastructure - Bridges & Civil Structures March 2015 Hansen
8 $16,174,000 $10,477,253
Infrastructure - Street Furniture March 2015 Hansen
8 $4,486,675 $2,658,710
Infrastructure – Drainage* May 2013 Hansen8
$59,964,380 $31,045,099
Infrastructure - City of Perth Parking (Open Air component) June 2013 Finance
One $29,832,058 $9,751,659
Art June 2015 Finance One $2,077,509 $2,069,604
Agriculture** N/A Finance One $795,271 $795,271
Computers** May 2013 Finance One $9,440,811 $807,418
Furniture and Fittings** May 2013 Finance One $10,313,869 $6,403,105
Information Technology - Fibre Optic
Interim March 2015
Register TBD
$5,099,387 $3,059,632
Fleet June 2013 Finance One
$3,791,638 $3,005,826
Plant and Equipment June 2013 Finance One
$8,438,248 $5,141,007
Buildings- All March 2015 Finance One▲
$297,147,224 $272,763,933
Sub Total $1,130,687,355 $778,491,722
Land - All March 2015 Finance One▲▲
$415,551,213 $415,551,213
Total $1,546,238,568 $1,204,042,935
Notes: *These Asset valuations were formally ‘loaded’ for revaluation purposes in March 2015.
** Asset Category located in Finance One ▲External Valuation March 2015 ▲▲External Valuation March 2015 adjusted internally June 2015 1. Assets approved for Disposal from the MRA Elizabeth Quay Project remain within these valuations 2. Assets that may have been disposed of within the MRA Riverside Project Stages 1, 2 and 3 remain within these
valuations.
C O R P O R A T E A S S E T M A N A G E M E N T P L A N 2 0 1 5 - 2 0 2 5
Page 23
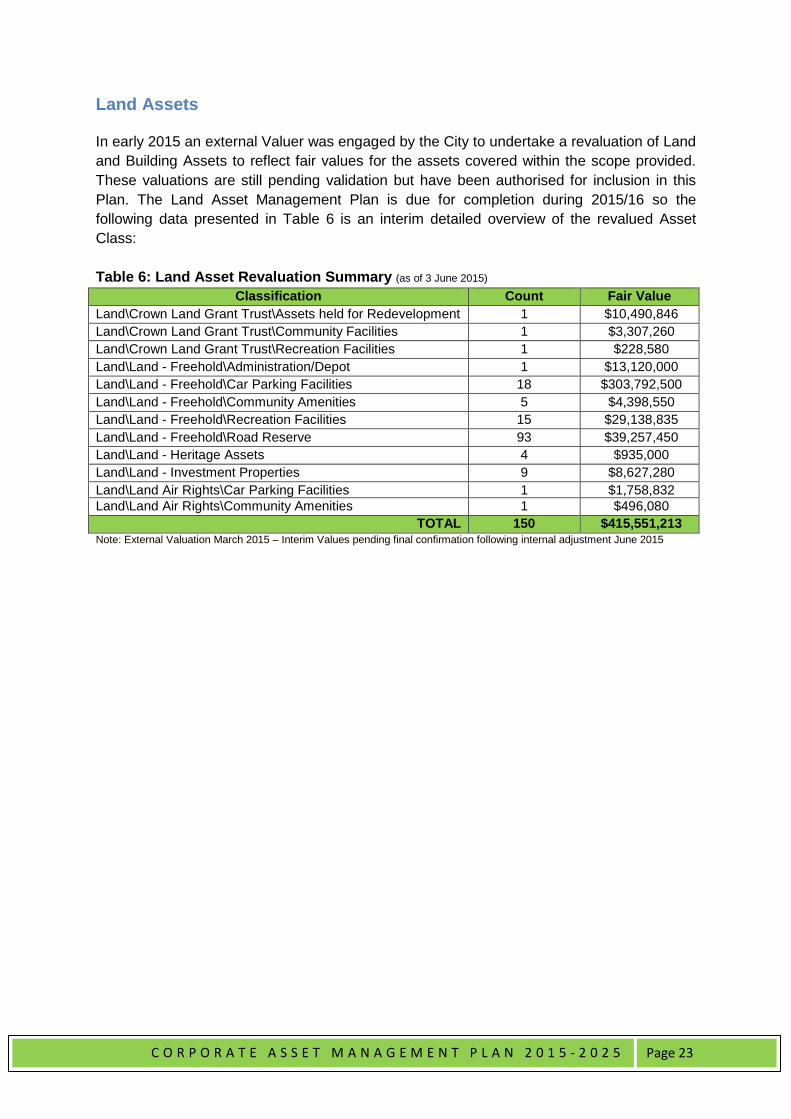
Land Assets
In early 2015 an external Valuer was engaged by the City to undertake a revaluation of Land and Building Assets to reflect fair values for the assets covered within the scope provided. These valuations are still pending validation but have been authorised for inclusion in this Plan. The Land Asset Management Plan is due for completion during 2015/16 so the following data presented in Table 6 is an interim detailed overview of the revalued Asset Class: Table 6: Land Asset Revaluation Summary (as of 3 June 2015)
Classification Count Fair Value Land\Crown Land Grant Trust\Assets held for Redevelopment 1 $10,490,846 Land\Crown Land Grant Trust\Community Facilities 1 $3,307,260 Land\Crown Land Grant Trust\Recreation Facilities 1 $228,580 Land\Land - Freehold\Administration/Depot 1 $13,120,000 Land\Land - Freehold\Car Parking Facilities 18 $303,792,500 Land\Land - Freehold\Community Amenities 5 $4,398,550 Land\Land - Freehold\Recreation Facilities 15 $29,138,835 Land\Land - Freehold\Road Reserve 93 $39,257,450 Land\Land - Heritage Assets 4 $935,000 Land\Land - Investment Properties 9 $8,627,280 Land\Land Air Rights\Car Parking Facilities 1 $1,758,832 Land\Land Air Rights\Community Amenities 1 $496,080
TOTAL 150 $415,551,213 Note: External Valuation March 2015 – Interim Values pending final confirmation following internal adjustment June 2015

C O R P O R A T E A S S E T M A N A G E M E N T P L A N 2 0 1 5 - 2 0 2 5
Page 24
Building Assets
As indicated above an external Valuer undertook the revaluation of the City’s Building Assets in March 2015. The structure of the revaluation undertaken by asset type is not directly aligned to the City’s asset management register so further internal work needs to be progressed in the coming period to map asset types / attributes with functional business activities and Units within the City. The Building Asset Management Plan is due for completion during 2015/16 so Table 7 is an interim detailed overview of the revaluation is provided:
Table 7: Building Asset Revaluation Summary (as of 8 April 2015)
Asset Type Gross Value (CRC) $
Fair Value (DRC) $
Accumulated Depreciation
$ Depreciation Expense $
Residual Value $
Substructure 59,034,597 55,432,147 3,602,449 174,602 23,613,838 Superstructure 55,384,111 51,318,096 4,066,014 221,783 27,692,055 Floor coverings 5,549,755 3,085,679 2,464,076 322,747 323,940 Fitout & fittings 5,258,869 4,149,135 1,109,733 154,835 2,103,547 Roof 17,663,295 15,765,915 1,897,379 123,281 8,831,647 Mechanical 21,983,434 17,762,261 4,221,172 399,559 5,441,534 Fire 4,759,181 4,417,816 341,364 29,289 3,331,427 Transport 6,893,282 6,674,770 218,511 51,240 4,825,297 Electrical 18,287,149 14,757,236 3,529,912 188,494 5,486,144 Hydraulic 12,889,452 10,173,861 2,715,590 135,905 3,866,835 Security 1,103,557 886,473 217,083 51,499 331,067 Building(mv) 88,340,539 88,340,539 0 0 0
TOTAL $297,147,224 $272,763,933 $24,383,290 $1,853,238 $85,847,336 Note: External Valuation March 2015 – Interim Values pending validation by Finance but authorized for use within this Plan
C O R P O R A T E A S S E T M A N A G E M E N T P L A N 2 0 1 5 - 2 0 2 5
Page 25
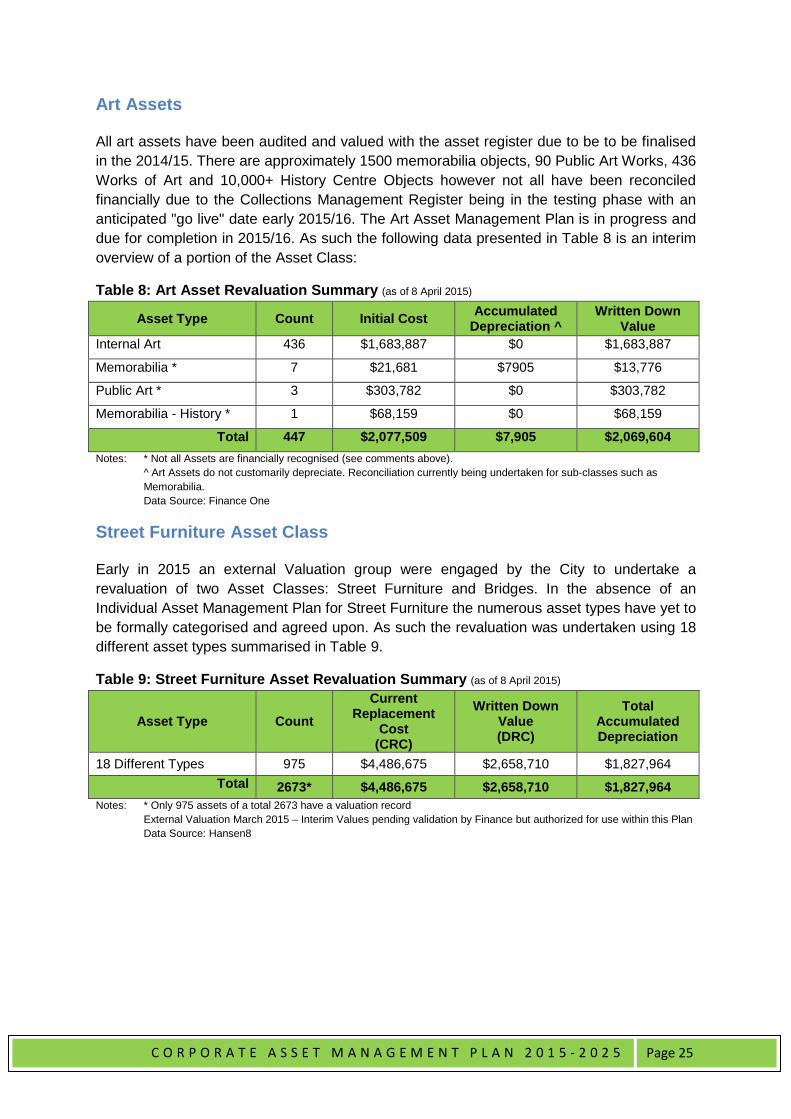
Art Assets
All art assets have been audited and valued with the asset register due to be to be finalised in the 2014/15. There are approximately 1500 memorabilia objects, 90 Public Art Works, 436 Works of Art and 10,000+ History Centre Objects however not all have been reconciled financially due to the Collections Management Register being in the testing phase with an anticipated "go live" date early 2015/16. The Art Asset Management Plan is in progress and due for completion in 2015/16. As such the following data presented in Table 8 is an interim overview of a portion of the Asset Class:
Table 8: Art Asset Revaluation Summary (as of 8 April 2015)
Asset Type Count Initial Cost Accumulated Depreciation ^
Written Down Value
Internal Art 436 $1,683,887 $0 $1,683,887
Memorabilia * 7 $21,681 $7905 $13,776
Public Art * 3 $303,782 $0 $303,782
Memorabilia - History * 1 $68,159 $0 $68,159
Total 447 $2,077,509 $7,905 $2,069,604 Notes: * Not all Assets are financially recognised (see comments above).
^ Art Assets do not customarily depreciate. Reconciliation currently being undertaken for sub-classes such as Memorabilia. Data Source: Finance One
Street Furniture Asset Class
Early in 2015 an external Valuation group were engaged by the City to undertake a revaluation of two Asset Classes: Street Furniture and Bridges. In the absence of an Individual Asset Management Plan for Street Furniture the numerous asset types have yet to be formally categorised and agreed upon. As such the revaluation was undertaken using 18 different asset types summarised in Table 9.
Table 9: Street Furniture Asset Revaluation Summary (as of 8 April 2015)
Asset Type Count Current
Replacement Cost
(CRC)
Written Down Value (DRC)
Total Accumulated Depreciation
18 Different Types 975 $4,486,675 $2,658,710 $1,827,964 Total 2673* $4,486,675 $2,658,710 $1,827,964
Notes: * Only 975 assets of a total 2673 have a valuation record External Valuation March 2015 – Interim Values pending validation by Finance but authorized for use within this Plan Data Source: Hansen8
C O R P O R A T E A S S E T M A N A G E M E N T P L A N 2 0 1 5 - 2 0 2 5
Page 26
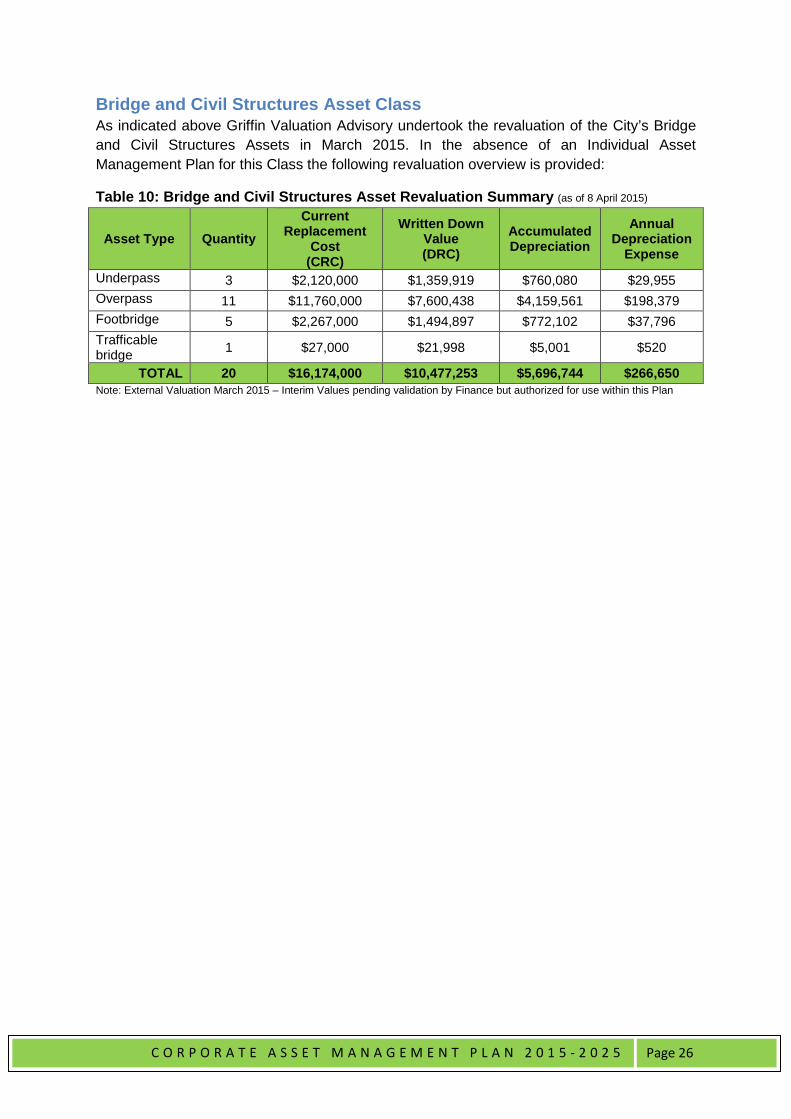
Bridge and Civil Structures Asset Class As indicated above Griffin Valuation Advisory undertook the revaluation of the City’s Bridge and Civil Structures Assets in March 2015. In the absence of an Individual Asset Management Plan for this Class the following revaluation overview is provided:
Table 10: Bridge and Civil Structures Asset Revaluation Summary (as of 8 April 2015)
Asset Type Quantity Current
Replacement Cost
(CRC)
Written Down Value (DRC)
Accumulated Depreciation
Annual Depreciation
Expense
Underpass 3 $2,120,000 $1,359,919 $760,080 $29,955 Overpass 11 $11,760,000 $7,600,438 $4,159,561 $198,379 Footbridge 5 $2,267,000 $1,494,897 $772,102 $37,796 Trafficable bridge 1 $27,000 $21,998 $5,001 $520
TOTAL 20 $16,174,000 $10,477,253 $5,696,744 $266,650 Note: External Valuation March 2015 – Interim Values pending validation by Finance but authorized for use within this Plan
C O R P O R A T E A S S E T M A N A G E M E N T P L A N 2 0 1 5 - 2 0 2 5
Page 27
6. Life Cycle Management
Asset Performance
The asset management key performance indicators required for reporting under the IPR Framework are shown in Table 11 below. The Asset Consumption Ratio (ACR) has been calculated across the majority of Asset Classes (see Table 12) however the Asset Sustainability Ratio (ASR) cannot be accurately determined at present. The Asset Renewal Funding Ratio has been determined holistically for the organisations assets (see Figure 2). Increased robustness in 10 year capital budgeting in both forecasting and expenditure will enable fuller reporting to emerge and greater accuracy in key performance indicator reporting. In addition to achieving a full reconciliation between the City’s financial management and asset management systems will be important in 2015/16 to structure both capital budget planning and expenditure, by way of 4 categories:
• New; • Upgrade; • Renewal (replacement); and • Expansion.
Individual Asset Class Plans contain 10 Year Forecasts for Operational, Maintenance and Renewal Programs, however these are also building in maturity and accuracy as more holistic data is being captured across multiple functional areas within the organisation. These costs flow into Business Unit Plans and Budgets and inform the City’s Corporate Budget Cycle and Plans.
C O R P O R A T E A S S E T M A N A G E M E N T P L A N 2 0 1 5 - 2 0 2 5
Page 28
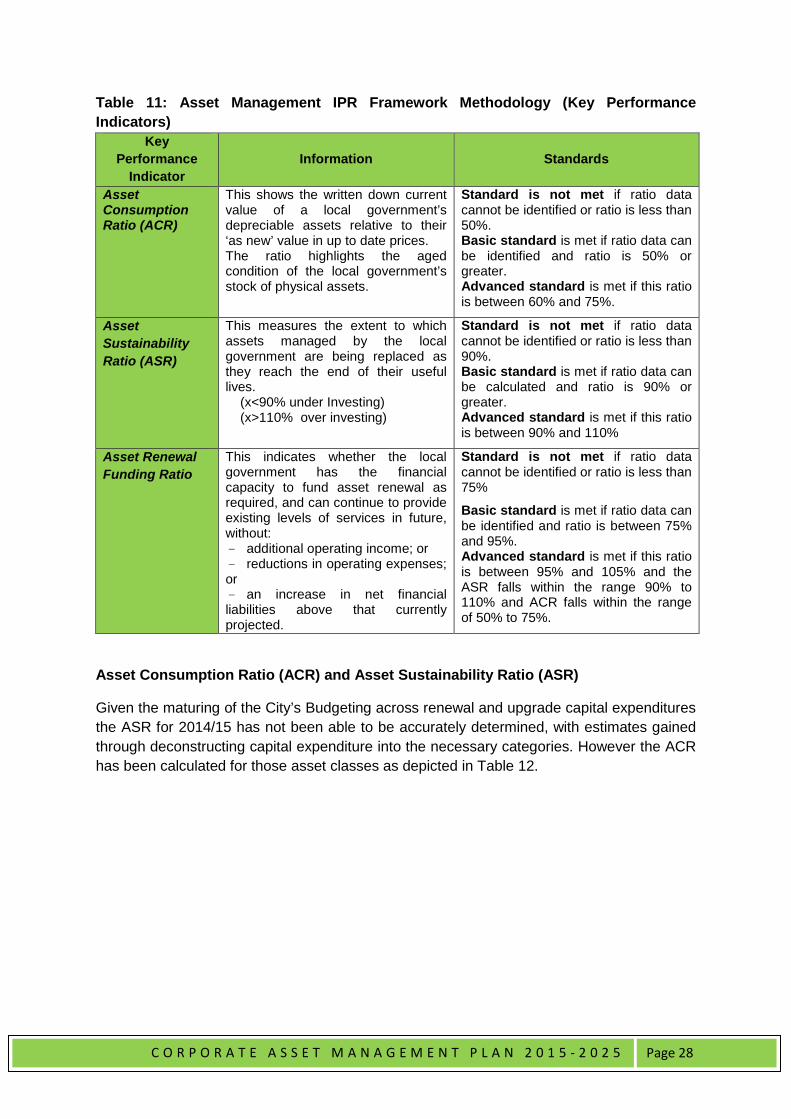
Table 11: Asset Management IPR Framework Methodology (Key Performance Indicators)
Key Performance
Indicator Information Standards
Asset Consumption Ratio (ACR)
This shows the written down current value of a local government’s depreciable assets relative to their ‘as new’ value in up to date prices. The ratio highlights the aged condition of the local government’s stock of physical assets.
Standard is not met if ratio data cannot be identified or ratio is less than 50%. Basic standard is met if ratio data can be identified and ratio is 50% or greater. Advanced standard is met if this ratio is between 60% and 75%.
Asset Sustainability Ratio (ASR)
This measures the extent to which assets managed by the local government are being replaced as they reach the end of their useful lives. (x<90% under Investing) (x>110% over investing)
Standard is not met if ratio data cannot be identified or ratio is less than 90%. Basic standard is met if ratio data can be calculated and ratio is 90% or greater. Advanced standard is met if this ratio is between 90% and 110%
Asset Renewal Funding Ratio
This indicates whether the local government has the financial capacity to fund asset renewal as required, and can continue to provide existing levels of services in future, without: - additional operating income; or - reductions in operating expenses; or - an increase in net financial liabilities above that currently projected.
Standard is not met if ratio data cannot be identified or ratio is less than 75%
Basic standard is met if ratio data can be identified and ratio is between 75% and 95%. Advanced standard is met if this ratio is between 95% and 105% and the ASR falls within the range 90% to 110% and ACR falls within the range of 50% to 75%.
Asset Consumption Ratio (ACR) and Asset Sustainability Ratio (ASR)
Given the maturing of the City’s Budgeting across renewal and upgrade capital expenditures the ASR for 2014/15 has not been able to be accurately determined, with estimates gained through deconstructing capital expenditure into the necessary categories. However the ACR has been calculated for those asset classes as depicted in Table 12.
C O R P O R A T E A S S E T M A N A G E M E N T P L A N 2 0 1 5 - 2 0 2 5
Page 29
Table 12: Asset Consumption and Asset Sustainability Ratios by Asset Class
Asset Class Data
Source Used
Asset Consumption Ratio (ACR)
Asset Sustainability Ratio (ASR)♣
2014/15 Standard Achieved
2013/14 Actual
Standard Achieved
Infrastructure – Roads Hansen8 48% Not Met 176% Over Investing
Infrastructure - Paths Hansen8 51% Basic 130% Over Investing
Infrastructure - Lights Hansen8 47% Not Met 12% Under Investing
Infrastructure - Parks & Landscape Hansen8 78% Advanced 47% Under
Investing Infrastructure - Riverbank Hansen8 63% Advanced 611% Over
Investing Infrastructure - Bridges & Civil Structures ^ Hansen8 65% Advanced 0% Under
Investing Infrastructure - Street Furniture ^ Hansen8 59% Basic 13% Under
Investing Infrastructure - Drainage Hansen8 52% Basic 1268% Over
Investing Infrastructure - City of Perth Parking Hansen8 33% Not Met 94% Advanced
Art – Art and Heritage ^
Finance One N/A N/A
Other Assets – New Library ^
Finance One N/A N/A
Other Assets – History Centre ^
Finance One N/A N/A
Information Technology - Fibre Optic
Interim* 60% Advanced*
37% Under Investing
Information Technology - Other ^ No Register N/A
Information Technology – Compliance ^
Finance One N/A
Fleet Finance One 80% Advanced 216% Over
Investing
Plant and Equipment Finance One 61% Advanced 143% Over
Investing Buildings – Council House
Finance One▲
91% Advanced 87% Under Investing
Buildings – All ^ Finance One▲
71% Advanced 37% Under Investing
Land - All^ Finance One▲
N/A N/A
Average Ratio 61.36% Advanced 101% Advanced Notes: ^ No Asset Management Plan
▲External Valuation March 2015 – Interim Values pending validation by Finance but authorized for use in this Plan ♣ Data as of 31 March 2015 therefore unable to calculate for 2014/15. * External Valuation is nearing completion (due 31 May 2015), therefore termed interim
C O R P O R A T E A S S E T M A N A G E M E N T P L A N 2 0 1 5 - 2 0 2 5
Page 30
The Average Asset Consumption Ratio (ACR) for 14 Asset Classes is 61.36% which is deemed an Advanced Standard however within these 15 Classes, 3 Classes have not met a Basic Standard for the ACR:
• Infrastructure Roads; • Infrastructure Lights; and • Infrastructure City of Perth Parking.
By way of comparison the 2013/2014 Corporate Plan reported an Average ACR for 9 Asset Classes of 56%, which was deemed as Basic Standard.
Asset Renewal Funding Ratio (ARFR)
The Asset Renewal Funding Ratio (ARFR) has been determined by using the current Corporate 10 Year Plan - Renewal & Upgrade Data2 with forecasted data being a hybrid of the Corporate 10 Year Plan and individual Asset Management plans. In some instances these data sets were the same however there were some minor variances. The average ARFR over the 10 year period is 98%.
In general the forecast and budget does not vary considerably as there appears to be limited funding constraints placed on renewal and replacement programs at the present time. The Advanced Standard is met if this ratio is between 95% and 105% and it would therefore appear overall that the City is well placed and has the financial capacity to fund asset renewal as required, and as such continue to provide existing levels of services in the coming 10 year period. However as condition assessments are undertaken, coupled with transparency in demand forecasting and differentiation in capital expenditure then this position will change.
Figure 2: Asset Renewal Funding Ratio 2015/16 to 2024/25
Note: Planned expenditure taken from individual Asset Management Plans and the budgeted renewal and upgrade capital expenditure from the 10 year corporate capital expenditure plan as at 20-Feb-2015
2 Draft Corporate Budget as of 20 February 2015.
C O R P O R A T E A S S E T M A N A G E M E N T P L A N 2 0 1 5 - 2 0 2 5
Page 31
Condition Rating
The City is progressing toward implementing structured condition assessments for each of the respective asset classes. The adopted advisory guidelines in Table 14 below are to be used across all Asset Classes and reported annually in each individual Asset Management Plan. Of the ten (10) Plans submitted in 2014/15 eight (8) have outlined progress toward undertaking condition assessments. It is essential that condition assessments are undertaken comprehensively as it allows for a better understanding to be gained on asset deterioration and failure modes, enabling any intervention or replacement planning to occur. The ongoing due diligence of these assessments will build greater transparency and robustness into maximising asset performance and forecasting asset budgeting needs; which feeds directly into Business Unit Plans and into the long term financial plan for the City. Table 14: Asset Condition Rating Guidelines
Rating Condition Description Performance Action Plan Maintenance Classification
1
Asset that has been recently installed or re -conditioned back to as-new
Good Condition
Predictive Maintenance
Planned Maintenance
Asset should not show any wear or fatigue characteristics Asset is expected to function fully as designed and deliver service level fully as intended.
2 An asset shows early stages of deterioration and wear Minor
Deterioration Preventative Maintenance There is no reduction in service
level delivery of the asset
3
Asset shows very obvious signs of deterioration
Fair Condition
Cyclic Maintenance
There will be some service delivery losses Planned maintenance action will be required to restore asset service level delivery
4 An asset is showing severe signs of deterioration Poor
Condition Reactive Maintenance
Unplanned Maintenance
Prompt actions have to be taken to avoid major service delivery failure
5
Asset has failed and is no longer capable of delivering services as intended
Failed Asset
Breakdown Maintenance / Asset Renewal
In some cases, it will be a risk in leaving the asset in service Urgent action will be required to replace or rehabilitate the asset.
0 Unable to Inspect / Missed Inspection Investigate - NA Not Applicable - -
CNYA Condition Not Yet Assessed Inspection Plan -
Data Source: Asset Management Advisory Standards

C O R P O R A T E A S S E T M A N A G E M E N T P L A N 2 0 1 5 - 2 0 2 5
Page 32
Risk Assessment
Individual Asset Management Plans address Risk Management by way of developing, monitoring and reporting on individual Risk Management Plans for respective asset classes as per the City’s Risk Management Policy Framework. Please refer to individual Plans for details pertaining to identified risk and mitigations put in place to minimise them.
Age Profiling
Asset useful lives are defined and recorded in the respective asset register. The useful life of the asset is used to calculate the assets current age and remaining life. In the absence of condition rating data and/or other performance measures, remaining life is used as an indication of asset deterioration and possible need for intervention or further assessment. Remaining lives are reviewed annually and updated in the asset register.
The age profile of the major Asset Classes owned and managed by the City are indicated in Figure 3. The average useful life for the 15 asset classes, as presented in Figure 3, is 37 years and the remaining life is 23 years, i.e. 62%.
Figure 3: Combined Asset Class Age profile 2014/15 Note: Asset useful life and remaining life is also used to calculate straight line depreciation for infrastructure assets
0.00
20.00
40.00
60.00
80.00
100.00
120.00
Year
s
Asset Class
FY 2014/15 Combined Asset Class Age Profile AverageUseful Life(Yrs)AverageRemaining Life(Yrs)Total Avg Life
TotalRemainingLife
C O R P O R A T E A S S E T M A N A G E M E N T P L A N 2 0 1 5 - 2 0 2 5
Page 33
Table 14 below outlines the Asset Age Profile for each available Asset Class for both Average Useful Life and Average Remaining Life.
Table 14: Individual Asset Class Age Profiles
Asset Class Average Useful Life (Yrs)
Average Remaining Life
(Yrs)
Infrastructure – Roads 44.00 20.20
Infrastructure – Paths 40.50 23.80
Infrastructure – Lights 19.80 8.30
Infrastructure – Parks & Landscape 20.70 12.40
Infrastructure – Riverbank (Hard Landscape)* 49.00 33.00
Infrastructure – Bridges & Civil Structures 54.40 37.20
Infrastructure – Street Furniture 11.90 6.50
Infrastructure – Drainage 73.60 35.70
Infrastructure – City of Perth Parking 11.40 4.70
Fleet 2.80 1.40
Plant and Equipment 5.80 2.70
Buildings – Council House 54.20 28.70
Buildings – All 46.40 27.70
Land – All 100.00 86.60
Information Technology – Fibre Optic 25.00 15.00
Art – Art and Heritage N/A
Other assets – New Library ^ N/A
Other assets – History Centre^ N/A
Information Technology – Other N/A
Information Technology – Compliance N/A
C O R P O R A T E A S S E T M A N A G E M E N T P L A N 2 0 1 5 - 2 0 2 5
Page 34
7. Future Demand
Each Individual Asset Class Plan details any challenges that lay ahead and how the future growth and development of the City, both as an organisation and the community and CBD at large, will impact individual assets. However this Plan outlines holistically at a corporate level the challenges of meeting future demand needs and opportunities.
Considerations and Challenges
With the introduction of increased transparency surrounding capital projects via the Gateways Accountability Framework, the proposed organisational restructure The New City of Perth, and greater robustness in budgeting, the ability for the City to manage its assets more effectively, is improving.
Simply a number of questions must be posed to enable a sustainable position to be established:
• How does the City meet the increasing demand for new and upgraded infrastructure? • How does the City prolong the useful life of assets or renew existing infrastructure? • How does the City fund the maintenance and operation of contributed assets? (eg
MRA Projects and Capital City Act outcomes) • How will the City pay for all of this?
Through collaboration and coordination across the City a sustainable position will be established for managing the assets over the longer term. Asset Custodians must develop renewal profiles for longer periods, at minimum 15-30 years, to ensure financial sustainability and allow for the City Long Term Financial Plan to be strengthened through effective asset management practices.

C O R P O R A T E A S S E T M A N A G E M E N T P L A N 2 0 1 5 - 2 0 2 5
Page 35
Future Opportunities and Strategies
Improvements or opportunities identified from a strategic or corporate perspective for consideration and implementation from 2015/16 are listed below, with tactical and operational level improvements residing within individual Asset Class Plans:
• Completion of all remaining Asset Management Plans; • Creation of remaining Asset Class Registers; • Development of an Asset Management Strategy; • Improved forecasting for renewal and replacement of assets (ie demand forecasting); • Greater transparency and accuracy of data within the 10 Year Capital Works Plan(ie
budget and expenditure defined as new, upgrade; renewal (replacement); and expansion;
• Integration and consolidation of data by Asset Custodians to ensure corporate ‘completeness’ of their Asset Plan;
• Development of a rolling Revaluation Plan to ensure all Asset Classes are revalued in accordance to legislated requirements and aligned to internal corporate timeframes;
• Reconciliation to be attained between the General Ledger and asset management system;
• Development of a Data Migration Plan for asset registers to be consolidated into a single corporate asset register (ie Hansen8);
• Improved accuracy and integrity of data in asset registers, inclusive of revised system access rights;
• System enhancements for revalued assets and uploading different asset classes; • Undertake community survey/s on service level expectations for all Asset Classes; • Condition assessments to be undertaken across all necessary Asset Classes; • Establish and verify Unit rates for all key asset components; • Improve accuracy and details of whole of life cycle costs for assets; • Establish and integrate environmental management factors into individual asset
management plans and practices; and • Aligned to the International Infrastructure Management Manual (2012) the City is
maturing towards lifecycle asset management with the objective of looking at the lowest long term cost option rather than short term savings when making decisions on asset management; thus providing significant benefits for the organisation and community (See Section 3.0 for details).
C O R P O R A T E A S S E T M A N A G E M E N T P L A N 2 0 1 5 - 2 0 2 5
Page 36
8. Contacts
Gary Stevenson PSM Chief Executive Officer [email protected]
Robert Mianich Director Corporate Services [email protected]
Dan Richards Manager Finance [email protected]

27 St Georges Terrace, Perth, Western Australia GPO Box C120 Perth, Western Australia 6839
Phone +61 9 9461 3333 Facsimile +61 8 9461 3083Email [email protected]
Internet www.cityofperth.wa.gov.auABN 83 780 118 628