
Coronavirus May Be a Black Swan Like No Other€¦ · JANUARY WEEKLY MARKET OUTLOOK 30, 2020...
24
JANUARY 30, 2020 CAPITAL MARKETS RESEARCH Moody’s Analytics markets and distributes all Moody’s Capital Markets Research, Inc. materials. Moody’s Capital Markets Research, Inc. is a subsidiary of Moody’s Corporation. Moody’s Analytics does not provide investment advisory services or products. For further detail, please see the last page. Coronavirus May Be a Black Swan Like No Other Credit Markets Review and Outlook by John Lonski Coronavirus May Be a Black Swan Like No Other » FULL STORY PAGE 2 The Week Ahead We preview economic reports and forecasts from the US, UK/Europe, and Asia/Pacific regions. » FULL STORY PAGE 6 The Long View Full updated stories and key credit market metrics: Moody’s long-term single- A and Baa industrial company bond yields have sunk to levels last observed in 1956. » FULL STORY PAGE 10 Ratings Round-Up U.S. Rating Change Activity Weakens » FULL STORY PAGE 13 Market Data Credit spreads, CDS movers, issuance. » FULL STORY PAGE 17 Moody’s Capital Markets Research recent publications Links to commentaries on: Corporate credit, thin spreads, leverage, rate sensitivity, sentiment, VIX, fundamentals, next recession, liquidity and defaults, cheap money, fallen angels, Fed moves, yields, inversions, unmasking danger, divining markets, upside risks. » FULL STORY PAGE 22 Click here for Moody’s Credit Outlook, our sister publication containing Moody’s rating agency analysis of recent news events, summaries of recent rating changes, and summaries of recent research. Credit Spreads Investment Grade: We see the year-end 2020’s average investment grade bond spread above its recent 113 basis points. High Yield: Compared with a recent 415 bp, the high- yield spread may approximate 450 bp by year-end 2020. Defaults US HY default rate: Moody's Investors Service’s Default Report has the U.S.' trailing 12-month high-yield default rate dipping from December 2019’s actual 4.2% to a baseline estimate of 3.5% for December 2020. Issuance For 2019’s offerings of US$-denominated corporate bonds, IG bond issuance rose by 2.6% to $1.309 trillion, while high- yield bond issuance surged by 55.8% to $432 billion. In 2020, US$-denominated corporate bond issuance is expected to rise by 6.4% for IG to $1.393 trillion, while high- yield supply may grow by 3.4% to $447 billion. Moody’s Analytics Research Weekly Market Outlook Contributors: Moody's Analytics/New York: John Lonski Chief Economist 1.212.553.7144 [email protected] Moody's Analytics/Asia-Pacific: Katrina Ell Economist Moody's Analytics/Europe: Barbara Teixeira Araujo Economist Moody’s Analytics/U.S.: Ryan Sweet Economist Steven Shields Economist Andrew Pak Economist Editor Reid Kanaley Contact: [email protected]
Transcript of Coronavirus May Be a Black Swan Like No Other€¦ · JANUARY WEEKLY MARKET OUTLOOK 30, 2020...
WEEKLY MARKET OUTLOOK
JANUARY 30, 2020
CAPITAL MARKETS RESEARCH
Moody’s Analytics markets and distributes all Moody’s Capital Markets Research, Inc. materials. Moody’s Capital Markets Research, Inc. is a subsidiary of Moody’s Corporation. Moody’s Analytics does not provide investment advisory services or products. For further detail, please see the last page.
Coronavirus May Be a Black Swan Like No Other
Credit Markets Review and Outlook by John Lonski Coronavirus May Be a Black Swan Like No Other
» FULL STORY PAGE 2
The Week Ahead We preview economic reports and forecasts from the US, UK/Europe, and Asia/Pacific regions.
» FULL STORY PAGE 6
The Long View Full updated stories and key credit market metrics: Moody’s long-term single-A and Baa industrial company bond yields have sunk to levels last observed in 1956.
» FULL STORY PAGE 10
Ratings Round-Up U.S. Rating Change Activity Weakens
» FULL STORY PAGE 13
Market Data Credit spreads, CDS movers, issuance.
» FULL STORY PAGE 17
Moody’s Capital Markets Research recent publications Links to commentaries on: Corporate credit, thin spreads, leverage, rate sensitivity, sentiment, VIX, fundamentals, next recession, liquidity and defaults, cheap money, fallen angels, Fed moves, yields, inversions, unmasking danger, divining markets, upside risks.
» FULL STORY PAGE 22
Click here for Moody’s Credit Outlook, our sister publication containing Moody’s rating agency analysis of recent news events, summaries of recent rating changes, and summaries of recent research.
Credit Spreads
Investment Grade: We see the year-end 2020’s average investment grade bond spread above its recent 113 basis points. High Yield: Compared with a recent 415 bp, the high-yield spread may approximate 450 bp by year-end 2020.
Defaults US HY default rate: Moody's Investors Service’s Default Report has the U.S.' trailing 12-month high-yield default rate dipping from December 2019’s actual 4.2% to a baseline estimate of 3.5% for December 2020.
Issuance For 2019’s offerings of US$-denominated corporate bonds, IG bond issuance rose by 2.6% to $1.309 trillion, while high-yield bond issuance surged by 55.8% to $432 billion. In 2020, US$-denominated corporate bond issuance is expected to rise by 6.4% for IG to $1.393 trillion, while high-yield supply may grow by 3.4% to $447 billion.
Moody’s Analytics Research
Weekly Market Outlook Contributors: Moody's Analytics/New York: John Lonski Chief Economist 1.212.553.7144 [email protected] Moody's Analytics/Asia-Pacific: Katrina Ell Economist Moody's Analytics/Europe: Barbara Teixeira Araujo Economist Moody’s Analytics/U.S.: Ryan Sweet Economist Steven Shields Economist Andrew Pak Economist
Editor Reid Kanaley
Contact: [email protected]
CAPITAL MARKETS RESEARCH
2 JANUARY 30, 2020 CAPITAL MARKETS RESEARCH / MARKET OUTLOOK / MOODYS.COM
Credit Markets Review and Outlook
Credit Markets Review and Outlook By John Lonski, Chief Economist, Moody’s Capital Markets Research, Inc.
Coronavirus May Be a Black Swan Like No Other A coronavirus pandemic would be even more of a “black swan” than the global financial crisis and Great Recession of 2008-2009. Unlike the U.S. home mortgage meltdown, no one predicted the early 2020 arrival of a potentially devastating pandemic. And unlike the financial crisis, public-health and economic policymakers may be limited regarding their ability to remedy or offset a 1918 (or Spanish flu) type pandemic.
Moody’s Analytics’ industrial metals price index has plunged in response to the risks posed by the possible spread of the coronavirus. To a considerable degree, the latest bout of industrial metals price deflation stems from China’s outsized influence on global industrial activity.
The 7.1% plunge by the industrial metals price index since the arrival of coronavirus risks included price setbacks of 10.4% for copper, 8.7% for nickel, 8.2% for tin, 7.3% for zinc, 4.6% for lead, and 3.5% for aluminum. January 29’s base metals price index was the lowest since June 2017. Thus, this often-reliable barometer of global industrial activity fared better during the worst of the U.S./China trade dispute that came to the forefront in June 2018.
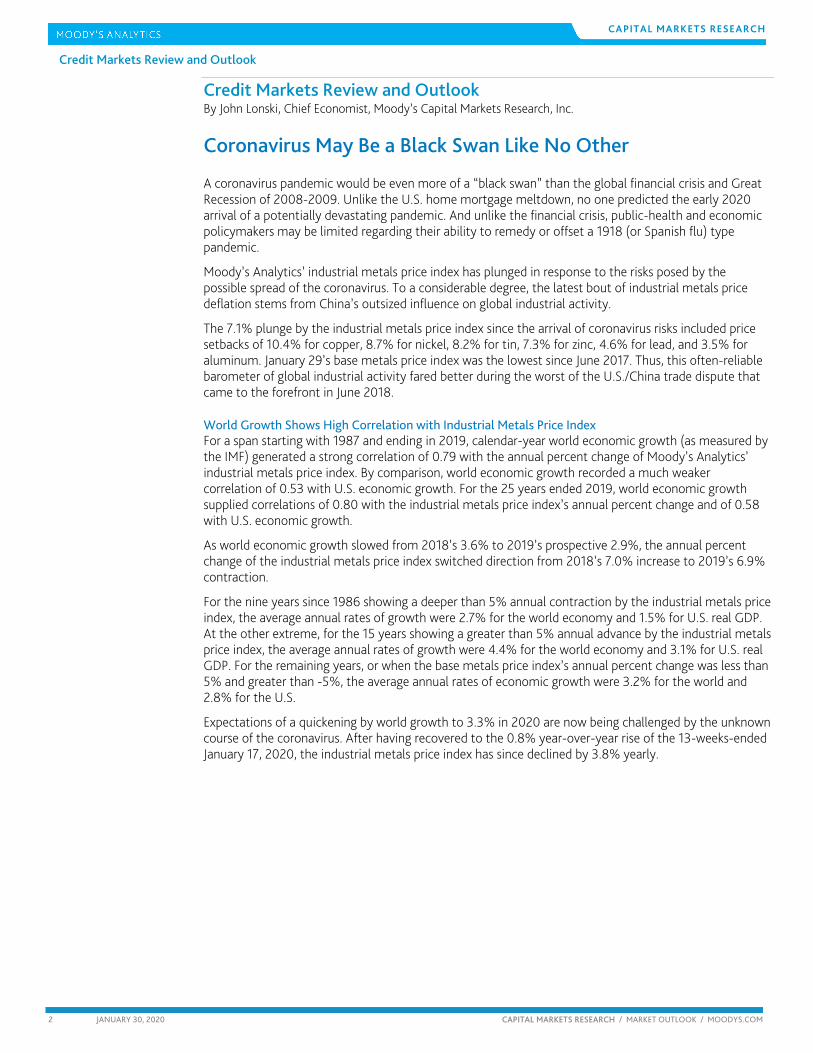
World Growth Shows High Correlation with Industrial Metals Price Index For a span starting with 1987 and ending in 2019, calendar-year world economic growth (as measured by the IMF) generated a strong correlation of 0.79 with the annual percent change of Moody’s Analytics’ industrial metals price index. By comparison, world economic growth recorded a much weaker correlation of 0.53 with U.S. economic growth. For the 25 years ended 2019, world economic growth supplied correlations of 0.80 with the industrial metals price index’s annual percent change and of 0.58 with U.S. economic growth.
As world economic growth slowed from 2018’s 3.6% to 2019’s prospective 2.9%, the annual percent change of the industrial metals price index switched direction from 2018’s 7.0% increase to 2019’s 6.9% contraction.
For the nine years since 1986 showing a deeper than 5% annual contraction by the industrial metals price index, the average annual rates of growth were 2.7% for the world economy and 1.5% for U.S. real GDP. At the other extreme, for the 15 years showing a greater than 5% annual advance by the industrial metals price index, the average annual rates of growth were 4.4% for the world economy and 3.1% for U.S. real GDP. For the remaining years, or when the base metals price index’s annual percent change was less than 5% and greater than -5%, the average annual rates of economic growth were 3.2% for the world and 2.8% for the U.S.
Expectations of a quickening by world growth to 3.3% in 2020 are now being challenged by the unknown course of the coronavirus. After having recovered to the 0.8% year-over-year rise of the 13-weeks-ended January 17, 2020, the industrial metals price index has since declined by 3.8% yearly.
CAPITAL MARKETS RESEARCH
3 JANUARY 30, 2020 CAPITAL MARKETS RESEARCH / MARKET OUTLOOK / MOODYS.COM
Credit Markets Review and Outlook
Base Metals Prices Were Subpar Prior to Arrival of Pandemic Fears Even before the outbreak of the coronavirus, global industrial activity was steadying at merely a sluggish pace. The industrial metals price index was not even close to mimicking its recovery following the global slowdown and profits recession of 2015-2016.
For example, February 2016’s base metals price index was up by a substantial 6.5% from its January 2016 bottom. Prior to the arrival of coronavirus fears, the January-to-date average of the industrial metals price index was only 1.7% above December 2019’s low and 0.5% under its average of 2019’s second half.
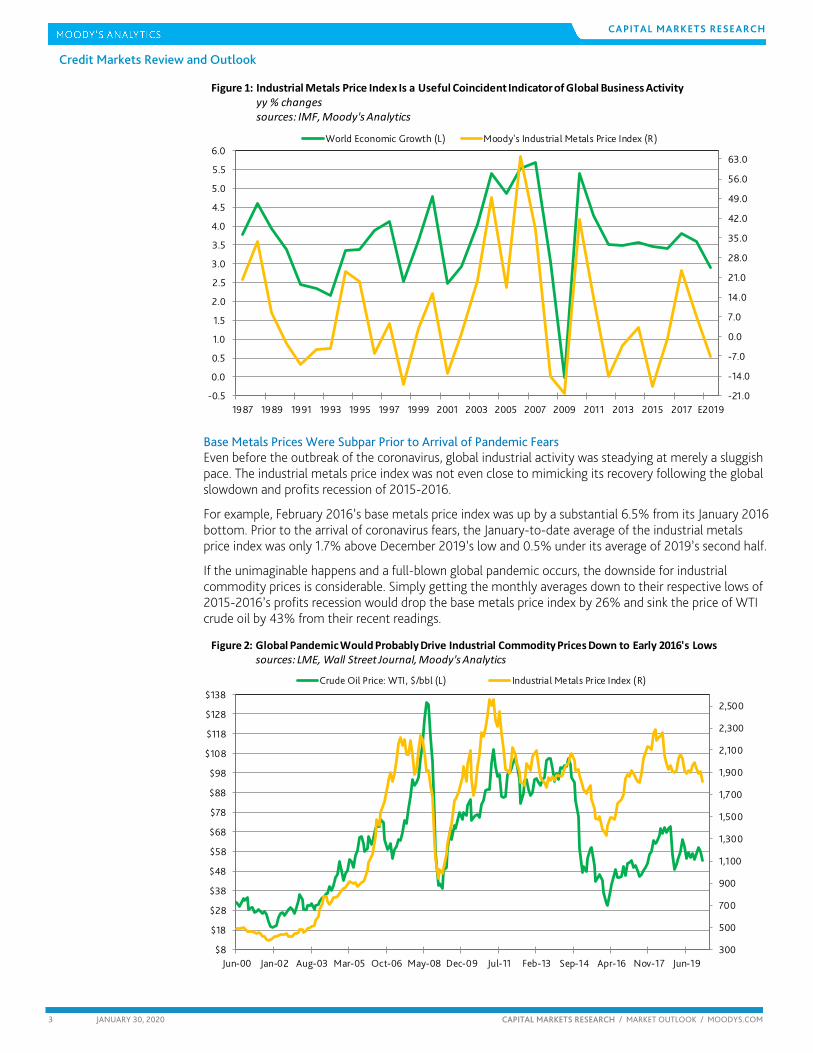
If the unimaginable happens and a full-blown global pandemic occurs, the downside for industrial commodity prices is considerable. Simply getting the monthly averages down to their respective lows of 2015-2016’s profits recession would drop the base metals price index by 26% and sink the price of WTI crude oil by 43% from their recent readings.
-21.0
-14.0
-7.0
0.0
7.0
14.0
21.0
28.0
35.0
42.0
49.0
56.0
63.0
1987 1989 1991 1993 1995 1997 1999 2001 2003 2005 2007 2009 2011 2013 2015 2017 E2019-0.5
0.0
0.5
1.0
1.5
2.0
2.5
3.0
3.5
4.0
4.5
5.0
5.5
6.0World Economic Growth (L) Moody's Industrial Metals Price Index (R)
Figure 1: Industrial Metals Price Index Is a Useful Coincident Indicator of Global Business Activity yy % changes sources: IMF, Moody's Analytics
300
500
700
900
1,100
1,300
1,500
1,700
1,900
2,100
2,300
2,500
Jun-00 Jan-02 Aug-03 Mar-05 Oct-06 May-08 Dec-09 Jul-11 Feb-13 Sep-14 Apr-16 Nov-17 Jun-19$8
$18
$28
$38
$48
$58
$68
$78
$88
$98
$108
$118
$128
$138Crude Oil Price: WTI, $/bbl (L) Industrial Metals Price Index (R)
Figure 2: Global Pandemic Would Probably Drive Industrial Commodity Prices Down to Early 2016's Lowssources: LME, Wall Street Journal, Moody's Analytics
CAPITAL MARKETS RESEARCH
4 JANUARY 30, 2020 CAPITAL MARKETS RESEARCH / MARKET OUTLOOK / MOODYS.COM
Credit Markets Review and Outlook
Excess Production Capacity Suppresses Commodity and Finished Goods Prices A removal of the coronavirus threat offers no assurance of a quick return by industrial commodity prices to their highs of 2018. Global industrial activity is likely to still fall short of what might significantly lift the utilization of global production capacity.
Partly because of the world’s underutilized production capabilities, tariffs have yet to accelerate the U.S. rate of tradable goods price inflation. Much to the contrary, December 2019’s U.S. price index for non-petroleum imports fell by 1.5% from a year earlier.
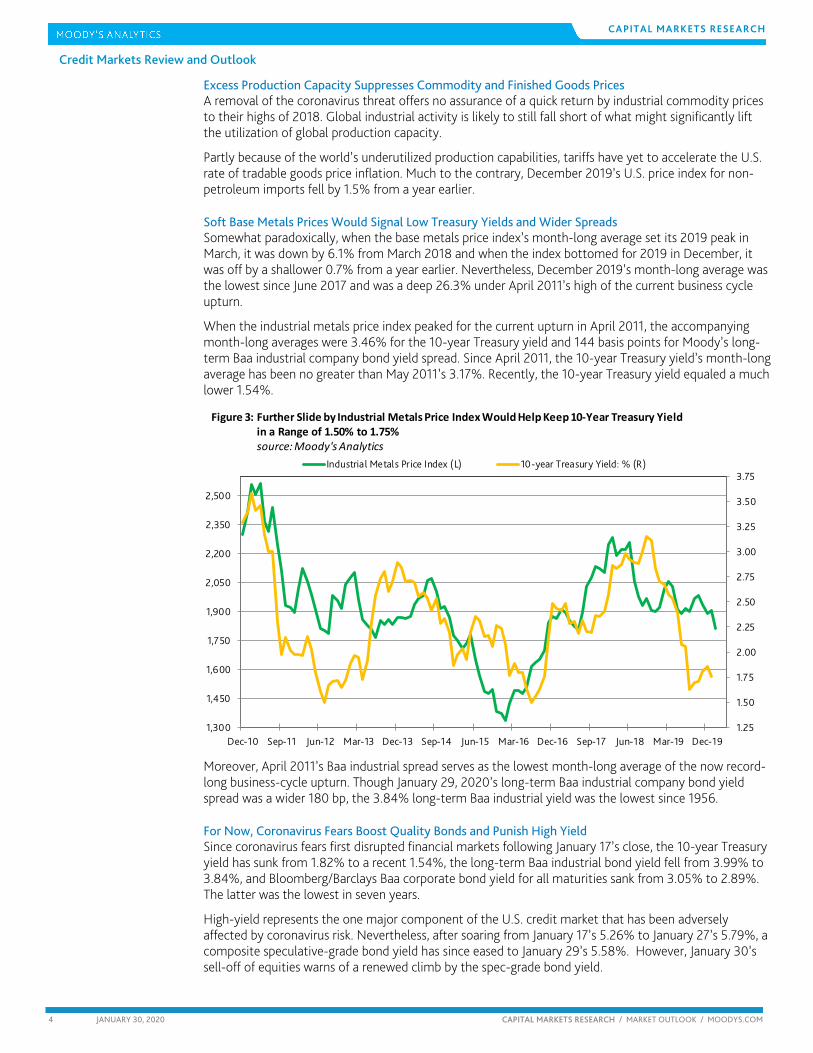
Soft Base Metals Prices Would Signal Low Treasury Yields and Wider Spreads Somewhat paradoxically, when the base metals price index’s month-long average set its 2019 peak in March, it was down by 6.1% from March 2018 and when the index bottomed for 2019 in December, it was off by a shallower 0.7% from a year earlier. Nevertheless, December 2019’s month-long average was the lowest since June 2017 and was a deep 26.3% under April 2011’s high of the current business cycle upturn.
When the industrial metals price index peaked for the current upturn in April 2011, the accompanying month-long averages were 3.46% for the 10-year Treasury yield and 144 basis points for Moody’s long-term Baa industrial company bond yield spread. Since April 2011, the 10-year Treasury yield’s month-long average has been no greater than May 2011’s 3.17%. Recently, the 10-year Treasury yield equaled a much lower 1.54%.
Moreover, April 2011’s Baa industrial spread serves as the lowest month-long average of the now record-long business-cycle upturn. Though January 29, 2020’s long-term Baa industrial company bond yield spread was a wider 180 bp, the 3.84% long-term Baa industrial yield was the lowest since 1956.
For Now, Coronavirus Fears Boost Quality Bonds and Punish High Yield Since coronavirus fears first disrupted financial markets following January 17’s close, the 10-year Treasury yield has sunk from 1.82% to a recent 1.54%, the long-term Baa industrial bond yield fell from 3.99% to 3.84%, and Bloomberg/Barclays Baa corporate bond yield for all maturities sank from 3.05% to 2.89%. The latter was the lowest in seven years.
High-yield represents the one major component of the U.S. credit market that has been adversely affected by coronavirus risk. Nevertheless, after soaring from January 17’s 5.26% to January 27’s 5.79%, a composite speculative-grade bond yield has since eased to January 29’s 5.58%. However, January 30’s sell-off of equities warns of a renewed climb by the spec-grade bond yield.
1.25
1.50
1.75
2.00
2.25
2.50
2.75
3.00
3.25
3.50
3.75
Dec-10 Sep-11 Jun-12 Mar-13 Dec-13 Sep-14 Jun-15 Mar-16 Dec-16 Sep-17 Jun-18 Mar-19 Dec-191,300
1,450
1,600
1,750
1,900
2,050
2,200
2,350
2,500
Industrial Metals Price Index (L) 10-year Treasury Yield: % (R)
Figure 3: Further Slide by Industrial Metals Price Index Would Help Keep 10-Year Treasury Yield in a Range of 1.50% to 1.75%source: Moody's Analytics
CAPITAL MARKETS RESEARCH
5 JANUARY 30, 2020 CAPITAL MARKETS RESEARCH / MARKET OUTLOOK / MOODYS.COM
Credit Markets Review and Outlook
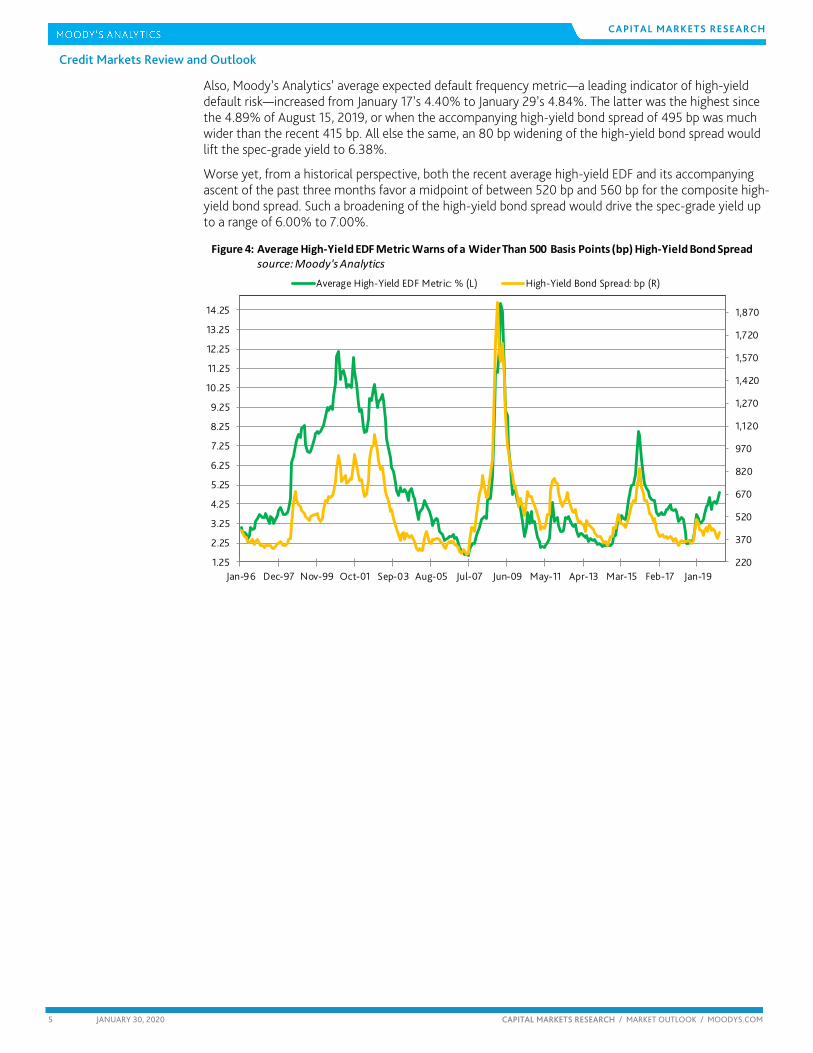
Also, Moody’s Analytics’ average expected default frequency metric—a leading indicator of high-yield default risk—increased from January 17’s 4.40% to January 29’s 4.84%. The latter was the highest since the 4.89% of August 15, 2019, or when the accompanying high-yield bond spread of 495 bp was much wider than the recent 415 bp. All else the same, an 80 bp widening of the high-yield bond spread would lift the spec-grade yield to 6.38%.
Worse yet, from a historical perspective, both the recent average high-yield EDF and its accompanying ascent of the past three months favor a midpoint of between 520 bp and 560 bp for the composite high-yield bond spread. Such a broadening of the high-yield bond spread would drive the spec-grade yield up to a range of 6.00% to 7.00%.
220
370
520
670
820
970
1,120
1,270
1,420
1,570
1,720
1,870
Jan-96 Dec-97 Nov-99 Oct-01 Sep-03 Aug-05 Jul-07 Jun-09 May-11 Apr-13 Mar-15 Feb-17 Jan-191.25
2.25
3.25
4.25
5.25
6.25
7.25
8.25
9.25
10.25
11.25
12.25
13.25
14.25
Average High-Yield EDF Metric: % (L) High-Yield Bond Spread: bp (R)
Figure 4: Average High-Yield EDF Metric Warns of a Wider Than 500 Basis Points (bp) High-Yield Bond Spread source: Moody's Analytics
The Week Ahead
CAPITAL MARKETS RESEARCH
6 JANUARY 30, 2020 CAPITAL MARKETS RESEARCH / MARKET OUTLOOK / MOODYS.COM
The Week Ahead – U.S., Europe, Asia-Pacific
THE U.S. By Ryan Sweet of Moody’s Analytics
Odds Rise for a Rate Cut This Year
The Federal Open Market Committee didn’t throw any curveballs after the conclusion of its January meeting with regard to its policy decisions, but a small tweak to the statement is telling and dovish. The Fed opted to keep the target range for the fed funds rate unchanged while making a technical adjustment to the interest on excess reserves. The IOER was increased by 5 basis points to 1.6% The purpose of this adjustment is to support trading of the effective fed funds rate well within the FOMC’s target range of 1.5% to 1.75%. Historically, the Fed has made these technical adjustments when the funds rate has been trading within 5 basis points of the borders of the target range, as it had been leading up to the meeting.
Though there were very few changes to the statement, one stood out to us. The Fed noted that the stance of monetary policy will help inflation return to policymakers' symmetric 2% objective, compared with the December statement that said policy would support inflation “near” the objective. This suggests that the Fed won’t settle for inflation close to its target but rather needs to achieve it.
Fed Chairman Jerome Powell hammered this point home during his post-meeting presser. Powell said the Fed can’t be comfortable with below-target inflation. Powell briefly discussed the Fed’s review of its policy framework and noted that a different framework, which we believe will be average inflation targeting, would require a different policy.
Favorable comparisons should boost year-over-year growth in the core PCE deflator early this year. Monthly growth in the core PCE deflator will need to average 0.17% to put year-over-year growth in December 2020 at 2%, the Fed’s target. Through November, the core PCE deflator rose an average of 0.1% in 2019. Therefore, risks to our and the Fed’s inflation forecast remain weighted to the downside.
To highlight the downside risks, we created models to monitor the possible inflation outcomes and by extension the possible implications for monetary policy. We created probit models, which use the normal distribution to convert various economic and inflation data into a probability of growth in the core PCE deflator hitting or exceeding certain thresholds over the next year.
Among the variables chosen were the unemployment rate gap, the net percent of small businesses planning to increase prices, corporate profit margins, and various measures of inflation expectations. The reasoning for using short- and long-term inflation expectations is that key determinants of the former are gasoline and food prices. Long-term inflation expectations helped determine if inflation that exceeds thresholds would prove to be persistent.
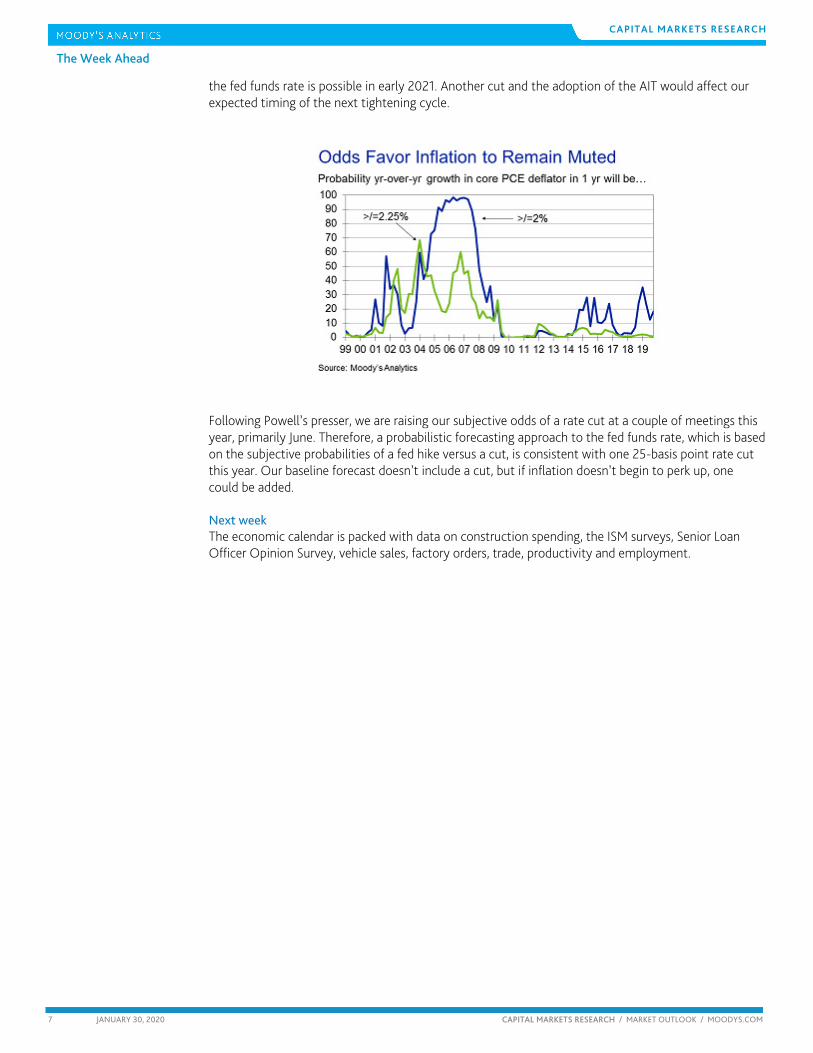
In the probit model we denoted various inflation thresholds using 0 or 1. If year-over-year growth in the core PCE deflator was at or above 2%, a 1 is assigned. If inflation was less than 2%, the dependent variable equals 0. Then we estimate the probability of inflation at or above 2% one year out. The model does a decent job, but in a couple of instances inflation was above the 2% threshold temporarily. The model puts the odds of the core PCE deflator at or exceeding 2% in the next year at 18%.
If inflation does not accelerate as the Fed anticipates, the odds of another Fed rate cut would increase since we expect the central bank to adopt average inflation targeting in the second half of this year. AIT should be fairly easy to communicate, and it prescribes that if inflation has been below target for a period, then the Fed will aim for a stretch of above-target inflation, so that inflation averages the target over the cycle.
We modified our inflation probit model to assess the probability of inflation hitting 2.25% in the next year. The odds are close to 0%. If the Fed does raise the bar for inflation by adopting AIT, another cut in
The Week Ahead
CAPITAL MARKETS RESEARCH
7 JANUARY 30, 2020 CAPITAL MARKETS RESEARCH / MARKET OUTLOOK / MOODYS.COM
the fed funds rate is possible in early 2021. Another cut and the adoption of the AIT would affect our expected timing of the next tightening cycle.
Following Powell’s presser, we are raising our subjective odds of a rate cut at a couple of meetings this year, primarily June. Therefore, a probabilistic forecasting approach to the fed funds rate, which is based on the subjective probabilities of a fed hike versus a cut, is consistent with one 25-basis point rate cut this year. Our baseline forecast doesn’t include a cut, but if inflation doesn’t begin to perk up, one could be added.
Next week The economic calendar is packed with data on construction spending, the ISM surveys, Senior Loan Officer Opinion Survey, vehicle sales, factory orders, trade, productivity and employment.
The Week Ahead
CAPITAL MARKETS RESEARCH
8 JANUARY 30, 2020 CAPITAL MARKETS RESEARCH / MARKET OUTLOOK / MOODYS.COM
EUROPE By Barbara Teixeira Araujo of Moody’s Analytics
U.K.’s First Week Out of the EU Next week will be the U.K.’s official first week out of the EU. For the economy, things will remain business as usual. The transition period is expected to last until the end of the year. In the meantime, the status quo will be maintained, with the U.K. remaining in the customs union and the single market. Expectations are that passing of the Brexit deal gave a boost to consumer and business confidence and will lead to a rebound in economic growth in the first quarter. That is why the release of the U.K. January final PMI figures next week will be paramount. As of now, there are few data available for the post-election period, so we don’t know the extent to which this expected improvement in confidence and activity materialized. If the data ultimately disappoint, there is certain to be a rate cut by the Bank of England in March or May—our view is that May 7 is the most likely date for a move. In any case, markets will be extremely sensitive to any U.K. data releases until then.
Elsewhere, the week will bring December retail sales and industrial production figures for the euro zone countries, as well as the barrage of final January CPI data for major European economies. Regarding the retailing sector, we expect that sales fell across most of the euro zone countries in December, following a sharp increase in November. For the currency area as a whole, we are penciling in a 0.2% m/m decline, which should reverse only a small part of the 1% rise in November. The fall won’t be to enough to taint the fourth-quarter figures; sales should still have increased by 0.4% q/q in the three months to December, building on a 0.5% rise in the third quarter. For the year as a whole, we expect that retail sales were up by 2.4%, improving on a 1.6% increase in 2018. Consumers in the euro zone have benefited both from an increasingly tight labour market—joblessness fell across all the euro zone economies in 2019—and a pickup in wage growth, which together have boosted consumers’ purchasing power and will to spend. Both retail sales and services spending performed well during the first three quarters of 2019, and we expect that they continued to increase in the fourth—we will not get the euro zone’s detailed fourth-quarter GDP breakdown until March 10.
Prospects remain upbeat. Granted, growth has slowed sharply over the past few months, leading to a deterioration in hiring intentions and a slowdown in employment gains. But we don’t think that the deterioration will be enough to cause unemployment to spike and to push consumers into caution mode. The labour market will remain tight in 2020, and the unemployment rate will rise, though only slightly. Supporting our outlook for continued consumer spending is that fiscal policy is set to become or remain expansionary in most of the euro zone’s major countries with tax cuts and higher spending expected to give a boost to household’s disposable income. Also, interest rates are likely to remain low throughout the year—our outlook is for the European Central Bank to leave rates unchanged—making access to credit very cheap. However, in the very short term, a major risk to our consumer spending outlook arises from the outbreak of the coronavirus. As of now, most of the economic damage is expected to be felt in Asia, but it is early, and we don’t know how the virus will spread or how long it will take for it to be contained. It is thus hard to estimate the impact that the coronavirus will have on the morale of euro zone’s consumers and their spending habits. For now, we know that the European aviation sector is likely to be hard hit by the travel bans and the cancelling of flights to China, while European retailers in tourist cities should feel the pinch from the drop in Chinese tourists—especially given that travel bans took place during the Chinese New Year holiday season.
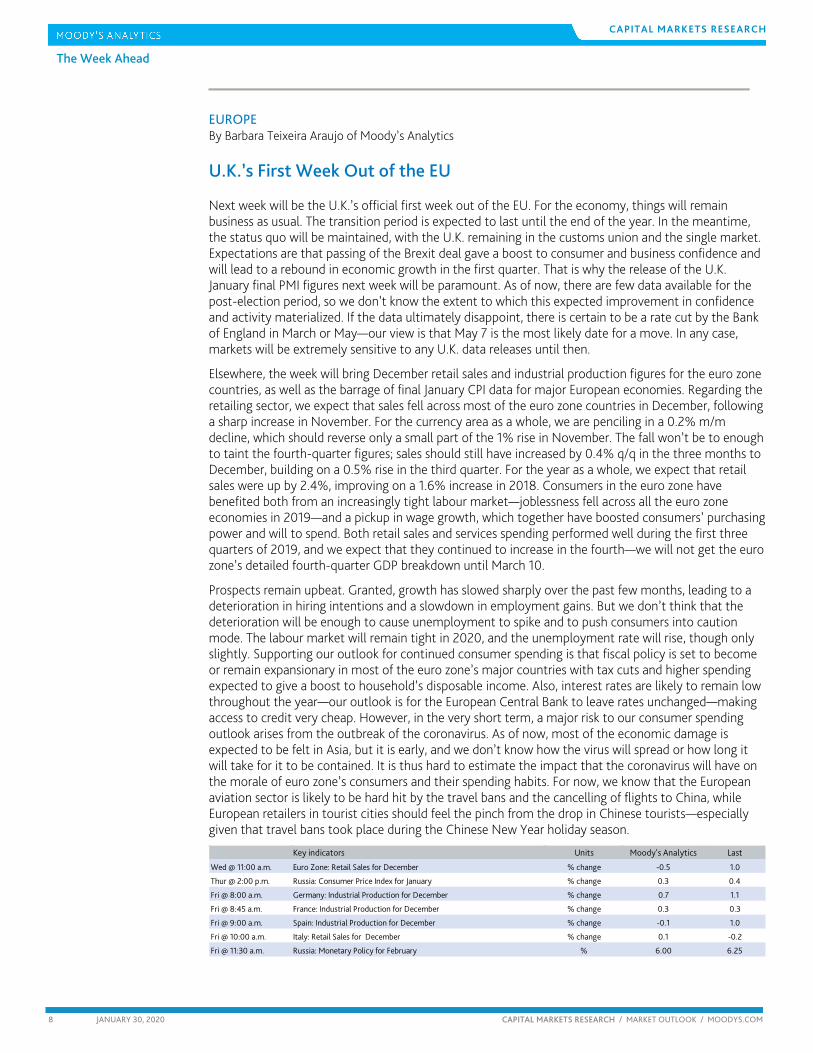
Key indicators Units Moody's Analytics Last
Wed @ 11:00 a.m. Euro Zone: Retail Sales for December % change -0.5 1.0
Thur @ 2:00 p.m. Russia: Consumer Price Index for January % change 0.3 0.4
Fri @ 8:00 a.m. Germany: Industrial Production for December % change 0.7 1.1
Fri @ 8:45 a.m. France: Industrial Production for December % change 0.3 0.3
Fri @ 9:00 a.m. Spain: Industrial Production for December % change -0.1 1.0
Fri @ 10:00 a.m. Italy: Retail Sales for December % change 0.1 -0.2
Fri @ 11:30 a.m. Russia: Monetary Policy for February % 6.00 6.25
The Week Ahead
CAPITAL MARKETS RESEARCH
9 JANUARY 30, 2020 CAPITAL MARKETS RESEARCH / MARKET OUTLOOK / MOODYS.COM
ASIA-PACIFIC By Katrina Ell of Moody’s Analytics
Trade War, Protests Hurt Hong Kong’s Economy; Coronavirus Is Next Hong Kong’s GDP growth likely contracted by 3.3% y/y in the December quarter, following the 2.9% fall in the September quarter. Hong Kong’s economy has had the double whammy of the U.S. trade war and the civil protests over the failed extradition bill, and both have inflicted serious damage on the economy. The trade dispute has calmed since Washington and Beijing signed the Phase One trade deal on 15 January, and the odds of escalation have been reduced. But with existing tariffs expected to remain in place through 2020, global trade flows will remain subdued in 2020.
A more recent downside risk to Hong Kong’s economy is from the outbreak of the coronavirus. The number of confirmed cases has risen exponentially in late January and with China’s Hubei province the epicenter, Hong Kong’s economy is at risk of severe damage if the outbreak continues to escalate. The 2003 SARS outbreak, when Hong Kong’s economy was deeply impacted for around six months, provides a useful case in point. During that period, Hong Kong’s retail trade and visitor arrivals sharply fell, as did the stock market and GDP growth. When SARS—severe acute respiratory syndrome—became contained in mid-2003, Hong Kong’s economy enjoyed a decent rebound.
Central banks in Australia and Thailand are set to keep their respective policy rates on hold in February. Odds that the Reserve Bank of Australia would cut in February have fallen sharply over January. An important contributor to the falling odds was the better-than-expected December employment report, which showed that the labour market has a little more momentum than previously thought. But the more important driver was the federal and some state governments meaningfully increasing spending as a result of the devastating bushfires that escalated since November. The government has also lowered the priority of returning the 2019-2020 federal budget to surplus, potentially opening the door to further spending initiatives, particularly related to the bushfires. That being said, the RBA maintains an easing bias and the performance of the already weakened consumer in the early months of 2020 will determine the extent of easing through the first half of 2020.
The Bank of Thailand has kept interest rates constant at 1.25% since November’s widely expected rate cut. There are several reasons for holding steady in February. First, financial conditions in Thailand remain accommodative because of the previous two rate cuts. Also, the global outlook looks more stable with the U.S. and China achieving their Phase One trade deal. Also, maintaining the current rate provides the central bank room to ease monetary policy should downside risks escalate in 2020.
Key indicators Units Confidence Risk Moody's Analytics Last
Mon @ 7:30 p.m. Hong Kong GDP for Q4 % change yr ago 3 -3.3 -2.9
Mon @ Unknown South Korea Foreign trade for January US$ bil 2 2.4 2.0
Tues @ 10:00 a.m. South Korea CPI for January % change yr ago 3 0.7 0.7
Tues @ 2:30 p.m. Australia Monetary policy for February % 3 0.75 0.75
Tues @ 3:00 p.m. Malaysia Foreign trade for December MYR bil 2 8.9 6.5
Wed @ 6:00 p.m. Thailand Monetary policy for February % 3 1.25 1.25
Thurs @ 11:30 a.m. Australia Foreign trade for December A$ bil 3 5.2 5.8
Thurs @ 11:30 a.m. Australia Retail sales for December % change yr ago 3 -0.1 0.9
Thurs @ Unknown Indonesia GDP for Q4 % change yr ago 3 5.0 5.0
Fri @ Unknown China Foreign trade for January US$ bil 2 44.2 46.8
10 JANUARY 30, 2020 CAPITAL MARKETS RESEARCH / MARKET OUTLOOK / MOODYS.COM
CAPITAL MARKETS RESEARCH The Long View
d The Long View Moody’s long-term single-A and Baa industrial company bond yields have sunk to levels last observed in 1956. By John Lonski, Chief Economist, Moody’s Capital Markets Research Group January 30, 2020
CREDIT SPREADS As measured by Moody's long-term average corporate bond yield, the recent investment grade corporate bond yield spread of 113 basis points was less than its 122-point mean of the two previous economic recoveries. This spread may be no wider than 120 bp by year-end 2020.
The recent high-yield bond spread of 415 bp is thinner than what is suggested by the accompanying long-term Baa industrial company bond yield spread of 180 bp and the recent VIX of 15.3 points.
DEFAULTS December 2019’s U.S. high-yield default rate of 4.2% was up from December 2018’s 2.8% and may average 3.6% during 2020’s final quarter according to Moody's Investors Service.
US CORPORATE BOND ISSUANCE Fourth-quarter 2018’s worldwide offerings of corporate bonds incurred annual setbacks of 23.4% for IG and 75.5% for high-yield, wherein US$-denominated offerings plunged by 26.1% for IG and by 74.1% for high yield.
First-quarter 2019’s worldwide offerings of corporate bonds revealed annual setbacks of 0.5% for IG and 3.6% for high-yield, wherein US$-denominated offerings fell by 3.0% for IG and grew by 7.1% for high yield.
Second-quarter 2019’s worldwide offerings of corporate bonds revealed an annual setback of 2.5% for IG and an annual advance of 17.6% for high-yield, wherein US$-denominated offerings sank by 12.4% for IG and surged by 30.3% for high yield.
Third-quarter 2019’s worldwide offerings of corporate bonds revealed annual advances of 15.2% for IG and 56.8% for high-yield, wherein US$-denominated offerings soared higher by 36.8% for IG and 81.3% for high yield.
During yearlong 2017, worldwide corporate bond offerings increased by 4.1% annually (to $2.501 trillion) for IG and advanced by 41.5% for high yield (to $603 billion).
Fourth-quarter 2019’s worldwide offerings of corporate bonds revealed annual advances of 15.3% for IG and 329% for high-yield, wherein US$-denominated offerings dipped by 0.8% for IG and surged higher by 330% for high yield.
For 2019, worldwide corporate bond offerings grew by 5.4% annually (to $2.447 trillion) for IG and advanced by 49.2% for high yield (to $561 billion). The projected annual percent increases for 2020’s worldwide corporate bond offerings are 2.9% for IG and 4.0% for high yield.
US ECONOMIC OUTLOOK In view of the underutilization of the world’s productive resources, low inflation should help to rein in Treasury bond yields. As long as the global economy operates below trend, the 10-year Treasury yield may not remain above 2.00% for long. A fundamentally excessive climb by Treasury bond yields and a pronounced slowing by expenditures in dynamic emerging market countries are among the biggest threats to the adequacy of economic growth and credit spreads.
11 JANUARY 30, 2020 CAPITAL MARKETS RESEARCH / MARKET OUTLOOK / MOODYS.COM
CAPITAL MARKETS RESEARCH The Long View
d
EUROPE By Barbara Teixeira Araujo of Moody’s Analytics January 30, 2020
UNITED KINGDOM The Bank of England decided to stand pat at its January meeting—markets had penciled in an even probability for a cut—both the meeting’s minutes and Governor Mark Carney’s press conference sounded extremely dovish, suggesting that a rate cut in coming months is not off the table. The story here is simple: The bank wisely chose to wait and see instead of rushing to act, especially as the consensus is for a significant rebound in activity in the first quarter of 2020. At the same time, if the upcoming data disappoint, the bank left the door open to cut rates without shocking markets. This means that market volatility will remain extremely elevated in coming months, with investors scrutinizing every piece of data released. Our view is that May 7 would be the most likely date for a move.
Given that our forecast is for a significant rebound in growth in the first quarter—we are penciling in a 0.3% to 0.4% q/q increase in GDP, higher than the BoE’s 0.2% forecast—we still haven’t incorporated a rate cut in our baseline. But we will be watching the data closely. As of now, all leading indicators suggest that the passing of the Brexit deal gave a strong boost to household and consumer confidence, lifting investment and spending intentions. The housing market also seems to be recovering. Adding to this, the chancellor has given all indications that the budget will outline expansionary fiscal policy measures for 2020.
That said, risks to the outlook abound, and our forecast is for growth to slow during the second half of the year given the trade negotiations. Therefore, a rate cut could still be warranted around midyear. In addition, this is the first time since 2013 that the BoE is not forecasting any period of above-target inflation if the bank rate remains unchanged. This means that, although a rate cut in 2020 is not set in stone, a rate hike also seems to be far off. Indeed, the Monetary Policy committee dropped from the minutes the reference to the need for “limited and gradual” increases in interest rates so as to keep inflation in check.
A key point of the meeting was that the bank revised down sharply its forecast for potential growth, with a margin of excess demand arising by the end of 2022. Given that inflation pressures are by then expected to be around or slightly above target, this could be a potential date for a first rate hike.
FRANCE AND GERMANY We got solid consumer confidence data for both France and Germany on Wednesday. The INSEE’s consumer confidence index for France rose from 102 in December to 104 in January—further above its previous-year average of 100. Germany’s GfK consumer sentiment indicator was up to 9.9 heading into February from the prior 9.7. The new figure is the highest since June. Both measures chimed in with our view that a still-tight labour market and strong wage growth will continue to support consumer spending and GDP growth in the euro zone during the first half of 2020.
Downside risks remain. Leading labour market data suggest employment gains are now slowing across most countries, with hiring intentions having dropped sharply. The risk is that the downturn in euro zone manufacturing won’t bottom out—as expected—and that, on the contrary, it spills into the rest of the economy, leading to a severe drop in demand and job losses. Rising unemployment is a fodder for a recession. It leads consumers to become more cautious and rein in spending, weighing on aggregate demand and resulting in even further job losses. As of now, this is not our base case. We expect growth in the currency area’s manufacturing sector to stabilize and allow for the overall economy to sail through this year rather intact. We expect euro zone GDP to grow by 1.3% in 2020, accelerating only slightly from a 1.2% rise in 2019.
Unfortunately, we have to add a new risk to our baseline: the coronavirus outbreak. While the immediate economic impact should be concentrated in Asia, the European economies could suffer from a tightening of financial market conditions, a drop in confidence, and hits to consumer spending and exports. The latter is in the spotlight. A high share of euro zone exports head to China, and we expect Chinese activity to be severely hit in the first quarter—we wouldn’t rule out an actual decline in GDP given the significant containment measures.
12 JANUARY 30, 2020 CAPITAL MARKETS RESEARCH / MARKET OUTLOOK / MOODYS.COM
CAPITAL MARKETS RESEARCH The Long View
d
ASIA PACIFIC By Katrina Ell of Moody’s Analytics January 30, 2020
CHINA Panic is growing, and adverse economic implications are rising as the number of confirmed cases of coronavirus in China and abroad continues to rise. While there is usually a bounce-back in economic activity after containment of a health epidemic, this latest outbreak hasn’t reached that point. Most of the cases are in China, but Hong Kong, Australia, the U.S., Canada, Taiwan and South Korea are amongst those with infected patients. There are directly observable economic implications of coronavirus.
The Chinese government has imposed domestic and international travel restrictions. This includes banning all tour groups heading overseas. This ban coincides with China’s peak tourism season—the Lunar New Year celebrations are taking place this year from late January until early February. This is a blow to neighbouring countries that are typically large recipients of Chinese tourists during this annual celebration, including Japan, South Korea, Singapore, Hong Kong and Macau. Data from Macau’s tourism office and Bloomberg show that the mainland visitors to Macau were down by 80% on 26 January (the third day of the Lunar New Year celebration) compared with the equivalent day in 2019. On 23 January, the chief executive of Macau, Ho Iat Seng, said that all casinos in the city could be closed due to the virus, a potentially major blow to Macau’s economy given that around 80% of the government’s annual revenue is from betting.
Taking a hit Retail trade in China is taking a hit. Household consumption accounts for around 40% of GDP in China, and the adverse impact on retail trade from this epidemic extends beyond Wuhan and Hubei province, where the outbreak began. Major tourist attractions across China have been closed, including Disneyland and the Great Wall. Movie theaters have been closed for several days and some Lunar New Year events cancelled.
Business disruption is also significant. Wuhan is a large industrial hub in central China; the city is home to over 11 million people, and many large auto, steel and electronics producers have a presence there. With the virus outbreak, many factories have closed, and some staff and family members have been evacuated, with further evacuations planned in coming days. The priority has shifted from keeping supply chains intact to ensuring worker safety, resulting in a substantial fall in worker productivity throughout Hubei province, extending well beyond those infected with the virus. Also, from a business perspective, the halting of transport services including trains, buses and planes means that goods cannot reach their intended destinations as planned, and it is unclear how long the transport suspensions will last.
The Chinese government has extended the Lunar New Year celebrations by three days because of the virus. This means that the usual business disruption that occurs over the holiday period will last longer than prior years and will capture production, transportation and shipping.
Worst performance The Shanghai Composite has been closed since 23 January and on its final day of trade was down by 2.8%, its worst performance on record for the eve of the Lunar New Year. It is not confirmed whether China's equity markets will reopen on Friday, as was planned, or also extend their closure. During the SARS outbreak—severe acute respiratory syndrome, an epidemic that began in China in 2002—the equity market closure was extended during the May Day holiday period. China's equity market is a decent barometer of economic sentiment during extreme shocks but doesn't tend to track closely with GDP growth or other widely watched economic indicators.
Health costs from diagnosing and treating coronavirus have increased and resources including military personnel in the health field have been redirected to assist with the epidemic.
Less observable but still significant is the impact on consumer and business sentiment. Fear can lead to lower discretionary spending on goods and services. The impact on sentiment is particularly pronounced for those in the quarantined areas, including Wuhan and surrounding cities; their economic profile was vibrant prior to the virus outbreak. Services account for 51% of Wuhan's GDP and many have ground to a halt with the virus outbreak. There can be a longer-term impact on foreign investment in infected economies, as businesses shy away from large-scale investments in provinces with an epidemic outbreak in their recent history.
13 JANUARY 30, 2020 CAPITAL MARKETS RESEARCH / MARKET OUTLOOK / MOODYS.COM
CAPITAL MARKETS RESEARCH Ratings Round-Up
Ratings Round-Up
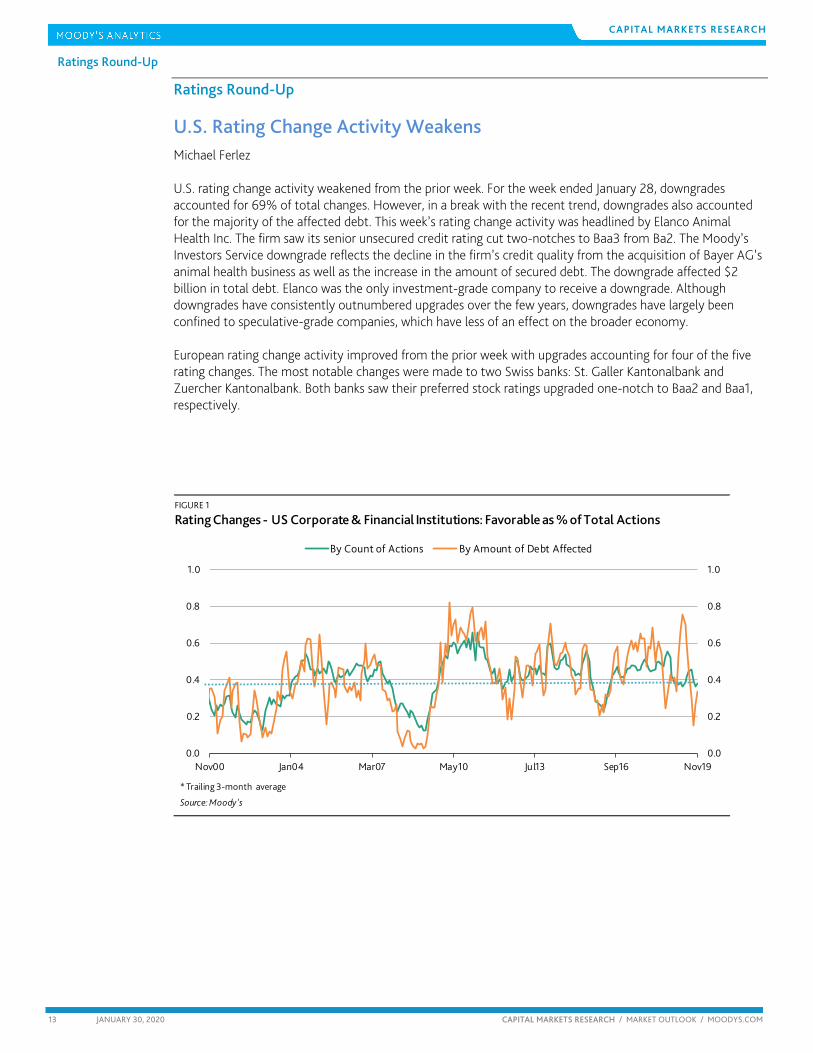
U.S. Rating Change Activity Weakens Michael Ferlez U.S. rating change activity weakened from the prior week. For the week ended January 28, downgrades accounted for 69% of total changes. However, in a break with the recent trend, downgrades also accounted for the majority of the affected debt. This week’s rating change activity was headlined by Elanco Animal Health Inc. The firm saw its senior unsecured credit rating cut two-notches to Baa3 from Ba2. The Moody’s Investors Service downgrade reflects the decline in the firm’s credit quality from the acquisition of Bayer AG’s animal health business as well as the increase in the amount of secured debt. The downgrade affected $2 billion in total debt. Elanco was the only investment-grade company to receive a downgrade. Although downgrades have consistently outnumbered upgrades over the few years, downgrades have largely been confined to speculative-grade companies, which have less of an effect on the broader economy. European rating change activity improved from the prior week with upgrades accounting for four of the five rating changes. The most notable changes were made to two Swiss banks: St. Galler Kantonalbank and Zuercher Kantonalbank. Both banks saw their preferred stock ratings upgraded one-notch to Baa2 and Baa1, respectively.
FIGURE 1
Rating Changes - US Corporate & Financial Institutions: Favorable as % of Total Actions
0.0
0.2
0.4
0.6
0.8
1.0
0.0
0.2
0.4
0.6
0.8
1.0
Nov00 Jan04 Mar07 May10 Jul13 Sep16 Nov19
By Count of Actions By Amount of Debt Affected
* Trailing 3-month average
Source: Moody's
14 JANUARY 30, 2020 CAPITAL MARKETS RESEARCH / MARKET OUTLOOK / MOODYS.COM
CAPITAL MARKETS RESEARCH Ratings Round-Up
FIGURE 2
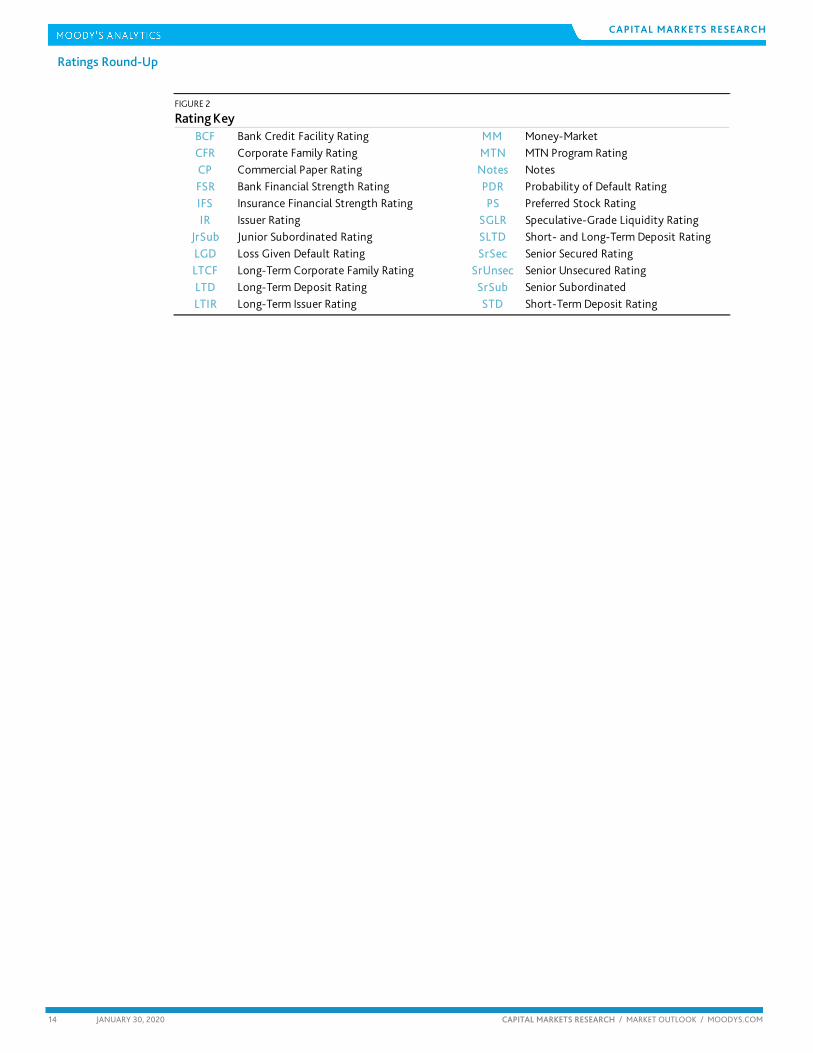
Rating Key
BCF Bank Credit Facility Rating MM Money-MarketCFR Corporate Family Rating MTN MTN Program RatingCP Commercial Paper Rating Notes NotesFSR Bank Financial Strength Rating PDR Probability of Default RatingIFS Insurance Financial Strength Rating PS Preferred Stock RatingIR Issuer Rating SGLR Speculative-Grade Liquidity Rating
JrSub Junior Subordinated Rating SLTD Short- and Long-Term Deposit RatingLGD Loss Given Default Rating SrSec Senior Secured Rating LTCF Long-Term Corporate Family Rating SrUnsec Senior Unsecured Rating LTD Long-Term Deposit Rating SrSub Senior SubordinatedLTIR Long-Term Issuer Rating STD Short-Term Deposit Rating

15 JANUARY 30, 2020 CAPITAL MARKETS RESEARCH / MARKET OUTLOOK / MOODYS.COM
CAPITAL MARKETS RESEARCH Ratings Round-Up
FIGURE 3
Rating Changes: Corporate & Financial Institutions – US
Date Company Sector RatingAmount
($ Million)Up/
Down
Old LTD
Rating
New LTD
RatingIG/SG
1/22/20 HECLA MINING COMPANY IndustrialSrUnsec
/LTCFR/PDR 500 U Caa2 Caa1 SG
1/22/20 NVR INC. Industrial SrUnsec 600 U Baa2 Baa1 IG
1/22/20
MCDERMOTT INTERNATIONAL, INC.-MCDERMOTT TECHNOLOGY (AMERICAS), INC.
IndustrialSrUnsec/SrSec
/BCF/LTCFR/PDR1,300 D Ca C SG
1/22/20FORUM ENERGY TECHNOLOGIES, INC.
IndustrialSrUnsec
/LTCFR/PDR400 D B2 B3 SG
1/22/20AEGIS TOXICOLOGY SCIENCES CORPORATION
IndustrialSrSec/BCF
/LTCFR/PDRD B3 Caa1 SG
1/23/20 OSHKOSH CORPORATION Industrial SrUnsec 550 U Ba1 Baa3 SG
1/23/20CASTLE US HOLDING CORPORATION
IndustrialSrSec/BCF
/LTCFR/PDRD B2 B3 SG
1/24/20FAIRWAY GROUP HOLDINGS CORP.
Industrial PDR D Ca D SG
1/24/20
COOPER-STANDARD HOLDINGS INC.-COOPER-STANDARD AUTOMOTIVE INC.
IndustrialSrUnsec/SrSec
/BCF/LTCFR/PDR400 D B2 B3 SG
1/24/20SOLENIS HOLDINGS, L.P.-SOLENIS HOLDINGS LLC
Industrial SrSec/BCF D B2 B3 SG
1/24/20 RODAN & FIELDS, LLC IndustrialSrSec/BCF
/LTCFR/PDRD B2 B3 SG
1/27/20 PYXUS INTERNATIONAL, INC. IndustrialSrSec
/LTCFR/PDR1,258 D Caa2 Ca SG
1/27/20 ZOTEC PARTNERS, LLC IndustrialSrSec/BCF
/LTCFR/PDRU B3 B2 SG
1/27/20ELANCO ANIMAL HEALTH INCORPORATED
Industrial SrUnsec/BCF 2,000 D Baa3 Ba2 IG
1/27/20NATIONAL MENTOR HOLDINGS, INC.
Industrial SrSec/BCF D B1 B2 SG
1/28/20 SOLARWINDS HOLDINGS, INC. Industrial LTCFR/PDR U B2 B1 SG
Source: Moody's

16 JANUARY 30, 2020 CAPITAL MARKETS RESEARCH / MARKET OUTLOOK / MOODYS.COM
CAPITAL MARKETS RESEARCH Ratings Round-Up
FIGURE 4
Rating Changes: Corporate & Financial Institutions – Europe
Date Company Sector RatingAmount
($ Million)Up/
Down
Old LTD
Rating
New LTD
Rating
Old LGD
New LGD
IG/SG
Country
1/22/20ST. GALLER KANTONALBANK
Financial PS 103 U Baa3 Baa2 IG SWITZERLAND
1/22/20ZUERCHER KANTONALBANK
Financial PS 773 U Baa2 Baa1 IG SWITZERLAND
1/22/20 BANIJAY GROUP S.A.S. IndustrialLTCFR/PDR
D B1 B2 SG FRANCE
1/24/20 PGS ASA IndustrialSrSec/BCF
/LTCFR/PDR
U B3 B2 SG NORWAY
1/28/20 MKB BANK NYRT. Financial LTD U B1 Ba3 SG HUNGARY
Source: Moody's
17 JANUARY 30, 2020 CAPITAL MARKETS RESEARCH / MARKET OUTLOOK / MOODYS.COM
CAPITAL MARKETS RESEARCH
Market Data
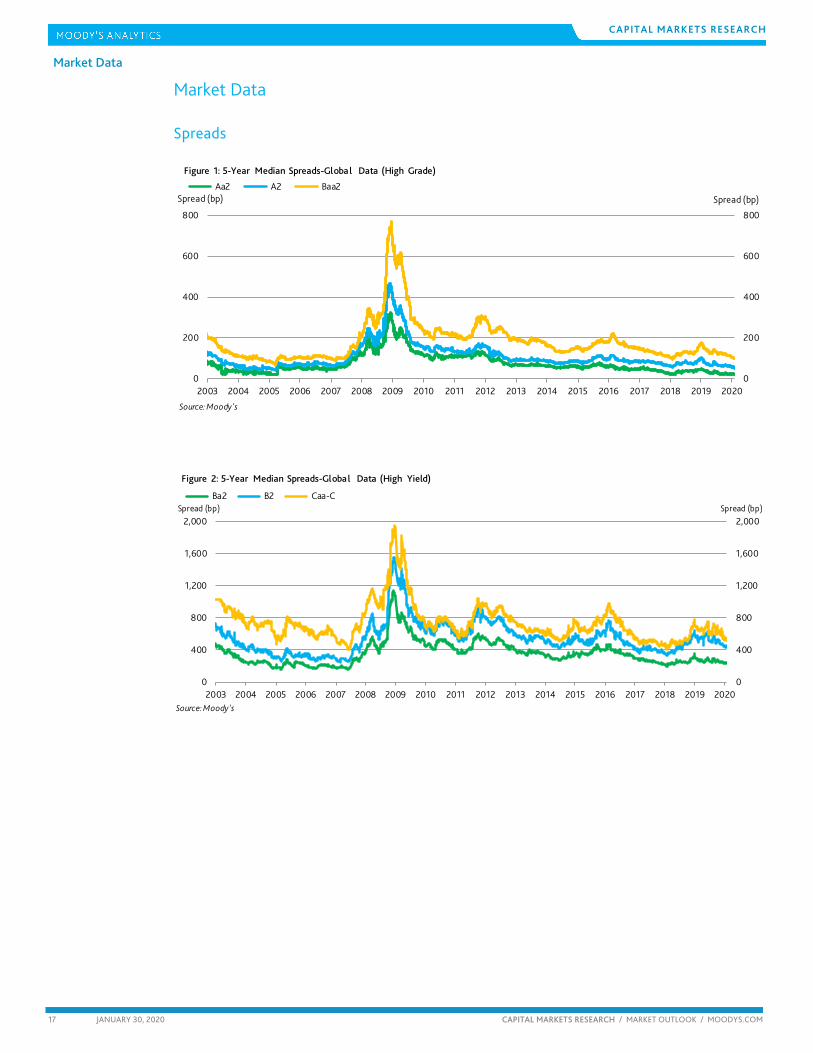
Market Data Spreads
0
200
400
600
800
0
200
400
600
800
2003 2004 2005 2006 2007 2008 2009 2010 2011 2012 2013 2014 2015 2016 2017 2018 2019 2020
Spread (bp) Spread (bp) Aa2 A2 Baa2
Source: Moody's
Figure 1: 5-Year Median Spreads-Global Data (High Grade)
0
400
800
1,200
1,600
2,000
0
400
800
1,200
1,600
2,000
2003 2004 2005 2006 2007 2008 2009 2010 2011 2012 2013 2014 2015 2016 2017 2018 2019 2020
Spread (bp) Spread (bp) Ba2 B2 Caa-C
Source: Moody's
Figure 2: 5-Year Median Spreads-Global Data (High Yield)
18 JANUARY 30, 2020 CAPITAL MARKETS RESEARCH / MARKET OUTLOOK / MOODYS.COM
CAPITAL MARKETS RESEARCH
Market Data
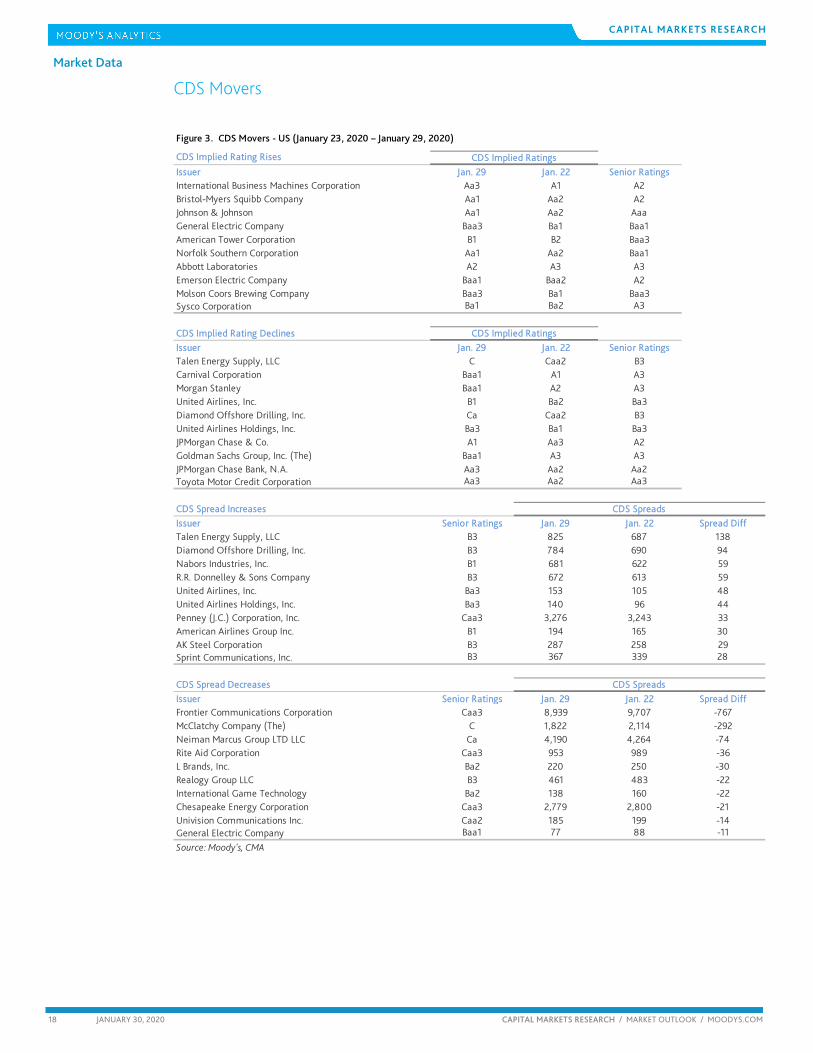
CDS Movers
CDS Implied Rating Rises
Issuer Jan. 29 Jan. 22 Senior RatingsInternational Business Machines Corporation Aa3 A1 A2Bristol-Myers Squibb Company Aa1 Aa2 A2Johnson & Johnson Aa1 Aa2 AaaGeneral Electric Company Baa3 Ba1 Baa1American Tower Corporation B1 B2 Baa3Norfolk Southern Corporation Aa1 Aa2 Baa1Abbott Laboratories A2 A3 A3Emerson Electric Company Baa1 Baa2 A2Molson Coors Brewing Company Baa3 Ba1 Baa3Sysco Corporation Ba1 Ba2 A3
CDS Implied Rating DeclinesIssuer Jan. 29 Jan. 22 Senior RatingsTalen Energy Supply, LLC C Caa2 B3Carnival Corporation Baa1 A1 A3Morgan Stanley Baa1 A2 A3United Airlines, Inc. B1 Ba2 Ba3Diamond Offshore Drilling, Inc. Ca Caa2 B3United Airlines Holdings, Inc. Ba3 Ba1 Ba3JPMorgan Chase & Co. A1 Aa3 A2Goldman Sachs Group, Inc. (The) Baa1 A3 A3JPMorgan Chase Bank, N.A. Aa3 Aa2 Aa2Toyota Motor Credit Corporation Aa3 Aa2 Aa3
CDS Spread IncreasesIssuer Senior Ratings Jan. 29 Jan. 22 Spread DiffTalen Energy Supply, LLC B3 825 687 138Diamond Offshore Drilling, Inc. B3 784 690 94Nabors Industries, Inc. B1 681 622 59R.R. Donnelley & Sons Company B3 672 613 59United Airlines, Inc. Ba3 153 105 48United Airlines Holdings, Inc. Ba3 140 96 44Penney (J.C.) Corporation, Inc. Caa3 3,276 3,243 33American Airlines Group Inc. B1 194 165 30AK Steel Corporation B3 287 258 29Sprint Communications, Inc. B3 367 339 28
CDS Spread DecreasesIssuer Senior Ratings Jan. 29 Jan. 22 Spread DiffFrontier Communications Corporation Caa3 8,939 9,707 -767McClatchy Company (The) C 1,822 2,114 -292Neiman Marcus Group LTD LLC Ca 4,190 4,264 -74Rite Aid Corporation Caa3 953 989 -36L Brands, Inc. Ba2 220 250 -30Realogy Group LLC B3 461 483 -22International Game Technology Ba2 138 160 -22Chesapeake Energy Corporation Caa3 2,779 2,800 -21Univision Communications Inc. Caa2 185 199 -14General Electric Company Baa1 77 88 -11
Source: Moody's, CMA
CDS Spreads
CDS Implied Ratings
CDS Implied Ratings
CDS Spreads
Figure 3. CDS Movers - US (January 23, 2020 – January 29, 2020)

19 JANUARY 30, 2020 CAPITAL MARKETS RESEARCH / MARKET OUTLOOK / MOODYS.COM
CAPITAL MARKETS RESEARCH
Market Data
CDS Implied Rating Rises
Issuer Jan. 29 Jan. 22 Senior RatingsItaly, Government of Ba1 Ba2 Baa3Spain, Government of A1 A2 Baa1Portugal, Government of Aa3 A1 Baa3Intesa Sanpaolo S.p.A. Baa3 Ba1 Baa1Credit Agricole Corporate and Investment Bank Aa1 Aa2 Aa3Santander UK plc A2 A3 Aa3Bankinter, S.A. A1 A2 Baa1KBC Group N.V. A3 Baa1 Baa1Banco Comercial Portugues, S.A. Ba1 Ba2 Ba1Atlantia S.p.A. B2 B3 Ba2
CDS Implied Rating DeclinesIssuer Jan. 29 Jan. 22 Senior RatingsLloyds Bank plc A1 Aa3 Aa3HSBC Holdings plc Baa1 A3 A2Electricite de France A2 A1 A3Standard Chartered PLC Baa1 A3 A2Landesbank Hessen-Thueringen GZ A3 A2 Aa3Total S.A. Aa2 Aa1 Aa3Bayerische Motoren Werke Aktiengesellschaft A3 A2 A1Standard Chartered Bank Aa3 Aa2 A1Anheuser-Busch InBev SA/NV A2 A1 Baa1Equinor ASA Aa1 Aaa Aa2
CDS Spread IncreasesIssuer Senior Ratings Jan. 29 Jan. 22 Spread DiffPizzaExpress Financing 1 plc Ca 4,968 4,587 380CMA CGM S.A. Caa1 1,069 923 146Boparan Finance plc Caa1 1,368 1,239 129Iceland Bondco plc Caa2 729 673 56Matalan Finance plc Caa1 881 837 44Novafives S.A.S. Caa2 768 725 43Selecta Group B.V. Caa1 312 290 23Casino Guichard-Perrachon SA B3 648 630 18Jaguar Land Rover Automotive Plc B1 436 420 17Ineos Group Holdings S.A. B1 197 182 15
CDS Spread DecreasesIssuer Senior Ratings Jan. 29 Jan. 22 Spread DiffAtlantia S.p.A. Ba2 188 242 -54Stena AB B3 378 401 -23Eksportfinans ASA Baa1 474 496 -21Italy, Government of Baa3 103 121 -18Greece, Government of B1 106 117 -11UniCredit S.p.A. Baa1 64 74 -10Intesa Sanpaolo S.p.A. Baa1 73 82 -9Banca Monte dei Paschi di Siena S.p.A. Caa1 245 253 -9thyssenkrupp AG Ba3 165 172 -7Permanent tsb p.l.c. Baa2 214 219 -5
Source: Moody's, CMA
CDS Spreads
CDS Implied Ratings
CDS Implied Ratings
CDS Spreads
Figure 4. CDS Movers - Europe (January 23, 2020 – January 29, 2020)

20 JANUARY 30, 2020 CAPITAL MARKETS RESEARCH / MARKET OUTLOOK / MOODYS.COM
CAPITAL MARKETS RESEARCH
Market Data
Issuance
FIGURE 5
Market Cumulative Issuance - Corporate & Financial Institutions: USD Denominated
0
600
1,200
1,800
2,400
0
600
1,200
1,800
2,400
Jan Feb Mar Apr May Jun Jul Aug Sep Oct Nov Dec
Issuance ($B) Issuance ($B)2017 2018 2019 2020
Source: Moody's / Dealogic
FIGURE 6
Market Cumulative Issuance - Corporate & Financial Institutions: EURO Denominated
0
200
400
600
800
1,000
0
200
400
600
800
1,000
Jan Feb Mar Apr May Jun Jul Aug Sep Oct Nov Dec
Issuance ($B) Issuance ($B)2017 2018 2019 2020
Source: Moody's / Dealogic
21 JANUARY 30, 2020 CAPITAL MARKETS RESEARCH / MARKET OUTLOOK / MOODYS.COM
CAPITAL MARKETS RESEARCH
Market Data
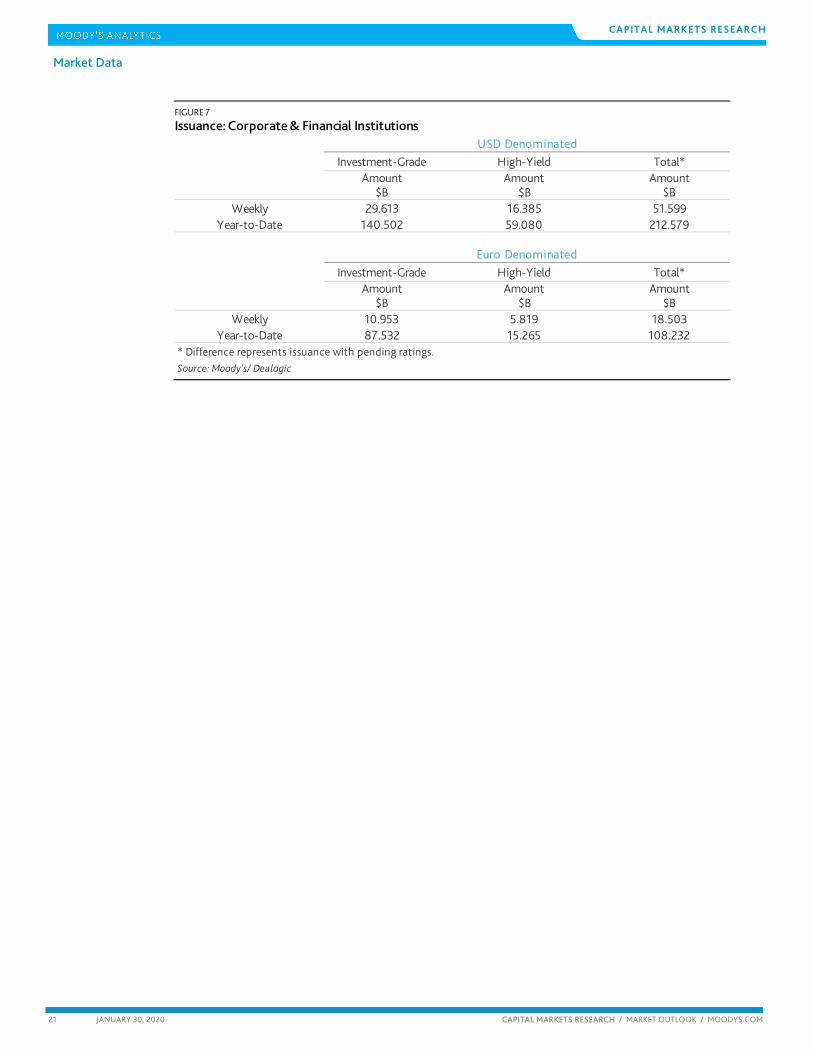
FIGURE 7
Issuance: Corporate & Financial Institutions
Investment-Grade High-Yield Total*Amount Amount Amount
$B $B $BWeekly 29.613 16.385 51.599
Year-to-Date 140.502 59.080 212.579
Investment-Grade High-Yield Total*Amount Amount Amount
$B $B $BWeekly 10.953 5.819 18.503
Year-to-Date 87.532 15.265 108.232* Difference represents issuance with pending ratings.Source: Moody's/ Dealogic
USD Denominated
Euro Denominated
22 JANUARY 30, 2020 CAPITAL MARKETS RESEARCH / MARKET OUTLOOK / MOODYS.COM
CAPITAL MARKETS RESEARCH
Moody’s Capital Markets Research recent publications
How Corporate Credit Might Burst an Equity Bubble (Capital Markets Research)
Positive Earnings Outlook Requires Flat to Lower Interest Rates (Capital Markets Research)
Overvalued Equities Increase Corporate Credit’s Downside Risk (Capital Markets Research)
High-Yield Rating Changes Say High-Yield Bond Spread Is Too Thin (Capital Markets Research)
Return of Christmas Past Does Not Impend (Capital Markets Research)
Next Plunge by Profits to Drive Leverage Up to 2009 High (Capital Markets Research)
Corporate Bond Issuance Reflects Business Activity’s Heightened Sensitivity to Rates (Capital Markets Research)
Equities Advanced for 95% of the Yearly Declines by High-Yield Bond Spread (Capital Markets Research)
Improved Market Sentiment Is Mostly Speculative (Capital Markets Research)
Loans Impart an Upward Bias to High-Yield Downgrade per Upgrade Ratio (Capital Markets Research)
VIX, EDF and National Activity Index Go Far at Explaining the High-Yield Spread (Capital Markets Research)
Worsened Fundamentals Lift Downgrades Well Above Upgrades (Capital Markets Research)
Next Recession May Lower 10-year Treasury Yield to Range of 0.5% to 1% (Capital Markets Research)
Abundant Liquidity Suppresses Defaults (Capital Markets Research)
Cheap Money in Action (Capital Markets Research)
Bond Implied Ratings Hint of More Fallen-Angel Downgrades (Capital Markets Research)
Leading Credit-Risk Indicator Signals A Rising Default Rate (Capital Markets Research)
Upon Further review, Aggregate Financial Metrics Worsen (Capital Markets Research)
Faster Loan Growth Would Bode Poorly for Corporate Credit Quality (Capital Markets Research)
Likelihood of a 1.88% Fed Funds Rate by End of July Soars (Capital Markets Research)
Market Implied Ratings Differ on the Likely Direction of Baa3 Ratings (Capital Markets Research)
Below-Trend Spreads Bank on Profits Growth, Lower Rates and Healthy Equities (Capital Markets Research)
Global Collapse by Bond Yields Stems from Worldwide Slowdown (Capital Markets Research)
Borrowing Restraint Likely Despite Lower Interest Rates (Capital Markets Research)
The Fed Cured 1998's Yield Curve Inversion (Capital Markets Research)
Extended Yield Curve Inversion Would Presage Wide Spreads and Many Defaults (Capital Markets Research)
Business Debt's Mild Rise Differs Drastically from 2002-2007's Mortgage Surge (Capital Markets Research)
Earnings Slump Would Unmask Dangers of High Leverage (Capital Markets Research)
Credit May Again Outshine Equities at Divining Markets' Near-Term Path (Capital Markets Research)
Not Even the Great Depression Could Push the Baa Default Rate Above 2% (Capital Markets Research)
Benign Default Outlook Implies Profits Will Outrun Corporate Debt (Capital Markets Research)
Upside Risks to the U.S. Economy (Capital Markets Research)
Outstandings and Rating Changes Supply Radically Different Default Outlooks (Capital Markets Research)
High Leverage Offset by Ample Coverage of Net Interest Expense (Capital Markets Research)

23 JANUARY 30, 2020 CAPITAL MARKETS RESEARCH / MARKET OUTLOOK / MOODYS.COM
CAPITAL MARKETS RESEARCH
To order reprints of this report (100 copies minimum), please call 212.553.1658.
Report Number: 1212580 Contact Us
Editor Reid Kanaley [email protected]
Americas: 1.212.553.4399
Europe: +44 (0) 20.7772.5588
Asia: 813.5408.4131
24 JANUARY 30, 2020 CAPITAL MARKETS RESEARCH / MARKET OUTLOOK / MOODYS.COM
CAPITAL MARKETS RESEARCH
© 2020 Moody’s Corporation, Moody’s Investors Service, Inc., Moody’s Analytics, Inc. and/or their licensors and affiliates (collectively, “MOODY’S”). All rights reserved.
CREDIT RATINGS ISSUED BY MOODY'S INVESTORS SERVICE, INC. AND ITS RATINGS AFFILIATES (“MIS”) ARE MOODY’S CURRENT OPINIONS OF THE RELATIVE FUTURE CREDIT RISK OF ENTITIES, CREDIT COMMITMENTS, OR DEBT OR DEBT-LIKE SECURITIES, AND MOODY’S PUBLICATIONS MAY INCLUDE MOODY’S CURRENT OPINIONS OF THE RELATIVE FUTURE CREDIT RISK OF ENTITIES, CREDIT COMMITMENTS, OR DEBT OR DEBT-LIKE SECURITIES. MOODY’S DEFINES CREDIT RISK AS THE RISK THAT AN ENTITY MAY NOT MEET ITS CONTRACTUAL FINANCIAL OBLIGATIONS AS THEY COME DUE AND ANY ESTIMATED FINANCIAL LOSS IN THE EVENT OF DEFAULT OR IMPAIRMENT. SEE MOODY’S RATING SYMBOLS AND DEFINITIONS PUBLICATION FOR INFORMATION ON THE TYPES OF CONTRACTUAL FINANCIAL OBLIGATIONS ADDRESSED BY MOODY’S RATINGS. CREDIT RATINGS DO NOT ADDRESS ANY OTHER RISK, INCLUDING BUT NOT LIMITED TO: LIQUIDITY RISK, MARKET VALUE RISK, OR PRICE VOLATILITY. CREDIT RATINGS AND MOODY’S OPINIONS INCLUDED IN MOODY’S PUBLICATIONS ARE NOT STATEMENTS OF CURRENT OR HISTORICAL FACT. MOODY’S PUBLICATIONS MAY ALSO INCLUDE QUANTITATIVE MODEL-BASED ESTIMATES OF CREDIT RISK AND RELATED OPINIONS OR COMMENTARY PUBLISHED BY MOODY’S ANALYTICS, INC. CREDIT RATINGS AND MOODY’S PUBLICATIONS DO NOT CONSTITUTE OR PROVIDE INVESTMENT OR FINANCIAL ADVICE, AND CREDIT RATINGS AND MOODY’S PUBLICATIONS ARE NOT AND DO NOT PROVIDE RECOMMENDATIONS TO PURCHASE, SELL, OR HOLD PARTICULAR SECURITIES. NEITHER CREDIT RATINGS NOR MOODY’S PUBLICATIONS COMMENT ON THE SUITABILITY OF AN INVESTMENT FOR ANY PARTICULAR INVESTOR. MOODY’S ISSUES ITS CREDIT RATINGS AND PUBLISHES MOODY’S PUBLICATIONS WITH THE EXPECTATION AND UNDERSTANDING THAT EACH INVESTOR WILL, WITH DUE CARE, MAKE ITS OWN STUDY AND EVALUATION OF EACH SECURITY THAT IS UNDER CONSIDERATION FOR PURCHASE, HOLDING, OR SALE.
MOODY’S CREDIT RATINGS AND MOODY’S PUBLICATIONS ARE NOT INTENDED FOR USE BY RETAIL INVESTORS AND IT WOULD BE RECKLESS AND INAPPROPRIATE FOR RETAIL INVESTORS TO USE MOODY’S CREDIT RATINGS OR MOODY’S PUBLICATIONS WHEN MAKING AN INVESTMENT DECISION. IF IN DOUBT YOU SHOULD CONTACT YOUR FINANCIAL OR OTHER PROFESSIONAL ADVISER.
ALL INFORMATION CONTAINED HEREIN IS PROTECTED BY LAW, INCLUDING BUT NOT LIMITED TO, COPYRIGHT LAW, AND NONE OF SUCH INFORMATION MAY BE COPIED OR OTHERWISE REPRODUCED, REPACKAGED, FURTHER TRANSMITTED, TRANSFERRED, DISSEMINATED, REDISTRIBUTED OR RESOLD, OR STORED FOR SUBSEQUENT USE FOR ANY SUCH PURPOSE, IN WHOLE OR IN PART, IN ANY FORM OR MANNER OR BY ANY MEANS WHATSOEVER, BY ANY PERSON WITHOUT MOODY’S PRIOR WRITTEN CONSENT.
CREDIT RATINGS AND MOODY’S PUBLICATIONS ARE NOT INTENDED FOR USE BY ANY PERSON AS A BENCHMARK AS THAT TERM IS DEFINED FOR REGULATORY PURPOSES AND MUST NOT BE USED IN ANY WAY THAT COULD RESULT IN THEM BEING CONSIDERED A BENCHMARK.
All information contained herein is obtained by MOODY’S from sources believed by it to be accurate and reliable. Because of the possibility of human or mechanical error as well as other factors, however, all information contained herein is provided “AS IS” without warranty of any kind. MOODY'S adopts all necessary measures so that the information it uses in assigning a credit rating is of sufficient quality and from sources MOODY'S considers to be reliable including, when appropriate, independent third-party sources. However, MOODY’S is not an auditor and cannot in every instance independently verify or validate information received in the rating process or in preparing the Moody’s publications.
To the extent permitted by law, MOODY’S and its directors, officers, employees, agents, representatives, licensors and suppliers disclaim liability to any person or entity for any indirect, special, consequential, or incidental losses or damages whatsoever arising from or in connection with the information contained herein or the use of or inability to use any such information, even if MOODY’S or any of its directors, officers, employees, agents, representatives, licensors or suppliers is advised in advance of the possibility of such losses or damages, including but not limited to: (a) any loss of present or prospective profits or (b) any loss or damage arising where the relevant financial instrument is not the subject of a particular credit rating assigned by MOODY’S.
To the extent permitted by law, MOODY’S and its directors, officers, employees, agents, representatives, licensors and suppliers disclaim liability for any direct or compensatory losses or damages caused to any person or entity, including but not limited to by any negligence (but excluding fraud, willful misconduct or any other type of liability that, for the avoidance of doubt, by law cannot be excluded) on the part of, or any contingency within or beyond the control of, MOODY’S or any of its directors, officers, employees, agents, representatives, licensors or suppliers, arising from or in connection with the information contained herein or the use of or inability to use any such information.
NO WARRANTY, EXPRESS OR IMPLIED, AS TO THE ACCURACY, TIMELINESS, COMPLETENESS, MERCHANTABILITY OR FITNESS FOR ANY PARTICULAR PURPOSE OF ANY CREDIT RATING OR OTHER OPINION OR INFORMATION IS GIVEN OR MADE BY MOODY’S IN ANY FORM OR MANNER WHATSOEVER.
Moody’s Investors Service, Inc., a wholly-owned credit rating agency subsidiary of Moody’s Corporation (“MCO”), hereby discloses that most issuers of debt securities (including corporate and municipal bonds, debentures, notes and commercial paper) and preferred stock rated by Moody’s Investors Service, Inc. have, prior to assignment of any rating, agreed to pay to Moody’s Investors Service, Inc. for ratings opinions and services rendered by it fees ranging from $1,000 to approximately $2,700,000. MCO and MIS also maintain policies and procedures to address the independence of MIS’s ratings and rating processes. Information regarding certain affiliations that may exist between directors of MCO and rated entities, and between entities who hold ratings from MIS and have also publicly reported to the SEC an ownership interest in MCO of more than 5%, is posted annually at www.moodys.com under the heading “Investor Relations — Corporate Governance — Director and Shareholder Affiliation Policy.”
Additional terms for Australia only: Any publication into Australia of this document is pursuant to the Australian Financial Services License of MOODY’S affiliate, Moody’s Investors Service Pty Limited ABN 61 003 399 657AFSL 336969 and/or Moody’s Analytics Australia Pty Ltd ABN 94 105 136 972 AFSL 383569 (as applicable). This document is intended to be provided only to “wholesale clients” within the meaning of section 761G of the Corporations Act 2001. By continuing to access this document from within Australia, you represent to MOODY’S that you are, or are accessing the document as a representative of, a “wholesale client” and that neither you nor the entity you represent will directly or indirectly disseminate this document or its contents to “retail clients” within the meaning of section 761G of the Corporations Act 2001. MOODY’S credit rating is an opinion as to the creditworthiness of a debt obligation of the issuer, not on the equity securities of the issuer or any form of security that is available to retail investors.
Additional terms for Japan only: Moody's Japan K.K. (“MJKK”) is a wholly-owned credit rating agency subsidiary of Moody's Group Japan G.K., which is wholly-owned by Moody’s Overseas Holdings Inc., a wholly-owned subsidiary of MCO. Moody’s SF Japan K.K. (“MSFJ”) is a wholly-owned credit rating agency subsidiary of MJKK. MSFJ is not a Nationally Recognized Statistical Rating Organization (“NRSRO”). Therefore, credit ratings assigned by MSFJ are Non-NRSRO Credit Ratings. Non-NRSRO Credit Ratings are assigned by an entity that is not a NRSRO and, consequently, the rated obligation will not qualify for certain types of treatment under U.S. laws. MJKK and MSFJ are credit rating agencies registered with the Japan Financial Services Agency and their registration numbers are FSA Commissioner (Ratings) No. 2 and 3 respectively.
MJKK or MSFJ (as applicable) hereby disclose that most issuers of debt securities (including corporate and municipal bonds, debentures, notes and commercial paper) and preferred stock rated by MJKK or MSFJ (as applicable) have, prior to assignment of any rating, agreed to pay to MJKK or MSFJ (as applicable) for ratings opinions and services rendered by its fees ranging from JPY125,000 to approximately JPY250,000,000.
MJKK and MSFJ also maintain policies and procedures to address Japanese regulatory requirements.