Coromandel: Opportunities Unbound Nov 2017Agri Growth Levers Food Security Annual food requirement...
48
Coromandel: Opportunities Unbound Nov 2017
Transcript of Coromandel: Opportunities Unbound Nov 2017Agri Growth Levers Food Security Annual food requirement...

Coromandel: Opportunities UnboundNov 2017

Contents
01
02
03
Ag Inputs Opportunities
Indian Agriculture
About Coromandel
2

Indian Agriculture
- Scale & Scope
- Growth Levers
- Agricultural Reforms

0
10
20
30
40
50
FY10 FY11 FY12 FY13 FY14 FY15 FY16 FY17
Agri Exports (USD Bil)
Indian Agriculture: The Global Giant
Crop India Ranking % Share
Pulses 1st 23%
Oilseeds 1st 11%
Cotton 1st 29%
F & V 2nd 11%
Sugarcane 2nd 20%
Cereals 3rd 11%
Source: FAOSTAT
Source: DGCIS
7th largest Agri exporter
2nd largest cropland globallyLargest irrigated area
3rd largest Agriculture
producer globally
Agriculture : Contribution to Indian Economy
17% contribution to GVA
12% of country exports
50% of employment
4

….But Productivity Gaps exist
Falling per capita land holding Low Nutrient Usage
Low Crop Protection consumptionLow Mechanization
6.8
1.8
2.7
2.9
0.6
1.4
3.7
0.9
2.3
0.0 2.0 4.0 6.0 8.0
Cereal
Pulses
Soyabean
Yield comparison (Tonnes/ ha)
World India China Brazil USASource: FAO
0.0
0.5
1.0
1.5
2.0
2.5
3.0
1960 1970 1980 1990 2000 2010
Avg Landholding Size (ha)
Source: FAO
132
281
106
146121
Brazil China India USA World
Fertiliser Consumption (kg/ha)
Source: FAO, IFA
0.6
5
7
1213
India UK USA Japan China
Pesticide Consumption (kg/ha)
Source: FICCI
CountryLevel of farm
Mechanization
India 40%
Brazil 75%
USA 95%
West Eur 95%
Russia 80%
China 48%
Source: World Bank, FAO
Mega Growth Opportunities for bridging the productivity gaps 5

Agri Growth LeversFood Security
Annual food requirement in India to go up at 1% CAGR
FY17
272 mil MT
FY50
333 mil MT
Improved support price
1.3 B
1.6 B
0
50
100
150
200
250
300
FY06 FY08 FY10 FY13 FY16
Avg Daily Wages- Agri Labour (Rs/ day)
….Coupled with Rural Wage Growth
Higher
Disposable
Income
Source: CACP
Source: Dept of Agri
1000 1120 880
30002500 2300
1470 1625 1365
5050
38604220
PADDY WHEAT MAIZE ARHAR COTTON GROUNDNUT
Crop MSP (Rs/Qtl)
FY11 FY17
CAGR 7% 7% 11%8% 9% 8%
6

2010 2030
Indian Consumption Basket
Cereals & Pulses Milk & Meat F&V Oil Others
Cereals
Milk & Meat
F&V
Others
USD 160 Bil
USD 350 Bil
Agri Growth Levers
Dietary Shifts Digital India
Efficient delivery mechanism- Ag Inputs & Output
Towards Cashless agri credit
Oil
Source: CII Mckinsey
Food consumption to more than double by 2030
Consumption towards premium food
Unified National Agriculture Market
Source: SFAC
USD 85 bil
USD 34 bil
USD 44 bil
USD 95 bil
7

…along with Agriculture reforms
Doubling Farmer Income by 2022
Productivity Improvement
Bio technology
Micro Irrigation
Water & Inputs
Minimizing crop losses:
Crop Protection
Balancing nutrition
Increasing Irrigation Coverage
Integrated Farming
Allied Activities
Improving Market
Realization
E Procurement
More crop per drop: Potential to bring 69 million hectare area under Micro-Irrigation (8 mil currently)
Bringing additional area under irrigation coverage: 8 mil ha (USD 13 bil investment)
Connecting 585 agri yards centrally
Developing Agri infrastructure & storage capabilities
8

& Positive Policy MeasuresNutrient Based Subsidy Make in India
…..Towards deregulating the Fertiliser industry
63% 60% 52%37% 35% 35% 34% 27%
37% 40%48%
63% 65% 65% 66% 73%
Pre NBS 2010-11 2011-12 2012-13 2013-14 2014-15 2015-16 2016-17
Subsidy as % of total realization Farmgate price as % of total realization
Fixed subsidy & variable farm gate pricesFixed MRP
Easing working capital pressure
Flexibility to fix farm gate prices
Shift from Commodity based to Market driven
…..Thrust towards Domestic Manufacturing
Fertiliser Prices
Investment Innovation Skill Devt Protect IP Best in Class
Promotes infrastructure development
Supports domestic manufacturing
R&D and innovative solutions
9

Manufacturer FarmerRetailer
PoStransaction
Digitized land records & Farmer’s Unique ID captured
Purchase info triggered
Subsidy Disbursement on Farmer Purchase
Product Flow Subsidy Flow
Dept of Fert
& Positive Policy Measures
Direct Benefit Transfer …..Towards balancing Soil Health
Informed farmer purchases based on Soil Health Status
Subsidy to manufacturer to be paid on weekly basis
Lead to digitization & improved rural connect
Prevention on fertiliser leakage & diversion
DBT to improve nutrient usage & promote balanced
applicationPilot study under way
10

…coupled with Rural Empowerment to boost Growth
Soil Health ~60 million soil health cards issued upto Mar’2017
Budget allotment: USD 84 mil
Organic thrust: Additional 0.5 mil ha coverage
Financial
Inclusion
Infrastructure
Development
Bank Account for each household: 250 million accounts
Crop Insurance (50% coverage by 2019) & Credit access
2000 Model Retail Outlets- Agri inputs, Soil & Seed testing facilities
Road development: 100 km/ day
100% rural electrification by 2018
89 Irrigation projects: Additional 8 mil hectare coverage
Long Term Irrigation Fund
Irrigation
Coverage
11

Ag Inputs Opportunities
- Ag Nutrients
- Crop Protection
12

Opportunities in Inputs space: Ag Nutrients
Source: IISS Bhopal
More than 50% of the districts deficient in essential plant nutrients- Opportunity for Balanced Nutrition
Relatively untapped Secondary & Micro Nutrients segment
Organic products to balance plant growth
Nutrient Deficient India Soils
13

Opportunities in Inputs space: Micro Irrigation & Water Soluble Fertiliser
Benefits:
Increase in Water Use Efficiency: 50 – 90%
Productivity Increase: 40-50%
Increase in Farmer’s income: 42%
3.1
4.9
6.1
7.7
2005 2010 2012 2015
Area under Micro irrigation (mil ha)
Potential: 69 mil HaCurrent coverage: 8 mil Ha
Current Micro Irrigation coverage at 6% (US: 55%, Brazil: 52%, China: 10%)
Scope to scale up consumption of Water soluble Fertilisers
Source: Grant Thornton
14

Opportunities in Crop Protection space
Increasing Pest Incidence
1940 At PresentTotal Pests
Serious Pests
Total Pests
Serious Pests
Rice 35 10 240 17
Wheat 20 2 100 19
Sugarcane 28 2 240 43
Ground Nut 10 4 100 12
Mustard 10 4 38 12
Pulses 35 6 250 34
Source: Tata Strategic Mgmt. Partner
Opportunities in Generic SpaceHerbicide Opportunities
2016 2017 2018 2019 2020
1.2
1.6
0.40.7
0.2
Molecules going off patent (USD Bil)
Domestic
Exports
FY15 FY20
2.3
3.12.1
3.2
Indian Crop Protection Market (USD Bil)
Exports segment to grow by 9% p.a.
Domestic segment to grow by 7% p.a.
Increasing labour cost to boost herbicide usage
Global share: 47% India share: 16%
15

Industry Updates: 2017-18 H1
16
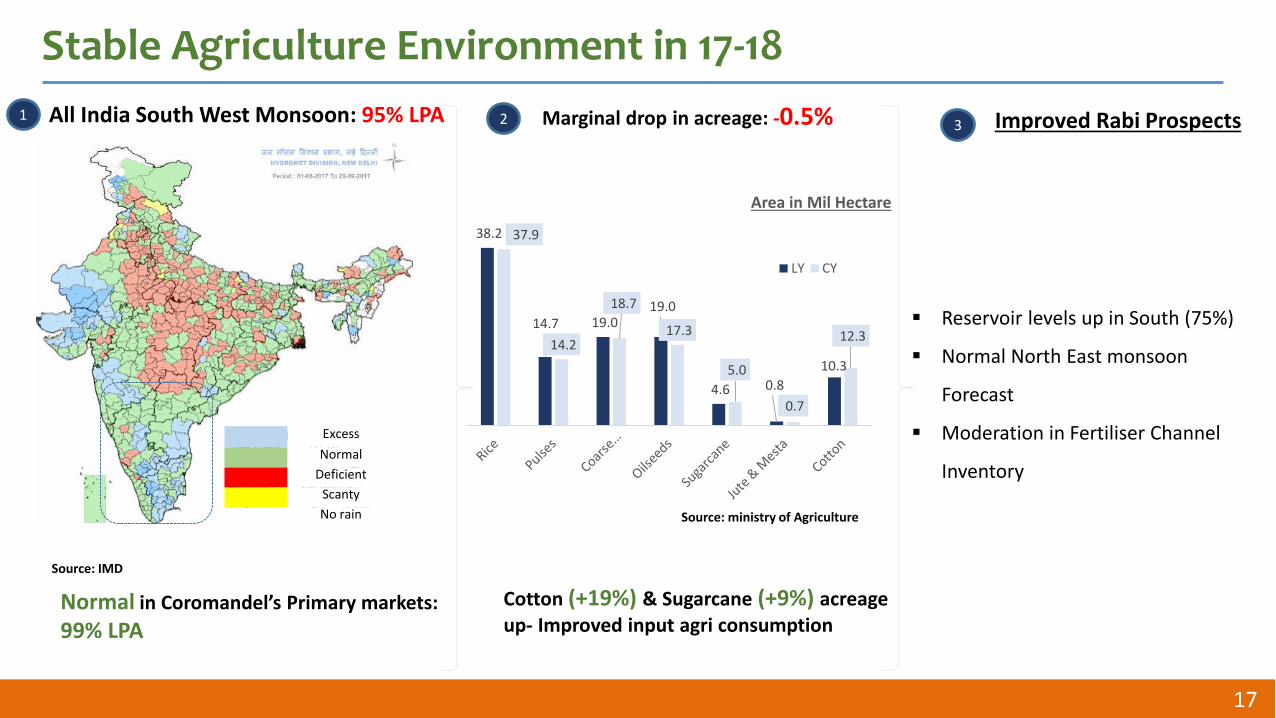
Stable Agriculture Environment in 17-18
Normal in Coromandel’s Primary markets:
99% LPA
Source: IMD
Marginal drop in acreage: -0.5%
Reservoir levels up in South (75%)
Normal North East monsoon
Forecast
Moderation in Fertiliser Channel
Inventory
Source: ministry of Agriculture
1 2 3
17
Excess
Normal
Deficient
Scanty
No rain
All India South West Monsoon: 95% LPA
38.2
14.7 19.0 19.0
4.6 0.8
10.3
37.9
14.2
18.7
17.3
5.0
0.7
12.3
LY CY
Cotton (+19%) & Sugarcane (+9%) acreage up- Improved input agri consumption
Area in Mil Hectare
Improved Rabi Prospects

& Positive Policy Reforms
Agriculture focus: Crop Insurance, National Agriculture Market, Infrastructure strengthening
‘Make in India’ Initiative:
Making India self sufficient in Urea production by 2021
Freight Subsidy changes favouring domestic manufacturing in Phosphatics
Direct Benefit Transfer: Bringing ‘Soil Health’ to focus
New Urea Policy: Incentivizing production beyond Reassessed capacity
Gas Price Pooling in Urea: Promoting Energy Efficiency
Ease of introduction of new products in Water Soluble Fertiliser segment
18

…Resulted in improved Fertiliser Industry Dynamics
Source: FAI
Sharp fall in Imports in H1(-24%)
Partially substituted by domestic DAP production (+19%)
Normalized sales (-1%)
Improved consumption resulting in lower channel stocks
Neem Coating of Urea resulting in improved nutrient efficiency
Moderation in bag size (50kg to 45kg) – Balanced Nutrition
Domestic production up in last 2 years: Make in India
19
Indian Phosphatic Industry: Supply-Demand Scenario (in mil tons)
Indian Urea Industry: Supply-Demand Scenario (in mil tons)
11.89.8 10.5 11.3 12.2 12.2
6.3 6.5
10.6
6.1 3.74.1
6.2 4.9
4.1 3.1
21.7
16.5
14.015.8
18.617.2
8.2 8.2
FY12 FY13 FY14 FY15 FY16 FY17 FY17 H1 FY18 H1
Production Imports Sales
22.0 22.6 22.7 22.6 24.5 24.2
11.9 11.5
7.8 8.0 7.1 8.7 8.5
5.5
3.6 3.2
29.5 30.2 30.4 30.9 32.0 29.6
14.4 14.7
FY12 FY13 FY14 FY15 FY16 FY17 FY17 H1 FY18 H1
Production Import Sale

Coromandel Introduction
- About Coromandel
- Business Segments
- Financials

About Coromandel
Vishakapatnam
Kakinada
Jammu
Ankleshwar
Ennore
Sarigam
Pali
Udaipur
KotaRae Baereli
Vadodara
Hospet
Ranipet
Nimrani
Dahej
Crop Protection Plants
Fertiliser Plants - Complexes
Fertiliser Plants - SSP
India’s largest private sector
Phosphatic Fertiliser company
5th largest Ag Chem Indian
company
India’s largest Single Super
Phosphate (SSP) company
Pioneers & market leaders in
Specialty Nutrients
No. 1 Organic Manure player in
India
Largest Rural Retail Chain across India
Coromandel’s Manufacturing Presence
Part of USD 4.5 bil Murugappa Group 21

About Coromandel
Key Facts :
Turnover: USD 1.6 bil (FY16-17)
Market Cap: USD 2.3 bil (Oct 2017)
Strong credit rating: ‘AA +’ (Stable outlook)’ with CRISIL India
Employees: 4300 & equal no. of contract employees
International Linkages: FOSKOR, GCT, CANPOTEX, SQM, GETAX , QAFCO, ICL, OCP, YANMAR etc
International Market Serviced: Latin America, Africa, China, South East Asia, Middle East
Strong Brand Equity Cost effective production Doing it Responsibly Bringing Prosperity R&D Focus 22

Global Strategic Alliances
Strategic investment for Phos acid sourcing
- Foskor
JV with SQM, Chile
Mitsui, Japan
Potash - Canada
Strategic Investment TIFERT – Phos acid venture in
Tunisia
WSF and MAP
MOP
Ammonia and Sulphur
Israel , Togo Algeria
Rock Phosphate
Pact with QAFCO for supply of Urea and Ammonia
FMS JV with Yanmar & co. Japan
“Shell “ Technology
Phos Acid Tie UpBrasil Presence
Crop Protection
Highly diversified sourcing
Significant presence in LatAmmarkets
Technology tie ups with global
majors like Shell
JV Partnership with global water
soluble major, SQM Chile
Farm Mechanization JV with
Yanmar, Japan
23

Business Structure
Non subsidy EBITDA share has steadily improved
from 23% in FY08-09 to 38% in FY16-17
Phosphatic Fertilisers
Crop Protection
Retail
Specialty
Nutrients & Organic fert
DAP
Complex Fertilisers
SSP/MOP
Technicals
Formulations
G-Sulphur
Water Soluble
Organic Manure
Agri Inputs
Agri Services
62%78%
38%22%
Sales EBITDA
Nutrient
and Other Allied Business
Crop Protection
Subsidy / Non Subsidy
24

Growth JourneyTo
war
ds
New
Gro
wth
Se
gme
nts
Entry into Retail
Specialty & Organic Business
Crop Protection-Sabero acquisition
2014 Farm Mechanization-Yanmar JV
2013 SSP-Liberty acquisition
2010 WSF JV with SQM
2008
2006
2011
2012 Technology tie up-Shell
New capacity addition: ~3 mil tons over last decade
New Businesses: CPC, SND, Organic
Expansion into Retail
Channel: 800 stores
Strategic Partnership
Yanmar, SQM, Foskor, Tifert
Technology Tie ups: Shell,
IRRI
25

Business Segments

Coromandel Phosphatic Fertilisers
..resulting in improved Unique Product share
28%
33%
FY14 FY17
…driven by Unique
product sales
Sales growth
0.6
0.8
FY14 FY17
2.2
2.5
FY14 FY17
mil MT
50 Lac Mt
C Train Expansion
LIBERTY SSP acquisition
Phosphatic Fertiliser
27
H1Summary
10% Growth
31% growth
35% share
(v/s 29% LY)

Coromandel Phosphatic Fertilisers: Key Strengths
Cost LeadershipSourcing
Strategic Alliances in Sourcing –
• Long Term tie-up with Foskor, South
Africa and Group Chemique, Tunisia,
OCP, Morocco
• Supply agreement :
• Ammonia and Sulphur with
Mitsui
• Potash from Canpotex
• Low cost manufacturer of Phos acid - Visak
and Ennore
• Kakinada - High Efficiency and low
conversion cost
• Ex Plant/Rail deliveries - Low Freight Cost
• Low cost of borrowing
• Access to low cost electricity – Stake in
APGPCL
Marketing Strength
• Wider reach and penetration
• Strong brand image in the home market
• Wide Product Range - Low ‘P’ to high ‘P’
• Direct contact with farmers - Mana Gromor
Centers
• Extensive field promotions
Unique Grade FocusAlternate Sources Manufacturing Flexibility
28

Coromandel Phosphatic Fertilisers: Locational Advantage
Nutrient Consumption (Kg/ha)
Presence across major consumption pockets
~60% market share in highest consuming AP & Telangana markets
Primary markets maintains the balanced nutrient ratio
Market leader in Complex fertiliser segment
2nd largest Phosphatics player in India
Highest producer and marketer of unique fertiliser grades
Plants located along strategic sourcing ports
Three Pronged Channel Approach: Trade, Retail, Institution
29

Direct Benefit Transfer (DBT) : Changing Scenario
Wholesaler Focus Retailer Focus
Servicing as per Convenience Scientifically Serving the network
Generic Grades Brands
Selling Marketing
Warehouse Storage Direct Plant Deliveries
Paradigm Shift post DBT
Advantage Coromandel:
Direct farmer connect through ~800 Mana Gromor Centers
Integrated Nutrient Team with Agronomist support
Feet on the Street: ~2200 marketing team
Unique product focus: 33% sales share
High brand equity in key markets
Significant Retailer Reach
30

Coromandel Phosphatics: Manufacturing efficiency
Strategically located Plants in highly irrigated southern Indian states and in heart
of fertilizer consumption market – low freight cost
Plant Facilities – State of art with good infrastructure support & robust systems
Phosphate – Lowest cost manufacturer in India
Backward integration into manufacturing the intermediate - phosphoric acid
from rock
Captive jetty at Vizag, Own storage tanks and pipeline for raw materials:
Ammonia & molten sulphur (Vizag & Ennore) - Lower handling and associated
costs
Captive power plants at Vizag & Ennore
31

Coromandel Crop Protection
5th Largest Crop Protection Company in India: USD 210 mil
Technical Manufacturing Capacity 50,000+ MT/ annum
3rd Largest Mancozeb manufacturer globally
Robust Environment Management Systems: ~USD 10 mil investment in last 5 years
Acquisition of FICOM and setting up Jammu Unit I
Expansion to Latin America
Acquired Pasura Bio Tech –
Jammu Unit IISabero
Acquisition
2006 2010 20112009
Acquired
pesticides unit of
BPM
1990’s
Sabero Merger completed
2015
32

Coromandel Crop Protection : Exports
8 Subsidiaries in key global geographies- Adding Subsidiaries in Africa
Presence across 71 countries
~USD 80-100 mil revenue from exports
Exports share: 40%
~800 global registrations
B2B & B2C presence
Central America,
7%
Africa, 11%
Apac, 12%
China, 2%
South America,
7%
India, 62%
33
Nigeria
Sales Share: 2016-17

Coromandel Crop Protection : Domestic Formulations
Rice –Andhra, Telangana, Tamil Nadu, West Bengal, Punjab
Grapes –Maharashtra, Karnataka
Cotton – Punjab, Andhra, Karnataka, Gujarat
Chilli – Andhra, Madhya Pradesh
Soyabean – Madhya Pradesh, Maharashtra
Pulses- Madhya Pradesh, Uttar Pradesh, Maharashtra, Rajasthan
F & V – All India
Coromandel Focus Crops and Major States
Wide product portfolio ~60 brands
Customer reach thru 9000+ retailers
76% 77% 72% 72% 69%
24% 23% 28% 28% 31%
FY12 FY13 FY14 FY15 FY16
Generic Specialities
Specialties Focus
34
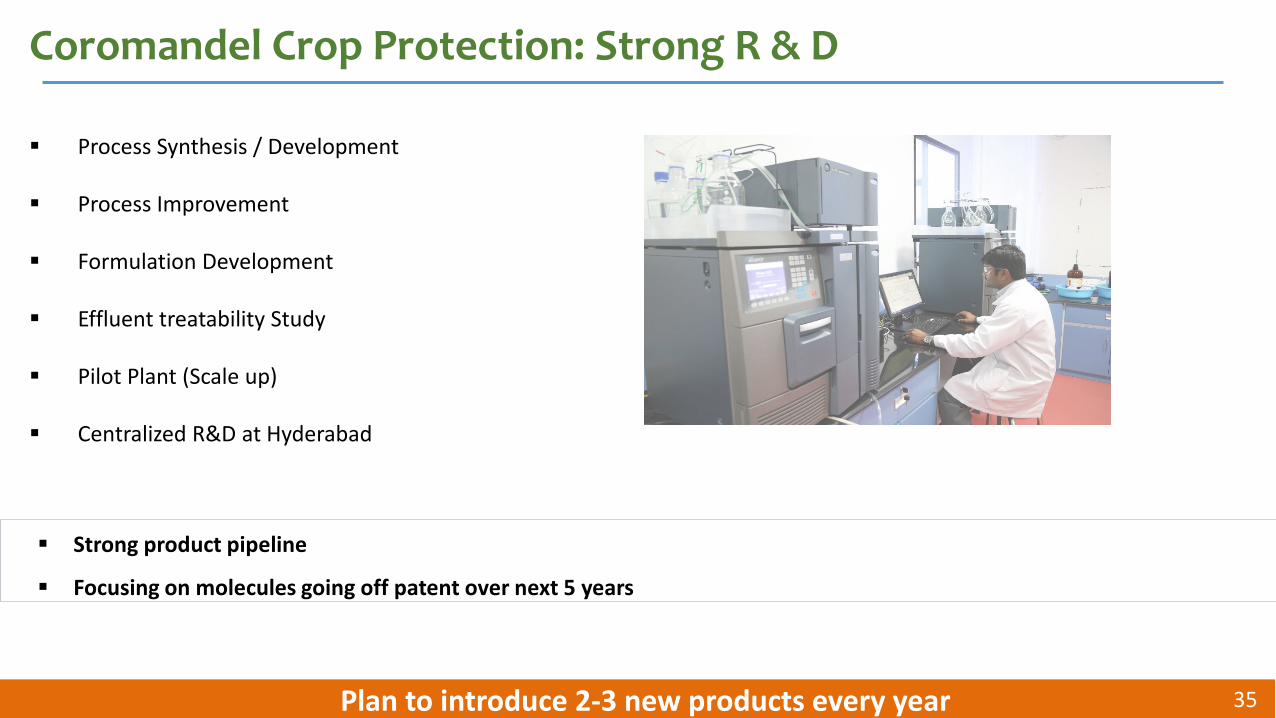
Coromandel Crop Protection: Strong R & D
Strong product pipeline
Focusing on molecules going off patent over next 5 years
Process Synthesis / Development
Process Improvement
Formulation Development
Effluent treatability Study
Pilot Plant (Scale up)
Centralized R&D at Hyderabad
Plan to introduce 2-3 new products every year 35

Coromandel Crop Protection: Growth Strategy
Focus on Export Registrations to improve market penetration
B2C presence
Expand business in LATAM, Africa & APAC by leveraging strong registration portfolio
Domestic market expansion
Product portfolio expansion
Increase R&D focus
Off Patent molecule synthesis and process improvements in existing range
Improving souring efficiency & Cost Position
Generate market information through China office
36

1644
2615
1500
FY16 FY17 FY18H1
1281614082
8036
FY16 FY17 FY18H1
Crop Protection: Performance Variables
10%59%
Growth Drivers:
High demand for key molecule Mancozeb
Capacity augmentation of Mancozeb at Dahej and Sarigam
Successful product launches
37
Turnover (INR mil) PBIT (INR mil)
12.8%
18.6% 18.7%
FY16 FY17 FY18H1
PBIT %
2% growth (2%) drop
Headwinds H1:
Industry slowdown globally in H1
De stocking before GST- Impact in Q1
Raw material strengthening

Coromandel Retail
Customer Reach
20
300
400 423
641
800No. of Retail Stores
Dec-07 Dec-08 Mar-09 Mar-11 Mar-13 Mar-16
Karnataka Andhra Pradesh
Telangana
Farming Solutions 2.8 million farmers annually
Seeds
Ag Nutrients
Crop Chem
Vet Feed
Products
Credit
Farm Mechanization
Agri Insurance
Farm Implements
Services
Soil/ Petiole Testing
Extension Activities
Convergence of
Products & Services:
One Stop Shop
for Agriculture needs
~70% turnover through Captive products
Non Fertiliser Focus: ~45% of annual sales
‘Retailer of the Year’ award by CMO Asia
38Expansion into Maharastra in Q3

Coromandel Retail: Improving Customer Value Proposition
Complete Farming
Solutions
Trusted Place to Buy & Sell
Assured Availability
Market Operated Price
Technical Advise to get
economic returns
Farm Mechanization
scale up
Digital Reach -Closer to door
steps
Farm Credit scale up
Quality, Trust & Farm Advice
Existing
Planned
39

Coromandel Specialty Nutrients
Product Solutions
WSFSecondary Nutrients
Micro Nutrients
Crop Solutions
Cereals Pulses Cotton Horticulture
Strategic Shift
Crop based & soil based new product introduction to address farmer needs
Agronomist team to bring crop focus- Developing market based on total nutrition package 40

Coromandel Specialty Nutrients: Balancing Growth
89% 85% 86% 83%67% 67% 66%
11% 15% 14% 17%33% 33% 34%
FY10 FY11 FY12 FY13 FY14 FY15 FY16
Generic Unique
Marketing CapabilityManufacturing Capability
Unique Product Focus
Knowledge Capability
Dedicated Agronomist Team
SQM Crop Knowledge
Agronomic & Process R&D
32%
68%
Coromandel Rest
12%
88%
Coromandel Rest
Sulphur products WSFValue based Market Share
Bentonite Sulphur Plant, Vizag- 25000 MT
2012 CSQM 15000 MT WSF Plant, Kakinada
2008 WSF Plant, Vizag
2006
Infr
astr
uct
ure
1st Bentonite Sulphur plant in India
Exclusive manufacturers of WSF
grades - Speedfol, Insta, Superia
WSF-Water Soluble Fertiliser 41New product launches in H1 targeting Solanaceae & Chilli crops

Coromandel Organic Manure: Enriching Soil Health
Organic fertilisers
Bio compost (Soil Health Enabler)
Bio/Microbial and OrganicFertiliser
P – Phosgold(Compost + Rock P)
N – Nrich (oil cake)
K – Kash (Molasses)
Press Mud (By prod Sugarcane)
City compost
Oil Cakes
Regulatory push from government- Market Development Assistance
Push towards waste treatment & management
Soil Health Focus- Sustainable Agriculture
Consumption shift- Green Food
Product Portfolio Growth Drivers
Market Leader in City Compost segment in H1: 38% market share
0.2
1.31
FY09 FY17
Coromandel Organic Vol (in Lakh MT)
26% CAGR
Pioneers in Organic Fertilisers
Market leaders ~30% value share
Efficient sourcing & distribution
42

Coromandel SSP
SSP : Market Leader in H1 12% market share
Manufacturing capacity ~1 mil MT/ annum
Presence across major SSP consuming crops- Pulses & Oilseeds
Improving quality perception and positioning of the product:
Quick Test Kits
Quality Certification: ISO 9001, ISO 14001 & OHSAS 18001 Management
Expanding product range – Granular, Fortified SSP
Expanded SSP presence thru Liberty Phosphate acquisition in 2013
Started SSP manufacturing in 1906 from Ranipet Plant:1st Fertiliser Plant in India
43

Farm Mechanization: Eyeing the Future
Market leadership in TN, AP, Kerala for Rice
transplanters
Service centers in AP, Telangana & Tamil Nadu
Synergistic approach through Coromandel
Retail operations
Indigenization of spares
Expanding portfolio to include other Yanmar
models (Combine , Tractors, Harvesters)
Partnering with Govt.- Custom Hiring Centers
Mechanization across Ag Value Chain
Yanmar Coromandel Agrisolutions –JV between Coromandel, Yanmar & Mitsui
40%
29%
37%
34%
65%
Soil & seed bed preparation
Seeding & Planting
Plant Protection
Irrigation
Harvesting & Threshing
Source: Grand Thornton
Paddy Transplanters
Power Sprayers
Drip
Coromandel’s Presence
44

Coromandel Key FinancialsTurnover ( USD Mil) EBIDTA (USD Mil) & EBIDTA %
ROE & ROCE (%)PAT (USD Mil) & PAT %
*As per new accounting standards Ind AS 45
16801952
1656 16821825 1766
1581
912
FY 2011 FY 2012 FY 2013 FY 2014 FY 2015 FY 2016* FY 2017* FY 2018H1*
186 191
121 126 136 119152
113
59 45
8 18 6
14%
10%9% 8% 7% 7%
10%
12%
0%
2%
4%
6%
8%
10%
12%
14%
16%
0
50
100
150
200
250
300
FY 2011 FY 2012 FY 2013 FY 2014 FY 2015 FY 2016* FY 2017* FY2018H1*
EBITDA before PY subsidy PY Subsidy EBITDA %
156
125
8061 65
5474
64
9%
6%
5%
4% 4%3%
5%
7%
0%
2%
4%
6%
8%
10%
0
50
100
150
200
FY 2011 FY 2012 FY 2013 FY 2014 FY 2015 FY 2016* FY 2017* FY 2018H1*
PAT PAT %
0.0%
10.0%
20.0%
30.0%
40.0%
FY 2011 FY 2012 FY 2013 FY 2014 FY 2015 FY 2016* FY 2017* FY2018H1*
ROCE ROE

Coromandel Financials- P&L
*As per new accounting standards Ind AS
In Rs Mio
FY 2011 FY 2012 FY 2013 FY 2014 FY 2015 FY 2016* FY 2017* FY 2018* H1
Revenue 77,204 99,796 91,038 1,01,140 1,13,630 1,17,003 1,02,499 59,543
YoY (Growth) (%) 18% 29% -9% 11% 12% 3% -12%
EBITDA before PY Subsidy 8,291 9,728 6,591 7,578 8,495 7,896 9,820 7,386
PY Subsidy 2,265 461 1,088 349 - - -
EBITDA Reported 10,556 10,189 7,679 7,926 8,495 7,896 9,820 7,386
YoY (Growth) (%) 49% -3% -25% 3% 7% -7% 24%
PBT after exceptional item 9,857 9,111 5,567 5,171 5,920 5,291 7,123 6,341
PAT 6,937 6,345 4,337 3,649 4,018 3,574 4,770 4,180
EPS (Rs.) -Basic 24.66 22.64 12.46 15.27 13.80 12.27 16.36 14.32
Debt / Total Capital (%) 44.4% 54.9% 56.1% 44.4% 51.0% 50.4% 43.5% 33.39%
LT Debt / Total Capital (%) 9.6% 12.2% 22.4% 10.6% 5.5% 1.8% 0.0% 0.0%
46
+5%
+56%
H1 growth YOY
+92%

Coromandel Financials- Balance SheetIn Rs Mio
FY 2011 FY 2012 FY 2013 FY 2014 FY 2015 FY 2016* FY 2017* FY 2018 H1*
Equity 19567 24161 23029 23066 22020 26340 28908 31,149
Debt & Other LT liabilities 15923 29774 29761 18730 23178 26890 22398 16,252
Deferred Tax Liability 815 675 1877 1890 1875 1679 1495 1,268
Sources of Funds 36305 54610 54666 43685 47074 54909 52801 48,669
Net Fixed Assets 11041 18226 22764 18085 14261 13612 13495 13,457
Investments 1330 1495 1597 3416 3520 4769 3884 4,608
Cash 9605 9847 5346 4722 3176 1978 1678 1,463
Deposits 0 2698 3850 2850 4700 4800 5223 5,677 Bonds 4300 0 0 0 0 0 0
Inventory 15139 19218 14775 17529 22592 23458 17246 18,602
Subsidy 9690 16260 13756 11123 17894 23671 25570 20,111
Debtors 2024 9579 18201 14835 14464 16419 16217 16,540
Other Current Assets 2163 2328 3832 3490 3010 3111 3138 5,412
Current Liabilities 18987 25041 29454 32363 36543 36908 33649 37,201
Net Current Assets 23933 34889 30306 22185 29293 36528 35423 30,604
Application of Funds 36305 54610 54666 43685 47074 54909 52801 48,669
*As per new accounting standards Ind AS
47

Thank You
48