Cornell University College of Engineering · Cornell University College of Engineering Civil and...
106
Cornell University College of Engineering Engineering Management Plug-In Hybrid Vehicles Critical Analysis and Los Angeles Regional Feasibility Study
Transcript of Cornell University College of Engineering · Cornell University College of Engineering Civil and...
Cornell University
College of Engineering Engineering Management
Plug-In Hybrid Vehicles Critical Analysis and Los Angeles Regional Feasibility Study

Page | 2
Cornell University
College of Engineering
Civil and Environmental Engineering
CEE 5910: Engineering Management Project
Professor Francis M. Vanek
Plug-In Hybrid Vehicles
Critical Analysis and Los Angeles Regional Feasibility Study
December 2010
Auret Basson, Mert Berberoglu, Whitney Bi
Vincent DeRosa, Sara Lachapelle, Christina Lu
Torio Risianto, Torsten Steinbach, Adam Stevens
Alice Yu and Naji Zogaib

Page | 3
Executive Summary
This report is the product of a team project conducted at Cornell University for the Master of
Engineering degree in Engineering Management. The project goal was to study the potential transition of
light duty passenger vehicles to the Plug-In Hybrid Electric Vehicle (PHEV) concept, using the Los Angeles
basin as the feasibility focus region. The analysis and findings should prove useful to governments,
consumers, utilities, vehicle manufacturers, and other stakeholders.
PHEVs incorporate both an electric motor and an internal combustion engine, with a battery pack that
can be recharged externally. This vehicle concept has been gaining attention due to its potential ability
to reduce petroleum consumption and carbon emissions, especially when combined with sustainable,
low-carbon electricity generation. A mass transition toward PHEVs has been seen as one possible
measure for addressing concerns related to climate change, global peak oil, dependence on foreign oil,
urban smog, and air pollution.
The team began by conducting a literature review in order to gain background information on the PHEV.
The scope of the literature review was limited to the existing PHEV technology in Europe, Asia and North
America; the PHEV battery with a focus on the Lithium-ion battery; electrical infrastructure including
charging stations, smart grid systems, and renewable energy; and finally a section summarizing
government, consumer and other points of view regarding PHEVs. The purpose of the literature review
was to collect existing information about PHEVs as well as to identify potential areas of research.
A Streamlined Life Cycle Analysis (SLCA) was performed to evaluate how environmentally responsible the
PHEV is when compared to Internal Combustion Engine Vehicles (ICEVs). All five stages of the life cycle
were studied: premanufacture, manufacture, delivery, use, and disposal. Though the ICEV showed
better results in both the manufacture and disposal stages, overall the PHEV achieved a better score and
proved to be the better environmental choice.
A regional analysis of electrical infrastructure was performed to determine whether the local utility had
sufficient generation capacity to support PHEVs. The analysis considered available capacity, existing
electricity demand, and hypothetical PHEV charging demand. These were compared on an hourly basis in
the context of the hottest day on record, when the infrastructure would be under maximum stress.
Several scenarios were considered for determining available capacity. These include currently existing
generation resources; hypothetical resources that meet 2020 targets for increased renewables; and
increased renewables in conjunction with a vehicle-to-grid system that uses PHEV batteries as a form of
grid storage. A Solver analysis was able to calculate maximum PHEV fleet penetrations under the various
scenarios, using both default assumptions for PHEV electricity usage and theoretical maximums. It was
found that LA’s existing generation resources can support a 100% transition under default assumptions,
and that the 2020 target resources can support a 98% transition if a vehicle-to-grid system is
implemented.
The team also performed a cost analysis, focusing on the costs incurred by the customer. The study was
concerned with both direct and indirect costs. The indirect cost consisted of a qualitative analysis, and
the PHEV proved to incur lower indirect costs. The direct costs were subdivided into two major
components: the capital costs and the operating costs. The capital costs consisted of the initial costs to
own the car and the operating cost consisted of costs from maintaining and driving the car over its
lifetime (a period of 15 years). The results of this analysis determined that the PHEV has higher capital

Page | 4
costs compared to the ICEV but that the overall costs over the lifetime of the car were similar for both.
The following table summarizes the findings of the cost analysis.
A review of current government incentives found that the government of California promotes PHEVs and
other low emission vehicles through legal regulations, offering various advantages to their drivers. The
Climate Change Program AB32, passed in 2006, sets annual goals for the reduction of greenhouse gas
emissions until 2020. This program requires manufacturers to reduce the emissions of their fleets
significantly year by year, starting in 2010. Meanwhile, by purchasing a PHEV, the consumers are granted
tax credits that are worth between $2,500 to $7,500 depending on the size of the battery. In addition,
PHEV owners enjoy the advantage of free parking in certain areas in LA and are allowed to use carpool
lanes in the greater LA area.
Overall, this research project reveals that PHEVs are the more environmentally friendly solution for
private transportation when compared to ICEVs. The infrastructure analysis demonstrates that
generation capacity is not a limiting factor for PHEV penetration in Los Angeles. However, other utilities
should do their own local analysis to determine whether additional generation resources are needed to
support the charging of PHEVs. Utilities can optimize the use of the existing generation resources by
implementing a smart-grid system that allows them to control the timing of PHEV charging. Wind
generation is highly compatible with PHEVs, as both peak at night, and PHEV batteries can act as form of
distributed storage that would help mitigate the intermittency of wind. Utilities with access to wind
resources should therefore promote PHEVs and consider implementing vehicle-to-grid systems.
Various stakeholders including manufacturers, consumers and utilities influence the transition from
ICEVs to PHEVs in the LA area. To increase and expedite PHEV penetration, the government should
consider service-based incentives in addition to the existing financial incentives. Private organizations
such as entertainment facilities, car wash companies and auto shops could be required to offer exclusive
service and ticket booth lanes for PHEV owners. Such service-based incentives raise public awareness
and make PHEVs more attractive while minimizing revenue losses for the government. The government
should also consider introducing PHEVs in their fleets as police cars or ambulances to raise public
awareness and increase demand.
PHEVs can help car manufacturers comply with the emission reduction requirements in California.
Therefore, they should extend their product portfolio and consider the introduction of luxury PHEVs and
SUV PHEVs. Key promotional values that can be used for manufacturers’ marketing campaigns include
lower noise pollution, less emissions and significantly lower operating costs. In addition to promoting
these values through creative advertisements, they should also be communicated via bi-directional
promotion strategies which allow consumers to easily inquire for more information about PHEVs.
At this early stage of the PHEV development, there are already strong arguments for consumers and
other stakeholders to support this alternative form of light duty passenger transportation. It is shown
that PHEVs are cost competitive, more environmentally friendly and energy efficient. In addition, cost
savings can be expected as the technology matures. The current capacity of LA's energy infrastructure is
able to support the maximum penetration rate of PHEVs, and with effective promotional efforts from the
government, manufacturers and other stakeholders, a transition to PHEVs in LA is achievable.

Page | 5
Team Roster
The following map shows the countries of origin of the eleven team members who worked on the PHEV
project. The backgrounds and interests of each group member are discussed below.
Figure 1 – Countries of Origin of the PHEV Team Members
Auret Basson studied Civil Engineering during his undergraduate education in South Africa, after which
he completed a Master’s degree in Renewable and Sustainable Energy. While completing his studies, he
has worked for a Consulting Engineering firm (BKS Engineering and Management) for almost 5 years in
their Water & Power Division. Auret has worked on various water treatment plants all over Africa. He
was the deputy project manager for a cooling water pipeline currently being constructed for two coal-
fired power stations in South Africa. In the last two years, Auret has become more involved in renewable
energy projects and last worked as the project engineer on a 40MW community wind farm project.
Auret was particularly interested in the grid integration aspects of the PHEV project. Specifically, he was
interested in the impact that increased PHEV penetration could have on the electric grid in terms of
added storage and its subsequent impact on renewable energy integration. He also wished to gain
understanding about the Smart Grid’s role in a high-penetration PHEV system and explore possibilities
for achieving a dynamic, integrated system between energy supply and the PHEV user.
Mert Berberoglu was born and grew up in Ankara, Turkey. He studied Environmental Engineering at the
Middle East Technical University. Before coming to Cornell, Mert was working at a Membrane Bio-
Reactor (MBR) Wastewater Treatment Facility as an Environmental Engineer. His concerns about the
environmental issues increased his interest in the renewable energy field. Moreover, he was also
interested in the managerial aspects of engineering. Accordingly, during his research for the PHEV
project, Mert participated in both, infrastructre and business sub-teams. He describes his experience in
the PHEV team as unique and unforgettable. Aside his contrubutions, he developed a deeper knowledge

Page | 6
about wind energy. He also had a chance to put his theoretical knowledge about team dynamics in to
practice and improved his facilitation skills.
Weijia Bi was born in China and completed her undergraduate studies in Shanghai, majoring in Material
Science and Textile Engineering. In addition, she completed various summer internships in the financial
services sector and worked for foreign trading companies in China. Weijia continued her studies at
Cornell and was very interested in the PHEV project, as she is herself an owner of a hybrid vehicle.
Weijia appreciates that hybrid vehicles are more efficient, less polluting and less noisy, thus protecting
the environment. She considers PHEVs to be a meaningful topic for research, given their potential for
improving quality of life. Weijia was also interested in the project as a way to develop her
communication skills, presentation skills and other “soft skills.”
Vincent DeRosa was born and raised in the United States. He studied at the Pennsylvania State
University and graduated in 2010 with a Bachelor of Science in Civil Engineering. His interests in the
PHEV project were primarily related to the infrastructure associated with PHEV technology, particularly
the systems related to an increase in penetration following the initial takeoff, such as commercial and/or
public charging stations.
One of Vincent’s goals in choosing this project was to become familiar with recent advances in green
technology. He also hoped to gain experience with the business aspect of PHEVs and their financial
feasibility. One of the reasons he decided upon the Engineering Management program was to gain
experience with the less technical business and managerial aspects of engineering projects, which was
left out of his undergraduate education.
Sara Lachapelle was born and raised in Calgary, Canada and attended Cornell University for her
undergraduate degree in Chemical Engineering. She was primarily involved in research regarding the
PHEV technology, including a life-cycle analysis, cost analysis and societal analysis. After she finishes the
Master of Engineering program, Sara plans to work in the financial services industry.
Christina Lu was born in China and came to the U.S. about ten years ago. She received her
undergraduate degree in Chemical Engineering at Cornell in May 2010 and has had internships in the
petroleum industry and in a multi-industry company. Over the course of her studies, however, she has
become more interested in the financial services industry and the consulting industry. Christina saw this
project as an opportunity to gain experience in the consulting process, allowing her to combine her
technical capabilities with her interest in finance and consulting. She also considers herself a big
advocate of renewable energy. This project has allowed Christina to gain a better understanding of the
evolving PHEV technology and how it can create a healthier environment when combined with a
sustainable power grid. Christina was mainly involved with researching the vehicle technology as well as
the business aspects of a market transition.
Torio Risianto was born in Jakarta, Indonesia, and lived in Bali, Indonesia for eight years. He studied
Industrial Engineering and Operations Research at the University of California, Berkeley, specializing in
operations and supply chain management. Torio pursued his Master’s degree in Engineering
Management at Cornell University and discovered his interest in renewable energy when he read and

Page | 7
watched related background information for this project. He is especially concerned about the
catastrophic global effects of oil scarcity if comparable renewable energy technologies have not been
developed. His goal in the project was to learn about the societal significance of renewable energy and
technology. In addition, he has gained experience in working with a large team and was able to relate it
to project management concepts.
Torsten Steinbach studied Industrial Engineering and Business Management at Nordakademie University
in Hamburg, Germany. During his undergraduate studies he focused on operations research and project
management. Torsten has completed various internships in the automotive industry and worked for
Mercedes-Benz after his graduation. He has been continuing his studies at Cornell University since
August 2010, with a focus on manufacturing management. Upon completion of his Master’s degree
Torsten wishes to continue working in the automotive industry. The PHEV project was attractive as an
opportunity to extend his knowledge of sustainable transportation technologies. Torsten is particularly
interested in the business aspects of a transition from internal combustion engine vehicles to PHEVs and
the market potential of the new technology for car manufacturers. He wishes to understand the roles of
different stakeholders of a PHEV introduction and study possibilities for promoting and marketing PHEVs.
Adam Stevens grew up and studied in the UK before moving to the US and studying at Cornell. His
undergraduate degree was a Bachelor of Engineering in Electronic Engineering and Music Technology
Systems. The PHEV project was a perfect match for Adam because of his career goals relating to
renewable energies and evolving technology markets. Aside from this fact, Adam also enjoys driving. His
personal goals for the project were mainly centered around the impact that such a technology would
have on electricity infrastructure, and Adam was very interested in the Vehicle-to-Grid possibilities that
were studied. Adam plans to keep an eye on this evolving technology as he hopes to see it become a
mainstream transportation choice in the coming years.
Alice Yu's background is unusually local, being both a US-born citizen and a recent graduate of Cornell
University. She received her Bachelor of Science from CALS in May 2010, having majored in
Environmental Engineering Technology. Throughout her undergraduate career, Alice pursued a strong
interest in issues of environmental sustainability, particularly as they relate to the sustainable energy
challenge. The PHEV project has been very relevant to these interests, allowing Alice to deepen her
understanding of sustainable transportation, renewable energy, electricity infrastructure, and smart-grid
systems.
Naji Zogaib was born and raised in Lebanon. He attended the University of Toronto for his
undergraduate degree in Mechanical Engineering. While completing his undergraduate studies, he
worked for a Consulting Engineering firm (SNC-Lavalin Nuclear Inc.) for two summer internships. He was
in charge of drafting technical and commercial proposals for the different work packages of one of the
major projects the company was involved in. This experience led him to choose to pursue a Masters
degree in Engineering Management.
Naji's work on the PHEV project focused primarily on the research of the technology including a life cycle
analysis, a cost analysis and a PHEV penetration forecast. Naji has particular interest in all topics related
to energy and the environment and hopes to re-enter that field of work professionally upon graduation.

Page | 8
Table of Contents
1 Problem Description and Statement of Scope ..................................................................................... 15
1.1 Background .................................................................................................................................. 15
1.2 Project objectives ........................................................................................................................ 15
1.3 PHEV technology ......................................................................................................................... 16
1.3.1 Streamlined LCA ...................................................................................................................... 16
1.3.2 Cost analysis ............................................................................................................................ 16
1.3.3 Societal analysis (background on LA) ...................................................................................... 16
1.3.4 Assumptions ............................................................................................................................ 17
1.4 Electrical infrastructure in the Los Angeles basin ....................................................................... 17
1.4.1 Available generation capacity ................................................................................................. 17
1.4.2 Electricity demand ................................................................................................................... 18
1.4.3 Smart grid and vehicle-to-grid ................................................................................................. 18
1.4.4 Assumptions ............................................................................................................................ 18
1.5 Business and transition analysis .................................................................................................. 19
1.5.1 Stakeholder analysis ................................................................................................................ 19
1.5.2 Government initiatives ............................................................................................................ 19
1.5.3 Marketing analysis ................................................................................................................... 19
2 Literature Review ................................................................................................................................. 20
2.1 PHEV Technology ......................................................................................................................... 20
2.1.1 Asia .......................................................................................................................................... 20
2.1.2 Europe ..................................................................................................................................... 21
2.1.3 North America ......................................................................................................................... 22
2.2 PHEV Battery ............................................................................................................................... 23
2.2.1 Battery R&D ............................................................................................................................. 23

Page | 9
2.2.2 Li-ion Battery Recycle .............................................................................................................. 25
2.3 PHEV Infrastructure ..................................................................................................................... 25
2.3.1 Charging Station Infrastructure ............................................................................................... 25
2.3.2 Smart Grid Infrastructure ........................................................................................................ 26
2.3.3 Energy Sources ........................................................................................................................ 27
2.3.4 Stakeholders ............................................................................................................................ 28
3 PHEV Technology ................................................................................................................................. 34
3.1 Two Cycles of the Battery ............................................................................................................ 34
3.2 Performance Criteria ................................................................................................................... 35
3.3 Types of Batteries ........................................................................................................................ 36
4 Life Cycle Assessment .......................................................................................................................... 38
4.1 Premanufacture ........................................................................................................................... 39
4.2 Manufacture ................................................................................................................................ 40
4.3 Delivery ........................................................................................................................................ 41
4.4 Use ............................................................................................................................................... 42
4.5 Disposal ....................................................................................................................................... 43
4.6 Discussion & Conclusions ............................................................................................................ 44
5 Background Information on Los Angeles ............................................................................................. 46
6 Los Angeles Electrical Infrastructure .................................................................................................... 50
6.1 Supply-side Model for Generation Capacity ............................................................................... 50
6.1.1 LADWP Carbon Emission Reduction Targets and Increase in PHEV Electricity Demand ........ 50
6.1.2 Smart Grid/Vehicle-to-Grid (V2G) Potential ............................................................................ 53
6.2 Demand-side Model for PHEV Penetration ................................................................................. 55
6.2.1 Charging Profile ....................................................................................................................... 55
6.2.2 Los Angeles Current Demand/Supply ...................................................................................... 57
6.2.3 PHEV energy demands ............................................................................................................ 58

Page | 10
6.2.4 Simulation model .................................................................................................................... 59
6.3 Results and Discussion ................................................................................................................ 59
6.3.1 Wind and Solar Effects on Supply Curves ................................................................................ 59
6.3.2 Scenario I Results –Penetration Based on Current Supply ...................................................... 60
6.3.3 Scenario II Results –Penetration Based on 2020 Targets ........................................................ 62
6.3.4 Scenario III Results –Penetration Based on 2020 Targets and V2G ........................................ 64
6.3.5 Summary of Results ................................................................................................................. 65
6.3.6 Potential changes .................................................................................................................... 66
7 PHEV Penetration Rates ....................................................................................................................... 67
8 Cost Analysis......................................................................................................................................... 71
8.1 Direct Costs .................................................................................................................................. 71
8.1.1 Capital Cost .............................................................................................................................. 71
8.1.2 Operating Costs ....................................................................................................................... 71
8.1.3 Disposal Cost ........................................................................................................................... 72
8.1.4 Total Direct Cost ...................................................................................................................... 72
8.2 Indirect Costs ............................................................................................................................... 73
8.2.1 Health Costs ............................................................................................................................. 73
8.2.2 Emission Costs ......................................................................................................................... 74
9 Business Aspects of the Transition ....................................................................................................... 75
9.1 Stakeholder Analysis.................................................................................................................... 75
9.2 Current Initiatives to Promote PHEVs ......................................................................................... 76
9.2.1 Climate Change Program - AB32 ............................................................................................. 76
9.2.2 Zero Emission Vehicle .............................................................................................................. 77
9.2.3 Carpool lane/HOV Lane Access and Free Parking ................................................................... 77
9.2.4 Environmental Performance Label .......................................................................................... 77
9.2.5 Tax credit ................................................................................................................................. 77

Page | 11
9.3 Potential Initiatives of the California Government to Promote PHEVs ....................................... 78
9.4 Manufacturers Strategies ............................................................................................................ 78
9.4.1 Current Strategies and Upcoming Challenges ......................................................................... 78
9.4.2 Potential Strategies in the 4 P Marketing Framework ............................................................ 80
10 Conclusion ....................................................................................................................................... 88
11 Recommended Topics for Further Study ........................................................................................ 89
12 Bibliography ..................................................................................................................................... 90
APPENDIX I – MANAGEMENT REPORT ........................................................................................................ 98
Midterm Management Report ................................................................................................................ 98
Summary .............................................................................................................................................. 98
Potential Improvements ...................................................................................................................... 98
Final Management Report ....................................................................................................................... 99
APPENDIX II – REFLECTIONS ...................................................................................................................... 100
Page | 12
List of Tables
Table 1 - Battery Module Specifications...................................................................................................... 37
Table 2 - Qualitative Comparison of batteries ............................................................................................ 37
Table 3 - Premanufacture SLCA Scoring ...................................................................................................... 39
Table 4 - Manufacture SLCA Scoring ........................................................................................................... 40
Table 5 - Delivery SLCA Scoring ................................................................................................................... 41
Table 6 - Use SLCA Scoring .......................................................................................................................... 42
Table 7 - Disposal SLCA Scoring ................................................................................................................... 43
Table 8 - Vehicle overall SLCA Scores .......................................................................................................... 44
Table 9 - Energy Source SLCA Scores ........................................................................................................... 44
Table 10 - Overall SLCA Scores .................................................................................................................... 45
Table 11 - Power Generation Breakdown per resource for 2010 and 2020 ............................................... 51
Table 12 - PHEV driving trends .................................................................................................................... 58
Table 13 - Hourly available solar generation ............................................................................................... 63
TTable 14 - Vehicle to Grid Constraints ....................................................................................................... 64
Table 15 - Summary of maximum penetration results ............................................................................... 66
Table 16 - HEV Sales 1999-2008 .................................................................................................................. 67
Table 17 - Estimated Economic Costs of Motor Vehicle-Related Air Pollution in 2000 .............................. 74
Table 18 - Fleet Average Greenhouse Gas Exhaust Mass Emission Requirements..................................... 83
Table 19 - Payment Plan .............................................................................................................................. 84

Page | 13
List of Figures
Figure 1 – Countries of Origin of the PHEV Team Members ......................................................................... 5
Figure 2 - Capacity Credit Values ................................................................................................................. 28
Figure 3 - The PHEV Propulsion Systems ..................................................................................................... 34
Figure 4 - Illustration of Typical PHEV Discharge Cycle ............................................................................... 35
Figure 5 - Los Angeles Household Income Statistics ................................................................................... 46
Figure 6 - Population Density vs. Daily per-capital VMT in Major Metropolitan Areas in 2007 ................. 47
Figure 7 - 2009 Hybrid Sales in Metropolitan Areas.................................................................................... 48
Figure 8 - Hybrids per 1000 Households in 2009 Metropolitan Areas ........................................................ 49
Figure 9 - Generation Capacity for 2010 and 2020 ..................................................................................... 51
Figure 10 - Capacity Credit Reduction with Increased Wind Energy Penetration ....................................... 52
Figure 11 - Effects of Increased Storage on Wind Capacity Credit .............................................................. 54
Figure 12 - Percentage of PHEVs available for V2G energy storage benefits ............................................. 55
Figure 13 - Hourly driving trends for the USA ............................................................................................. 56
Figure 14 - PHEV charging Profile ................................................................................................................ 56
Figure 15 - Seasonal demand patterns ........................................................................................................ 57
Figure 16 - Hourly demand for LA; hottest day ........................................................................................... 58
Figure 17 - Maximum Dependable Supply under various supply scenarios ............................................... 60
Figure 18 - Supply and demand curves for Scenario I ................................................................................. 62
Figure 19 - Supply and demand curves for Scenario II ................................................................................ 63
Figure 20 - Supply and demand curves for Scenario III ............................................................................... 65
Figure 21 - U.S. Light Duty Vehicle in Use ................................................................................................... 68
Figure 22 - PHEV Adoption Rate .................................................................................................................. 69
Figure 23 - PHEV Penetration ...................................................................................................................... 70
Figure 24 - Summary of Direct Costs ........................................................................................................... 73

Page | 14
Figure 25 - Stakeholders of the PHEV Implementation ............................................................................... 75
Figure 26 - Per Capita Annual Fuel Use and Miles Traveled........................................................................ 79
Figure 27 - Four P Marketing Framework ................................................................................................... 81
Figure 28 - Sales Trucks vs. Passenger Cars ................................................................................................. 82
Page | 15
1 PROBLEM DESCRIPTION AND STATEMENT OF SCOPE
This project is a study of Plug-In Hybrid Electric Vehicles (PHEVs) as a sustainable transportation energy
concept. Its scope includes a critical analysis of the vehicle technology, a regional feasibility study of the
electrical infrastructure necessary for the vehicle fleet, and a business-focused transition analysis.
1.1 Background
Cheap fossil fuel energy has been one of the most important drivers of economic growth in the 20th
century. However, the US dependence on fossil fuel is becoming an ever-growing concern due to
looming challenges such as climate change, air pollution, and global peak oil. There is also public and
political interest in reducing dependence on foreign oil and supplying a larger portion of US energy needs
with renewable energy.
The transportation sector currently relies heavily on the Internal Combustion Engine Vehicle (ICEV),
which necessitates the burning of petroleum in the form of gasoline or diesel. This releases carbon
dioxide – a greenhouse gas that constitutes a major contributor to global warming. Other pollutants in
the exhaust are harmful to urban air quality and constitute a major contributor to smog in densely-
populated cities.
PHEVs are increasingly recognized as a highly efficient and environmentally attractive form of sustainable
light duty passenger transportation (cars, minivans, sport-utility vehicles, etc). PHEVs are powered using
an electric motor and battery pack that is recharged using an external electricity source. The vehicle also
incorporates a traditional internal-combustion engine which recharges the battery when needed and
provides back-up power and range extension. This technology drastically reduces the average amount of
petroleum consumed per vehicle-mile, and the efficient electric power-train results in less energy
consumed overall. This reduces the marginal carbon footprint per vehicle-mile, an effect that is
maximized when the batteries are charged using low-carbon electricity. Low-carbon electricity
generation includes sources such as wind, solar, hydroelectric, geothermal, and nuclear.
Due to these considerations, the PHEV transportation concept is receiving a great deal of interest from
regional and national governments, as well as from energy companies and vehicle manufacturers. The
successful adoption of the technology will depend on many factors, as will its impact on society. These
factors include environmental performance, cost competitiveness, availability of electrical infrastructure,
consumer behavior, government initiative, and marketing strategy.
1.2 Project objectives
This project seeks to understand the potential transition of light duty passenger vehicles from ICEVs to
PHEVs in a specific geographic region. The Los Angeles basin serves as the focus region due to its large
transportation demand and the various energy resources available, including wind and solar.

Page | 16
Due to the range of critical issues associated with such a transition, the scope of this project is organized
into three major components. The first component explores issues relating specifically to the vehicles
themselves; the second component explores issues relating to the local electrical infrastructure; and the
third component explores issues relating to business feasibility and transition.
The combined objective is to achieve a well-rounded, system-level perspective on the desirability and
feasibility of this move away from incumbent ICEVs toward the new PHEVs, as well as identifying what
kinds of investments and adaptations may be required of various stakeholders. This analysis should
provide useful insight to governments, consumers, utilities, vehicle manufacturers, and other
stakeholders.
1.3 PHEV technology
The main objective of this component of the project is to determine how the PHEV compares against the
ICEV in terms of environmental performance, cost competitiveness, and local societal acceptance.
1.3.1 Streamlined LCA
Because the negative environmental impact of ICEVs is such a primary motivator for the transition
toward PHEVs, a life cycle analysis (LCA) was performed in order to compare the two technologies. The
purpose was to determine whether the PHEV is actually the “greener” alternative. The scope of this LCA
was comparative rather than absolute; thus, the analysis overlooked the vehicle components that were
common to both vehicle-types and focused instead on differences such as the battery, electric motor,
energy source, etc.
Rather than attempting to quantify absolute measures of environmental performance such as carbon
footprint, this project used a streamlined approach developed by Yale professor T.E. Graedel. This
approach assigns weighted rankings to five different environmental stressors over five different life
stages of the vehicle. 1
1.3.2 Cost analysis
The LCA determines whether or not the PHEV is the more environmentally friendly alternative, but
eventually, the price the end-user is willing to pay is the deciding factor. The cost analysis took into
consideration both direct and indirect costs. Direct costs consist of capital costs, operating costs and
end-of-life (disposal) costs. The indirect costs focus more on aspects that will affect society as a whole
and thus tax payers. The cost analysis plays a major role in determining whether or not the PHEV is a
feasible alternative to the ICEV. If costs are too high, customers will not buy-in to the idea of the PHEV,
even if it is the environmentally friendlier choice.
1.3.3 Societal analysis (background on LA)
This analysis is concerned with how the PHEV would fit into the local Los Angeles society. This includes a
study of driving trends of the community, including average driving distances, highway vs. city mileage,
1 (Graedel, 1998)

Page | 17
daily peak hours, seasonal trends, surrounding topography, etc. In addition, the analysis will evaluate
LA’s perception of PHEVs and green transportation as suggested by indicators such as the rate at which
people are buying hybrid vehicles. The study will also assess the demographics of the LA population,
particularly with respect to disposable income and the effect of PHEVs across society’s various income
segments.
1.3.4 Assumptions
The following are some of the assumptions that the above studies will be based on:
• Lithium Ion (Li-Ion) is to be used as the battery of choice for the PHEV. The literature review
determined that the Li-Ion battery exhibited the best performance, showing the best results in
terms of efficiency, capacity, weight and size when compared to the alternatives (see Section 2.2
on page 23).
• The project assumes that the average PHEV drives 80% on electricity and 20% on gasoline. This
simplification will allow for a better understanding of the LCA and of the cost incurred on the
customer by each technology.
• The study will be focused on a mid-size light duty passenger vehicle. A Honda Accord is a good
example of such a type of car.
• The technology is already feasible in terms of performance and safety. Assessment of the
technology’s risks, such as a failure modes and effects analysis (FMEA analysis), is outside the
scope of the project.
1.4 Electrical infrastructure in the Los Angeles basin
A large transition toward PHEVs will result in a proportionally large increase in electricity demand. The
main objective of the infrastructure component of the project is to determine whether this increased
demand can be feasibly supported by the electrical generation resources available to the local utility –
the Los Angeles Department of Water and Power (LADWP).
1.4.1 Available generation capacity
The project considers both the current available generation resources and potential future generation
resources. The current status of the power grid must be analyzed to serve as a basis for comparison
before researching the added energy requirements of PHEVs. We are interested in both the total
available capacity and the nature of those resources. The study investigates the LADWP’s current
electricity generation mix, determining the use of fossil fuels versus renewable energy sources. The
current existing infrastructure serves as a valuable context for scenario analysis.
In addition, our project also considers potential changes to the generation mix. In particular, the utility’s
stated goals for 2020 serve as a useful reference point. Increased wind and solar energy will result in
changes to the hourly availability of dependable capacity, which is important to consider when
performing scenario analysis.

Page | 18
1.4.2 Electricity demand
The project considers both existing demands on the electrical system and the hypothetical added
demand from PHEVs. Seasonal, daily, and hourly patterns are considered when evaluating these
demands. Based on these patterns, we can calculate what penetration levels are feasible and
theoretically possible under various supply scenarios. It is important to determine what additional
generation capacity must be added (if any) in order to support the total combined electricity demand.
1.4.3 Smart grid and vehicle-to-grid
One of the reasons PHEVs have been receiving interest is the potential for vehicle-to-grid applications in
the context of a smart grid. The concept of vehicle-to-grid (V2G) is that PHEVs can be left plugged-in
whenever they are not being driven. Whenever there is a sudden drop in supply or a spike in demand,
the grid can draw power from the car batteries. Conversely, whenever there is a spike in supply or a dip
in demand, the grid can load the excess supply into the batteries. Thus V2G can act as a form of backup
storage and load following for the grid. This can help mitigate the intermittency of resources such as
wind energy.
V2G would require a “smart grid” in which there is real-time digital communication and control between
the grid operators and the vehicle charge points. The objective of this study is to determine how such
systems can maximize renewable potential, reduce costs, and facilitate the integration of PHEV demand
into the existing electrical supply and demand picture.
1.4.4 Assumptions
The following are some of the assumptions that the above studies will be based on:
• There exists a public preference for renewable electricity over electricity generated from fossil
fuels.
• Some form of carbon economy will exist in the study region that will help incentivize
improvements that will result in reduced carbon emissions. (e.g. cap-and-trade, carbon tax, or
emissions constraints such as those found in California’s AB32 legislation)
• It is outside the scope of our project to study the political and regulatory difficulties associated
with the installation of additional transmission and distribution infrastructure. We will assume
that any necessary, financially-viable infrastructure can be constructed without issue.
• It is outside the scope of our project to assess potential sites for renewable electricity
generation. It is assumed that the targets published by the utility are physically achievable given
the wind and solar resources of the region.
• It is outside the scope of our project to propose potential sites for public charging points and
outline an implementation schedule. It is assumed that the availability of public charging will not
be a binding constraint on PHEV penetration, as it is a convenience rather than a primary source
of electricity, with the majority of recharging taking place at the owner’s home.

Page | 19
1.5 Business and transition analysis
The objective of this component of the project is to critically evaluate the business case for the PHEV and
analyze how a transition could take place. This analysis is necessary because the PHEV is competing
against an incumbent technology – the ICEV. Even if this project concludes that PHEVs are superior to
ICEVs and that the infrastructure can support them, it is important to study how the move away from
ICEVs can take place.
1.5.1 Stakeholder analysis
This analysis was performed in order to identify which stakeholders are most relevant to the possible
transition from ICEVs to PHEVs. In addition to consumers, these stakeholders include the government,
vehicle manufacturers, utility companies, and providers of financial services. The project analyzes each of
these stakeholders in order to determine how they would be impacted by the PHEV transition, how they
can stand to benefit, and how they might exert influence on the transition.
1.5.2 Government initiatives
The project performed a review of existing government initiatives that serve to support PHEVs, whether
directly or indirectly. In addition, we assessed potential new initiatives that could be introduced in order
to expedite the adoption of PHEV technology, including both financial and non-financial incentives. The
project analyzed how the federal, state and local governments could help educate the public on the
environmental benefits of PHEVs and facilitate the transition until capital costs can be reduced.
1.5.3 Marketing analysis
This analysis sought to determine how to optimize the marketability of PHEVs. The question was
analyzed from the manufacturer’s perspective under the classic 4P marketing framework (product, price,
place, and promotion). In addition, we explored potential opportunities to use PHEVs to address
challenges faced by the stakeholders, such as emissions regulations and a desire for vehicles that are
large yet fuel-efficient. The analysis also identified several non-obvious consumer benefits of the PHEV
that can be used to advertise it to the customer and make it more attractive compared to the ICEV.

Page | 20
2 LITERATURE REVIEW
2.1 PHEV Technology
A plug-in hybrid electric vehicle (PHEV) is a hybrid vehicle with rechargeable batteries that can be
connected to an external electric power to restore to full charge. A PHEV combines an electric motor, an
internal combustion engine, and a plug to connect it to the electrical grid. PHEVs have several important
advantages over the conventional vehicles. Firstly, it can reduce air pollution by eliminating greenhouse
gas emissions that contribute to global warming. Secondly is the convenience of recharging the vehicles
at home. Notable automakers in three major continents include Toyota in Japan; Volvo, Audi, and
Peugeot in Europe; and General Motors, Chrysler, and Ford in the United States. All of these companies
are currently undertaking extensive research and development to produce the next generation of
“green” vehicles. This review has been divided to recognize the three distinct markets.
2.1.1 Asia
Toyota’s Prius PHEV vehicle is based on the third-generation Prius. The vehicle is an expansion of
Toyota’s Hybrid Synergy Drive technology that comes with an external power source that allows the
lithium-ion battery to be recharged from a household electrical outlet. When it’s fully charged, Toyota’s
PHV can be in electric vehicle mode with zero greenhouse emissions for about 12.4 miles (20km) and is
capable of achieving highway speeds up to 60 mph in electric-only mode which is sufficient enough for
shorter distances or city commute, while for long-distance journeys, the vehicle has to be operated as a
full hybrid.
According to the pressroom of Toyota website, in late December 2009, a total of 350 vehicles were
delivered to Japan and Europe to support the model as well as to raise social awareness. In early 2010,
150 vehicles arrived in the U.S. where they were placed in regional clusters for market/consumer
analysis and technical demonstration. All vehicles that were released for test were equipped with data
retrieval devices which monitor activities such as how often the vehicle is charged and when, whether
the batteries are depleted or being topped off during charging, trip duration, mpg in electric mode and
so on. In October 2009, Toyota finalized its partnership with Xcel Energy’s SmartGridCity program in
Boulder, Colorado to test ten PHVs with Boulder residents whom are participants in an interdisciplinary
research project coordinated by the University of Colorado at Boulder Renewable and Sustainable
Energy Institute to better understand the vehicle by gathering data on performance and charging
patterns, consumer behavior and preferences, as well as customer-electric utility interaction2. In
February 2010, Toyota in Norway signed a partnership agreement with the City of Oslo to run a
demonstration project with two plug-in hybrid vehicles for three years starting in June 20103.
2 (Toyota Environmental, 2009) 3 (Abuelsamid, Toyota to test Prius PHEV in Oslo, Norway, 2010)

Page | 21
2.1.2 Europe
In Europe, PHEVs appear to be an immature technology. Many recent advances have taken place
concerning hybrid vehicles, but the combination of a plug-in option has yet to be established in the
market. Also, new European regulation dictates that automakers' fleets must not exceed an average
greenhouse emission of 130 g CO2/km starting in 20154; this is bound to have a large reaction from all of
the automotive companies.
The Geneva motor show in March 2010 provided the industry with many exciting announcements for
future releases. Notably, Peugeot have given details on their 2011 model, the 3008 Hybrid45. This 5-
person 2.0 litre Diesel hatchback offers 163bhp from the efficient diesel engine and an addition of 37bhp
from an all-electric motor (200bhp comb.). Overall, they are predicting a possible fuel economy as high
as 74.4mpg with 99g/km CO2 emissions. On top of this, the 3008 Hybrid4 will come with 4 possible drive
modes, including a Zero Emissions (ZE) mode where it will operate solely on the electric motor, which
offers exciting possibilities for inner-city users especially. The system layout allows for 4x4 drive
possibilities and also the electric motor can be used as a ‘boost’ option for hard acceleration times. An
energy recovery system (the electric motor becomes a generator) enables kinetic energy created by the
vehicle to be transformed into electrical energy to recharge the Nickel Metal Hybrid batteries during
deceleration. This recovery system can be used to reduce fuel consumption accordingly. On top of this, it
was announced that a Plug-In version will be released the following year, with expectedly similar
performance parameters.
Volvo is also making their impression on the PHEV market. The V70 hybrid combines the popular
features of the original ICE model with the ability of a 30 mile (50km) range on electricity alone6. It is
expected for release in 2012. No formal details have yet been released, but the company will be teaming
up with Swedish energy utility Vattenfall to create a new plug-in hybrid. They plan to use a lithium-ion
battery pack whose batteries, once depleted would charge in about five hours from a household socket.
Their vehicle will also use regenerative braking to maintain charge.
Audi’s A1 E-Tron was also unveiled at Geneva, but remains only a concept as of yet7. The A1’s lithium-ion
battery pack has a capacity of 12 kW-hours, which can provide up to 30 miles (50km) of range per
charge. This combines with a gas-engine to provide an additional 125 miles (200km) of range after the
electric charge has run out. This is relatively small as the fuel tank holds only 3.17 gallons. Overall, this
car is expected to offer a 124 mpg fuel efficiency. On Sept 9th 2010, Audi started testing its fleet of A1 E-
Tron Mega City Vehicle (MCV) in Munich8.
In the luxury market sector, Porsche has released details of the PHEV 918 Spyder9. This super car has a
top speed of nearly 199mph, and can accelerate from 0 to 62mph in just 3.2 seconds: all for a $650,000
4 (International Council on Clean Transportation) 5 (Abuelsamid, Auto Blog Green) 6 (Berman, Volvo V70 Plug-in Hybrid) 7 (Berman, Audi A1 E-Tron) 8 (Yvkoff) 9 (Porsche Approves 918 Spyder Hybrid Supercar)

Page | 22
price tag. The high-end automaker says that it has received 2,000 non-binding submissions of interest for
the 918 - more than twice the required level of interest for the board to vote on production of a new
vehicle. The Spyder will have a total of 718bhp - 218bhp coming from a pair of 160kW electric motors
and 500bhp coming from a 3.4 liter V8 engine. The electric drive train will provide about 16 miles range
from the fluid-cooled lithium ion battery. It is claimed that the car will produce just 79g/km CO2
emissions and achieve 78mpg.
2.1.3 North America
In the American automobile market, the Ford Escape PHEV uses a Series-Parallel power-train similar to
that of the Toyota Prius10. While Ford used some of Toyota's Prius’s Solomon patents11, the Escape was
designed independent of the Prius, and therefore its technical specifications are very different. Ford is in
partnership with Microsoft on new energy management software that will help customers determine
when and how to most efficiently and affordably recharge PHEVs.
The Ford Escape PHEV, a research vehicle using high voltage lithium-ion batteries can deliver up to
120mpg12 resulting in a reduced need for refill. Full charge of the battery takes six to eight hours from a
standard power outlet. On a full charge, the Ford Escape has a 30 mile13 range running solely on the
electric mode. Once the battery charge has depleted, the vehicle continues to operate as a fuel efficient,
standard Ford Escape Hybrid. The transition is automatic and unnoticeable to the driver.
Ford Motor Company is partnered with Progress Energy, a regional utility company, who is adding a Ford
Escape PHEV to its Florida operations. Ford was the first automotive manufacturer to partner with the
utility industry in a shared effort to understand all of the issues related to PHEV technology and its
interconnectivity with the electric grid. Ford started the program in mid-2007 when it formed its first
utility partnership with Southern California Edison. Ford’s utility partners have already conducted more
than 160,000 miles of road testing with a fleet of 21 Escape PHEVs14.
The Chevrolet Volt Hybrid propulsion system is based on General Motor's new Voltec (formerly known
as E-Flex) electric automobile platform, which differs significantly from GM's earlier BAS Hybrid and
Two-Mode Hybrid systems. For the first 40 miles, the Volt is powered by electrical energy, a distance
longer than the daily commute for 75% of Americans (who average 33 miles). After depletion, a small 4-
cylinder internal combustion engine (ICE) using premium-grade gasoline creates electricity on-board
using a 55 kW generator to extend the Volt's range to more than 300 miles15.
10 (Coperation, 2010) 11 (Alternative Fuel Vehicles(AFVs) and Hybrid Electric vehicle report, 2010-03-09) 12 (2005 Ford Escape Hybrid Electric Vehicle, 2005) 13 (2005 Ford Escape Hybrid Electric Vehicle, 2005) 14 (Ford delivers E85 hybrid vehicles, 2007) 15 (Stenquist, 2010)

Page | 23
2.2 PHEV Battery
This section discusses current development of li-ion battery technologies for plug-in hybrid electric
vehicle (PHEV) applications. In any PHEV architecture the battery plays a crucial role in storing energy
from the electric grid as well as passing energy back and forth with the electric motor to maximize
efficiency. Ultimately, the commercial success of the PHEV depends on the development of appropriate
battery technology due to its expensive price.
2.2.1 Battery R&D
AFS Trinity, an American company that develops PHEV technology, has recently invented a more efficient
battery. By combining Lithium-ion battery, which has high storage but low power, and ultra capacitors,
which have low storage and high power, the overall battery system has a longer life, higher energy
density and it also weighs less. This is due to the fact that energy output fluctuation will be more
controlled by such combination and less lithium will be required. These batteries will be equivalent to
current batteries with a higher energy capacity. GM will apply the technology for its future SUV PHEV
fleets. One issue with this product on the market is that since its required energy capacity is lower, it
receives less tax credit from the government16.
Electrovaya, developer and manufacturer of portable power solutions based in Ontario, has signed a
Memorandum of Understanding (MOU) to form a joint venture with Visionary Vehicles, a PHEV
developer and manufacturer in New York. The joint venture will result in a creation of a separate
company, owned equally by both firms, that focuses on battery research and development. Electrovaya
is known for its SuperPolymer technology, which provides longer battery life span. Visionary Vehicles, on
the other hand, develops vehicles that are targeted to luxury consumers and its products are comparable
to German and Japanese luxury car models17.
BYD, a Chinese manufacturer, still remains the largest battery producer in the world. Based in Shenzhen,
the company has built an additional factory worth $732 Million in Huizhou in the Guangdong province.
This expansion is supported by Berkshire Hathaway, through which Warren Buffet invested $230 Million.
BYD, also a successful PHEV manufacturer, claimed its proprietary battery technology called “lithium-ion
ferrous phosphate” although the ability to apply this new technology at full scale while maintaining low
cost is still questionable18.
Argonne National Laboratory, one of the US science and engineering research national laboratories, had
its lithium-ion battery commercialized by BASF. Argonne signed a licensing agreement that allows its
patented composite cathode materials to be used by BASF, which planned to manufacture advanced
lithium-ion batteries. Consequently, the company also planned to build a manufacturing plant in Elyria,
16 (AFS trinity) 17 (Abuelsamid, Auto Blog Green) 18 (BYD)

Page | 24
Ohio, to start the battery mass production.19 The technology results in high performing, longer lasting
and safer than current battery products for EVs, HEVs and PHEVs20.
Ford is currently working with academia and battery suppliers to improve the efficiency of lithium-ion
batteries. It found that lithium-ion batteries are 5% more energy efficient than the nickel-metal hydride
and they are also 30% less expensive. It also announced that all of its green vehicle models would use
lithium-ion instead of nickel-metal hydride. Ford estimated that its battery system technology could
support PHEV fleets by 2012. One of the challenges in this development stage is safety issue related to
extreme hot or cold temperature, which has been an issue for li-ion batteries used in laptops and other
consumer electronics. To accelerate Ford’s research, Michigan Economic Development Corporation
granted a $55 Million tax credit to the company. Moreover, Ford established partnerships with eight
regional electrical utility companies to test their battery-powered Ford Escape21.
Other companies who are developing more effective and cheaper li-ion batteries are the following: A123
Systems, Johnson Controls – Saft Advanced Power Solutions, China BAK Battery, Lishen, Wanxiang,
Shuzhou, Phylion, and Exponent. 22They were present at the Vehicle Battery Summit in Shanghai in
September 2010 along with major automakers (e.g. Toyota, Ford, Chrysler) to discuss the current
development of battery technologies and how it would impact the penetration of green-vehicles in the
market23.
A Massachusetts company named A123 Systems uses a technology initially developed at MIT called low
impedance Nanophosphate electrode, which is used to produce low cost/watt batteries due to their
higher voltage compared other long-life battery systems. This year, the company developed battery
packs for Shanghai Automotive Industry Corporations, the largest automaker in China. 24In addition, the
company also signed a supply contract with Fisker Automotive for battery systems of Fisker Karma
model25.
Smaller companies and academic institutions also contribute in li-ion battery development. For example,
ActaCell, a spin-off company from University of Texas, Austin, has received funding from the Texas
Emerging Technology Fund for their research in li-ion batteries. Supported by the university’s Material
Science and Engineering Laboratory, the company created a manganese spinel formulation that might
solve decreasing capacity over time problem26.
19 (Argonne National Laboratory) 20 (Argonne National Laboratory) 21 (Red Orbit) 22 (PR Newswire) 23 (SAE International) 24 (A123 Systems) 25 (A123 Systems) 26 (Green Car Congress)

Page | 25
2.2.2 Li-ion Battery Recycle
Recycling batteries create an extra hassle to consumers because there are regulations to treat each type
of battery. For example, car owners have to dispose lead acid batteries at designated places such as
Autozone or Sears, and would otherwise be penalized by the government27. Presently, Toxco, based in
California, is still the only company in the world that can recycle large size of lithium batteries, which
include Li-Ion PHEV batteries28. Due to this reason, Toxco is awarded 9.5 Million by the Department of
Energy to increase their operation capacity to meet the growing demand of EV, HEV and PHEV in the
United States. Using the fund, Toxco built an exclusive lithium battery recycling facility in Lancaster,
Ohio29.
2.3 PHEV Infrastructure
2.3.1 Charging Station Infrastructure
Even though it is possible to charge a PHEV from a standard electricity outlet, they can also be charged at
higher voltages and higher currents for faster charging. Society of Automotive Engineers (SAE)
categorizes these fast-charging opportunities as Level 1, Level 2 and Level 330. Level 1 charging is
essentially the standard 110 volt power supply. Level 2 recharging point charges the vehicle with a
voltage 240 V alternative current and it can be installed in homes. Level 3 charging points supply
electricity with 500 Volts direct current. Mostly because of the safety issues, Level 3 charging is not used
as a domestic charging opportunity. Additionally, battery swapping is also another alternative charging
opportunity, which is offered and has been fully tested by Better Place - a global provider for EV
networks.
Charging time and power supply demand are two main concerns in vehicle recharging. It requires several
hours for a level 2 charging station providing 3.3kW of power to charge an electric vehicle. This method
is the most preferable charging manner as it can be carried out while the car is at home or work. On the
other hand, level 3 charging stations reduce the charging time remarkably and allow refueling at any
stage of a journey. The Nissan Leaf can be charged in only 30 minutes31 by a level 3 station providing 500
Volts and 125 Amperes of DC current. This would take 7 hours32 in a level 2 charging station. However,
fast charging requires larger sized electrical power services.
In Battery swapping business model of the better place, discharged batteries can be exchanged at ‘swap
points’ for charged batteries. In this system the battery pack is owned by the network operator company
rather than the customer. With a three month field test in Tokyo, Better Place showed that their
27 (Health and Safety Online Environment) 28 (Toxco Inc) 29 (Toxco Inc) 30 (Tennessee Valley Authority) 31 (Nissan) 32 (Nissan)

Page | 26
technology works as promised. During the test the battery powered Nissan Rogue crossovers were used
as taxis, and made over 25,000 miles having their batteries swapped a total of 2,122 times33.
2.3.2 Smart Grid Infrastructure
Unmanaged PHEV charging could mean a significant increase in demand on the existing electrical
infrastructure. Utilities have designed their systems to accommodate such impacts only up to a point
before system upgrades and new investments are required. Utility generation, transmission and
distribution systems are designed to meet the highest expected peak demand, which in most cases
occurs for less than a few hundred hours a year. The rest of the time, in off peak time, up to a third or
more of the power plants are idle, ready to respond to part-time duty, or shut down altogether if there is
no scheduled requirement.
Based on research conducted by Pacific Northwest National Laboratories, this idle capacity in the U.S.
grid could supply the equivalent energy needs of over 70% of the cars, trucks and SUVs that are on U.S.
roads today. That equals approximately 175 million PHEVs. However, achieving this requires the charging
of PHEVs to be managed in a centralized fashion to ensure that charging takes place during off-peak
periods. By making use of Smart Grid principles the additional demand that PHEVs will imply on the grid
system can be provided for without making major investments in additional electricity generation,
transmission or communication systems34.
Smart grid applications improve the ability of electricity producers and consumers to communicate with
one another and make decisions about how and when to produce and consume electricity. One
advantage of a smart grid application is time-based pricing. Customers who traditionally paid a fixed rate
per kWh each month will be able to set their threshold and adjust their usage to take advantage of
fluctuating prices and even sell electricity from their PHEV battery of they feel the price is right and they
won’t be using their battery capacity before being able to recharge again35.
Large numbers of PHEVs connected to such a Smart Grid then create a “distributed storage” resource
that can be used to absorb excess energy that routinely occurs in utility systems. Such excess energy, for
example, occurs moment to moment as the system operators attempt to match generation supply with
demand and keep the system in balance. Perhaps more significant is the “excess energy” associated with
renewable energy. Renewable energy is inherently variable and in many places is mostly available at
times when energy is least in demand (i.e., off-peak; midday, as with solar and mostly wind as well).
Without energy storage, the ability of electricity systems to absorb increasing amounts of intermittent
renewable energy is significantly impacted. A recent study indicated that without energy storage,
achieving 50% renewable portfolio standards in California would result in over 3,000 GWh of energy
“dumped” annually – energy that could otherwise charge the equivalent of 1 million vehicles for that
year36.
33 (Motavalli, 2010) 34 (Kevin Morrow, 2008) 35 (Chris Farmer, 2009) 36 (Jim Lazar, 2008)

Page | 27
PHEV Smart Grid software similar to the EV Smart Grid Software developed for the Better Place Project
will be able to monitor all the batteries in the network, aggregating data on each battery's state of
charge and anticipated energy demand. Smart Grid network software can then communicate this data to
utility partners in real-time, allowing them to optimize the allocation of energy based on available supply
and PHEV drivers' demand. In this way utilities can ensure that PHEVs serve as a distributed storage
mechanism, absorbing under-utilized, off-peak electricity, while at the same time meeting driver
expectations in terms of charging time and pricing37.
The technology already exists to allow customers to feed excess power from their own electricity supply
systems back onto the grid by digital net / bi-directional metering systems. This PHEV-to-grid supply will
reduce the amount of spinning reserve or backup capacity that electric utilities have to keep on stand-by
further firm up the grid system.
2.3.3 Energy Sources
2.3.3.1 Wind Energy
Capacity factor (as % of installed capacity) is a measure of the actual energy produced by a generator as
a percentage of that which would be achieved if the generator were to operate at maximum output for
100% of the time. Capacity factor for baseload thermal generators can be above 85%. As the electricity
production from wind turbines depend on the intermittent wind resource, wind energy plants achieve
capacity factors of 25% - 45%.
Capacity credit (as % of installed capacity) is a measure of the amount of load that can be served on an
electricity system by an intermittent plant with no increase in the loss-of-load probability (LOLP), which
is often expressed in terms of conventional thermal capacity that an intermittent generator can replace.
The LOLP is in other words a measure of reliability/dependability of an energy resource. In simple terms
there must be minimal probability that a period of high demand coincides with the failure/unavailability
of conventional energy source or low output from intermittent resources. Since the risk of low output
from a wind farm during high demand periods is often higher than for conventional generators it is
necessary to hold more “backup” capacity on the system in order to maintain LOLP
(reliability/dependability). This reduces the capacity credit which could be given to an intermittent
renewable energy source38. For example; a 10% capacity credit means that by adding a 100 MW wind
installation allows you to remove 10 MW of “on demand” generation capacity without compromising
grid reliability.
Because the variance in supply from a wind resource at peak demand is larger than for conventional
stations, the capacity credit of intermittent sources tends to be significantly lower than their installed
capacity. This is due to the fact that the capacity credit will always be less than the capacity factor, as you
cannot give a resource a higher capacity credit than for the amount of electricity it actually produces
(capacity factor).
37 (Better Place) 38 (UK Energy Research Centre, 2006)

Page | 28
The California Public Utilities Commission (CPUC) calculates the monthly net qualifying capacity credit of
wind by determining the three-year average of monthly hourly production between noon and 6:00 p.m.
on weekdays. This calculation is method was based on a 10% penetration of wind as percentage of total
produced energy39.
The capacity credit data of 19 studies conducted by the UKERC, 2006 in Europe are summarized in the
graph below. Their findings concluded that wind energy does have a capacity credit value greater than
zero, and also clearly shows that the capacity credit, expressed as a percentage of installed wind
capacity, declines as the penetration of wind energy increases. Penetration is stated as a percentage of
total produced electricity per resource for the total grid supply40.
Figure 2 - Capacity Credit Values (Source: UK Energy Research Centre, 2006)
2.3.4 Stakeholders
2.3.4.1 Government
For decades, national and regional governments have recognized the benefits of PHEVs and Plug-In
Electric Vehicles (PEVs). There has been interest from as early as 1990 to further their introduction into
the market in order to reduce dependence on petroleum, improve urban air quality, and reduce overall
greenhouse gas emissions. Various initiatives have been introduced in the US and abroad that directly or
indirectly support their research, development, and deployment. The strength of these initiatives vary
39 (Laboratory, 2008) 40 (UK Energy Research Centre, 2006)

Page | 29
widely from region to region and change over time in response to public interest, industry pressures, and
the balance of political power.
This review is not an exhaustive summary of the history and nature of government attitudes and
activities relating to PHEVs and PEVs. Rather, it seeks to organize and group the various forms that
government support has taken. A few examples have been selected to illustrate these various forms of
support, chosen from a vast body of relevant literature. Examples are drawn primarily from the US
Federal government, though some have been drawn from other countries or from state-level initiatives.
Below is a categorization of government support for PHEVs:
Specific support:
1) Mandates or goals stating that PHEVs must reach a certain number or fleet percentage by
specified time targets.
2) Per-car monetary incentives for end-consumers who purchase PHEV technology.
3) Per-car monetary incentives for manufactures who produce and sell PHEV technology.
4) Funding for the research and development of PHEV technology.
General support:
1) Funding for the manufacture of PHEV components.
2) Funding for transportation electrification.
3) Funding for “advanced vehicle” development.
4) Mandates to reduce petroleum use.
Examples of government activities that specifically support PHEV technology
1) Mandates or goals stating that PHEVs must reach a certain number or fleet percentage by
specified time targets.
One of the earliest initiatives was the “Zero-Emission Vehicle Mandate” (ZEV Mandate) created
in 1990 by the California Air Resources Board (CARB) as part of Low-Emission Vehicle (LEV)
Regulations. It required increasing the percentage of ZEVs to 2% of new car sales by 1998 and
10% by 2003. This was effectively a mandate to produce electric cars, which were then the only
viable vehicle technology with zero tailpipe emissions. This mandate was eventually repealed
under pressure from car manufacturers, the petroleum industry, and shifting interest to
hydrogen fuel cells41.
More recently, on March 19, 2009, Barack Obama articulated his “New Energy for America” plan,
which includes a goal stating that 1 million PHEVs be on the road by 201542.
2) Per-car monetary incentives for end-consumers who purchase PHEV technology.
41 (Korthof) 42 (Obama for America)

Page | 30
Such incentives do not appear to exist in the US at the moment. However, numerous
governments in other countries offer these incentives to their citizens in various forms.
In 1996, Japan introduced its first incentive program for electric vehicles, which was integrated
with the Clean Energy Vehicles Introduction Project in 1998. The project subsidized up to 50% of
the incremental costs of a clean energy vehicle (electric, hybrid electric, natural gas, or
methanol) as compared with the price of a conventional ICEV. The program was extended until
200343.
In Canada, Ontario established a rebate for new plug-in electric vehicles purchased or leased
after July 1, 2010, available to the first 10,000 applicants that qualify. The rebate ranges from
CAD 5,000 to CAD 8,500 depending on battery size (~ US $4,956 - $8,425)44.
3) Per-car monetary incentives for manufactures who produce and sell PHEV technology.
On October 3, 2008, the US “Energy Improvement and Extension Act of 2008” was signed into
law. One of its features grants tax breaks of $2,500 to $7,500 per car for manufacturers of up to
250,000 plug-in hybrid vehicles45.
In 2009, the “American Recovery and Reinvestment Act of 2009” modified the tax credits. It
included a new credit for plug-in electric drive conversion kits and for 2- and 3-wheel vehicles46.
Many other countries offer similar incentives to companies. On June 1, 2010, the Chinese
government announced a trial program that would provide incentives of up to 50,000 yuan (~US
$7,507) for new PHEVs in five cities. The subsidy would be reduced after 50,000 units are sold47.
4) Funding for the research and development of PHEV technology.
Barack Obama's “New Energy for America” plan (announced March 19, 2009) included programs
that would direct $2.4 billion toward electric vehicle development48.
Meanwhile, the “FreedomCAR” program of the USDOE announced that it would give $30 million
to three companies over three years to further develop electric vehicles. (Longley, 2008) The
USDOE also announced the selection of Navistar Corporation for a cost-shared award of up to
$10 million to develop and deploy PHEV school buses49.
Examples of government activities that generally benefit PHEV technology
5) Funding for the manufacture of PHEV components.
43 (Incentives for EV & HEV, 2003) 44 (Queen's Printer for Ontario) 45 (IRS, 2009) 46 (IRS, 2009) 47 (Motavalli, 2010) 48 (Obama for America) 49 (EERE Network News, 2009)

Page | 31
The “American Recovery and Reinvestment Act of 2009” includes two competitive solicitations
for up to $2 billion in federal funding for cost-shared agreements to manufacture advanced
batteries and other drive components50.
6) Funding for transportation electrification.
The “American Recovery and Reinvestment Act of 2009” also includes up to $400 million for
demonstration and deployment projects of transportation electrification, which includes PHEVs
in addition to PEVs, electric rails systems, etc51.
7) Funding for “advanced vehicle” development.
The US House of Representatives has passed house bill H.R.3246 – the Advanced Vehicle
Technology Act of 2009. This bill has not yet been passed by the Senate or signed into law, but it
includes $2.85 billion for “advanced vehicle” development, 39% of which would go toward
retrofitting medium- and heavy-duty commercial vehicles for advanced vehicle technologies
(including PHEVs)52.
8) Mandates to reduce petroleum use.
On October 5, 2009, Barack Obama signed Executive Order 13514 on “Federal Leadership in
Environmental, Energy, and Economic Performance.” It would require a 30% reduction in
petroleum use by 2020 among the 600,000-vehicle federal fleet. Agencies with 20 or more
vehicles would be required to reduce petroleum 2% annually through 202053.
2.3.4.2 Consumer
According to a new survey conducted by Pike Research, plug-in hybrid electric vehicles are one of the
most highly anticipated new product categories. Approximately 48% of prospective consumers in the
U.S. would be either “extremely” or “very” interested in purchasing a PHEV. The survey results indicated
that the needs of the vast majority of drivers would be met by the PHEV, since 82% of those surveyed
drove 40 miles or less on a given day with an average of 27 miles54.
Research revealed several other factors that were noted as being important for consumers choosing
their next vehicle. Improved fuel efficiency was one of the main criteria according to 85% of consumers.
A total of 65% of survey respondents indicated a willingness to pay a premium over and above the price
of standard gasoline car, with an average premium of 12%. This last statistic is particularly relevant,
considering the early stages of the PHEV technology and, as a result, the relatively high prices compared
50 (U.S. Department of Health and Human Services, 2009) 51 (U.S. Department of Health and Human Services, 2009) 52 (California Cars Initiative, 2009) 53 (California Cars Initiative, 2009) 54 (Pike Research, 2009)

Page | 32
to gasoline cars. It is expected that in the future, once PHEVs become more popular and the demand for
them increases, the cost will drop.55
One of the primary issues with the commercialization of PHEVs is the charging infrastructure that is
needed. A massive effort would need to be set forth to make charging stations available in public urban
areas, workplaces and homes. Many prospective consumers will not consider purchasing a PHEV unless
the appropriate infrastructure has been put in place that makes driving the vehicle convenient56.
Some critics also believe that, in some cases, PHEVs may not result in lower CO2 emissions than a
standard gasoline car. The source of the electricity used to charge the vehicle is in question. In locations
where the local power grid is relatively clean, such as California, the CO2 emissions would certainly be
reduced. However, in states that used coal-fired grids, such as North Dakota and Wyoming, the PHEV
may emit more CO2 per mile than the conventional gasoline car57. There is not a consensus on this issue,
and other sources claim that is the PHEV battery is charged entirely on electricity from coal-fired plants,
there is still a net reduction in CO2 emissions of at least 50%58.
Overall, it appears that many prospective consumers in the US would be willing to purchase a plug-in
hybrid electric vehicle, provided that the necessary infrastructure was put in the place even though the
PHEV may be initially more expensive than the standard gasoline car.
2.3.4.3 Other Stakeholders
Besides consumers and governments, there is a sizeable list of “other” stakeholders involved with PHEVs.
While often times they may be considered an afterthought in the discussion, there are a few particular
industries that have much to gain (or lose) with an increase in PHEV production.
Power utility companies are one of the primary benefactors from an increase in PHEVs. With multiple
PHEVs scheduled to launch in the upcoming year, coal power will still dominate current electricity
generation. However, the extra demand will pave the way for other power technologies, perhaps the
continued development of nuclear power or the expanded use of renewable resources like solar and
wind. As it stands currently, a report by the Department of Energy's Pacific Northwest National Lab
(PNL) estimates that if the national power grid were optimally utilized at all hours of the day, it could
provide enough power for plug-in hybrids to comprise up to 73 percent of the nation's cars59. However,
the same study also mentions that while certain parts of the country could handle this burden, other
areas such as California and Nevada would have to build more power plants to accommodate the
additional load. This increased use of the nation’s power supply would mean profitable gains for the
power utility companies.
Electronic manufacturing is another industry that stands to make a substantial profit with an increase in
PHEVs. The increase in computerized electronics in a PHEV will have a ripple down effect to various
55 (Pike Research, 2009) 56 (Taylor & Van Doren, 2010) 57 (Hybrid Cars, 2009) 58 (County of Sonoma Green Transportation Alternatives, 2010) 59 (Gartner, 2007)

Page | 33
manufacturers. While it may be more obvious to mention the companies that produce the larger parts
of the car, the ripple effect will mean switch, circuit, and chip vendors will show increased profits as well.
In fact, even at relatively modest production volumes, the additional $500 - $1,500 worth of electronics
used by each of these vehicles would constitute an additional $25 - $150 million opportunity for
automotive electronics vendors60. Unfortunately however, the corollary remains that the vendors who
supply parts to traditional ICE vehicles may lose their market share if they do not modify their product
line. In this way, the potential benefit- drawback analysis will be based primarily on the volume of PHEVs
produced.
Finally, an interesting theory of some of the other stakeholders involved with PHEVs includes an almost
infinite list of “to be announced” names. This list will begin to be filled as the various research and
development programs take shape. In 2008, the British automaker Lotus created a new research and
development group solely devoted to electric and hybrid vehicles. This has led to the creation of lighter
weight materials and improved aerodynamics61. In this way, there will be countless stakeholders that
will come as a result of the various findings from research and development teams.
There are many stakeholders with something to gain with an increase in production of PHEVs. Power
utility companies, electronic manufactures and the vast list of “to be announced” names all stand eagerly
awaiting the development of PHEVs.
60 (Goldberg) 61 (Lotus Creates Hybrid R&D Center, 2008)

Page | 34
3 PHEV TECHNOLOGY
The plug-in hybrid vehicle can be thought of as a combination of an internal combustion engine vehicle
and an electric motor vehicle. The vehicle includes two propulsion systems, an IC engine powered by
gasoline that’s stored in the fuel tank and an electric motor powered by electricity that is stored in the
battery. The battery can be recharged by plugging it to an electricity source.
The battery plays a crucial role in storing energy from the electric grid as well as passing energy back and
forth with the electric motor to maximize efficiency. The state of charge of the battery is one of the
factors that determines which propulsion system is used.
Figure 3 - The PHEV Propulsion Systems
3.1 Two Cycles of the Battery
PHEV operates in either one of these modes: Charge Depleting (CD) or Charge Sustaining (CS)62.
Initially, once the battery is fully charged, the vehicle will run in CD mode, which gradually depletes the
battery’s state of charge. In this mode, gasoline can either be used or not. After reaching a certain charge
62 (Axsen, Burke, & Kurani, 2008)

Page | 35
level, the vehicle runs in CS mode and the battery’s state of charge is sustained by using gasoline. In CD
mode, the battery state of charge will slightly oscillate due to receiving energy from the regenerative
battery and using energy to improve engine efficiency. The vehicle remains in this mode until the battery
is recharged from an off-board source, while the vehicle is at rest
Figure 4 - Illustration of Typical PHEV Discharge Cycle(Axsen & Kurani, 2008)
3.2 Performance Criteria
According to the US Advanced Battery Consortium (USABC), battery performance criteria or “goals”
consists of power, energy capacity, life, safety, and cost.
Power is the rate of energy transfer, measured in kilowatts (kW). Specifically, it is the rate at which
mechanical energy can be transferred from the engine to the tires via the drivetrain, which is especially
significant for acceleration. While for ICEV the speed of gasoline transfer is not the only factor for
acceleration rate, it is particularly critical for PHEV63.
Energy capacity is related to the maximum energy storage capacity (in kWh) and the energy density
(Wh/kg). This translates to how far the PHEV can travel in the Charge Depleting mode. Maximum energy
storage capacity is not the only factor to determine the distance travel capability. Depth of discharge
(DOD) determines how much of that energy (in percent) can actually be used in the Charge Depleting
mode. For example, a 100 kWh energy capacity with a 50% DOD means that we can only deplete the
energy up to 50 kWh before the system will change to a Charge Sustaining mode64.
For battery life, the most common metrics to measure the performance is calendar life, which is the
time it takes to degrade the battery independent to the usage frequency. USABC aims 15 years at a
temperature of 35 degrees Celsius as an ideal battery life. Another measure is called deep cycle life,
which is the total number of charge cycles in CD mode. USABC aims for 5,000 deep cycles. There are
many other criteria such as shallow cycles, which calculate electric regeneration using gasoline and
63 (Axsen, Burke, & Kurani, 2008) 64 (Axsen, Burke, & Kurani, 2008)

Page | 36
brakes, and survival temperature range, which is the range of temperatures a battery can be subjected
to while not in operation65.
Battery safety is an important factor. Batteries contain energy and chemicals, which can harm people
and damage the vehicle if they behave in an uncontrollable manner. Overall, battery safety depends on
battery chemistry, design, and manufacturing quality control66.
Battery cost is very critical to PHEV market expansion. USABC estimates a cost of $3,400 (not including
mark-ups) for an Li-Ion battery with 17 kWh capacity which translates to $200/kWh. Such a battery
would allow the PHEVs to travel up to 40 miles in the CD mode. Another performance metric for cost is
called dollars per total kWh, which is aimed to be $800/kWh to $1,000/kWh67.
3.3 Types of Batteries
Lead-Acid Batteries: The safe and affordable lead-acid batteries have low energy storage capacity. They
have been used for decades as the starter batteries of conventional automobiles so their performance is
already proven. The lead-acid batteries don’t store as much energy as alternative batteries, so larger,
heavier packs must be used to supply enough energy. The lead-acid battery in today’s Prius based PHEVs
allow around 8 to 12 miles in all-electric mode driving at low speeds68.
Lithium Ion Batteries: The expensive Li-ion battery has high energy storage capacity. It is not a proven
technology and its safety and performance are questioned when it comes to using it in a PHEV. The high
energy storage allows a PHEV Prius to drive as much as 30-40 miles in all-electric mode69.
Nickel Metal Hydride Batteries: The NIMH battery has moderate energy storage capacity. Their safety
and performance has been proven in current Hybrids. Since these batteries store less energy than Li-ion
batteries, they aren’t being considered for use in PHEVs70.
Table 1 - Battery Module Specifications (Tara, Shahidineja, Filizadeh, & Bibeau, 2010)Table 1 summarizes
the characteristics of each of the 3 battery types.
65 (Axsen, Burke, & Kurani, 2008) 66 (Axsen, Burke, & Kurani, 2008) 67 (Axsen, Burke, & Kurani, 2008) 68 (Plug-in Hybrid Batteries: Type Matters, 2007) 69 (Plug-in Hybrid Batteries: Type Matters, 2007) 70 (Plug-in Hybrid Batteries: Type Matters, 2007)

Page | 37
Table 1 - Battery Module Specifications (Tara, Shahidineja, Filizadeh, & Bibeau, 2010)
The table below summarizes the advantages and disadvantages of each of the 3 batteries:
Table 2 - Qualitative Comparison of batteries(Pesaran, 2006)
From the above analysis, we can conclude that the Li-Ion battery is the better choice to be used in
PHEVs. Assuming all car manufacturers precede with Li-ion for all of their PHEVs, its cost, safety and
maturity can all be eventually improved.

Page | 38
4 LIFE CYCLE ASSESSMENT
For a transition from an ICEV market to a PHEV market to be beneficial, it is important to determine first
if the PHEV is better than the ICEV in minimizing the negative impacts on the environment and society
over the entire life cycle. This is done by performing a life cycle assessment (LCA) for both alternatives
and their respective sources of energy. The life cycle of the vehicle is cut down to five distinct stages.
Each stage is governed by environmental stressors. These can be classified as inputs and outputs as
follows:
Inputs Life Stage Outputs
Materials Choice
Energy Use
�
�
Premanufacture
Manufacture
Delivery
Use
Disposal
�
�
�
Gaseous Residues
Liquid Residues
Solid Residues
Each life stage will be evaluated for each of the 5 environmental stressors creating a 5x5 matrix71. In
order to perform the study, the team chose T.E. Graedel’s Streamlined LCA (SLCA) model. The SLCA is a
semi-quantitative LCA method. Each stage is given five scores, one for each environmental stressor. The
scoring is based on a formalized scoring system published by Graedel.
The SLCA is widely used in the marketplace to evaluate how environmentally responsible products and
processes are. The SLCA is a rapid but still rigorous alternative to the traditional expensive and time
consuming LCAs. One is able to identify 80% of the issues in a fraction of the time using the SLCA72.
Since the main purpose of this study is to compare the ICEV to the PHEV, it can be deemed reasonable to
use a semi-quantitative LCA rather than a quantitative one. The scoring of each alternative is done
comparatively and thus the final result is sufficient enough to determine which vehicle is more
environmentally responsible.
Rather than discussing each alternative separately, the team chose to compare them for each life stage
of the LCA while also studying their respective sources of energy. Each section will start with a table
portraying the scores awarded to the different alternatives over the specific life stage.
71 (Graedel, 1998) 72 (Benmar, 2010)

Page | 39
The analysis will focus on the differences between the two vehicles and not on the vehicles as a whole. In
other words, no research will be done on the vehicle’s chassis since it is the same for both cases. The
main components of the research are the IC engine, the electric motor and the Li-Ion battery.
4.1 Premanufacture
When doing the research on the premanufacture stage, the team focused on the resources extracted,
the processes of extraction and the transport of the resources.
Materials
Choice
Energy
Use
Solid
Residues
Liquid
Residues
Gaseous
Residues
Total
Vehicle ICEV 3 2 2 3 2 12
PHEV 1 1 1 2 2 7
Energy
Source
Gasoline 1 0 1 2 1 5
Electricity 3 2 2 3 2 12
Table 3 - Premanufacture SLCA Scoring
Materials Choice
The ICEV scored higher than the PHEV due to the use of lithium and cobalt in the Li-Ion battery. Both
lithium and cobalt are scarce materials but they are both recoverable. Since there are other alternatives
for batteries that don’t use scarce materials, the PHEV was awarded a lower score for materials choice73.
The bulk of LA’s electricity generation comes from coal and natural gas. Both these natural resources are
more abundant than petroleum from which gasoline is produced. Also the supply of coal and natural gas
in the US is more stable74. For these reasons gasoline was awarded a lower score in material choice over
electricity.
Energy Use
The ICEV scores a bit higher than the PHEV because more energy is put into extracting the Lithium and
the cobalt. The remaining resources used to manufacture either vehicle are common to both.
The energy used to extract petroleum is significantly higher than that used to extract natural gas and
coal75.
Residues
The residues generated from the premanufacture stage of the ICEV get higher scores than those of the
PHEV because the PHEV involves the extraction of more materials. Also, lithium and cobalt reserves are
located in areas that will require additional transport and thus generate additional residues76.
73 (Jungst, 1999) 74 (Fossil Fuels - Coal, Oil and Natural Gas) 75 (Graedel, 1998)
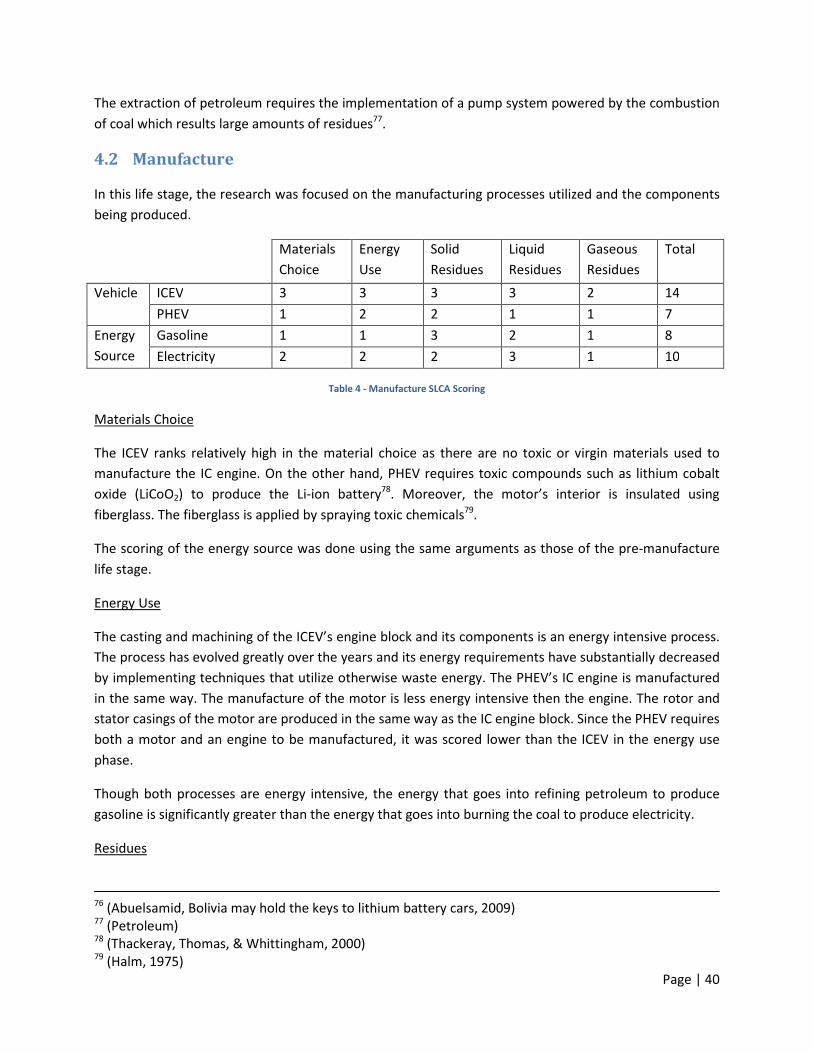
Page | 40
The extraction of petroleum requires the implementation of a pump system powered by the combustion
of coal which results large amounts of residues77.
4.2 Manufacture
In this life stage, the research was focused on the manufacturing processes utilized and the components
being produced.
Materials
Choice
Energy
Use
Solid
Residues
Liquid
Residues
Gaseous
Residues
Total
Vehicle ICEV 3 3 3 3 2 14
PHEV 1 2 2 1 1 7
Energy
Source
Gasoline 1 1 3 2 1 8
Electricity 2 2 2 3 1 10
Table 4 - Manufacture SLCA Scoring
Materials Choice
The ICEV ranks relatively high in the material choice as there are no toxic or virgin materials used to
manufacture the IC engine. On the other hand, PHEV requires toxic compounds such as lithium cobalt
oxide (LiCoO2) to produce the Li-ion battery78. Moreover, the motor’s interior is insulated using
fiberglass. The fiberglass is applied by spraying toxic chemicals79.
The scoring of the energy source was done using the same arguments as those of the pre-manufacture
life stage.
Energy Use
The casting and machining of the ICEV’s engine block and its components is an energy intensive process.
The process has evolved greatly over the years and its energy requirements have substantially decreased
by implementing techniques that utilize otherwise waste energy. The PHEV’s IC engine is manufactured
in the same way. The manufacture of the motor is less energy intensive then the engine. The rotor and
stator casings of the motor are produced in the same way as the IC engine block. Since the PHEV requires
both a motor and an engine to be manufactured, it was scored lower than the ICEV in the energy use
phase.
Though both processes are energy intensive, the energy that goes into refining petroleum to produce
gasoline is significantly greater than the energy that goes into burning the coal to produce electricity.
Residues
76 (Abuelsamid, Bolivia may hold the keys to lithium battery cars, 2009) 77 (Petroleum) 78 (Thackeray, Thomas, & Whittingham, 2000) 79 (Halm, 1975)

Page | 41
Through the years, IC engine manufacturers have found ways to cut down scrap production in the
manufacturing of the engine. On the other hand, the manufacturing process of the motor generates
large amounts of harmful residues. The spraying of the toxic compound to apply the fiberglass insulation
to the interior of the motor produces both liquid and gaseous residues. Moreover, once assembled, the
motor is coated with polyester varnish which is another source of liquid residue. Solid and gaseous
residues are produced by hardening the varnish in large ovens80. Also the manufacturing of the Li-Ion
battery involves toxic compounds such as lithium cobalt oxide (LiNiCoO2).
The generation of electricity by burning coal produces significant quantities of waste by-products such as
ash and sludge. Refining petroleum on the other hand creates by-products that can be converted into
higher value products81.
4.3 Delivery
In this life stage, the research was focused on the methods used to deliver the products to the customer
and on the packaging involved.
Materials
Choice
Energy
Use
Solid
Residues
Liquid
Residues
Gaseous
Residues
Total
Vehicle ICEV 3 2 3 3 2 13
PHEV 3 2 3 3 2 13
Energy
Source
Gasoline 4 2 3 3 2 14
Electricity 4 2 4 4 4 18
Table 5 - Delivery SLCA Scoring
The rank for both ICEV and PHEV for all environmental stressors is the same because the same delivery
process is used for both vehicles. The same transportation system, such as trains and trucks, is applied to
deliver both vehicles. Potential liquid residue could result from cleaning supplies, such as detergents and
waxes. The low gaseous residue score comes from the use of trucks to deliver the vehicles, leading to
increased emissions.
Materials Choice
Since no packaging is used for the delivery of either gasoline or electricity, both alternatives score 4.
Energy Use
The gasoline is delivered using truck and rail transportation. These account for a high energy use over
long distances. Electricity is transported through power lines and there is no direct energy input in the
process. However, there are losses of electricity due to the resistance of the power lines over long
80 (Halm, 1975) 81 (Petroleum Refining, 2006)

Page | 42
distances. The losses can be up to 30% and must be compensated for by producing more to meet the
demand82.
Residues
Transporting electricity in power lines doesn’t generate any major residues. On the other hand,
transporting the gasoline to the gas station by trucks contributes heavily to the greenhouse gas
emissions and thus scores lower than electricity.
4.4 Use
In this life stage, the research was focused on what goes into operating and maintaining the vehicle while
taking into consideration their respective efficiencies. The use stage of the SLCA was done for both the
vehicle and the energy source simultaneously. It is not reasonable to study them separately since the
vehicle cannot be used without using up the energy source
Materials
Choice
Energy
Use
Solid
Residues
Liquid
Residues
Gaseous
Residues
Total
Vehicle ICEV 1 1 2 2 1 7
PHEV 3 3 3 3 3 15
Table 6 - Use SLCA Scoring
Materials Choice
The ICEV has a rank of 1 because it exclusively uses gasoline which is not renewable. Fuel contains
various chemical components that are hazardous to the environment and dangerous to human health.
The potential spill of fuel could result in contamination of the environment. The PHEV has a rank of 3
because it uses a combination of gasoline and electricity. Since the PHEV uses less gasoline, the potential
contamination to the environment is reduced.
Energy Use
The ICEV uses the IC engine as its source of torque. As the gasoline SI engine is used over its lifetime, its
efficiency decreases. Energy-conservative design features have been implemented; however they still
have not been able to significantly increase the efficiency to more than 20%83.Since the PHEV uses both
the IC engine and the electric motor as the sources of torque, the overall efficiency of the vehicle is
improved and the energy used for the same distances is lower. Electric motors have varying efficiencies
depending on the load used but it is usually near 75%84. Also the regenerative breaking system available
in the PHEV allows it to recover otherwise lost energy when breaking.
Residues
82 (Hokin) 83 (Johnson, 2010) 84 (U.S. Department of Energy)

Page | 43
According to the EPA, over the lifetime of the Honda Civic DX engine use, there would be over 756kg of
CO released alone (assuming 15 years with 12,000 miles per year)85. Gaseous residues such as CO2, SO2,
VOCs, and CFCs, although released on a small level, are a significant contributor to GHG over the
engine’s lifetime. The use of electricity will not produce any tailpipe residues but it does produce
emissions such as CO2 and NOx at the power plant; still, it is considered the cleaner than burning
gasoline. The highest score was not awarded in this case since the PHEV still uses gasoline in its SI engine.
However the amount of gasoline used is lower than that of the standard engine and hence the emissions
are lower.
4.5 Disposal
In this life stage, the research was focused on how the vehicle is disposed of, taking into consideration
how much is recycled and what is reused.
Materials
Choice
Energy
Use
Solid
Residues
Liquid
Residues
Gaseous
Residues
Total
Vehicle ICEV 3 2 2 3 2 12
PHEV 1 1 1 2 2 7
Table 7 - Disposal SLCA Scoring
Materials choice
The IC engine is mainly made out of steel which is recycled and reused for the manufacture of new IC
engines. The electric motor of the PHEV can be broken up into two main components: the steel casings
and the fiberglass insulation. Both are recycled. Recycling the Li-Ion battery is a newer process. The
lithium can be fully recovered but it is not economically viable since producing lithium carbonate from
raw materials is cheaper than extracting it from the recycled batteries. This is expected to change once
the market evolves and the price of lithium carbonate rises due to demand86.
Energy Use
An estimated 85 million barrels of oil are saved every year by using recycled car parts to manufacture
new parts87. More energy is put into the disposal of the PHEV since it has two additional components
that need to be taken care of. Recycling the electric motor and the battery will use up energy and thus
the PHEV scores lower than the ICEV. The overall low scores of both come from the high usage of energy
in the reuse of the steel.
Residues
The low scores awarded to the PHEV come from the disposal of the Li-Ion battery. Since, as discussed
above, the recycling rates are not currently high; the battery is mainly being disposed of in landfills. Such
85 (EPA, 2008) 86 (Green, 2009) 87 (Automotive Recyclers Association, 2006)

Page | 44
a practice poses major issues; there is high potential for soil contamination from the toxic compounds
within the battery such as lithium hydroxide88. It is assumed that as the PHEV market grows, the lithium
carbonate market will become more competitive and thus the recycling of the Li-Ion battery will become
economically profitable.
4.6 Discussion & Conclusions
Having performed the life cycle assessment for both the ICEV and the PHEV and compared them in each
life stage separately, the team will now evaluate these results and come up with conclusions that
compare the two alternatives over the full life. In order to do that, we need to combine the scores of the
different life stages into one score. The SLCA is designed in a way where weights should be given to the
different stages according to their importance, their environmental impact on the whole life cycle and
their duration89. These weights are to be chosen after having performed the research and having
understood the impact of each stage. In the automobile case, the use phase gets the highest weight
since it uses up a significant amount of energy and emits large amounts of residues over a 15 year
period. The delivery gets the lowest weight considering that on average it takes 1 month to deliver the
automobile from the plant to the dealer and the process doesn’t impact the total life cycle as much. The
tables below summarize the overall results of the SLCA.
Vehicle SLCA Scores
Life stage Weight Max
Score
ICEV PHEV
Weighted total Weighted total
Premanufacture 2 40 24 14
Manufacture 3 60 42 21
Delivery 1 20 13 13
Use 5 100 35 75
Disposal 1 20 12 7
Grand Total 12 240 126 130
Table 8 - Vehicle overall SLCA Scores
Energy Source SLCA Scores
Life stage Weight Max
Score
Gasoline Electricity
Weighted total Weighted total
Premanufacture 2 40 10 24
Manufacture 3 60 24 30
Delivery 1 20 14 18
Grand Total 6 120 48 72
Table 9 - Energy Source SLCA Scores
88 (Jungst, 1999) 89 (Graedel, 1998)

Page | 45
From the two SLCAs summarized above, it can be concluded that the PHEV/Electricity combination wins
over the ICEV/Gasoline combination. The results can be combined to give one final score for each
alternative. Since the PHEV drives 80% on electricity and 20% on gasoline, the same ratio will be given to
the scores of each energy source. The table below summarizes the final scores of the SLCA.
Overall SLCA Scores
Max Score ICEV / Gasoline PHEV / 80% Electricity / 20% Gasoline
Vehicle 240 126 130
Energy Source 120 48 67
Grand Total 240 174 197
Table 10 - Overall SLCA Scores
After performing the SLCA, the team can confidently conclude that the PHEV is an environmentally
feasible alternative to the ICEV. It is indeed a more environmentally responsible product than the ICEV.

5 BACKGROUND INFORMATI
The County of Los Angeles incorporates 88 cities and covers an area of 4,079 square miles. In 2005, the
population of Los Angeles County was 9.8 million according to the U.S. Census Bureau
median earnings were $31,30391. At the beginning of 2007, there were 5,484, 606 automobiles in the
L.A. County according to the California Department of Motor Vehicles. The avera
workers over the age of 16 who work outside the home was 29.6 minutes in 2005. Traffic congestion is
significant problem in L.A. County, and, in 2003, travelers were delayed by 93 hours in 2003
household income statistics for L.A.
Figure 5 - Los Angeles Household
90 (Los Angeles Department of Transportation, 2009)91 (U.S. Census Bureau, 2008) 92 (Los Angeles Department of Transportation, 2009)93 (Los Angeles Alliance for a New Economy, 2009)
0
100,000
200,000
300,000
400,000
500,000
600,000
700,000
800,000
Under
$25,000
$25,000 to
$50,000
Nu
mb
er
of
Ho
use
ho
lds
Income Statistics for Los Angeles
BACKGROUND INFORMATION ON LOS ANGELES
The County of Los Angeles incorporates 88 cities and covers an area of 4,079 square miles. In 2005, the
les County was 9.8 million according to the U.S. Census Bureau
. At the beginning of 2007, there were 5,484, 606 automobiles in the
L.A. County according to the California Department of Motor Vehicles. The average commute time for
workers over the age of 16 who work outside the home was 29.6 minutes in 2005. Traffic congestion is
significant problem in L.A. County, and, in 2003, travelers were delayed by 93 hours in 2003
household income statistics for L.A. are shown in the following figure93.
Los Angeles Household Income Statistics(Los Angeles Alliance for a New Economy, 2009)
(Los Angeles Department of Transportation, 2009)
(Los Angeles Department of Transportation, 2009)
Angeles Alliance for a New Economy, 2009)
$25,000 to
$50,000
$50,000 to
$75,000
$75,000 to
$100,000
$100,000 to
$125,000
$125,000 to
$150,000
Income Level
Income Statistics for Los Angeles
Page | 46
The County of Los Angeles incorporates 88 cities and covers an area of 4,079 square miles. In 2005, the
les County was 9.8 million according to the U.S. Census Bureau90. In 2008, the
. At the beginning of 2007, there were 5,484, 606 automobiles in the
ge commute time for
workers over the age of 16 who work outside the home was 29.6 minutes in 2005. Traffic congestion is
significant problem in L.A. County, and, in 2003, travelers were delayed by 93 hours in 200392. The
(Los Angeles Alliance for a New Economy, 2009)
$125,000 to
$150,000
Over
$150,000

Page | 47
The daily vehicle miles travelled per capita was approximately 21 miles/capita in 2007. The population
per square mile in Los Angeles is considerably higher than other metropolitan areas and this is a primary
contributor to traffic congestion. Although it is commonly thought that NYC is the most densely
populated city in the USA, this impression is based on the situation in Manhattan only. When all 5 NYC
boroughs are included, it is in fact less densely populated than LA. The following graph shows daily
vehicle miles travelled per capita versus population per square mile in 200794.
Figure 6 - Population Density vs. Daily per-capital VMT in Major Metropolitan Areas in 2007(Sorenson, October)
94 (Sorenson, October)

In 2009, Los Angeles was the metropolitan area with the highest hybrid sales during the year, which were
26,66795.
Figure 7 - 2009 Hybrid Sales in
95 (Hybrid Cars, 2010)
0
Los Angeles
New York
San Francisco
Washington, DC
Chicago
Boston
Seattle
Philadelphia
Phoenix
Dallas-Ft. Worth
San Diego
Denver
Atlanta
Orlando
Minneapolis-St. Paul
2009 Hybrid Sales in Metropolitan Areas
In 2009, Los Angeles was the metropolitan area with the highest hybrid sales during the year, which were
2009 Hybrid Sales in Metropolitan Areas(Hybrid Cars, 2010)
5,000 10,000 15,000 20,000 25,000
Number of Hybrids Sold
2009 Hybrid Sales in Metropolitan Areas
Page | 48
In 2009, Los Angeles was the metropolitan area with the highest hybrid sales during the year, which were
25,000 30,000

Relative to other metropolitan areas, Los Angeles has the 5
households in 2006, which were 4.80
Figure 8 - Hybrids per 1000 Households in 2009
Currently, hybrid vehicles are relatively popular in L.A. and it is likely the new hybrid sales will continue
to grow in the future. Given the relatively low daily vehicle miles
is an ideal setting for PHEVs.
96 (Hybrid Cars, 2010)
0.0 1.0
Portland, OR
Helena, MT
San Francisco
Washington, DC
Los Angeles
San Diego
Seattle
Juneau
Santa Barbara, CA
Monterey, CA
Charlottesville, VA
Austin, TX
Billings, MT
Lafayette, IN
Boston
Hybrids per 1000 Households in 2009 in Metropolitan Areas
Relative to other metropolitan areas, Los Angeles has the 5th highest number of hybrids per 1000
households in 2006, which were 4.8096.
Hybrids per 1000 Households in 2009 Metropolitan Areas(Hybrid Cars, 2010)
Currently, hybrid vehicles are relatively popular in L.A. and it is likely the new hybrid sales will continue
to grow in the future. Given the relatively low daily vehicle miles traveled and the available income, L.A.
2.0 3.0 4.0 5.0 6.0 7.0 8.0
Hybrids per 1000 Households
Hybrids per 1000 Households in 2009 in Metropolitan Areas
Page | 49
highest number of hybrids per 1000
Currently, hybrid vehicles are relatively popular in L.A. and it is likely the new hybrid sales will continue
traveled and the available income, L.A.
9.0 10.0
Hybrids per 1000 Households in 2009 in Metropolitan Areas

Page | 50
6 LOS ANGELES ELECTRICAL INFRASTRUCTURE
In addition to assessing PHEV technology, the project also examined its impact on electrical
infrastructure. Because of the regional feasibility aspect of our project scope, we wished to assess the
available generation capacity in order to determine whether the local LA infrastructure could support a
mass transition away from ICEVs toward PHEVs without a net increase in generation capacity.
Our study region was defined to be the area serviced by the Los Angeles Department of Water and
Power (LADWP), a utility company that operates independently of the California Independent System
Operator (CAISO). Our analysis helps provide insight on what capacity upgrades are necessary, if any, and
how the LADWP infrastructure can best adapt to the challenges and opportunities associated with the
changing demand landscape.
In order to model hypothetical future scenarios, we constructed a modeling framework consisting of two
components:
1) Supply-side model: this model illustrates how the available generation capacity could change
with the implementation of various upgrades, such as added capacity, increased renewable
generation, and vehicle-to-grid electrical storage systems.
2) Demand-side model: this model illustrates how the total hourly demand curve could change
with the addition of PHEVs, allowing us to adjust parameters such as total PHEV fleet
penetration, charging profile, and vehicle-miles traveled.
By combining these two components, we can illustrate any number of hypothetical future scenarios. For
the purposes of our analysis, we selected a small sample of illustrative examples for discussion.
6.1 Supply-side Model for Generation Capacity
In order to construct the supply-side model, it was necessary to research the LADWP’s current electricity
supply composition and determine its maximum potential power supply. We did this by applying the
allocable capacity factors to each resource as indicated by LADWP sources and then distributed the wind
and solar generation according to regionally observed daily patterns. (Please refer to Section 2.3.3.1 on
page 27 for technical clarifications on terms used in this section)
We also examined the impacts of carbon emission targets and how those targets could be met while
simultaneously supporting increased energy demand due to a hypothetical influx of PHEVs. With this as
our target case we then analyzed the potential benefits that the increased penetration of the PHEVs can
have when coupled with a Smart Grid/ Vehicle-to-Grid (V2G) System.
6.1.1 LADWP Carbon Emission Reduction Targets and Increase in PHEV Electricity
Demand
Figure 9 compares the current power generation mix in LA (dependable power produced per resource)
to the targeted generation mix for 2020. The 2020 target generation pie chart is an estimation of the
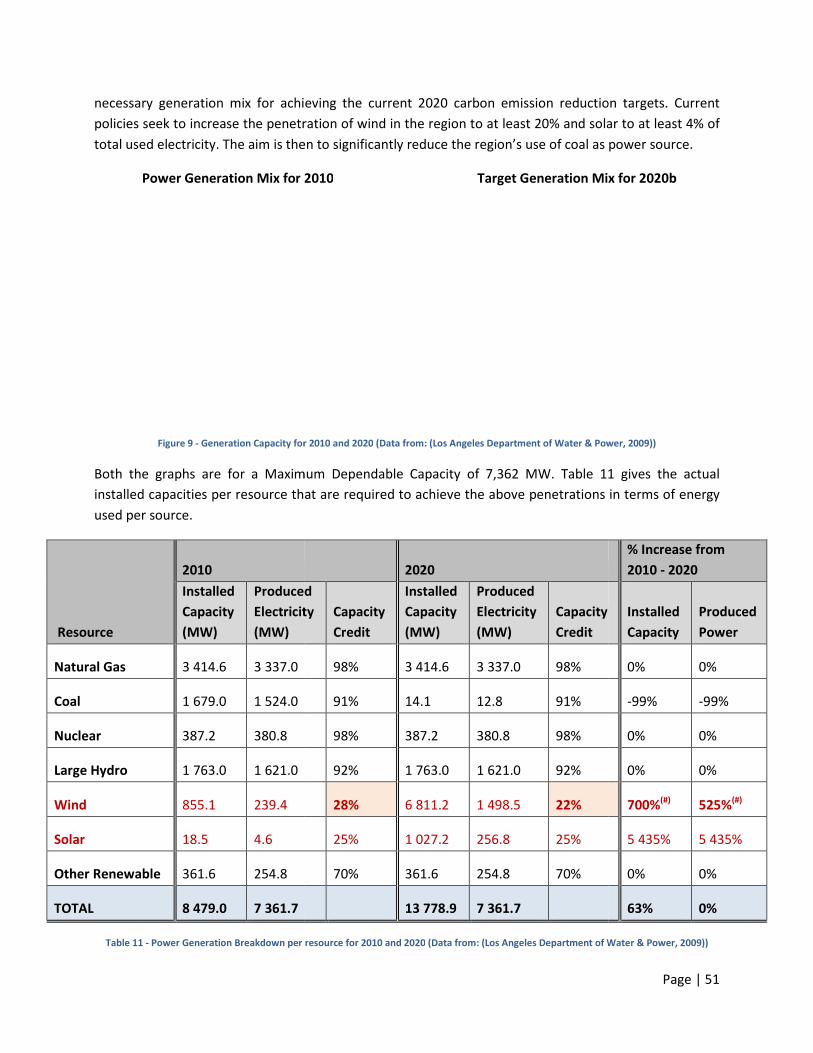
necessary generation mix for achieving
policies seek to increase the penetration of wind in the region to at least 20% and solar to at least 4% of
total used electricity. The aim is then to significantly reduce the region’s use of coal as power sourc
Power Generation Mix for 2010
Figure 9 - Generation Capacity for 2010 and 2020
Both the graphs are for a Maximum Dependable Capaci
installed capacities per resource that are
used per source.
Resource
2010
Installed
Capacity
(MW)
Produced
Electricity
(MW)
Natural Gas 3 414.6 3 337.0
Coal 1 679.0 1 524.0
Nuclear 387.2 380.8
Large Hydro 1 763.0 1 621.0
Wind 855.1 239.4
Solar 18.5 4.6
Other Renewable 361.6 254.8
TOTAL 8 479.0 7 361.7
Table 11 - Power Generation Breakdown per resource for 2010 and 2020
for achieving the current 2020 carbon emission reduction targets. Current
to increase the penetration of wind in the region to at least 20% and solar to at least 4% of
total used electricity. The aim is then to significantly reduce the region’s use of coal as power sourc
Power Generation Mix for 2010 Target Generation Mix for 2020
Capacity for 2010 and 2020 (Data from: (Los Angeles Department of Water & Power, 2009)
Both the graphs are for a Maximum Dependable Capacity of 7,362 MW. Table 11
stalled capacities per resource that are required to achieve the above penetrations in terms of energy
2020
Produced
Electricity Capacity
Credit
Installed
Capacity
(MW)
Produced
Electricity
(MW)
Capacity
Credit
98% 3 414.6 3 337.0 98%
91% 14.1 12.8 91%
98% 387.2 380.8 98%
92% 1 763.0 1 621.0 92%
28% 6 811.2 1 498.5 22%
25% 1 027.2 256.8 25%
70% 361.6 254.8 70%
13 778.9 7 361.7
per resource for 2010 and 2020 (Data from: (Los Angeles Department of Water & Power, 2009)
Page | 51
0 carbon emission reduction targets. Current
to increase the penetration of wind in the region to at least 20% and solar to at least 4% of
total used electricity. The aim is then to significantly reduce the region’s use of coal as power source.
Target Generation Mix for 2020b
(Los Angeles Department of Water & Power, 2009))
11 gives the actual
required to achieve the above penetrations in terms of energy
% Increase from
2010 - 2020
Capacity Installed
Capacity
Produced
Power
0% 0%
-99% -99%
0% 0%
0% 0%
700%(#) 525%(#)
5 435% 5 435%
0% 0%
63% 0%
(Los Angeles Department of Water & Power, 2009))

Page | 52
It will be noted that the installed wind capacity in 2010 produces only 3% of the total dependable
electricity and has an associated capacity credit of 28%. The capacity credit at this low level of
penetration was determined by using the general principles to determine the capacity credit for wind
energy in California as described in the Section 2.3.3 of the literature review.
Figure 10 shows how the capacity credit of wind is expected to decrease as its penetration increases to
20% by 2020. The thick red line represents information for the LADWP region. This trend was plotted on
top of information gathered in other studies of capacity credit over increased penetration levels to
ensure that our information was consistent. It should be noted that the 2010 capacity credit calculation
was calculated on a 10% penetration level, to be conservative, even though the current wind penetration
is only about 3%.
In Figure 10, the amount of storage is kept constant and the effects of increased wind penetration on its
capacity credit is observed.
Figure 10 - Capacity Credit Reduction with Increased Wind Energy Penetration (Source: (UK Energy Research Centre, 2006))
Due to these effects, the capacity credit associated with the 20% wind penetration goal for 2020 is
reduced to only 22%, down from 28%. This reduction in capacity credit is why a seven-fold increase in
installed wind is necessary in order to produce 5.25 times more dependable power from wind in the
LADWP region (Note (#) in Table 11). Putting this in context, one will notice that there is a 63% increase
in the required total installed capacity due to the higher penetration of wind. This is due to the fact that
low-dependability energy (wind, capacity credit = 22%) is used to replace relatively high-dependability
energy (coal, capacity credit = 91%).

Page | 53
6.1.2 Smart Grid/Vehicle-to-Grid (V2G) Potential
Since it is beyond the scope of this project to simulate the working of the Smart Grid, it was decided to
assume that the Smart Grid is functioning as intended for the last analysis of the model. This involves
real-time net metering, including the ability to communicate two ways between the consumer and the
utilities. For our analysis, this would mean that the utilities can have information on the projected
charging demand from each PHEV (i.e. when a PHEV is expected to be fully charged and what the current
state of its battery is). With this information the utility can determine to what extent it can make use of
energy stored in the PHEV’s battery at a given time and still meet the charge requirement as set by the
owner.
We thus decided to further analyze the potential benefits that a V2G system could provide as a form of
grid storage. As noted in Section 2.3.3.1 of the literature review, added grid storage can mitigate the
intermittency of wind energy and thus increase the capacity credit of these resources. This benefit would
allow more coal resources to be removed for a given level of installed wind capacity, without
compromising system reliability. This would make the generation mix “greener” and could potentially
reduce the cost of wind energy, due to the reduced need for backup capacity.
In order to pursue this V2G analysis, we needed to quantify the relationship between the capacity credit
of wind resources and increased backup grid storage. First, it is known that capacity credit of wind in the
LADWP region is expected to be 22% when wind penetration is 20%. This figure establishes the
associated capacity credit at 0% additional storage. Meanwhile, the maximum capacity credit (with 100%
backup storage) cannot be more than the capacity factor of the resource in the region. The maximum
capacity credit with 100% storage was thus calculated to be 42% (the capacity credit of wind in LA).
Adjusting this figure for the time allowed for maintenance brings the maximum capacity credit to about
41% for the region. From various other studies, it was concluded that capacity credit does not increase
linearly as storage increases from 0% to 100%. A more accurate relationship is depicted for the LA region
in Figure 11 below. 97
In Figure 11 the wind penetration is kept constant and the percentage storage is changed.
97
Please refer to the following paper for additional information if required: Wangdee, W & Li, W. 2009. Coordinating Wind and Hydro
Generation to Increase the Effective Load Carrying Capability. Canada.
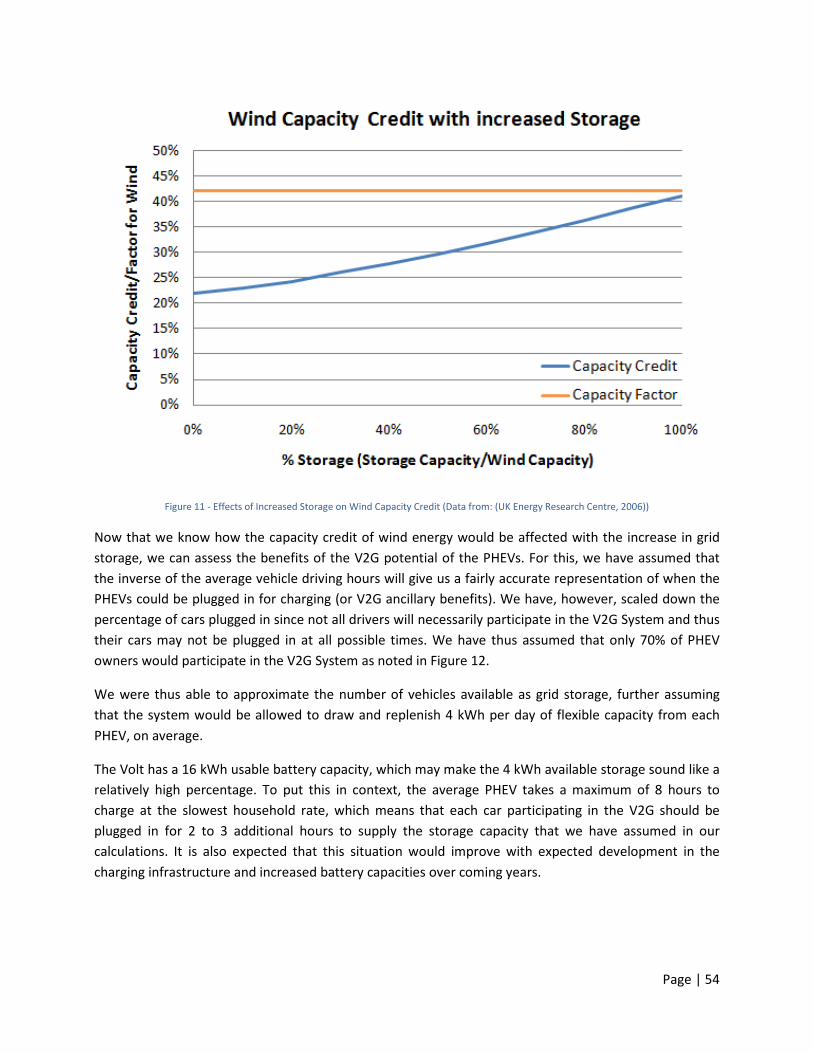
Page | 54
Figure 11 - Effects of Increased Storage on Wind Capacity Credit (Data from: (UK Energy Research Centre, 2006))
Now that we know how the capacity credit of wind energy would be affected with the increase in grid
storage, we can assess the benefits of the V2G potential of the PHEVs. For this, we have assumed that
the inverse of the average vehicle driving hours will give us a fairly accurate representation of when the
PHEVs could be plugged in for charging (or V2G ancillary benefits). We have, however, scaled down the
percentage of cars plugged in since not all drivers will necessarily participate in the V2G System and thus
their cars may not be plugged in at all possible times. We have thus assumed that only 70% of PHEV
owners would participate in the V2G System as noted in Figure 12.
We were thus able to approximate the number of vehicles available as grid storage, further assuming
that the system would be allowed to draw and replenish 4 kWh per day of flexible capacity from each
PHEV, on average.
The Volt has a 16 kWh usable battery capacity, which may make the 4 kWh available storage sound like a
relatively high percentage. To put this in context, the average PHEV takes a maximum of 8 hours to
charge at the slowest household rate, which means that each car participating in the V2G should be
plugged in for 2 to 3 additional hours to supply the storage capacity that we have assumed in our
calculations. It is also expected that this situation would improve with expected development in the
charging infrastructure and increased battery capacities over coming years.
Figure 12 - Percentage of PHEVs
6.2 Demand-side Model for PHEV Penetration
In order to construct the demand
necessary to characterize the current electricity demand in the LADWP service region
the region’s patterns and requirements, it would then be possible
penetration of a successful PHEV fleet under various supply scenarios.
would be needed in the form of hourly power demand, and hourly possible supply. This was seen as
most relevant time frame, since PHEV charging patterns vary greatly over a 24
6.2.1 Charging Profile
In order to characterize the potential PHEV electricity demand per hour, it was important to determine
the portion of the PHEV fleet that is idle and potentially connected to the grid throughout the day. This
helps define the potential charging weight per hour. Initially, we sought to research the hourly driving
patterns of the LA population. Although no LA
and it was assumed that LA trends would be similar to nationwide
associated with work, leisure, and travel.
contribution per hour over the course of a 24
98 (Green Car Congress)
Percentage of PHEVs available for V2G energy storage benefits (Data from: (Nicole Davis)
side Model for PHEV Penetration
order to construct the demand-side model for total electricity demand including PHEVs, it was
necessary to characterize the current electricity demand in the LADWP service region. By understanding
patterns and requirements, it would then be possible to determine the potential
HEV fleet under various supply scenarios. It was decided that this data
would be needed in the form of hourly power demand, and hourly possible supply. This was seen as
most relevant time frame, since PHEV charging patterns vary greatly over a 24-hour period.
In order to characterize the potential PHEV electricity demand per hour, it was important to determine
that is idle and potentially connected to the grid throughout the day. This
ntial charging weight per hour. Initially, we sought to research the hourly driving
patterns of the LA population. Although no LA-specific data was found, national statistics were available,
LA trends would be similar to nationwide trends due to common patterns
and travel. Figure 13 depicts these patterns, in terms of the percentage
hour over the course of a 24-hour day 98.
Page | 55
(Nicole Davis))
demand including PHEVs, it was
. By understanding
determine the potential
It was decided that this data
would be needed in the form of hourly power demand, and hourly possible supply. This was seen as the
period.
In order to characterize the potential PHEV electricity demand per hour, it was important to determine
that is idle and potentially connected to the grid throughout the day. This
ntial charging weight per hour. Initially, we sought to research the hourly driving
specific data was found, national statistics were available,
due to common patterns
these patterns, in terms of the percentage

Page | 56
Figure 13 - Hourly driving trends for the USA – Source (Green Car Congress)
This information was useful for an initial visualization of a potential charging profile; i.e. when people
were not driving, they could potentially be recharging their vehicles. However, this information alone
does not allow for reliable conclusions concerning the PHEV charging profile. For example, when people
are not driving, they may simply be parked or they may be in an area where no grid connection is
available
Further research uncovered a PHEV charging profile based on the LADWP’s own estimates (Figure 14).
This charging profile matched our assumptions about the reciprocal relationship between driving
patterns and charging patterns. 99 Using this charging profile, we were able to convert the PHEVs’ daily
electricity needs into hourly demands.
Figure 14 - PHEV charging Profile - Source:(City of LA department of Water and Power, 2010)
99 (City of LA department of Water and Power, 2010)
0%
2%
4%
6%
8%
10%
12%
h0
1
h0
2
h0
3
h0
4
h0
5
h0
6
h0
7
h0
8
h0
9
h1
0
h1
1
h1
2
h1
3
h1
4
h1
5
h1
6
h1
7
h1
8
h1
9
h2
0
h2
1
h2
2
h2
3
h2
4
Pe
rce
nta
ge
of
PH
EV
fle
et
Hour of Day
Charging Trend
Charging Trend

Page | 57
6.2.2 Los Angeles Current Demand/Supply
In addition to researching the hourly variation in PHEV electricity demands, it was also necessary to
research the current hourly demand in LA without the inclusion of a PHEV fleet of any size. However, this
hourly pattern varies day-to-day and season-to-season.
Figure 15 - Seasonal demand patterns- Source: (GE Energy Consulting, 2007)
Figure 15 illustrates the data which was found.100 The graph details both the average summer and winter
loads. The discrepancy here is largely due to air conditioning use in the summer.
At this stage, it was decided that it would be most relevant to use the highest demand in order to truly
understand the maximum penetration for a PHEV fleet, since this added demand must be met at all
points during a year. Therefore, it was seen as irrelevant to use an average. The team concluded that the
day of highest demand (i.e. the hottest day) would be the most inclusive figure to use for the final
analysis of LA’s capability to cope with the introduction of PHEVs on a large scale. This data is shown in
Figure 16.
100 (GE Energy Consulting, 2007)

Now that the charging demand and the unique electricity demand
characterized on an hourly basis, the
in order to make use of the hourly PHEV charging profile, the total daily electricity requirement had to be
calculated.
6.2.3 PHEV energy demands
As a basis for determining the charging requirements of a PHEV, it was decided to use the m
model on the market – the Chevy Volt. Based
is 16 kWh, which allows for an average of 40 miles of all
Average Miles per day
% average use of electric motor
Average use on electric motor
kWh/mile
kWh per day
Table 12 - PHEV driving trends
Table 12 illustrates the model inputs used in our LA
average, an LA driver will travel only 21 miles per day. Bas
city, it was possible to conclude that around 17 miles per day would be driven on the electric battery
supply alone – i.e. not using the ICE.
kWh/mile, it was then possible to determine the
(Genral Motors 2009). This figure could then be multiplied by the total number of light
cars in LA and the percent PHEV fleet penetration in order to calculate the total kWh electricity
requirement for all cars.
Figure 16 - Hourly demand for LA; hottest day
Now that the charging demand and the unique electricity demand for the LA region had both been
an hourly basis, the combination of both demand curves could be analyzed. However
in order to make use of the hourly PHEV charging profile, the total daily electricity requirement had to be
V energy demands
the charging requirements of a PHEV, it was decided to use the m
Chevy Volt. Based on the figures released for this model, the battery capacity
average of 40 miles of all-electric travel.
Average Miles per day 21.00
% average use of electric motor 0.80
Average use on electric motor 16.80
0.4
6.72
trends (data generated based on research and assumptions covered in the text)
model inputs used in our LA-specific feasibility study. It was found that
average, an LA driver will travel only 21 miles per day. Based on the statistic that 80% of travel is inner
city, it was possible to conclude that around 17 miles per day would be driven on the electric battery
i.e. not using the ICE. Using the Chevy Volt’s technical specifications to determine
it was then possible to determine the total daily energy requirements per vehicle
This figure could then be multiplied by the total number of light
nt PHEV fleet penetration in order to calculate the total kWh electricity
Page | 58
for the LA region had both been
combination of both demand curves could be analyzed. However,
in order to make use of the hourly PHEV charging profile, the total daily electricity requirement had to be
the charging requirements of a PHEV, it was decided to use the most current
on the figures released for this model, the battery capacity
d on research and assumptions covered in the text)
It was found that, on
the statistic that 80% of travel is inner-
city, it was possible to conclude that around 17 miles per day would be driven on the electric battery
’s technical specifications to determine
per vehicle in kWh.
This figure could then be multiplied by the total number of light-duty passenger
nt PHEV fleet penetration in order to calculate the total kWh electricity

Page | 59
Now that the PHEV demand curve and the current electricity demand curve had both been identified, a
combination of the two could begin. By inputting data for the potential maximum hourly energy supply,
a comparison could be carried out for the demand/supply relationship and the implications a varying
number of PHEVs may have on this. In using the solver tool in Excel, an analysis could be carried out in
order to realize the potential maximum number of PHEVs possible to add to the grid under various
supply scenarios.
6.2.4 Simulation model
The model created is adaptable for a number chosen situations. In this case, it is desired to simply find
the theoretical maximum penetration of PHEVs in the current market. The input variables for the model
are given below.
• Vehicles on the road in LA
• kWh per mile per vehicle
• Hourly charging profile
• Hourly daily demand (non PHEV)
• Hourly maximum supply
To consider how many PHEVs could potentially be included in the grid at this time, the current number
of cars on the road was decided to be considered, as a basis of understanding. It could then be
concluded what maximum penetration of the existing fleet could be reached. By considering the
maximum supply of electricity currently available to the region, the solver analysis could maximize the
penetration of the PHEV fleet, whilst never exceeding the maximum hourly supply potential. In other
words, our results illustrate how much penetration could take place in terms of hourly charging needs
without exceeding the LADWP’s hourly generation capacity.
6.3 Results and Discussion
6.3.1 Wind and Solar Effects on Supply Curves
As previously stated, the two main factors influencing PHEV penetration are the power supply and
subsequent demand. In order for PHEVs to be a feasible technology, there must be adequate supply to
match the increase in demand caused by the recharging of the vehicle’s batteries.
The curves shown in Figure 17 were calculated by modifying the initial constant baseline supply. The
blue line is simply the maximum daily power supply divided evenly throughout the day. However, this
baseline must be modified to account for the changes in daily wind speed. Generally, wind speeds are
higher at night than the middle of the day and thus provide more power between the hours of 7:00pm to
6:00am. As it turns out, maximum solar generation is on an opposite schedule to wind; solar provides
more power during the middle of the day when the sun is directly overhead. This simple fact will prove
to be vital as more of these renewable resources are brought online. Instead of having large peaks and
valleys during certain parts of the day, an electrical generation plan that utilizes both wind and solar

Page | 60
energies will help to maintain a more constant supply. In this way, wind and solar generation were
correctly modified from the original baseline supply to account for these characteristics.
6.3.2 Scenario I Results –Penetration Based on Current Supply
This modification to the baseline generation was calculated using California wind averages to create an
“hourly capacity factor.” This intermediate factor is a per-hour percentage of the total installed capacity
and was used as a way to determine the power production throughout the day. Using these individual
hourly factors plus a wind capacity credit of 28% (based upon a conservative 10% wind penetration
assumption) the hourly distributed wind generation was calculated. For this initial modification to the
baseline supply, the true solar distribution was ignored. Calculating this distribution would follow the
same procedure as wind generation but may be disregarded as solar power currently comprises such a
small fraction of the total generation. With the above modifications, the true current power supply is
described by the red curve in Figure 17.
Figure 17 - Maximum Dependable Supply under various supply scenarios
The wind modified maximum dependable supply curve was then used to calculate the theoretical
maximum PHEV penetration. The first step in this process was to determine the PHEV charging profile as
displayed previously in Figure 14. This profile was used to assess the additional demand created by the
influx of PHEVs. As can be seen, without any type of price or other incentives by the utility, the majority
of PHEVs will be charged at night with a slight peak during the middle of the day. This profile
corresponds well to the standard business day of high vehicle use during the rush hours of 7:00am
through 9:00am and 5:00pm to 7:00pm. Consequently, there will be minimal charging during these
times. The shape of this charging profile is one of the primary constraints to PHEV penetration. The
5500
6000
6500
7000
7500
8000
8500
9000
1 2 3 4 5 6 7 8 9
10
11
12
13
14
15
16
17
18
19
20
21
22
23 0
Ma
x D
ep
en
da
ble
Ele
ctri
city
(M
W)
Hours of the day
Maximum Dependable Supply (MW)
Target + V2G (Smart Grid)
20% Wind, 4% Solar Target
Wind Correctly Distributed
Constant Daily Supply

Page | 61
ability to modify it may be considered one of the two best ways to increase potential penetration; the
other being to simply increase power generation. There is tremendous potential to modify this charging
profile through different types of incentives to get more people to charge during the middle of the day.
Currently, the majority of charging takes places at the home mostly out of physical infrastructure
necessity; there are very few public charging stations. However, additional charging stations at public
areas such as shopping malls and office complexes where vehicles are parked for long periods of time
will do much to alter the charging profile.
The LADPW’s current maximum hourly demand curve is plotted in Figure 18 below. The charging profile
from Figure 14 was added to the standard demand to produce the true hourly power demand including
PHEVs. Using Excel Solver to equate the peak of the hourly demand profile to the minimum of the
supply curve, the maximum PHEV penetration was calculated to be 113% of the total vehicle fleet in Los
Angeles. In this way, Los Angeles can already support a vehicle fleet comprised of solely PHEVs without
adding any generation capacity or charging incentives. Since 113% is only a theoretical number, the
analysis determined that there would be a daily excess of 29,557 kWh based upon a PHEV only vehicle
fleet. The minimum energy excess would occur at 2:00pm with a surplus of 132 kWh. An important
factor to remember is the fact that the original demand profile was taken from the hottest day when air
conditioners and other large energy consumers were running constantly. Therefore, the normal day
would see an even larger excess supply and LADPW would still be able to sell off their surplus power to
other utilities.
Finally, as a basis for comparison, the total kWh used per day per vehicle was modified to assume that
the driver completely drained the battery. In this way, it was assumed that the battery would need to be
fully recharged, demanding 16 kWh per vehicle. With this large increase in demand, the model
calculated a new maximum PHEV penetration of 43%.

Page | 62
Figure 18 - Supply and demand curves for Scenario I
6.3.3 Scenario II Results –Penetration Based on 2020 Targets
After the analyzing the penetration based upon the current generation capacity, the next step was to
determine the maximum theoretical penetration based on the 2020 power generation targets. In an
effort to reduce carbon emissions, California has a goal to increase wind generation to 20% and solar
generation to 4% of the total installed capacity and to eliminate the use of coal power.
A similar strategy was used to determine the “20% wind, 4% solar target” supply line in Figure 19 as was
used to calculate the current generation profile. However, the capacity credit decreases from 28% to
22% for a 20% wind penetration model. In addition to the wind profile change, this new model cannot
ignore the true solar distribution profile any longer. The solar distribution was calculated in much the
same way as the wind; however a 25% capacity credit was used constantly though our calculations (25%
is the currently used capacity credit used by the LADWP). As mentioned previously, solar energy makes
up somewhat for the decrease in daytime wind speed as indicated in Table 13. However, there will still
be a mid-day decline in supply as installed wind generation is still over 1,000 MW larger than solar
power. There is simply not enough solar capacity to make up for the mid-day decline in wind speeds. In
this way, the total daily power generated using 20% wind and 4% solar will equal the current supply.
However, the generation will not be as constant throughout the day and will experience peaks and
valleys. Figure 19 indicates that there will be a 345 MW decrease in power at 12:00pm compared to the
current generation profile. As will be discussed, these valleys will affect the potential maximum
penetration of PHEVs.
0
1000
2000
3000
4000
5000
6000
7000
8000
1 2 3 4 5 6 7 8 9 10 11 12 13 14 15 16 17 18 19 20 21 22 23
MW
Hour of the day
Scenario I - Penetration Based on Current Capacity
Hourly Demand Curve
Hourly Demand Curve
including PHEVs
Scenario 1 Capacity
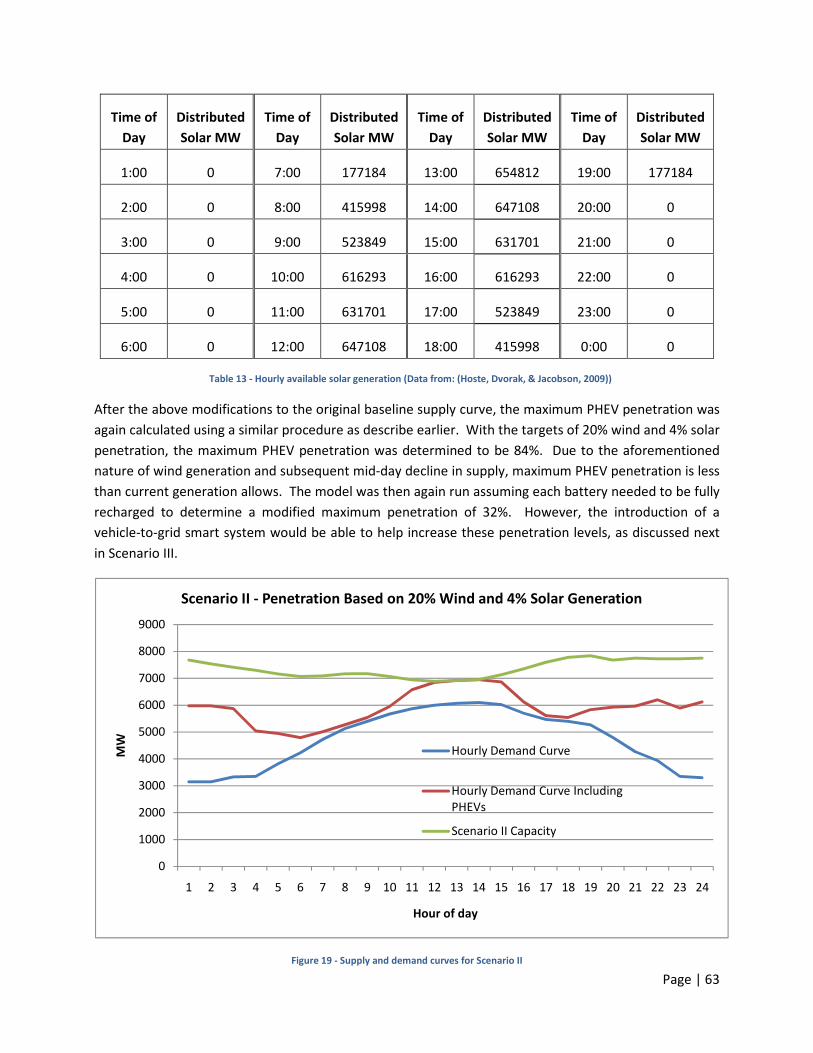
Page | 63
Time of
Day
Distributed
Solar MW
Time of
Day
Distributed
Solar MW
Time of
Day
Distributed
Solar MW
Time of
Day
Distributed
Solar MW
1:00 0 7:00 177184 13:00 654812 19:00 177184
2:00 0 8:00 415998 14:00 647108 20:00 0
3:00 0 9:00 523849 15:00 631701 21:00 0
4:00 0 10:00 616293 16:00 616293 22:00 0
5:00 0 11:00 631701 17:00 523849 23:00 0
6:00 0 12:00 647108 18:00 415998 0:00 0
Table 13 - Hourly available solar generation (Data from: (Hoste, Dvorak, & Jacobson, 2009))
After the above modifications to the original baseline supply curve, the maximum PHEV penetration was
again calculated using a similar procedure as describe earlier. With the targets of 20% wind and 4% solar
penetration, the maximum PHEV penetration was determined to be 84%. Due to the aforementioned
nature of wind generation and subsequent mid-day decline in supply, maximum PHEV penetration is less
than current generation allows. The model was then again run assuming each battery needed to be fully
recharged to determine a modified maximum penetration of 32%. However, the introduction of a
vehicle-to-grid smart system would be able to help increase these penetration levels, as discussed next
in Scenario III.
Figure 19 - Supply and demand curves for Scenario II
0
1000
2000
3000
4000
5000
6000
7000
8000
9000
1 2 3 4 5 6 7 8 9 10 11 12 13 14 15 16 17 18 19 20 21 22 23 24
MW
Hour of day
Scenario II - Penetration Based on 20% Wind and 4% Solar Generation
Hourly Demand Curve
Hourly Demand Curve Including
PHEVs
Scenario II Capacity

Page | 64
6.3.4 Scenario III Results –Penetration Based on 2020 Targets and V2G
The final scenario studied was the 2020 target generation supply with the addition of a vehicle to grid
system. Using an assumed penetration of PHEVs in the total 5.5M Los Angeles light vehicle market, we
were able to determine exactly how much added storage potential to use. As indicated in TTable 14 -
Vehicle to Grid Constraints, we assumed a 15% penetration in the Los Angeles market which resulted in a
32% storage capacity as a percentage of the total installed wind energy. This would increase our wind
capacity credit from 22% to 26.4%. The curve for this scenario is indicated by the purple line in Figure
17.
TTable 14 - Vehicle to Grid Constraints
The 4.6% increase in the wind capacity credit translates into an added reliable supply of about 300 MW
which increases the total dependable supply about 4%. With the modifications as a result of a smart grid
system, the new theoretical maximum PHEV penetration is 98%. Again, this theoretical percentage
translates into a fleet that is comprised almost entirely of PHEVs. As a final comparison, the model was
again run assuming every battery needed to be fully recharged, yielding a modified penetration of 37%.
If we assume that we have met the 2020 targets for installed wind energy, and that we are still allowed
to make use of 4 kWh of each PHEV's battery capacity per day and that 70% of all PHEV owners would
participate in a V2G system, then we will reach a level of 100% backup storage for the installed wind
capacity when a PHEV penetration level of 47% is reached. Even if the PHEV itself does not reach a
penetration level of 47% In the future, this level could still be reached if 100% of Electric Vehicles
participate in such a V2G system. This will allow for a potential total reduction in required backup
capacity of 1300 MW, which will result in significant cost savings and an even greener power generation
mix than mentioned before. This is mainly due to the fact that we will then be able to increase the wind
capacity credit not only to 26.4% but to the maximum 41%

Page | 65
Figure 20 - Supply and demand curves for Scenario III
If we assume that we have met the 2020 targets for installed wind energy, and that we are still allowed
to make use of 4 kWh of each PHEV's battery capacity per day and that 70% of all PHEV owners would
participate in a V2G system, then we will reach a level of 100% backup storage for the installed wind
capacity when a PHEV penetration level of 47% is reached. Even if the PHEV itself does not reach a
penetration level of 47% one day, this level could still be reached if all Electric Vehicles participate in
such a V2G system.
This will allow for a potential total reduction in required backup capacity of 1300 MW, which will result
in significant cost savings and an even greener power generation mix than mentioned before. This is
mainly due to the fact that we will then be able to increase the wind capacity credit not only to 26.4%
but to the maximum 41%.
6.3.5 Summary of Results
Table 15 is a summary of the results of the three different scenarios analyzed in this study. The
‘Maximum Penetration’ column lists the percentage of the total fleet that Los Angeles would be able to
support based on the assumptions presented in Table 12, specifically the 6.72 kwh consumed per day.
The remaining column displays the maximum theoretical PHEV penetration based on a full battery
recharge.
0
1000
2000
3000
4000
5000
6000
7000
8000
9000
1 2 3 4 5 6 7 8 9 10 11 12 13 14 15 16 17 18 19 20 21 22 23
MW
Hour of day
Scenario III - Penetration Based on 20% Wind, 4% Solar with V2G system
Daily Demand Curve
Daily Demand Curve including
PHEVs
Scenario III Capacity

Page | 66
Scenario Maximum Penetration
Maximum Penetration
with Full Battery
Recharge
Current Supply 100% 43%
2020 Targets 84% 32%
2020 Targets Plus Vehicle-to-Grid System 98% 37%
Table 15 - Summary of maximum penetration results
6.3.6 Potential changes
The above penetration percentages were based upon a number of assumptions, particularly in the areas
of LADWP’s supply capabilities and personal driving habits. Therefore, the penetrations are a function of
the current knowledge of the power grid without any awareness of upcoming changes that may impact
their accuracy. For example, any increase in the LADWP’s baseline supply or a new record of the largest
daily energy consumption by its users would certainly alter the percentages. In addition, there is the
possibility of an increase in travel as the cost per mile decreases while operating a PHEV. These are just a
few examples of the numerous ways in which any of the penetrations may be altered.
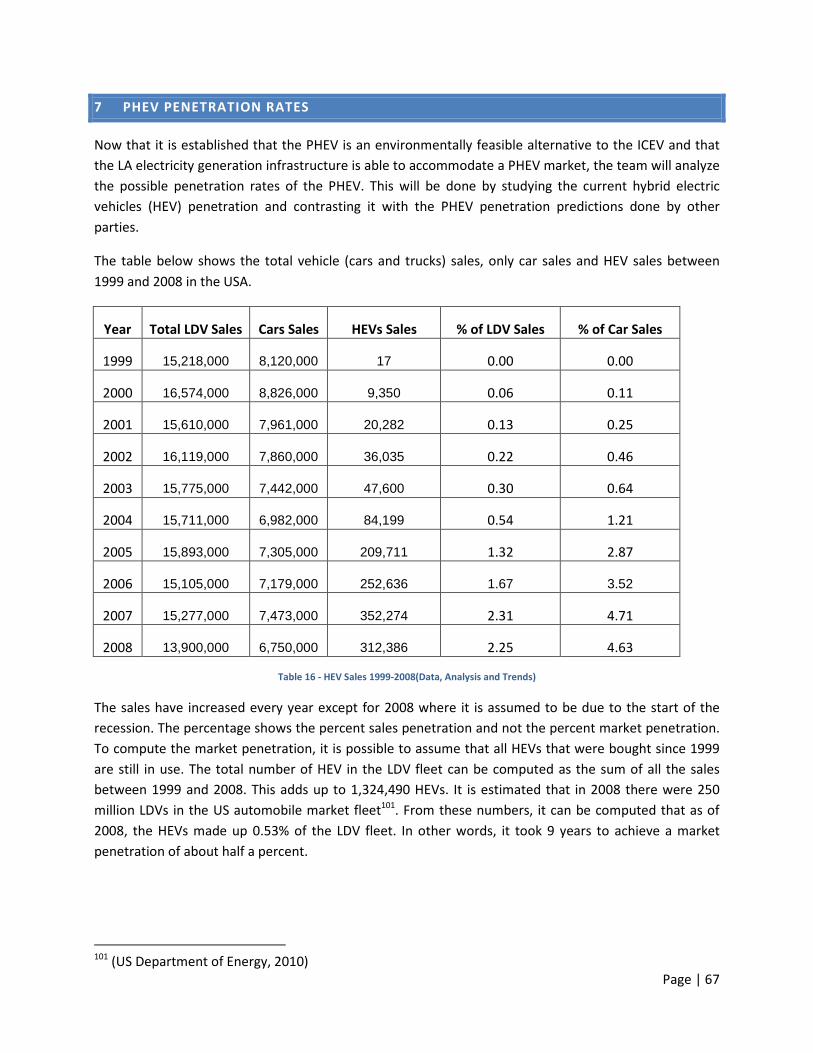
Page | 67
7 PHEV PENETRATION RATES
Now that it is established that the PHEV is an environmentally feasible alternative to the ICEV and that
the LA electricity generation infrastructure is able to accommodate a PHEV market, the team will analyze
the possible penetration rates of the PHEV. This will be done by studying the current hybrid electric
vehicles (HEV) penetration and contrasting it with the PHEV penetration predictions done by other
parties.
The table below shows the total vehicle (cars and trucks) sales, only car sales and HEV sales between
1999 and 2008 in the USA.
Year Total LDV Sales Cars Sales HEVs Sales % of LDV Sales % of Car Sales
1999 15,218,000 8,120,000 17 0.00 0.00
2000 16,574,000 8,826,000 9,350 0.06 0.11
2001 15,610,000 7,961,000 20,282 0.13 0.25
2002 16,119,000 7,860,000 36,035 0.22 0.46
2003 15,775,000 7,442,000 47,600 0.30 0.64
2004 15,711,000 6,982,000 84,199 0.54 1.21
2005 15,893,000 7,305,000 209,711 1.32 2.87
2006 15,105,000 7,179,000 252,636 1.67 3.52
2007 15,277,000 7,473,000 352,274 2.31 4.71
2008 13,900,000 6,750,000 312,386 2.25 4.63
Table 16 - HEV Sales 1999-2008(Data, Analysis and Trends)
The sales have increased every year except for 2008 where it is assumed to be due to the start of the
recession. The percentage shows the percent sales penetration and not the percent market penetration.
To compute the market penetration, it is possible to assume that all HEVs that were bought since 1999
are still in use. The total number of HEV in the LDV fleet can be computed as the sum of all the sales
between 1999 and 2008. This adds up to 1,324,490 HEVs. It is estimated that in 2008 there were 250
million LDVs in the US automobile market fleet101. From these numbers, it can be computed that as of
2008, the HEVs made up 0.53% of the LDV fleet. In other words, it took 9 years to achieve a market
penetration of about half a percent.
101 (US Department of Energy, 2010)
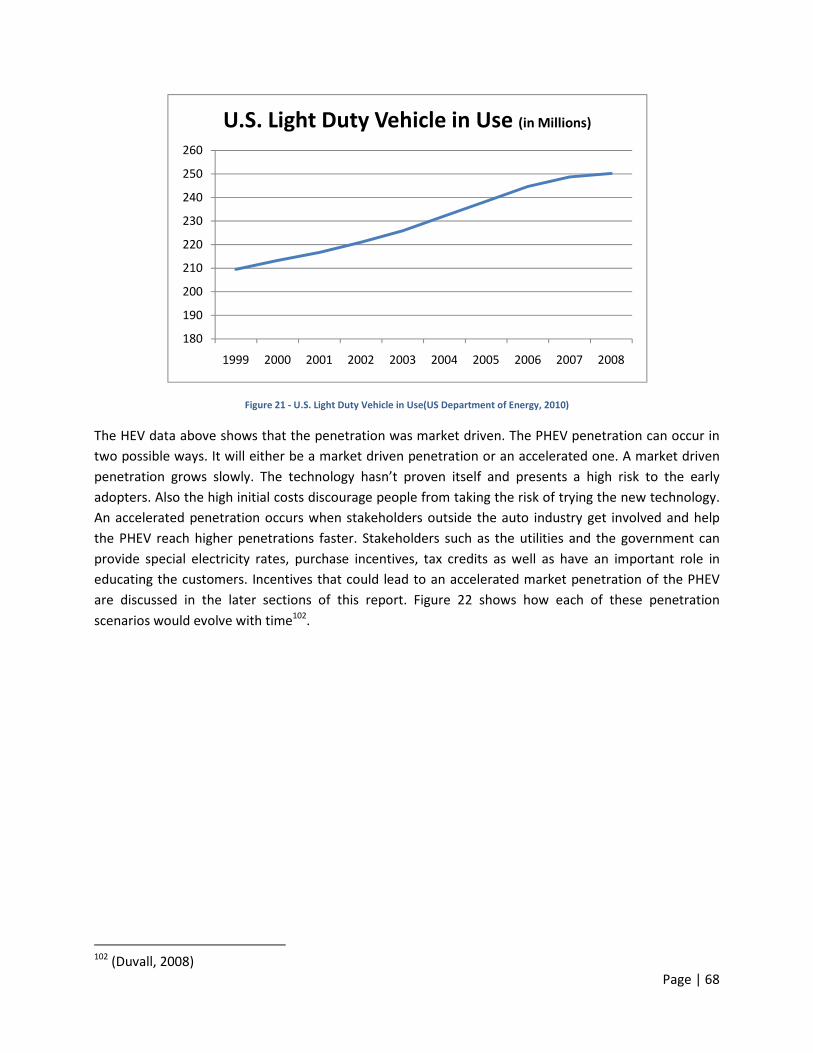
Page | 68
Figure 21 - U.S. Light Duty Vehicle in Use(US Department of Energy, 2010)
The HEV data above shows that the penetration was market driven. The PHEV penetration can occur in
two possible ways. It will either be a market driven penetration or an accelerated one. A market driven
penetration grows slowly. The technology hasn’t proven itself and presents a high risk to the early
adopters. Also the high initial costs discourage people from taking the risk of trying the new technology.
An accelerated penetration occurs when stakeholders outside the auto industry get involved and help
the PHEV reach higher penetrations faster. Stakeholders such as the utilities and the government can
provide special electricity rates, purchase incentives, tax credits as well as have an important role in
educating the customers. Incentives that could lead to an accelerated market penetration of the PHEV
are discussed in the later sections of this report. Figure 22 shows how each of these penetration
scenarios would evolve with time102.
102 (Duvall, 2008)
180
190
200
210
220
230
240
250
260
1999 2000 2001 2002 2003 2004 2005 2006 2007 2008
U.S. Light Duty Vehicle in Use (in Millions)

Page | 69
Figure 22 - PHEV Adoption Rate(Duvall, 2008)
Several studies have been done for a proposed PHEV penetration curve. In the study done at the
University of Michigan – Transportation Research Institute, the Virtual AutoMotive MarketPlace
(VAMMP) model was created to simulate an actual marketplace comprised of actual decision makers103.
It was designed to test the success of a new vehicle technology such as the PHEV. The decision makers
included:
• The consumers,
• The government,
• The energy providers and,
• The auto manufacturers.
When the simulation was run, all of the above agents took decisions that achieve their individual or
organizational benefits and objectives. Figure 23 shows the results of 20 simulations.
According to the VAMMP simulation, it would take up to year 2040 to reach a market penetration of
about 15%, as shown by the band of 17 out of 20 runs that are in the range of 0.13 to 0.18.
103 (Sullivan, Salmeen, & Simon, 2009)

Page | 70
Figure 23 - PHEV Penetration104
It would be unreasonable to assume a penetration rate faster than the one portrayed above. This is
because the assumed life of the car is 15 years. A 15% penetration in 30 years is achievable if and only if
the accelerated scenario is followed and the political decision to implement a transition is taken.
Without such a decision it is unlikely to reach such penetrations, in the same that it took the HEV 9 years
to achieve just half a percent penetration.
104 (Sullivan, Salmeen, & Simon, 2009)

Page | 71
8 COST ANALYSIS
The following analysis highlights the differences in costs between PHEVs and ICEVs to the consumer over
the life of the vehicle. Both direct and indirect costs are presented; direct costs include the initial capital
cost of the vehicle, the operating costs as well as the disposal cost. Indirect costs measure the effect of
health hazards and emissions caused by the vehicles.
8.1 Direct Costs
8.1.1 Capital Cost
This analysis assumes that the ICEV is a mid-size passenger vehicle and the capital cost is based on the
Honda Accord. The base model of the Honda Accord is priced at $21,180105.
The capital cost of the PHEV is based on the GM Chevy Volt, which is $41,000106. Owners of new PHEVs
can qualify for the “New Qualified Plug-in Electric Drive Motor Vehicle Credit”. This credit is composed
of $2,500 plus $417 for a vehicle which draws propulsion energy from a battery with at least 5 kilowatt
hours of capacity plus an additional $417 for each kilowatt hour of battery capacity in excess of 5
kilowatt hours. The portion of the credit that results from batter capacity, cannot excess $5,000. As a
result, the total credit allowable for each new PHEV is $7,500107. After taking into account the federal tax
credit, the capital cost of the PHEV is $33,500.
The price of PHEVs will eventually decrease as the market becomes more competitive and PHEVs
become more popular. The entry of PHEVs into the market provides an opportunity for U.S.
manufacturers to invest research into the production of batteries, the generation of more efficient
electricity, and other industries associated with PHEVs. This increased demand will create new jobs,
increase research in new technology areas as well as strengthen the U.S. economy.
8.1.2 Operating Costs
Operating costs include daily gasoline and electricity costs as well as maintenance and tire costs. The
lifetime of both the PHEV and ICEV is assumed to be 15 years, and annual vehicle miles traveled is 12,000
miles. While the ICEV uses gasoline for all types of driving, it is assumed that the PHEV uses electricity for
urban driving and gasoline for intercity driving. Assuming 80% of miles traveled are urban in nature and
the remaining 20% are intercity, a total of 9,600 miles are traveled in urban settings each year and 2,400
miles are traveled in intercity conditions.
ICEVs, such as the Honda Accord, travel 22 mpg in urban conditions and 31 mpg in intercity travel108. For
a projected average gasoline price of $4.00/gallon, the total urban fuel cost is $1,745/year and the
intercity cost is $310/year. The maintenance and tire costs are estimated at $0.056/mile and therefore
105 (Honda, 2010) 106 (GM-Volt, 2010) 107 (IRS, 2009) 108 (www.fueleconomy.gov, 2010)

Page | 72
the total maintenance cost for the ICEV is $672/year109. The annual operating costs for the ICEV are
$2,727. Using a discount rate of 7%, the rate typically used by the U.S. government when evaluating
investments, the net present value of the operating costs of the ICEV over the life of the vehicle is $24,
838.
Assuming PHEVs use electricity in urban areas, the cost of electricity to the consumer is estimated at
$0.02415/kWh110. The PHEV achieves 3 miles/kWh in urban driving and 38 mpg in intercity travel. The
total urban electricity cost is $77/year and the intercity gasoline cost is $253/year. The maintenance and
tire costs are again estimated at $0.056/mile and therefore the total maintenance cost for the ICEV is
$672/year111. The annual operating costs for the PHEV are $1,002. In year ten, the battery of the PHEV
will have to be replaced which will cost approximately $10,000. Using a discount rate of 7%, the net
present value of the operating costs of the ICEV over the life of the vehicle is $14,209.
8.1.3 Disposal Cost
When analyzing disposal costs, several parts of ICEVs and PHEVs, for which lifecycle and costs are
different, must be considered. The primary driver of the disposal cost for the ICEV is the body itself,
which is made of steel. There is also a small battery, which is made of lead-acid. In PHEVs, an important
component of the disposal cost results from the lithium-Ion battery. In Los Angeles, the disposal of ICEVs
and PHEVs is free to the owner of the vehicle112.
8.1.4 Total Direct Cost
Over the life of the vehicle, PHEVs are approximately $1,700 more expensive than ICEVs. Given the 15-
year life of the vehicles, the additional expense is deemed to be minimal. The issue arises from the high
up-front capital cost of the PHEV. Ways to resolve this will be discussed in the business section of this
report. The following graph summarizes the capital costs and operating costs for the ICEV and the PHEV.
109 (Commute Solutions, 2010) 110 (Los Angeles Department of Water & Power, 2009) 111 (Commute Solutions, 2010) 112 (Donate a Car 2 Charity, 2010)

Page | 73
Figure 24 - Summary of Direct Costs
8.2 Indirect Costs
8.2.1 Health Costs
Dependence on vehicles in the U.S has many negative effects on society including decreased
opportunities for physical activity, increased vulnerability to traffic crashes as well as increased exposure
to air pollution. It is estimated that the social costs of air pollution associated with vehicles are between
$30 billion and $349 billion per year113.
The following table summarizes the estimated economic costs of motor vehicle-related air pollution in
2000. The majority of costs are attributed to mortality, chronic bronchitis and other respiratory and heat
diseases caused by inhalation of particulate matter114.
Pollutant Impact Costs of Rural
Motor Vehicle
Travel
Costs of Urban
Motor Vehicle
Travel
Costs of All Motor
Vehicle Travel
$1990 (millions) $1990 (millions) $1990 (millions)
Particulate Matter Mortality 12,695 21,558 31,162
Particulate Matter Non-fatal Illness 3,683 6,232 9,183
Sulfur dioxide, nitrogen
dioxide, carbon monoxide
Non-fatal Illness 0 51 51
113 (U.S. Department of Transporation, Federal Highway Administration, 2000) 114 (U.S. Department of Transporation, Federal Highway Administration, 2000)
$0
$10,000
$20,000
$30,000
$40,000
$50,000
$60,000
ICEV PHEV
Co
st (
$)
Summary of Direct Costs for ICEV and PHEV
Capital Cost Operating Cost

Page | 74
Ozone Non-fatal Illness 28 16 47
Total 16,406 27,857 40,443
Table 17 - Estimated Economic Costs of Motor Vehicle-Related Air Pollution in 2000(U.S. Department of Transporation, Federal Highway
Administration, 2000)
Given the substantially decreased air pollutions from PHEVs as compared to ICEVs, the health costs due
to air pollutions will also be greatly diminished as PHEVs become more popular.
8.2.2 Emission Costs
In 2008, 1,945.8 million metric tons carbon dioxide equivalent were emitted by the transportation sector
in the U.S, which represents approximately 28% of all greenhouse gas emissions115. Currently, the U.S.
has not committed to the Kyoto Protocol, which calls for a reduction of greenhouse gases by 7% from
1990 levels in 2012. Should the U.S. agree to sign the Kyoto Protocol, the cost would be extraordinary.
Transportation is an ideal sector to begin decreasing greenhouse gas emissions. There has been a trend
to increase efficiency of internal combustion engines, however, a significant decrease in emissions is not
likely. New technologies such as PHEVs provide an alternative to traditional ICEVs and greatly decrease
U.S.’ carbon footprint.
115 (U.S. Energy Information Administration, 2009)

9 BUSINESS ASPECTS OF THE TRANSITION
The next section discusses the business aspects of a transition from ICEVs to PHEVs in the Californian
market. At first, the major stakeholders of a PHEV i
explained. Next, the current legal incentives to promote low emission vehicles in California are described
before potential new incentives to increase and expedite PHEV market penetration are presented. La
the manufacturers’ strategies to overcome the challenge of governmental regulations are described and
a potential marketing strategy to promote PHEVs is developed.
9.1 Stakeholder Analysis
At first, the various groups that are likely to affect or to be af
LA area are identified. Manufacturers, consumers, the utilities, banks and car dealers in LA as well as the
Californian government will influence how fast and to which extent PHEVs will penetrate the market. The
following figure illustrates the different stakeholders and lists some of their major concerns related to
PHEVs.
Figure
Domestic and international car manufacturers
introduction of Assembly Bill 32, the Global Warming Solutions Act of 2006, sets reduction targets for
greenhouse gas emission until 2020. This will be further discussed in the next sections. Each car
manufacturer cannot exceed defined average GHG emissions of all cars sold in a specific year. The
emission limits decrease every year from 2010 to 2020. Therefore manufactures will have to introduce
new technologies to lower the average emissions of their sales fleet or introdu
smaller engines to fulfill the requirements. In this context and due to the fact that California has the
highest Hybrid penetration of all US states, PHEVs are a business opportunity for the Californian market.
However to make PHEVs more attractive for consumers and competitive to the ICEVs, car manufacturers
might need to cooperate in research and development of production processes and for the battery
technology to reduce the initial cost difference of PHEVs and ICEVs.
THE TRANSITION
The next section discusses the business aspects of a transition from ICEVs to PHEVs in the Californian
market. At first, the major stakeholders of a PHEV introduction are identified and their key interests
explained. Next, the current legal incentives to promote low emission vehicles in California are described
before potential new incentives to increase and expedite PHEV market penetration are presented. La
the manufacturers’ strategies to overcome the challenge of governmental regulations are described and
a potential marketing strategy to promote PHEVs is developed.
At first, the various groups that are likely to affect or to be affected by a PHEV introduction in the greater
LA area are identified. Manufacturers, consumers, the utilities, banks and car dealers in LA as well as the
Californian government will influence how fast and to which extent PHEVs will penetrate the market. The
following figure illustrates the different stakeholders and lists some of their major concerns related to
Figure 25 - Stakeholders of the PHEV Implementation
car manufacturers face new challenges in the Californian market. The
introduction of Assembly Bill 32, the Global Warming Solutions Act of 2006, sets reduction targets for
greenhouse gas emission until 2020. This will be further discussed in the next sections. Each car
ceed defined average GHG emissions of all cars sold in a specific year. The
emission limits decrease every year from 2010 to 2020. Therefore manufactures will have to introduce
new technologies to lower the average emissions of their sales fleet or introduce smaller cars with
smaller engines to fulfill the requirements. In this context and due to the fact that California has the
highest Hybrid penetration of all US states, PHEVs are a business opportunity for the Californian market.
re attractive for consumers and competitive to the ICEVs, car manufacturers
might need to cooperate in research and development of production processes and for the battery
technology to reduce the initial cost difference of PHEVs and ICEVs.
Page | 75
The next section discusses the business aspects of a transition from ICEVs to PHEVs in the Californian
ntroduction are identified and their key interests
explained. Next, the current legal incentives to promote low emission vehicles in California are described
before potential new incentives to increase and expedite PHEV market penetration are presented. Later,
the manufacturers’ strategies to overcome the challenge of governmental regulations are described and
fected by a PHEV introduction in the greater
LA area are identified. Manufacturers, consumers, the utilities, banks and car dealers in LA as well as the
Californian government will influence how fast and to which extent PHEVs will penetrate the market. The
following figure illustrates the different stakeholders and lists some of their major concerns related to
s in the Californian market. The
introduction of Assembly Bill 32, the Global Warming Solutions Act of 2006, sets reduction targets for
greenhouse gas emission until 2020. This will be further discussed in the next sections. Each car
ceed defined average GHG emissions of all cars sold in a specific year. The
emission limits decrease every year from 2010 to 2020. Therefore manufactures will have to introduce
ce smaller cars with
smaller engines to fulfill the requirements. In this context and due to the fact that California has the
highest Hybrid penetration of all US states, PHEVs are a business opportunity for the Californian market.
re attractive for consumers and competitive to the ICEVs, car manufacturers
might need to cooperate in research and development of production processes and for the battery

Page | 76
A PHEV introduction would give consumers the choice to pay extra for an environmentally friendly
solution of private transportation. Smog and noise pollution can be reduced by PHEVs which would
positively affect health issues in the region. In addition, the lower operating costs of the PHEVs make
them attractive for consumers who exceed a certain amount of miles driven over the lifetime of the car.
Furthermore, it can be assumed that the battery technology is not mature and that batteries will become
cheaper, lighter and or have more capacity after further years of research. Therefore the PHEVs might
become attractive from a cost perspective in a few years.
As discussed earlier, a PHEV penetration in the Californian market would affect the utility companies in
the region as the energy demand as well as the potential for renewable energy would increase. Oil
companies might try to oppose a PHEV introduction and influence other stakeholders such as the
government and the consumers.
Payment plans and leasing options can give PHEVs an advantage in their competition with ICEVs, as
PHEVs require a higher initial payment with the advantage of lower operation costs throughout the
lifetime of the car. For that reason financial service packages around the PHEV can become an
interesting market for banks and car dealers.
The Californian government is a key stakeholder of a potential PHEV introduction as they have a high
power of influence and a high interest in the technology as opportunity to reduce green house gas
emissions. The next two chapters will discuss in detail which current incentives are in place in California
and which potential initiatives can be undertaken by the government to increase and expedite PHEV
penetration in the market.
9.2 Current Initiatives to Promote PHEVs
The Californian government promotes PHEVs through passing legal regulations for the car manufacturers
as well as offering various benefits for PHEV users. In order to meet California's air quality standards and
greenhouse gas emission reduction goals as well as to reduce the dependence on foreign oil, a
transformation away from petroleum is required.116 The following incentives are either fully
implemented or in the process of implementation in the greater LA area: Climate change program
(AB32), zero emission vehicle (ZEV) program, carpool lane/HOV lane access for PHEVs, environmental
performance label as well as tax credit given to the consumers when they purchase PHEVs.
9.2.1 Climate Change Program - AB32
In 2006, the Legislature passed the Global Warming Solution Act of 2006 to set greenhouse gas emission
reduction goals through 2020. This act helped the California Air Resources Board (CARB) begin
developing actions to reduce greenhouse gases while also prepared a roadmap to illustrate the series of
implementation steps in order to accomplish the ambitious 2020 limit, as indicated in the act.117 The first
reduction target is set for 2011. The overall goal of AB32 is to reduce GHGs to 1990 levels by 2020. After
116 (California Government, Nov. 2010) 117 (Schwarzenegger, Dec. 2008)

Page | 77
that, California’s goal is a reduction of 80 percent from 1990 levels by 2050.118 In addition, the board
approved the 2020 emission limit of 427 million metric tons of carbon dioxide equivalent of greenhouse
gases.
9.2.2 Zero Emission Vehicle
CARB has been a frontrunner in developing programs to reduce emissions from vehicles. They have
adopted a new approach to passenger vehicles by combining the control of smog-causing pollutants and
greenhouse gas emissions into a single coordinated package of standards. The new approach also
includes efforts to support and accelerate the numbers of - zero-emission vehicles in California (PHEVs is
one kind of such vehicles). The zero emissions vehicle regulation requires large volume and intermediate
volume manufacturers to introduce and operate a certain percentage of zero emissions vehicles in
California, including PHEVs with almost zero emissions
9.2.3 Carpool lane/HOV Lane Access and Free Parking
California Governor Arnold Schwarzenegger signed a bill (SB 535) that extends HOV-lane access to
40,000 miles and allows plug-in hybrid vehicles to use these lanes starting in 2012.119 In addition, PHEV
owners have the privilege to park for free in some areas of LA.
9.2.4 Environmental Performance Label
Since 1998, all new cars sold in California need to have a Smog Index Label. The label is intended to help
consumers compare the smog forming emissions from different vehicles. Assembly Bill 1229120 signed
into law in 2005 required the ARB to redesign the Smog Index Label to include information about
emissions of global warming emissions. The Environmental Performance (EP) Label was approved by the
Board in 2007 and has to be shown in the window of every new car sold in California that was
manufactured after January 1, 2009. The new EP Label includes both a Smog Score and a Global
Warming Score, both range from 1 to 10, with 10 being the score of the cleanest vehicles in both smog
and greenhouse emissions and 1 being the score of the dirtiest vehicles.121 The environmental
performance label helps to raise awareness of the customer and allows vehicle comparison by their
emissions and effect on global warming.
9.2.5 Tax credit
The Clean Vehicle Rebate Project (CVRP), funded with a total of $4.1 million by CARB, was established in
order to promote the production and use of zero-emission vehicles such as plug-in electric and fuel cell
vehicles. The program was created from Assembly Bill 118 that was signed in October 2007. The funding
will be provided on a first-come, first-served basis, and the project is expected to go through 2015.
Eligible vehicles include only new CARB-certified or approved zero-emission or plug-in hybrid electric
118 (California Air Resource Board, Sep. 2010) 119 (Jay Friedland, Jan. 2010) 120 (California Government, Oct. 2005) 121 (Mary D. Nichols, Sep. 2010)

Page | 78
vehicles. Vehicles must be purchased or leased on or after March 15, 2010. Rebates of up to $5,000122
per light-duty vehicle are available for individuals and business owners who purchase or lease new
eligible vehicles. Certain zero-emission commercial vehicles are also eligible for rebates of up to $20,000.
The base credit is $2,500, plus $417 for a base 5 kilowatt pack, plus an extra $417 for each kilowatt of
capacity over that (up to 16). The government offers up to $7500 tax credit for PHEV depending on the
size of the battery package.
9.3 Potential Initiatives of the California Government to Promote PHEVs
Current incentives in the United States and California are mostly in form of financial advantages. While
this is effective, and raises awareness, there are several drawbacks of the financial incentives as they
cause revenue losses for the government and trigger opposition from individuals and organizations. They
argue that especially during the economic crisis, the cost of financial incentives to promote low emission
vehicles do not outweigh the benefits. Therefore service based incentives can complement the current
financial incentives which should be used only to initially increase the PHEV market share.
Service based incentives draw attention from the general public. By watching PHEV owners getting
benefits from PHEVs, it increases people’s desire in wanting to own a product like it, thus increase the
likelihood of them purchasing one.
The government could pass laws or regulations to enforce service-based incentives from private
organizations, such as entertainment facilities like Broadways, Six Flags, Disney World, etc. Public
entertainment facilities would have to dedicate specific ticket booths to PHEV owners. The government
could require similar prioritizations to car wash companies, auto shops, dealers, etc.
These incentives are non-monetary-based and could be applied more ubiquitously throughout the
public. Service-based incentive implementations do only incur negligible financial losses to both the
government and private organizations.
Another potential initiative to enhance PHEV awareness and market penetration is to gradually replace
government ICEV fleets with PHEVs. For instance, police PEHVs would draw attention from the public. By
transitioning the police fleets to PHEVs, it shows the trust of the government in the new technology
which could help to convince the general public of PHEVs. This transition does not only apply to police
fleets but also to ambulances and fire truck fleets. Furthermore, vehicles of politicians and other officials
could also be replaced by PHEVs.
9.4 Manufacturers Strategies
9.4.1 Current Strategies and Upcoming Challenges
With reference to Table 18 the emission limits will be challenging to satisfy in the second half of this
decade. The main strategy of the manufacturers is to impose US customers the European way of thinking
122 (Center for Sustainable Energy California, 2010)

Page | 79
about cars, which is “smaller vehicles with smaller engines”.123 However it is questionable whether the
US customers will adopt this idea. Another shortcoming of this strategy is the customers’ tendency to
drive more miles per year if their vehicles become more efficient. Figure 26 shows that while the fuel use
per capita has stayed constant, the miles traveled per capita continuously increased.
Figure 26 - Per Capita Annual Fuel Use and Miles Traveled(Davis, 2009)
This shows that as the IC engine became more efficient in terms of gas consumption, the people started
to travel more. It can be seen that increasing the efficiency of IC engines did not actually decrease the
overall emissions. Although the situation doesn’t affect the manufacturers directly, it makes it harder for
the government to accomplish the overall emission targets. Consequently, especially for the California
region which aims to reach the AB 32 target, increasing efficiency of the IC engine doesn’t contribute to
the emission reductions significantly. Therefore it would be better to focus on other strategies, such as
the introduction of PHEVs to the fleets.
The companies which are planning to introduce PHEVs’ to their fleets will be able to offer larger and
heavier cars while satisfying the regulations because the PHEVs will lower the average fleet GHG
emission levels. Moreover the introduction of PHEVs such as the Ford Escape to the California market
proved that the PHEV technology is capable of offering larger and heavier vehicles. Consequently,
besides promoting smaller cars, different type of PHEVs can be included in the fleets and the customers
can continue to enjoy the advantages of larger cars while not polluting the environment.
123 (White, 2010)
0
1,000
2,000
3,000
4,000
5,000
6,000
7,000
8,000
9,000
10,000
0
50
100
150
200
250
300
350
400
450
500
Mil
es
Tra
ve
led
pe
r C
ap
ita
(M
ile
s)
Fue
l U
se p
er
Ca
pit
a (
Ga
llo
ns)
Per Capita Annual Fuel Use and Miles Traveled
Fuel Used per Capita Miles Traveled per Capita

Page | 80
9.4.2 Potential Strategies in the 4 P Marketing Framework
A recent survey has shown that the majority of new vehicle buyers have little to no familiarity with the
idea of a PHEV.124 To ensure a successful PHEV transition, it is imperative for the manufacturers, dealers,
and commercial companies to apply various marketing strategies to appeal to consumers. While the
government can only offer external incentives for driving a PHEV and penalties/additional liabilities for
not driving them, the manufacturers’ marketing campaign can alter the consumers’ perception of PHEVs
and hence create the internal drive to purchase them.
The following paragraphs describe possible strategies for the manufacturer to promote PHEVs based on
the Marketing Mix, or more commonly known as 4 P’s. The term was popularized by Neil Borden and
later simplified by E. Jerome McCarthy.125 The concept consists of 4 variables that are used for marketing
management: Product, Price, Promotion, and Place. These variables are internal elements that can be
controlled by marketing managers in order to satisfy a targeted market.126 “Product” relates to
function, quality, appearance, packaging, service, and other aspects related to the product (or service)
sold to the targeted customers. “Price” covers list price to customers, pricing policies and segmentation
(e.g. for revenue management purposes), customer payment options (e.g. full payment, finance, lease,
etc) and payment methods (e.g. cash, credit cards, etc). “Place” is associated with channel of distribution
and the supply chain decisions. “Promotion” involves decisions related to advertisement and its media,
public relations, promotions and budget to perform those activities.127 Due to their nature, price and
promotion decisions can be implemented quickly, while place and product decisions require more time
to implement.
Figure 27 shows an overview of a 4 P marketing framework for manufacturers to promote PHEVs in
California.
124 (Axsen & Kurani, 2008) 125 (NetMBA Business Knowledge Center, 2010) 126 (QuickMBA, 2010) 127 (Borden, 1984)

Page | 81
Figure 27 - Four P Marketing Framework
9.4.2.1 Product
9.4.2.1.1 Luxury PHEV
While Chevrolet has been launched this year, along with the existing Chinese model BYD Auto F3DM,
most PHEVs in progress are targeted to mass market segments. Toyota, Volvo, Volkswagen, Ford,
Hyundai, Kia, and specialty manufacturers are launching at least one PHEV model in the next 5 years128.
In addition to the mass market there is an opportunity to target luxury segments with PHEVs. Upper class
consumers are less price-sensitive and they are more likely to purchase premium luxury PHEVs. Using
hybrid as a model, Hybrid Car Sales statistics129 showed that luxury hybrids, such as the Lexus RX450h,
count for 10% of total hybrid vehicle sales.
Indeed, Audi, BMW, Lexus and Mercedes already have some models in development, but there are other
brands who haven’t considered PHEVs: Acura, Infiniti, Maserati, and Jaguar among others. Increasing
model variety for upper class segment may trigger more sales as customers who are brand loyal can
purchase a PHEV from their favorite manufacturer.
9.4.2.1.2 SUV PHEV
Using similar argument, there is an opportunity to target SUV aficionados. With the increasing popularity
of the SUVs’ (Sport Utility Vehicle) the vehicle profile in the US roads has changed dramatically. Figure 28
shows the increase in the light truck sales during the last three decades.
128 (Plug In America, 2010) 129 (Hybrid Cars, 2010)

Page | 82
Figure 28 - Sales Trucks vs. Passenger Cars(Davis, 2009)
Many heavy vehicles having off-road capabilities are only driven in urban areas. A significant amount of
four by fours is only used in daily routine activities that can also be done by regular passenger cars. SUVs
create an extra amount of carbon dioxide emission, as they are relatively heavier and less efficient
compared to regular passenger cars. This extra portion of emission can be referred to as “luxury carbon
emissions”. Although the California government has introduced strict emission caps for the vehicles,
SUVs are included in the light truck category and the emission constraints for these vehicles are less
strict than those for other passenger cars which are illustrated in Table 18.
0.0%10.0%20.0%30.0%40.0%50.0%60.0%70.0%80.0%90.0%
% Sales of Cars vs. Light Trucks
% Car Sales

Page | 83
4,000 mile Durability Vehicle Basis
Model Year Fleet Average Greenhouse Gas Emissions
(grams per mile CO2-equivalent)
All Passenger Cars and
Light Duty Trucks from 0-
3750 lbs.
Light Duty Trucks from
3751 lbs. and Medium-
Duty Passenger Vehicles
2009 323 439
2010 301 420
2011 267 390
2012 233 361
2013 227 355
2014 222 350
2015 205 332
2016+ 205 332
Table 18 - Fleet Average Greenhouse Gas Exhaust Mass Emission Requirements (California Air Resource Board, 2010)
According to the trend shown in Figure 28 SUVs will continue to play an important role in private
transportation. The luxury carbon emission problem can be tackled with the introduction of SUV PHEVs
to the market. Currently, there are 4 SUV PHEV models in development/pilot phase: Saturn Vue, Ford
Escape, Mitsubishi PX-MiEV, and Velozzi SOLO130. The news is promising for the concept of SUV PHEV;
Ford has introduced to the California market 20 plug-in hybrid Escapes, offering 30 electric only miles.
The later versions will be developed according to the feedbacks from these current models131.
To support the “Luxury carbon emission” argument, further research should be done on estimating the
amount of GHG emitted by using SUVs in daily activities instead of a standard passenger car. With a
consumer survey, the number of SUV drivers who never go off-road can be determined. Considering the
difference in the average exhaust emissions between the SUVs and passenger cars the amount or ratio
of “luxury carbon emission” can be calculated for a specific region.
9.4.2.1.3 Solar Panel Rooftop
There is also a proposed idea to study the feasibility of installing solar panel rooftops on PHEVs. This will
make the operational costs less expensive since consumers would have to purchase less electricity from
130 (Plug In America, 2010) 131 (Bianco, 2007)
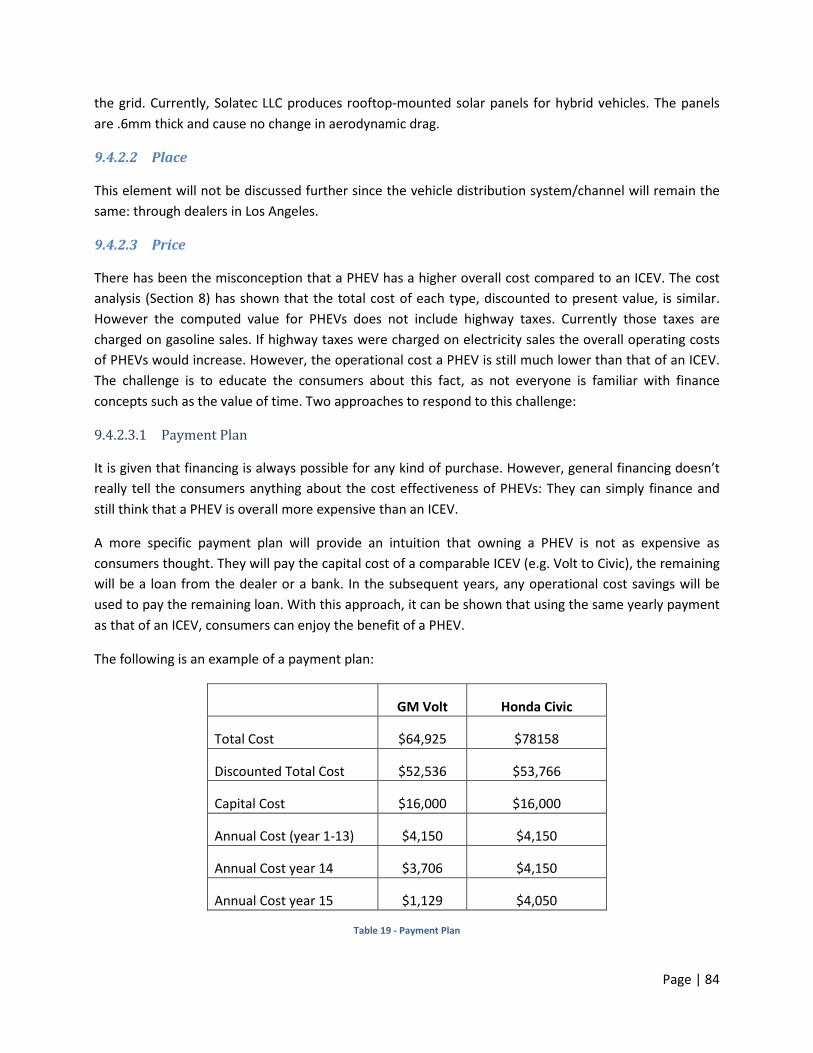
Page | 84
the grid. Currently, Solatec LLC produces rooftop-mounted solar panels for hybrid vehicles. The panels
are .6mm thick and cause no change in aerodynamic drag.
9.4.2.2 Place
This element will not be discussed further since the vehicle distribution system/channel will remain the
same: through dealers in Los Angeles.
9.4.2.3 Price
There has been the misconception that a PHEV has a higher overall cost compared to an ICEV. The cost
analysis (Section 8) has shown that the total cost of each type, discounted to present value, is similar.
However the computed value for PHEVs does not include highway taxes. Currently those taxes are
charged on gasoline sales. If highway taxes were charged on electricity sales the overall operating costs
of PHEVs would increase. However, the operational cost a PHEV is still much lower than that of an ICEV.
The challenge is to educate the consumers about this fact, as not everyone is familiar with finance
concepts such as the value of time. Two approaches to respond to this challenge:
9.4.2.3.1 Payment Plan
It is given that financing is always possible for any kind of purchase. However, general financing doesn’t
really tell the consumers anything about the cost effectiveness of PHEVs: They can simply finance and
still think that a PHEV is overall more expensive than an ICEV.
A more specific payment plan will provide an intuition that owning a PHEV is not as expensive as
consumers thought. They will pay the capital cost of a comparable ICEV (e.g. Volt to Civic), the remaining
will be a loan from the dealer or a bank. In the subsequent years, any operational cost savings will be
used to pay the remaining loan. With this approach, it can be shown that using the same yearly payment
as that of an ICEV, consumers can enjoy the benefit of a PHEV.
The following is an example of a payment plan:
GM Volt Honda Civic
Total Cost $64,925 $78158
Discounted Total Cost $52,536 $53,766
Capital Cost $16,000 $16,000
Annual Cost (year 1-13) $4,150 $4,150
Annual Cost year 14 $3,706 $4,150
Annual Cost year 15 $1,129 $4,050
Table 19 - Payment Plan

Page | 85
Volt potential buyers will be presented this payment plan where they only have to pay the price of the
Honda Civic ($16,000), and take a loan for the difference. Each year, they will have to pay the usual
operating cost (electricity, gas, service). The lender will calculate that year’s operating cost if it were a
Honda civic ($4,150), and have the owner pay the savings as the loan payment ($4,150 – Volt operating
cost). This is more intuitive for consumers who lack financial literacy because they can immediately see
that owning a Volt is not so much different than owning a Civic.
9.4.2.3.2 Battery/vehicle leasing
Dealers and independent auto shops can also lease PHEVs or the battery, and offer options to purchase
them at the end of the lease term. This option is also especially useful for consumers who are interested
in driving PHEV but are not ready for a total commitment to the transition.
9.4.2.4 Promotion
9.4.2.4.1 PHEV Promotional Values
Branding, or brand equity, is a logo that identifies a product or service. A well-known brand attached to a
product/service can add a significant value to the customers, even if other aspects of the product/service
are similar to the non-branded ones. Brand equity is an intangible asset and it may require significant
financial resource to create.132 It is important for the manufacturers (and possibly the government) to
have a join PHEV-branding campaign to promote PHEV as a preferable lifestyle. Driving SUVs, for
example, is highly regarded because it is associated with toughness or strength. It is imperative to
promote PHEV’s forte and embed these to consumers’ mind. The following paragraphs discuss PHEV
values to be promoted to consumers.
One example is to emphasize the value of environmental protection and anti-pollution and make it as
the value people remember when they hear the word “PHEV”. Car manufacturers have to launch a
strong marketing campaign that shows how owning an ICEV destroys the world and causes various
human health problems. Until today, none of the manufacturers is doing so due to the following reasons:
i. They don’t sell PHEVs and it does not make sense and might hurt their car sales to discourage
consumers to buy ICEVs.
ii. They sell PHEVs but the campaign might cause the consumers to turn to other brands who are
not conveying the same message. This is due to the perception that these manufacturers are
focusing on its PHEVs and therefore compromising their ICEV qualities.
Based on these problems, it is clear that to have a strong national PHEV brand, the majority of
manufacturers (that constitute 80% of market share or more) have to have PHEV models. They also have
to agree on launching the campaign together, which is something that might not occur without a
government’s push.
Another value is the minimum noise pollution of the PHEVs. A marketing campaign can emphasize how
loud engine noise causes discomfort to drivers, passengers and other people. This value can be sold to
132 (NetMBA, 2010)

Page | 86
consumers with family and consumers who drive luxury cars. Since PHEVs do not produce any noticeable
sound during operation, it is also predicted that companies and users will create software that allows
PHEV owners to change the sound of their cars.
There is also a value of safety due to the fact that PHEVs have two parallel propulsion systems.
Combustion engine breakdown on the interstate highway is not an issue for PHEVs, neither is an electric
motor malfunction. This value is especially important for long-range drivers, travelers, and consumers
who drive to locations where the infrastructure level is below average. One of the consumers’ concerns
after the launch of GM Volt is the scarcity of non-residential charging stations. This is an opportunity for
commercial locations (e.g. restaurants, malls, beauty salon, supermarkets, dealers, etc) to provide
charging stations to their customers. This service also means special parking spots, which is an additional
incentive to the consumers especially during busy hours where parking spots are hard to find. On the
downside, ICEV drivers might resent this.
Although the electricity supply in the United States is relatively reliable compared to the other countries,
power shortages do occur occasionally. According to the historical data, there have been 92 outages in
US, between the years 2001-2005 affecting 50,000 or more customers in US. This number doesn’t
include small scale shortages that affect less than 50,000 customers133 . Additionally, over-relying on the
electricity supply may cause vulnerability in case of an extraordinary power shortage. With a large
battery having a 16kWh storage capacity, PHEVs’ can protect their owners from these kinds of situations.
The average power requirement of a house is 1kW, however this is not constant and changes during the
day and varies according to season. Assuming a power demand of 2kW a PHEV battery could supply a
house for around 8 hours. According to statistics of the Center for Risk and Economic Analysis of
Terrorism Events134, three fourths of the power outages in the US are caused by either equipment failure
or extreme weather conditions. The average expected duration of a shortage is around 5 and 27 hours
for equipment failures and extreme weather conditions respectively. Accordingly the PHEV battery has
enough storage to protect the customer from a power outage caused by an equipment failure in most
cases. For longer outages the inhabitants can reduce their electricity consumption during the shortage to
make sure that they will have electricity until the system is recovered.
9.4.2.4.2 Promotion Channels
Advertising
Related to some concepts discussed previously, the following are some ideas that can be incorporated to
television commercials and print advertisement:
a. Due to its battery, PHEV can be used as a portable power generator so that it can power outdoor
activities such as barbequing, lighting up outdoor activities such as playing basketball outdoor at
night, etc. This opportunities brought by PHEVs can be displayed in the commercials.
b. A simple advertisement that shows the quietness of the car, for instance sleeping children on the
back seat and whispering parents in the front.
133 (Amin, 2010) 134 (Center for Risk and Economic Analysis of Terrorism Events, 2005)

Page | 87
c. A split screen that shows two gas stations. The first screen shows how often an ICEV have to fill
out their gas tank, while the other screen shows how rarely a PHEV does so.
d. A TV commercial could show a group of friends driving to the beach in a PHEV. They decide to
share fuel costs and each give a penny to the driver.
e. Another idea of a potential commercial to attract young drivers and brand the name PHEV to be
“cool” would be the following: A group of people having a house party. A “nerdy” looking guy
stands in the corner and is ignored by all the girls. Suddenly, the power shuts down, lights go off
and the music is out. Everyone is annoyed as the party seems to be over when the guy from the
corner says:”Hey! I have a PHEV! Let me connect my car to the house grid!” The car is quickly
connected to the grid and the party continues. The “nerdy guy” becomes the attraction of the
party being surrounded by a group of girls.
f. Similarly, one screen can show how cars behave according to gas price on a gas station. The
other screen shows the stability of electricity price on a day-to-day basis and how PHEV drivers
don’t have to worry about price fluctuation.
g. In particular in the LA region celebrities driving a PHEV could be shown on billboards and in
commercials to raise public awareness and support the idea of emission-free private
transportation.
Public relations
Since PHEV is a new technology, of which consumers might not be familiar, it is crucial for car
manufacturers to have a bi-directional promotion strategy where consumers can easily inquire for more
information. There is detailed information, such as total ownership cost of PHEV, energy efficiency and
environmental benefits of PHEV among others that are difficult to convey through a simple television
advertisement. An effective way to educate the consumers is to have mini-seminars in shopping centers
and other public places. Car manufacturers can also show their PHEV models in public institutions and
locations and let consumers to test-drive the unit while representatives can fill them in with relevant
information.

Page | 88
10 CONCLUSION
The following key conclusions can be determined from the analysis of this project:
• The semi-quantitative life-cycle analysis, presented in section 4, showed that when compared
with ICEVs, the PHEVs have less impact on both the environment and on society.
• The research presented in section 6 showed that;
o The current LA infrastructure is already capable of handling a transition to a PHEV
market.
o PHEVs are highly compatible with wind generation due to similarities in hourly demand
and supply patterns, with both having peaks during the night.
o The high storage capacity of PHEV batteries allow for the possibility of a vehicle-to-grid
system that can help mitigate supply intermittency; is one of the key challenges
associated with wind power.
• The cost analysis showed that the initial cost of a PHEV is significantly higher than the ICEV but
over a perspective lifetime, this cost is compensated for via lower running costs.
• As PHEV is a relatively new concept, it allows diverse innovative ideas to be raised, in terms of
marketing. Aside from the primary benefits of PHEV technology, the large battery capacity in
particular may provide concurrent advantages such as vehicle to house electric supply.
The cost analysis shows that although PHEV is a new and developing technology, it is still comparable
with the ICEV technology, which has been developing for more than a hundred years. This shows that it
is likely that PHEV technology will be remarkably more competitive than ICEVs in the following century
and will dominate the market if no other more feasible technology arises.
The penetration model was successfully able to demonstrate how PHEVs may be able to fit into the
current demand/supply relationships in LA. Where some assumptions have been made and the final
outcome can only be considered theoretical at this time due to implications in charging access points,
transmission limitations etc, it is important to take note that the overall findings strongly concur with the
ability for a wide scale PHEV market penetration. The model was constructed in such a way that it can
easily be adapted to other regions for analysis of their potential penetration by varying the inputs to as
per their own situation.
For a successful evolution into a PHEV market, it is vital for all stakeholders to become involved in the
transition process. Consumer awareness of the PHEV must be developed in order for the sales to
increase. Even though the technology is feasible and the infrastructure is able to support a substantial
penetration, it will not succeed unless the customer is made aware of the benefits and is given enough
incentives in order to justify the potential risks associated with such a new technology.

Page | 89
11 RECOMMENDED TOPICS FOR FURTHER STUDY
The analysis resulting from this project can be used as a foundation for further studies relating to PHEVs,
their implications for electricity infrastructure, and their business feasibility. Below are some example
topics that future project teams may be interested in pursuing:
• Quantify the need for public and commercial charging stations. Assess potential deployment
strategies, taking into consideration the number of stations needed, the types of charging
provided (i.e. voltage), potential locations, and the speed at which they should be introduced.
• Assess the case for using large park-and-ride facilities in major cities as potential sites for vehicle-
to-grid storage capability. PHEVs parked at such facilities would have very predictable V2G
potential.
• Quantify the marginal financial value that a hypothetical V2G system could provide to a utility
company, taking into consideration the increased capacity credits for renewables, the reduced
need for installed capacity, and the reduced need for competing services such as spinning
reserves, pumped storage, or demand response.
• Explore the various possible pricing models for sharing the value of V2G with the PHEV owner,
thus incentivizing PHEV ownership and participation in V2G.
• Research the logistics of operating a smart grid, identify the key parameters of a successful
system, and estimate the levels of consumer participation under various scenarios and
assumptions.
• Simulate an average 24-hour household electricity usage cycle combined with a PHEV, across
various seasons. Explore the role that a PHEV could play for a household that uses “off-the-grid”
electricity from small-scale wind or solar power.
• Obtain hourly solar and wind data for a focus region and simulate the effects of added V2G
storage capacity on an hourly basis, using techniques from the Engineering Management
Methods class.
• Quantify the total potential revenue losses for the government due to tax credits and financial
incentives to promote PHEVs
• Quantify the potential loss of tax revenue from gasoline taxes, due to PHEVs’ low gasoline
consumption. Assess alternative models for collecting taxes for road maintenance from PHEV
drivers.
• Analyze the case for introducing PHEVs into various government fleets as a way to stimulate
manufacture of PHEVs and raise public awareness.
• Perform a comparative assessment of PHEVs versus other low-emission vehicle technologies in
the context of vehicle manufacturers’ strategies for complying with AB32 targets.

Page | 90
12 BIBLIOGRAPHY
(n.d.). Retrieved from Toxco Inc: http://www.toxco.com/
(n.d.). Retrieved from Toxco Inc: www.toxco.com/docs/Toxco%20DOE.pdf
(n.d.). Retrieved from SAE International: http://www.sae.org/events/battery/
(n.d.). Retrieved from Red Orbit:
http://www.redorbit.com/news/business/1673470/fords_accelerated_battery_research_drives_develop
ment_of_vehicle_electrification_plans/
(n.d.). Retrieved from PR Newswire: http://www.prnewswire.com/news-releases/vehicle-battery-
researchers-manufacturers-to-meet-with-evphev-companies-in-shanghai-1-3-september-during-sae-
international-vehicle-battery-summit-97096184.html
(n.d.). Retrieved from Health and Safety Online Environment:
http://www.ehso.com/ehshome/batteries.php
(n.d.). Retrieved from Green Car Congress: http://www.greencarcongress.com/2009/11/actacell-
20091110.html
(n.d.). Retrieved from BYD: http://www.byd.com/buzz/media-reproduced/byd-builds-ev-battery-
production-base-in-huizhou/
(n.d.). Retrieved 09 17, 2010, from Better Place: www.betterplace.com
(n.d.). Retrieved from Argonne National Laboratory:
http://www.cmt.anl.gov/oldweb/Science_and_Technology/batteries/default.shtml
(n.d.). Retrieved from Argonne National Laboratory:
http://www.anl.gov/Media_Center/News/2009/news090603.html
(n.d.). Retrieved from A123 Systems: http://ir.a123systems.com/releasedetail.cfm?ReleaseID=437662
(n.d.). Retrieved from A123 Systems: http://ir.a123systems.com/releasedetail.cfm?ReleaseID=530830
(2005). 2005 Ford Escape Hybrid Electric Vehicle. HEV America, US Department of Energy Advanced
Vehicle Testing Activity.
Abuelsamid, S. (n.d.). Retrieved from Auto Blog Green: http://green.autoblog.com/2008/01/13/detroit-
2008-bricklin-and-electrovaya-team-on-phev-battery-syst/
Abuelsamid, S. (2009, January 28). Bolivia may hold the keys to lithium battery cars. Retrieved December
04, 2010, from Autoblog Green: http://green.autoblog.com/2009/01/28/bolivia-may-hold-the-keys-to-
lithium-battery-cars/

Page | 91
Abuelsamid, S. (2010, February 3rd). Toyota to test Prius PHEV in Oslo, Norway. Retrieved from autoblog
green: http://green.autoblog.com/2010/02/03/toyota-to-test-prius-phev-in-oslo-norway/
AFS trinity. (n.d.). Retrieved from http://afstrinity.com/
(2010-03-09). Alternative Fuel Vehicles(AFVs) and Hybrid Electric vehicle report. Alternative Fuels and
Advanced Vehicle Data Center.
Amin, D. M. (2010, October 8). TLI Blog. Retrieved December 5, 2010, from University of Minnesota
College of Science & Engineering: http://tli.umn.edu/blog/
Automotive Recyclers Association. (2006, 02 13). Facts About the North American Automotive Recycling
Industry. Retrieved 12 02, 2010, from Automotive Recyclers Association: http://www.a-r-
a.org/content.asp?contentid=436
Axsen, J., & Kurani, K. (2008). The Early US Market for PHEVs: Anticipating Consumer Awareness. Davis,
CA: Institute of Transportation Studies, University of California.
Axsen, J., Burke, A., & Kurani, K. (2008). Batteries for Plug-in Hybrid Electric Vehicles (PHEVs): Goals and
the State of Technology circa 2008. Davis, CA: Institute of Transportation Studies, University of California.
Benmar, C. (2010, May 28). Hidden Health Costs of Transportation. Retrieved December 3, 2010, from
Grist: http://www.grist.org/article/2010-05-28-hidden-health-costs-of-transportation/
Berman, B. (n.d.). Audi A1 E-Tron. Retrieved 12 6, 2010, from Plugincars: http://www.plugincars.com/a1-
audi-e-tron/review
Berman, B. (n.d.). Volvo V70 Plug-in Hybrid. Retrieved 12 6, 2010, from Plugincars:
http://www.plugincars.com/volvo-v70-plugin-hybrid/review
Bianco, S. (2007, December 4). autobloggreen. Retrieved December 5, 2010, from autoblog:
http://green.autoblog.com/2007/12/04/evs23-ford-hands-over-the-plug-in-escape-hybrid-to-sce
Borden, N. H. (1984). The Concept of the Marketing Mix. Journal of Advertising Research , 7-12.
California Air Resource Board. (2010). Retrieved Dec 17, 2010, from
http://www.arb.ca.gov/regact/2009/ghgpv09/ghg15dayattach1.pdf
California Air Resource Board. (Sep. 2010). Climate Change Scope Progress Report.
California Cars Initiative. (2009, September 22). The Ultimate Posting on Plug-In Hybrid Developments:
Clip & Save. Retrieved September 20, 2010, from CalCars: http://www.calcars.org/calcars-
news/1072.html
California Government. (Oct. 2005). Assembly Bill No.1229 Chapter 575. California Government.
California Government. (Nov. 2010). ZEV Regulation 2010. California Government.

Page | 92
Center for Risk and Economic Analysis of Terrorism Events. (2005). Statistical Analysis of Electric Power
Outages. Los Angeles, CA: University of Southern California.
Center for Sustainable Energy California. (2010). www.energycenter.org. Retrieved Dec. 17, 2010, from
https://energycenter.org/index.php/incentive-programs/clean-vehicle-rebate-project/cvrp-eligible-
vehicles
Chris Farmer, P. H. (2009). Modeling the Impact of Increasing PHEV Loads on the Distribution
Infrastructure. State College: Pennsylvania State University.
City of LA department of Water and Power. (2010). Retail Electric Sales and Demand Forecast. Los
Angleles.
Commute Solutions. (2010, November 2). The True Cost of Driving. Retrieved December 3, 2010, from
Commute Solutions: http://www.commutesolutions.org/calc.htm
Coperation, F. (2010). 2010 Ford Escape Hybrid-the most fuel efficient suv on the planet. Ford
Coporation.
County of Sonoma Green Transportation Alternatives. (2010, January 1). Toyato Prius Conversion to
PHEV Technology. Retrieved December 11, 2010, from County of Sonoma:
http://www.co.sonoma.ca.us/gs/pdf/laminated.pdf
Data, Analysis and Trends. (n.d.). Retrieved December 05, 2010, from US Department of Energy:
http://www.afdc.energy.gov/afdc/data/vehicles.html
Davis, S. a. (2009). Transportation Energy Data Book. Oak Ridge, TN: Oak Ridge National Laboratories.
Donate a Car 2 Charity. (2010, January 1). Car Donation in Los Angeles. Retrieved December 3, 2010,
from Donate a Car 2 Charity: http://www.donateacar2charity.com/losangeles-car-donation-
information.php?gclid=CLKU2IX29aQCFYdX2godTnPOiA.
Duvall, M. (2008). Plug-In Hybrids on the Horizon. EPRI Journal , 8-15.
EERE Network News. (2009, April 17). DOE to Award $10 Million for Plug-In Hybrid Electric School Buses.
Retrieved September 20, 2010, from US Department of Energy:
http://apps1.eere.energy.gov/news/news_detail.cfm/news_id=12463
EPA. (2008). 2008 Honda Civic. Retrieved 12 03, 2010, from US Environmental Protection Agency:
http://www.epa.gov/greenvehicles/Detailsresult.do?vehicle_ID=71136
Ford delivers E85 hybrid vehicles. (2007). GreenCar , 20-24.
Fossil Fuels - Coal, Oil and Natural Gas. (n.d.). Retrieved December 04, 2010, from Energy Story:
http://www.energyquest.ca.gov/story/chapter08.html
Gartner, J. (2007, February 16). PHEVs: Will the Grid Be Ready? Retrieved September 13, 2010, from
http://featured.mattemetwork.com/2007/2/plug-hybrids-will-power-grid.cfm

Page | 93
GE Energy Consulting, 2007. Intermittency Analysis Project: Impact of Intermittent Generation on
Operation of California Power Grid. California Energy Commission.
GM-Volt. (2010, July 28). Chevy Volt Pricing Analysis. Retrieved December 3, 2010, from GM-Volt:
http://gm-volt.com/2010/07/28/chevy-volt-pricing-analysis/
Goldberg, L. (n.d.). Hybrids On Steroids! Plug-In Hybrid Vehicle Technology Offers The Best Of Both Gas
And Electric Worlds. Retrieved September 13, 2010, from http://www.analogzone.com/grnrept22.htm
Graedel, T. E. (1998). Streamlined Life Cycle Assessment. Prentice Hall.
Green, H. (2009, 08 17). Li-ion battery recycling starts getting attention. Retrieved 12 01, 2010, from
Yahoo Green: http://green.yahoo.com/blog/ecogeek/1167/li-ion-battery-recycling-starts-getting-
attention.html
Halm, R. (1975). Patent No. 3,979,822. Esslingen, Germany.
Hokin, S. (n.d.). Transmission Lines. Retrieved 12 03, 2010, from BSharp:
http://www.bsharp.org/physics/transmission
Honda. (2010, January 1). Accord Sedan. Retrieved December 3, 2010, from Honda:
http://automobiles.honda.com/accord%2Dsedan/
Hoste, G., Dvorak, M., & Jacobson, M. (2009). Matching Hourly and Peak Demand by Combining Different
Renewable Energy Sources: A case study for California in 2020. San Francisco: Stanford University.
Hybrid Cars. (2010). Retrieved from http://www.hybridcars.com/hybrid-clean-diesel-sales-dashboard/
Hybrid Cars. (2009, January 7). Consumer Reports Questions Plug-In Practicality. Retrieved December 2,
2010, from Hybrid Cars: http://www.hybridcars.com/news/consumer-reports-questions-plug-
practicality-25392.html
Hybrid Cars. (2010, January 20). December 2009 Dashboard: Year-End Tally. Retrieved December 2, 2010,
from Hybrid Cars: http://www.hybridcars.com/hybrid-sales-dashboard/december-2009-dashboard.html
Incentives for EV & HEV. (2003, Oct). Retrieved September 20, 2010, from Electric Vehicle Association of
Asia Pacific: http://www.evaap.org/pdf/incentive.pdf
Internal Revenue Service. (2009, November 30). New Qualified Plug-in Electric Drive Motor Vehicle
Credit. Retrieved December 3, 2010, from Internal Revenue Service: http://www.irs.gov/irb/2009-
48_IRB/ar09.html
International Council on Clean Transportation. (n.d.). Retrieved 12 6, 2010, from icct:
http://www.theicct.org/2010/04/ghg-fe-standards-update/
IRS. (2009, June 3). Energy Provisions of the American Recovery and Reinvestment Act of 2009. Retrieved
September 20, 2010, from IRS.gov: http://www.irs.gov/newsroom/article/0,,id=206871,00.html

Page | 94
Jay Friedland, L. D. (Jan. 2010). California To Extend HOV Access To Up To 40,000 PHEVs. Green Car
Congress.
Jim Lazar, J. J. (2008). Plug-In Hybrid Vehicles, Wind Power, and the Smart Grid. EUEC Energy and
Environment Conference. Tucson: EUEC.
Johnson, C. (2010, 11 19). Physics In an Automotive Engine. Retrieved 12 03, 2010, from http://mb-
soft.com/public2/engine.html
Jungst, R. G. (1999). Recycling of Advanced Batteries for Electric Vehicles. Albuquerque: Sandia National
Laboratories.
Kevin Morrow, D. K. (2008). Plug-in Hybrid Electric Vehicle Charging Infrastructure Review. Idaho: U.S.
Department of Energy.
Korthof, D. (n.d.). Zero Emission Vehicle (ZEV): NO tailpipe emissions. Retrieved September 20, 2010,
from Driving the future: http://drivingthefuture.com/zevhist.htm
Laboratory, N. R. (2008). Determining the Capacity Value of Wind. WindPower Conference. Houston.
Languell, B. (2010). Scoping plan AB32, Vol II. Los Angeles: Air Resource Board.
Longley, R. (2008, January 25). DOE to Invest $30 Million in Hybrid Car Development. Retrieved
September 20, 2010, from US Government Info: http://usgovinfo.about.com/b/2008/01/25/doe-to-
invest-30-million-in-hybrid-car-development.htm
Los Angeles Alliance for a New Economy. (2009, September 22). Los Angeles on the Edge, Part I: An
Analysis of Health and Income. Retrieved December 1, 2010, from Los Angeles Alliance for a New
Economy: http://www.laane.org/downloads/LosAngelesontheEdgeI.pdf
Los Angeles Department of Transportation. (2009, December 1). The City of Los Angeles Transportation
Profile 2009. Retrieved December 2, 2010, from Los Angeles Department of Transportation:
http://www.ladot.lacity.org/pdf/PDF10.pdf
Los Angeles Department of Water & Power. (2009, July 1). Electric Rates, Residential Service. Retrieved
December 3, 2010, from Los Angeles Department of Water & Power:
http://www.ladwp.com/ladwp/cms/ladwp001710.jsp
Lotus Creates Hybrid R&D Center. (2008, February 22). Retrieved September 13, 2010, from Hybrid Cars:
http://www.hybridcars.com/news/lotus-commits-going-green.html
Mary D. Nichols, C. (Sep. 2010). proposed modification to criteria and greenhouse gas emission
requirement for light and medium duty vehicle. Air Resources Borad. EL Monte: Clifornia Environmental
Protection Agency.
More eye opening facts about the Chevy Volt. (2009, August). Retrieved from Climate Sanity:
http://climatesanity.wordpress.com/2009/08/18/more-eye-opening-facts-about-the-chevy-volt/

Page | 95
Motavalli, J. (2010, November 1). Plugged in. Retrieved December 6, 2010, from Bnet:
http://www.bnet.com/blog/electric-cars/better-place-rolls-out-bay-area-battery-swapping-ev-taxi-
fleet/2563
Motavelli, J. (2010, June 2). China to Subsidize Electric Cars and Hybrids. Retrieved September 20, 2010,
from The New York Times: http://wheels.blogs.nytimes.com/2010/06/02/china-to-start-pilot-program-
providing-subsidies-for-electric-cars-and-hybrids/
NetMBA. (2010). Retrieved from http://www.netmba.com/marketing/brand/equity/
NetMBA Business Knowledge Center. (2010). Retrieved Dec 17, 2010, from
http://www.netmba.com/marketing/mix
Nicole Davis, J. L. (n.d.). Mexico City. Retrieved 10 13, 2010, from International Sustainable Systems
Research: http://www.issrc.org/ive/downloads/reports/MexicoCityMexico.pdf
Nissan. (n.d.). Q & A charging. Retrieved December 6, 2010, from Nissanusa:
http://www.nissanusa.com/leaf-electric-car/faq/list/charging#/leaf-electric-car/faq/list/charging
Obama for America. (n.d.). Barack Obama and Joe Biden: New Energy for America. Retrieved September
20, 2010, from BarackObama.com:
http://www.barackobama.com/pdf/factsheet_energy_speech_080308.pdf
Pesaran, A. (2006, July 12). Battery Choices for Different Plug-in HEV Configurations. Retrieved December
5, 2010, from National Renewable Energy Laboratory: http://www.nrel.gov/docs/fy06osti/40378.pdf
Petroleum. (n.d.). Retrieved 12 04, 2010, from Spiritus Temporis: http://www.spiritus-
temporis.com/petroleum/extraction.html
Petroleum Refining. (2006, 10 19). Retrieved 12 02, 2010, from The Encyclopedia of Earth:
http://www.eoearth.org/article/Petroleum_refining
Pike Research. (2009, September 9). Consumer Interest in PHEVs in High - Survey. Retrieved December 2,
2010, from SustainableBusiness.com:
http://www.sustainablebusiness.com/index.cfm/go/news.display/id/18834
Plug In America. (2010). Retrieved Dec 17, 2010, from http://www.pluginamerica.org/vehicles
Plug-in Hybrid Batteries: Type Matters. (2007, March 20). Retrieved December 4, 2010, from Hybrid Cars:
http://www.hybridcars.com/plug-in-hybrids/phev-battery-types.html
Porsche Approves 918 Spyder Hybrid Supercar. (n.d.). Retrieved 12 6, 2010, from Hybrid Cars:
http://www.hybridcars.com/news/porsche-approves-918-spyder-hybrid-supercar-28313.html
Queen's Printer for Ontario. (n.d.). Ontario Paves The Way For Electric Vehicles. Retrieved September 20,
2010, from Ontario: http://www.news.ontario.ca/mto/en/2010/06/ontario-paves-the-way-for-electric-
vehicles.html

Page | 96
QuickMBA. (2010). Retrieved Dec 17, 2010, from http://www.quickmba.com/marketing/mix
Schwarzenegger, A. (Dec. 2008). Climate change scoping plan. California Air Resource Board.
Sorenson, P. (October, 2008 1). Moving Los Angeles. Retrieved December 2, 2010, from University of
California Transportation Center: http://www.uctc.net/access/35/access35_Moving_Los_Angeles.pdf
Stenquist, P. (2010). Cherolet Volt receives EPA ratings and label. Green Car Congress.
Sullivan, J., Salmeen, I., & Simon, C. (2009, July). PHEV Marketplace Penetration: An Agent Based
Simulation. University of Michigan Transportation Research Institute.
Tara, E., Shahidineja, S., Filizadeh, S., & Bibeau, E. (2010, July 6). Battery Storage Sizing in a Retrofitted
Plug-in Hybrid Electric Vehicle. IEEE Transactions on Vehicular Technology , p. 2789.
Taylor, J., & Van Doren, P. (2010, May 25). Plug-In Pablum. Retrieved December 2, 2010, from CATO
Institute: http://www.cato.org/pub_display.php?pub_id=12000
Tennessee Valley Authority. (n.d.). Technology Innovation. Retrieved December 6, 2010, from TVA:
http://www.tva.gov/environment/technology/car_infrastructure.htm
Thackeray, M. M., Thomas, J. O., & Whittingham, M. S. (2000). Science Applications and Mixed
Conductors for Lithium Batteries. MRS Bulletin.
Toyota Environmental, S. a. (2009, December 2). 2010 Prius Plug-in Hybrid Makes North American Debut
at Los Angeles Auto Show. Retrieved from Toyota Pressroom:
http://pressroom.toyota.com/pr/tms/toyota/2010-prius-plug-in-hybrid-makes-149402.aspx
U.S. Census Bureau. (2008, December 1). American Community Survey, Los Angeles County, California.
Retrieved December 2, 2010, from U.S. Census Bureau:
http://factfinder.census.gov/servlet/STTable?_bm=y&-qr_name=ACS_2008_1YR_G00_S0802&-
geo_id=05000US06037&-ds_name=ACS_2008_1YR_G00_&-_lang=en.
U.S. Department of Energy. (n.d.). Determining Electric Motor Laod and Efficiency. Retrieved 12 04, 2010,
from Motor Challenge: http://www1.eere.energy.gov/industry/bestpractices/pdfs/10097517.pdf
U.S. Department of Health and Human Services. (2009, March 19). Recovery Act - Electric Drive Vehicle
Battery and Component Manufacturing Initiative. Retrieved September 20, 2010, from Grants.gov:
http://www07.grants.gov/search/search.do;?oppId=46164&flag2006=false&mode=VIEW
U.S. Department of Transporation, Federal Highway Administration. (2000, May 1). 1997 Federal
Highway Cost Allocation Study. Retrieved December 3, 2010, from U.S. Department of Transporation,
Federal Highway Administration: http://www.fhwa.dot.gov/policy/hcas/addendum.htm
U.S. Energy Information Administration. (2009, December 9). Emissions of Greenhouse Gases Report.
Retrieved Decemeber 3, 2010, from U.S. Energy Information Administration:
http://www.eia.doe.gov/oiaf/1605/ggrpt/

Page | 97
UK Energy Research Centre. (2006). The Cost and Impact of Intermittency. London: Imperial College.
US Department of Energy. (2010). Transportation Energy Data Book. Retrieved December 10, 2010, from
US Department of Energy: http://www-cta.ornl.gov/data/tedb29/Edition29_Chapter03.pdf
White, J. B. (2010, May 26). Drivers Can Take a Tip From Europe: It's Fiesta Time. Retrieved December 5,
2010, from The Wall Street Journal:
http://online.wsj.com/article/SB10001424052748704026204575266382333854948.html
www.fueleconomy.gov. (2010, January 1). Fuel Economy Guide. Retrieved December 3, 2010, from
www.fueleconomy.gov: http://www.fueleconomy.gov/feg/findacar.htm
Yvkoff, L. (n.d.). Audi fleet testing A1 e-tron city car. Retrieved 12 6, 2010, from CNET Reviews:
http://reviews.cnet.com/8301-13746_7-20015965-48.html

Page | 98
APPENDIX I – MANAGEMENT REPORT
Midterm Management Report
Summary
The individual midterm management evaluations indicate that the team is working well together up to
this point, that the leadership and organizational structure has been effective, and that each team
member is acting in a professional, and responsible manner regarding assigned tasks. Most of the
midterm goals have been accomplished and several comments were made. Potential improvements
have been suggested in the evaluations that will be implemented in the coming weeks.
Initially the team was divided into two smaller teams – the PHEV team and the Infrastructure team. The
PHEV team is responsible for researching the technology itself while the infrastructure team is
responsible for researching a myriad of topics including the Grid, charging infrastructure, vehicle-to-grid
charging, generation capacity, integration of renewables, etc. Up until this point, this organizational
structure has been effective. Many team members commented that increased communication between
the two groups is necessary in the second half the project. Currently, each sub-team meets weekly and
develops a plan of action for the following week. Representatives from each sub-team meet with
Professor Vanek on a weekly basis to discuss results from the previous week and goals for the remainder
of the semester.
Several team members commented favorably on the use of Google Documents, Google Group, Doddle
Poll and Dropbox. These technologies have been very useful for a variety of purposes including
scheduling meetings and presentations and storing deliverables and documents from previous projects.
Dropbox is a new technology for the team and it will be used more frequently to store research, and
sources.
Generally, the team members appear to be aligned with regards to objectives, goals, deliverables and
schedule. Each person is doing their allotted work and is contributing their knowledge and expertise to
the greater team and project.
Potential Improvements
Potential improvements have been suggested regarding communication between the PHEV sub-team
and the Infrastructure sub-team; particularly as the team begins work on the transition study from an
ICEV market to a PHEV market in the Los Angeles region. Several team members have suggested creating
a liaison from each sub-team to attend the other sub-team’s weekly meetings. The liaison would be
responsible for summarizing the information and then reporting back to their own sub-team. This liaison
could either be an assigned position or a rotating position within each sub-team. The purpose of this role
would be to keep every team member informed of the activities of the group, ensure research is not
repeated and to be a point of contact for requests between the two sub-teams. This role will be
particularly important

Page | 99
Final Management Report
Several team members have indicated that that many of the issues raised during the midterm
management report have been appropriately addressed and the entire team has benefitted from the
implemented changes. All the final goals and deliverables have been met and submitted on time due to a
concerted team effort.
Initially the team was divided into two smaller teams – the PHEV team and the Infrastructure team. The
PHEV team was responsible for researching the technology itself while the infrastructure team was
responsible for researching a myriad of topics including the Grid, charging infrastructure, vehicle-to-grid
charging, generation capacity, integration of renewables, etc. In the last few weeks, a third sub-team, the
Business team, was created. This team was responsible for researching existing incentives for consumers
to purchase PHEVs as well as to brainstorm potential future incentives that could be put in place in order
to increase PHEV sales. The Business team was composed of members from the PHEV team as well as
the Infrastructure team. The composition of the Business team seemed to greatly benefit them and the
other two sub-teams had enough remaining members to be able to finish their respective research.
One of the issues raised in the midterm management report was in reference to communication
between the sub-teams. Immediately following the submission of the midterm management report,
liaisons from the sub-teams attended the other sub-teams’ weekly meetings. This idea was only carried
out for a few weeks due to the increasing number of weekly meetings. However, communication
between all sub-teams was deemed to be adequate and the liaisons were no longer necessary.
Following the midterm management report, Google Documents and Dropbox were particularly
important. While preparing the final presentation and final report, many edits were made and many
versions of each document were created. Dropbox was especially useful in managing those processes to
ensure that all of the necessary corrections were implemented and all team members had access to the
documents at all times.
One of the main challenges that the team faced throughout the semester was dealing with the large
number of team members. A massive organizational effort had to be put forth by the subteam leaders as
well as each team member in order to accomplish all of the required tasks.
Generally, the team members appear to be aligned with regards to objectives, goals, deliverables and
schedule. Each person is doing their allotted work and is contributing their knowledge and expertise to
the greater team and project.

Page | 100
APPENDIX II – REFLECTIONS
Adam Stevens
I was initially interested in this project as it appealed to my interest in renewables, future technologies
and also because it took the form of a feasibility study. I have career aims in such sectors and this project
gave me valuable experience in the problems which may be faced in real world situations. I feel that we
were initially hindered in some sense because of the generalness of the scope and there was some
confusion with both how we would structure the project, and what our final outcome would aim
towards. However, I think that as time and progress moved on, the team enjoyed this sense of
‘openness’ as it allowed use to move in the directions we wanted and we could put a higher level of
passion into the work.
We structured the team in an efficient manner that I felt worked exceedingly well, with eventually three
different subgroups. The teams at times had a slight lack in communication but this was of no real
determent to the final outcome. Each sub team had a clear understand of their aims and deliverables
and it portioned the work to be completed well I believe.
One major part of this project which I enjoyed was the coming together of many different backgrounds,
cultures and personalities. We all had to adjust to the ways in which others operated and in the end, the
differences are what made the team strong.
I feel that our final outcome was very pleasing and it allowed us to visualise how a PHEV penetration may
impact the grid, and also the lifestyles of the consumer. I think we correctly waited to divide the teams
into 3 for the business analysis as this firstly could only be completed once details were known, but also
it allowed for every member of the group to first gain an understanding of the situation and information.
The project will be a very good basic teaching to any further research into the area, and I feel proud of
this. There is much possibility to carry on with the business model or the infrastructure (transmission
lines in particularly) impact which may be caused. I would especially be interested in seeing any future
research into the V2G system and the smart grid applications.
Alice Yu
This project has definitely been one of the more positive group experiences of my Cornell career. The
team has enjoyed a very strong and healthy social dynamic, which has fostered good communication,
trust, and teamwork (not to mention making the project much more fun than it would’ve been
otherwise). It is also one of the largest and most diverse project groups I have been a member of, and
the challenge of managing such a group has been a great learning experience. The diversity of the group
has been a valuable asset, as many different viewpoints, strengths, and experiences are brought to the
table, and we have been able to depend on each other for support to cover any weaknesses we may
have as individuals.

Page | 101
When I compare this project with previous experiences that involved large groups, I see several key
factors by which this team distinguished itself, and which I consider to be central to success. These
factors are: individual engagement, communication, and flexibility.
I have worked in a number of teams of similar size; a frequent pattern is that 1-3 people are very strong-
willed and enthusiastic, and they end up providing most of the heavy lifting and research guidance while
everybody else plays a passive role. This was definitely not the case in this team; although there was
some variability in level of engagement, passive players were the exception rather than the rule. Most
people were engaged and proactive about framing the research, doing the work, and creating the
deliverables. I think this is well-illustrated in the way leadership and initiative has been spread out
among many people. We have a team leader, several sub-team leaders, and many task-specific
leadership roles such as final report manager.
Our good communication and flexibility has allowed the project to take maximum advantage of the
strong engagement of its individuals. A good example of this is the way in which we managed our sub-
team structure. There was a lot of discussion initially, and several possible structures were proposed.
Through this process, we realized that everybody was interested in business and transition, so we
decided to divide into two broader sub-teams that would both keep the business picture in mind during
research, with a plan to collaborate on the transition study later in the semester. When we reached this
point, our flexibility allowed a smooth transition from two sub-teams to three.
When I review my own personal goals for the project that I wrote at the beginning of the semester, I find
that all of them have been addressed in some form. My goals were grouped into three categories –
technical, professional, and interpersonal. In line with my technical goals, I have become much more
knowledgeable about PHEVs and can speak more confidently about the critical issues and strategic
challenges that are relevant. In line with my professional goals, I have improved my organizational and
management skills, particularly with respect to managing information and delegating tasks. In line with
my interpersonal goals, I have experienced good teamwork with this group and fostered personal
relationships that will continue after the project is over.
Auret Basson
The PHEV was a new concept to me at first, but I soon realized it is a possible way of transitioning into
the era of the electric car that people have been speculating about for many years now. I think the PHEV
has a very important role to play in our movement to a more sustainable world and it was very good to
get behind of the details of how it works and how we envisage it working for us. With the HEV’s getting
more and more popular it seems to be only a matter of time before all the main car manufactures will a
PHEV model in their catalogues.
I think being a part of this project has broadened my perspective of the world of energy. The way toward
a sustainable energy future seems to be more focused on smaller scale personal devises, of which the
PHEV seems to be the next piece in the puzzle. The PHEV through V2G seems to be a way of making
better use grid energy and household renewable energy installations. I thus think that there will be

Page | 102
significant benefit in a vehicle market saturated with PHEV’s (or EV’s for that matter) not only on a utility
scale, but also on a personal level.
With such a diverse team you are bound to learn some valuable lessons; be it from how communication
methods differ between people to how different cultures/people perceive the same concept and why
they deem them valuable to society. In such a diverse group of intelligent people there will always be a
new opinion and most probably better ways of looking at something that you have thought about
before. I have learnt so much not just from the project matter covered, but have also learnt a great deal
from my team mates. The difference being that you cannot find the latter on the internet or in a book; I
could only have learnt from the group by being part of it, and I must say, even from this perspective, I
think this project was a great success!
Christina Lu
The biggest learning experience from this MEng Project is working with a wide-diversified group of
people. The 11 of us represent 9 nationalities and 4 continents (if I counted correctly). Everyone comes
from a different background and brings into the team a set of unique talents and useful skills.
Being a member of 11-people team, what surprises me the most is that it actually worked more
effectively compared to the usual team of 3 or 4 members. The diversity of people created both
challenges and opportunities for the team. It was easy to come to an agreement what needs to be done,
however due to the fact that people come from different backgrounds, it was difficult in the beginning to
come to an agreement on how to get it done. People have different perspectives mainly because they
had different educations from their countries compare to the ones in the United States, therefore, what
they consider as not professional might be acceptable here and vice versa. However, once people realize
that disagreements were due to cultural differences, people tend to react to them more smoothly.
Although, challenges were not the only thing diversity has brought into the team, the opportunities it
brought were tremendous. The different experiences and backgrounds were essential to bring great
ideas and implement them effectively with the skills each of us possesses into our project.
Mert Berberoglu
In the beginning of the project I was in the room with 11 individuals that I didn’t have any idea about.
Besides the initial ambiguity in the team forming stage it was quite obvious that it’s going to be an
extraordinary experience. When we first met, it was surprising that almost all the people have came
from different parts of the world. There were so many different cultures and so many different
personalities that it was surprising that this team became a jelled team and gained a strong identity.
Individuals were supportive and had respect to each other. Different perspectives and different expertise
were combined in harmony and created a high quality work. “Collaboration” was the key of our success.
We have also experienced a “halfway point” that almost all the teams experience. The first half of the
project time has mostly passed by collecting information and creating ideas. When we were in the
middle of our project time we were a bit nervous thinking that we haven’t done much work. However
the ideas and knowledge was there. In the second half we were extremely productive and working with
enthusiasm and great commitment. We have formed a new sub-team in the second half to focus on the

Page | 103
business aspects and I was also involved in that team. I can say that it was the best team experience of
my life. The meetings were extremely productive and we have applied facilitation techniques that we
learned in other managerial courses. It was great to see that these theoretical concepts really work in
practice.
Finally, I am proud that I was a part of this team and I believe that our conclusions are helpful for the
parties that make important decisions about renewable energy and PHEV technology.
Naji Zogaib
I originally chose this project for my interest in energy and the environment in general and PHEVs in
particular. Looking back at the past four months, I can see that both, my knowledge and interest in
PHEVs, the auto market, the electric grid and the environment have increased substantially. Considering
this project is designed for the Engineering Management students, I really enjoyed learning how to
interact and work with the team on a day to day basis, especially considering how multicultural the team
was. Having to manage yourself and others throughout the meetings and work sessions was a very useful
experience. Being able to apply the tools taught by Professor Frank Wayno in CEE5900-Project
Management throughout the semester made them more concrete and more meaningful.
Looking back at how it all started, the team was very confused about what had to be accomplished. The
fact that the team was allowed to set their own goals for this project made it that much more
interesting. The general topic of the project was given to us but we had to discuss between each other
and conclude what we wanted our deliverables to be, all with the approval of the advisor. These
introductory meetings were very important. It could be determined from these early meetings who were
the take charge team members, who was able/willing to lead and who just wanted to follow. In the first
few meetings, it was agreed to divide the team into 3 sub teams; PHEV, infrastructure and business.
When everyone wanted to be on the business sub team, it was decided to drop it and to stick to two sub
teams. After performing the cost analysis, it was concluded that the PHEV is not economically feasible
from a customer point of view. Towards the end of the semester, around a week before the final
presentation, it was decided that a business sub team was essential to analyze ideas that would make
the PHEV economically feasible. The business sub team was formed by a group of individuals extracted
from each of the other two sub teams and together they came up with ideas that would help sell the
phev to the customer.
The weekly meetings with professor Vanek and the sub team leaders were very useful in keeping
everyone on the same page. The sub team leaders coordinated the work between their team's members
and the remaining teams' members. This was the key so that no overlapping work was done twice.
Overall, I am very satisfied with the project choice I made. The topic was very interesting, but what made
it a successful research was the people involved in it. Even though there were no two individuals from
the same nationality/culture, the team was very well coordinated and we all jelled well with each other.
Moreover, the way Professor Vanek dealt with the team made it come together even better. Having to
define our own deliverables and having to choose our own team leaders made us all assume part of the
responsibility of succeeding in this project.

Page | 104
Sara Lachapelle
The Plug-in Hybrid Electric Vehicle project within the Master’s of Engineering, Engineering Management
Program has been a great experience in terms of the material studied and working with my fellow team
members. One of my primary goals at the beginning of the semester was to work effectively in a large
team of people. I believe that this project has given me the opportunity to meet many people from
across world with various backgrounds. One of the most challenging aspects of this project was the large
number of people involved in the research. Learning to work with that many people is an important skill
that I am sure will be useful to me in the future. Another of one of my goals for this project was to learn
about the PHEV technology and determine whether or not it is feasible in the current economic and
energy situation. I found that the scope of the project was very relevant and I had the opportunity to
learn about many different aspects that are related to PHEVs. I was able to study both technical and non-
technical subjects such as the PHEV technology itself, infrastructure and future business solutions for
increasing PHEV sales. Overall, I enjoyed my experience working on the PHEV project with my colleagues.
I believe that the skills learned during the semester will be very beneficial in the future and the subject of
the project is also very relevant given the uncertainty surrounding energy sources.
Whitney Bi
My experiences with the PHEV project, improved my communication and teamwork skills. I also had a
chance to put my theoretical background in to practice.
Perhaps the most beneficial part of this project was the opportunity to work with people coming from
different cultures and backgrounds. Before enrolled in the project, I was very shy, and didn’t want to talk
with people that I am unfamiliar with. But currently, I’d love to continue exchanging ideas and thoughts
with my 10 colleagues that I work with during the project. Moreover, I am currently more confident
about talking to people.
This project experience has totally changed my idea about teamwork. In my education, in china the
weight given to the team work was relatively less. I didn’t have many group projects and presentations
during my undergraduate studies. However, this PHEV project provided me to gain experience and new
skills in both team work and presentations. It is not easy to operate a team by taking the advantage of
every individual’s background, knowledge and experience. Acknowledging that, I integrated my ideas
together, and made sure that everyone has understood my ideas. During my participation in business
sub team, I have applied the knowledge that I’ve got from my Marketing Management class to develop a
marketing strategy for PHEV. This was actually very exciting experience form as I was able to use my
academic knowledge in the project.
Torio Risianto
Working with a large group was a rare experience for me. At first I thought that the team would be
chaotic in terms of splitting up a fair workload, but our team had shown otherwise. Even during the early
phase (i.e. writing the literature review), we discussed, defined and created sub-teams to handle the
project tasks. The time required for my sub-team’s literature review was very efficiently spent, and I
believe that the other sub-teams were as effective.

Page | 105
During the core phase, the team reconvened and was split into two sub-teams: PHEV and infrastructure.
In this sub-team, I experienced the same positive atmosphere. More importantly, we covered each
other’s tasks when required, especially due to the fact that this semester is full with job interviews. For
example, one person who had to work less on that week due to interviews would work more on the
following week to cover another person’s tight schedule. This work dynamics enabled us to accomplish
our tasks efficiently.
In the middle of the semester, we all realized that sub-team communications had to be improved, and
we conclude that a liaison for each sub-team had to be created. Although this was a good idea, the
implementation didn’t last long due to at least two reasons: the creation of the business sub-team
(which requires each liaison to attend three sub-team meetings) and the improved communications
between the three sub-teams. Since joining the business sub-team, I was more involved in the marketing
strategies. While the PHEV sub-team requires a lot of research effort, the business sub-team requires
basic background information and a lot of recommendation idea generations. These varieties of my role
were very engaging to me.
Overall, the whole team was very supportive. Everyone consistently got feedback of their work and was
offered assistance whenever needed. I am content that I was able to volunteer to help other members’
issues at certain times and receive support in other times, particularly during both presentation
preparations. I believe that working in this project has given me more teamwork experience, which will
be a relevant skill-set in my future jobs.
Torsten Steinbach
I chose the PHEV project due to my strong interest in the automotive industry and the application of new
technologies for a cleaner way of private transportation. I enjoyed that we could set our own goals and
agree on our own deliverables. By that we could shape our own Master of Engineering project within the
given framework. The project offered various opportunities for all team members to apply material
learned in class and to deepen their knowledge in fields they were interested in. From forecasting
models and optimization techniques to making good use of project management principles and applying
basics of marketing and finance – a variety of opportunities were given to engage in the project.
The group size of eleven students made the project an interesting and challenging experience. It
required more communication then projects I was involved in during my undergraduate and professional
career. Good communication especially in the second half of the semester helped us to align our efforts
and to work efficiently. It was satisfying to see the development of the team. At the end of the term the
term a group of people from nine different nations was able to discuss various technical details around
PHEVs in depth.
Overall, I enjoyed the PHEV project and I am satisfied with the final deliverables. Personally, I think I
developed in three areas: My technical understanding of the electrical infrastructure and the interplay
with renewable energies, my communication and team work skills, and my project management skills
improved throughout the course of the semester.

Page | 106
Vincent DeRosa
Overall, I was very pleased with how the project turned out and how the group came together. I think
one of the best aspects of the team was the fact that members were from all different parts of the
world. People used ideas from their specific cultures that certainly helped to develop the final project. It
was fascinating that while some of the ideas were from ordinary experiences at home that the person
may have thought to be extremely trivial, they turned out to be quite novel to the other members of the
group. A simple example of this was some of the vehicle type restrictions and commuting distances that
apparently are in place in London. While this may have been commonplace for certain members of the
group, I was unaware of this type of restriction. Therefore, I think that the makeup of the team,
specifically the fact that the members hailed from all different parts of the world, helped to create many
great ideas. We were able to take some of the best attributes from a wide range of sources to
determine things that we thought would be useful in Los Angeles.
One of the main concerns I had at the mid-term report was how the team was going to attack the
remainder of the semester. The team was split into two sub-groups at the onset of the project, one
focusing on the PHEV technology itself and the other dealt with the subsequent infrastructure. This
model worked well for the first half when the work separation was much more defined and clear cut.
The technology team analyzed the PHEV while the infrastructure side researched the Los Angeles power
grid. However, the second half of the semester saw the need for a much more interdependent
approach. Assumptions made by one side needed to be communicated to the other and vice versa. I
know specifically for the infrastructure side, we needed to use many of the technological values such as
battery capacity and driving habits that the other sub-team developed. The creation of a sub-team
liaison therefore helped tremendously in this task. There was certainly the possibility of difficulties
maintaining this cross team communication and the high potential for slow feedback that would have
really hurt the overall project. However, with a sub-team liaison attending the other group’s meetings,
the answers to various questions were much more readily available. In this way, many of the concerns
that I had during the mid-term evaluation report did not actually happen as a result of great team
chemistry and the foresight to mitigate any situations before they became true problems.