Cornea In Vivo Confocal Microscopy of Meibomian Glands in ...
7
In Vivo Confocal Microscopy of Meibomian Glands in Sjo ¨gren’s Syndrome Edoardo Villani, Silvia Beretta, Michela De Capitani, Daniela Galimberti, Francesco Viola, and Roberto Ratiglia PURPOSE. To evaluate morphologic changes in meibomian glands (MGs) and the status of periglandular inflammation in patients with primary and secondary Sjo ¨gren’s Syndrome (SS) using in vivo confocal laser microscopy (LSCM). METHODS. Twenty patients with primary SS (SSI), 25 with second- ary SS (SSII), 20 with MG dysfunction (MGD), and 25 age- and gender-matched control subjects were enrolled consecutively. Each participant completed an Ocular Surface Disease Index ques- tionnaire and underwent a full eye examination, including tear film break-up time (BUT), fluorescein and lissamine green stain- ing, Schirmer test, and an LSCM examination of the MGs, the last to determine acinar unit density and diameter, glandular orifice diameters, meibum secretion reflectivity, inhomogeneous appear- ance of glandular interstice, and acinar wall. RESULTS. All parameters indicated statistically significant differ- ences among groups (P 0.001, Kruskal-Wallis test). LSCM demonstrated no differences between SSI and SSII (Mann– Whitney U test). Compared with control subjects, SS subjects’ MGs showed more periglandular inflammation and higher se- cretion reflectivity (P 0.001, Mann–Whitney U test). Com- pared with MGD patients, SS patients’ MGs had higher acinar density, smaller diameters, greater density of periglandular inflammatory cells, and lower secretion reflectivity (P 0.001, Mann–Whitney U test). In SS patients, the two measured con- focal signs of inflammation were significantly interrelated and correlated with corneal fluorescein staining (P 0.01, Spear- man correlation coefficient). Acinar density and diameters were strongly correlated among themselves (P 0.001) and with BUT (P 0.05). CONCLUSIONS. LSCM is capable of effectively revealing morpho- logic and inflammatory changes in MGs and showed discern- ible patterns of MG abnormalities in SS and MGD not easily distinguishable by the usual clinical exams. (Invest Ophthal- mol Vis Sci. 2011;52:933–939) DOI:10.1167/iovs.10-5995 S jo ¨gren’s Syndrome (SS), a relatively common chronic auto- immune disorder affecting 1%–2% of the population, is characterized by dysfunction and destruction of exocrine glands— mainly salivary and lacrimal glands. SS can be found alone—primary SS (SSI)— or accompanied by almost any other autoimmune disease–secondary SS (SSII), wherein a broad spectrum of clinical symptoms that extend from the exocrine glands (organ-specific exocrinopathy) to extraglandular mani- festations (systemic disease) can be observed. 1 Epithelial cells are thought to play important pathogenetic roles, as suggested by the occurrence of infiltrating lesions in various epithelial tissues (described as autoimmune epithelii- tis) as well as increased epithelial expression of several inflam- matory proteins in the lesions of patients. Epithelial cells in SS are activated and are capable of acting as antigen-presenting cells. 2–4 SS is classically characterized by oral (xerostomia) and oc- ular dryness, keratoconjunctivitis sicca (KCS). For many years, KCS associated with SS was considered to be the result of reduced secretion of the aqueous component in tears. 5 Today, other pathogenetic elements, such as inflammation, changes in tear osmolarity, and alterations in corneal sensitivity and inner- vation, are considered to be fundamental. These elements interact in a complex (although, as yet, not completely de- coded) manner within the ocular surface morpho-functional unit that comprises the tear film, cornea, limbus, conjunctiva, mucocutaneous junction, and lacrimal (principal and acces- sory) and meibomian glands (MGs). 5,6 MGs are holocrine, lipid-excreting glands embedded in the tarsal plate of the upper and lower lids. Each MG comprises multiple acini that are connected by a long common central duct running throughout the entire length of the gland. MG dysfunction (MGD) is a term primarily used to describe ob- structive MG disease. MGD, a major cause of evaporative dry eye, causes alteration and reduction of lipid secretions, leading to increased tear evaporation, decreased tear stability, loss of lubrication, and damage to the ocular surface epithelia. 6–8 Previous studies have also shown abnormal evaporation rates and clinically significant destruction of MGs in patients with “hyposecretive” KCS associated with SS. 9,10 In vivo confocal laser microscopy (LSCM) is a new emerging noninvasive technology that is useful as a supplementary diag- nostic tool for in vivo assessment of the histopathology of many ocular surface disorders, 11 including in vivo examination of MGs. 12–14 In this study we evaluated the morphologic changes of MGs and the status of periglandular inflammation in patients with SSI and SSII using LSCM and investigated the correlation between clinical and confocal findings. METHODS Patients We consecutively enrolled 20 patients with SSI (20 women; mean age, 53.3 20 years; range, 35–72 years), 25 patients with SSII (23 women and two men; mean age, 53 11 years; range, 42– 65 years), 20 patients with MGD (mean age, 52 10 years; range, 40 – 60 years), and 25 healthy control subjects (18 women and 7 men; mean age, 50 15 years; range, 20 – 80 years). From the 1 Universita ` degli Studi di Milano, UO Oculistica Fonda- zione IRCCS Ca ` Granda Ospedale Maggiore Policlinico, Milan, Italy. Submitted for publication June 3, 2010; revised August 16, 2010; accepted September 4, 2010. Disclosure: E. Villani, None; S. Beretta, None; M. De Capitani, None; D. Galimberti, None; F. Viola, None; R. Ratiglia, None Presented at the annual meeting of the Association for Research in Vision and Ophthalmology, Fort Lauderdale, Florida, May 2010. Corresponding author: Edoardo Villani, Universita ` degli Studi di Milano, UO Oculistica Fondazione IRCCS Ca ` Granda Ospedale Mag- giore Policlinico, Via Francesco Sforza 35, 20122 Milan, Italy; [email protected]. Cornea Investigative Ophthalmology & Visual Science, February 2011, Vol. 52, No. 2 Copyright 2011 The Association for Research in Vision and Ophthalmology, Inc. 933
Transcript of Cornea In Vivo Confocal Microscopy of Meibomian Glands in ...

In Vivo Confocal Microscopy of Meibomian Glands inSjogren’s Syndrome
Edoardo Villani, Silvia Beretta, Michela De Capitani, Daniela Galimberti, Francesco Viola,and Roberto Ratiglia
PURPOSE. To evaluate morphologic changes in meibomianglands (MGs) and the status of periglandular inflammation inpatients with primary and secondary Sjogren’s Syndrome (SS)using in vivo confocal laser microscopy (LSCM).
METHODS. Twenty patients with primary SS (SSI), 25 with second-ary SS (SSII), 20 with MG dysfunction (MGD), and 25 age- andgender-matched control subjects were enrolled consecutively.Each participant completed an Ocular Surface Disease Index ques-tionnaire and underwent a full eye examination, including tearfilm break-up time (BUT), fluorescein and lissamine green stain-ing, Schirmer test, and an LSCM examination of the MGs, the lastto determine acinar unit density and diameter, glandular orificediameters, meibum secretion reflectivity, inhomogeneous appear-ance of glandular interstice, and acinar wall.
RESULTS. All parameters indicated statistically significant differ-ences among groups (P � 0.001, Kruskal-Wallis test). LSCMdemonstrated no differences between SSI and SSII (Mann–Whitney U test). Compared with control subjects, SS subjects’MGs showed more periglandular inflammation and higher se-cretion reflectivity (P � 0.001, Mann–Whitney U test). Com-pared with MGD patients, SS patients’ MGs had higher acinardensity, smaller diameters, greater density of periglandularinflammatory cells, and lower secretion reflectivity (P � 0.001,Mann–Whitney U test). In SS patients, the two measured con-focal signs of inflammation were significantly interrelated andcorrelated with corneal fluorescein staining (P � 0.01, Spear-man correlation coefficient). Acinar density and diameterswere strongly correlated among themselves (P � 0.001) andwith BUT (P � 0.05).
CONCLUSIONS. LSCM is capable of effectively revealing morpho-logic and inflammatory changes in MGs and showed discern-ible patterns of MG abnormalities in SS and MGD not easilydistinguishable by the usual clinical exams. (Invest Ophthal-mol Vis Sci. 2011;52:933–939) DOI:10.1167/iovs.10-5995
Sjogren’s Syndrome (SS), a relatively common chronic auto-immune disorder affecting �1%–2% of the population, is
characterized by dysfunction and destruction of exocrineglands— mainly salivary and lacrimal glands. SS can be foundalone—primary SS (SSI)—or accompanied by almost any other
autoimmune disease–secondary SS (SSII), wherein a broadspectrum of clinical symptoms that extend from the exocrineglands (organ-specific exocrinopathy) to extraglandular mani-festations (systemic disease) can be observed.1
Epithelial cells are thought to play important pathogeneticroles, as suggested by the occurrence of infiltrating lesions invarious epithelial tissues (described as autoimmune epithelii-tis) as well as increased epithelial expression of several inflam-matory proteins in the lesions of patients. Epithelial cells in SSare activated and are capable of acting as antigen-presentingcells.2–4
SS is classically characterized by oral (xerostomia) and oc-ular dryness, keratoconjunctivitis sicca (KCS). For many years,KCS associated with SS was considered to be the result ofreduced secretion of the aqueous component in tears.5 Today,other pathogenetic elements, such as inflammation, changes intear osmolarity, and alterations in corneal sensitivity and inner-vation, are considered to be fundamental. These elementsinteract in a complex (although, as yet, not completely de-coded) manner within the ocular surface morpho-functionalunit that comprises the tear film, cornea, limbus, conjunctiva,mucocutaneous junction, and lacrimal (principal and acces-sory) and meibomian glands (MGs).5,6
MGs are holocrine, lipid-excreting glands embedded in thetarsal plate of the upper and lower lids. Each MG comprisesmultiple acini that are connected by a long common centralduct running throughout the entire length of the gland. MGdysfunction (MGD) is a term primarily used to describe ob-structive MG disease. MGD, a major cause of evaporative dryeye, causes alteration and reduction of lipid secretions, leadingto increased tear evaporation, decreased tear stability, loss oflubrication, and damage to the ocular surface epithelia.6–8
Previous studies have also shown abnormal evaporation ratesand clinically significant destruction of MGs in patients with“hyposecretive” KCS associated with SS.9,10
In vivo confocal laser microscopy (LSCM) is a new emergingnoninvasive technology that is useful as a supplementary diag-nostic tool for in vivo assessment of the histopathology ofmany ocular surface disorders,11 including in vivo examinationof MGs. 12–14 In this study we evaluated the morphologicchanges of MGs and the status of periglandular inflammation inpatients with SSI and SSII using LSCM and investigated thecorrelation between clinical and confocal findings.
METHODS
Patients
We consecutively enrolled 20 patients with SSI (20 women; mean age,53.3 � 20 years; range, 35–72 years), 25 patients with SSII (23 womenand two men; mean age, 53 � 11 years; range, 42–65 years), 20patients with MGD (mean age, 52 � 10 years; range, 40–60 years), and25 healthy control subjects (18 women and 7 men; mean age, 50 � 15years; range, 20–80 years).
From the 1Universita degli Studi di Milano, UO Oculistica Fonda-zione IRCCS Ca Granda Ospedale Maggiore Policlinico, Milan, Italy.
Submitted for publication June 3, 2010; revised August 16, 2010;accepted September 4, 2010.
Disclosure: E. Villani, None; S. Beretta, None; M. De Capitani,None; D. Galimberti, None; F. Viola, None; R. Ratiglia, None
Presented at the annual meeting of the Association for Research inVision and Ophthalmology, Fort Lauderdale, Florida, May 2010.
Corresponding author: Edoardo Villani, Universita degli Studi diMilano, UO Oculistica Fondazione IRCCS Ca Granda Ospedale Mag-giore Policlinico, Via Francesco Sforza 35, 20122 Milan, Italy;[email protected].
Cornea
Investigative Ophthalmology & Visual Science, February 2011, Vol. 52, No. 2Copyright 2011 The Association for Research in Vision and Ophthalmology, Inc. 933
Patients with SSI and SSII were recruited at the Referral Centre forSystemic Autoimmune Diseases of Fondazione Ca Granda IRCCS, Os-pedale Maggiore Policlinico. The diagnosis was made according toAmerican-European Consensus Group criteria.15 MGD and control pa-tients were recruited at the General Clinic of Ophthalmology of Fonda-zione Ca Granda IRCCS, Ospedale Maggiore Policlinico. The diagnosisof MGD was made according to criteria reported by Matsumoto et al.12
Exclusion criteria for all groups included lymphoma, AIDS, diabetesmellitus, contact lens wear, history of eye surgery, and systemic ortopical therapy with FAN, steroids, or drugs with known cornealtoxicity.
Written informed consent was obtained from all subjects beforeexamination. This study adhered to the tenets of the Declaration ofHelsinki.
Clinical Evaluation
An accurate medical history was recorded for all study participants. Allpatients completed a questionnaire for standardized evaluation of dryeye–related symptoms: the Ocular Surface Disease Index. All patientsunderwent a thorough ophthalmic evaluation, including biomicro-scopic examination of the ocular adnexa and anterior segment.
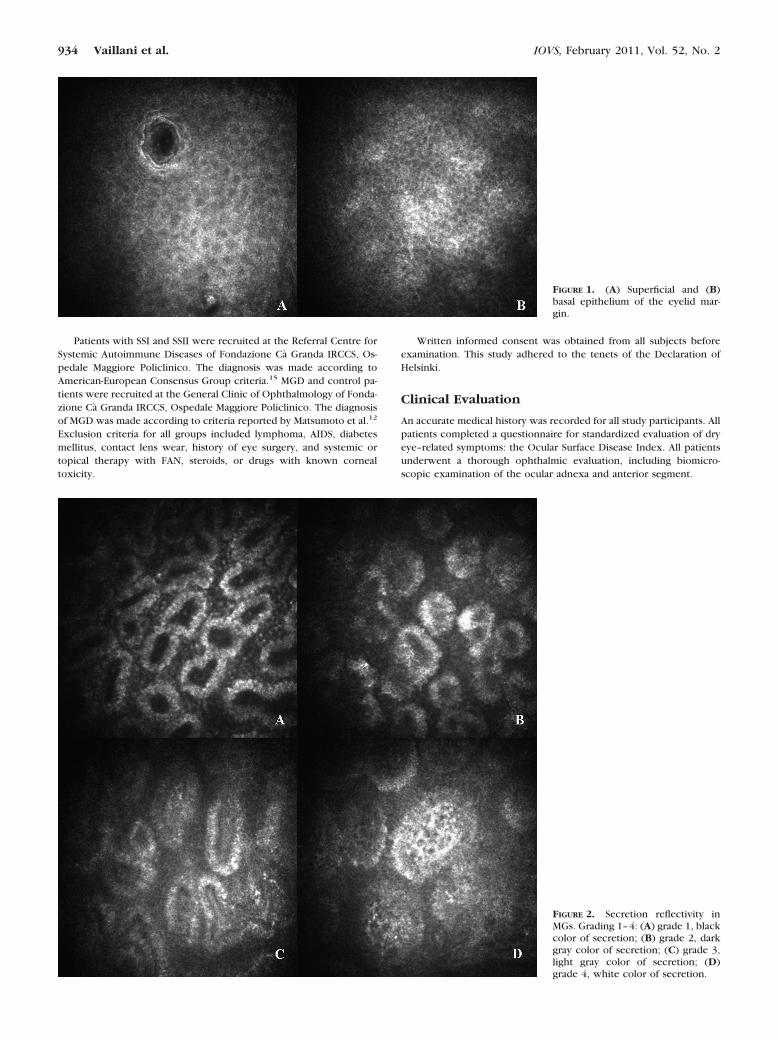
FIGURE 1. (A) Superficial and (B)basal epithelium of the eyelid mar-gin.
FIGURE 2. Secretion reflectivity inMGs. Grading 1–4: (A) grade 1, blackcolor of secretion; (B) grade 2, darkgray color of secretion; (C) grade 3,light gray color of secretion; (D)grade 4, white color of secretion.
934 Vaillani et al. IOVS, February 2011, Vol. 52, No. 2

To evaluate MGs, transillumination observation (meibography) ofthe lower eyelid was performed using a fiber-optic device. The degreeof MG dropout was scored, as described previously8,10: grade 0 � nogland dropout; grade 1 � gland dropout in less than half of the inferiortarsus; and grade 2 � gland dropout in more than half of the inferiortarsus.
Tear film break-up time (BUT), corneal staining with fluorescein,and bulbar conjunctival staining with lissamine green were alsoperformed. Ocular surface staining was scored according to theCollaborative Longitudinal Evaluation of Keratoconus scheme.5
Tear secretion was evaluated by the Schirmer test using oxybu-procaine chloridrate 0.4%. Assessment of obstruction in MG orificeswas conducted by applying digital pressure on the upper tarsus,after which the degree of ease in expressing MG secretion(meibum) was evaluated semiquantitatively: grade 0 � clearmeibum easily expressed; grade 1 � cloudy meibum expressed withmild pressure; grade 2 � cloudy meibum expressed with more thanmoderate pressure; and grade 3 � meibum not expressed even withfirm pressure.8,10
Both eyes of all subjects were examined. For statistical analysis, theeye with the highest fluorescein staining score was selected. In thecase of equal scores for the two eyes, discriminant criteria consideredwere, in order of relevance, conjunctival staining and BUT.
Confocal Microscopy
Image Acquisition. LSCM was performed on all subjects usinga new-generation confocal microscope (HRT II Corneal Rostock Mod-ule; Heidelberg Engineering, Dossenheim, Germany), which employs a670 nm scanning wavelength. The objective lens (Zeiss �63 immer-
sion) is covered with a polymethacrylate sterile cap (Tomo-Cap;Heidelberg Engineering) and has a working distance of 0.0–2.0 mm.Before each examination, a drop of oxybuprocaine chlorohydrate 0.4%and an ophthalmic polyacrylic gel 0.2% were separately instilled intothe conjunctival fornix. After the lower eyelid was partially everted,the center of the sterile cap was applanated onto the center of theeyelid margin (horizontally halfway between the inner and outer can-thi), and the instrument focus manually settled (microscope in acqui-sition modality “Section Mode”), starting from the most superficialdown to the deepest discernible tissues having a satisfactory resolu-tion. Ten images were taken every 10 �m in depth. Additional imageswere also taken mid-depth, to manually adjust the quality of thedifferent structures during examination. This procedure was repeatedfor the nasal and temporal eyelid margins.
Two-dimensional image sizes measured 384 � 384 pixels, with a400 � 400 �m field of view. Each LSCM examination session lasted�3–5 minutes.
Image Analysis. For each variable examined, a single masked
investigator (SB) analyzed three randomized, nonoverlapping high-quality digital images of the nasal, middle, and temporal lowereyelid margins. We quantified the following variables: cellular den-sity of the superficial and basal epithelia of the eyelid margin (Fig. 1;manually marked inside the largest available region of interest andcalculated automatically) (Cell Count software; Heidelberg Engi-neering), diameters of acinar units (manually measured along thelongest axis of the acinar unit), density of MGs (manually markedinside each 400 � 400 �m frame and calculated automatically usingCell Count),12 diameter of glandular orifices (manually markedalong the longest axis of orifice), meibum secretion reflectivity
FIGURE 3. Inhomogeneous appear-ance of interstice of acinar unit.Grading 1–4: (A) grade 1, absence ofpunctate reflecting elements: (B)grade 2, slight presence of punctatereflecting elements; (C) grade 3,greater presence of punctate reflect-ing elements; (D) grade 4, higherpresence of punctate reflecting ele-ments.
IOVS, February 2011, Vol. 52, No. 2 Meibomian Glands in Sjogren’s Syndrome 935

(Fig. 2), and inhomogeneous appearance of interstices and walls ofacinar units (Figs. 3 and 4). For the last three variables, we adoptedthree grading scales (1– 4) assessed by comparison with the refer-ence images (Figs. 2– 4). Values obtained by the same investigator(SB) 1 month later and by a second independent investigator (MDC)were used to quantify intra- and interobserver agreement, respec-tively.
Statistical Analysis
All data are presented as mean � SD. For each variable, the Kruskal-Wallistest was applied to test the statistical differences between the four groups.The Mann–Whitney U test was used as a post hoc test to determine thedifference between individual pairs of groups. Correlations among vari-ables were analyzed with Spearman’s index of linear correlation.
TABLE 1. Clinical Data
OSDI MG Dropout BUT Corneal StainingConjunctival
Staining Schirmer TestMG
Expressibility
SSI 26.5 � 12.8 1.3 � 0.7 3.7 � 1.8 4.2 � 3.3 2.7 � 0.9 1.9 � 0.9 1.7 � 0.9SSII 18.2 � 6.9 1.2 � 0.7 5.1 � 2.9 2.8 � 1.9 1.6 � 0.5 3 � 1.9 1.7 � 0.9MGD 13.3 � 9.8 1.6 � 0.5 5.4 � 1.7 1.2 � 0.9 1.2 � 0.9 12.3 � 1.9 2.5 � 0.6C 4.9 � 3.4 0.4 � 0.5 9.2 � 3.1 n.s. n.s. 9.5 � 5.6 0.4 � 0.5P* �0.001† �0.001‡ �0.001§ �0.001� �0.001¶ �0.001# �0.001**
* P obtained by Kruskal-Wallis test; n.s., not significant.† SSI vs. SSII: P � 0.01; SSI vs. C: P � 0.001; SSII vs. C: P � 0.001; MGD vs. C: P � 0.01; SSI vs. MGD: P � 0.001; SSII vs. MGD: n.s.
(Mann-Whitney U test).‡ SSI vs. SSII: n.s.; SSI vs. C: P � 0.001; SSII vs. C: P � 0.001; MGD vs. C: P � 0.001; SSI vs. MGD: P � 0.05; SSII vs. MGD: P � 0.05
(Mann-Whitney U test).§ SSI vs. SSII: n.s.; SSI vs. C: P � 0.001; SSII vs. C: P � 0.001; MGD vs. C: P � 0.001; SSI vs. MGD: P � 0.01; SSII vs. MGD: n.s. (Mann-Whitney U test).� SSI vs. SSII: n.s.; SSI vs. MGD: P � 0.001; SSII vs. MGD: P � 0.01 (Mann-Whitney U test).¶ SSI vs. SSII: P � 0.001; SSI vs. MGD: P � 0.001; SSII vs. MGD: n.s. (Mann-Whitney U test).# SSI vs. SSII: n.s.; SSI vs. C: P � 0.001; SSII vs. C: P � 0.001; MGD vs. C: P � 0.001; SSI vs. MGD: P � 0.001; SSII vs. MGD: P � 0.001
(Mann-Whitney U test).** SSI vs. SSII: n.s.; SSI vs. C: P � 0.001; SSII vs. C: P � 0.001; MGD vs. C: P � 0.001; SSI vs. MGD: P � 0.001; SSII vs. MGD: P � 0.001
(Mann-Whitney U test).
FIGURE 4. Inhomogeneous appear-ance of wall of acinar unit. Grading1–4: (A) grade 1, absence of punc-tate reflecting elements; (B) grade 2,slight presence of punctate reflectingelements; (C) grade 3, greater pres-ence of punctate reflecting elements;(D) grade 4, greatest presence ofpunctate reflecting elements.
936 Vaillani et al. IOVS, February 2011, Vol. 52, No. 2

The minimum criterion for tests of significance was P � 0.05.Statistical analysis was conducted using commercial software (SPSS forWindows, v. 12.0; SPSS Sciences, Chicago, IL).
RESULTS
Clinical Data
All clinical parameters showed statistically significant differ-ences among groups (P � 0.001, Kruskal-Wallis test). All com-parisons among groups are shown in Table 1.
Cell Density Data
There were no significant differences in superficial epitheliumcell density among groups. Basal epithelium cell density wassignificantly higher in the C group, compared with othergroups (Table 2).
MG Confocal Data
MGs had significantly higher diameters and lower density inpatients with MGD compared with other groups. SSI andSSII patients had significantly reduced MG orifice diameters(Table 3).
MGD patients showed significantly higher secretion reflec-tivity compared with other groups.
SSI and SSII patients’ secretion reflectivity presented signif-icant differences compared with MGD and C groups. SSI and
SSII patients showed higher inhomogeneous appearance ofperiglandular interstices than did other groups. MGD patients’interstices’ inhomogeneous appearance was significantlyhigher than C but lower than SS patients. SS and MGD patientsshowed higher inhomogeneous appearance of the acinar wallcompared with the C group (Table 4).
Secretion reflectivity, inhomogeneous appearance of perig-landular interstice, and inhomogeneous appearance of the aci-nar wall showed substantial intra- and interobserver agreement(K � 0.92 and 0.80, respectively), secretion reflectivity (0.86and 0.78, respectively), inhomogeneous appearance of perig-landular interstice (0.82 and 0.78, respectively), and inhomo-geneous appearance of acinar wall.
In SS patients, the grade of inhomogeneous appearance ofperiglandular interstices and the acinar wall were significantlyinterrelated and correlated with corneal fluorescein staining(P � 0.01, Spearman’s correlation coefficient). Acinar densityand diameter were strongly correlated between themselves(P � 0.001) and with BUT (P � 0.05).
DISCUSSION
SS is a chronic autoimmune disorder characterized by dysfunc-tion and destruction of exocrine glands resulting in an aqueoustear-deficient dry eye.5 Recent literature suggests that within SSthere exists an organic hybrid form of aqueous-deficient dryeye (ADDE)—inflammatory infiltration of the lacrimal gland—and evaporative dry eye (EDE)—MGD.16
LSCM has been recently applied to the armament of modal-ities used in the examination of MGs, providing a new nonin-vasive tool with which to study morphologic changes inMGs.12,14 LSCM is a technology that allows description andtesting of the diagnostic values of acinar density and diameter,secretion reflectivity, and periglandular inflammation in MGDpatients.
Previous studies12,14 described MGs in vivo confocal ex-aminations performed through the tarsal conjunctiva of theinverted superior eyelid. A confocal examination needs aprolonged contact (a few minutes) between instrument andexamined tissue, which can be uncomfortable for the pa-tient during inverted superior eyelid tarsal conjunctiva eval-uation. Moreover the instrument has a space fix orientation,so it requires the examined tissue to be positioned parallelto the polymethacrylate sterile cap (Tomo-Cap) face; this is
TABLE 2. Cell Density of Superficial and Basal Epithelium of theEyelid Margin
Cell Density (cell/mm2)
Superficial Epithelium Basal Epithelium
SSI 1350 � 226 3351 � 217SSII 1286 � 277 3987 � 285MGD 1278 � 290 3890 � 342C 1473 � 458 4446 � 619P* n.s. �0.001†
n.s., not significant.* Obtained by Kruskal-Wallis test.† SSI vs. SSII: P � 0.01; SSI vs. C: P � 0.001; SSII vs. C: P � 0.05;
MGD vs. C: P � 0.05; SSI vs. MGD: P � 0.05; SSII vs. MGD: n.s.(Mann-Whitney U test).
TABLE 3. MG Acinar Unit Density and MG Acinar and GlandularOrifice Diameters
Acinar UnitGlandular
Orifices
Density(units/mm2)
Diameter(�m)
Diameter(�m)
SSI 138 � 69 53 � 31 27.8 � 5.9SSII 97 � 43 70 � 42 20.6 � 5.1MGD 57 � 21 106 � 41 50.0 � 9.1C 110 � 31 53 � 14 34.7 � 4.3P* �0.001† �0.001† �0.001‡
n.s., not significant.* Obtained by Kruskal-Wallis test.† SSI vs. SSII: n.s.; SSI vs. C: n.s.; SSII vs. C: n.s.; MGD vs. C: P �
0.001; SSI vs. MGD: P � 0.001; SSII vs. MGD: P � 0.001 (Mann-WhitneyU test).
‡ SSI vs. SSII: P � 0.05; SSI vs. C: P � 0.05; SSII vs. C: P � 0.001;MGD vs. C: P � 0.001; SSI vs. MGD: P � 0.001; SSII vs. MGD: P � 0.001(Mann-Whitney U test).
TABLE 4. Grade of Secretion Reflectivity and InhomogeneousAppearance of Interstices and Wall of MG Acini
SecretionReflectivity
InhomogeneousAppearance of
Interstice
InhomogeneousAppearance of
Wall
SSI 1.7 � 0.6 2.6 � 0.6 3.0 � 1.0SSII 2.2 � 0.8 2.6 � 0.6 2.8 � 0.8MGD 3.3 � 0.7 1.8 � 0.8 2.5 � 0.9C 1.1 � 0.7 1 � 0.3 1.4 � 0.5P* �0.001† �0.001‡ �0.001§
n.s., not significant.* Obtained by Kruskal-Wallis test.† SSI vs. SSII: n.s.; SSI vs. C: P � 0.05; SSII vs. C: P � 0.001; MGD
vs. C: P � 0.001; SSI vs. MGD: P � 0.001; SSII vs. MGD: P � 0.001(Mann-Whitney U test).
‡ SSI vs. SSII: n.s.; SSI vs. C: P � 0.001; SSII vs. C: P � 0.001; MGDvs. C: P � 0.001; SSI vs. MGD: P � 0.01; SSII vs. MGD: P � 0.001(Mann-Whitney U test).
§ SSI vs. SSII: n.s.; SSI vs. C: P � 0.001; SSII vs. C: P � 0.001; MGDvs. C: P � 0.001; SSI vs. MGD: n.s.; SSII vs. MGD: n.s. (Mann-WhitneyU test).
IOVS, February 2011, Vol. 52, No. 2 Meibomian Glands in Sjogren’s Syndrome 937
the reason why it is very difficult to evaluate the superioreyelid margin, whereas the lower one is easily positionedand inspected. By performing LSCM of the eyelid margin, wewere able to visualize not only the MG acini but also muco-cutaneous junction epithelia and glandular orifices. We be-lieve that the chance of studying by in vivo microscopy themucocutaneous junction is extremely interesting, not onlybecause of potential clinical information derivable in thedifferent pathologies involving this structure, but also be-cause of its role, recently emphasized in the literature,17,18
as a potential focal point of mucosal epithelial cell differen-tiation activities.
We performed LSCM of MGs in SS patients, comparingcharacteristics with MGD patients and healthy subjects.
The basal mucocutaneous epithelium showed a lowercell density in SS and MGD patients than in the controlgroup, suggesting that mechanical and inflammatory damagecannot be compensated by proliferative changes of the basalepithelium, as happens, for example, in the cornea.19,20
MGD patients were characterized by extensive MG drop-out, MG secretion that could not be expressed, tear filminstability, and ocular surface epithelial damage. Accordingto recent literature,12–14 LSCM in these patients showedincreased diameters of acinar units and orifices and high-reflective secretion. These alterations may be due to quali-tative changes of the MG secretion (inspissation, increasedviscosity, and build-up) and to consequent MG obstruction.
Patients with SS showed less acinar dilatation, lowersecretion reflectivity, and decreased orifice diameters, sug-gesting a minor role for the obstructive pathogenetic mech-anism.
We interpreted the inhomogeneous appearance of theperiglandular interstices as a confocal sign of eyelid marginand tarsal inflammation. Previous studies reported quantita-tive data regarding periglandular inflammatory dendritic celldensity.12,14 In our hands, it was too difficult to identifyindividual cells. Furthermore, the dendritic shape was oftenunrecognizable. Thus, we chose to perform a semiquantita-tive analysis (1– 4 grading) of the punctiform elements view-able in the interstices. This inflammatory sign was signifi-cantly increased in all pathologic groups but was highest inthe SS group.
The inhomogeneous appearance of the acinar wall wassignificantly increased in all pathologic groups, with nodifferences between SS and MGD patients. This confocalfeature is most likely interpretable as signifying inflamma-tory processes and changes in MG secretion characteristics.
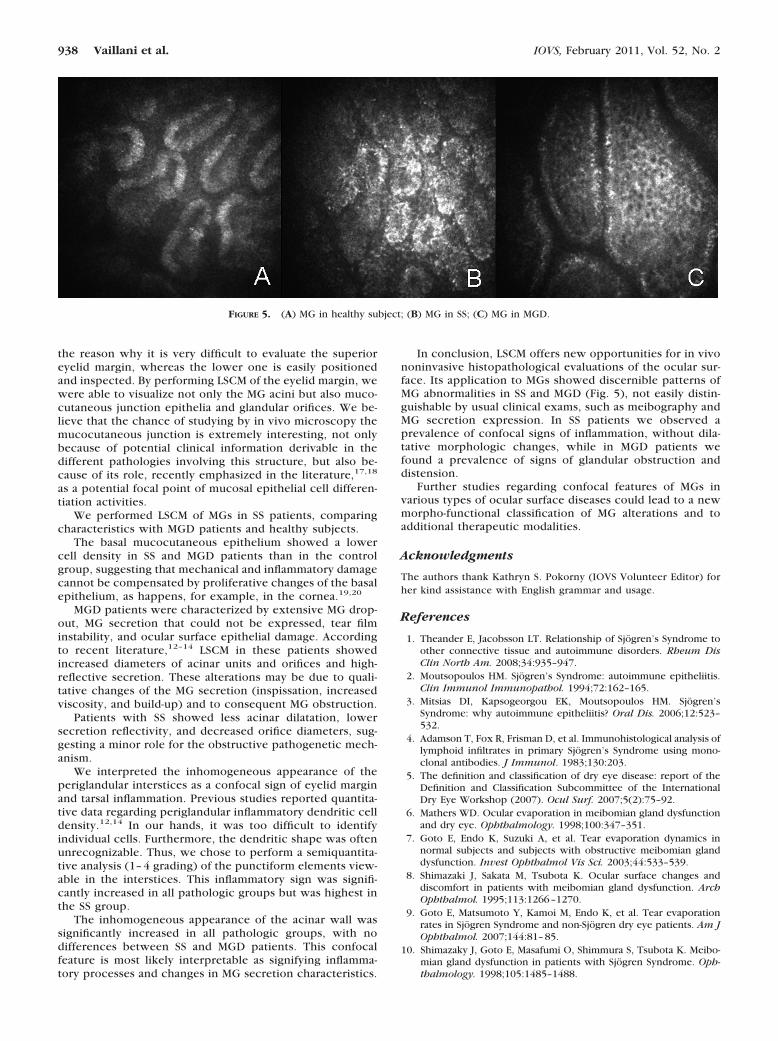
In conclusion, LSCM offers new opportunities for in vivononinvasive histopathological evaluations of the ocular sur-face. Its application to MGs showed discernible patterns ofMG abnormalities in SS and MGD (Fig. 5), not easily distin-guishable by usual clinical exams, such as meibography andMG secretion expression. In SS patients we observed aprevalence of confocal signs of inflammation, without dila-tative morphologic changes, while in MGD patients wefound a prevalence of signs of glandular obstruction anddistension.
Further studies regarding confocal features of MGs invarious types of ocular surface diseases could lead to a newmorpho-functional classification of MG alterations and toadditional therapeutic modalities.
Acknowledgments
The authors thank Kathryn S. Pokorny (IOVS Volunteer Editor) forher kind assistance with English grammar and usage.
References
1. Theander E, Jacobsson LT. Relationship of Sjogren’s Syndrome toother connective tissue and autoimmune disorders. Rheum DisClin North Am. 2008;34:935–947.
2. Moutsopoulos HM. Sjogren’s Syndrome: autoimmune epitheliitis.Clin Immunol Immunopathol. 1994;72:162–165.
3. Mitsias DI, Kapsogeorgou EK, Moutsopoulos HM. Sjogren’sSyndrome: why autoimmune epitheliitis? Oral Dis. 2006;12:523–532.
4. Adamson T, Fox R, Frisman D, et al. Immunohistological analysis oflymphoid infiltrates in primary Sjogren’s Syndrome using mono-clonal antibodies. J Immunol. 1983;130:203.
5. The definition and classification of dry eye disease: report of theDefinition and Classification Subcommittee of the InternationalDry Eye Workshop (2007). Ocul Surf. 2007;5(2):75–92.
6. Mathers WD. Ocular evaporation in meibomian gland dysfunctionand dry eye. Ophthalmology. 1998;100:347–351.
7. Goto E, Endo K, Suzuki A, et al. Tear evaporation dynamics innormal subjects and subjects with obstructive meibomian glanddysfunction. Invest Ophthalmol Vis Sci. 2003;44:533–539.
8. Shimazaki J, Sakata M, Tsubota K. Ocular surface changes anddiscomfort in patients with meibomian gland dysfunction. ArchOphthalmol. 1995;113:1266–1270.
9. Goto E, Matsumoto Y, Kamoi M, Endo K, et al. Tear evaporationrates in Sjogren Syndrome and non-Sjogren dry eye patients. Am JOphthalmol. 2007;144:81–85.
10. Shimazaky J, Goto E, Masafumi O, Shimmura S, Tsubota K. Meibo-mian gland dysfunction in patients with Sjogren Syndrome. Oph-thalmology. 1998;105:1485–1488.
FIGURE 5. (A) MG in healthy subject; (B) MG in SS; (C) MG in MGD.
938 Vaillani et al. IOVS, February 2011, Vol. 52, No. 2

11. Villani E, Galimberti D, Viola F, Ratiglia R. In vivo confocalmicroscopy of the ocular surface. Am J Ophthalmol. 2010;149:689 – 690.
12. Matsumoto Y, Sato EA, Dogru M, Tsubota K. The application of invivo laser confocal microscopy to the diagnosis and evaluation ofmeibomian gland dysfunction. Mol Vis. 2008;14:1263–1271.
13. Matsumoto Y, Shigeno Y, Sato E, Tsubota K, et al. The evaluationof the treatment response in obstructive meibomian gland diseaseby in vivo laser confocal microscopy. Arch Exp Ophthalomol.2009;247:821–829.
14. Ibrahim OM, Matsumoto Y, Dogru M, et al. The efficacy, sensitiv-ity, and specificity of in vivo laser confocal microscopy in thediagnosis of meibomian gland dysfunction. Ophthalmology. 2010;117:665–672.
15. Vitali C, Bombardieri S, Jonsson R, et al. Classification criteria forSjogren’s Syndrome: a revised version of the European criteria
proposed by the American-European Consensus Group. AnnRheum Dis. 2002;61:554–558.
16. Bron A, Yokoy N, Gaffney E, Tiffany JM. Predicted phenotypes ofdry eye: proposed consequences of its natural history. Clin Sci.2009;7:78–92.
17. Liu S, Li J, Tan DT, Beuerman RW. The eyelid margin: a transitionalzone for 2 epithelial phenotypes. Arch Ophthalmol. 2007;125:523–532.
18. Riau AK, Barathi VA, Beuerman RW. Mucocutaneous junction ofeyelid and lip: a study of the transition zone using epithelial cellmarkers. Curr Eye Res. 2008;33:912–922.
19. Fabiani C, Barabino S, Rashid S, Dana M. Corneal epithelial prolif-eration and thickness in a mouse model of dry eye. Exp Eye Res.2009;89:166–171.
20. Villani E, Galimberti D, Viola F, Mapelli C, Del Papa N, Ratiglia R.Corneal involvement in rheumatoid arthritis: an in vivo confocalstudy. Invest Ophthalmol Vis Sci. 2008;49:560–564.
IOVS, February 2011, Vol. 52, No. 2 Meibomian Glands in Sjogren’s Syndrome 939