Coriolis White Paper
17
! "##$ %&% ’( ) % "*+", "##$ !"" - -- . --/ .- --0 1- . ( - 0 ( . -0 2 - . ( - %&% 33 . ’ 0 3#4 - - ( 0 "#"$ - - . ( -. 1 -- 3,5#60 -- (- -7 0 % - %&% 8 90 33 :3; %&% 9 :"; .( - / < 0 .( ( -- - /0 - . .- - . -- ( ( - - .( / -- 3# 0 - - -= - ( . ’ 0 - . ( ( ( (7 .( 0 % - .- - . / = %&% :%- & %; % :%- - ; 9 :> 2 ; :&- 2 ; ? : @ ?@;0 ( . - - . - - .( ( - .( 0
-
Upload
oscar-yazit-salah-garcia -
Category
Documents
-
view
39 -
download
3
Transcript of Coriolis White Paper

EXTENDED APPLICATION OF CORIOLIS METERSFOR MEASURING NATURAL GAS
Keven Conrad, Flow Product Business Manager, Endress+Hauser, IncJoel Clancy, Operations Manager, CEESI Iowa High Flow Test Facility
Prepared for:
2005 AGA Operations Conference and Biennial Exhibition – April 27-29, 2005
__________________________________________________Abstract
Coriolis mass flow measurement for natural gas proves to minimize the uncertainties associated with volumetric flow measurement. The installation requirements and overall cost can be greatly simplified and reduced. The need for proper straight run and flow profile dependencies are shown to be virtually eliminated. While simulating such high level perturbation and installation effects, Coriolis continues to perform well within the accuracy specification of AGA 11 over and extended range of flow. Testing on a new 10” Coriolis mass flowmeter will be discussed.
__________________________________________________
Introduction
Coriolis mass flowmeters have been used to improve the accuracies of liquid measurement since the 1980’s. It is no secret that gas measurement has become a major focus for this technology. At the time of the release of AGA Report No. 11 (1) and the prior issuing of AGA Engineering Technical Note (2), the available Coriolis meter sizes were only up to 6 inch. Coriolis is a viable option to be used in gas flow measurement, yet typically thought of for smaller line sizes. Coriolis manufacturers continue to advance the development of meter sensitivity, their immunity to noise, the ability to be mechanically self supporting and most recently, larger available sizes commercially up to 10 inch. There are manufacturers who custom make meter bodies which can even exceed this. Older designs may not have been able to operate within the needed accuracies at lower pressure, total allowable pressure drop and were subject to noise and vibration effects.
As a result of manufacturers overcoming these technical hurdles, Coriolis has gained worldwide recognition from standards and approving organizations like, AGA (American Gas Association), API (American Petroleum Institute), NMI (Dutch Weights and Measures), PTB (German Weights and Measures) and OIML (Organisation Internationale de Métrologie Légale). The ability to deliver meters which continue to operate and maintain custody transfer level of performance regardless of pressure, temperature, noise, vibration, pipe stress and installation is unparallel by any other metering technology available to this industry.

Since Coriolis flow meters measure direct mass, many issues are eliminated which affectthe uncertainty of volumetric based metering.
Some Coriolis manufacturers do not rely on any particular velocity profile and in turn can reduce the amount of piping and external equipment needed to achieve the accuracies desired. Coriolis meters with this capability are able to register bi-directional just as accurate. This can further eliminate the need of additional piping, flow conditioning and auxiliary equipment. Since not all Coriolis meters are alike, it is recommended that the manufacturer be consulted in regards to their specific recommendations on upstream piping configurations.
For Coriolis to report out in standard volumetric flow, it simply divides the mass flow by the standard or base density of the fluid being measured. The need to actually measure and compensate for the temperature, pressure or compressibility of the gas is virtually eliminated.For single component gases, common databases exist to look this information up. For mixtures, the gas composition can be measured or estimated, depending on the level of accuracy required. If measured, a gas chromatograph is typically used allowing the operator to back calculate the base density by the use of AGA Report No. 8 (5).
Individual manufacturers may have compensation for temperature and pressure and its effects on the meter itself and will be discussed later in this report.
For the reasons mentioned above and others, the installation can be simplified and reduced in size and overall cost.
Principle of Operation
When a fluid particle inside a rotating body moves away or toward the center of rotation, the particle creates an inertial force (known as the Coriolis force) that acts on the body. (1) In this case, the tube of a Coriolis flow meter is the body.
Coriolis meters typically comprise of one or two tubes which oscillate amongst their own axis. In a dual tube meter, the tubes are typically referenced to each other with electro-dynamic sensors or “pickoff” coils which are located near the inlet and outlet of each tube. An exciter or drive coil is typically placed near the center of each of the tubes and will oscillate the tubes at a frequency determined by the design of the meter and the fluid which is present at the time.
In liquid or gas measurements, the oscillation frequency is inversely proportional to the density of the fluid. The heavier the fluid the lower the oscillation frequency will be. With gases, the use of oscillation frequency does not provide a satisfactory level of resolution to properly determine the flowing density of the gas accurate enough and at this point is not typically utilized. Knowing the mass flow and differential pressure across the meter is actually a much better way to back into the flowing density of a gas stream if needed. On the other hand, for liquids, the resolution of density can be evaluated in the order of ±0.0005 g/cc.

When a mass of fluid (gas/liquid) flows through the meter, each tube experiences what is called the Coriolis force. The force causes each tube to deflect where the inlet and outlet become out of phase. The detection of the phase shift, or “offset” as it is commonly referred to, is measured by the electro-dynamic sensors at the inlet and outlet of the meter. This amount of phase offset is dependent on individual manufacturer’s designs and is directly proportional to the mass flow.
Figure 1 is an example of a dual tube design which shows the tubes with an exaggerated amount of movement in an oscillatory state with zero flow.
Figure 2 gives a visual of what the tube looks like when flow of either gas or liquid begins to move through this rotational frame. A Coriolis force is experienced and the tubes begin to deflect.
Figure 1: Dual tube design with zero flow Figure 2: Dual tube design with flow
Figure 3 is an example of a single tube with flow along with the graphing of each individual pickoff coil signal.
Figure 3: Single tube with flow rate illustrating the pickoff coils plotting out phase offset detection
Different manufacturers will have different amount of movement or amplitude depending upon designs. One particular manufacturer moves the tubes less than .050 mm. This in itself is an indication of how sensitive the measuring techniques have become with modern technology. On the other hand, they are resistant to vibration and other external influences and these become proprietary discussions and techniques utilized by the different manufactures. The ability to read several phase offsets and update the mass flow measurement in the order of milliseconds is just another example of how far technology has allowed Coriolis to advance.

Benefits in Using Coriolis Flow Meters
Coriolis Mass Flowmeters offer great advantage over volumetric based flow measurement technologies, including:
• No moving parts or bearings which will wear in dry gas.• No straight run requirements needed for the majority of manufacturer’s designs.• No flow conditioning needed for the majority of manufacturer’s designs.• Tolerable to solids/liquid particulates which can damage orifice plates and turbines.• Can handle an over range of flow which can damage mechanical metering.• No external temperature or pressure measurement required in most cases.• Immune to fluid property and compositional changes.• Coating of the tubes can actually be detected. (Dependent on manufacturer). • Diagnostics which allow continuous monitoring for corrosion, erosion or buildup.• No sensing lines to plug, freeze or leak• Wide turndown ratio demonstrated at 150:1*
* Typical spec. of 50:1 and dependent on allowable dp, gas density and velocity)150:1 was on testing of high pressure natural gas at CEESI (1190 Psia & 77 F)
Specific manufacturers have designs which are mechanically built to isolate the measuring tubes from mechanical stress and external forces. Immunity to pipeline vibration, with excellent stability and accuracy is also a feature that can now be sourced. To put it simply, this means no brackets or supports required for the installation. If the piping system will support the meter, then there is no need to provide isolative support. This will lower the installation costs. The stability of the zero point is also very important when evaluating performance of a Coriolis flow metering. Stability means there is no significant shift or phase offset detected when there is zero flow.
The benefits that come with mass flow are enormous. Although there is a substantial install base and several reports out that prove how tolerable this technology is on gas flow measurement, there still seems to be hesitancy or a lack of knowledge within the gas measurement industry on the implementation of Coriolis and the use of mass flow i.e. “standard volume” for their measurement needs. One reason would be the thought that these meters can’t handle the range of gas flow and that size limitation would eliminate the ability to select Coriolis. This report will give an update on what’s new for the industry as well as detail some testing which was performed by Colorado Engineering Experiment Station, Inc. (CEESI) in Iowa. Cost could also be a factor when one is initially evaluating the use of Coriolis flowmeters. They tend to be more pricy than your traditional volumetric based primary elements, but when the total installed and operating cost is evaluated in more detail, one will see the benefits really stand out and can outweigh the cost difference.
Installation effects have been evaluated by several independent testing facilities and one specifically on natural gas was performed several years ago by Southwest Research Institute (SwRI) and showed that the “bent-tube designs showed insignificant flow measurement error when subjected to a variety of upstream piping configurations.”(3) This report will highlight continued testing and proven performance in multiple high level flow disturbances.

What’s New for the Industry in Gas Measurement?
Large Coriolis Flow Meters!
Independent testing, conducted by the Colorado Engineering Experiment Station, Inc. (CEESI) confirms a newly released 10-inch Coriolis flowmeter to perform well within the custody transfer gas accuracy specifications of 1.0% as described in the American Gas Association (AGA) Report No. 11. Meter performance shown later in this report is within the specified accuracy of ±0.35% ± [(Zero Stability/Actual Reading)*100] % taking into account the uncertainty of the calibration facility of ±0.23%. Meter proved to perform extremely well in both ideal and non-ideal piping orientations.
Turndown ratio or range ability exceeded all expectations and demonstrated custody transfer level accuracies in the range of 150:1. Typical specifications would more likely be in the range of 50:1 or less depending on the gas density and allowable pressure drop. Velocities tested at CEESI were way outside of typical pipeline or gas flow standard practices. The flow rate through the Coriolis meter was compared to three Daniel 12-inch turbine meters at 300 lb/s (Velocity of 158 ft/s in a 10-inch pipeline) and went all the way down to one 4-inch Daniel turbine at 2 lb/s (Velocity of 1 ft/s in 10-inch pipeline). In between each test point the metering system was given a sufficient amount of time to stabilize prior to taking the data.
Third Party Testing of Large Size Coriolis in Natural Gas
Performance specifications within AGA 11 are describe and illustrated below in Figure 4. The meters ability to repeat within ±1.0% below Q transitional and ±0.5% above and with an average mean error of less than ±1.0% is after the final meter factors are applied. This allows an Operator/Designer to have the meter third party certified and adjust the final meter factor to match up with an accredited calibration facility. CEESI, which was used to test the newly released 10 inch Promass from Endress+Hauser has an advertised uncertainty on mass flow of ±0.23% and is ISO/IEC 17025 certified by the National Voluntary Laboratory Accreditation Program (NVLAP). See Appendix A for copy of their certificate. All in all, Coriolis meters are performing out-of-the-box near the uncertainty of the calibration facility. Several tests have shown that Coriolis meters, depending on the manufacturer and design, could meet the specifications eliminating the need for any additional meter factors. It is still the option of the Operator/Designer to have the meter re-calibrated if they still desire. They can fine tune the meter with multiple k factors or implement other linearization and adjustment functions in either a flow computer or within the electronics of the meter depending on the manufacturer’s capability.

AGA 11 Repot No. 11 Performance Requirements
Figure 4: AGA Performance Specification Summary

Previously, a 6 and 4-inch flowmeter were confirmed to perform within the same custody transfer specifications at Pigsar/Ruhrgas in Germany.
Figure 5: Illustration of Endress+Hauser Promass Coriolis meter installed at Pigsar
Figure 6: Results of tests of natural gas measurements in the PIGSAR calibration institute. Endress+Hauser Promass F, the DN 150 / 6” model, proved just as efficient as the smaller versions of
the meter tested prior at both 20 and 50 bar.
In 2004, CEESI conducted calibration water, air, dry gas and wet-gas tests on Coriolis Mass Flowmeter. This testing was sponsored by the Gas Research Institute and the results are reported in GRI-04/0172. The single calibration fluid tests show that a water calibration of the Coriolis mass flowmeter can be used for transferability over to specified accuracies in natural gas applications without deviation in the k-factor. (4)
This was also proven by the calibration test which was run on a new 10-inch Coriolis at CEESI. The meter was certified and calibrated on water (see Appendix B – calibration certificate of a particular manufacturer). It then performed in gas within the specification which is ±0.35% plus the zero stability. See the sizing, accuracy curve and pressure drop calculation from a sizing program in Figure 8.
Figure 7: Installation of 10-inch Promass Coriolis of Endress+Hauser at CEESI in Iowa
Figure 8: Example of a sizing and specification software giving expected accuracy data as well as pressure drop information.

Results and Test Description of 10-Inch Coriolis Meter at CEESI
Natural gas flowing through CEESI’s facility in Iowa is taken from the Northern Border Pipeline, ran through the calibration facility where temperature, pressure and gas composition is evaluated and compensated for compressibility. It is then converted to mass by taken the volumetric flow in standard cubic feet and simply multiplying it by the reference or standard density in lbs/ft^3 at 519.67 degrees Rankine and 14.696 Psia . The gas is compensated for compressibility and composition according to AGA 8 (5) calculations. This is then compared directly to the mass flow reading from the Coriolis meter. The Coriolis meter does not need the temperature or pressure reading to make any adjustments to the fluid component.
On the other hand, different manufacturers will specify an accuracy effect due to the pressure and temperature effect it has on the metering tubes themselves. For the highest degree of accuracy, this needs to be corrected for. For one particular manufacturer, the temperature correction is ±0.0001% of full scale per degree F and is compensated for in the meter. The pressure effect has a higher negative bias offset due to the stiffening of the tubesat higher pressure. For the 10 inch model, this offset is specified at -0.0006/psi, so for 1200 psi operating conditions at CEESI in Iowa, it is determined to be .72% adjustment. If the pressure condition is constant or stable, one can program directly into the meter the pressure value. If the operating condition is more dynamic and has extreme pressure swings, then taking a pressure reading live into the meter electronics is also possible for optimization of accuracy.
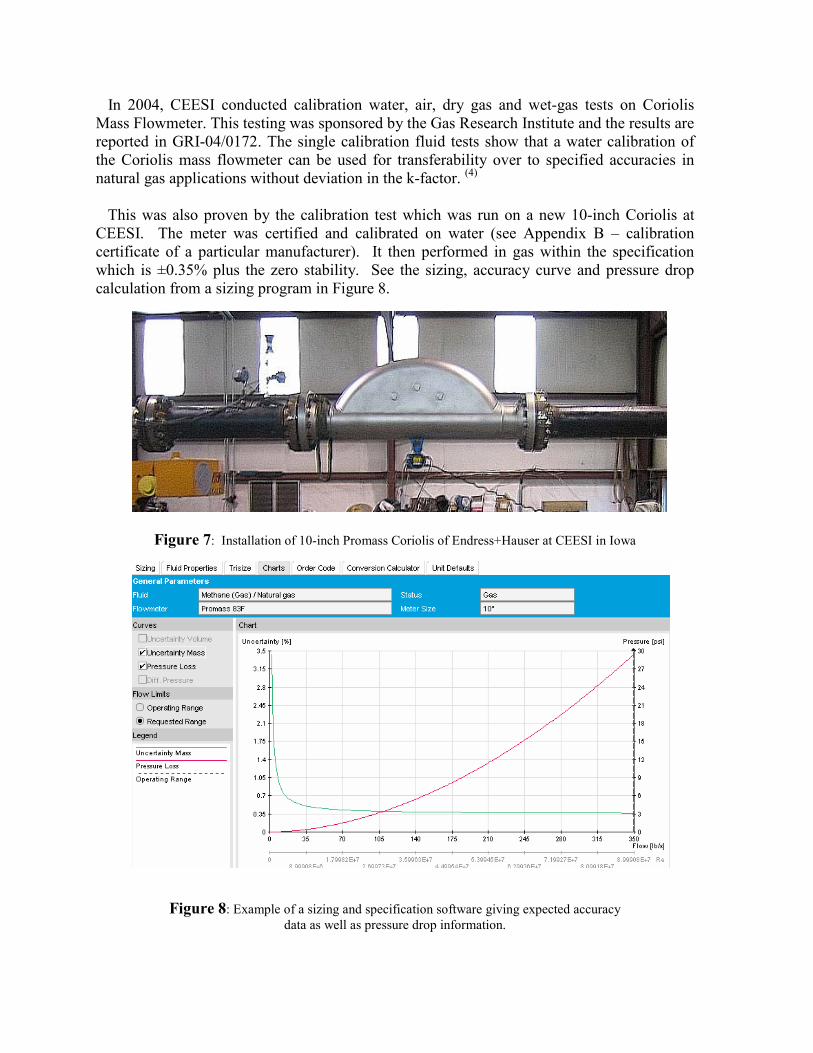
Test 1 & 2: Straight Run Test
This was a baseline test which we allowed over 40 diameters of straight pipe coming into the meter after it reduced from 12 inch to 10 inch and then the downstream flow had at least 20 diameters prior to expansion back into the larger size diameter pipeline. The meter was installed with no support and also no flow conditioning. The meter zero was checked under pressure conditions and the amount the value had changed from factory calibration was very small. Flange alignments were centered by the technicians, yet no dowel pin alignment was used.
Pressure drop data was captured yet showed extreme deviation from calculated hydraulics and appears to be a result of the pressure tap location downstream of the meter. Future testing may be needed to verify the entire pressure recovery zone downstream of the Coriolis meter.
Results were extremely good and showed a slight tail off on the low end yet were still in the specified accuracy of the meter as well as within the requirements of AGA 11. Test 2 was a reproducibility check which looked good as well. The data in Figure 10 has the uncertainty of ±0.23% from CEESI’s calculation indicated on the graph.
Test 1 & 2
Figure 9: Picture of Installation with Pressure measurements upstream and downstream of meter
Test 1 & 2 Results
Figure 10: Testing of 10-Inch in over 40 diameter of straight run
10" Endress+Hauser Promass Coriolis Meter Straight run of pipe with over 40 diameters from 12" x 10" reducer, no flow conditioner
-2.0
-1.5
-1.0
-0.5
0.0
0.5
1.0
1.5
2.0
0.00 50.00 100.00 150.00 200.00 250.00 300.00
Mass Flow Rate, lb/ s
Percent D
eviatio
n
Test #1 Test #2
Q-min
Qt (10% of Qmax) Q-max
Uncertainty of CEESI Natural Gas Data+/ - 0.23%
585 487 97 292 195 390 0 MMSCFD

Test 3: Elbows Out of Plane and 10 Diameters Upstream of Meter
In this setup we reconfigured the piping to create a flow disturbance which would likelyexist in the real world due to piping or space limitations. Again, no flow conditioner wasused and the piping was aligned by best practices like before. Results were quite impressiveand seem to be very repeatable and flat in comparison to the straight run test. See Figure 12below.
Test 3
Figure 11: Picture of Installation for flow disturbance and only 10D
Figure 12: Results from Test 3 with elbows out of plane and only 10D
10" Endress+Hauser Promass Coriolis Meter(2) 90 degree elbow out of plane with 5D, 90 degree elbow and 10D straight pipe, no flow conditioner
-2.0
-1.5
-1.0
-0.5
0.0
0.5
1.0
1.5
2.0
0.00 50.00 100.00 150.00 200.00 250.00 300.00
Mass Flow Rate, lb/ s
Percent D
eviation
Test #3
Q-min
Qt (10% of Qmax) Q-max
Uncertainty of CEESI Natural Gas Data+/ - 0.23%
585 487 97 292 195 390 0 MMSCFD
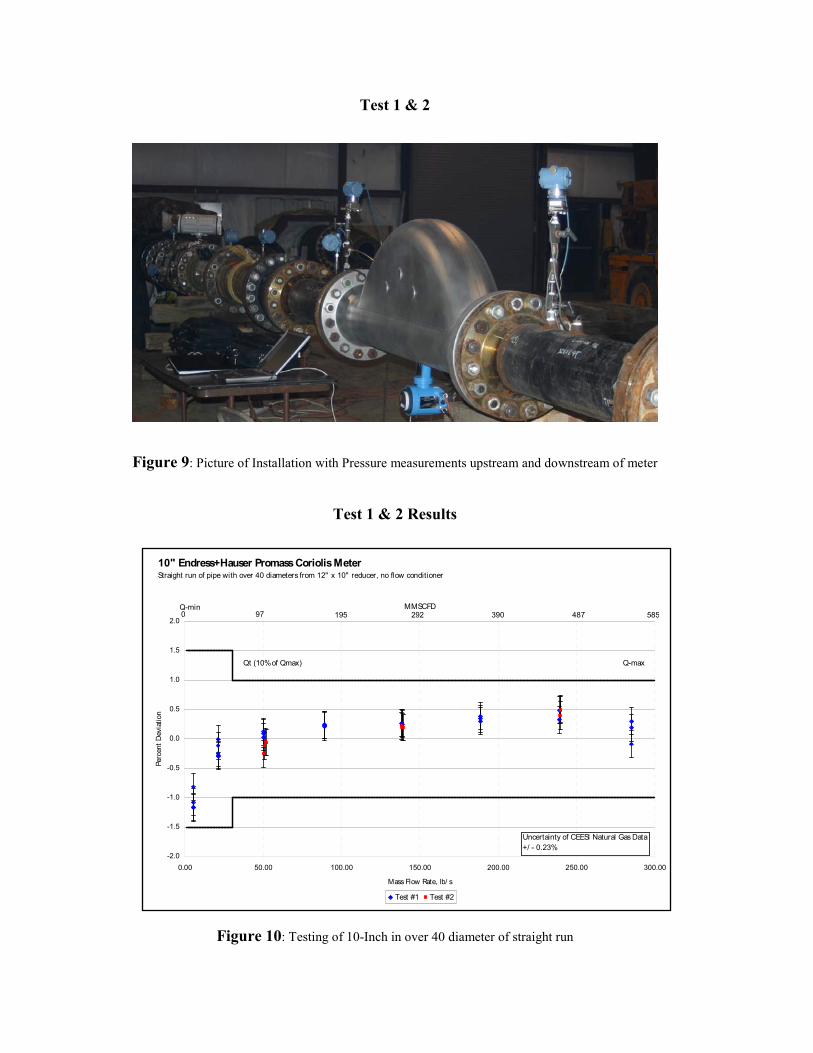
Test 4 & 5: Elbows Out of Plane and 0 Diameters Upstream of Meter
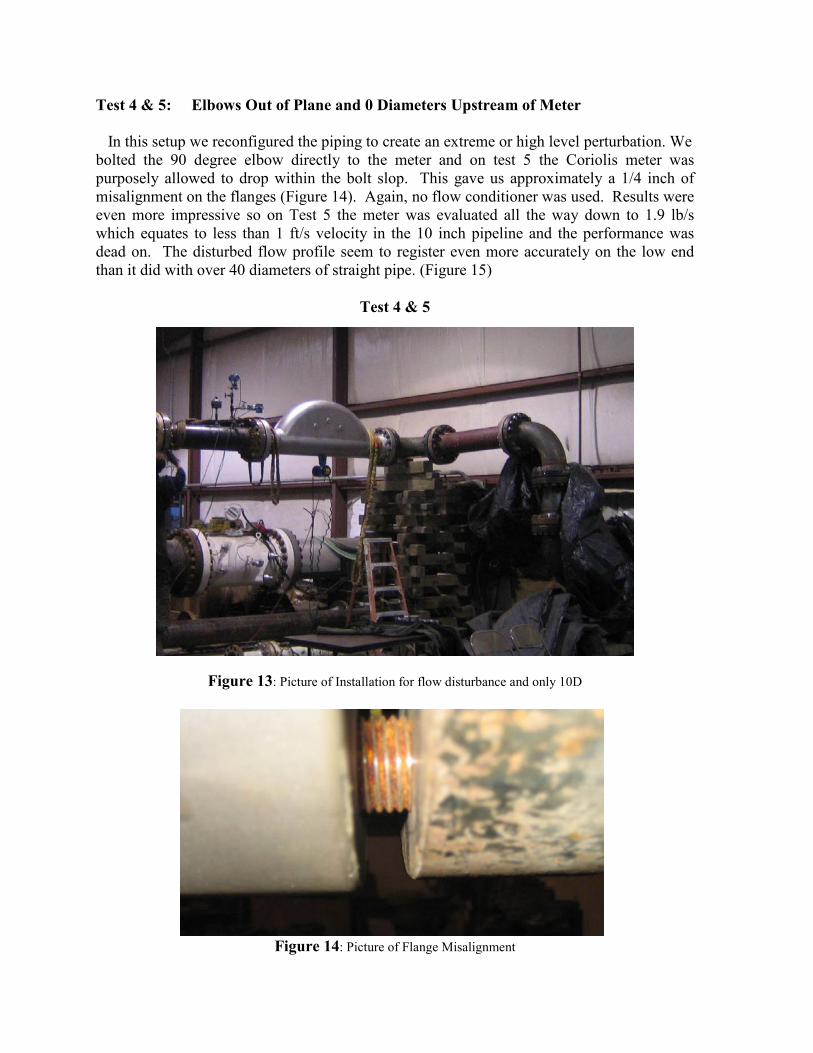
In this setup we reconfigured the piping to create an extreme or high level perturbation. Webolted the 90 degree elbow directly to the meter and on test 5 the Coriolis meter was purposely allowed to drop within the bolt slop. This gave us approximately a 1/4 inch of misalignment on the flanges (Figure 14). Again, no flow conditioner was used. Results were even more impressive so on Test 5 the meter was evaluated all the way down to 1.9 lb/s which equates to less than 1 ft/s velocity in the 10 inch pipeline and the performance was dead on. The disturbed flow profile seem to register even more accurately on the low end than it did with over 40 diameters of straight pipe. (Figure 15)
Test 4 & 5
Figure 13: Picture of Installation for flow disturbance and only 10D
Figure 14: Picture of Flange Misalignment

Test 4 & 5 Results
Figure 15: Results from Test 4 & 5 with elbows out of plane and 90 bolted directly to Coriolis
Summary of All Tests
Figure 16: Results from all tests with the manufacturer specification curves
10" Endress+Hauser Promass Coriolis MeterDouble elbows out of plane with 12" x 10" reducer between, 5D, 90 bolted directly to Coriolis meter
-2.0
-1.5
-1.0
-0.5
0.0
0.5
1.0
1.5
2.0
0.00 50.00 100.00 150.00 200.00 250.00 300.00
Mass Flow Rate, lb/ s
Percent D
eviation
Test #5 Test #4
Q-min
Qt (10% of Qmax) Q-max
Uncertainty of CEESI Natural Gas Data+/ - 0.23%
585 487 97 292 195 390 0
MMSCFD
10" Endress+Hauser Promass Coriolis MeterCEESI High Flow Natural Gas Calibration Testing Facility - All Data
-2.0
-1.5
-1.0
-0.5
0.0
0.5
1.0
1.5
2.0
0 50 100 150 200 250 300
Mass Flow Rate, lb/ s
Percent D
eviation
Test #CP Test #1 Test #2 Test #3 Test #4 Test #5 UCL LCL
Q-min
Qt (10% of Qmax) Q-max
Typical flow range for natural gas pipeline operation
Uncertainty of CEESI Natural Gas Data+/ - 0.23%
585 487 97 292 195 390 0
MMSCFD

Example of Total Installed and Operating Cost Comparison
Below is an example of a study performed by a major petrochemical company on an allocation meter for a particular gas coming into the plant. Figure 17 below points out all of the different issues which could play a factor in the overall installed and operating cost outside of the initial purchase price. In the example below, the payback was calculated to less than six months just due to the improvement on the uncertainty of the measurement only. As one can see, there is much more than just the measurement accuracy which can affect the total installed or operating cost of a measurement point. Other items like leak points and secondary containment issues were not discussed in detail, yet are all positive issues with the Coriolis meter and that the fact there are little or no moving parts, the overall maintenance of the measurement will be reduced.
Figure 17: Example of radar plot between Coriolis and Inferred mass volumetric meter
Conclusion
Meter sizes, performance and overall immunity to flow profile and compositional factors have surpassed most expectations within the industry. The following are conclusions which were drawn from the independent testing and data made available in this report.
1. Calibration of Coriolis flow meters on water is transferable over to gas measurement within the gas specification of each individual manufacturer.
2. Customers should get the manufacturers specifications on the effects of Pressure and Temperature for their particular design and if needed, plug the values into the meter for proper compensation.
3. Depending on manufacturer, Coriolis flow meters can have extremely good turndown ratios in excess of 50:1. Typically seen on higher pressure gases.
100:120:1 50:110:15:1
2
4
6
8
25
15
10
5
0.5
0.1
1.0
5.0
0.1
0.5
1.0
5.0
.01
1
2
6
1
4
8
12
2 4 8 12
% of reading
Turndown
Replacement period(years)
Human Intervention(times / year)
No. of components
% drift per year
calibration frequency(times / year)
Points of potentialleakage
Coriolis meter
Inferred mass meter
4. Flow profile disturbances and swirl flow have little or no impact on the measurement accuracy. In this particular report, it enhanced the measurement.
5. Mass based measurement of natural gas eliminates many factors which go into the calculation of the overall measurement uncertainty in volumetric based measurement. Temperature, pressure, compressibility, expansion coefficients, flow profile and wear on moving parts is just to name a few.
6. Larger size Coriolis meters and their extreme sensitivity on the low end of the measurement allows one to properly size these meters with an acceptable pressure drop. It should also be pointed out that flow strainers, long runs of piping and flow conditioners can all be removed and therefore will help in the overall pressure drop evaluation.
References
1. AGA [2003]. Measurement of Natural Gas by Coriolis Meter. American Gas Association Transmission Measurement Committee, AGA Report No. 11 / API MPMS 14.9. Arlington, VA.
2. AGA [2001]. Coriolis Flow Measurement for Natural Gas Applications. American Gas Association Transmission Measurement Committee, Engineering Technical Note. Arlington, VA.
3. Pipeline & Gas Journal [2002]. Coriolis Suggests It Can Serve In Custody Transfer Applications. Terrence A. Grimley, Southwest Research Institute. San Antonio, TX
4. Gas Research Institute, GRI-04/0172 [2004]. Coriolis Mass Flow Meter Performance With Water, Air, Dry-Gas & Wet-Gas. Charles L. Britton / Josh Kinney, Colorado Engineering Experiment Station, Inc. Nunn, CO
5. AGA [1994]. Compressibility Factor of Natural Gas and Related Hydrocarbons. American Gas Association Transmission Measurement Committee, AGA Report No. 8. Arlington, VA.

Appendix A

Appendix B