
corfu
73
Work Package: WP3 Impact Assessment Document Name: Flood Impact Assessment Literature Review Date: 15 August 2014 Report Number: D3.1 Revision Number: 2 Deliverable Number: D3.1 Due date for deliverable: 31 December 2010 Actual submission date: 15 August 2014 Author: University of Exeter ************************* CORFU is co-funded by the European Community Seventh Framework Programme. CORFU is a Collaborative Project in the FP7 Environment Programme Start date April 2010, duration 4 Years. ****************************** Document Dissemination: PU (Public dissemination) Co-ordinator: University of Exeter, United Kingdom Project Contract No: 244047 Project website: www.corfu7.eu ACKNOWLEDGEMENTS The work described in this publication was supported by the European Community’s Seventh Framework Programme through the grant to the budget of CORFU Collaborative Research on Flood Resilience in Urban Areas, Contract 244047. DISCLAIMER This document reflects only the authors’ views and not those of the European Community. The work may rely on data from sources external to the CORFU consortium. Members of the Consortium do not accept liability for loss or damage suffered by any third party as a result of errors or inaccuracies in such data. The information in this document is provided “as is” and no guarantee or warranty is given that the information is fit for any particular purpose. The user thereof uses the information at its sole risk and neither the European Commission nor any member of the CORFU Consortium is liable for any use that may be made of the information.
-
Upload
oscar-galindo-rosete -
Category
Engineering
-
view
113 -
download
6
Transcript of corfu

Work Package: WP3 Impact Assessment
Document Name: Flood Impact Assessment Literature
Review
Date: 15 August 2014 Report Number: D3.1
Revision Number: 2 Deliverable Number: D3.1 Due date for deliverable: 31 December 2010 Actual submission date: 15 August 2014 Author: University of Exeter
*************************
CORFU is co-funded by the European Community
Seventh Framework Programme. CORFU is a Collaborative Project in the FP7 Environment Programme
Start date April 2010, duration 4 Years.
******************************
Document Dissemination: PU (Public dissemination)
Co-ordinator: University of Exeter, United Kingdom
Project Contract No: 244047
Project website: www.corfu7.eu
ACKNOWLEDGEMENTS
The work described in this publication was supported by the European Community’s Seventh Framework Programme through the grant to the budget of CORFU
Collaborative Research on Flood Resilience in Urban Areas, Contract 244047.
DISCLAIMER
This document reflects only the authors’ views and not those of the European Community. The work may rely on data from sources external to the CORFU
consortium. Members of the Consortium do not accept liability for loss or damage suffered by any third party as a result of errors or inaccuracies in such data. The
information in this document is provided “as is” and no guarantee or warranty is given that the information is fit for any particular purpose. The user thereof uses the
information at its sole risk and neither the European Commission nor any member of the CORFU Consortium is liable for any use that may be made of the information.

Project Report Contract no. 244047 _________________________________________________________________________________________________________________
2
©CORFU Consortium
DOCUMENT INFORMATION:
Title
Flood Impact Assessment Literature Review
Lead Authors
Michael Hammond
Contributors
Slobodan Djordjevic, David Butler, Albert Chen
Distribution
PU - Public
Document
Reference
WP3/D3.1
DOCUMENT HISTORY:
Date Revision Prepared by Organisation Approved by Notes
23 March 2011 1 MJH UoE SJD
15 August 2014 2 MJH UoE SDj Minor
modifications
Click here to enter
a date.
Click here to enter
a date.
Click here to enter
a date.
Click here to enter
a date.
Click here to enter
a date.

Project Report Contract no. 244047 _________________________________________________________________________________________________________________
3
SUMMARY
This report is a literature review on flood damage approaches and models with suggestion for model
adaption, including the report on assessed damages in case study cities.

Project Report Contract no. 244047 _________________________________________________________________________________________________________________
4
Flood Impact Assessment – A Literature Review
Contents 1 Introduction .................................................................................................................................... 6
1.1 Flood damages, impacts, consequences, costs and losses ..................................................... 6
1.2 The importance of flood impact assessment .......................................................................... 7
1.3 The problem of divergent flood damage estimates ............................................................... 9
1.4 The benefits of a common approach to flood impact assessment ....................................... 10
1.5 Some problematic areas in flood impact assessment .......................................................... 11
1.6 Typology of damage .............................................................................................................. 12
1.7 Study scale ............................................................................................................................ 14
1.8 Ex-ante and ex-post estimates of flood damage .................................................................. 14
2 Tangible damage estimation ......................................................................................................... 16
2.1 Direct tangible damage ......................................................................................................... 16
2.2 Data requirements ................................................................................................................ 16
Land-use data ................................................................................................................................ 16
Determination of the assets at risk ............................................................................................... 17
Damage function data ................................................................................................................... 18
Development and Application of models ..................................................................................... 22
2.3 Indirect tangible damage ...................................................................................................... 24
Simple empirical methods ............................................................................................................ 24
Econometric models ..................................................................................................................... 26
Input-output (I-O) modelling ........................................................................................................ 26
Computational General Equilibrium models ................................................................................ 30
3 Intangible damage ........................................................................................................................ 32
3.1 Health impacts ...................................................................................................................... 32
Physical health impacts of flooding .............................................................................................. 34
Diseases ......................................................................................................................................... 37
Psychological impacts of flooding ................................................................................................. 38
Social Vulnerability ........................................................................................................................ 41

Project Report Contract no. 244047 _________________________________________________________________________________________________________________
5
3.2 Quantification of health impacts .......................................................................................... 42
Direct measures of health impacts ............................................................................................... 43
QALYs and DALYs .......................................................................................................................... 43
3.3 Monetisation of intangible impacts ...................................................................................... 45
Placing a value on human life and health ..................................................................................... 45
Valuing other intangible impacts .................................................................................................. 47
Other techniques of incorporating intangible damage in an impact assessment ........................ 48
4 Work in the case study areas ........................................................................................................ 49
4.1 Barcelona .............................................................................................................................. 49
INUNCAT methodology ................................................................................................................. 49
SW0801 methodology................................................................................................................... 52
ACA simplified methodology ......................................................................................................... 55
4.2 Hamburg ............................................................................................................................... 56
4.3 Nice ....................................................................................................................................... 57
4.4 Taipei ..................................................................................................................................... 57
4.5 Mumbai ................................................................................................................................. 60
Ex-post estimates of the impacts from the 2005 Flood ................................................................ 60
4.6 Dhaka, Bangladesh ................................................................................................................ 63
4.7 Beijing, China......................................................................................................................... 63
5 Conclusions ................................................................................................................................... 67
6 References .................................................................................................................................... 68

Project Report Contract no. 244047 _________________________________________________________________________________________________________________
6
1 Introduction
The impacts of flooding on urban populations can be multi-faceted and wide-ranging. The
objective of Work Package 3 is to develop a comprehensive and flexible framework that will
combine different methodologies for the evaluation of all types of damage. This can mean
the damage that is caused to property, interruptions to the economy, and the impacts on
human health, which could include the loss of life and injury, as well as outbreaks of
diseases that can occur following flooding. An improved knowledge of the flood impacts
should enable the assessment of the vulnerability of cities, and allow for the evaluation of
different flood risk management strategies and their effectiveness.
This report is intended to provide a systematic, objective and critical review of the existing
approaches, models and results of their application, to provide a comprehensive insight to
their data requirements, their applicability and their limitations. This review will describe
some of the gaps within the literature, and consider how, as part of the CORFU project, they
may be filled. This review will, in particular, focus on estimates that have been made in or
near the case study cities, and will include estimates from real historical events.
Messner et al (2007) produced guidelines for flood damage estimation as part of the
European Commission-funded FLOODsite project. That report was comprehensive in many
areas, and it is unnecessary to repeat those sections for their own sake. However, the
principal purpose of that report was to provide guidelines for practitioners on ex-ante flood
damage evaluation. The focus of this report is to critically assess the different
methodologies, and their appropriateness for use in the case study cities.
This review will also draw on information from several ongoing European research projects,
including ConHaz (Cost of Natural Hazards), ENSURE (Enhancing resilience of communities
and territories facing natural and na-tech hazards), and CapHazNet (Social Capacity building
for natural hazards toward more resilient societies). ConHaz is a project that specifically
aims to synthesise current cost assessment methods and strengthen the role of cost
assessment in the development of natural hazard management and adaptation planning.
The ConHaz project involves a range of natural hazards, including droughts, floods, storms,
coastal hazards, and alpine hazards, whereas the CORFU project only considers flooding.
This review also sources review papers in the published literature (Merz et al., 2010).
1.1 Flood damages, impacts, consequences, costs and losses
The terms ‘flood damage’, ‘flood impact’, ‘flood consequences’ and ‘flood loss’ are used
regularly in the technical literature. To avoid confusion on the part of the reader, these
terms will be defined and explained. These terms should be used consistently throughout
this report and the CORFU project.

Project Report Contract no. 244047 _________________________________________________________________________________________________________________
7
The terms ‘flood consequences’ and ‘flood impacts’ are synonymous, and both refer to the
broad effects that flooding can have on people, to property and to the environment. These
consequences or impacts can be both positive and negative, although it is common in the
literature to see the terms used in a purely negative sense, especially in relation to human
health, where health impact assessments are conducted (Fewtrell et al., 2008). The terms
‘loss’ and ‘damage’ are also used synonymously in the literature. Damage is the negative
result of the spatial and temporal impact of an event on societal elements (people,
buildings, etc.), societal processes (interruption of production, services, etc.) and the
environment (Vetere Arellano et al., 2003).
The positive effects of flooding are referred to as the ‘benefits’ of flooding. In a report by
the National Research Council of the United States, losses were differentiated from the
term ‘costs’, with the latter referring to only to the payouts made by governments and
insurers, whereas ‘losses’ had a broader connotation (Committee on Assessing the Costs of
Natural Disasters, 1999).
For consistency, this report will use the term ‘impact’ in place of ‘consequence’, but
‘damage’ and ‘loss’ can be considered to be interchangeable. Additionally, this report
makes the stylistic decision to use ‘damage’ to refer to both singular and multiple negative
impacts, avoiding the use of the word ‘damages’, which does occur in the literature. The
term ‘costs’ when used will not be considered synonymous with damage or loss.
1.2 The importance of flood impact assessment
Flood impact assessment is a key component of the practice of flood risk management.
Flood risk is defined in the European Flood Directive as “the combination of the probability
of a flood event and of the potential adverse impacts on human health, the environment,
cultural heritage and economic activity associated with a flood event” (European
Commission, 2007). There are several similar definitions in the literature, that agree that
flood risk is the probability of a certain flood event, in combination with its impact
(DEFRA/EA, 2006). With this definition, flood impact is therefore one half of the flood risk
equation.
The estimates of the impacts caused by flooding can be used by a number of stakeholders
for different purposes and these are summarised in Table 1 (Vetere-Arellano et al., 2003).

Project Report Contract no. 244047 _________________________________________________________________________________________________________________
8
Table 1 - Areas where damage estimation results can be used (adapted from Vetere-Arellano et al, 2003)
Area Description of possible damage estimation input
Decision making and risk
management
To assist decision makers in carrying put adequate
risk management policy initiatives
Policy-making To assist policy makers in preparing, revising and
updating existing legislationso as to ensure
optimum protection of the citizen
Civil protection To assist competent authorities to target civil
protection methods
Spatial and land-use planning To assist urban, rural and regional planners to
adopt both prevention and mitigation measures to
face potential threats
Emergency preparedness and
response
To assist competent authorities in the preparation,
revision, and updating of emergency plans
Disaster recovery/relief To assist in prioritising and better targeting the
allocation of disaster recovery and relief resources
Construction and re-construction To assist managers of buildings and other
vulnerable facilities to improve construction
practice
Insurance and reinsurance To provide feedback to insurance and reinsurance
companies, so that premiums can be established
Damage estimation practice To improve damage estimation techniques
Damage estimation research To identify areas of research where advances can
be made, as well as providing a better
understanding of hazards and how they impact on
societies.
Flood damage estimates are, therefore, useful at all the stages of what is known as the
Flood Mitigation Cycle, shown in Figure 1 (Mark and Djordjevic, 2006). The Flood Mitigation
Cycle forms the basis for the development of strategies for flood protection and flood
responses. The flood mitigation cycle can be considered as three stages, by considering the

Project Report Contract no. 244047 _________________________________________________________________________________________________________________
9
strategies that affect the system’s response, relative to the timing of the flood. The
strategies can be considered as those which:
Aim at improving the system’s readiness and preparedness prior to a flood event;
Aim at improving the system’s response during a flood event;
Aim at improving the system’s recovery following a flood event.
Figure 1 - Flood Mitigation Cycle (taken from Mark and Djordjevic (2006))
1.3 The problem of divergent flood damage estimates
As flood impact assessment is so critical to the practice of flood risk management, any
estimates of damage should be as reliable and as accurate as possible. However, there is no
common methodology that is applied to estimate flood damage internationally.
As part of the EU-funded FLOODsite project, Meyer and Messner (2005) described the
variety of methods that are used in four European states (the UK, Germany, the Netherlands
and the Czech Republic). The differences related to a) the objective of the evaluation, (b)
the damage categories considered, (c) the level of detail, (d) the scale of the analysis and (e)
the basic evaluation principles. Vetere-Arellano et al (2003) demonstrated the variety of
methods employed in other European countries, including Bulgaria, Greece and Sweden. As
this report will show, these different methods have their advantages and disadvantages,
relying as they do on different assumptions.
There is also a difficulty in obtaining reliable historical flood damage estimates on which to
base research into flood damage estimation. Downton and Pielke (2005) studied flood

Project Report Contract no. 244047 _________________________________________________________________________________________________________________
10
damage estimates in the US, and concluded that there were often significant differences
between estimates made by different agencies. These differences were more acute for
floods that had occurred in small, localised areas, while these differences were averaged out
over larger and more extensive floods. The damage estimates used in this study had been
collected using a variety of methods, including working with local officials, insurance agents
and newspaper reports, as well as detailed surveys that might take up to five years after an
event to complete.
A report by the National Research Council of the US stated that
“Somewhat surprisingly, however, the total economic losses that natural
disasters cause the nation are not consistently calculated. Following a natural
disaster, different agencies and organizations provide damage estimates, but
these estimates usually vary widely, cover a range of costs, and change (usually
increasing) through time. There is no widely accepted framework or formula for
estimating the losses of natural disasters to the nation” (Committee on Assessing
the Costs of Natural Disasters, 1999).
It has been noted that in general, disaster damage data are of poor quality, and collected
using a variety of different methods for different purposes (Bouwer et al., 2007). Much of
the data is held by disparate organisations such as insurance companies, government
agencies and research bodies. A notable database on disasters is the EM-DAT database held
at the Centre for Research on the Epidemiology of Disasters (CRED) in Belgium, which has
collected data on natural disasters since 1988. The database contains information on the
1.4 The benefits of a common approach to flood impact assessment
It has been argued that a common framework for the assessment of damage, conducted in a
consistent manner, including a variety of complementary models, would support policy and
decision making (Jonkman et al., 2008a). Such a methodology would reflect the complexity
and variety of impacts of flooding upon society. Lack of such an approach may lead to
inadequate flood risk management strategies, and therefore limited preparedness and the
inability to promote recovery following a flooding event.
The EU Flood Directive requires that EU member states should conduct an assessment of
the potential adverse consequences of future floods for human health, the environment,
cultural heritage and economic activity for major river basins (European Commission, 2007).
Tsakiris et al (2009) argue that developing a unified approach is a key technical issue in the
implementation of the Directive.

Project Report Contract no. 244047 _________________________________________________________________________________________________________________
11
A workshop was hosted at the University of Twente in 2003, as part of the European
Commission’s NEDIES project, to consider the feasibility of developing a common
methodology on the estimation of flood damage (NEDIES, 2003).
For such a unified approach, there would need to be unified vocabulary of concepts. The
methodology would however, have to take into consideration the fact that different
countries will be vulnerable to different types of flooding, and therefore their prioritisation
for certain consequences may be different. For example, the flash floods that affect cities
like Barcelona are different to the less responsive and longer lasting flood events that take
places on rivers such as the Danube.
1.5 Some problematic areas in flood impact assessment
The field of flood impact or damage assessment is not without its problems. Van der Veen
and Logtmeijer (2005) argued that there are five problems in the assessment of flood
damage.
a) There is no agreement on the economic points of departure. Financial appraisals are
confused with cost-benefit analyses (CBA). In the latter, the usual concept is
economic cost, which relates to opportunity costs in welfare economics, whereas a
financial appraisal is often used to assess the sum of money that should be
recovered for insurance purposes.
b) There is often confusion over temporal and spatial scales. A financial appraisal will
usually refer to a single organisation, whereas, conducted properly, a CBA will
require wider borders, such as that of a city, a region, or a nation, for example.
c) There is confusion over the definition of direct costs.
d) Stock concepts are confused with flow concepts
e) The boundary between direct and indirect costs is not well defined.
To counter these problems, Messner et al (2007) argued for six key principles of the
economic valuation of flood impacts
1. Define the appropriate time and spatial boundaries of the study
2. Apply scarcity prices for the evaluation of market goods
3. Only consider real effects, and ignore inflationary effects
4. Consider that stock and flow are two sides of the same economic coin, to avoid
double counting.
5. Apply depreciated values and not full replacement costs
6. Use the net present value of benefits and costs in the context of cost-benefit
analyses.

Project Report Contract no. 244047 _________________________________________________________________________________________________________________
12
Point 1) is important as it raises the issue of the difference between financial and economic
damage or losses. Financial losses refer to the sum of impacts upon individuals or
organisations, whereas economic losses take a broader approach and consider losses to a
regional or national economy as a whole. Consider an individual business that is flooded.
That business will lose trade for a period during the flood and the clean-up process.
However, in an ideally functioning economy, that trade will simply be transferred to another
business. As such, from the financial perspective there is a loss, but from the economic
perspective, there is no loss to the overall economy.
Pielke Jr (2000) describes some of the problems that exist with flood damage assessment.
Firstly, there is the problem of contingency. When a flood occurs, some damage caused will
be obviously apparent. However, there may be impacts that may be further reaching and
longer lasting. The analyst should consider carefully the signal of impacts, which may be
difficult to discern. Secondly, there is the problem of attribution, and understanding what
precisely has caused some damage. It may be well be that the damage is caused by the
flooding itself, but human action and poor planning may lead to some of the impacts.
Thirdly, there is the problem of measurement. The cost of repairing a damaged structure
may be clear, but the value of a human life is a trickier question. This also raises ethical
questions which the analyst will need to consider. Fourthly, there is the problem of
aggregation and scale. On an individual level, one organisation may benefit from flooding, as
it wins business that would otherwise have gone to a rival. However, on a regional or
national scale, the picture may be different. Finally, there is the problem of socio-economic
changes, which may lead to the problem of increasing damage over time from floods, from
no other reason than the increase in material wealth exposed to a flood hazard.
Overall, when assessing flood impacts, it can be argued that there is no one right way to
assess them. Therefore, it is important to make clear the assumptions that were made, the
categories that are being considered and the methodologies that are being used to assess
the impacts.
1.6 Typology of damage
To understand the damage or losses that floods can cause, it can be useful to categorise
them. Within the literature, there is a broad consensus on the categorisation of flood
damage.
The first distinction that is commonly made is between tangible and intangible damage. A
tangible damage is a damage that is capable of being assessed in monetary terms (Smith
and Ward, 1998). A similar but slightly different definition is given by Messner et al (2007),
who define a tangible damage as one that can be “easily specified in monetary terms”.
Project Report Contract no. 244047 _________________________________________________________________________________________________________________
13
Intangible are those, in contrast, which cannot be so easily specified. Tangible damage
includes the cost of physical damage to property, or the loss of business due to
interruptions in the economy during and following a flood event. Intangible damage might
include the loss of human life, or the increased burden of disease. The distinction between
the two is not necessarily clear, as there have been some attempts in the literature to
“monetise” intangible losses, through concepts such as Willingness to Pay (WTP), which will
be described later in this report. Because of this difficulty, some authors have provided a
slightly different definition, by describing tangible damage as that which can be priced
whereas intangible damage cannot be priced, and where no market exists (Jonkman et al.,
2008a). Parker (2000) makes a subtle distinction in describing intangible losses as those
where monetary estimates are considered to be undesirable or unacceptable.
The second common distinction is between direct and indirect damage. Typically, a direct
damage is defined as any loss that is caused by the immediate physical contact of flood
water with humans, property and the environment. An indirect damage is induced by the
direct impacts and may occur – in space or time – outside the flood event. Jonkman et al
(2008a) refer to direct losses as occurring within the flooded area, and indirect damage
occurring outside of the flooded area. Messner et al (2007) state that direct damage is
usually measured as damage stock, whereas an indirect damage relates to interruptions to
flows and linkages. Some authors describe an indirect damage as any damage that is simply
not caused directly by flooding, i.e. anything that is not a direct damage. From the
perspective of this review, the most appropriate definition of a direct damage is one that
arises from direct physical contact with the flood water, following the FLOODsite Project,
and an indirect damage is any damage that is not direct.
An additional distinction is made by Smith and Ward (1998), who state that both tangible
and intangible losses can be subdivided into primary and secondary damage. Primary
damage results from the event itself, and secondary damage is described as being at least
one causal step removed from the flood. An indirect tangible example might be the
disruption of trade in an area, which would be considered as a primary loss, whereas the
reduced spending power in the community would be a secondary loss. A direct intangible
example might be the loss of life through drowning, which would be a primary loss, whereas
the ill-health of flooded people would be a secondary loss. Parker (2000) even discusses the
idea of fixed tertiary losses that are even further removed from the flooding incident, but
few authors seem to have used this additional category. These additional categories may
complicate the question.
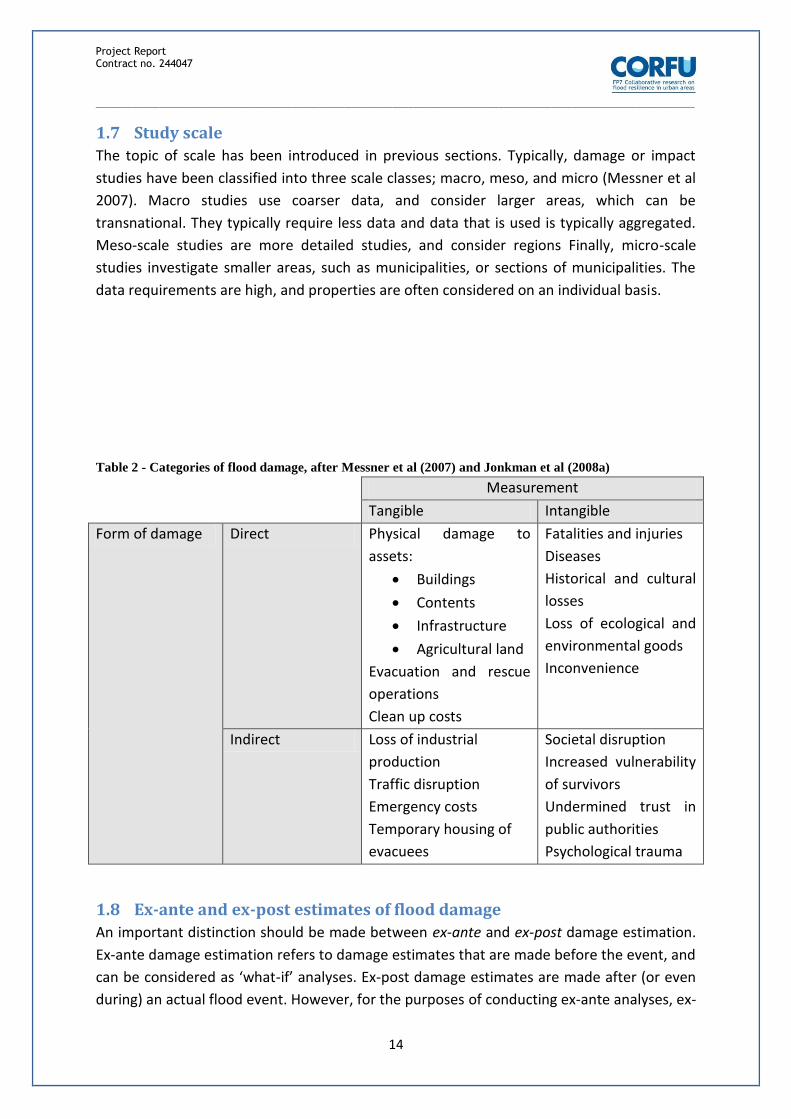
Table 2, adapted from Messner et al (2007) and Jonkman et al (2008a) shows the typology
of damage with examples of each.
Project Report Contract no. 244047 _________________________________________________________________________________________________________________
14
1.7 Study scale
The topic of scale has been introduced in previous sections. Typically, damage or impact
studies have been classified into three scale classes; macro, meso, and micro (Messner et al
2007). Macro studies use coarser data, and consider larger areas, which can be
transnational. They typically require less data and data that is used is typically aggregated.
Meso-scale studies are more detailed studies, and consider regions Finally, micro-scale
studies investigate smaller areas, such as municipalities, or sections of municipalities. The
data requirements are high, and properties are often considered on an individual basis.
Table 2 - Categories of flood damage, after Messner et al (2007) and Jonkman et al (2008a)
Measurement
Tangible Intangible
Form of damage Direct Physical damage to
assets:
Buildings
Contents
Infrastructure
Agricultural land
Evacuation and rescue
operations
Clean up costs
Fatalities and injuries
Diseases
Historical and cultural
losses
Loss of ecological and
environmental goods
Inconvenience
Indirect Loss of industrial
production
Traffic disruption
Emergency costs
Temporary housing of
evacuees
Societal disruption
Increased vulnerability
of survivors
Undermined trust in
public authorities
Psychological trauma
1.8 Ex-ante and ex-post estimates of flood damage
An important distinction should be made between ex-ante and ex-post damage estimation.
Ex-ante damage estimation refers to damage estimates that are made before the event, and
can be considered as ‘what-if’ analyses. Ex-post damage estimates are made after (or even
during) an actual flood event. However, for the purposes of conducting ex-ante analyses, ex-

Project Report Contract no. 244047 _________________________________________________________________________________________________________________
15
post analyses are required to provide the background to the assumptions made, and to
benchmark the studies. Ex-post assessments are an opportunity to improve the techniques
used to perform ex-ante estimates.
The estimation of ex-post damage will be considered briefly. Although the main focus of this
report is on ex-ante damage estimation, ex-post estimates, as described earlier, are an
opportunity to improve ex-ante flood damage estimation techniques.
Ex-post damage estimation involves considering the damage caused by an event after it has
occurred, and requires observation and measurements of the impacts, relying on various
types of surveys. Several data sources have been suggested for the ex-post estimation of
flood damage (ECLAC, 1991);
Strategic information sources
Press coverage
Cartography
Reconnaissance missions
Surveys
Analysis of secondary data
Long-distance interpersonal communication
Aerial photography
Remote sensing images
Most of these categories are relatively self-explanatory. Surveys and questionnaires are
particularly useful sources of information, and are usually conducted by government
agencies. However, the collection of primary information can be expensive and time-
consuming. Secondary information can include insurance data, data on the release of
disaster relief funds and small business loans. An example of the use of this is to estimate
the total economic damage by applying a ratio to the insured losses. This method is simple,
although its accuracy is limited.
Project Report Contract no. 244047 _________________________________________________________________________________________________________________
16
2 Tangible damage estimation
It has been noted that a tangible damage is a damage to which a price can be specified, and
is typically subdivided into direct and indirect tangible damage. This section will describe the
impacts and the methods that can be used to assess them.
2.1 Direct tangible damage
Direct tangible damage refers to the physical damage caused to property and contents in
both residential and non-residential (industrial and public sector) sectors by direct contact
with flood waters.
The estimation of direct damage involves four steps, according to Messner et al (2007). The
first of these is to select an approach, depending on the spatial scale, the objective of the
study, the availability of resources, and the availability of pre-existing data. Secondly, the
direct, tangible damage categories that are being considered must be determined. Thirdly,
the data is collected, and fourthly, the calculations are undertaken. The data required for
direct, tangible damage estimation is discussed in the Section 2.2
2.2 Data requirements
The estimation of direct tangible damage can be very data intensive. To estimate the direct
tangible damage, there are four main data sources.
Land-use data
Firstly, information is required on the number, location, and type of assets (commercial
building, residential properties, etc) that is potentially exposed to flooding. Land-use data
can be broadly categorised as being of one of two types; object-oriented data, and
aggregated land-use data.
Object-oriented data records individual properties and buildings, whereas aggregated data,
by its nature, records aggregated information of more or less homogeneous areas. An
example of an object-oriented land use database is the UK’s National Property Dataset. It
includes information on every single property in the country, using address-point data. An
example of an aggregated land-use database is the CORINE Land cover (CLC) database, that
was developed by the European Environment Agency. This database covers most European
Countries at a scale of 1:100,000, and distinguishes 44 types of land-cover, including
‘continuous urban fabric’, ‘airports’ and ‘arable land’. A clear benefit of this data is that it
covers wide areas, so that transnational studies can be conducted. For example, in one
study, CORINE land-cover data was used to estimate the flood risk on the River Rhine.

Project Report Contract no. 244047 _________________________________________________________________________________________________________________
17
A more detailed aggregated land-use database is the ATKIS-DLM database developed in
Germany. This is at a finer scale than the CLC data, and incorporates over 100 land-use
classes at scales ranging from 1:10000 to 1:25000.
In one study, the two land-use data types were used on a study on the River Mulde in
Saxony in Germany, to estimate the damage caused by flooding in August 2002 (Wunsch et
al., 2009). In this study, the two data sets were used and disaggregated in an attempt to
produce finer land-use data sets, using a variety of techniques. The finer ATKIS-DLM data
produced more accurate results, and the authors of that study concluded that more
accurate disaggregated data would improve flood loss estimation.
Much of the data that is available for flood damage estimation is secondary data, but it is
possible to collect primary information on land-use with field surveys, especially for small
areas, and when a high level of detail is required.
Determination of the assets at risk
Secondly, it is necessary to collect information on the value-at-risk of the properties.
However, before any detail is discussed, it is necessary to introduce the concept of relative
and absolute damage functions. Absolute damage functions relate the absolute damage
caused by the flood to its characteristics (usually depth), whereas the relative damage
functions relates the damage as a proportion of the value of the property to the flood
characteristics.
If relative damage functions are to be used in a study, it is necessary to estimate the total
value of the elements at risk in the study area. This is a noticeable disadvantage to this
approach. The need to estimate the total value of assets introduces additional uncertainty.
However, relative damage functions have the advantage that they are more easily
transferable in space and time. If absolute damage functions are to be used in a study, the
damage functions will produce absolute damage estates, usually as a function of the
property areas, and the value of the elements at risk is integrated in these functions. A key
disadvantage of absolute damage functions is that they need regular recalibration as market
values change, for example.
Data on the total value of the elements at risk can come from a number of sources. Firstly,
aggregated data from official statistics can be used. This approach was used in a study on
Cologne in Germany, where data were taken from state data on the gross stock of fixed
assets (Grünthal et al., 2006). These data source often cover municipalities, which are not
sufficiently accurate for much damage estimation. The data needs to be disaggregated to
land-use classes. In the study on Cologne, unit values for a fixed area were developed and
applied. Other methods that can be applied include data on standardised construction costs.
Insurance data can be applied, and often is in studies conducted by insurers.
Project Report Contract no. 244047 _________________________________________________________________________________________________________________
18
Object-oriented assessment of property values can be conducted using either market value
data, or standard construction costs. In Australia, construction costs per square metre of
different building types were published by the authorities. This method was then applied
using ratios to different building types for a study in Queensland (Blong, 2003).
Data for other fixed assets such as contents can be more difficult to obtain. Insurance
company data has been used in some studies. However more specialised surveys may be
necessary for some studies (Penning-Rowsell et al., 2005b). For cars, Messner et al (2007)
quote several methods. Some studies have taken approximate values of news cars and
depreciated those values. In some studies, the approximate market value of cars has been
taken from specialised consultancies and applied. For infrastructure such as streets and
railways, Messner et al (2007) quote the use of official statistics, or methods to obtain data
from relevant ministries.
Damage function data
Thirdly, damage functions are necessary. This section will describe the parameters that
determine damage and then how damage functions are developed.
Damage influencing characteristics
There are various characteristics of any flooding that influence flood damage, of which some
may be more significant than others. These characteristics will be of more importance to
some categories of damage than others.
Area (extent) of flooding;
Depth of flooding;
Duration of flooding;
Velocity of flood water;
Rate of rise of flood water;
Time of occurrence;
Contamination and debris loads of the flood water;
Whether the water is fresh or salt water;
Warning time;
Building age construction, age, materials and condition;
Previous experience of flooding;
Preparation before flooding.
Merz et al (2010) distinguished between impact parameters and resistance parameters. The
former include the characteristics of the flood that causes the damage, whereas the latter
include those parameters such as the building type that depend upon the resisting object.
Project Report Contract no. 244047 _________________________________________________________________________________________________________________
19
In practice, much of the focus on estimating the damage caused by flooding has been on the
flooded depth. Gilbert White at the University of Chicago was one of the first researchers to
estimate the damage caused by flooding, and introduced the concept of stage-damage
curves. Depth-damage or stage-damage curves have been adopted in multiple locations
around the world (Smith, 1994), so much so that the technique is commonly used in the
field of flood risk management.
In the early work, velocity was also presumed to be an important parameter in flood
damage estimation (White, 1945). However given the different types of floods, ranging from
slow-rising river floods, to rapid, flash urban flooding, the importance of other parameters
may be important in different situations. Some research has considered the importance of
other parameters, such as velocity (Kreibich et al., 2009). However, in this study, the
influence of velocity was only found to be significant on structural damage to road
infrastructure. It was recommended in that study that flow velocity should not be
considered. This study was based on the Elbe catchment in Germany, and the conclusions
would not necessarily hold for the other case studies in the project. Merz et al (2004)
studied nine flood events in Germany from 1978 to 1994, and reported that the variation in
flood damage to properties could not be explained by inundation depth alone. This means
that there is significant uncertainty when assessing flood damage.
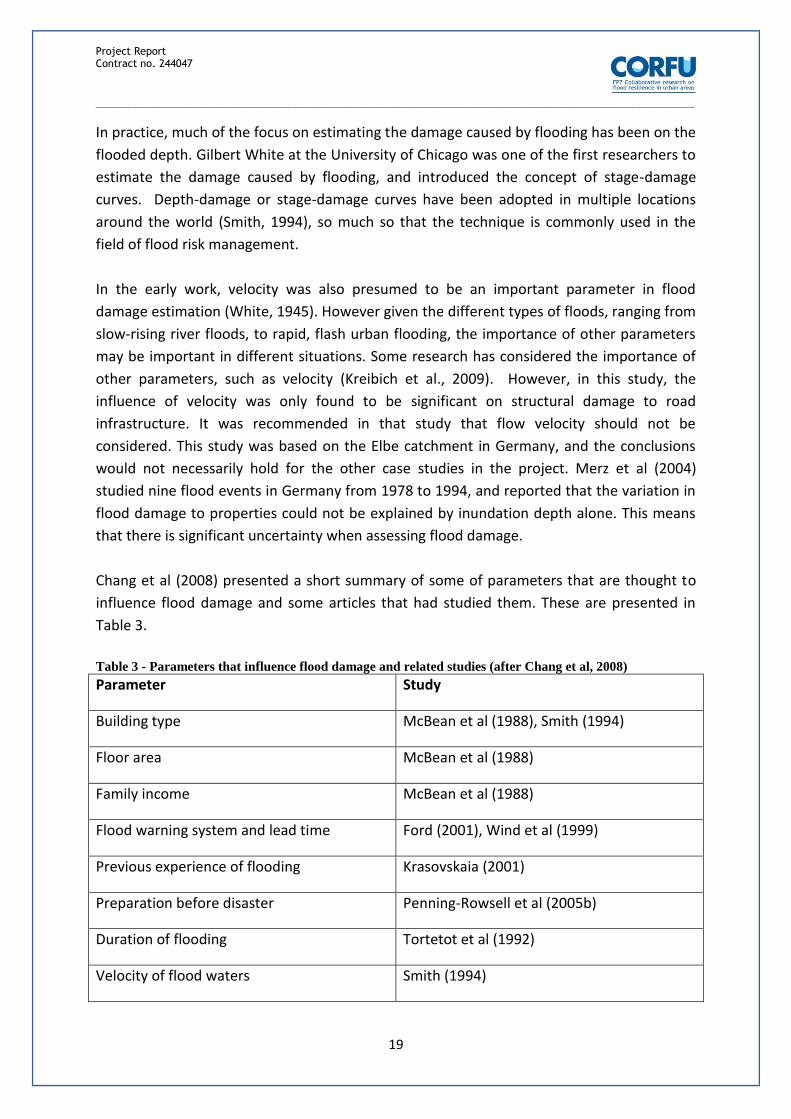
Chang et al (2008) presented a short summary of some of parameters that are thought to
influence flood damage and some articles that had studied them. These are presented in
Table 3.
Table 3 - Parameters that influence flood damage and related studies (after Chang et al, 2008)
Parameter Study
Building type McBean et al (1988), Smith (1994)
Floor area McBean et al (1988)
Family income McBean et al (1988)
Flood warning system and lead time Ford (2001), Wind et al (1999)
Previous experience of flooding Krasovskaia (2001)
Preparation before disaster Penning-Rowsell et al (2005b)
Duration of flooding Tortetot et al (1992)
Velocity of flood waters Smith (1994)

Project Report Contract no. 244047 _________________________________________________________________________________________________________________
20
Number of people at risk Shaw et al (2005b)
Location of household Shaw et al (2005b)
Development of damage functions and data requirements
There are two main approaches to developing damage functions. The first of these is
through the use of real flood damage data, or survey data. This is often referred to as the
empirical method, and it used to derive functions based on observed flood characteristics
such as depth and velocity, related to the observed flood damage. The second approach is
referred to as a synthetic approach, which is a hypothetical analysis based on land cover and
land use patterns, type of objects, information of questionnaire survey, etc. It is akin to a
‘what-if’ analysis, and asks what damage would be caused if the flood waters were to reach
a certain depth within a property. The database of absolute damage functions, developed
at the Flood Hazard Research Centre in Middlesex is an example of a synthetically derived
database. In Germany, the HOWAS database is a collection of empirical flood damage data.
Merz et al (2010) list some of the advantages and disadvantages of empirical or synthetic
damage curves. Some authors have argued that empirical damage curves derived from real
data are more accurate than synthetic data (Gissing and Blong, 2004). The variability of the
data within a category (such as residential) can be quantified. However, detailed damage
data following floods is rate, so that the models may be based on poor quality data. The
transferability in time and space of these models can be difficult if the data used to derive
the curves was very location or event specific. The paucity of information may require the
use of extrapolation techniques, which increases the uncertainty of the data. Synthetic data
has the advantage that it provides a higher level of standardisation and therefore allows for
a greater comparability of flood damage estimates. The data can be transferred more easily
to different geographic areas. However, much effort is required to conduct these what-if
analyses to produce databases, and the analyses can be subjective, resulting in uncertain
estimates. In contrast to the damage curves based on real data, synthetic curves may not
reproduce the variation within a property category.
There are several studies on the development of depth-damage curves in different
geographical settings (Nascimento et al., 2007, Penning-Rowsell and Chatterton, 1977).
According to Freni et al (2010), the main bottleneck in the estimation of damage curves
used to estimate direct, tangible damage is the limited availability of good quality flood
damage data.
Damage to infrastructure

Project Report Contract no. 244047 _________________________________________________________________________________________________________________
21
In this section, a short mention of the damage to infrastructure should be made. This area is
complicated, and perhaps one of the areas that the CORFU project will be able to make
significant progress. Infrastructure can include public utilities such as water supply,
sewerage and drainage, and telecommunications, as well as transportation facilities,
particularly roads and railways. Some studies have included facilities such as hospitals and
schools in this category.
In the US, the HAZUS-MH methodology data is used to estimate the damage to point
facilities such as hospitals and bridges (Scawthorn et al., 2006).
Dutta et al (2001) proposed a model for use in Japan that could consider damage to water,
gas and power supply, as well as sewerage and drainage, telecommunications and
transport. However, in practice, only data was available for the assessment of transport
losses. Data were sourced from the Japanese Ministry of Transportation.
The Multicoloured Manual in the UK (Penning-Rowsell et al., 2005b) adopts simple models
to estimate the damaged caused by traffic interruptions, by incorporating additional travel
time costs and additional vehicle operating costs. This method requires data on traffic flows,
the particular mix of traffic, resource costs and the value of time from the UK government
sources. In addition, a three-step filtering process is proposed to present a short-lit of assets
for a detailed economic assessment:
Enumerate the relevant assets at risk by assessing their sizes and value;
Assess the total risk for each infrastructure by classifying approximately the
likelihood of damage and the scale of the impact as high, medium or low;
Quantify the damage for high and very high risk assets only.
Damage to agriculture
The focus of the CORFU project is on urban flooding, and therefore agricultural damage will
not be particularly relevant. However, a few techniques will briefly be discussed.
In a Japanese case-study, an equation was used to estimate the damage to rice paddies, as a
function of a fixed cost per ton of rice multiplied by the tonnage per square kilometre, with
a damage function (between 0 and 100%) applied as a function of the inundation depth
(Kazama et al., 2009). The empirical data used to estimate the damage curves were taken
from Ministry of Land, Infrastructure, Transport and Tourism.
In the UK, agricultural damages are estimated from assessing the impact of flooding on
agricultural productivity, defining the impact of flooding upon that productivity, and then
expressing the difference in a monetary value (Penning-Rowsell et al., 2005b).

Project Report Contract no. 244047 _________________________________________________________________________________________________________________
22
Data on the flood/inundation characteristics
Finally, data are required on the inundation characteristics. This can come from flood risk
mapping. Depending on the damage function used, the common characteristics that are
required are flood extent, depth, and velocity. This data is usually obtained from hydraulic
modelling studies and will not be discussed further.
Development and Application of models
Estimates of the direct tangible damage caused by flooding have been made for a number of
years in different geographic settings, and there is not space to discuss the methods that
have been applied. A few techniques will be discussed briefly.
In the UK, stage-damage curves were developed by Penning-Rowsell and Chatterton (1977)
for a variety of property types. These stage-damage curves have been revised as part of the
Multi-coloured Manual (MCM) (or the shorter Multi-coloured Handbook). The stage-
damage curves are based on synthetic data, and use absolute damage functions, so there is
no need to calculate the total value of assets at risk. As mentioned in an earlier section, the
model uses an object-oriented database of property types to define the land-use types.
As well as considering the effect of stage on the flood damage, some account is taken for
the flood duration in the MCM. These losses are adjusted depending on whether there are
flood warnings, and the estimated damage is adjusted on the basis of whether the lead
times are greater than or less than eight hours (Penning-Rowsell et al., 2005b). Figure 2
shows the classic method of estimating the Average Annual Flood Loss by combining the
probability of a flood with its discharge, and thus with the flooded depth. This is further
combined with the depth-damage curve to produce a relationship between the probability
of the flood and the probability of the damage. By integrating this relationship, the average
annual loss is calculated.

Project Report Contract no. 244047 _________________________________________________________________________________________________________________
23
Figure 2 - Calculation of Annual Average Flood Losses (from the Multicoloured Handbook)
Research in the UK on damage to infrastructure is limited, but the MCM states that damage
to utilities and communications was equal to 20% of the total economic losses, but there is
no greater consideration than this in the methodology at present.
In the Netherlands, the standard method developed nationally uses depth-damage curves in
a way similar to that of the UK (Kok et al., 2004). However, in addition to applying these
depth-damage curves to residential and commercial properties, curves are applied for
infrastructure such as roads and gas and water mains.
Dutta et al (2001) developed a model that attempted to consider urban, rural and
infrastructure damage for a catchment in Japan. The ex-ante estimates were compared with
a real flooding event from September 1996, but only for the urban damage, for which ex-
post damage surveys were available. The ex-ante estimates were found to be between 30-
40% higher than the ex-post estimates, although the authors argued that a significant
proportion of this was due to the greater simulated flooded extent than observed.
In Germany, two models have been developed by a team in Germany, known as FLEMOps
(Flood Loss Estimation MOdel for the private sector) and FLEMOcs (Flood Loss Estimation
MOdel for the commercial sector. FLEMOps, despite its name, considers the damage to
residential property, and relies on empirically derived relative damage functions. FLEMOps
makes use of five variables in determining the relative damage functions; the water depth,

Project Report Contract no. 244047 _________________________________________________________________________________________________________________
24
building type, building quality (defined as high, medium or low), contamination of the flood
water, and the level of private precaution (defined as none, good, or very good). FLEMOcs
uses functions that are based on water depth, sector and company size as well as
precaution and contamination (Kreibich et al., 2010).
2.3 Indirect tangible damage
As mentioned, indirect tangible damage is caused by disruptions to linkages within the
economy. They are more complicated to estimate than direct tangible damage. Cochrane
(2004) argued that there are six categories of methods used to model indirect damage
caused by flooding.
Linear programming models which provide guidance as to the optimal allocation of
scarce post-event production capacity;
Post-event economic surveys;
Econometric models reflecting historical trading patterns (and thus unable to take
shocks into account);
Input-output (I-O) models, as demand driven models that reflect an accounting stance
of an economy;
Computable General Equilibrium (CGE) models, as an extension of input-output
models taking into account price and quantity effects;
Hybrid models (computational algorithms) addressing supply shocks, post event
supply constraints and time phased reconstruction.
This section of the review will focus on three techniques that appear frequently in the
literature on indirect damage estimation; simple empirical methods (derived from post-even
surveys), input-output modelling, and Computable General Equilibrium models.
Econometric models will be discussed very briefly. Before this is mentioned, there is a view
that the direct damage is indicative of the magnitude and severity of any flooding, and
therefore indirect damages do not require the same attention (Kreibich, personal
communication).
Simple empirical methods
It is noted by James and Lee (1971) that indirect tangible damage could be estimated as a
fixed proportion of the estimated direct tangible damage. They argued that this could be
justified for practical reasons, but this is a rather simplistic method. Penning-Rowsell and
Parker (1987) studied some cases where the indirect damage, as a percentage of direct
losses, ranged from 21% for a study in Bristol, to 93% for a study in Chesil. In the study on St
Maartens, indirect damage was simply estimated as a fixed proportion of the direct damage
(Vojinovic et al., 2008). Fixed percentages of 15%, 35% and 45% were applied to residential,
commercial and industrial properties. The key advantage of such a method is its simplicity.

Project Report Contract no. 244047 _________________________________________________________________________________________________________________
25
The key disadvantage is that results from previous events might not be transferable to other
events.
Other examples where this approach have been taken is in Australia with the ANUFLOOD
model developed by the Queensland Government (Natural Resources and Mines, 2002)
where the indirect residential damage is taken as 15% of the direct residential damage, and
the indirect commercial damage is taken as 55% of the direct commercial damage. In the
Rapid Appraisal Method developed by the Victorian State Government, it is recommended
to estimate indirect damage as 30% of the direct damage, although rates such as 20 per
cent might be more appropriate for rural regions with relatively low populations while 45
per cent might be more appropriate for flood events affecting urban centres with a
substantial tourism sector (Victorian Department of Natural Resources and Environment,
2000).
Within the UK, indirect tangible losses are accounted for in a number of ways. Firstly, on the
basis of empirical studies, emergency costs are assumed to be 10.7% of the direct property
damage. Indirect losses to transport are estimated using extensive techniques that consider
the additional travel time and costs.
In addition, research carried out on Louisiana has shown that indirect losses would increase
nonlinearly, when the direct losses exceed $50bn, and therefore the linear assumption
would not be valid. More complex methods are needed to assess the indirect damage from
flooding, and two of these methods are discussed in the following sections.
Figure 3 - Non-linearity of indirect losses in study from Louisiana (from Hallegatte et al 2008)

Project Report Contract no. 244047 _________________________________________________________________________________________________________________
26
In addition to the simple empirical methods applied above, it is worth noting the
methodology applied in the Netherlands where depth-damage curves are applied to
estimate indirect flood damage.
Econometric models
Econometric models have been used to assess the impacts of disasters. For example, Ellson
et al (1984) used such a model to investigate the potential losses from earthquakes in
Charleston in South Carolina in the US. However, there has been limited use of such models
in the field of flood risk management.
Input-output (I-O) modelling
Input-output (I-O) modelling is a method used to understand linkages in an economy. I-O
modelling has a long history, dating back in some form to the Tableau Economique of the
eighteenth century. However, in more recent history, work by Wassily Leontief in the 1930s
and 1940s led to the development of its modern theory and application (Leontief, 1936),
and an overview of the modelling framework is provided by Kowalewski (2009).
The I-O modelling framework rests upon the idea of an economy as a system, where
industries receive inputs from other industries, and producing outputs which feed into other
industries. I-O models are described as static, linear models of all purchases and sales
between sectors of an economy, based on the technical relations of production. Their focus
on production interdependencies makes them especially well suited to examining how
damage in some sectors can ripple through the economy.
Because of the prominence of input-output modelling throughout economics, in fields such
as forecasting, or structural analysis of an economy, I-O tables are commonly produced. For
example in the UK, I-O tables are regularly produced, dividing the economy into 123
industries.
The following section describes the technical basis of the static input-output model,
however, this section can be overlooked, and more detail can be found in equations can be
skipped.
Technical description of model
A distinction needs to be made between intermediate and final demand. If a demand is
intermediate, the output from a previous sector would be expected to be processed further.
For example, a motor manufacturing firm will need metals or plastics in various forms that
will be further processed to produce motor parts. However, the car itself would be a final
product, and thus represent a final demand. A very simple example is as follows. Imagine an
economy with three sectors; Sector 1, Sector 2, and Sector 3. These could be agriculture,
manufacturing, and services. Sector 1 purchases outputs from the three sectors, and these
totals are denoted , , and . These purchases can be presented in the following
column vector.

Project Report Contract no. 244047 _________________________________________________________________________________________________________________
27
If demand vectors from each sectors are placed alongside each other, the intermediate
output from each sector can be summed as
(2-1)
These can be combined in the following table.
Purchasing sector Total
1 2 3
Selling sector 1
2
3
Total
The table shown above can be put in a matrix form, but whereas above the table describes
the absolute measure of inputs and outputs, coefficients can be used to define the
relationship in relative terms, which could remain static while the magnitude of the inputs
and outputs changed. The values of the coefficients are described in the following equation.

Project Report Contract no. 244047 _________________________________________________________________________________________________________________
28
(2-2)
The matrix of these coefficients form a matrix A, where
Having considered the intermediate inputs and outputs, there is a final demand, where the
outputs are not expected to be used for further processing. This demand is created by
households or government agencies for example. Equation (2-1 is altered so that the output
from one sector is equivalent to
(2-3)
where in this case represents the demand from sector 1. Combining the matrix
representation of the coefficients, and including this demand (known as exogeneous),
(2-4)
where represents the sector outputs in vector form, and represents the vector of the
final demand. This can rearranged, in the following form
or
(2-5)
(2-6)
The matrix is known as the Leontief Inverse, or the multiplier matrix, and
describes how changes in final consumption can ‘ripple’ through the economy, in what is
known as a demand-driven model.

Project Report Contract no. 244047 _________________________________________________________________________________________________________________
29
The use of I-O models in impact assessment
The Adaptive Regional Input-Output model has been used to assess the indirect impact of
flooding on the wider economy following Hurricane Katrina in Louisiana (Hallegatte, 2008).
This model was developed to overcome some of the limitations that had existed in previous
I-O modelling studies. Firstly, the model takes into account the sector production capacities
and both forward and backward propagations with the economy. The basic I-O model had
typically only considered backward propagations, given a change in the final demand.
Secondly, the model introduced the ability to model adaptive behaviours. For this study,
National Input-Output tables were obtained from the US Bureau of Economic Analysis for 15
sectors. These were then adjusted to produce regional input-output tables for the state of
Louisiana. Parameters were required that describe overproduction, adaptation and for
demand and price responses. These were calibrated with a combination of data from
previous events (the Landfall of Hurricane Andrew in 1992, and the Northridge Earthquake
of 1994, as well as other events from the 2004 hurricane season), as well as ad-hoc expert
choice.
The study assumed that the direct damage was $107bn, and that the total damage was
$149bn. The total economic damage was estimated to be 139% of the direct losses, so that
the economic amplification ratio was equal to 1.39 (defined as the ratio of the overall
production loss due to an event to its direct costs).
This model has also been applied to a case study in Copenhagen (Hallegatte et al., 2011) and
in Mumbai in India (Ranger et al., 2011). This latter study will be discussed in more detail in
Section 4.5.
This type of input-output model might be referred to by Cochrane (2004) as a hybrid model,
as it incorporates the use of input-output tables, but extends it. A further example of a
hybrid model is the HAZUS model developed by the US Federal Emergency Management
Agency and the National Institute of Building Sciences.
In a study on the Netherlands, bi-regional I-O models were used to assess the vulnerability
of a region, and to identify the economic ‘hot-spots’ (Van der Veen and Logtmeijer, 2005).
An input-output model has been developed at the Hamburg Weltwirtshafts Institut (HWWI)
and this model is described below. This model is a static, open model, in the sense that time
is not explicitly modelled. This model has certain data requirements. Input-output tables are
required, as well as data on the number of employees in different sectors in the region. A
parameter is required that defines the behaviour of regional imports in the model. The
model than can make estimates of the impacts, if there are changes to the sector outputs or
the final demand, as a result of a shock.

Project Report Contract no. 244047 _________________________________________________________________________________________________________________
30
Up to date, this model has not been used to assess the impact of floods, and so there is
significant uncertainty over whether this model is able to produce reliable results.
There are various advantage and disadvantages to using I-O methods. They are relatively
easy to manage, and their implementation is less time consuming than some models, such
as Computable General Equilibrium models (discussed below). However, according to
Kowalewski (2009), they have several shortcomings. They are based on a microeconomic,
consistent and closed framework, and so they can only lead to a limited impact analysis. For
example, allocation effects of policy measures are not considered. In the standard form, the
cyclical connection between income and expenditure as well as the economic links between
the markets of the region are neglected. They assume an entirely elastic supply-side in the
economy, and in addition, they assume a constant return to scale, and no technological
progress
Overall, I-O models are useful tools that enable the analysis of regional economic
interdependencies, and they are being used regularly in studies of flood impacts. The
construction of a regional I-O table poses one of the biggest challenges. I-O tables may be
only found (if at all) for nations, and therefore some form of disaggregation is required,
which requires some assumptions.
They are technically inferior to some models (which will be discussed in a subsequent
section of the report), especially when it comes to long-run analysis. They typically show a
static picture of the economy, and does not take into account price or substitution effects,
nor do they include technological progress and economies of scale.
Computational General Equilibrium models
Computable General Equilibrium (CGE) models are based on an equation system that
represents the demand for goods by consumers, the supply of goods by producers, and the
equilibrium condition that supply equals demand on every market is solved simultaneously.
However, the model allows for some modifications like imperfect markets and externalities.
A review of CGE models and their application to the field of climate impacts, focusing on
damage calculations and adaptation modelling was conducted by Döll (2009).
There are several steps in producing a GCE. Firstly agents (producers, consumers, state) and
markets (food, cars) are delineated. The next step is to produce a Social Accounting Matrix
which defines the flows between industries, labour, capital and households (Rose, 2004). A
market type is assumed, benchmark prices are chosen, and the functional forms of supply
and demand are specified. The model is then calibrated, and then policy effects are
computed. Sensitivity analyses can be conducted.

Project Report Contract no. 244047 _________________________________________________________________________________________________________________
31
Much of the work on using CGE models to assess disaster impacts have been related to
earthquakes rather than floods. Rose and Liao (2005) used a CGE model to study on the
resilience of the water supply system following an earthquake in Portland.
There are various advantages to using CGE models. They allow for simultaneous reactions to
changes in the model. However, the calibration of the model has a poor empirical
foundation.
It has been argued that that CGE models are not distinct from I-O analysis, but are rather a
“more mature cousin or extension” and retains many of the advantages and overcomes
some of their shortcomings (Rose, 2004). A major shortcoming is the assumption that
decision-makers make optimal decisions, and that the economy is always in equilibrium. It
has also been noted that the CGE model is more suitable for long-term analysis, and can
underestimate impacts in the short-term (Rose and Liao, 2005). To date, their application in
flood impact studies has been limited.

Project Report Contract no. 244047 _________________________________________________________________________________________________________________
32
3 Intangible damage The estimation of intangible damage is particularly complicated. Intangible damage cannot
be easily quantified in monetary terms. It can include health impacts, psychological impacts,
as well as damage to the environment. Perhaps the most prominent aspect of intangible
damage is related to human health, and this section of the report begins there.
3.1 Health impacts
Floods are known to have a great impact on human health. This section of the report is
divided into two sections. The first section will be a broad overview of the epidemiology of
the health impacts of flooding. The second section of this report
There are two key articles that were provided much of the source information in this review.
Hajat et al (2005) conducted a literature review on the health impacts of flooding in Europe,
North America and Australasia. The purpose of the review was to investigate the impacts of
flooding in Europe, but these other geographic areas provided additional information on
industrialised developed countries.
Ahern et al (2005) performed a literature review on the epidemiological evidence on the
global health impacts of flooding. This is useful, in that the study is global, in contrast to
many of the European or localised studies discussed. The paper presents a table of the key
studies that assess the relationship between flooding and health. The paper makes several
conclusions. Firstly there is surprisingly little evidence base on the health effects of flooding,
particularly on morbidity, and also on public health interventions. The risks are understood,
but there is significant uncertainty. The risks to life are generally clear, but longer term
impacts, and especially mental health impacts are often underestimated. These and
location-specific infectious diseases require further study.
There are two principle types of health impacts from flooding (Hajat et al., 2005);
Physical health effects sustained during the flood event itself or during the clean-up
process, or from knock-on effects brought about by damage to major infrastructure
including displacement of populations. These include injuries and the loss of life, as
well as diseases linked to the flooding;
Mental health effects, which occur as a direct consequence of the experience of
being flooded, or indirectly during the restoration process, or by people proximate to
the flooding.
Again, as with the tangible damage or impacts, a distinction can be made between direct
and indirect health impacts. The loss of life caused by drowning would be a direct health
impact, whereas the loss of life caused by an outbreak of disease following disruption to the
sanitation systems might be seen as an indirect health impact.

Project Report Contract no. 244047 _________________________________________________________________________________________________________________
33
Uscher-Pines (2007) argues for a third category, (the disaster-triggered impacts) to clarify
what is meant by indirect health impacts. An indirect impact would be one which occurs
within the first two weeks after a flood, in the “acute excitement and response phase”. This
might include the fatal injuries caused during the clean-up, or pulmonary embolisms as a
result of poor shelter. The disaster-triggered deaths would then be those that occur from
two weeks to a year after the event, assuming that the mortality levels would settle down to
the pre-disaster levels during this period. The main objective of this scheme is to consider
the long-term consequences of natural disasters over a longer period than is normally
considered, i.e. those deaths that were it not for the particular disaster, would not have
occurred.
Table 4 and Table 5, summarise the direct and indirect causes and implications of flooding
on human health.
Table 4 - Direct health impacts of flooding (taken from WHO (2002))
Causes Health implications
Stream flow velocity; topographic land
features; absence of warning; rapid speed of
flood onset; deep floodwaters; landslides;
risk behaviour; fast
flowing waters carrying boulders and fallen
trees
Drowning
Injuries
Contact with water Respiratory diseases; shock; hypothermia;
cardiac arrest
Contact with polluted waters Wound infections; dermatitis; conjunctivitis;
gastrointestinal illnesses; ear, nose and
throat infections; possible serious
waterborne diseases
Increase of physical and emotional stress Increase of susceptibility to psychosocial
disturbances and cardiovascular incidents
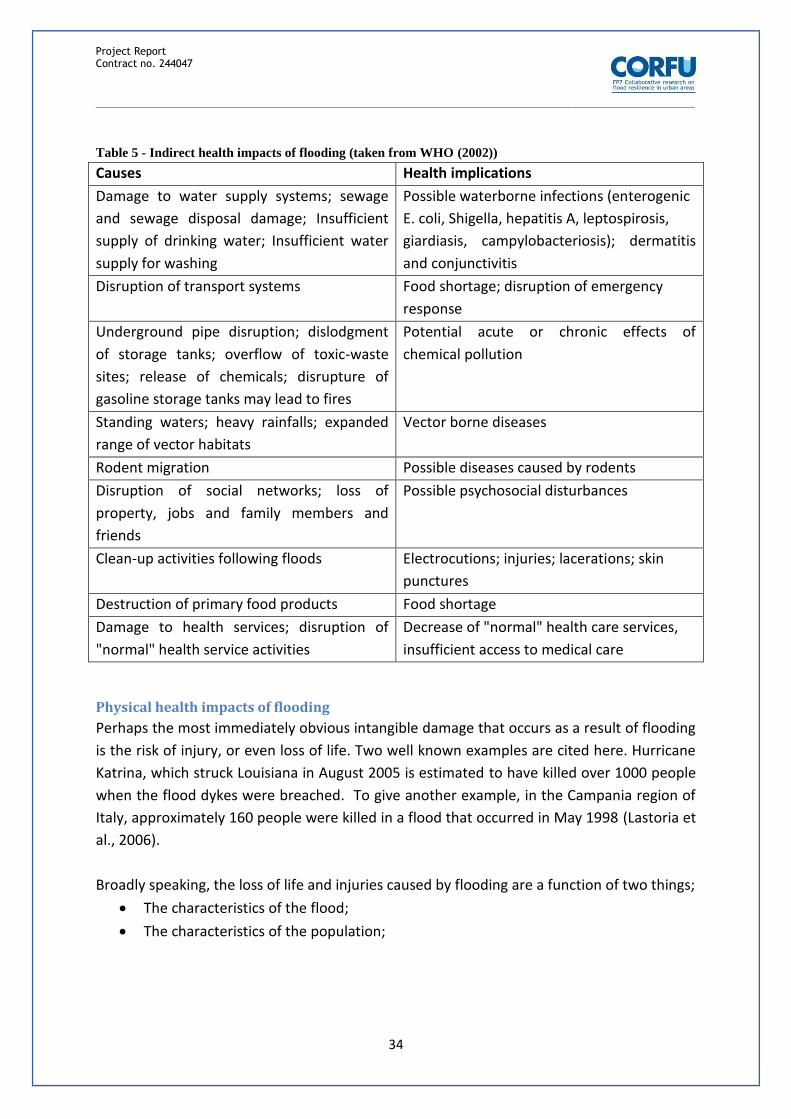
Project Report Contract no. 244047 _________________________________________________________________________________________________________________
34
Table 5 - Indirect health impacts of flooding (taken from WHO (2002))
Causes Health implications
Damage to water supply systems; sewage
and sewage disposal damage; Insufficient
supply of drinking water; Insufficient water
supply for washing
Possible waterborne infections (enterogenic
E. coli, Shigella, hepatitis A, leptospirosis,
giardiasis, campylobacteriosis); dermatitis
and conjunctivitis
Disruption of transport systems Food shortage; disruption of emergency
response
Underground pipe disruption; dislodgment
of storage tanks; overflow of toxic-waste
sites; release of chemicals; disrupture of
gasoline storage tanks may lead to fires
Potential acute or chronic effects of
chemical pollution
Standing waters; heavy rainfalls; expanded
range of vector habitats
Vector borne diseases
Rodent migration Possible diseases caused by rodents
Disruption of social networks; loss of
property, jobs and family members and
friends
Possible psychosocial disturbances
Clean-up activities following floods Electrocutions; injuries; lacerations; skin
punctures
Destruction of primary food products Food shortage
Damage to health services; disruption of
"normal" health service activities
Decrease of "normal" health care services,
insufficient access to medical care
Physical health impacts of flooding
Perhaps the most immediately obvious intangible damage that occurs as a result of flooding
is the risk of injury, or even loss of life. Two well known examples are cited here. Hurricane
Katrina, which struck Louisiana in August 2005 is estimated to have killed over 1000 people
when the flood dykes were breached. To give another example, in the Campania region of
Italy, approximately 160 people were killed in a flood that occurred in May 1998 (Lastoria et
al., 2006).
Broadly speaking, the loss of life and injuries caused by flooding are a function of two things;
The characteristics of the flood;
The characteristics of the population;

Project Report Contract no. 244047 _________________________________________________________________________________________________________________
35
The characteristics of the flood are those such as water depth, rate of rise, flood velocity
and the flooded area. The characteristics of the population include the population size, and
their vulnerability (e.g. is the population elderly?).
Jonkman (2008b) conducted a literature review on the methods used to estimate the loss of
life due to flooding, with a particular emphasis on coastal flooding. In that study several
mortality functions were quoted. For example, one study considered the mortality from
typhoons in Japan. Two events were considered (Isewan Typhoon in 1959, and Typhoon
Jane in 1950) and mortality functions were developed, as a function of the flooded depth,
where mortality the number of deaths for a standard size of population. In Isewan Typhoon
(or Typhoon Vera), there were 5238 fatalities, compared to 539 fatalities for Typhoon Jane.
The mortality for a depth of 1m was 30 times greater for the Typhoon Vera, and so it is
believed that other factors must have played a role. Similar empirical relationships had been
developed for coastal flooding in the US (Boyd et al., 2005).
The 1953 coastal flooding of the Netherlands led to the death of approximately 1,800
people. Because of its devastating loss of life, the event has been intensively studied, and
several researchers have developed explanatory models of the causes of the loss of life.
Jonkman et al (2008b) quoted methods that estimated the loss of life through factors such
as the flood depth, the flow velocity, whether there was warning, the rate of rise and the
likelihood of collapsed buildings.
Zhai et al (2006) conducted a study in coastal regions of Japan, which related the flood
fatality functions to the number of inundated houses, with empirically derived parameters.
Penning-Rowsell et al (2005a) also proposed a methodology that was developed as part of
an Environment Agency study in England and Wales. Performing ex-post analyses, there is
good knowledge of the number of deaths caused by flooding events in the UK and the USA.
A DEFRA study (DEFRA/EA, 2006) has been developed that proposed a hazard formula for
assessing risks to people, as a function of depth, velocity and a debris factor, as well as area
and people vulnerability, developed with flooding from rivers, and estuaries and the sea in
mind.
The methodology was developed, based on the idea that the risk to people’s life is a
function of three factors.
Flood hazard
Area vulnerability
People vulnerability
Project Report Contract no. 244047 _________________________________________________________________________________________________________________
36
A Flood Hazard function is derived that is function of the expected flow velocity, the flooded
depth, and a debris factor, which takes into account the probability of debris, and whether it
will lead to greater hazard.
The area vulnerability score is proposed that ranges from 3 to 9, with a score of 1 to 3 given
for each of three factors.
Flood warning (1 point for an effective tried and tested scheme, whereas 3
represents no scheme)
Speed of onset (1 point for a time that is measured in hours, and 3 points for a speed
that would be measured in minutes)
Nature of area (1 point representing multi-storey apartments, and 3 points
representing bungalows and mobile homes).
Finally, a human vulnerability factor is then applied, which rates whether the population is
particularly aged, or whether there is a high proportion of sick and disabled people. These
factors are combined to provide an estimate of the likely deaths and injuries during a flood
event.
Jonkman (2008b) begins his review by pointing out some of the event characteristics that
led to the greatest loss of life.
The flood tends to occur unexpectedly without substantial warning. Warning that
allows for evacuation or time to find shelter, conversely reduces the risk of mortality;
The possibility for shelter is very important in reducing mortality;
The collapse of buildings used for shelter is an important determinant;
Water depth is an important parameter;
The combination of high water depths and rapid rise increases the risk to life;
High flow velocities reduce the stability of people and buildings during flooding
events, and increase the risk of death;
The elderly and children are typically more vulnerable to flooding.
A new approach then proposed takes into account three general steps
Analysis of flood characteristics, such as water depth, rise rate and flow velocity
Estimation of the number of people exposed
Assessment of the mortality amongst those exposed to the flood.
Figure 1 below shows the general approach to the loss of life model

Project Report Contract no. 244047 _________________________________________________________________________________________________________________
37
Figure 4 - General approach for the estimation of loss of life due to flooding (from Jonkman et al (2008a))
The EU Project FLOODsite extended the work of the Environment Agency’s Risk to Life
project and developed a methodology to map the risk of the loss of life from flooding
(Priest, 2007).
Diseases
Flooding is known to be linked to the outbreak of diseases (Ahern et al., 2005). These
diseases range from bacterial outbreaks such as leptospirosis and diarrhoea through to
vector-borne diseases such as Malaria. Kay and Falconer (2008) have noted the growing
international awareness of health risks associated with water, particularly in developing
countries, and they noted that “more than half the world’s hospital beds are filled by people
with water-related diseases”.
Ahern et al (2005) distinguished between faecal-oral diseases, vector-borne diseases and
rodent-borne diseases. Faecal-oral diseases include those such as gastro-enteritis, rotavirus,
diarrhoea and typhoid. All of these have been found to be linked to flooding, and are more
prominent in developing countries.
There are several papers that specifically consider the impact of flooding on human health
in Dhaka, Bangladesh (Harris et al., 2008). These papers have looked at the diarroeal
epidemics that are linked with the flooding events. In one study, Schwartz et al (2006) noted
that patients showing diarrhoea during flood periods were older, more dehydrated, and of
lower socio-economic status than the patients in non-flood periods.
Project Report Contract no. 244047 _________________________________________________________________________________________________________________
38
Vector-borne diseases are those such as malaria, which are transmitted by insects or any
living carrier, such as mosquitoes. The relationship between vector-borne diseases and
flooded is complex, where for example, flood waters can reduce the risk of malaria by
washing away breeding sites. However, floods can lead to the collection of stagnant water,
which provide breeding sites for mosquitoes. The floods in Mozambique of 2000 increased
the risk of malaria by a factor of 1.5 to 2 (Kondo et al., 2002). One study showed the
behaviour of malaria following flooding in Gujurat, India (Pawar et al., 2008). Other vector
borne diseases include Dengue fever. A study following the 2005 flooding of Mumbai
showed an increase in the incidence of Dengue Fever among children, as well as an increase
in leptospirosis, a rodent borne disease (Zaki and Shanbag, 2010).
Leptospirosis is a commonly studied rodent-borne disease that is linked to flooding (Watson
et al., 2007). Leptospirosis (or Weil’s Disease) is a bacterial disease, caused by spiroechetes
of the genus Leptospirosa. It is known that heavy rainfall and flooding increase the risk of
leptospirosis by bringing bacteria and their animal hosts (such as rats) into contact with
humans. Outbreaks following flooding have been noted in such geographically diverse areas
as the Czech Republic, India, Brazil and Indonesia. Table 6 lists some incidences of outbreaks
of leptospirosis linked with flooding. Leptospirosis is known to more prevalent in developing
countries, but outbreaks have occurred in the USA and Japan (Lau et al., 2010).
Lau et al (2010) conducted a review on the relationship between outbreaks of the disease
with flooding, and questioned whether the burden of the disease could be increased due to
climate change and increased urbanisation. The areas most at risk from the increased
burden would be those where multiple risk factors might coexist, such as increased flood
risk, rising temperatures, overcrowding, poor sanitation, poor health care, poverty and an
abundance of rats or other animal reservoirs. These factors often co-exist in urban slums, in
cities such as Mumbai and Dhaka, and therefore may be at increased risk in the future. It
was also argued in that review that spatiotemporal modelling using Geographical
Information Systems could potentially be useful to understand the disease burden.
Kay et al (2007) argued that there is a scientific vacuum in the area of terrestrial hydraulic
and catchment modelling of bacterial and other faecal pathogen concentrations. Work is
currently being conducted at the Danish Hydraulics Institute, as part of a research project,
to improve the modelling in urban catchments of microbial loads (Mark, 2010).
Kay and Falconer (2008) have argued for emergence of a new research agenda called hydro-
epidemiology, which could be explored as part of the CORFU project.
Psychological impacts of flooding
Mental health impacts should be separated from other health impacts, mainly because the
knowledge of these impacts is less than for those other areas, and their relationship with
flooding is particularly complex. According to (Hajat et al., 2005) the studies are hampered

Project Report Contract no. 244047 _________________________________________________________________________________________________________________
39
by the varying definitions of outcomes used. Some are focused on post-traumatic stress
disorder (PTSD) as a specific entity, while some use standard instruments such as the
General Health Questionnaire, which does not give a specific diagnosis.
Table 6 - Incidence of leptospirosis outbreaks linked to flooding (from Lau et al, 2010)
Country, Region Year Flooding Event
Mumbai, India 2005 944mm in 24hr resulted in an eight fold rise
in the number of cases compared with the
previous 4 years.
Laos 2006 Flooding associated with seropositivity for
the disease with an odds ratio of 2.12
Puerto Rico 1996 Leptospirosis diagnosed in 6% of non-
dengue febrile illnesses pre-hurricane versus
24% of non-dengue febrile illnesses post-
hurricane
Kerala, India 2002 Peak in leptospirosis observed 7-10 days
after heavy rainfall
Indonesia 2002 Outbreak following massive flooding in
Jakarta in Janaury 2002
Italy 2002 Devastating flooding in suburban area
resulted in 6.8% seroconversion
(development of specific antibodies in blood
serum) rate for leptospirosis
Nicaragua 1995 Epidemic of leptospiros following sever
rainfall and flooding. Greater than 5000mm
of rainfall, where annual average of
1300mm
New Caledonia 2008 High rainfall and flooding associated with La
Nina. Epidemic of leptospirosis in 138
people, with incidence rate of 500 per
100,000 in Bourail region.
Post-traumatic stress disorder (PTSD) is defined as “arising after a stressful event of an
exceptionally threatening or catastrophic nature and is characterised by intrusive memories,

Project Report Contract no. 244047 _________________________________________________________________________________________________________________
40
avoidance of circumstances associated with the stressor, sleep disturbances, irritability and
anger, lack of concentration and excessive vigilance”. It is the most commonly studied and
probably the most frequent psychological disorder that occurs after traumatic events and
natural disasters. A review of its epidemiology was conducted by Galea et al (2005), using
studies from 1980 to 2003. The prevalence of PTSD related to natural disasters was found
to range between 5 to 60%, with most of the studies showing numbers towards the lower
end of this range. The review demonstrated that the biggest risk factor for developing PTSD
during a natural disaster was the extent of the exposure, and therefore injured people, for
example, are significantly more likely to develop PTSD. Approximate figures from the review
suggested that the prevalence among direct victims of disasters is at 30-40%, 10-20% among
rescue workers, and 5-10% in the general population. Other risk factors included gender
(women are shown to be more likely to suffer from PTSD), pre-existing psychological
disorders and low social support.
More specifically related to flooding, studies quoted by Ahern et al (2005) have shown a
prevalence of 22% of PTSD during the 1993 Midwest floods, or 19% among flood victims of
the 1997 Central Valley Floods in California. However, studies are limited in some cases by
the fact that some of the results from these studies are self-reported. A study in India (Telles
et al., 2009), showed older people were more prone to PTSD than the younger population.
A meta-analysis of the risk-factors that are linked to PTSD caused by traumatic events was
conducted by Brewin et al (2000). The analysis showed similar factors were linked with a
higher prevalence of PTSD, including age, education, previous trauma and psychiatric
history, as well as the severity of the trauma and the lack of social support.
Huang et al (2010) studied post-traumatic stress disorder among people in flood-hit areas in
the Hunan Province in China, and developed what they claimed to be the first predictive
model of PTSD using a risk-score model among flood victims in a large population. Nearly
30,000 individuals were selected for the study, of whom 25,500 participated (87% response
rate). 70% of the sample was used to develop the predictive model, with the remaining 30%
used to test the model’s predictive skill. The prediction model used 7 variables:
Age
Gender
Education level
Type of flood (soaked flood (drainage related), collapsed embankment (river) flood,
or flash flood).
Severity of flood
Flood experience
Mental status before flood

Project Report Contract no. 244047 _________________________________________________________________________________________________________________
41
These variables were used to develop a risk score, and individuals with a score higher than a
certain threshold were then diagnosed as potential sufferers. The model has a positive
predictive value of 23%, and a negative predictive value of 98% (for a threshold of 67.5
although this was a function of the threshold. As the threshold increased, the Positive
Predictive Value increased, while the Negative Predictive Value1 decreased), showing that
the model had some predictive value. There were several limitations of the study. Firstly,
because the survey was taken after the flooding, recall and information bias could be
present. Secondly, the sufferers of PTSD were not diagnosed by trained psychologists, and
so their diagnosis might not have been accurate.
Verger et al (2003) developed indicators for the cumulative exposure to a flooding incident
in south-eastern France in 1992, and assessed its association with the incidences of PTSD
five years later. The researchers found a strong exposure-effect relationship, and argued
that such studies could be used to develop a greater predictive understanding of the impact
of flooding on mental health.
Other psychological disorders are known to affect people affected by flooding include
anxiety and depression. Most of the studies on the effects of these disorders are from
wealthier countries, although a study quoted by Ahern et al (2005) focused on Bangladesh.
Among 162 children aged 2 to 9 years old, 16 children were found to be very aggressive
post-flood, in contrast to no reports before the flood. The prevalence of bed-wetting
increased from 16% to 40%.
Ahern et al (2005) conclude that the mental health impacts of flooding, especially the long-
term impacts, and their principal causes, have been inadequately researched, even in high-
income settings. A study in Lewes, UK, following the floods of 1998, demonstrated a four-
fold increase in psychological distress among flood-affected people (Reacher et al., 2004).
An unquantified increase in visits to doctors with mental health problems was noted in
Nimes, following the floods of 1988 (Duclos et al., 1991).
The vulnerability of the population to these health impacts is clearly important and is briefly
discussed in the following section.
Social Vulnerability
There is a discussion in the literature over the precise meaning of vulnerability in the
context of flooding. In addition, there is the need to distinguish between ‘vulnerability’ and
‘deprivation’. To give an example, the elderly may be vulnerable to flooding, but not
materially deprived.
1 The Positive Predictive Value (PPV) is a measure of the ability of the method or technique to correctly identify
true. The Negative Predictive Value (NPV) is a measure of the ability to measure true negatives
Project Report Contract no. 244047 _________________________________________________________________________________________________________________
42
The Social Flood Vulnerability Index (SFVI) was developed for the UK as a measure of the
coping capacity of the flood affected population, and includes indicators such as the number
of elderly people, lone parents as well as people with pre-existing health and financial
deprivation problems (Tapsell et al., 2002). This approach has been used on several case
studies in the UK, in Salford and in Maidenhead. However, this work is limited to the UK,
and the factors that give rise to social vulnerability may be significantly different in the other
case study cities considered in this project.
A similar index was proposed by Lekuthai and Vongvisesomjai (2001) who introduced a
“Anxiety-Productivity and Income Interrelationship Approach”, or API approach. However,
this approach attempts to quantify intangible damage in monetary terms. It does this by
relating flood depth to anxiety, anxiety to productivity, and productivity to income. Finally, it
is able to produce a relationship between flood depth and loss of income. The equations
used to estimate these relationships are based on survey data. Although this study was
conducted in Thailand, the techniques have been applied to St Maartens in the Dutch
Antilles (Vojinovic et al., 2008).
3.2 Quantification of health impacts
Although it is evident from these studies that the health impacts of flooding are significant,
it would be useful to be able to quantify the health impacts of flooding. This section of the
report considers how the health impacts of flooding can be best be quantified.
There are three techniques that can be applied to quantify the health impacts of flooding.
Firstly, direct measurements of the changes to the health of the population could be
made. For example, the number of fatalities, injuries and numbers of the infections
that either have occurred in an ex-post evaluation, or could be expected, in an ex-
ante evaluation.
Secondly, indirect measurements of the health impacts on the population could be
made. Two common measurements that will be discussed are the Quality Adjusted
Life Year (QALY) and the Disability Adjusted Life Year (DALY). These two measures
attempt to make an estimate of the change in health levels of summed over the life
(or the expected remaining life) of a person, which can then be aggregated over the
population.
Thirdly, and most controversially, the health impacts could be quantified in
monetary terms. However, there may be ethical concerns with these methods,
where some may feel uncomfortable placing a monetary value, for example, on a
human life.
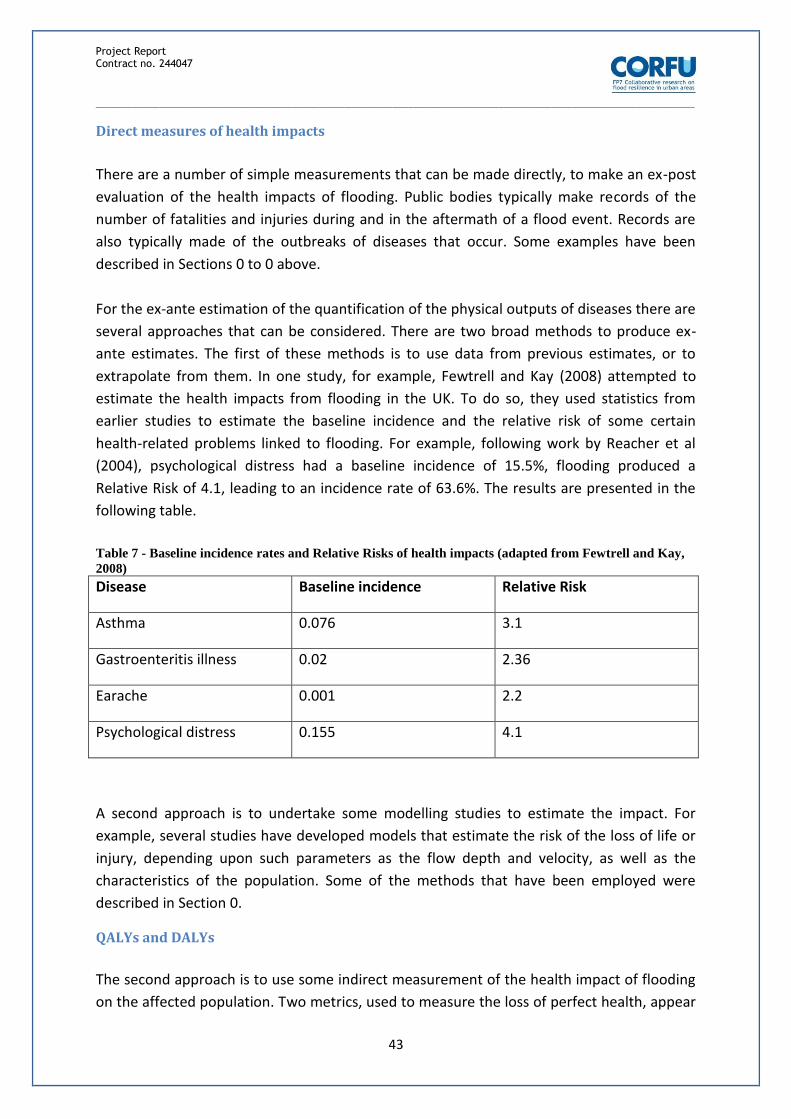
Project Report Contract no. 244047 _________________________________________________________________________________________________________________
43
Direct measures of health impacts
There are a number of simple measurements that can be made directly, to make an ex-post
evaluation of the health impacts of flooding. Public bodies typically make records of the
number of fatalities and injuries during and in the aftermath of a flood event. Records are
also typically made of the outbreaks of diseases that occur. Some examples have been
described in Sections 0 to 0 above.
For the ex-ante estimation of the quantification of the physical outputs of diseases there are
several approaches that can be considered. There are two broad methods to produce ex-
ante estimates. The first of these methods is to use data from previous estimates, or to
extrapolate from them. In one study, for example, Fewtrell and Kay (2008) attempted to
estimate the health impacts from flooding in the UK. To do so, they used statistics from
earlier studies to estimate the baseline incidence and the relative risk of some certain
health-related problems linked to flooding. For example, following work by Reacher et al
(2004), psychological distress had a baseline incidence of 15.5%, flooding produced a
Relative Risk of 4.1, leading to an incidence rate of 63.6%. The results are presented in the
following table.
Table 7 - Baseline incidence rates and Relative Risks of health impacts (adapted from Fewtrell and Kay,
2008)
Disease Baseline incidence Relative Risk
Asthma 0.076 3.1
Gastroenteritis illness 0.02 2.36
Earache 0.001 2.2
Psychological distress 0.155 4.1
A second approach is to undertake some modelling studies to estimate the impact. For
example, several studies have developed models that estimate the risk of the loss of life or
injury, depending upon such parameters as the flow depth and velocity, as well as the
characteristics of the population. Some of the methods that have been employed were
described in Section 0.
QALYs and DALYs
The second approach is to use some indirect measurement of the health impact of flooding
on the affected population. Two metrics, used to measure the loss of perfect health, appear

Project Report Contract no. 244047 _________________________________________________________________________________________________________________
44
frequently in the literature on health impact assessments. These are the Quality Adjusted
Life Years (QALY) and the Disability Adjusted Life Year (DALY).
The Quality Adjusted Life Year (QALY) was developed in the 1960s by economists,
operations researchers, and psychologists, primarily for use in cost-effectiveness analysis
(Gold et al., 2002). Its function is to combine the number of years of life that are added to
an individual by a certain medical intervention, with a measure of the quality of those years
(using a scale where 1 is a year of perfect health, decreasing to zero as the health
deteriorates).
A related, but more relevant metric used in health impact assessment is the Disability
Adjusted Life Year (DALY). In a sense, it is the obverse of a QALY, as its aim is to quantify the
health that is lost, by either some disease or disaster. The DALY has been adopted by the
World Health Organisation as a metric to assess the burden of diseases, injuries and risk
factors on human populations (Murray and Acharya, 1997). The DALY is described as
combining the "time lived with a disability and the time lost due to premature mortality”.
Years lost from premature mortality are estimated with respect to a standard expectation of
life at each age. Years lived with disability are translated into an equivalent time loss by
using a set of weights which reflect reduction in functional capacity, with higher weights
corresponding to a greater reduction (Anand and Hanson, 1997). DALYs have been applied
in studies such as Pruss et al (2002), which estimated the disease burden from water,
sanitation, and hygiene to be 5.7% of the total disease burden (in DALYs) occurring
worldwide, taking into account such diseases as diarroea and schistosomiasis.
The DALY is not a universally accepted measure, and there has been criticism of some of the
assumptions used in its formulation. For example, Anand and Hanson (1997) argued that
There is no account taken for other important socio-economic factors, such as
wealth, which does affect the ‘burden’ felt by an individual.
The weighted age-function, which values one year of a mid-age person rather than
that of a child or an older person
Discounting factors are used so that one person’s life may be worth more than five
people in fifty years time.
Some of these criticisms have been rebutted by Murray and Acharya (1997), who state that
functions within the DALY framework can be adjusted to recalibrate the value placed on
different lives at different stages. However, it remains the case the DALY is not universally
accepted within the health assessment field (Nygaard, 2000).
Project Report Contract no. 244047 _________________________________________________________________________________________________________________
45
The DALY has been used within the UK to assess the health risk from flooding (Fewtrell et
al., 2008). This study considered the health impacts of pluvial flooding in the UK. This study
categorised health impacts into three groups:
Mortality and injuries
Infection; and
Mental health effects.
The study demonstrated that, in the UK case study, the greatest impacts on human health
were related to mental health problems, something also noted in the review by Ahern et al
(2005). However, this may not be the case in developing countries where the risk of disease
outbreak is known to be greater. This framework of using DALYs to estimate the burden of
disease from flooding could be extended within the CORFU project, and applied to the
various case studies.
3.3 Monetisation of intangible impacts
Much of the focus on intangible damage has been on health impacts, although there are
other intangible impacts such as environmental or recreational impacts which fall under the
category of intangible damage. They are not easily monetised, there have been attempts in
the literature to place a price on them. Firstly this report will focus on human health impacts
Placing a value on human life and health
Mishan (1971), discussed the range of methods that can be used to incorporate the value of
life into cost-benefit analyses:
1. Discounting to the present the person’s future earnings (known as a gross output
approach);
2. Discounting to the present the loss of money accrued to others only as a result of a
person’s death (known as a net output approach). This can be thought of as a more
refined version of the first approach;
3. Taking a social approach, and assess the number of additional or reduced deaths due
to investment decisions;
4. The insurance principle, where it is considered how much a person is willing to pay in
insurance premiums combined with the probability of his or her death.
These approaches have been developed further, and methods of assessing the value of
human life can be placed into two categories. The first of these categories is known as a
human capital approach, in which it explores the income in some way that is lost following a
mortality. The second approach uses concepts known as the Willingness To Pay (WTP), or
the Willingness to Accept (WTA). WTP or WTA can be estimated using either revealed or
expressed (or stated) preference surveys.
Project Report Contract no. 244047 _________________________________________________________________________________________________________________
46
There are some who criticise of putting a monetary value on a human life (Ackerman and
Heinzerling, 2004). They argued that a human life is simply beyond valuation, although that
it not to say the value of a human life is infinite.
Human Capital Approach
One approach is to estimate the lost future income (discounted to present), referred to as a
gross output method, or to estimate the loss amount of money accrued to other as a result
of a person’s death (approach 2. above).
In the first approach, the person’s income is summed (and discounted over their expected
remaining lifetime (had they not died), whereas for the second approach, their income
generated minus the expenditure that passes to others is summed. The first method is
criticised by some, who argue that the method implicitly relies on the idea that it is an
appropriate economic policy to maximise Gross National Product (GNP). However, in its
favour, it does readily enable the calculation of the “value” of a life. The second method is
deemed more reasonable, in that it considers the economic benefit to society of a life as a
whole. However, it can lead to the conclusion that the premature death of someone’s life,
whose net output was negative, such as a retired or unemployed person, would be a benefit
to society. It is also criticised for taking no account of the feelings of the person’s decedents.
An ethical problem with this approach is that wealthier people who earn more, are valued
more than either the less well off or the retired or ill. This method also ignores the intrinsic
value of life.
Willingness to Pay or Willingness to Accept
This second class of methods relies on the idea that a person or persons are willing to pay
some amount to reduce the risk of death or injury, or are willing to accept some amount , to
face a higher risk of death or injury.
A problem with this model is that they can assume a linearity relation between the value of
life, probability of death and the premium that should be paid. For example, assume a man
is willing to be paid $100,000 to do a job where the risk of death is 25%, suggesting a value
of his life of $400,000. However, it is implausible to suggest he would go to a certain death
for $500,000. A further criticism is that the insurance premium is the value one would want
to accrue to others on his death (perhaps his family), but does not necessarily state how he
values his own life for its own sake. Take the example of a bachelor with no family, he may
have no desire to take out insurance, but will value his own life to some degree.
Values from WTP or WTA methods can be derived from Revealed or Express Preference
studies. These are described below.

Project Report Contract no. 244047 _________________________________________________________________________________________________________________
47
Expressed or stated preference methods
Expressed or stated preference rely the idea of directly asking people how much they would
be willing to pay, either in insurance premiums or indirectly for flood defences, for example,
to reduce the risk of death or injury. These are often conducted through a methodology
called Contingent Valuation.
Fischer at al (1989) applied this concept to estimating the value of a human life, and
concluded that empirical studies indicated a range for the value-per-statistical-life estimates
of $1.6m to $8.5m (in 1986 US Dollars). A study conducted by DEFRA and the Environment
Agency in England and Wales, based on a WTP concept, suggested a £200 value per
household per year as representing the benefits of a reduced risk of flooding (DEFRA and
EA, 2004).
Revealed preference methods
Expressed preference methods are contrasted with Revealed Preference techniques, where
the one’s valuation of their life and health is estimated by observing their decisions in
relation to other markets. For example, one might be willing to pay more for a house, if it
were identical to another but with reduced flood risk. There have been fewer studies into
estimating the value of human life with revealed preference methods. However, they have
been used to study the value of other intangible impacts such as environmental losses, and
these are briefly discussed in the next section.
Valuing other intangible impacts
As with estimating human life, expressed preference techniques can be used to estimate the
value of other intangible impacts such as the loss of environmental or cultural benefits.
However, revealed preference techniques have been more widely applied.
In a meta-study, Daniel et al (2009) considered the difference in house prices to assess the
value of flood risk. This is known as a hedonic pricing method. They concluded that the
results were highly variable, but estimated that ncrease in the probability of flood risk of
0.01 in a year is associated to a difference in transaction price of an otherwise similar house
of –0.6%. This study does not explicitly estimate the health impacts of flooding however,
but rather the value of being flood free. The problem with this kind of estimation is
identifying precisely what the risk is that is being estimated.
A further method is the replacement cost method. For example, wetlands damaged in a
flood can be rehabilitated, but there is a cost associated with this rehabilitation. However,
this method is unlikely to uncover the true cost of the method.

Project Report Contract no. 244047 _________________________________________________________________________________________________________________
48
The production cost method can investigate the economic benefit derived from a resource,
such as through tourism, or perhaps through the market price of fish that might be caught in
a lake or river. A related method is the substitute or proxy method uses the value of some
substitute good that is closely linked with the damaged resource.
Finally, a method that has been applied to valuing the benefit derived from some
environmental benefit is the travel cost approach. Through calculating the amount that
people are prepared to spend to travel to the environmental amenity, the benefit of the
amenity can be estimated.
Other techniques of incorporating intangible damage in an impact assessment
If, as some authors have suggested, it is not feasible to adequately monetise the losses to
human health, it may be necessary to adopt a multi-criteria decision scheme. The different
criteria (e.g. monetary losses, health losses) can be weighted in importance, using weighting
processes such as simple additive, pairwise comparison, simple weighted average, ordered
weighted average, spatial ordered weighted average (SOWA) or fuzzy additive weighted
processes (Yager, 1988, Makropoulos and Butler, 2006).

Project Report Contract no. 244047 _________________________________________________________________________________________________________________
49
4 Work in the case study areas This section of the report will describe in detail some of the damage estimates that have
been conducted in or near to the case study cities. This work has principally been derived
from work with our case study partners.
4.1 Barcelona
Barcelona, and the Catalonia region in general, has a long history of being affected by
flooding, with records stretching back to the Middle Ages (Barrera et al., 2005). A list of
some of these events is presented in Table 8.
Table 8 - Damage estimates from flood events in Barcelona
Date
Max.
Intensity
(mm/h)
Total
Precipitatio
n (mm)
Discharge
(m3/s)
Economic
loss (million
€)
Deaths
October 1907 - - 1500
(Martorell) - 29
October 1940 - - 2200
(Martorell) 0,7 300
September 1962 110 (1 h) 250 1550
(Martorell) 16 815
September 1971 82 (4 h) 400 1630
(Martorell) 42 19
November 1982 17 (24 h) 556 1600
(Martorell) 270 14
June 2000 100 (1 h) 225
1100
(Castellbell i
el Vilar)
65 5
There are three broad approaches to estimating flood impacts in Barcelona.
INUNCAT methodology
The first of these is known as INUNCAT, a Flood Risk Management Plan that describes a
methodology to assess the level of flood risk at a municipality level, and was developed by
the Catalan Water Agency (ACA). It consists of a methodology to assess the flood hazard
(together with River Area Planning PEFCAT (ACA, 2005), which is framed in the European
Water Framework Directive (2000/60/CE)) and vulnerability, obtaining a level risk of each
Catalan municipality.
In the frame of the INUNCAT plan, the flood hazard is obtained using hydraulic and
hydrologic models that allow to determine the flood delimitation areas regarding different

Project Report Contract no. 244047 _________________________________________________________________________________________________________________
50
return periods (T=50, T=100 and T=500). For each of the cells (1x1 m in the Llobregat basin
(south-west of Barcelona)) the flood water depth is given.
The vulnerability to flood events depends on several variables, such as the flood water
depth, water velocity, debris concentration and duration of the event.
Depending on the flood risk level of each municipality, the creation of a Municipal Action
Program (PAM) is set as compulsory, recommended or not needed. Most of the
municipalities (501 out of 946) of Catalonia (including Barcelona), must have a PAM for
flood events, as shown in Figure 5.
Figure 5 - Map showing municipalities where Action Plans are compulsory (red) and recommende
(orange)
The direct tangible costs, are separated in three different categories:
Loss assessment;
Population in the affected area;
The length of road affected
The loss assessment for different land uses are obtained differently. In the case of urban
land use, the damages are calculated with damage-depth curves, using the same
methodology as in the USA or Great Britain. However, it uses a relative damage function,
where the proportion of damage to the property is assessed.

Project Report Contract no. 244047 _________________________________________________________________________________________________________________
51
Figure 6 - Damage curves used in INUNCAT plan
Depending on the typology and kind of building studied, different curves are used, as well as
different value is given to the structure, as it can be seen in the next table. In addition, the
damages of the goods contained in the building are considered as half of the monetary
value of the structure.
Table 9 - Monetary value given to the structures of different kinds of buildings
Typology Cost (€/m2)
Apartments 606,79
Average income
home 653,01
Two-story house 529,46
For industrial and commercial land use categories, the same methodology is used, but a
single value has been established: 346.5 €/m2 and the coefficient for the goods contained in
the building is 1.07.
In camp sites, these two values are 117€/m2 and 1.07 and, for rural areas, the value given
depends on the land cover:

Project Report Contract no. 244047 _________________________________________________________________________________________________________________
52
Table 10 - Monetary value given to the different kinds of land cover
Type of crops Dry Irrigated
Cerals (€/Ha) 356,9 553,9
Fruit trees (€/Ha) 2168,4 4713,3
Vineyard (€/Ha) 2253,2 2880,9
The measurement of the population that lives in affected areas is done by using, for each
municipality, data from the last population census, together with the flood hazard curves for
different return periods.
According to the affected roads, a threshold of 0.3m of water depth has been established,
and all the km with a higher water depth have been considered as affected.
By doing all this in Barcelona, the potential damage values obtained are as follows:
Damages: €10.2m
21,000 people affected
5km of road flooded
In the INUNCAT plan, this qualifies as a high level of risk is detected, and therefore it is
required to obtain a Municipal Action Program.
Indirect tangible damages, and intangible damages are not included in the INUNCAT
methodology.
SW0801 methodology
The SW0801 project (Medium & long term strategies to manage flooding events in urban
and peri-urban areas) is framed in the R+i Alliance funding program, a genuine management
tool to target research on water and environment. Leaders in the water sector currently
participate in this very active network to shape, finance and manage research programmes.
This project aims to develop a methodology for flood risk assessment in urban and peri-
urban areas, focused on different types of floods. Flood risk must be determined in order to
obtain the impacts or damages of a given rainfall. This methodology has been tested in the
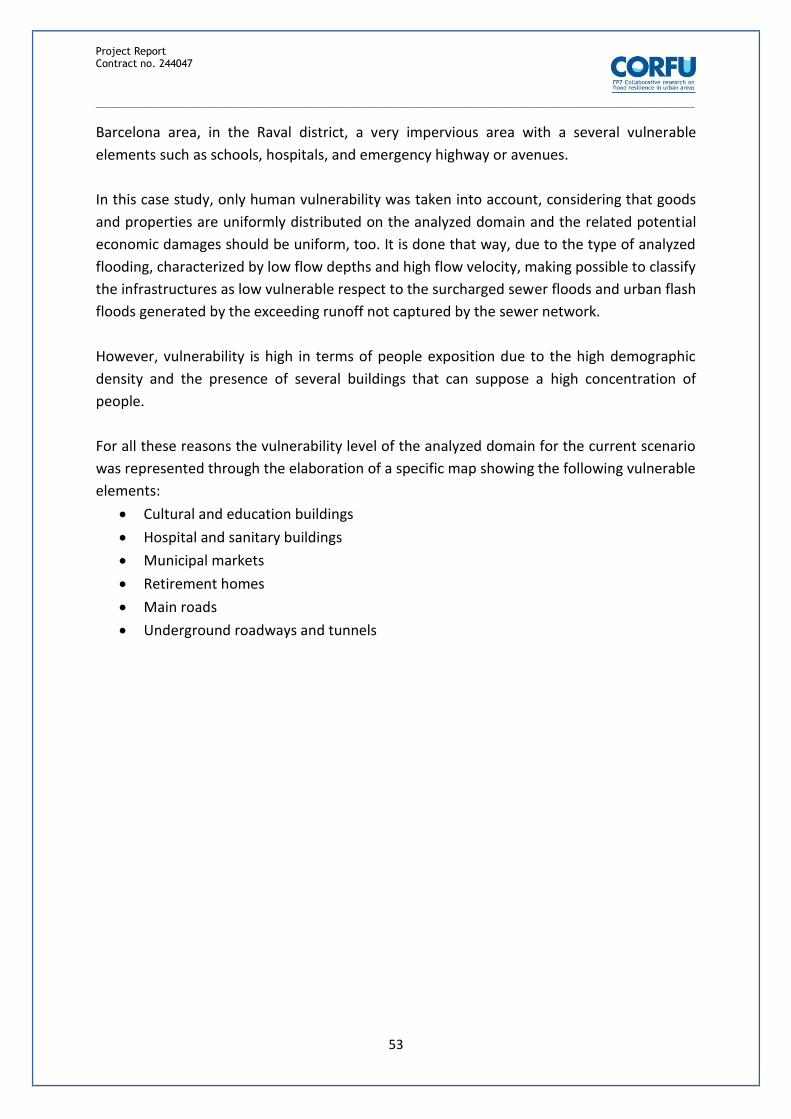
Project Report Contract no. 244047 _________________________________________________________________________________________________________________
53
Barcelona area, in the Raval district, a very impervious area with a several vulnerable
elements such as schools, hospitals, and emergency highway or avenues.
In this case study, only human vulnerability was taken into account, considering that goods
and properties are uniformly distributed on the analyzed domain and the related potential
economic damages should be uniform, too. It is done that way, due to the type of analyzed
flooding, characterized by low flow depths and high flow velocity, making possible to classify
the infrastructures as low vulnerable respect to the surcharged sewer floods and urban flash
floods generated by the exceeding runoff not captured by the sewer network.
However, vulnerability is high in terms of people exposition due to the high demographic
density and the presence of several buildings that can suppose a high concentration of
people.
For all these reasons the vulnerability level of the analyzed domain for the current scenario
was represented through the elaboration of a specific map showing the following vulnerable
elements:
Cultural and education buildings
Hospital and sanitary buildings
Municipal markets
Retirement homes
Main roads
Underground roadways and tunnels
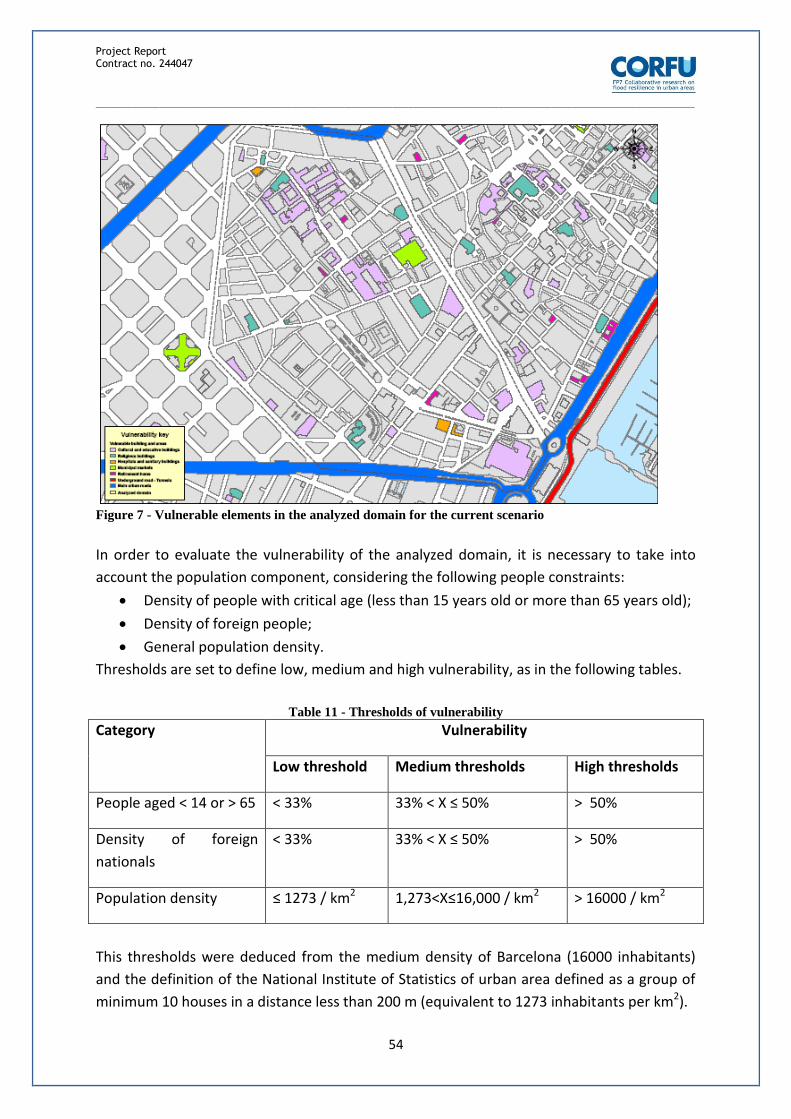
Project Report Contract no. 244047 _________________________________________________________________________________________________________________
54
Figure 7 - Vulnerable elements in the analyzed domain for the current scenario
In order to evaluate the vulnerability of the analyzed domain, it is necessary to take into
account the population component, considering the following people constraints:
Density of people with critical age (less than 15 years old or more than 65 years old);
Density of foreign people;
General population density.
Thresholds are set to define low, medium and high vulnerability, as in the following tables.
Table 11 - Thresholds of vulnerability
Category Vulnerability
Low threshold Medium thresholds High thresholds
People aged < 14 or > 65 < 33% 33% < X ≤ 50% > 50%
Density of foreign
nationals
< 33% 33% < X ≤ 50% > 50%
Population density ≤ 1273 / km2 1,273<X≤16,000 / km2 > 16000 / km2
This thresholds were deduced from the medium density of Barcelona (16000 inhabitants)
and the definition of the National Institute of Statistics of urban area defined as a group of
minimum 10 houses in a distance less than 200 m (equivalent to 1273 inhabitants per km2).

Project Report Contract no. 244047 _________________________________________________________________________________________________________________
55
Then values of 1, 2 and 3 were given, respectively to low, medium and high vulnerability,
and for the assessment of the final human vulnerability, the maximum values were selected
for each sub-district.
With all this, a final map of vulnerability was obtained, where in this particular case, almost
all the region is rated with a high vulnerability value (3), as it can be seen in the next figure.
Figure 8 - Vulnerability mapping in Barcelona
ACA simplified methodology
From a draft report framed in the PEFCAT plan, a simplified methodology of flood risk
assessment on singular points was created in 2008 by the Catalan Water Agency (ACA). It
consisted on different tables where a weighed value was given to each of the categories,
and then, by multiplying the different variables (intensity, probability, vulnerability, etc.), a
final value for each point is obtained, and classified as high, medium or low risk.
According to vulnerability, the categories created together with its values given can be seen
in the following table.
Table 12 - Vulnerability factors for the ACA simplified methodology
Name V
Life loss 16

Project Report Contract no. 244047 _________________________________________________________________________________________________________________
56
Urban zones, vulnerable areas, industrial or commercial
areas 8
Road infrastructures and other basic networks 8
Other (rural zones, cultural heritage regions, etc.) 4
Free urban systems (green areas, parking zones, etc.) 2
Agriculture and farming regions 2
Natural regions without anthropological uses 0
4.2 Hamburg
KALYPSO is an open source software package, and was developed jointly by the Hamburg
University of Technology (TUHH) and Bjornsen Consulting Engineers. It comprises separate
modules that permit the modelling and mapping of various facets of flood risk, including a
1D and 2D Hydrodynamic modelling, as well as damage estimation techniques. KALYPSO
RISK is the module that enables the modelling of direct tangible damage. A unit loss
methodology is used, that combines flooded depths, land-use types and depth-damage
curves to estimate flood damage. Flood depths from different return period events can be
used to estimate the Expected Annual Damage.
The main steps in using KALYPSO to estimate flood damage are as follows (Schrage et al.,
2009)
Land use on the flood-plain is categorised into standard land-use units;
Asset values and damage functions are derived for the land-use units, on the
basis of available statistical data;
Overlay the land-use data and inundation data;
Calculate the damage within each unit by making use of the asset values and
the damage functions
Calculate the expected average annual damage by summing the expected
damage of different likelihoods, and then weighting them by their probability
TUHH has also developed a software tool called FLORETO. This allows for a more micro-scale
analysis of direct tangible damage. The user can specify individual building types, the
number of floors, property inventories and other variables to establish depth-damage
curves.
A case study was conducted on the Wilhemsburg area of Hamburg using three approaches.
The first was the rasterised medium scale standardised damage curves. The second
approach was to use a physically based individual property level assessment. Thirdly, the
two approaches were coupled, using physically based damage curves rather than standard
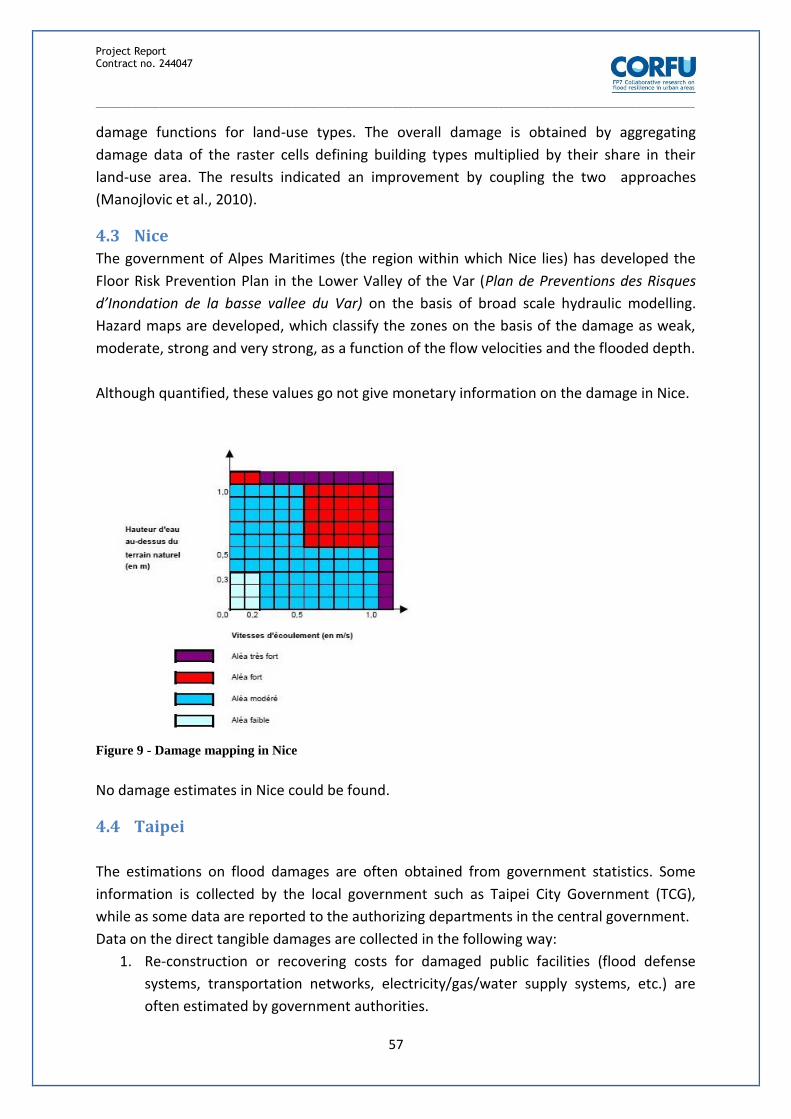
Project Report Contract no. 244047 _________________________________________________________________________________________________________________
57
damage functions for land-use types. The overall damage is obtained by aggregating
damage data of the raster cells defining building types multiplied by their share in their
land-use area. The results indicated an improvement by coupling the two approaches
(Manojlovic et al., 2010).
4.3 Nice
The government of Alpes Maritimes (the region within which Nice lies) has developed the
Floor Risk Prevention Plan in the Lower Valley of the Var (Plan de Preventions des Risques
d’Inondation de la basse vallee du Var) on the basis of broad scale hydraulic modelling.
Hazard maps are developed, which classify the zones on the basis of the damage as weak,
moderate, strong and very strong, as a function of the flow velocities and the flooded depth.
Although quantified, these values go not give monetary information on the damage in Nice.
Figure 9 - Damage mapping in Nice
No damage estimates in Nice could be found.
4.4 Taipei
The estimations on flood damages are often obtained from government statistics. Some
information is collected by the local government such as Taipei City Government (TCG),
while as some data are reported to the authorizing departments in the central government.
Data on the direct tangible damages are collected in the following way:
1. Re-construction or recovering costs for damaged public facilities (flood defense
systems, transportation networks, electricity/gas/water supply systems, etc.) are
often estimated by government authorities.
Project Report Contract no. 244047 _________________________________________________________________________________________________________________
58
2. Tax relief claims from individual households and business, collected by tax revenue
office.
3. Household damage estimates are made by field surveys conducted by government
investigators.
The indirect tangible damages are estimated in the following ways:
1. Cost of emergency operations (management, evacuation and rescue, shelters),
estimated by the Emergency Operation Center (EOC) of TCG
2. The loss of business transactions and delay of product deliveries are reported by
individual businesses to the Department of Economic Development of TCG, and to
the Ministry of Economic Affairs in the central government
3. Increase in food (vegetable) prices because of supply shortages from outside of
Taipei are estimated by the Council of Agriculture in the central government.
4. Tourism losses are reported by the travel agencies, hotels, and tourism industries to
the Ministry of Transportation and Communication in the central government.
5. Aftermath cleansing costs are estimated by the TCG
Intangible impacts, including health impacts (both physical and mental) are estimated in the
following ways:
1. Statistics on the loss of life, injuries and the missing are collected by the EOC of TCG
2. Clinics and hospitals records are reported to the Department of Health, TCG
All of these damages are then collected by the EOC from the various government
departments. The final detailed figures are collected by:
1. Field investigations by the Department of Civil Affairs;
2. Tax relief claims from victims by the Department of Finance;
3. Business losses from the Department of Economic Development;
4. Road and drainage recovery costs by the Department of Public Works;
5. Deaths and injuries by the Department of Health;
6. Water supply systems repairs by the Taipei Water Company;
7. Rapid transit system damage and losses are collected by the Department of Rapid
Transit System and Taipei Rapid Transportation Corporation.
Other than these estimates made by municipal government, some flood damages are
estimated in the national scale by the departments of central government (flood defense
facility, highway agency, airport, agriculture and business).
Some households are not liable for paying income tax, and the damages caused to those
people are not included in the tax relief claims. Other deficiencies for the collected ex-post
damage data include the fact that the damages are collected immediately after the event,
using simplified methods. Systematic guidelines for estimating the flood damages more
precisely is required.

Project Report Contract no. 244047 _________________________________________________________________________________________________________________
59
The central government and TCG are highly involved with the flood damage estimation. The
databases are stored in different government departments, collected via the above-
mentioned methods.
Our colleagues in the NTU and NCDR have been involved in several studies of flood damage
estimation and flood insurance planning. They may hold some useful information that we
can apply to the CORFU case study.
In a study, the economic losses are loss of life over a period from 1991 to 2001 were quoted
(Teng et al., 2006).
Table 13 - Economic losses in Taipei from 1991 to 2001 (from Teng et al, 2006)
Year 1991 1992 1993 1994 1995 1996 1997 1998 1999 2000 2001
Loss of
life
31 15 36 28 35 73 28 17 54 89 178
Economic
damages
(US $m)
32.4 22.9 26.2 15.1 13.8 19.4 24.2 33.7 28.8 36.1 55.7
However, there have been several investigations with computer modelling to develop
damage estimates.Research by Shaw(2005a) showed that the damage caused by Typhoon
Nari was affected by socio-economic factors such as human vulnerability. For example, the
number of years that one had lived in the same area reduced flood damage. There were
also some differences noted when comparing the number of times a person had been
flooded before. The paper concluded that these factors should be taken into consideration
when estimating flood damages.
There have been several academic studies into flood damage estimation in Taiwan, that
have largely focused on the direct tangible damages. Chang (2009) developed depth-
damage curves for the industrial and commercial sectors in Taiwan, using data from
Typhoon Nari that struck Taiwan in 2001. Kang et al. (2005) developed depth-damage
curves for residential areas in Taipei, using socio-economic data such as persons per
household, building characteristics, and indoor decorations, furniture and appliances for
Taipei. For example, information on the percentage of households that possessed
dishwashers or televisions were used in the development of the stage-damage curves. It
was suggested in this study that the information derived for Taipei could be adjusted and
applied to other cities, using such information as land values and taxation data.
Project Report Contract no. 244047 _________________________________________________________________________________________________________________
60
Finally, research was conducted by Su et al (2005) into using a grid-based flood damage
model. The model was developing using aggregated census data, rather than parcel data to
estimate the damages. The benefit of this approach was that the data handling is more
practical, although there is the potential that the estimates are less accurate. The model
was applied to Shih-Jr City.
No ex-ante methods to estimate intangible damages were found in the literature.
4.5 Mumbai
No formal techniques have been used to estimate flood damages in Mumbai. However,
flood damages in the past have been estimated by personal interview of various head or
senior officials of organizations; information available with Government during flood and
informal sources like newspapers.
Watson Hawksley International Ltd had adopted a following simplistic approach of
estimation of flood loss while preparing master plan for Greater Bombay storm drainage
and sewer rehabilitation (BRIMSTOWAD Project, 1993). They investigated several factors
Number of Establishment affected by flooding
Average loss per establishment (based on actual observation and probability of
occurrence of flood per year).
Ex-post estimates of the impacts from the 2005 Flood
On 26th July 2005, extremely high rainfall totals were recorded in Mumbai and the
surrounding area. In 24 hours, from 8.30am on the 26th July, 944mm of rain was recorded at
the Santa Cruz meteorological station to the south of the City. At least 419 people (and
15,000 cattle) were killed as a result of the ensuing flash floods and landslides in the
Mumbai municipal area, and another 216 as a result of flood-related illnesses. Over 100 000
residential and commercial establishments and 30 000 vehicles were damaged (Gupta,
2007).
Water levels rose rapidly, and much of the transport networks was submerged. Road traffic
was immobilized, low-lying areas in the city were heavily flooded, with the poor being the
worst affected, although no social groups were unaffected. Basic services were damaged,
with no electricity in Mumbai, telephone services were disrupted. Access to information was
limited, causing greater difficulties. The Western and Central Railways did not run their local
services for a number of days, and all the long-distance trains run by the Central Railways

Project Report Contract no. 244047 _________________________________________________________________________________________________________________
61
were cancelled. The national and international flights at the Sahar and Santacruz airports
were disrupted for a number of days (Government of Maharashtra, 2006).
A substantial number of buildings were damaged: 175,000 residential buildings were
partially damaged, damaged while 2,000 were fully damaged and 40 000 commercial
establishments suffered heavy losses. Some 30 000 vehicles were damaged and 850 buses
of the Mumbai Transport were damaged. The following table, taken from the report by the
Governent of Maharashtra (the Indian state within which Mumbai is situated) in million
rupees shows the losses from the 2005 event.
In Mumbai, reports of diseases were made, and listed in the following table.
Table 14 - Hospital admissions following the 2005 floods
Name of the disease Admission in the
last 24 hours
Total admissions
since 29th July
Number of deaths
Gastroenteritis 154 1318 1
Hepatitis 27 194 --
Enteric fever,
typhoid
5 53 --
Malaria 62 406 2
Dengue 5 49 --
Leptospirosis 56 197 10
Fever (unknown
cause)
597 1,044 45
Total 906 3,261 57
Table 15 - Total losses in the Mumbai 2005 floods
Nature of losses Total losses (Bn Rupees)
Infrastructure losses 10
Livestock losses 1
Housing losses 3
Loss of crops 6

Project Report Contract no. 244047 _________________________________________________________________________________________________________________
62
Export losses 8
Total losses 28
Insured losses in Mumbai were as follows. It can be seen that the insured losses are only a
small proportion of the estimated total losses.
Table 16 - Insured losses in the Mumbai 2005 floods
Insurance type Total losses (Bn Rupees)
Insurance of cars 0.3
Insurance of property 0.2
Insurance of shops 0.5-0.6
Insurance of Godowns (warehouses) 2
Total losses 3.1-3.2
An ex-ante study was conducted by Ranger et al (2011) into the potential impact of climate
change on Mumbai. The study investigated the direct and economic damage that could be
caused by flooding, assuming certain future carbon emission scenarios. Intangible damages
were not considered. In that study, the exposure to flooding was estimated from several
sources. Population was estimated using local census data. The distribution of property
types was derived from the analysis of satellite data. The total insured values were taken
from an existing insurance industry database (RMS India Earthquake model), to create a
total insured value (TIV) of $2,960m from the residential, commercial and industrial sectors.
Vulnerability was first considered using stage – relative depth-damage curves (See Section
2.1 for an explanation) for each of the three sectors (residential, commercial and industrial).
However, because of the lack of good data, an average mean damage ratio was applied, and
therefore only flood extent was taken into account. A disadvantage of this study is,
therefore, if floods, as expected become deeper, the results will be underestimates, unless
some adjustment is made. The data used to create the average mean damage ratio came
from the July 2005 event discussed above. Data were taken from published statistics from
the Dartmouth Flood Observatory and Swiss Re data (a reinsurance firm), assuming 50% of
the total damage came from the Greater Mumbai area, and 70% of these losses were

Project Report Contract no. 244047 _________________________________________________________________________________________________________________
63
related to residential, commercial and industrial losses. These were also combined with
insured loss data taken from RMS, as well as RMS simplified flood vulnerability curves, with
estimates of the flooded depth taken from Gupta (2007). Infrastructure losses were then
added, and assumed to be 40% of the combined residential, commercial and industrial
direct damage.
As for the indirect damage, an Input-Output model, known as the Adaptive Regional Input-
Output model was used (Hallegatte, 2008). The model has previously been discussed in
Section 0. Sector-by-sector macroeconomic data from the National Council of Applied
Economic Research was used, and downscaled to the Mumbai area. Several modifications
were made to the model, to make it more applicable to the Mumbai area. A difficulty with
the indirect losses is that it was not possible to validate these losses because of no data on
the wider implications on the economy. The study did go on to consider the benefit of
resilience measures, and in particular the role that insurance could play in reducing the
indirect economic losses.
4.6 Dhaka, Bangladesh
The information on Dhaka comes largely from work conducted by Dr. K. M. Nabiul Islam,
firstly as part of a PhD at the University of Middlesex, and from two subsequent books
published on the subject.
In a study on the impacts of flooding in Bangladesh, estimates were made of the direct and
indirect impacts of flooding (Islam, 2000), using unit-loss models for the direct tangible
damages, and linkage models for the indirect effects. Estimates were made for river, flash
and tidal floods, and it was shown that tidal flooding in Bangladesh caused the greatest
damage.
An input-output model was used to estimate the indirect effects of flooding upon the
economy, and it was estimated to be 61% of the direct damages.
However, there are no known formal methods that are prescribed by the government to
assess flood impacts in Bangladesh.
As mentioned earlier in this report, there have been a few studies that investigated the
potential for communicable diseases in Bangladesh (see Section 0).
4.7 Beijing, China
The methods for estimating flood damages in Beijing are limirted. According to our project
partners, in the past 20 years, North China has been very dry with relatively few flooding
events, and the reservoir on the Yongding has helped for Beijing to avoid flooding.

Project Report Contract no. 244047 _________________________________________________________________________________________________________________
64
Normally in China, direct tangible damages are evaluated by national ex-post investigations
and from loss report produced by the local government. The estimation of indirect tangible
damages is very difficult.
There are some methods on flooding assessment in our work, especially in direct loss
evaluation. We usually use statistic or empirical model to estimate the flooding loss, and the
key factor in flooding loss evaluation is the rate of loss, it is related to the factors such as the
intensity of the flooding, the submergence depth, the submergence time length etc. The
rate of loss also is different that related to land use such as urban, agriculture, forest etc.
The rate of loss is also related to location, and the quality of construction.
The rate of loss usually is calculated by this formula:
In China, The Department of Disaster Mitigation has conducted research on how to appraise
the indirect damages caused by flooding, but the methods are not well used.
Zhang et al (2002) reviewed the techniques employed more widely in China to evaluate
flood damages. With funds from the Ministry of Science and Technology of China, the
National Professional and Operational Integrated System (NPOIS), which uses remote
sensing technology, was developed to monitor and evaluate natural disasters, of which
flooding is one of the most prevalent. Before flooding, the system is able to estimate the
economic and social losses under different alternatives, based on social and economic
databases. During flooding, the system dynamically monitors flooded areas, and after
flooding, the system can be used to calculate the actual losses from flooding.
Figure 10 - Data flow in NPOIS From Zhang et al (2002)

Project Report Contract no. 244047 _________________________________________________________________________________________________________________
65
That article notes that when flood disasters occur in China, local governments are required
to report the losses to the national government, in order to receive relief funds. However,
there is a tendency for these losses to be inflated. The priorities for the damage assessment
are as follows.
The area of homes submerged and the population affected;
The area of crop land submerged and the losses;
Damage to infrastructure, including roads, bridges and pipe lines;
Damage to flood control works such as dykes and dams.
The techniques for the analysis are shown in the following figure.
Figure 11 - From Zhang et al 2002
The system was applied to investigate widespread flooding of the River Yangtze in the
summer of 1998. A flood disaster report was produced and showed that the total inundated
area was 1403.2km2. The system was able to produce estimates of the submerged areas,
broken down into classes, such as wetland, grassland, urban areas and suburban residential
areas.
Ni et al (2010) studied the impacts of flooding in terms of sustainability in China. Two indices
were developed to evaluate the flood impacts. The first, termed the Insurance Related
Flood Risk Index (IRFRI), which measures impacts in the short term. It is a function of
vulnerability and the Flood Hazard Index (FHI. The second measure, the Long Term Flood
Impact on Sustainability (LFIS) is a ratio of the Flood Hazard Index to the Sustainability
Development Index (SDI). The techniques used were rapid assessment techniques. The SDI,

Project Report Contract no. 244047 _________________________________________________________________________________________________________________
66
developed by Sun et al (2010) uses social, economic and environmental indicators, such as
GDP per capita, number of telephones per 1000 people, and forest coverage to develop
indicator scores for counties and cities in China. Of 58 major cities investigated, Beijing was
found to have the highest sustainability indicator score. The Flood Hazard Index was a
function of the climate, geomorphology and the river network. Vulnerability was a function
of the per-Capita GDP, the population density, the arable land density and the road density.
The research showed the variability of these indices across China. The rapid assessment
techniques were compared with work derived from an earlier PhD thesis (unavailable in
English), and good agreement was found between the results. The results from the two
indices demonstrated the need for both the short-term economic losses and longer term
changes in sustainability to considered in flood risk management.
Broad-scale modelling was discussed by Harvey et al (2009) who described how the UK
Foresight Flooding approach could be applied to the Taihu Basin in China.
In one study on the Hunan Province, a Synthetic Evaluation Model was developed to
investigate the impacts of flooding in the Hunan Province (Tan et al., 2006). Data from
historical floods were studied, and data on the number of casualties, the incidence of Post-
Traumatic Stress Disorder, the spread of diseases, as well as the economic losses. The
model was used to predict the impacts of flooding with differently ranked indicators.

Project Report Contract no. 244047 _________________________________________________________________________________________________________________
67
5 Conclusions This review has assessed the existing literature on flood impact assessment. From the
review, several points can be highlighted.
There has been a greater emphasis in the literature of the estimation of direct
tangible damage. There are some shortcomings to these techniques, especially in
reference to the impacts on infrastructure.
There is a less developed understanding of the impacts of flooding on the wider
economy, as indirect tangible damage. Indirect damage is often poorly defined, and
suffer from the problem of setting the boundary of the area to be studied.
Health impacts are as significant, if not more significant than tangible flood impacts.
Diseases are thought to be a more significant problem in the developing world.
Mental health impacts are even more difficult to assess than the physical impacts.
The assessment of all impacts is made more difficult by a lack of good quality flood
impact data. This leads to problems with the validation of flood damage data.
The quantification of health impacts is difficult. The use of the DALY appears to be a
useful avenue through which the impacts could be quantified. The monetising of
health impacts is difficult and likely to remain so because of the value attached to
human life.
Due to the difficulty of putting a monetary value on human life, it may be that the
most appropriate way of comprehensively assessing all flood impacts will be through
some multi-criteria decision scheme.
There is a need for a consistent, comprehensive framework to consider all types of
damage. There is a multitude of techniques that are used in different countries or
regions, and so a comparison of impacts can be difficult.
Estimates from flood damage are uncertain. More emphasis on understanding the
uncertainty surrounding these damage estimates may be necessary.

Project Report Contract no. 244047 _________________________________________________________________________________________________________________
68
6 References ACKERMAN, F. & HEINZERLING, L. 2004. Priceless: on knowing the price of everything and the value
of nothing, New York, The New Press. AHERN, M., KOVATS, R. S., WILKINSON, P., FEW, R. & MATTHIES, F. 2005. Global health impacts of
floods: Epidemiologic evidence. Epidemiologic Reviews, 27, 36-46. ANAND, S. & HANSON, K. 1997. Disability-adjusted life years: a critical review. Journal of Health
Economics, 16, 685-702. BARRERA, A., BARRIENDOS, M. & LLASAT, M. C. 2005. Extreme flash floods in Barcelona County.
Advances in Geosciences, 2, 111-116. BLONG, R. 2003. A new Damage Index. Natural Hazards, 30, 1-23. BOUWER, L. M., CROMPTON, R. P., FAUST, E., HOPPE, P. & PIELKE, R. A. 2007. Confronting disaster
losses. Science, 318, 753-753. BOYD, E., LEVITAN, M. & VAN HEERDAN, I. 2005. Further specification of the dose-relationship for
flood fatality estimation. US-Bangladesh workshop on innovation in windstorm/storm surge mitigation construction. Dhaka, Bangladesh.
BREWIN, C. R., ANDREWS, B. & VALENTINE, J. D. 2000. Meta-analysis of risk factors for posttraumatic stress disorder in trauma-exposed adults. Journal of Consulting and Clinical Psychology, 68, 748-766.
CHANG, L.-F., KANG, J.-L. & SU, M.-D. Year. Depth-damage curve for flood damage assessments industrial and commerical sectors. In: 4th IASME/WSEAS International Conference on Water Resources, Hydtaulics and Hydrology 2009 Cambridge.
CHANG, L. F., LIN, C. H. & SU, M. D. 2008. Application of geographic weighted regression to establish flood-damage functions reflecting spatial variation. Water SA, 34, 209-215.
COCHRANE, H. 2004. Economic loss: myth and measurement. Disaster Prevention and Management, 13, 290-296.
COMMITTEE ON ASSESSING THE COSTS OF NATURAL DISASTERS 1999. The Impacts of Natural Disasters: A Framework for
Loss Estimation. National Research Council. DANIEL, V. E., FLORAX, R. J. G. M. & RIETVELD, P. 2009. Flooding risk and housing values: An
economic assessment of environmental hazard. Ecological Economics, 69, 355-365. DEFRA & EA 2004. The appraisal of human-related intangible impacts of flooding R & D Technical
Report. DEFRA/EA 2006. Flood risks to people. Phase 2. The flood risks to people methodology. Flood and
Coastal Defence R&D Programme. DÖLL, S. 2009. Climate change impacts in Computable General Equilibrium models: An overview.
HWWI Research Papers. Hamburg: HWWI. DOWNTON, M. W. & PIELKE, R. A. 2005. How accurate are disaster loss data? The case of US flood
damage. Natural Hazards, 35, 211-228. DUCLOS, P., VIDONNE, O., BEUF, P., PERRAY, P. & STOEBNER, A. 1991. Flash-Flood Disaster-Nimes,
France, 1988. European Journal of Epidemiology, 7, 365-371. DUTTA, D., HERATH, S. & MUSIAKE, K. 2001. Direct flood damage modeling towards urban flood risk
management. Joint Workshop on Urban Safety Engineering. Bangkok, Thailand: Asian Institute of Technology.
ECLAC 1991. Manual for estimating the socio-economic effects of natural disasters. Santiago, Chile. ELLSON, R. W., MILLIMAN, J. W. & ROBERTS, R. B. 1984. Measuring the regional economic effects of
earthquakes and earthquake predictions. Journal of Regional Science, 24, 559-579. EUROPEAN COMMISSION 2007. EU Directive of the European Parliament and of the European
Council on the estimation and management of flood risks. 2007/60/EU. FEWTRELL, L. & KAY, D. 2008. An attempt to quantify the health impacts of flooding in the UK using
an urban case study. Public Health, 122, 446-451.

Project Report Contract no. 244047 _________________________________________________________________________________________________________________
69
FEWTRELL, L., KAY, D. & ASHLEY, R. 2008. Flooding and health - an evaluation of the health impacts of urban pluvial flooding in the UK. In: FEWTRELL, L. & KAY, D. (eds.) Health Impact Assessment for Sustainable Water Management. IWA Publishing.
FISCHER, A., CHESTNUT, L. G. & VIOLETTE, D. M. 1989. The value of reducing risks of death: A note on new evidence. Journal of Policy Analysis and Management, 8, 88-100.
FORD, D. T. 2001. Flood-Warning Decision-Support System for Sacramento, California. Journal of Water Resources Planning and Management, 127, 254-260.
FRENI, G., LOGGIA, G. L. & NOTARO, V. 2010. Uncertainty in urban flood damage assessment due to urban drainage modelling and depth-damage curve estimation. Water Science and Technology, 61, 2979-2993.
GALEA, S., NANDI, A. & VLAHOV, D. 2005. The epidemiology of Post-Traumatic Stress Disorder after Disasters.
GISSING, A. & BLONG, R. 2004. Accounting for variability in commercial flood damage estimation. Australian Geographer, 35, 209-222.
GOLD, M. R., STEVENSON, D. & FRYBACK, D. G. 2002. HALYs and QALYs and DALYs, oh my: Similarities and differences in summary measures of population health. Annual Review of Public Health, 23, 115-134.
GOVERNMENT OF MAHARASHTRA 2006. Maharashtra Floods 2005, Relief and Rehabilitation. GRÜNTHAL, G., THIEKEN, A., SCHWARZ, J., RADTKE, K., SMOLKA, A. & MERZ, B. 2006. Comparative
Risk Assessments for the City of Cologne – Storms, Floods, Earthquakes. Natural Hazards, 38, 21-44.
GUPTA, K. 2007. Urban flood resilience planning and management and lessons for the future: A case study of Mumbai, India. Urban Water Journal, 4, 183-194.
HAJAT, S., EBI, K. L., KOVATS, R. S., MENNE, B., EDWARDS, S. & HAINES, A. 2005. The human health consequences of flooding in Europe: a review. Extreme Weather Events and Public Health Responses, 185-196.
HALLEGATTE, S. 2008. An adaptive regional input-output model and its application to the assessment of the economic cost of Katrina. Risk Analysis, 28, 779-799.
HALLEGATTE, S., PATMORE, N., MESTRE, O., DUMAS, P., CORFEE-MORLOT, J., HERWEIJER, C. & MUIR-WOOD, R. 2011. Assessing climate change impacts, sea level rise and storm surge risk in port cities: a case study on Copenhagen. Climatic Change, 104, 113-137.
HARRIS, A. M., CHOWDHURY, F., BEGUM, Y. A., KHAN, A. I., FARUQUE, A. S. G., SVENNERHOLM, A. M., HARRIS, J. B., RYAN, E. T., CRAVIOTO, A., CALDERWOOD, S. B. & QADRI, F. 2008. Shifting Prevalence of Major Diarrheal Pathogens in Patients Seeking Hospital Care during Floods in 1998, 2004, and 2007 in Dhaka, Bangladesh. American Journal of Tropical Medicine and Hygiene, 79, 708-714.
HARVEY, G. L., THORNE, C. R., CHENG, X., EVANS, E. P., J.D. SIMM, S. H. & WANG, Y. 2009. Qualitative analysis of future flood risk in the Taihu Basin, China. Journal of Flood Risk Management, 2, 85-100.
HUANG, P., TAN, H., LIU, A., FENG, S. & CHEN, M. 2010. Prediction of posttraumatic stress disorder among adults in flood district. BMC Public Health, 10, 1-8.
ISLAM, K. M. N. 2000. Micro- and macro-level impacts of floods in Bangladesh. In: PARKER, D. (ed.) Floods, Volume 1. London and New York: Routledge.
JAMES, L. D. & LEE, R. R. 1971. Economics of Water Reosurces Planning, New York, McGraw-Hill. JONKMAN, S. N., BOCKARJOVA, M., KOK, M. & BERNARDINI, P. 2008a. Integrated hydrodynamic and
economic modelling of flood damage in the Netherlands. Ecological Economics, 66, 77-90. JONKMAN, S. N., VRIJLING, J. K. & VROUWENVELDER, A. C. W. M. 2008b. Methods for the estimation
of loss of life due to floods: a literature review and a proposal for a new method. Natural Hazards, 46, 353-389.

Project Report Contract no. 244047 _________________________________________________________________________________________________________________
70
KANG, J.-L., SU, M.-D. & CHANG, L.-F. 2005. Loss functions and framework for regional flood damage estimation in residential area. Journal of Marine Science and Technology, 13, 193-199.
KAY, D., EDWARDS, A. C., FERRIER, R. C., FRANCIS, C., KAY, C., RUSHBY, L., WATKINS, J., MCDONALD, A. T., WYER, M., CROWTHER, J. & WILKINSON, J. 2007. Catchment microbial dynamics: the emergence of a research agenda. Progress in Physical Georgraphy, 31, 59-76.
KAY, D. & FALCONER, R. 2008. Hydro-epidemiology: the emergence of a research agenda. Environmental Fluid Mechanics, 8, 451-459.
KAZAMA, S., SATO, A. & KAWAGOE, S. 2009. Evaluating the cost of flood damage based on changes in extreme rainfall in Japan. Sustainability Science, 4, 61-69.
KOK, M., HUIZINGA, H. J., VROUWENFELDER, A. C. W. M. & BERENDREGT, A. 2004. Damage and casualties caused by flooding. Highways and Hydraulics Engineering Department.
KONDO, H., SEO, N., YASUDA, T., HASIZUME, M., KOIDO, Y., NINOMIYA, N. & YAMAMOTO, Y. 2002. Post-flood--infectious diseases in Mozambique. Prehosp Disaster Med, 17, 126-33.
KOWALEWSKI, J. 2009. Methodology of the input-output analysis. HWWI Research Papers. Hamburg: HWWI.
KRASOVSKAIA, I. 2001. Perception of the risk of flooding: the case of the 1995 flood in Norway. Hydrological Sciences Journal-Journal Des Sciences Hydrologiques, 46, 855-868.
KREIBICH, H., PIROTH, K., SEIFERT, I., MAIWALD, H., KUNERT, U., SCHWARZ, J., MERZ, B. & THIEKEN, A. H. 2009. Is flow velocity a significant parameter in flood damage modelling? Natural Hazards and Earth System Sciences, 9, 1679-1692.
KREIBICH, H., SEIFERT, I., MERZ, B. & THIEKEN, A. H. 2010. Development of FLEMOcs - a new model for the estimation of flood losses in the commercial sector, Wallingford, ROYAUME-UNI, IAHS Press.
LASTORIA, B., SIMONETTI, M. R., CASAIOLI, M., MARIANI, S. & MONACELLI, G. 2006. Socio-economic impacts of major floods in Italy from 1951 to 2003. Advances in Geosciences, 7, 223-229.
LAU, C. L., SMYTHE, L. D., CRAIG, S. B. & WEINSTEIN, P. 2010. Climate change, flooding, urbanisation and leptospirosis: fuelling the fire? Transactions of the Royal Society of Tropical Medicine and Hygiene, 104, 631-638.
LEKUTHAI, A. & VONGVISESSOMJAI, S. 2001. Intangible flood damage quantification. Water Resources Management, 15, 343-362.
LEONTIEF, W. 1936. Quantitative input and output relations in the economic system of the United States. The Review of Economic Statistics, 18, 105-125.
MAKROPOULOS, C. K. & BUTLER, D. 2006. Spatial ordered weighted averaging: incorporating spatially variable attitude towards risk in spatial multi-criteria decision making Environmental Modelling & Software, 21.
MANOJLOVIC, N., ANTANASKOVIC, D. & PASCHE, E. 2010. Multiscale flood risk assessment with physically based damage modelling tools. 9th International Conference on Hydroinformatics. Tianjin, China.
MARK, O. 2010. RE: Personal Communication. MARK, O. & DJORDJEVIC, S. 2006. While waiting for the next flood in your city... 7th International
Conference on Hydroinformatics. Nice, France: Research Publishing. MCBEAN, E. A., GORRIE, J., FORTIN, M., DING, J. & MOULTON, R. 1988. Adjustment factors for flood
damage curves. Journal of Water Resources Planning and Management-Asce, 114, 635-646. MERZ, B., KREIBICH, H., SCHWARZE, R. & THIEKEN, A. 2010. Assessment of economic flood damages.
Natural Hazards Earth Systems Science, 10, 1697-1724. MERZ, B., KREIBICH, H., THIEKEN, A. & SCHMIDTKE, R. 2004. Estimation uncertainty of direct
monetary flood damage to buildings. Natural Hazards and Earth System Sciences, 4, 153-163.

Project Report Contract no. 244047 _________________________________________________________________________________________________________________
71
MESSNER, F., PENNING-ROWSELL, E., GREEN, C., MEYER, V., TUNSTALL, S. & VAN DER VEEN, A. 2007. Evaluating flood damages: guidance and recommmendations on principles and methods. In: PROJECT, F. (ed.).
MEYER, V. & MESSNER, F. 2005. National Flood Damage Evaluation Methods. A review of applied methods in England, the Netherlands, the Czech Republic and Germany. UFZ Discussion Papers.
MISHAN, E. J. 1971. Evalaution of life and limb: a theoretical approach. Journal of Political Economy, 79, 687-705.
MURRAY, C. J. L. & ACHARYA, A. K. 1997. Understanding DALYs. Journal of Health Economics, 16, 703-730.
NASCIMENTO, N., MACHADO, M. L., BAPTISTA, M. & SILVA, A. D. P. 2007. The assessment of damage caused by floods in the Brazilian context. Urban Water Journal, 4, 195-210.
NATURAL RESOURCES AND MINES 2002. Guidance on the assessment of tangible flood damages. Queensland Goverment.
NEDIES. Year. In search of a common methodology on damage estimation - workshop proceedings. In: VAN DER VEEN, A., VETERE ARELLANO, A. L. & NORDVIK, J.-P., eds., 2003 Twente.
NI, J., SUN, L., LI, T., HUANG, Z. & BORTHWICK, A. G. L. 2010. Assessment of flooding impacts in terms of sustainability in mainland China. Journal of Environmental Management, 91, 1930-1942.
NYGAARD, E. 2000. Is it feasible or desirable to measure the burdens of disease as a single number? Reproductive Health Matters, 8, 117-125.
PARKER, D. J. 2000. Floods Volume I, Routledge. PAWAR, A. B., BANSAL, R. K., KUMAR, M., JAIN, N. C. & VAISHNAV, K. G. 2008. A rapid assessment of
mosquito breeding, vector control measures and treatment seeking behaviour in selected slums of Surat, Gujarat, India, during post-flood period. Journal of Vector Borne Diseases, 45, 325-327.
PENNING-ROWSELL, E., FLOYD, P., RAMSBOTTOM, D. & SURENDRAN, S. 2005a. Estimating Injury and Loss of Life in Floods: A Deterministic Framework. Natural Hazards, 36, 43-64.
PENNING-ROWSELL, E., JOHNSON, C., TUNSTALL, S., TAPSELL, S., MORRIS, J., CHATTERTON, J. B. & GREEN, C. 2005b. The benefits of flood and coastal risk management: a manual of assessment techniques, Middlesex University Press.
PENNING-ROWSELL, E. & PARKER, D. 1987. The indirect effects of floods and benefits of flood alleviation: evaluating the Chesil Sea Defence Scheme. Applied Geography, 7, 263-288.
PENNING-ROWSELL, E. C. & CHATTERTON, J. B. 1977. The benefits of flood alleviation: A manual of assessment techniques, Aldershot, Gower Technical Press.
PIELKE JR, R. A. 2000. Flood impacts on society - damaging floods as a framework for assessment. In: PARKER, D. (ed.) Floods, Volume 1. London and New York: Routledge.
PRIEST, S. 2007. Building a model to estimate risk to life for European flood events - Final Report. FLOODSITE project.
PRUSS, A., KAY, D., FEWTRELL, L. & BARTRAM, J. 2002. Estimating the burden of disease from water, sanitation, and hygiene at a global level. Environmental Health Perspectives, 110, 537-542.
RANGER, N., HALLEGATTE, S., BHATTACHARYA, S., BACHU, M., PRIYA, S., DHORE, K., RAFIQUE, F., MATHUR, P., NAVILLE, N., HENRIET, F., HERWIJER, C., POHIT, S. & CORFEE-MORLOT, J. 2011. An assessment of the potential impact of climate change on flood risk and Mumbai. Climatic Change, 104, 139-167.
REACHER, M., MCKENZIE, K., LANE, C., NICHOLS, T., KEDGE, I., IVERSEN, A., HEPPLE, P., WALTER, T., LAXTON, C. & SIMPSON, J. 2004. Health impacts of flooding in Lewes: a comparison of reported gastrointestinal and other illness and mental health in flooded and non-flooded households. Commun Dis Public Health, 7, 39-46.

Project Report Contract no. 244047 _________________________________________________________________________________________________________________
72
ROSE, A. 2004. Economic principles, issues, and research priorities in hazard loss estimation. In: OKUYAMA, Y. & CHANG, S. (eds.) Modeling spatial and economic impacts of disasters. Springer.
ROSE, A. & LIAO, S.-Y. 2005. Modeling Regional Economic Resilience to Disasters: A Computable General Equilibrium Analysis of Water Service Disruptions*. Journal of Regional Science, 45, 75-112.
SCAWTHORN, C., FLORES, P., BLAIS, N., SELIGSON, H., TATE, E., CHANG, S., MIFFLIN, E., THOMAS, W., MURPHY, J., JONES, C. & LAWRENCE, M. 2006. HAZUS-MH flood loss estimation methodology. II. Damage and loss assessment. Natural Hazards Review, 7, 72-81.
SCHRAGE, N., ANTANASKOVIC, D., JUNG, T. & PASCHE, E. 2009. KALYPSO – An open source software tool for flood studies in rivers. 8th International Conference on Hydroinformatics. Concepion, Chile.
SCHWARTZ, B. S., HARRIS, J. B., KHAN, A. I., LAROCQUE, R. C., SACK, D. A., MALEK, M. A., FARUQUE, A. S. G., QADRI, F., CALDERWOOD, S. B., LUBY, S. P. & RYAN, E. T. 2006. Diarrheal epidemics in Dhaka, Bangladesh, during three consecutive floods: 1988, 1998, and 2004. American Journal of Tropical Medicine and Hygiene, 74, 1067-1073.
SHAW, D., HUANG, H.-H., HO, M.-C. & LIN, S. 2005a. Modeling flood loss and risk perception. The case of Typhoon Nari in Taipei. Fifth Annual IIASA-DPRI Forum on Integrated Disaster Risk Management: Innovations in Science and Policy. Beijing.
SHAW, D. G., HUANG, H. H. & HO, M. C. 2005b. Modeling flood loss and risk perception: the case of typhoon Nari in Taipei. Proc. 5thAnnu. IIASA-DPRI Meeting on Integrated Disaster Risk Management: Innovations in Science and Policy. Beijing, China.
SMITH, D. I. 1994. Flood damage estimation - a review of urban stage-damage curves and loss functions. Water SA, 20, 231-238.
SMITH, K. & WARD, R. 1998. Floods - Physical processes and human impacts, John Wiley & Sons. SU, M.-D., KANG, J.-L., CHANG, L.-F. & CHEN, A. S. 2005. A grid-based GIS approach to regional flood
damage assessment. Journal of Marine Science and Technology, 13, 184-192. SUN, L., NI, J. & BORTHWICK, A. G. L. 2010. Rapid assessment of sustainability in Mainland China.
Journal of Environmental Management, 91, 1021-1031. TAN, H., PING, W., YANG, T., LI, S., LIU, A., ZHOU, J., GROVES, J. & SUN, Z. 2006. The synthetic
evaluation model for analysis of flooding hazards. European Journal of Public Health, 17, 206-210.
TAPSELL, S. M., PENNING-ROWSELL, E. C., TUNSTALL, S. M. & WILSON, T. L. 2002. Vulnerability to flooding: health and social dimensions. Philosophical Transactions of the Royal Society of London Series a-Mathematical Physical and Engineering Sciences, 360, 1511-1525.
TELLES, S., SINGH, N. & JOSHI, M. 2009. Risk of posttraumatic stress disorder and depression in survivors of the floods in Bihar, India.
TENG, W.-H., HSU, M.-H., WU, C.-H. & CHEN, A. S. 2006. Impact of flood disasters on Taiwan in the Last Quarter Century. Natural Hazards, 37, 191-207.
TORTEROTOT, J. P., KAUARKLEITE, L. A. & ROCHE, P. A. 1992. ANALYSIS OF INDIVIDUAL REAL-TIME RESPONSES TO FLOODING AND INFLUENCE ON DAMAGE TO HOUSEHOLDS. Floods and Flood Management, 15, 363-387.
TSAKIRIS, G., NALBANTIS, I. & PISTRIKA, A. 2009. Critical technical issues on the EU Flood Directive. European Water, 25/26, 39-51.
USCHER-PINES, L. 2007. "But for the hurrcane": Measuring natural disaster mortality over the long term. Prehospital and Disaster Medicine, 22, 149-151.
VAN DER VEEN, A. & LOGTMEIJER, C. 2005. Economic hotspots: Visualizing vulnerability to flooding. Natural Hazards, 36, 65-80.

Project Report Contract no. 244047 _________________________________________________________________________________________________________________
73
VERGER, P., ROTILY, M., HUNAULT, C., BRENOT, J., BARUFFOL, E. & BARD, D. 2003. Assessment of exposure to a flood disaster in a mental-health study. J Expo Anal Environ Epidemiol, 13, 436-442.
VETERE-ARELLANO, A. L., NORDVIK, J.-P. & RANGUELOV, B. Year. In search of a common methodology on damage estimation: from an European perspective. In: VAN DER VEEN, A., ARELLANO, A. L. V. & NORDVIK, J.-P., eds. In search of a common methodology on damage estimation, 2003 2003 Twente. 195-206.
VETERE ARELLANO, A. L., NORDVIK, J.-P. & RANGUELOV, B. Year. In search of a common methodology on damage estimation: from an European perspective. In: VEEN, A. V. D., ARELLANO, A. L. V. & NORDVIK, J.-P., eds. In search of a common methodology on damage estimation - workshop proceedings, 2003 Delft.
VICTORIAN DEPARTMENT OF NATURAL RESOURCES AND ENVIRONMENT 2000. Rapid Appraisal Method (RAM) for Floodplain Management, Report prepared by Read Sturgess and Associates.
VOJINOVIC, Z., EDIRIWEERA, J. C. W. & FIKRI, A. K. 2008. An approach to the model-based spatial assessment of damages caused by urban floods. 11th International Confernce on Urban Drainage. Edinburgh, Scotland.
WATSON, J. T., GAYER, M. & CONNOLLY, M. A. 2007. Epidemics after natural disasters. Emerging Infectious Diseases, 13, 1-5.
WHITE, G. F. 1945. Human adjustment to floods. Research Paper No 93. University of Chicago, Department of Geography.
WHO 2002. Floods: Climate change and adaptation strategies for human health. Report on a WHO meeting. London, UK, 30 June - 2 July 2002.
WIND, H. G., NIEROP, T. M., DE BLOIS, C. J. & DE KOK, J. L. 1999. Analysis of flood damages from the 1993 and 1995 Meuse floods. Water Resources Research, 35, 3459-3465.
WUNSCH, A., HERRMANN, U., KREIBICH, H. & THIEKEN, A. H. 2009. The Role of Disaggregation of Asset Values in Flood Loss Estimation: A Comparison of Different Modeling Approaches at the Mulde River, Germany. Environmental Management, 44, 524-541.
YAGER, R. R. 1988. On ordered weighting average aggregation operators in multi-criteria decision making. IEEE Transactions on Systems, Man and Cybernetics, 18, 183-190.
ZAKI, S. A. & SHANBAG, P. 2010. Clinical manifestations of dengue and leptospirosis in children in Mumbai: an observational study. Infection, 38, 285-291.
ZHAI, G. F., FUKUZONO, T. & IKEDA, S. 2006. An empirical model of fatalities and injuries due to floods in Japan. Journal of the American Water Resources Association, 42, 863-875.
ZHANG, J., ZHOU, C., XU, K. & WATANABE, M. 2002. Flood disaster monitoring and evaluation in China. Environmental Hazards, 4, 33-43.