core.ac.uk · 2018-01-04 · ABSTRACT Natural radioactive sources expose the human beings...
223
STUDY OF NATURAL AMBIENT RADIOACTIVITY IN THE ENVIRONMENT AND SOME MATERIALS ABSTRACT OF THE THESIS SUBMITTED FOR THE AWARD OF THE DEGREE OF Bottor of ^Ijilo^opljp //J m ^^\ Q APPLIED PHYSICS . U X^. rr ^m^^ MEENA MISHRA Under the Supervision of Prof. S.A.H. Naqyi Prof. Rajendra Prasad (Supervisor) (Co-supervisor) DEPARTMENT OF APPLIED PHYSICS Z. H. COLLEGE OF ENGINEERING & TECHNOLOGY ALIGARH MUSLIM UNIVERSITY ALIGARH (INDIA) 2008
Transcript of core.ac.uk · 2018-01-04 · ABSTRACT Natural radioactive sources expose the human beings...

STUDY OF NATURAL AMBIENT RADIOACTIVITY IN THE ENVIRONMENT AND SOME MATERIALS
ABSTRACT OF THE
THESIS SUBMITTED FOR THE AWARD OF THE DEGREE OF
Bottor of ^Ijilo^opljp //J m ^ ^ \
Q APPLIED PHYSICS . U
X^. rr ^m^^
MEENA MISHRA
Under the Supervision of
Prof. S.A.H. Naqyi Prof. Rajendra Prasad (Supervisor) (Co-supervisor)
DEPARTMENT OF APPLIED PHYSICS Z. H. COLLEGE OF ENGINEERING & TECHNOLOGY
ALIGARH MUSLIM UNIVERSITY ALIGARH (INDIA)
2008


ABSTRACT
Natural radioactive sources expose the human beings continuously by their
ionizing radiation. This exposure exceeds from combined man-made sources.
Radioactive nuclides that originated in the earth's crust, are present everywhere in the
environment.
Radon is a noble gas is a decay product of the uranium series and has a fairly long
half life of 3.8 days. Being an inert gas it can easily disperse into the atmosphere as soon
as it is released. The solid alpha active decay products of radon ( Po, Po) become
airborne and attach themselves to the dust particles, aerosols and water droplets in the
atmosphere. On inhalation, these solid decay products along with inhaled air may get
deposited in the tracheo-bronchial(T-B) and pulmonary(P) regions of lungs, and
continuously irradiate the cells by a-particles which may cause lung cancer.
Indoor radon measurements are important as the radiation dose to human
population due to inhalation of radon and its progeny contributes more than 50% of the
total dose from natural sources. Thus large scale studies have been carried out world
wide. There exists few studies relating to passive measurements of thoron. It is assumed
that the inhalation dose from thoron and its progeny is negligible, although recent studies
in many countries have revealed that this may not be entirely correct.
Predominant source of radon in the dwellings is the soil beneath structures, but building
materials and water used in the homes and in few cases natural gas may also contribute.
The concentrations of radium in soil and in building materials vary widely resulting in the
variation of radon concentrations in the dwellings. Thus it is quite important to make a
systematic study of the indoor radon/thoron concentration in Indian dwellings.
tPB^^^
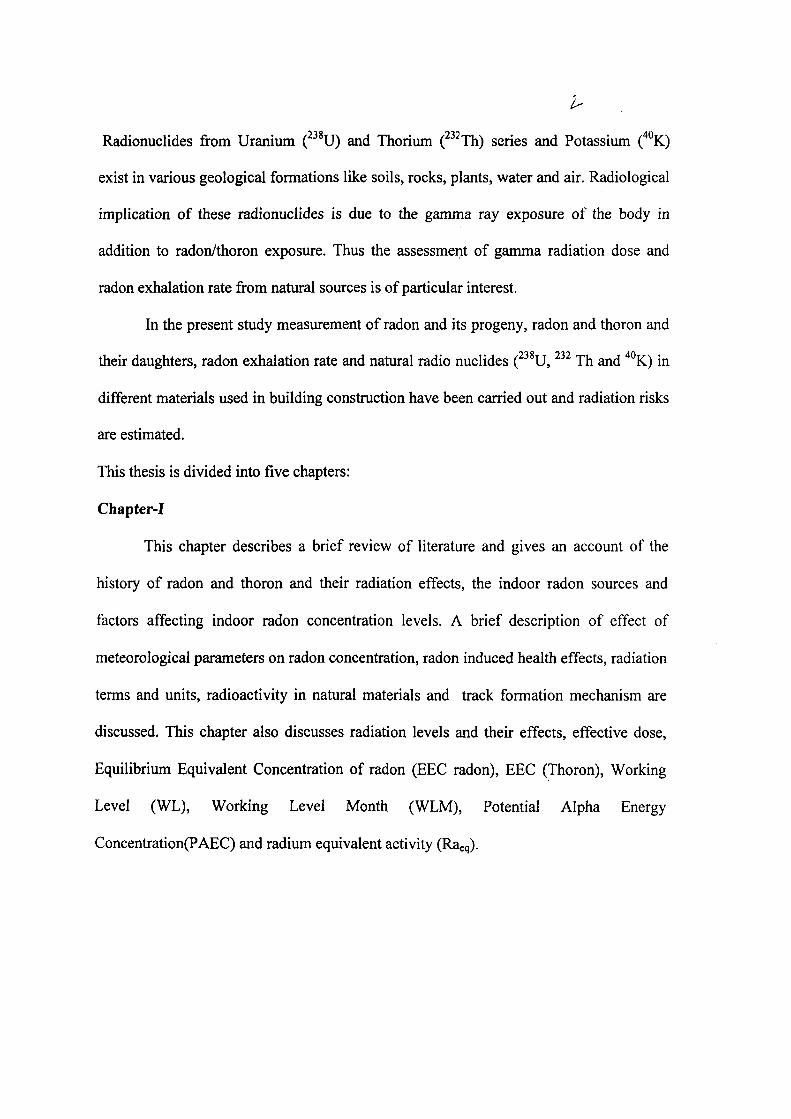
Radionuclides from Uranium ( U) and Thorium ( Th) series and Potassium ( K)
exist in various geological formations like soils, rocks, plants, water and air. Radiological
implication of these radionuclides is due to the gamma ray exposure of the body in
addition to radon/thoron exposure. Thus the assessment of gamma radiation dose and
radon exhalation rate from natural sources is of particular interest.
In the present study measurement of radon and its progeny, radon and thoron and
their daughters, radon exhalation rate and natural radio nuclides ( U, Th and K) in
different materials used in building construction have been carried out and radiation risks
are estimated.
This thesis is divided into five chapters:
Chapter-I
This chapter describes a brief review of literature and gives an account of the
history of radon and thoron and their radiation effects, the indoor radon sources and
factors affecting indoor radon concentration levels. A brief description of effect of
meteorological parameters on radon concentration, radon induced health effects, radiation
terms and units, radioactivity in natural materials and track formation mechanism are
discussed. This chapter also discusses radiation levels and their effects, effective dose.
Equilibrium Equivalent Concentration of radon (EEC radon), EEC (Thoron), Working
Level (WL), Working Level Month (WLM), Potential Alpha Energy
Concentration(PAEC) and radium equivalent activity (Raeq).

Chapter- I I
This chapter presents a brief description of Solid State Nuclear Track Detectors
(SSNTDs), criteria for track formation mechanism of trick formation in SSNTD's and
revelation of tracks. This chapter gives an account of various active and time integrated
radon measurement techniques.
"Sealed Can Techniques" for the measurement of radon exhalation rate
measurements in different materials used in building construction have been discussed in
details. Twin cup radon dosimeter technique used in present study for the measurement
of radon/thoron and their daughter concentrations has been described. Radon exhalation
study from various materials used in building construction is of prime importance for the
estimation of radiation risk.
Low level gamma ray spectroscopic system using HPGe detector used for the
estimation of activity concentration of natural radionuclides (^^^U, ^ ^ Th and ''°K) has
been described.
Chapter- III
"Sealed can techniques" were used for the measurement of radon exhalation rate
from: coal, fly ash, ceramic tiles, granite, mosaic, bazari, badarpur, cement and slag etc,
widely used as building construction materials in this region. The results are discussed in
the light of radiation exposure. The effect of plastering and the use of paints of different
colors and brands on the exhalation rates from fired bricks was also studied. From the
radon exhalation rates radiation doses were estimated.

Chapter-IV
Measurements of natural radioactivity in the form of ^ ^U, ^ ^ Th and ' °K activity
concentrations were carried out in a large no. of soil, fly ash, mosaic and granite samples
collected from different places and widely used as building construction material in the region
and the results are analyzed. Radium equivalent activity, absorbed gamma dose rate,
annual effective doses, external hazard index and internal hazard index were
computed from the activity concentration of radionuclides.
Chapter- V
This chapter presents and discusses the results of measurement of radon and its
progeny concentration in the rooms of the dwelling in the neighourhood of a Thermal
Power Plant at Kasimpur and in the nearby villages using solid state nuclear track
detectors (SSNTD) in "Bare Mode". Track detector based twin chamber dosimeters were
used for estimating radon ( Rn) and thoron ( Rn) gases and their progeny
concentrations in the dwellings of Kasimpur Thermal Power Plant and its neighbouring
villages. From the concentration radiation dose and the resulting risk have been
estimated.
cassis

« ^
STUDY OF NATURAL AMBIENT RADIOACTIVITY IN THE ENVIRONMENT AND SOME MATERIALS
THESIS SUBMITTED FOR THE AWARD OF THE DEGREE OF
©octor of ^l)iIos;opliP ' I ^ ^ .-' •C% IN
, » • • - . « > ' /
; -. <i APPLIED PHYSICS
BY
MEENA MISHRA
Under the Supervision of
Prof. S.A.H. Naqvi Prof. Rajendra Prasad (Supervisor) (Co-supervisor)
DEPARTMENT OF APPLIED PHYSICS Z. H. COLLEGE OF ENGINEERING & TECHNOLOGY
ALIGARH MUSLIM UNIVERSITY ALIGARH (INDIA)
2008
:>s^^

T6935
V .

DEPARTMENT OF APPLIED PHYSICS
^ ^ ^ Z.H. COLLEGE OF ENGG. & TECH.
ALIGARH MUSLIM UNIVERSITY
ALIGARH-202002
l ^ ^ ^
Date ..oL-L^-o^
CERTIFICATET^x Certified that the thesis entitled "Study of Natural Ambient
Radioactivity in the Environment and Some Materials"
submitted by Ms. Meena Mishra is a record of the candidate's
own work carried out by her under our supervision and
guidance. The results presented in this thesis have not been
submitted elsewhere and are suitable for the submission to the
award of Ph.D. degree. M
GXd Prof. S.A.H. Naqvi
Supervisor (Dept. of Applied Physics)
A.M.U. Aligarh
/ _
7^ Prof. Rajendra Prasad
Co-Supervisor (Dept. of Applied Physics)
, A.M.U. Aligarh
^ ^ ^

to fMy Barents
^My^CusSandC

Acknowledgements
/ have great pleasure to express my sincere gratitude to my
supervisors, Prof. S.A.H Naqvi and Prof. Rrajendra Prasad, Department
of Applied Physics, Z.H.College of Engg. & Technology, Aligarh Muslim
University, Aligarh, India for their guidance, encouragement, support
and helpful suggestions throughout the course of this work.
I wish to express my deep sense of gratitude to Prof Rajendra
Prasad for his valuable and efficient guidance and supervision. I am
indebted to him for numerous stimulating discussions, critical comments
and encouragement during the entire course of this work.
I would like to extend my thankfulness to Prof. Alimuddin,
Chairman, Department of Applied Physics, providing me all the facilities
available in the department and encouragement.
Thanks are due to Dr. Amit Roy, Director, Inter University Accelerator
Center(IUAC), New Delhi for allowing me to utilize all the facilities
available in the Health Physics Lab of the centre.
I am deeply indebted to Dr. R.G. ,Sonkawade, Scientist, Inter University
Accelerator Center, New Delhi, for his valuable support and constant help
during the measurements at lUAC. I also wish to thank Mr. Virendra
singh, Lab Assistant at lUAC.
I take this opportunity to thank all teaching and non teaching staff
of the department of Applied Physics who have been very helpful to me.
I am also extremely indebted to my colleagues Mr. Ajay Kumar
Mahur , S. Asad AH, Dr. Sikander AH , Dr. M. Chaman and aU other

research Scholars in the department and my friend, for all the help
rendered to me during the course of this study.
My special thanks go to my husband Dr. Ajay Sharma for his
encouragement, sympathy and moral support for the fulfillment of the aim
of my work.
I am greatly indebted to my parents, Mr. K. M. L. Mishra and Mrs.
Santosh Mishra, my brother, Mr. R. N. Mishra and Bhabhi, Mrs. Surabhi
Mishra who never deprived me of the freedom for exploration and
encouraged me by their prayers and love and provided guidance at every
stage of my study.
In the last but not the least my sincere thanks are also due to Mr.
K. P. Sharma(father-in-law), Mrs. Vadehi Sharma(mother-in-law),
Dr.Anita Sharma(sister-in-law) and Mr. Vijay Sharma(brother-in-law)
for their love, affection, inspiration and moral support.
Financial assistance in the form of fellowship from UGC is
gratefully acknowledged.
(MEENA MISHRA)
t^ s"^
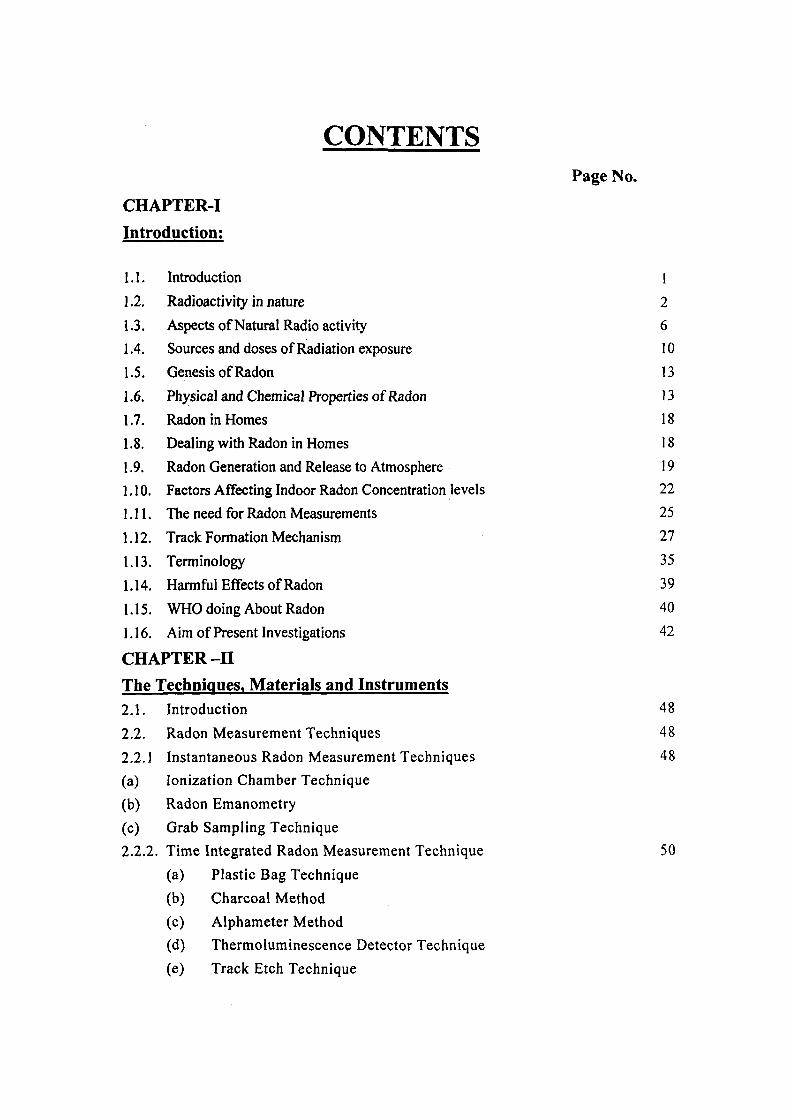
CONTENTS Page No.
CHAPTER-I Introduction:
1.1. Introduction 1
1.2. Radioactivity in nature 2
1.3. Aspects of Natural Radio activity 6
1.4. Sources and doses of Radiation exposure 10
1.5. Genesis of Radon 13
1.6. Physical and Chemical Properties of Radon 13
1.7. Radon in Homes 18
1.8. Deal ing with Radon in Homes 18
1.9. Radon Generation and Release to Atmosphere 19
1.10. Factors Affecting Indoor Radon Concentration levels 22
1.11. The need for Radon Measurements 25
1.12. Track Formation Mechanism 27
1.13. Terminology 35
1.14. Harmful Effects of Radon 39
1.15. WHO doing About Radon 40
1.16. Aim of Present Investigations 42
CHAPTER-11 The Techniques, Materials and Instruments 2.1. Introduction 48
2.2. Radon Measurement Techniques 48
2.2.1 Instantaneous Radon Measurement Techniques 48
(a) Ionization Chamber Technique
(b) Radon Emanometry
(c) Grab Sampling Technique
2.2.2. Time Integrated Radon Measurement Technique 50
(a) Plastic Bag Technique
(b) Charcoal Method
(c) Alphameter Method
(d) Thermoluminescence Detector Technique
(e) Track Etch Technique

2.3 Techniques used in Present Radon Investigation 51
2.3.1 Alpha Particle Etched Track Detector 51
2.3.1.1 CR-39 Detector 54
2.3.1.2. LR-115 type II Detector 54
2.3.1.3. Peculiarity of LR-115 type 11 and CR-39 57
2.3,1.4 Importance of Radon Detectors 58
2.3.2. Radioactivity Measurements Through Gamma Spectroscopy 59
2.3.3 Twin Chamber Dosimeter Cup 60
2.3.4 Spark Counter 61
2.3.5 Etching Apparatus 65
2.3.6 Optical Microscope 65
2.3.7 Bare-Mode Technique 66
2.3.8 Can Technique 66
2.3.8.1 Can Technique I 66
2.3.8.2. Can Technique II 67
Chapter-Ill
Measurement of Radon Exhalation rate and Estimation of Radiation Doses in solid samples
3.1 Introduction 75
3.2 Measurement of radon exhalation rate and estimation of radiation
doses in solid samples i.e. Fly ash, Coal, Slag, Soil, Cement, Sand,
Bazari, and Badarpur. 77
3.2.1 Experimental details 77
(a) Preparation of samples
(b) Experimental technique (can technique I)
(c) Indoor internal exposure due to radon inhalation
3.2.2 Radon exhalation rate and radiation doses in fly ash, coal, bottom
ash and slag samples collected from Panki Thermal Power Plant. 80
3.2.3. Radon exhalation rate and radiation doses from fly ash and coal
samples collected from Kasimpur Thermal Power Plant. 82
3.2.4. Radon exhalation rate and radiation doses in fly ash samples
collected from National Thermal Power Corporation (NTPC), Dadri. 86
3,2.5 Radon exhalation rate and radiation doses in soil samples collected

from different places surrounding the Kasimpur Thermal power plant. 88
3.2.6 Radon exhalation rate and radiation doses in soil samples collected
from inside and outside the Kasimpur Thermal Power Plant. 92
3.2.7 Radon exhalation rate and radiation doses in soil samples collected
from 50 m away from Kasimpur Thermal Power Plant. 94
3.2.8 Radon exhalation rate and radiation doses in soil samples
collected from nearby Panki Thermal Power Plant. 96
3.2.9 Radon Exhalation rate and radiation doses in soil samples
collected from Jaduguda U-mines area (East Singh Bhum
Shear Zone), Jharkhandlndia. 98
3.2.10 Measurement of radon exhalation rate and radiation doses from
some building construction materials. 101
3.3 Measurement of radon exhalation rate and estimation
of radiation doses from solid samples of building materials
i.e. mosaic, granite, ceramic tiles, bricks. 102
3.3.1 Experimental details 102
(a) Experimental technique (can technique II)
(b) Risk estimates
3.3.2 Radon Exhalation rate and radiation doses from granite
samples. 104
3.3.3 Radon Exhalation rate and radiation doses from mosaic samples. 108
3.4 Effect of plastering and paints on the radon exhalation rate and
radiation doses from fired bricks. 111
3.4.1 Effect of fly ash additives in soils 113
CHAPTER-IV Measurement of Natural Radioactivity Through Gamma Ray Spectroscopy
4.1 Introduction. 124
4.2 Measurement of Natural Radioactivity Through Low Level Gamma Ray Spectroscopy. 125
4.3 Computation of Radiological Effects 128
4.3.1 Radium equivalent activity (Ragq) 128

4.3.2 Absorbed gamma dose rate measurement(D) 128
4.3.3 External (Hex) and Internal (Hin) hazard index 129
4.4 Estimation of Activity Concentration of Uranium, Thorium and
Potassium in Mosaic samples. 129
4.5 Measurement of Natural Radioactivity in Granite Samples. 137
4.6 Measurement of Natural Radioactivity in soil Samples from near
Jharkhand U-mines region. 144
4.7 Natural Radioactivity in soil samples collected from the distance
of 50m from Kasimpur thermal power plant. 150
4.8 Measurement of Natural Radioactivity in fly ash Samples from
Kasimpur thermal power plant. 157
CHAPTER-V Measurements of Radon, Thoron and their Prognies in dwellings 5.1. Introduction 167
5.2 Action Levels Limits 169
5.3 Indoor radon and its progeny 170
5.3.1 Measurement of Indoor Radon and its progeny in dwellings
around Kasimpur Thermal Power Plant. 172
5.3.2 Measurement of Indoor Radon and its Progeny in dwellings of Ukhalana Village. 175
5.3.3 Measurement of Indoor Radon and its progeny in dwellings of
Sunamai Village. 178
5.4. Indoor Radon, Thoron and their progeny using Twin Chamber
Dosimeter Cups. 179
5.4.1 Measurement of Indoor Radon, Thoron and their progeny in
dwellings inside Kasimpur Thermal Power Plant. 183
5.4.2 Measurement of Indoor Radon, Thoron and their progeny
indwellings of Ukhalana village. 187
5.4.3 Measurement of Indoor Radon, Thoron and their progeny
in dwellings of Sunamai village. 192
List of Publications 201-202

rf^V tei" X

C H A P T E R - I
I N T R O D U C T I O N
1.1 Introduction
Naturally occurring background radiation is a topic which has evoked curiosity and
concern between the scientist and layman alike in recent years due to the shift in focus
of health effects due to exposure of radiation from acute high level to chronic low
level. Many locations around the world have higher levels of natural background
radiation due to elevated levels of primordial radionuclides in the soil and their decay
products like radon (^^Rn), and thoron ( °Rn). In the environment of late,
technologically enhanced naturally occurring radioactive materials have also
contributed to the burden of background radiation. It has been estimated that
inhalation of ^ ^Rn, °Rn and their short lived progenies contribute more than 54% of
the total natural background radiation dose received by the general population.
Radon is the primary source of naturally occurring a-radiation present every
where in the environment in varying concentration. Radon is the heaviest known gas,
nine times heavier than air. It is the only gas in the long decay chain of heavy metal
element. It is now well established fact that radon when inhaled in large quantity
causes lung disorders and is the second major cause of lung cancer after smoking. The
exposure of population to high concentrations of radon and its daughters for a long
period leads to pathological effects like the respiratory functional changes and the
occurrence of lung cancer (BEIR, 1999).
During recent years, radon monitoring has become a global phenomenon due
to its health hazard effects on population (radiation workers and general public). It has
been estimated that out of 2.2 mSv of dose which an individual receives annually
from low-level exposure, 1.27 mSv is due to radon isotopes and their short-lived

progeny (IAEA, 1988; Narayanan et al. 1991; ICRP, 2000). As the radon in the
environment (indoor and outdoor), Soil, groundwater oil and gas deposits contributes
the largest fraction of the natural radiation dose to population, tracking its
concentration is of fundamental interest from radiation protection, health and hygiene
point of view in mining developments, coal fields, thermal power plants, housing,
building construction materials etc.
1.2 Radioactivity in Nature
Our world is radioactive and has been since it was created. Over 60 radionuclides
(radioactive elements) can be found in nature, and they can be placed in three general
categories.
1. Primordial from before the creation of the earth.
2. Cosmogenic formed as a result of cosmic ray interactions.
3. Human produced- enhanced or formed due to human actions
(minor amounts compared to natural).
Radionuclides are found naturally in air, water and soil. They are even found
in us, being that we are products of our environment. Every day, wc ingest and inhale
radionuclides through air, food and the water. Natural radioactivity is common in the
rocks and soil that makes up our planet, in water and oceans, and in building materials
and homes. There is no place on earth where we can not find natural radioactivity.
In the United States, the annual estimated average effective dose equivalent
from radiation is 360 mrem per adult. This is broken down as shown in Table 1.1

Table 1.1
Annual estimated average effective dose equivalent received by a member of the population of the United State.
Sources
Inhaled (Radon and Decay Products)
Other internally deposited Radionuclides
Terrestrial Radiation
Cosmic Radiation
Cosmogenic Radioactivity
Rounded total from natural source
Rounded total from artificial sources
Total
Average Annual Effective
dose equivalent
(l sv)
2000
390
280
270
10
3000
600
3600
(mrem)
200
39
28
27
1
300
60
360
As shown in the table above, 82% of the total average annual effective dose is
from natural sources of radiation and of that, most is from radon. Of the other 18%,
the majority is from medical diagnosis and treatments with <1% from nuclear power
and fallout.
Primordial Radionuclides
Primordial radionuclides are left over from when the world and the universe were
created. They are typically long lived with half lives often of the order of hundreds of
millions of years. Radionuclides that exist for more than 30 half-lives are not
measurable. Some basic information on some common primordial radionuclides are
shown in Table 1.2.

Table 1.2
Primordial Nuclides
Nuclides
Uranium 235
Uranium 238
Thorium 232
Radium 226
Radon 222
Potassium 40
Symbol
2"U
238^
232^j^
"*Ra
2^2Rn
40^
Half- life
7.04x1 oVr.
4.47x10 V
1.41x10'V
1.60x10 V-
3.82days
1.28xl0V.
Natural Activity
0.72% of all natural uranium
99.2745% of all natural uranium
0.5 to 4.7 ppm total uranium in the common rock types.
1.6 to 20 ppm in the common rock types with a crustal average of 10.7 ppm
0.42 pCi/g (16Bq/kg) in limestone and 1.3 pCi/g (48Bq/kg) in igneous rocks
Noble Gas; annual average air concentrations range in the U.S. from 0.016 pCi/1 (0.6Bq/m^) to 0.75 pCi/1 (28 Bq/m )
Soil 1-30 pCi/g (0.037-l.lBq/g)
Some other primordial radionuclides are ^V, ''Rb, "^Cd, '"in, ' ^Te, ' *La, '"^Ce,
'^Nd, ' ^Sm, '"Gd, ' ^Hf, ' ^Lu, '"Re, ''°Pt, ' ^Pt, ^ ^Bi.
Cosmogenic
Cosmic radiation permeates all of space, the source being primarily outside of our
solar system. The radiation is in many forms, from high speed heavy particles to high
energy photons and muons. The upper atmosphere interacts with many of the cosmic
radiations and produces radioactive nuclides. They can have long half-lives, but the
majority have shorter half-lives than the primordial nuclides. Some common
cosmogenic nuclides are shown in Table 1.3.

Table 1.3
Cosmogenic Nuclides
Nuclides
Carbon 14
Hydrogen (Tritium)
Beryllium
Symbol
' C
H
'Be
Half-life
5730yr.
12.3yr
53.28 days
Source
Cosmic-ray interactions, ' ' 'N (n,p) 'C
Cosmic- ray interactions with N and 0, spallation from cosmic rays, ^Li (n,a) H
Cosmic-ray interactions witli N andO
Natural Activity
6 pCi/g (0.22 Bq/g) in organic material
0.032 pCi/lcg (1.2x10" Bq/kg)
0.27 pCi/lcg. (0.01 Bq/kg)
Some other cosmogenic radionuclides are '°Be, ^ Al, ^ Cl, °Kr, '^C, ^^Si, ^W, ^ Na,
^^S, "Ar, ''P,''?, «Mg, 2 Na, ' \ ^'Si, '«F, 'Cl, ^ Cl, ^ " Cl.
Human Produced
Humans have used radioactivity for one hundred years, and through its use, added to
the natural inventories. The amounts are small compared to the natural amounts, due
to the shorter half-lives of many of the nuclides, have seen a marked decrease since
the halting of above ground testing of nuclear weapons. Here are a few human or
enhanced nuclides shown in Table 1.4.

Table 1.4
Human Produced Nuclides
Nuclides
Tritium
Iodine 131
Iodine 129
Cesium 137
Strontium 90
Technetium 99
Plutonium 239
Symbol
H
. 3 . J
129.
•"Cs
°Sr
^ Tc
2 Pu
Half-life
12.3 yrs
8.04 days
1.57x10^ yrs.
30.17yrs.
28.78 yrs.
2.11x10^ yrs.
2.41x10^ yrs,
Source
Produced from weapons testing and fission reactors, reprocessing facilities, nuclear weapons manufacturing
Fission product produced from weapons testing and fission reactors, used in medical treatment of thyroid problems
Fission product produced from weapons testing and fission reactors
Fission product produced from weapons testing and fission reactors.
Fission product produced from weapons testing and fission reactors.
Decay product of ^^Mu, used in medical diagnosis
Produced by neutron bombardment of ^^^U
(23«u+n-^23^U-^"^Np+P^^^^Pu+ p
1.3 Aspects of Natural Radioactivity
Natural Radioactivity in Soil
Natural radioactivity is found in a volume of soil that is 1 sq. mile, by 1 foot deep.
The following Tablel.5 is calculated for this volume (total volume is 7.894x10^ m )
and the listed activities. Activity levels vary greatly depending on soil type, mineral
make-up and density (~1.5g/cm^ used in this calculation).

Table 1.5
Natural Radioactivity by the Source Mile, 1 Foot Deep
Nuclide
Uranium
Thorium
Potassium
Radium
Radon
Activity used in calculation
0.7 pCi/g (25Bq/lcg.)
l.lPCi/g(40Bq/kg.)
11 PCi/g
(400 Bq/kg.)
1.3 PCi/g
(48 Bq/kg.)
0.17 PCi/g
(10KBq/m^)Soii
Mass of Nuclide
2,200kg
12,000kg
2000kg
1.7g
l l^g
Total
Activity found in the volume of Soil
0.8 Curies
(31GBq)
1.4 Curies
(52 GBq)
13 Curies (6Ci/Bq)
500 GBq
1.7 curies (63 GBq)
0.2 Curies (7.4 GBq)
>17 Curies
(> 653 GBq)
Natural Radioactivity in the Ocean
All waters on the Earth, including seawaters have some radionuclides in them. In the
following Table 1.6, the oceans volumes were calculated from the 1990 world
Almanac:
Pacific = 6.549x10'V^
Atlantic = 3.095x10' m
Total = 1.3x10%^
The activities used in the table below are from 1971 radioactivity in the
Marine Environment, National Academy of Sciences;

Table 1.6
Natural Radioactivity by the Ocean
Nuclide
Uranium
Potassium 40
Tritium
Carbon 14
Rubidium 87
Activity used in Calculation
0.9 PCi/L (33m Bq/L)
300 PCi/L (UBq/L)
0.016 PCi/L (0.6m Bq/L)
0.135 PCi/L (5m Bq/L)
28 PCi/L (1.1 Bq/L)
Activity in Ocean
Pacific
6x10* Ci (22E Bq)
2x10" Ci (7400 EBq)
IxlO^Ci (370 PBq)
8x10^ Ci (3EBq)
1.9x10'° Ci (700 E Bq)
Atlantic 3x10* Ci (HE Bq)
9xl0'° Ci (300 EBq)
5x10^ Ci (190 PBq)
4x10^ Ci (1.5 E Bq)
9x10' Ci (300 EBq)
All Oceans I.lxlO'Ci (41 EBq)
3.8x10" Ci (14000 EBq)
2x10^ Ci (740 PBq)
1.8x10* Ci (6.7 E Bq)
3.6xlO'°Ci (1300 EBq)
Food
Every food has some small amount of radioactivity in it. The common radionuclides
in food are potassium C°K), radium 226 ( ^ Ra), and uranium 238 ( *U) and the
associated progeny. Here is a Tablel.7 of some of the common foods and their levels
of^Kand^^^Ra.
Table 1.7
Natural Radioactivity in Food
Food Banana
Brazil Nuts
Carrot
White Potatoes
Beer
Red Meat
Lima Bean Raw
Drinking Water
'"K(pCi/kg) 3,520
5,600
3,400
3,400
390
3,000
4,640
-
""Ra (pCi/kg) 1
1,000-7,000
0.6-2
1-2.5
-
0.5
2-5
0-0.17
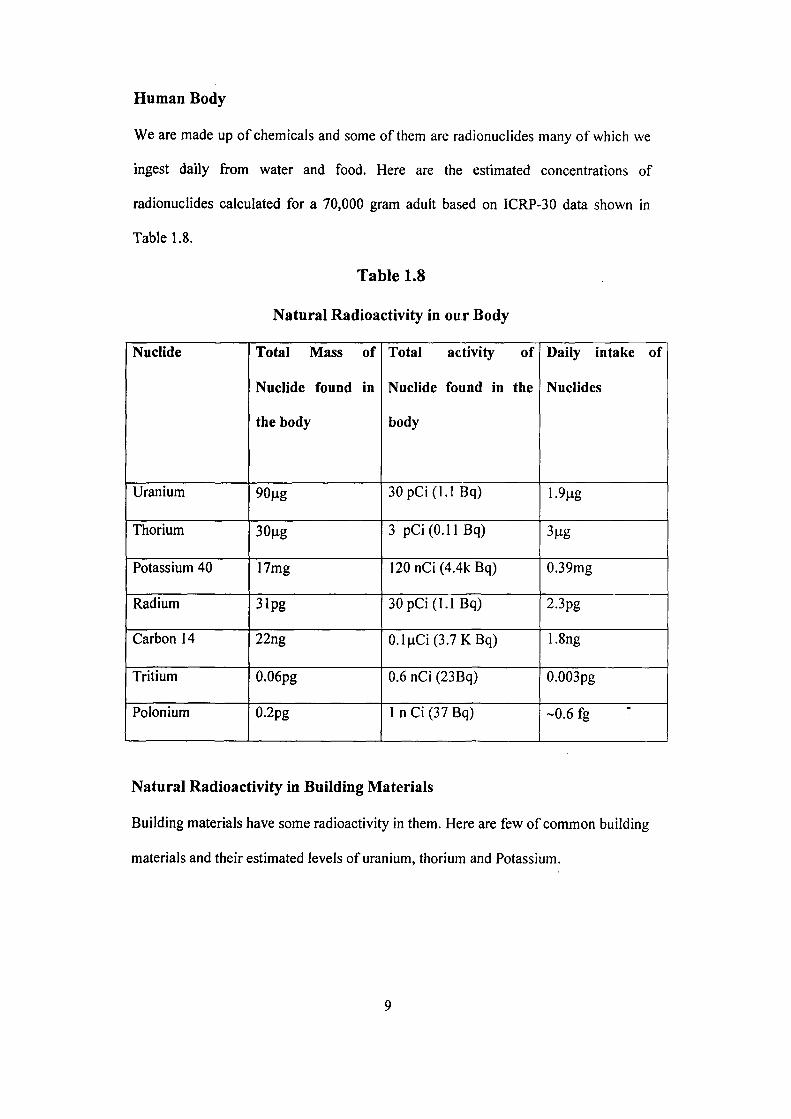
Human Body
We are made up of chemicals and some of them are radionuclides many of which we
ingest daily from water and food. Here are the estimated concentrations of
radionuclides calculated for a 70,000 gram adult based on ICRP-30 data shown in
Table 1.8.
Table 1.8
Natural Radioactivity in our Body
Nuclide
Uranium
Thorium
Potassium 40
Radium
Carbon 14
Tritium
Polonium
Total Mass of
Nuclide found in
the body
90iig
30ng
17mg
31pg
22ng
0.06pg
0.2pg
Total activity of
Nuclide found in the
body
30pCi(l.l Bq)
3 pCi(O.llBq)
120 nCi (4.4k Bq)
30pCi(I.lBq)
0.1^Ci(3.7KBq)
0.6 nCi (23Bq)
1 n Ci (37 Bq)
Daily intake of
Nuclides
\.%g
3^g
0.39mg
2.3pg
1.8ng
0.003pg
-0.6 fg
Natural Radioactivity in Building Materials
Building materials have some radioactivity in them. Here are few of common building
materials and their estimated levels of uranium, thorium and Potassium.
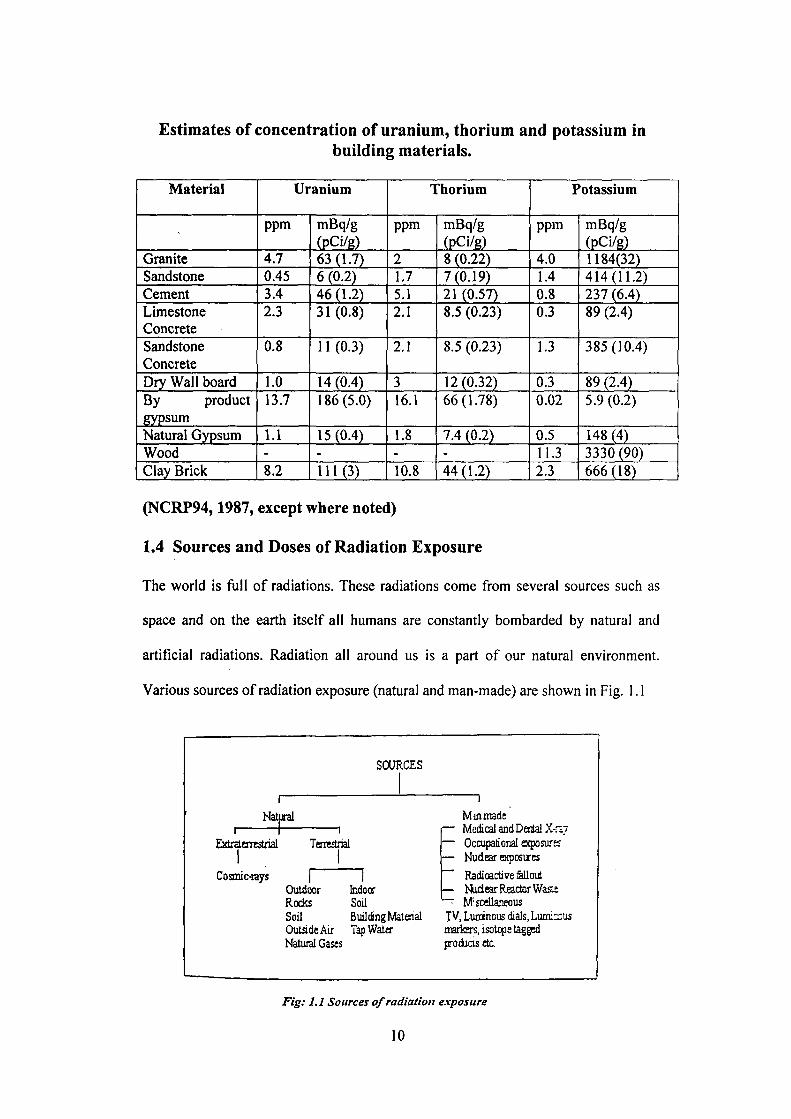
Estimates of concentration of uranium, thorium and potassium in building materials.
Material
Granite Sandstone Cement Limestone Concrete Sandstone Concrete Dry Wall board By product gypsum Natural Gypsum Wood Clay Brick
Uranium
ppm
4.7 0.45 3.4 2.3
0.8
1.0 13.7
1.1 -
8.2
mBq/g (pCi/g) 63(1.7) 6 (0.2) 46(1.2) 31 (0.8)
11 (0.3)
14(0.4) 186(5.0)
15(0.4) -
111(3)
Thorium
ppm
2 1.7 5.1 2.1
2.1
3 16.1
1.8 -
10.8
mBq/g (pCi/g) 8 (0.22) 7(0.19) 21 (0.57) 8.5 (0.23)
8.5 (0.23)
12(0.32) 66(1.78)
7.4 (0.2) -
44(1.2)
Potassium
ppm
4.0 1.4 0.8 0.3
1.3
0.3 0.02
0.5 11.3 2.3
mBq/g (pCi/g) 1184(32) 414(11.2) 237 (6.4) 89 (2.4)
385(10.4)
89 (2.4) 5.9 (0.2)
148 (4) 3330 (90) 666(18)
(NCRP94,1987, except where noted)
1.4 Sources and Doses of Radiation Exposure
The world is full of radiations. These radiations come from several sources such as
space and on the earth itself all humans are constantly bombarded by natural and
artificial radiations. Radiation all around us is a part of our natural environment.
Various sources of radiation exposure (natural and man-made) are shown in Fig. 1.1
SOURCES
Natural
Extrslerrestrial 1
TeiTKtrial
Cosmic-iays Outdoor Indoor Rodcs Soil Soil Building Material Outside Air TapWata-hfatuial Gases
Man made • Medical andDentalX-nj
— Occupational exposures Nudear exposures
Radioactive &llout — Nudear Reactor Wass ~ M'scellaneous TV, Luminous dials, Lumirrius markrs, isotope tagged products etc.
Fig: 1.1 Sources of radiation exposure
10

These radiations include cosmic rays which include high energy electrons and protons
that come from the outer space and become more intense at higher altitudes, alpha
particles emitted from radioactive isotopes, uranium and thorium and beta particles
emitted from potassium 40. These radioactive materials also emit gamma radiations.
Uranium and thorium present in the rock and soil decay to form the radioactive gas
radon and thoron. Radon along with its progeny leak into the atmosphere, where
people inhale and get their lungs irradiated. Natural radiation is of particular
importance because it is the largest contributor to the collective dose of world
population (NCRP, 1987). Worldwide average annual effective dose from cosmic rays
is 0.38 mSv (UNSCEAR, 1993; 2000). In general the range of individual annual
effective dose from cosmic rays is 0.26 to 2 mSv .
Artificial sources of radiation include discharges from nuclear and thermal
power plants and contaminated articles from radiotherapy and other departments in
hospitals. The radiation exposure to a nuclear worker can either be external or internal
and is mainly due to beta and gamma rays. External exposure is caused due to
radioactive sources external to the body whereas internal exposure is caused due to
radioactive materials entering the human body through food, inhalation, ingestion and
injection. The world-wide average dose received by a person is 2.2 mSv/y. the
international standards allow up to 20 mSv a year exposure for those who work with
an around radioactive materials. Global averaged exposures for radiation in different
fields are in the range of 2 to 8 mSv/y (NCRP, 1987).
The contribution of various natural sources of radiation to the average annual
effective dose is shown in Fig 1.2. The rate at which doses from cosmic rays are
delivered is fairly constant at any one point on the earth's surface but vary with
latitude and, to a greater extent, with altitude. Consequently, people living in towns
11

with higher latitude above sea level are exposed to greater cosmic radiation. It is well
known that primary cosmic rays are substantially affected by the earth's magnetic
field which deflects the lower energy radiation back into space. As a result of this
process, the flux of cosmic rays is greater at the north and south poles than it is at the
equator. Typical values at sea level in temperate latitudes are of order of 0.30 mSv/y.
As the latitude increases, dose rates approximately double every 1,500 meters up to
few kms above the earth. For example, Bombay ( at sea level) measures a total of
0.484 mSv/y of radiation under natural background condition of which 0.28 mSv/y
comes from cosmic sources (Nambi and Soman, 1987).
Contribution of various natural sources of radiation to tiie average annual effective dose
2.5
2
1.5
1
0.5
2A.
Ui-S 1.2
0.5 JIA.
m
-&:3r SLA.
m 0.005 0.002 0.002
m u. 3 CO
z
•a c = 3 (0 o _-
a ^^ JQ
2: ro to (0 P E
E w <0
c .2 «
c
o "C 0) >- —.
J - CO O) a .2 •-o ^ "
pis
._(
2 Q- o
Fig-1.2 Contribution of various natural sources of radiation to tlie average annual effective dose
12

1.5 Genesis of Radon
The history of the discovery of radon is as old as the history of the discovery of
radioactivity in 1896. Radon was discovered in 1900 by Friedrich Ernst Dorn. It was
originally named as niton, from the Latin word "nitens". The nit comes from the
Latin, meaning shining or the property of emitting light. The suffix on, was used to
place it in the noble gas series of the periodic table. In 1921 M. Uhlig suggested that
radium emanation might be the cause of lung cancers (Uhlig, 1921). In 1925 the name
radon began appearing in the literature.
1.6 Physical and chemical properties of radon
Radon is a colourless, odourless, chemically inert radioactive gas. It is about 7.5 times
heavier than air and about 100 times heavier than hydrogen. Its atomic number is 86
000 00(^ 01Q
and it has three isotopes, namely Rn (radon), Rn (thoron) and Rn
(actinon). The sources of these radioactive gases are the radioactive elements, i.e.,
uranium and thorium present in the earth's crust. ^ Rn occurs as immediate decay oofi 01ft oon
product of Ra (Radium) in the decay series of -""U (Uranium). ""Rn occurs as OO^ O^O OIQ
immediate decay product of Ra in the decay series of ' Th (Thorium) while "^Rn
occurs as immediate decay product of ^ Th in the decay series of ^ U (uranium). As
these radioactive elements are present in varying amounts in earth's curst almost at
every place, these gases are also present in the atmosphere in varying amounts at all
places. The three decay series are shown in Figs. 1.3, 1.4 & 1.5. ^ Rn has half-life of
3.824 days while ^ °Rn has a half-life of 55 s and ' Rn has very short half-life of 3.9
s. The difference in the half-lives of radon (3.824 days) and thoron (55s) is important
for the release of these gases from ground and distribution in atmosphere.
13

Concentration of ' Rn is not significant in atmosphere due to its short half-life and
due to small abundance of •' U in natural uranium.
Radon daughters products are divided into two groups based on their half-lives: those
with half-lives below 30 min. are termed as short-lived and others as long-lived. The
short-lived radon daughters are: '*Po (RaA; 3.05 min.), "*Pb (RaB; 26.8 min.), "*Bi
(RaC; 19.7 min.) and '"Po (RaC; 164 ^s), while the long-lived daughters are: '°Pb
(RaD; 22.3 years), ' Bi (RaE; 5.1 Days) and 2 ' % (RaF; 138.4 days). There is no
long-lived group for thoron daughters.
14

'Occ
•A >-^ro • h.'
M 0^
^•o
poo
> 0
^ « ^
0\
>o'
a \
a.r.
C.\
4 d->
4 d->
"** r<
(-10 ; N
fSvO 0 « <;fs
- c o\ :^ 0\ oc
n'O
CO 00
> 0
^ b ^ ^
>n'
0N„
1 0\
h
> 0
'^6-4 00
o
^ \o '0 00 00 00
CQ.\
1/1
On C H O O
-
^ oc
> 0
-^ "<
ffl(N'
^U
c i \
> 0
0 0 ^ ^
0 ^ (NOO
h f'
ca\
> Q
^ 6 - > 00
h''
-" P
1 .
n (N -00 00 00
2 1 s-1 00 s i 2
b

w
^O
CUO n
!> 0
•00
00
d->
cx\
-^w ^3 or: fSffl ^ ^ S^h
w
(N P ?—1 " ^
1
•::0 CQ\o
a \
> 0
IT) 0 - > OO O
OO f-
"^-^
pf^
c i \
•
1 / ^
> 0
2
in
> 0
^ « -> 00
in
^ fi
1 j - tn
> 4)
^ b-> 00
vO w ' - '00 f S m
0 ^ 0(0
> 0
^ d- 00
(N^
NS S2
C l \
00 ^
U .
I I en
o
fa
VO
CIV.
>'
N2
1 >/ f- X
Co r—4
> 0
^ d-> 0\
ri
1
a^ £VO)
o 0\
OS 00
00 00
r-X
vC CO
in 00
^ 00
m 00
M 00 00

-HP ^ "
CQM'
> 0
o (NOO
hrt
r-'O > 0
^tf-> 0\ tn
m'O > 0
^ b - > >-4
^
*o
i'« ^ s i c2n
> 0
^ 6- i>-<
M
\o
w
lib
—
a\
> 0
^ b - > 00
^
1
; : ;>•
a-fi
a\
-> «-^
^ >
1 • 0--<(N
(« V
CI]
u •o
I
E 3
bX)
C l \
"» Z'
"•iK
' r^
-> S-> ;3^«c
1 r-l/"!
h ^
M 0
— c
c ON
ON OC
OO 00
ro 00
•^
00 •n 00
'cr 00
n 00
(N 00 00
1.7 Radon in Homes
The concentration of radon in a home depends on the amount of radon producing
uranium in the underlying rocks and soils, the routes available for its passage into the
home and the rate of exchange between indoor and outdoor air. Radon gas enters
houses through openings such as cracks at concrete floor-wall functions, gaps in the
floor, small pores in hollow-block walls, and through sumps and drains.
Consequently, radon levels are usually higher in basements, cellars or other structural
areas in contact with soil.
Exchange of indoor air with the outside depends on the construction of the house,
ventilation, habits of the inhabitants and sealing of windows. The radon concentration
in houses directly adjacent to each other can be very different. Radon concentrations
within a home can vary with the time of the year, from day to day and from hour to
hour. Because of these fluctuations, estimation of the annuals mean concentration of
radon in indoor air requires reliable measurements of mean radon concentration for at
least three month and preferably longer. Short term radon measurements give only
limited information.
1.8 Dealing with Radon in Homes
Radon levels in indoor air can be lowered in a number of ways, from sealing cracks in
floors and walls to increasing the ventilation rate of the building. The five principal
ways of reducing the amount of radon accumulating in a house are:
• Improving the ventilation of the house and avoiding the transport of radon
from the basement into living rooms.
• Increasing under-floor ventilation.
• Installing a radon Pump system in the basement.
• Sealing floors and walls and
18

• Installing a positive pressurization or positive supply ventilation system.
Radon safety should be considered when new houses are built, particularly in high
radon area. In Europe and the United States, the inclusion of protective measures in
new buildings has become routine for some builders and in some countries has
become a mandatory procedure. Passive systems of mitigation have been shown to be
capable of reducing indoor radon levels by upto 50%, when radon ventilation fans are
added (active system) radon levels can be reduced further.
1.9 Radon generation and release to atmosphere
Radon and isotopes are produced in mineral grains containing radium present due to
uranium or thorium. Within a rock, different minerals contain radioactive elements in
varying concentrations. Once the radon is produced in a mineral grain, only a fraction
of it is able to escape from where it is generated. The fraction of radon generated in
grain that is able to escape to pore spaces is called emanation coefficient. The
emanation process involves the recoil effect of emitted alpha particle during the decay
of ^ ^Ra. The emitted alpha particle can give sufficient recoil energy to ^ Rn nucleus
so that it can leave the grain and enter interstitial space if the radium atom is
sufficiently near the surface of the grain and recoil properly directed (Kigoshi, 1971).
If the interstitial space is filled with water, the recoiling ^ Rn atom will be stopped in
pore space. If the interstitial space is dry, then the recoiling atom may get embedded
in another grain close to the surface. In doing so, the recoiling atom produces a
damaged region in mineral called an alpha recoil track, which in some materials is
preferentially soluble (Huang and Walker, 1967).
Later presence of water may dissolve the damage track and release the radon.
This is the second way in which the radon can be released form the rock. The two
radon release mechanisms are shown in Fig. 1.6. Thus the water is very important for
19

the release of radon from the ground. The radon so trapped in pore spaces gets
transported with groundwater movement. If the water is present as a thin layer (less
than 2 cm), radon can escape to dry pore spaces and subsequently to atmosphere. It is
worth mentioning here that radon can move a distance of only 1.5 m in
dry pore spaces before it decays (Fleischer and Mogro-Campero, 1978). So the soil
within a few meters beneath the house can contribute to the indoor radon in general.
For radon to enter the atmosphere, it must be transported through the pores of
material so that a fraction of it reaches the surface before it decays. There are two
processes of radon transport to air: diffusion and convective flow. Diffusion, flow of
gas under the concentration gradient, is described by Pick's law. If C is the
concentration of radon in interstitial space, D is the diffusion coefficient, the flux Qd
in the x direction is given by
Qd = -D dC/dx
Convective flow induced by pressure differences can be characterized by
Dacy's law which relates the flow rate per unit cross-sectional area Vj to the gradient
of pressure P: Vj = -K dp/|xdx, where K is the permeability of the medium and \i is the
dynamic viscosity of the air. If the flux density is Qf=Vd. C, then the total radon flux
In the material is Q = D dC/dx+ Vd.C The amount of activity released per unit surface
area per unit time is called exhalation rate.
20

RECOIL INTO WATER
Rn RECOIL STOPPED IN PORES
ETCHjNGOF TRACKS
LATER;LOOSENED BY WATER
Figl.6 Mechanisms of radon release from the mineral grains
21

1.10 Factors affecting indoor radon concentration levels
The major factors which influence the indoor levels of radon and radon progeny to
which occupants are exposed are the source strength of radon bearing materials (soil,
building materials and water), structural characteristics of the home which effect
radon entry and removal and meteorological conditions. Radon is released from the
soil, rock and building materials into the environment through the mechanism of
diffusion and transport that is affected by several factors (King, 1978; Strong and
Levins, 1982; Stranden et al., 1984; Singh et al., 1988). The local geological factors
if not dominant play a major role in determining the distribution of indoor radon
concentrations in a given area (Hess et al.,1985). The infiltration of soil gas through
cracks and holes in the foundation is also the largest contributor to indoor radon
concentration levels.
1.10.1 Source Strength
The most important factor that influences the radon concentration is the source
strength which ultimately depends upon the ^ Ra content in the soil beneath the
houses, the building materials used for construction of houses and the associated
water supply.
1.10.2 Structural Characteristics
From the various structural characteristics, the factors that affect the indoor radon
concentration are:
(a) Air Exchange Rates
The air exchange rates depend upon the following mechanisms:
1. Infiltration: Air leakage inward through cracks and interstices and through
ceiling, floors and walls of a building. Air movement occurs due to pressure
differences.
22
2. Natural ventilation: The movement of air into and out of a space through
intentionally provided openings such as windows and doors or by infiltration.
3. Mechanical ventilation: Forced movement of air between the indoor and
outdoors produced by fans.
A variety of factors such as shape and height of the buildings, the air tightness, the
location of doors and windows, the climate and the life style of occupants etc. also
influences the air exchange rate.
(b) Substructure Configuration
The critical factor influencing radon entry rate in the dwellings is through the building
substructure. Several studies which have analyzed the contribution of various sources
of indoor radon levels have concluded that the direct infiltration of soil gas into a
house is generally the largest contributor to indoor radon levels. It follows that
variability in soil gas transport through cracks and other penetration in the foundation
are likely to be the major cause of the distribution of residential indoor radon levels in
any given region. The cracks in the basement slabs are the most common sources of
radon diffusion into the houses, the joint between the wall and the floor is the next
common pathway for entry of radon.
(c) Building Type and Design
In addition to ventilation and substructure characteristics, the building design may
impact the indoor radon concentration. Earth sheltered dwellings provide more
surface area for diffusion of radon bearing soil gas and frequently larger than average
radon concentration.
1.10.3 Meteorological and environmental Conditions
Moisture, temperature, wind speed and atmospheric pressure all of which affect radon
exhalation rates and infiltration, appear to be of major importance.
23

(a) Moisture
A radon atom produced after alpha decay of radium has significant recoil energy and
can come to stop in the fluid in the pore spaces and can then move through the porous
medium by various mechanisms. The low emanation ratios of some building
materials, such as brick, cement and fly ash may be associated with the fact that they
have very low moisture contents, affording little opportunity for recoiling radon atoms
to come to stop in pore spaces (Nero and Nazaroff, 1984). There seem to be three
major effects of moisture causing an increase in radon exhalation:
1. The direct recoil fraction of the emanation power is increased when there is a
fluid present in the internal pores of the material.
2. The fluid may hinder absorption of radon gas in internal surfaces of the
material.
3. If there is a moisture content gradient in the sample, active transport of radon
on water molecules may take place.
Up to a certain level of moisture in the material, the effects which increase radon
exhalation are dominating, however, after optimum moisture content, the reduced
diffusion due to water will dominate strongly. If the porosity of the samples is high,
more water will be taken up by the sample before the pores are filled, and the
maximum radon exhalation will occur at higher moisture content than for low
porosity materials (Stranden et al. 1984).
(b) Pressure
Flow of radon bearing air through soil and building materials is an important
mechanism for radon entry. The radon exhalation will vary with the atmospheric
pressure. A sudden drop in pressure will cause an increase in radon exhalation due to
sucking effect of the falling pressure. It has been observed that radon concentration at
24 , ^ ^ ^ *

moderate depths are depleted during periods of high wind speed (Kraner et al., 1964;
Israelsson, 1980) and it has been suggested that this is due to the turbulent pumping
i.e. local pressure changes in the vicinity of the soil surface. Clements and Wilkening
(1974) found good agreement between a theoretical model, which combined flow and
diffusion effects during barometric pressure changes, and experimental results.
(c) Temperature
Radon exhalation is seen to increase with temperature, though the effect is smaller
than the effect of moisture (Stranden et al. 1984). Ghosh (1975) has studied the effect
of temperature on powdered ore. It is observed that when the sample is subjected to
mild heating (100-200 "C), almost all the adsorbed emanation is released from the
grains. Further heating does not change the situation till about 800-1200 °C when a
phase change takes place and the trapped radon or thoron from the core of mineral
grain is released.
1.11 The Need for Radon Measurements
The problem of radon is an important global problem of radiation hygine concerning
the world population. Radon is present in trace amounts almost everywhere (Indoor
and outdoor) on the earth, being distributed in the soil, in the ground water and in the
lower atmosphere. Radioactive radon can migrate from soils and rocks and
accumulate in surrounding enclosed areas such as homes and underground mines.
Measurement of radon, thoron and their progeny is important because the radiation
dose to human population due to inhalation of radon and its progeny contribute more
than 50% of the dose from all sources of radiation, both naturally occurring and man
made (UNSCEAR,2000). A relationship between lung cancer and inhalation of radon
and its decay products has been demonstrated (Lubin and Boice, 1997). Recent
epidemiological evidence suggests that inhalation of radon and its decay products in
25

domestic environments could also be a cause of lung cancer ( ICRP, 1993; BEIR,
1999).
Measurements of indoor radon are important because the radiation dose to
human population due to inhalation of radon and its progeny contribute more than
50% of the total dose from natural sources. Hultqvist (1956) carried out the first
measurement of indoor radon in Sweden. Systematic surveys of indoor radon started
in many countries soon after the incidental discovery. Ramachandran et al. (1986)
started indoor radon level measurements in dwellings in India and since then selective
radon surveys have been in progress by our group(Khan et al, 1992; Kumar et al,
2003; Mahur et al 2005,2008) and other various groups (Ramola et al., 1987; 1998;
1992; Ramachandran et al., 1987; Sonkawade et al., 2002; 2004). The prevailing
indoor radon levels in India reported by various radon measurement groups range
from 1.5 to 2000 Bq m"', while the level to be considered normal is in the range
of 10 to 60 Bq m''' (lARP, 1994). A large number of radon surveys have also been
carried out abroad (Porstendorfer et al., 1994; Alvanja et al., 1999). Worldwide
population weighted arithmetic mean value of radon concentration has been estimated
to be 40 Bq m" (UNSCEAR, 1994).
A large number of indoor radon surveys carried out in India and abroad reveal
that there is a large variation in radon levels (few Bq m" to, 1,00,000 Bq m' ). The
recommendations of various national and international organizations for radon levels
in indoor air are given in Tablel.9. Dose from inhalation of radon in dwellings is
more than that from all other natural radiation sources (UNSCEAR, 1993). The
estimated level of health risk associated with average indoor radon level is much
higher than those due to other environmental carcinogen (Nazaroff and Nero, 1988).
26 t ^^

In this light, tracking indoor radon concentration is of fundamental interest from
health and hygiene point of view.
Table 1.9
International and National recommendations for indoor radon levels
Recommended Rnduu Level (Bq m*) Reference
150
400 (for existing houses.)
200 (for future)
250
200
200-600 (for dwellings)
500-1500 (for work places)
(USEPA, 1986)
(ICRP, 1984)
(FRG, 1988)
(NRPB. 1990)
(ICRP. 1993)*
(ICRP, 1993)*
* The recommendations of ICRP, 1993 are QIHO being followed in India
1.12 Track Formation Mechanism
When a heavily ionizing nuclear charged particle passes through an insulating solid,
the physical, chemical and other properties of the solid along and around the path of
the particle change and a narrow path of intense damage is created. This narrow path
is called latent track and the track recording materials are known as solid state nuclear
track detectors. Various authors have suggested to relate the track formation with
different parameters, such as total rate of energy loss, primary ionization, restricted
energy loss etc. Experimentally set up track formation criterion is that there exists a
certain value of energy loss rate (known as critical value of energy loss rate below
which the tracks are not formed in solids. The critical energy loss rate is generally
27

denoted by Jc = (dE/dx)c, the values of which is different for different solids but same
in a given solid for all the particles (Fig. 1.7). It can also be seen from Fig. 1.7 that a
particle may not be able to produce track if either energy is too low or too high.
However, if the value of J is less than Jc for a given solid, the tracks will not be
formed in the solid at any energy of the traversing particle.
The charged particle latent tracks are narrow (< 50A° radius), stable, chemically
reactive centres of strain, composed mainly of displaced atoms rather than electrons
(Maurette, 1970; Fleischer et al., 1975). On the basis of experimental tests conducted
(a) on the measurement of effects of electron irradiation on chemical dissolution rates
of solids, and (b) on the measurement of radial distribution of etchable damage in
solids; It has been concluded that two separate mechanisms of track formation exists,
one for the inorganic solids and glasses and other for organic solids or polymers
(plastics).
28

ENERGY/ NUCLEON (MeV)
0.5 2 5 10 20
0.\ 0.2 0.3 C- 0.5 0.5
VELOCITY, ^--v/c
0.7 0.3 G:
Fig.1.7 Curves of primary ionization rate J as a function of relative velocity (P)
and energy per nucleon for a number of ions. The experimental points
for accelerator ions in lexan polycarbonate are given as open circles for
zero registration and as filled circles for 100% registration. Thresholds
for other detectors are also indicated.
29

In case of inorganic solids and glasses, the ion explosion spike model proposed by
Fleischer et al. (1965) provides a considerably satisfactory explanation of track
formation mechanism. According to this model, a positively charged particle knocks
out the orbital electrons of the atoms lying in and around the vicinity of its path, thus
producing the cylindrical region full of positive ions. These positive ions there upon
repel one another violently, thus disturbing and distorting the regular lattice in a
crystalline solid (Fig. 1.8) and producing a more or less cylindrical region (Bonfiglioli
et al., 1961; Lindhard and Thomson, 1962; Chadderton and Montagu Pollock, 1963;
Benton, 1967; Fleischer et al., 1967). On the other hand, in case, of organic polymers
and plastics it is believed that both the primary and secondary ionization and
excitation play a role in the production of etchable tracks in the organic polymers
(Fleischer et al., 1967). The charged particle leads to the breaking up of long
molecular chains of the polymers. These broken molecular chains rarely unite at the
same place, instead they produce broken bonds and free radicals etc. which are
chemically more reactive (Fig. 1.9). These latent damage trails can be developed by
using the appropriate etchant to visualize them under the optical microscope. It is
explained as follows:
As the damage trails are chemically more reactive regions (compared to the
undamaged area), on etching the sample in appropriate etchant, all those trails which
intersect the surface are rapidly dissolved and hollow
30

a IONIZATION
^ J^ ELECTROSTATIC
DISPLACEMENT Q O , ®
o o o o to o\ o
o o o o o o o
fJl? f i ? s P p p
4 * *
0
o
/" RELAXATION O AND • -^ o ELASTIC STRAIN
o 0 ^ i r
Fig.1.8 The ion explosion spike mechanism for track formation in inorganic
solids.
a. The atoms ionized by the massive charged particle.
b. The mutual repulsion of ions separated and forced them into the lattice.
c. Stressed region relaxes elastically straining the undamaged matrix.
31

/
Fig.1.9 Track formation in organic polymers (Plastics). The charged particle
ionizes and excites the molecules, breaking the polymer chains. The
chain ends rarely reunite in the same place, but usually react with
oxygen or other dissolved gases in the polymer forming new species
along the particle's trajectory (shown by black dots) that are chemically
reactive.
32

cylindrical tubes of about SOA" diameter are left behind. The undamaged well of
hollow tube is attacked and its diameter increases into micron range, thus ultimately, a
modified enlarged version of the original damage trail is produced which can be seen
easily under an optical microscope.
The Radiation damage trails are more susceptible to chemical reaction as compared to
other bulk materials because of the large free energy associated with the disordered
structure. The technique of enlarging the latent trails of radiation damage with
suitable chemical agent is called chemical etching. The shape of the etched track in
certain materials depends not only on the charge, mass and velocity of the incoming
particle and on the nature, concentration and temperature of the etchant but also on
the environmental conditions at the time of irradiations and pre-etching treatments.
The shape of the track also depends on the ratio of chemical attack along the track VT,
to the rate of chemical attack for the bulk material VB. This process of track revelation
involves the concept of critical angle 9 = Sin'' (VBA^T)- If the angle of incidence of
the charged particles with respect to the surface of the detector is less than the critical
angle, the tracks of the incident particles can not be revealed (Fleischer et al., 1975).
As the etchant moves in the material along the damage trails at a faster rate, i.e. VT>
VB it produces a conical etch pit (Fig. 1.10).
33

ORIGINAL SURFACE I 2 I
ETCHED SURFACE V - /-'
Fig. 1.10 Track registration geometry
a. Shows the shape of etched track when VBA'T<1.
b. No track formation, as the surface is removed at a faster rate than the
normal component of VT.
c. Shows Sin"' (VBA^T), the critical angle 9c above which tracks are
registered.
34

The etching efficiency of the detection depends upon the critical angle and is given by
f) = 1-Sin ec
The etching efficiency depends upon the composition of the material, the nature of
the damage produced by the charged particle, etchant parameters and etching time.
1.13 Terminology
Radiation Terms and Units
Following are the terms and units generally used in the measurement of radiation and
its effects:
Activity
The activity of a radioactive sample is a measurement of the rate of decay of its
nuclei. The S.I. unit of activity is Bequerel (Bq). One Bq is equal to one
disintegration per second. The old unit of activity is curie (Ci). One Ci is
approximately equal to the activity of 1 gram of ^ ^Ra, which is equal to 3.7x10'°
disintegrations per second. Thus
ICi = 3.7x10'°Bq
Exhalation Rate
The rate at which radon is released from a solid surface into the adjacent air, in Bq m"'
s"'. It is function of the radon production rate and the diffusion coefficient of the solid.
"The emission of radon per unit area per unit time is called exhalation rate"
and depends upon:
1. Radium concentration in the material.
2. Emanation factor of radon from material.
3. Diffusion coefficient of radon in the material.
4. Porosity and density of the material.
35

Absorbed Dose
The absorbed dose 'D' is defined as the energy absorbed in matter per unit mass. The
old unit of absorbed does is rad and S.I unit is Gray (Gy) or i/kg.
If 100 ergs of radiation energy is deposited in one gram of irradiated matter, it
is called 1 rad. 1 Gray is defined as 1 Joule of radiation energy deposited in 1 kg of
irradiated matter.
l G y = l J k g - ' = 100 rad
Dose Equivalent
The dose equivalent is the product of absorbed dose, quality factor and factor N which
is product of all modifying factors. It is a measure of both, the energy absorbed by the
mass and radiobiological effectiveness (RBE).
The conventional unit of equivalent dose is rem and S.I. unit is sievert (Sv)
lSv=100rem= IJkg"'
And 1 rem= lOmSv
The absorbed dose multiplied by radiation weighting factor (Wr) is known as
equivalent dose (Hj)
H-r DxWr
Effective dose equivalent
It is calculated by multiplying the dose equivalent for an organ by a weighing factor,
which accounts for radio sensitivity of that organ. The total risk to an individual is
equal to sum of the effective dose equivalents for all organs of the body.
The equivalent dose multiplied by a tissue -weighting factor (WT) is called the
effective dose (E)
E = HT WT
36

If more than one tissue is exposed to radiation, the effective dose is the sum of the
weight equivalent doses in all the tissues.
i.e. E = SHTWT
Potential Alpha Energy (PAE)
The PAE is the total alpha energy emitted by an atom as it decays through its entire
radioactive series.
Potential Alpha Energy Concentration(PAEC)
The potential alpha energy concentration (PAEC) is defined as the sum of all the
potential alpha energy in unit volume of air. The S.I unit of PAEC is J m-3. The
widely used unit of PAEC is working level (WL).
Radiation Weighting Factor
The biological effect of radiation produced in the body not only depends on the
quantity of absorbed dose but also on type and energy of radiation. This is taken into
account by weighting the radiation absorbed dose by a factor called radiation
weighting factor (Wr). Earlier it was known as quality factor.
Tissue Weighting Factor
The probability of stochastic effect in a tissue depends on its sensitivity to radiation.
Some organs are more sensitive to radiation than others e.g. bone marrow is much
more sensitive than skin. This is taken into account by weighting the equivalent dose
by a factor called the tissue weighting factor (WT).
Equilibirium Factor
Equilibirium factor F, is defined as the ratio of the total potential alpha energy for a
given daughter concentration to the total potential alpha energy of the daughters if
they are in equilibirium with the given amount of radon concentration (CRn).
37

F = lOOxPAECrWU CRn (pCi/1)
orF = 3700xPAEC fWL)
CRn(Bqm"^)
Equilibirium Equivalent Concentration (EEC)
The Equilibirium equivalent concentration (EEC) is defined as the activity concentration of the parent gas in radioactive equilibirium with the concentration of
its short-lived progeny that has the same PAEC as the non- equilibirium mixture.
Working Level (WL)
A unit of radon decay product exposure rate WL is the combination of radon progeny
such that total potential alpha energy released on ultimate decay to '°Pb is 1.28x10^
MeVL'' (rounded to 1.3x10 ). for conversion purposes, 1WL= 1.3x10^ MeVL"'
=2.08x10"^ Jm'^
1 WL corresponds to an activity concentration of 3700 Bq m' of ^ ^Rn. Although WL
was originally defined only for progeny of ^ ^Rn, it can also be calculated for ^ "Rn
and ' Rn by letting IWL equal to 1.3x10 Me VL"' of air regard less of source 1 WL
corresponds to 275 Bq m' for ^ °Rn and 5960 Bq m' for ' Rn.
Working Level Month (WLM)
A unit of exposure corresponding to a concentration of radon decay products of 1 WL
for 170 working hours (1 work month). It is a measure of exposure rather than dose.
Working Level Ratio (WLR)
A ratio that compares the concentration of decay products to the concentration of
radon.
WLR = (WLvaluelxlOO Radon concentration
38

Radium Equivalent (Raeq)
The radium equivalent concept allows a single index or number to describe the
gamma output from different mixture of uranium (radium), thorium and '*°K in a
material. The radium equivalent in Bq/kg can be calculated as:
Raeq = Au + 1.43 Ajh + 0.07 AR
1.14 Harmful Effects of Radon
> Radon is the second leading cause of lung cancer and a serious public health
concern.
> The primary adverse health effect associated with chronic exposure to radon
is lung cancer (typically bronchogenic).
4- Squamous Cell Carcinoma
4- Small Cell Carcinoma
4- Adenocarcinoma
4i. Large Cell Carcinoma
> Other harmful respiratory effects associated with chronic exposure to radon
include.
"4- Emphysema
"t Pulmonary fibrosis
4- Chronic interstitial pneumonia
4- Silicosis
4 Respiratory lesions
> Radon also has the potential to generate genotoxic effects higher incidence of
chromosomal aberrations
> Radon has been linked with teratogenic effects.
39

> Radon and smoking display a synergistic (submultiplicative) effect, liowever,
the mechanism remains unclear.
> Increased levels of exposure to radon increase the probability of observing an
effect, however, increased levels of exposure do not necessarily influence the
type or severity of the effect.
> There is no zero-risk threshold for radon exposure, but instead, risk increases
proportionate to the exposure time.
> Radon exposure causes no acute or subacute health effects, no irritating
effects, and has no warning signs at levels normally encountered in the
environment.
> Epidemologic studies and a recent study of ground water radon and cancer
mortality have found no association with extrapulmonary cancers, such as
leukemias and gastrointestinal cancers.
> Experimental investigations using animals, miners, and molecular and cellular
studies provide supporting evidence and some understanding of the
mechanism by which radon (i.e. alpha radiation) causes lung cancer. These
types of studies are not direct investigations concerning the effects of radon
and may have confounding variables that need attention.
1.15 WHO (Doing About Radon)
Recent studies of people exposed to radon have confirmed that radon in homes is a
serious health hazard that can be easily mitigated. As a result WHO has established
the international radon project in which over 20 countries have formed a network of
partners to identify and promote programmes that reduce the health impact of radon.
The first meeting of the project was held in Geneva. In January 2005 to develop a
40

strategy for dealing with this important health issue. The key objectives of the project
are to:
> Identify effective strategies for reducing the health impact of radon.
> Promote sound policy options, prevention and mitigation programmes to
national authorities.
> Raise public and political awareness about the consequences of exposure to
radon.
> Raise the awareness of financial institutions supplying home mortgages to the
potential impact of elevated radon levels on property values.
> Monitor and periodically review mitigation measures to ensure their
effectiveness.
> Estimate the global health impact of exposure to residential radon and so allow
resources to be allocated effectively to mitigate the health impact of radon.
> Create a global database (including maps) of residential radon exposure.
The international radon project will be issuing detailed recommendations on radon
risk reduction that will target:
> The installation of mitigation devices at th?.t time of construction versus
retrofitting.
> The incorporation of radon prevention and control measures and national
building codes.
> Radon testing, mitigation and inspection of existing passive/active systems at
the time of sale for existing homes.
> Control measures designed for medium and low radon exposure levels which
contribute most to the overall radon lung cancer burden.
41

> The role of tobacco smoking in radon risk reduction programmes witii a view
to the overall goal of healthy indoor air.
> The use of both voluntary guidelines and enforceable regulations and
> Financial support mechanism to assist radon mitigation actions in cases where
such support is necessary to allow implementation of effective protection from
radon health hazards.
The international radon project will provide sound science based information on
radon control measures and investigate the cost- effectiveness of alternative
approaches. The project will also provide a worldwide estimate of the number of lung
cancers attributable to radon exposure than can be used to highlight the global scope
of the problem. This estimate will also allow assessment of progress made through
future prevention and mitigation programmes.
1.16 Aim of Present Investigation
The aim of present investigation is to carry out the study of radon and its progeny in
relation to their applications in radiation protection. The radon exhalation rates from
the commonly used building construction materials have been measured to assess the
radiation risk to the inhabitants..
The thesis contains the results of the study carried out to measure the indoor
radon/thoron and their progeny levels in dwellings and radon exhalation rates from
different materials used for building construction and assessment of effective dose
equivalents. The analyses of radioactivity has also been carried out in the form of ^ U,
Th and ^"K activity concentration measured by a low level gamma ray spectrometer
using HPGe detector. Radium equivalent activity, absorbed gamma dose rate, annual
effective doses, external hazard index and internal hazard index have been computed from
the radioactivity data.
42

REFERENCES
Alvanja, M.C., Lubin, J.H. and MahafFey, J.A., (1999). Am. J. pub. Health, 89, 1042.
BEIR (1999). Report of the committee on the Biological effects of Ionizing radiation,
Nutl. Res. Council. Natl. Acad. Press, Washington, DC.
Benton E V. USNRDL-TR-67-80,U.S. Naval Rad.Def Lab.San Francisco, California,
U.S.A. 1967.
Chadderton L T, Montagu Pollock H M. Proc. Roy. Soc. A 274, 1963; 239.
Clements W E, Wilkening M H. Atmospheric pressure effects on ^ ^ Rn transport
across the earth air interface. J. Geophys. Res. 1974; 79: 5025.
Cothern, C. Richard; Jr. James E. smit; 1987. "Environmental Radon" Volume 35,
Plenum Press- New York and Landon.
Durrani, A. Saeed., Ilic, Radomir; World Scientific Radon Measurement by Etched
Track Detectors Application in Radiation Research Earth Sciences and the
Environment.
Eisenbud, Merril; Gesell, Torn. Environmental Radioactivity from Natural, Industrial
and Military sources 4* edition, Academic Press, Inc.
Fleischer R L, Price P B, Walker R M, Hubbard E L. Criterion for registration in
dielectric track detectors. Phys. Rev. 1967; 156:353.
Fleischer R L, Price P B, Walker R M. Nuclear tracks in solids, principles and
Applications. University of California press, Berkeley, USA, 1975.
Fleischer R L, Price P B, Walker R M. The ion explosion spike mechanisms for
formation of charged particle tracks in solids. J. Appl. Phys. 1965; 36: 3645.
Fleischer R.L and Mogro-Campero A. (1978). Mapping of integrated radon
emanation for detection of long distance migration of gases within the earth:
thecniques and principles. J. J. Geophys. Res; 83, 3539-3549.
43

Ghosh P C. Escape of radon and thoron from radioactive minerals on mild heating .
Ind . J. Pure and Appl. Phys. 1975; 13(10): 713.
Handbook of radiation measurement and protection, Brodsky, A. CRC Press 1978 and
Environmental Radioactivity from Natural, industrial and military sources,
Elsenbud, M and Gesell T. academic Press, Inc. 1997.
Hess C T, Michel J, Horton T R, Pirchard H M, Coniglio W A. The occurrence of
radioactivity in public water supplies in the United States. Health Phys. 1985;
48(5).
Huang W. H. and Walker (1967). Fossil alpha particle tracks: a new method of age
determination, science, 155, 1103-1106.
Hultqvist, B., (1956). Kungl. Sevenska Vetenkapaska derniens Handlinger. Fjarde
Serien. Band G.Nr. 3.
IAEA, Bullentin of international Atomic Energy Agency, (1988)., 88-3069.
IAEA/PI/A114E.
lARP, Indian Association for Radiation Protection, (1994). lARP Report. Vol. 17, No.
3 and 4, Bombay.
ICRP, International Commission on Radiological Protection (1993). ICRP Publication
65, Annals of the ICRP 23 (2). Pergamon Press, Oxford.
ICRP, International Commission on Radiological Protection. (2000). ICRP
Publication No. 85, Annals of the ICRP, Pergamon Press, New York.
Israelsson S. Meteorological influences on atmospheric radioactivity and its effects on
the electrical environment. In: The natural Radiation Environment III (Ed. By T
F Gesell, W M Lowder). Technical inf Center, United States Department of
Energy, Washington DC. CONF- 780 422, 1980; 210.
44

Kant, K., Chauhan, R.P., Sharma, G.S. et al., (2001). Ind. J. Pure & Appl. Phys. 39,
679.
Kathren, Ron; (May 1991). Radioactivity in the Marine Environments, Radioactivity
in the Environmental, Taylor & Francis Pub., National Academic of Sciences.
Khan, A.J., Prasad, R; and Tyagi, R.K., (1992). Nucl. Tracks Radiat. Meas. 20, 609-
610.
Kigoshi K.(1971). Alpha recoil ^'^^ Th dissolution into water and the ^^'^\}F^\]
disequilibrium in nature; science, 174, 47-48.
King C Y. Radon emanation on san Andreas fault. Nature 1978; 271: 515.
Kraner H W, Sebroeder G L, Evans R D. Measurements of the effects of atmospheric
variables on 222m flux and soil- gas concentrations. In: the natural Radiation
Environment, University of Chicago Press, Chicago. 1964; 191. Lindhard J,
Thomson P U. IAEA, Vienna, 1962; 1:66.
Kumar, Rajesh; Mahur, A.K; Varshney, A.K.; Prasad, R., 2003, Concentration of
indoor radon and its daughters in dwellings of Palampur City, Indian J.
environmental protection. Vol. 23, No. 10.
Lubin, J.H. and Boice, Jr. J.D., (1997). J Nat can Inst. 89, 49-57.
Mahur, A.K; Kumar, Rajesh; Mishra, Meena; Sengupta, D; Prasad, Rajendra; 2008.
An investigation of radon exhalation rate and estimation of radiation doses in
Coal and fly ash samples. Applied radiation and isotope 66, 401 - 406.
Mahur, A.K; Kumar, Rajesh; Sengupta, D; Prasad , Rajendra; 2005. Estimation of
Uranium, Thorium, Potassium in fly ash samples and total gamma dose emitted
from the ash Pond. NUCAR.
Mahur, A.K; Kumar, Rajesh; Sengupta, D; Prasad, Rajendra; 2008. Estimation of
radon exhalation rate, natural radioactivity and radiation doses ion fly ash
45
samples from Durgapur Thermal Power Plant, West Bengal. India. Journal by
environmental radioactivity XXX, 1-5.
Maurette M. Rad. Eff. 1970; 3 : 149.
Narayanan, K.K., Krishna, D. and Subbarmu, M.C., (1991). ISRP (K)-BR-3, ISRP,
Kalpakkam Chapter.
Nazaroff, W.W. and Nero, A.V. Jr., Eds., (1988). John Wiley and Sons, Inc., New
York., P. 518.
NCRP, National Council on radiation Protection and Measurements, (1987). NCRP
Report No. 94, Bethesda, Maryland.
Nero A V, Nazaroff W W. Characterizing the sources of radon indoors. Radiat. Prot.
Dosim.1984; 7(1-4), 23.
Nambi, K.S.V. and Soman, S.O., (1987). Health Phys. 59, 339-344.
Porstendorfer, J., Butterweck, H. and Reineking A., (1994). Health Physics. 67, 283-
287.
Printable version fact sheet No. 291, June 2005. WHO> Programmes and Projects>
Media Centre> Fact Sheets.
Radiation information Network's Radioactivity in Nature, IdaHO State University.
Ramachandran, T,V. "Thoron ( °Rn) in the indoor Atmospheric Environment" 2006
Chemical & Environmental Research 15 (3&4).
Ramachandran, T.V. Lalit, B.Y. and Mishra, U.C, (1987). Nucl. Tracks and Rad.
Meas., 13,81-84.
Ramachandran, T.V., Lalit, B.Y. and Mishra, U.C, (1986). Nucl. Tracks and Rad.
Meas., 11,25-249.
Ramola, R.C., Choubey V.M. and Mukherjee P.K. (2003). Bulletin of Indian
Geologists Association 36, 39-45.
46

Ramola, R.C., Kandari., M.S. and Rawat, R.B.S., (1998). J. Environ. Radioactivity
39: 1-7.
Ramola, R.C., Singh, M., Singh, S., and Virk, H.S., (1992). J. Environ. Radioactivity.
Ramola, R.C; Singh, M., Singh, S., and Virk, H.S., (1987). Ind. J. Pure Appl. Phys.
25, 127-129.
Sankawade, R.G., Lochab, S.P. and Ramola, R.C, (2002) Indoor Build Environ- 11,
221-226.
Sharma, Navjeet Kumar; "A comparative study of Radon/Thoron levels in the
dwellings of Punjab and Himachal Pradesh", 2001.Ph.D thesis, Guru Nanak
Dev University Amritsar.
Singh S, Singh L, Singh J, Virk H S. Fission track dating of some copper ore
formations in India. Nucl. Tracks Radiat. Meas. 1988; 15(1-4): 715.
Sonkawade R.G., Rew a Ram, Kanjilal D, and Ramola R.C. (2004). Indoor Built,
Envi. 13,383-385.
Sonkawade R.G., Saini; S.K. and Gupta, K., (2005). Proceedings of International
Congress, Dec 4-7, Delhi. (In Press).
Straden E, Kolstad A K, Lind B. Radon exhalation: Moisture and temperature
dependence. Health Phys. 1984; 47(3): 480.
Strong K P, Levins D M. Effect of moisture contenton rado emanation from uranium
ore and Tailings. Health Phys. 1982; 42(1): 27.
UNSCEAR, United Nation Scientific Committee on the effects of Atomic Radiation
(1993). Exposures from Natural Sources of Radiation,, Annex. A/A/c; 82/R.526.
UNSCEAR, United Nation Scientific Committee on the Effects of Atomic Radiation
(2000). Exposures from Natural Sources, Annex. B.
47

c^v tef / /

Chapter-II
The Techniques, Materials and Instruments
2.1 Introduction
The Radon measurement techniques are based on the detection of emissions from
radioactive decay of radon and its daughter products. Most of the methods are based
on the detection of alpha particles, some on detection of beta emission while a few
utilize gamma decay. So, the detection of radon can be performed by detecting a p or
y radiations. A brief description of various techniques available and those used in the
present work is described in this chapter.
2.2 Radon Measurement Techniques
Because of its unique physical and nuclear properties, radon can easily be
measured by numerous techniques. The techniques of radon measurement may be
divided into two categories:
1. Instantaneous radon measurement techniques
2. Time integrated radon measurement techniques
2.2.1. Instantaneous Radon Measurement Techniques
(a) Ionization Chamber Technique
An ionization chamber is a gas filled electrode system which is designed to
detect the presence of an ionizing particle. When the ionizing particle passes through
the gas filled ionization chamber, the ionizing particle creates a track of pairs of
electron and positive ions. Under the influence of electric field, the electron and
positive ions are attracted in opposite directions. The chamber operates at a potential
of 100 to 300 volts, so that recombination and multiplication of electron and ion pair
is negligible. Ionization chamber technique needs a fairly high radon concentration
48

(more than 1000 pCi/1) in order to be effective (Pacer and Czamecki, 1980).
(b) Radon Emanometry
Emanometer was the earliest device to measure radon and is still widely used
for exploration (Alekseevs et al., 1959; Cheng and Porritt, 1981; Pacer and Czamecki,
1980; McCorkell and Card, 1978; Virk, 1990). In this technique, the soil gas is
pumped into a scintillation chamber which detects alpha particles emitted by the gas.
ZnS (Ag) is used as the scintillation material. The alpha particles emitted from the
decay of radon interact with the scintillator and create an energy pulse in the form of
light quanta. These photons are registered and amplified by photomultiplier tube until
it can be detected as a single pulse. Since a gross or total alpha measurement is made,
the growth and emission from the alpha emitting radon daughters need to be
considered in determining the radon concentration of sample. For soil gas
measurement, it is also necessary to account for thoron ( Rn), the radon isotope
from the thorium decay series.
(c) Grab Sampling Technique
In this technique, air sample of the radon is taken in a container for analysis
(Lucas, 1957; George, 1976). For radon decay products a sample is collected on a
filter for a sampling period of 2 to 10 minutes (Martz et a!., 1969; Rolie, 1972). The
filter paper sample is obtained by sucking the air through a 2.5 cm dia Millipore filter
type AA of 0.8 ^m pore size at the suction rate of 20 1pm for a period ranging from
half an hour to one hour. Due to the short half-lives of the radon decay products, the
analysis should be profiled strictly within one hour after sampling. The filter paper
sample is counted using a ZnS(Ag) detector system which is coupled to a nuclear
counting system to record the counts due to disintegrations of radon daughters
collected on the filter paper. Grab sampling technique is suitable for large scale
49

survey, because of its simplicity, minimal labour requirement and low cost. The
disadvantage of this technique is that it does not give accurate information of time
averaged air concentration in dwellings.
2.2.2 Time Integrated Radon Measurement Techniques
Time integrated techniques involve the accumulation of radon over longer
time periods from a few days to a week or more. In these techniques the radon is
measured directly by detecting the alpha emission or indirectly by detecting the
radioactive decay products of radon. A brief description of these techniques is given
below:
(a) Plastic Bag Technique
The first time integrating technique developed for radon studies is the plastic
bag technique(Sill, 1969). The sampled air collected over a period of 2 to 3 days by
pumping air at a slow rate into a bag that is impermeable to radon gas. Analysis for
radon concentration is performed later in a laboratory by concentrating and
transferring the integrated sample to a scintillation flask for alpha counting.
Concentrations as low as 0.01 pCi/1 can be measured.
(b) Charcoal Method
A charcoal sampler with dimensions of the order of 10 cm can be used to
collect ^ Rn over a period of a day to a week. The instrument developed by EML
consists of a small container filled with activated charcoal. Gamma rays emitted from
^'Tb and ' Bi, which are daughter products of Ra are measured (Cohen and
Cohen, 1983; Cohen and Nason, 1986). This technique is not suitable for a period
more than one week because after this period most of the ^ Rn collected at the
beginning will decay because of its 3.82 day half life.
50

(c) Alphameter Method
This method employs a solid state alpha particle detector counter assembly.
The alpha particle detector is a silicon diffused junction with an active area of 400
mm . When an alpha particle enters the n-p junction, a number of electron hole pairs
are generated, the number being proportional to the energy of alpha particle when it
enters the junction. The alpha particles striking the detector are counted and stored
until a read mode is initiated whereby the accumulated count and integration time can
be recorded. This instrument does not register any alpha particle which exhibits
energy less than 1 MeV. The alpha counts are displayed on LED (light emitting
diode) display. The detector records the alpha particles emanated by radon isotopes
and their alpha emitting daughters.
(d) Thermo luminescence Detector Technique
The process in which light is emitted by a substance when it is heated and
which can be attributed to the previous exposure to ionizing radiation is called thermo
luminescence. The thermo luminescence detectors are sensitive to all ionizing
radiation, the detectors used for radon measurements are very thin wafers (76 microns
of calcium sulphate doped with dysprosium in a matrix of Teflon), which are sensitive
mainly to alpha radiations (McCurdy et al., 1969; Pacer and Czamecki, 1980). These
detectors are typically exposed for 30 days in the uranium exploration programme and
then processed for their thermo luminescence signal.
2.3 Techniques used in Present Radon Investigations:
2.3.1 Alpha Particle Etched Track Detector:
It is also called a solid State nuclear track detector (SSNTD). SSNTD has been
extensively used for radiation dosimetery. Although several active and quick methods
are known for short term radon dosimetry, it is preferred to make long term (2-3
51
months) time integrated measurements (Alter and Pleisciier, 1981) using passive
alpha sensitive plastic track detectors. This preference is due to the fact that the radon
concentrations inside dwellings and also in the open atmosphere are found to vary
with several factors viz. the ventilation rate (Abu-Jarad and Fremlin, 1983) moisture
and temperature(Straden and Kolstad,1984), diurnal and seasonal variation(Lloyd,
1983) etc. The short term measurement does note give a value which may be taken as
representative for calculating the average effective yearly dose-equivalent needed for
the assessment of the health hazards likely to be caused by constant inhalation of
radon and its progeny. Long-term radon measurement with the help of active devices
is very tedious and expensive proposition. The choice of the passive, relatively simple
and less expensive plastic track detectors is evidently more advantageous. It also
facilities data collection at several locations simultaneously.
The nuclear track detectors play an important role, for their reliability, low
cost, small size, almost independence of the environmental conditions and good
sensitivity (Nikolaev and Ilic, (1991). Cellulose nitrate, commercially available as LR
115 (DOSIRAD) is one of such track detectors with suitable characteristics to
evaluate indoor atmospheric radon. Its range of energy sensitivity excludes the
formation of tracks related to self-plate-out of radon daughters. On the other hand, the
sensitive volume from where the incoming alpha particles produce a signal becomes
depleted of the radon progeny. Adequate calibration assures a good evaluation of total
concentration of alpha emitters in air (Bigazzi et al„ 1988; Da silva and Yoshimura,
2003) with bare LR 115 plastics.
Tracks formed in a SSNTD have different shapes and opacities depending on
the energy and angle of incidence of the alpha particle (El-Hawary et al., 1999;
Hudler et al., 1999). In LR 115, for instance, high energy alpha particles produce
52
small and dark (deep) tracks, whereas the low energy alpha particles give rise to big
and shallow ones. These characteristics can be quantified and used in a way to
classify alpha particles in regions of energy with a software for track analysis (Da
Silva and Yoshimura, 2005).
When a-particles strike a SSNTD, latent tracks will be formed, which will
become visible under the optical microscope on suitable chemical etching. LR 115
detector has an upper energy threshold for track formation which is well below the
energy of
a -particles emitted by the radon progeny deposited on the detector (Yu et al., 2005).
Out of the numerous advantages of SSNTDs some important features are listed below:
a. Etched track detectors are extremely simple to construct as compared with
other track detectors namely bubble, cloud and spark chambers and nuclear
emulsions.
b. These detectors are cheap and are available in different sizes.
c. The tracks formed are permanent and are stable under severe environmental
conditions like high temperature, pressure, humidity and mechanical
vibrations.
d. Due to small size, these detectors can be placed in direct contact with fission
fragment sources and hence very high efficiency and sensitively can be
achieved.
e. Due to small size these are quite suitable for personnel dosimetery in
environment and in congested surroundings,
f These detectors are highly durable and pose no health effect or handling
problems.
53

g. Their geometrical flexibility makes them suitable for angular distribution
measurements in nuclear reactions.
Normally two kinds of plastic track detectors (1) CR-39 plastic (Manufactured by
Pershore Mouldings Ltd. England) LR-1I5 type II plastic (Manufactured by Kadak-
Pathe, Dosired, France) are used for the measurement of radon.
2.3.1.1 CR-39
CR-39 is the most versatile and most sensitive track detector discovered by
Cartwright, Shirk and Price in 1978. CR stands for "Coumbia Resin" and chemically
CR-39 is a homopolymer of allyl diglycol-carbonate which is a plastic with
exceptional optical clarity. The CR-39 detector can be used in neutron, radon and
heavy-ion dosimetery.
It has a specific gravity of 1.32 at 25°C and has refractive index 1.504 at 20°C
with almost same light transmission as glass-92% for 0.25" thickness (Pershore
Moulding date sheet, PM002). CR-39 detector, when used for radon measurement,
record tracks of all alpha particles originating from radon and its progeny. The best
etchant for this detector foil was proved to be 20% NaOH at 70% for several hours.
2.3.1.2 LR-115 type II
One of the most significant detector materials for dosimetric application is the Kadak-
Pathe LR-115 type-II film. This is a two-layered detector which consists of a 12-
13fam red-coloured cellulose nitrate layer and an about 100(xm thick polyester
support. The recommended track etchant is usually 6N NaoH at 60°C. If the track is
etched completely through the sensitive CN layer, the track appears as a bright hole.
This makes track counting easier, and provides a low background in the case of
appropriate etching. The value of background track density varies with the thickness
of the etched off detector layer, shown in Fig. 2.1
54

-1 ^ ' - T 1 ' r
7 5 9 10
Fig. 2.1 Background track density in Kadak-Pathe LR-115 films produced i
1979 and 1980 as a function of tlie removed layer thickness.
m
55

The density of detector is 1.44 gm/cm''the upper cut off energy for track formation in
this detector is 4 MeV. The bulk etch rate for the detector is found to be 4 txm/hour.
LR-115 films consists of a thin layer of cellulose nitrate deep red coated on a
100)im thick polyester base. LR-115 type I films have only 6p.m cellulose nitrate
coating while LR-115 type II films have 12fim cellulose nitrate coating which is
sensitive to record alpha particles.
Kodak LR-115, type II films are of two types, pelliculable and non
pelliculable. For pelliculable films, spark counter can be used to count the tracks,
which is less time consuming. For non-pelliculable films the counting of tracks will
have to be carried out using microscope. For large- scale field work the counting of
tracks is very tedious.
One type of the Kodak-path track detector family is produced in "strippable"
form. The sensitive film can be removed by aqueous washing from the support sheet.
Thus the etched through tracks (holes) can also be evaluated with jumping spark
counter. Another type of Kodak Pathe detector is coated with a lithium-tetraborate
layer which serves as an alpha radiation for neutrons. LR-115 is one of the most
widely used track detector for radon concentration measurements. The detector
contains (Fig. 2.2) two LRl 15 stripping films.
56

( ^ Films
I/. I \ Aluminum side
N\ i Sensitive volume
G -A
yyy / ^ //????/// ^ //// /}//
Mylar
Fig. 2.2 LR-115 detector cross section.
2.3.1.3 Peculiarity of LR-115 typell and CR-39
CR-39, being most sensitive to alpha particles of all energies from almost zero to 60
MeV is used for ^ Rn measurements during past two decades due to its high
sensitivity to alpha particles of all energies. But, recently it has been observed that its
sensitivity over wide spectrum range causes problems. In spite of patenting thin
plastic film, it accumulates large number of tracks during storage. These back ground
tracks reduce signal to noise ratio especially in stored stock of films. On the other
hand, LR-115 is free from these problems. It essentially consists of a 12-13|am thick
alpha sensitive layer of red dyed cellulose nitrate plastic deposited on a lOO^m thick
polyester base is sensitive for track registration in the 1-9-4.2 MeV energy range
(Somogyi, 1986; Nikezic et al., 1993) for revealing tracks of alpha particles through
etched holes. This film is free from the self plate-out effect as it does not record tracks
due to self plating short-lived ^ Rn daughters which emit alpha particles of 6.00 MeV
from Po-218 and 7.69 Mev from Po-214
(Nikezic et al., 1992). Etching time needed to develop tracks in this film is also quite
small. LR-115 can provide better results than CR-39 in dust atmosphere where plate
57

out effect will cause a lot of uncertainty in radon and its daughters level
measurements (Abu-Jarad et. al., 1980).
Due to these aspects we have used LR-115 type II plastic track detectors
compared to CR-39 for the measurement of radon and its daughters.
2.3.1.4 Importance of Radon Detectors
Nowadays, Solid state nuclear track Detectors (SSNTDs) are preferred over other
prevalent nuclear detectors as they have in themselves the properties of track
recording detectors like the cloud chambers, nuclear emulsions etc. together with the
compactness and single particle counting ability of Semiconductor detectors without
requiring any special dark room processing or costly electronic equipments. Due to
their many useful features, these detectors have been used extensively for the last
three decades in almost all branches of nuclear science and technology, radiation
dosimetry, health physics and geo-sciences (Fleischer et. al., 1975). Today SSNTDs
are being used in more than fifty laboratories of the world including Australia,
Bangladesh, Brazil, China Czechoslovakia, England, France, Hungary, India, Iraq,
Iran, Italy, Japan, Mexico, Pakistan, Spain, Sweden, the U.S.A., Russia, Germany and
Yugoslavia.
SSNTDs have wide applications in the study of low cross-section nuclear
reactions, nuclear fission reactions, identification of cosmic ray particles of solar and
galactic origin, neutron flux measurements, study of radiation history of meteorites
and lunar samples, age determination of geological and archaeological samples, micro
distribution studies and microanalysis of some elements like U, Th, PU, Li, B, Be,
etc., neutron and charged particle radiography and radon and thoron dosimetry, study
of spreading of sea-beds, as micropore, filters for filtration of cancer blood cells, virus
and bacteria in beer industry, for measuring flight altitude of birds and for heavy ion
58

lithography etc. In fact these detectors have been found to have potential application
in almost every branch of science and technology. In addition to the books written by
Fleischer et al. (1975) and Durrani and Ball (1987) which are excellent treatise on this
subject and have elaborate list of latest references covering all topics, many review
articles have appeared on special refinements of the SSNTD technique and its
applications.
2.3.2 Radioactivity Measurements Through Gamma Spectroscopy
Gamma spectrometry is a very powerful non destructive technique for the detection
and measurement of gamma emitting radionuclides in different types of samples. In
this technique, the gamma spectrum of the desired sample is obtained using a NaI(Tl)
or HPGe detector coupled to a multichannel pulse height analyzer. The gamma
spectrum thus obtained is often complex and the various components are separated by
different analytical techniques. Thus the technique provides a non destructive multi -
component analysis which is extensively used for environmental samples.
In order to measure the natural radioactivity samples are crushed into fine
powder by using mortar and pestle. Fine quality of the sample is obtained using
scientific sieve of 150 micron-mesh size. Before measurement samples are dried in an
oven at a temperature of 383 K for 24h. each sample is packed and sealed in a airtight
PVC container and kept for about 4 week's period to allow radioactive equilibrium
among the daughter products of radon. We used high resolution gamma spectrometry
system with HPGe detector for themeasurement of activity of samples. The detector is
a CO- axial n- type high purity germanium detector (Make EG&G, OR TEC, Oak
Ridge, U.S.). The spectral data was analyzed using the software "CANDLE"
(Collection and Analysis of Nuclear data using Linux network) developed locally at
59

Inter University Accelerator Centre, New Delhi. Fig 2.3 shows the output of the
"CANDLE" software describing peaks of different energies.
CjH<t:il£ai:A|fl5»>X:&(3JlfCMIW4
Fig.23 Output of the "CANDLE" software describing peaks of different energies
2.3.3 Twin Chamber Dosimeter Cup
Concentration of radon, thoron and their progeny levels in the dwellings under
investigation were measured using the twin chamber solid state nuclear track detector
(SSNTD) based dosimeters using 12um thick LR-115 type II pelliculable celluse
nitrate based SSNTD manufacture by Kodak Pathe, France, days.
The dosimeter has been developed at Bhabha Atomic Research Centre
(BARC). Each cylindrical chamber has a length of 4.1 am and a radius of 3.1 cm. one
piece of the detector film (SSNTD) of size 3cm x 3cm. placed in first compartment
measures radon only which diffuses into it from the ambient air through a
semipermeable membrane. It allows the build up of about 90% of radon gas in the
compartment and suppresses thoron gas concentration by more than 99%. The mean
60

time for radon to reach the steady- state concentration inside the cup is about 4.5 hour.
Glass fiber filter paper in the compartment second allows both radon and thoron gases
to diffuse in and hence the tracks on second piece of the detector film placed in this
chamber are related to the concentrations of both the gases. Third piece of the detector
film exposed in bare made (placed on the outer surface of the dosimeter) registers
alpha tracks attributed to both the gases and their alpha emitting progeny, namely
2i8pQ 2i4pQ 2i6pQ j j 2i2pQ LR.] 15 detectors do not develop tracks originating from
the progeny alphas, deposited on them (Eappen et al., 1998; Nikolaev and lUic, 1999;
Durrani, 1997) and, therefore, are ideally suited for radioactive gas concentration
study. Etched detectors are pre-sparked using spark counter. The tracks are then
counted at the voltage corresponding to the plateau region of the counter. The
concentrations are derived from the observed track densities using appropriate
calibration factors. The calibration factors depend upon various parameters such as
membrane and filter characteristics as well as the energy of the alpha particles for the
cup mode exposure, the parameters of the etching process and spark counting
characteristics.
2.3.4 Spark Counter
The spark counter unit used in this study is the one designed by radiation safety
system division (RSSD), BARC, Mumbai. The block diagram of the set up is shown
in fig2.4. The set up consists of a spark head, adjustable HV circuit, display for counts
and EHT and pulse shaping circuits. As shown in photograph, the spark head is in the
form of a circular electrode of area Icm^ and the other electrode is in the form of a
spring loaded contact. Before the actual counting of the detector films on the sparks
counter, its plateau characteristics were studied. The variation of track density with
voltage for sample film was plotted. The plateau characteristics are shown in fig 2.5.
61

Set H V
Counter v/t 'i ^ * -i, -i '^
I • I Al C o a t i n g
/7777
POWER
Fig.2.4. Block diagram of spark counter set-up.
380 420 ^60 500 540 Voltage (V )
580 620
Fig.2.S. Plateau characteristics of spark counter
62

The voltage at the centre of the plateau region, i.e. 480v, was selected as the operating
voltage. Then, for counting the tracks, the following procedure is followed. The
detector film is placed on the spark head (round electrode). The mylar film cut in size
of about 3cm x 3cm is placed on the film such that its aluminized side faces the film
and covers the circular electrode and also touches the other electrode. Then a circular
weight is placed on the electrode base so as to press the spring loaded contact then a
high voltage of about 900v is applied across the electrodes and the counting is started
by pressing the start switch, provided on the front panel of the instrument this process
is called pre-sparking and is necessary for clearing and partially developed holes
during the etching. When the counting stops, as indicated by LED on the front panel,
the mylar film is removed and the fresh mylar is placed on the film without disturbing
the film. Now the voltage across the electrodes is set to operating voltage i.e. 480v
and again the counting is started. At the end of counting, the counts obtained are
noted down and the process is repeated twice again with fresh mylar every time and
the average of three reading is taken. Usually the central area of the film is sued for
counting.
When the spark dashes, a small amount of energy is dissipated. It fuses the
walls of the track (fig 2.6) and heats the small zone of the mylar films involved by the
spark, causing the local sublimation of aluminum (fig.2.7). This effect is important to
avoid the multiple counting of the same track, but might cause the electrical isolation
of an adjoining track.
63

Fig.2.6 Track holes on LR-115 film. The image on the left hand side shows a track after a spark. Its walls are fused and smooth. The image on the right-hand
side shows a track before a spark.
Fig.2.7 Sublimated aluminums spots on a mylar film.
64

The sublimated area varies according to the spark energy and its diameter is
proportional to the intensity of the electronic filed and to the capacity of both the
electronics of the spark counter and the film. The latter can be calculated in ~ InFcm'
for a 6.5fjjn residual thickness film.
Two tracks, with a mutual distance lower than one spot diameter, could be
resolved as a single one this effect is called 'saturation'.
2.3.5 Etching Apparatus
The apparatus used for etching was constant temperature shaker water bath
manufactured by Tempoo Company. For etching 2.5 N NaoH solution is prepared
using freshly prepared distilled water and placed in water bath in beakers the water
bath is provided with a digital temperature controller. Once the desired temperature
i.e. 60°C is achieved, the samples are introduced in the solutions with care so that all
the films are dipped properly. The samples are marked properly so that they are not
mixed during etching. Intermitting stirring is used during etching. During the etching
time the beaker with solution are kept covered so as the avoid the change in
concentration of solution due to evaporation. After etching for present time (80
minutes in this case, the samples are taken out and washed first with distilled water
and then in running water for 20-30 minutes. Then after washing, the films are peeled
off from the base and stored for counting in paper envelopes after drying.
2.3.6 Optical Microscope
The tracks formed by chemical etching are usually scanned under an optical
microscope at ordinary magnification. In the case of ncrmal or near normal incidence
the microscope can be focussed on the surface of the detector where the intersection
of the track with the surface is seen as dark circular spot. By changing the focus one
can also look into the depth of the track, in the case of oblique incidence the track can
65

be seen by changing the focus with the help of microscope to find the traclc density or
total number of track, area of etched detector surface is scanned using an eye piece
equipped with a grid marked graticule. The field of view is calibrated with the help of
a stage micrometer glass slide to find out the scanned area. A handtally counter
facilities counting the number of tracks in each grid of the eye piece graticule. Track
parameters can be measured with the help of a micrometer eye piece. Practical limit
of visual scanning lie between 10 -10 . tracks cm' using optical microscope.
2.3.7 Bare Mode Technique
For the measurement of radon concentration for dwelling, bare mode technique has
been used. In this mode the piece of the detector film of size 2 cm x 2cm fixed on a
thick flat card were exposed by hanging the cards on the wall in the dwellings for a
period of 90 days such that the detector viewed a hemisphere of radius at least 6.9cm,
the rage of 214 Po a-particles in the air. No surface should be closer than this range as
the decay products deposited on it would act as an additional alpha particles source
including a larger error in our measurements. The track density registered in the
detector will, therefore, be a function of radon progeny concentration in air (Kumar, et
al., 2004).
2.3.8 Can Technique
For the measurement of radon exhalation rates from coal, fly ash, soil, cement, and
other building construction materials the "can technique" has been used (Abu-Jarad,
1988.,Khan et al., 1992; Kant et al., 2001; Ramola and Choubey, 2003; Mahur et ai.,
2008).
2.3.8.1 Can Technique I
In this technique samples were dried and sieved through a 100-mesh sieve. In such
measurements equal amount of each sample (lOOg) was placed in the cans (diameter
66

7.0cm and height 7.5 cm) similar to those used in the calibration experiment (Singh et
al., 1997). In each can, an LR-115 type II plastic track detector (2cm x 2 cm) was
fixed at the top inside of the can. Thus the sensitive lower surface of the detector is
freely exposed to the emergent radon so that it is capable of recording the alpha
particles resulting from the decay of radon in the can. Radon and its daughters reach
an equilibirium concentration after a week or move and thus the equilibrium activity
of the emergent radon could be obtained from the geometry of the can and the time of
exposure (A.K. Mahur et al., 2008).
After the exposure for 100 days, the detectors from all the cans were retrieved.
The detectors were etched in 2.5 N NaoH at 60±rc for a period of 90 minutes in a
constant temperature water bath to reveal the tracks. Resulting alpha tracks on the
exposed face of the detector foils were scanned under an optical microscope at a
magnification of 400x.
2.3.8.2 Can Technique II
A plasticin can of known dimension (7.5 cm height and 7.0 cm diameter) was sealed
by plastic in to the individual building material. In each can a LR-115 type II plastic
detector (2 cm x 2cm) was fixed at the top inside the can .such that the sensitive
surface of the detector faces the material and is freely exposed to the emergent radon
so that it can record the alpha particles resulting from the decay of radon in the whole
volume of the can and also from '*Po and '"Po deposited on the inner wall of the
can. In such measurements it is expected that the exhalation rate depends upon the
material and the geometry and dimension of the can (A.K Mahur; 2006) . Radon and
its daughters will reach an equilibrium concentration after one week or more. Hence
the equilibirium activity of the emergent radon can be obtained from the geometry of
the can and the time of exposure. After the exposure for 90 days, the detectors from
67

all the cans were retrieved for the revelation of tracks the detectors were etched in 2.5
N NaoH at 60°C for a period of 90 minutes in a constant temperature water bath.
Resulting alpha tracks on the exposed face of the detector foils were scanned under an
optical microscope at a magnification of 400x.
68
REFERENCES
Abu- Jarad , F;Fremlin, J.H; (1983). Health physics,44,479.
Abu-Jarad F. Fremlin J.H. and Bull R., (1980). Phy. Med. Bio., 25,683.
Abu-Jarad, F., (1988). Nucl. Tracks Radiate. Meas. 15 (1-4), 525.
Ahlen S.P., Price P.B. and Tarle, G; (1981). Phys. Today, 34, 32.
Alekseeve V V, Grammakov AG, Tafeev G P. Radiometric methods in the
prospecting and exploration of uranium ores. Translation series, USAEC report
AEC - tr. 1959; 3778, book 2: p-425.
Al-Najyar S.A.R., Bull R.K. and Durrani S.A. (1980) Proc. Int. Conf. Solid State
Nucl. Track Detectors, Lyen and Suppl. 2, Nucl. Tracks, Pergamon Press,
Oxford.
Alter H.W. and Fleischer R.L. (1981). Health Phys. 40, 693.
Azam, Ameer; (2005). Environmental Radon and Radium Studies using Plastic track
detectors, Ph.D. Thesis, A.M.U., Aligarh (India).
Benton E.V. (1970). Radiat. Effects 2, 273 Benton E.V. and Henke R.P. (1969) Nucl.
Instrum. Meth. 70, 183.
Bhagwat a m. solid state nuclear track detection: theory and applications. Published
by India society for radiation physics, kalpakkam chapter, ISRP(K). T D-2,
1993.
Campi, F. Caresana, M. Ferrarini, M., Garlat, L., Palermo, M. and Rusconi, R., 2004
Uncertainty evaluation of radon measurement with LR-115 detector and Spark
Counter, Radiation Protection Dosimestry vol. I l l , No. 1, Oxford University
Press, 59-64.
Cheng K C, Porrit J M M.The measurement of radon emanation rates in Canadian cut-
and- fill uranium mine. CIM Bull. 1981; 74:110
69

Cohen B L, Cohen E S. Theory and Practice of radon monitoring with charcoal
adsorption. Heahh Phys. 1983; 45:501.
Cohen B L, Nason R. A diffusion barrier charcoal adsorption collection for
measuring Rn concentration in indoor air. Health Phys. 1986; 50:457.
Cross ,W.G., Tommasino, L., 1970 Rapid reading technique for nuclear particle
damage tracks in thin foils Radiat. Eff. 5, 85-89.
Durrani S A, Bull R K. Solid State Nuclear Track Detection: Principles, Methods and
Applications Pergamon Press, Oxford. 1987.
Durrani S.A. and Bull R.K. (1987). Solid state Nuclear Track detection Principals,
methods and Application Pergamon Press.
Durrani, S.A., 1997. Alpha particles etched track deector. IN. Durrani, S.A., 1 liC, R.
(Eds.), Radon measurement by etched track detectors. Application in Radiation
Protection, Earth Sciences and the Environment world Scientific, Singapore, PP.
77-101.
Engew., Grabisch K., Beaujean R. and Bartholma K.P. (1974) Nucl. Instrum. Meth.
115,263.
Fleischer R L, Giaid W R, Mongro-compro A, Turner L G, Alter H W, Gingrich J E.
Dosimetry of Environmental Radon: methods and theory for low dose integrated
measurements. Health Phys. 1980; 39: 957-962.
Fleischer R.L. (1979). Ann. Sci., 67, 194.
Fleischer R.L., Alter H.W., Furman S.C. Price P.B. and walker R.M. (1972). Science,
178,255.
Fleischer R.L., Price P.B. and Walker R.M. (1965) Ann. Rev. Nucl. Sci., 15, 1.
Fleischer R.L., Price P.B. and Walker R.M. (1969). GE C Report No. 69C-133.
70

Fleischer R.L., Price P.B. and Walker R.M. (1975). Nuclear Tracks in Solids
Principles and Applications; University of California Press.
Fleischer R.L., Price P.B. and woods R.T. (1969): Phys. Rev., 188, 563.
Fleischer R.L; Girard W.A., Margo-Compero A., Turner L.G., Alter H.W. and
Gingrich J.E. (1980). Health Phys. 19, 957.
George A C. scintillation flasks for the determination of low level concentrations of
radon. In: proceedings of ninth mid year. Health Physics Symposium Denver co.
1976.
Gopalakrishnan, SMT. S; Analysis of food and Soil Samples using Gamma
Spectrometry Methods Environmental ssessment Division Bhabha Atomic
Research Centre Bombay-400085.
Handbook of Solid state Nuclear Track Dosimetery./G. DAJ ko and G- SOMOGYI.
Hepburn C, and Windle H.H. (1980). J. Mat. Sci., 15,273.
Iyer R.H. (1981). Pro. Earth and Planet Sci., 90, 437.
Jojo, P.J., et al. 1994. Inter laboratory Calibration of Track etch detector for the
measurement of radon and radon daughter levels. Radiat. Meas., 23: 715-724.
Jojo, P.J; 1993. Study of Radon and its Progeny using Etched Track Detectors and
Microanalysis of Uranium, Ph.D. Thesis. A.M.U. Aligarh (India).
Kant, K., Chauhan, R.P., Sharma, G.S. et al, (2001). India, J. Pure & Appl. Phys. 39,
679.
Khan, A.J., et al. 1995. The distribution of radon levels in some Indian dwellings. 3' ''
international colloquium on Rare gas Geochemistry. Amritsar. Proceedings, PP
299-300.
Khan, A.J., Prasad R. and Tyagi, R.K., (1992). Nucl. Tracks Radiat. Meas. 20, 609-
610.
71

Kumar, A., Singh, B., & Singh, S; (2001). Uranium, Radium and radon exhalation
studies in some soil samples from Una district, Himachal Pradesh, India using
track -etching technique Indian Journal of Pure, Applied Physics, 39, 761-764.
Kumar, Rajesh; Mahur, A.K. Varshney, A.K.; Prasad, Rajendra; 2004. Distribution of
indoor radon levels in dwellings of palampur and Baijnath. IJEP 24 (8) 588-592.
Lloyd L.L. (1983). Montana Department of Health and Environmental Sciences. EPA
60-01-6100.
Lucas H F. Improved loe level alpha scintillation counter for radon. Rev. sci. Inst.
1957; 28(9): 680.
Mahur, A.K; Kumar, Rajesh; Mishra, Meena; Sengupta, D., Prasad, Rajendra; 2008.
an investigation of radon exhalation rate and estimation of radiation doses in
coal fly ash samples. Applied Radiation and isotopes 66, 401-406.
Martz D E, Hoileman D F, Mc Cundy D E, Schiager K J. Analysis of atmospheric
concentrations of Ra A, Ra B and Ra CP by alpha spectroscopy. Health Phys.
1969; 17(1): 131.
Mayya Y.S., Eappen, K.P., Nambi, K.S. V., 1998. Methodology for mixed field
inhalation in monazite areas using a twin- cup dosimeter with three-track
detector; Radiate, Prof Dosim. 77 (3) 177-184.
Mc Corkell R H, Card J W. The decay products of ^ ' Rn in etched track radon
detection J. Geochi. Explor. 1978; 10:277.
Mc Curdy D E, Shiager K J, Flack E D. Thermoluminescent dosimetry for personal
monitoring ofuranium miners. Health Physics. 1969; 17:415
Mehra, R; Singh, S., & Singh, K. (2006). A study of uranium, radium, radon
exhalation rate and indoor radon in the environs. Of some areas of Malwa
region, Punjab. Indoor and Built Environment, 15 (5), 499-505.
72

Mehra, Rohit., Singh Surinder; Singh, Kulwant; Sonkawade, Rajendra, 2007. ^ ^ Ra,
•' Th, and '*\ analysis in soil samples from some areas of Malwa region,
Punjab, India using gamma ray spectrometry. Environ. Monit. Asses Do I 10.
1007/s 10661-007-9624-3.
Morgan D.V. and Vliet D.V. (1970). Contem. Phys., 11,173.
Nikeizic, D.,P. Markovic and BekUzarov. 1992. calculating the Calibration coefficient
for radon measurements with LR-115 track detectors Health Physics. 62: 239-
244.
Nikezic, D.P; Markovic and Bek- Uzarov, 1993 .Determination of calibration
coefficient for radon measurements with track etch detectors. Health physics.
64.628-631.
Nikolaev, V.A., Ilic. R., 1999 Etched track radiometers in radon measurements: a
review, Radiate. Meas. 30,1-13.
Pacer J C, Czamecki R F. Principle and characteristics of surface radon and helium
technique used in uranium exploration, U.S Deptt. Of energy GJBX-177 180,
1980;64.
Price P.B. and Fleischer R.L. (1971). Ann. Rev. Nucl. Sci., 21, 295.
Ramola R C, Kandari M S, Rawat RBS, Ramachandran T V, Choubey V M. A study
of seasonal variations of radon levels in different types of houses. J. Eniron.
Radioactivity. 1998; 39(1): 1-7.
Ramola, R. C, Rawat, R.B.S., Kandari, M.S., Ramachandran, T.V., and Choube,
V.M., 1997. Seasonal variation of Indoor Radon Levels in Dwellings of Tehri
Garhwal Areas using Track Etch. Techniques. IJEP 18 (2), 81-89.
Ramola, R.C., Chaubey V.M. and Mukherjee P.K. (2003). Bulletin of Indian
Geologists Association 36, 39-45.
73

Roll R. Rapid working level monitoring. Health Phys. 1972; 2293): 223.
Saini H.S. and Nagpaul K.K. (1979) Phys. News. 10,1.
Sill C. W. An integrating air sampler for determination of radon - 222. Health Phys.
1969; 16(3): 371.
Singh A.K., Jojo, P.J., Khan, A.J. Prasad, R., Ramachandran, T.V., 1997. Calibration
of track detectors and measurement of radon exhalation rate from solid samples.
Radiate Prot. Environ. 3, 129-133.
Singh S, Malhotra R, Kumar J, Singh L. Indoor radon measurements in dwellings of
kulu area, Himachal Pradesh, using solid state nuclear track detectors. Radiation
Measurements 2001 a; 34 : 505-508.
Somogyi G. (1986). ATO MKI Preprint E/125. 1-28.
Somogyi, G. 1986. Track detection methods of radium measurements. ATOMIK
Report E, 25. (5).
Sphor R. (1981). J. Electrochem. Soc, 128,188.
Srivastava D.S. (1971). Study of Plastic Tack Detectors for Detection of alpha
Particles, Ph.D. Thesis, A.M.U. Aligarh.
Straden E., and Kolstad A.K. (1984). Health Phys. 47, 480.
Subba Ramu, M.C. et al. 1990. Measurement of equilibrium factor for ^ Rn
daughters in dwellings in India. Sci. Total Env., 99: 40-52.
Tommasino L,Torri G, Piermattei S, Susanna A, Flores B, Feroce C, Blasi M,
Riccardi M. A Mediterranean test house : Radon measurements prior,during and
after restoring. Radiat. Prot. Dosim. 1992; 45(1-4): 585. Virk H S. Earthquake
forecasting using radon signals Physics - Education. 1990; 7 : 221.
Virk, H.S. 2000 Indoor radon/thoron survey report from Hamirpur and Una district,
Himachal Pradesh. Appl. Radiat. Isotopes. 52: 137-141.
74

cM tef in

Chapter-Ill
Measurement of Radon Exhalation rate and Estimation of Radiation Doses in solid samples
3.1 Introduction
Radon gas is produced by decay of ^ *Ra which is a member of the uranium series.
Uranium and consequently, radium are present in soil, waste materials and building
materials etc. in different concentration. However, radon concentration may be much
higher in indoor air than outdoor, depending on the rate of radon entry and air
exchange in the dwellings.
It is well known that there is a correlation between indoor radon exposure and
lung cancer. The risk coefficient for lung cancer due to inhalation of radon and its
progeny varies according to the age group subject to radon exposure. Hence, many
scientists and researchers have put lot of efforts to measure the concentration of
radon and its progeny (Nikolaev and Hie, 1999; Srivastava et al, 2001; Durrani and
Ilic, 1997). As a result of these efforts, several places were spotted and identified as
radon polluted areas (Lowder, 1990).
Construction materials are one of the major sources of indoor radon
concentration in dwellings. Radon exhalation rate from the surface will enable the
estimation of indoor radon input from the construction materials to the indoor radon
air. Radon exhalation from construction materials has been the subject of many
studies (Abu-Jarad et al, 1980; Mustonen, 1984; Savidou et al, 1996; Durrani and Ilic,
1997; Al-Jarallah et al; 2001; Mahur et al; 2008 ).
The amount of radioactivity in soil depends upon the type of soil and its uses.
A large number of trace elements are present in soils (Baytas et al, 2002) . Soil is a
complex substance because of its extreme variability in physical and chemical
75

composition. It contains small but significant quantities of organic and inorganic
compounds.
There has been an increasing demand for electricity generation throughout
the world with the ever increasing growth in human civilization. With the increasing
demand for electricity, coal plays an important role in electric power generation world
wide. Coal is burnt in furnaces operating at temperatures of up to about 200K. In the
combustion process most of the mineral matter in the coal is fused in to the vitrified
ash which is a major environmental problem.
This problem is particularly important for Indian power stations because most
of them use poor quality coal with 55-60% ash content. This results in an average
production of 100 million tons of ash per annum. In the combustion process, most of
the mineral matter in coal is converted into ash. A portion of the heavier ash together
with incompletely burnt organic matter drops to the bottom of the furnace as ash or
slag. The natural radiocuclides included in the non-combustible mineral matter of coal
are portioned among the bottom ash and fly ash, except for the gases and volatile
minerals which are incorporated directly into the flue gases. In large power stations,
there is about 20% bottom ash and, therefore, 80% fly ash. The natural radionuclides
concentrations in ash and slag from coal-fired power plants are significantly higher
than the corresponding concentration in the earth's crust. Radiation risk from fly
ash is of importance since if used in construction materials it may raise the
concentration of airborne indoor radioactivity to unacceptable levels, especially in
places having low ventilation rates (Rawat et al, 1991; Khan et al, 1992).
Radon exhalation is of prime importance for the estimation of radiation risk from
various solid waste materials. Measurement of radon exhalation from building
materials using active devices is difficult owing to low levels of emanation from the
76

materials and long-term measurements are necessary. Track etch d teciOTSctiave'.been.
used successfully for passive and time integrated measurements (tl^an ^nd Piesch,
1981).
3.2 Measurement of radon exhalation rate and estimation of radiation doses in solid samples i.e. Flyash , Coal, Slag, Soil, Cement, Sand, Bazari and Badarpur.
In the present investigations radon exhalation rates from flyash, coal, slag, soil,
cement, sand, bazari and badarpur samples collected from different places of India
were carried out through sealed can technique I using LR-115 type II as detectors.
3.2.1 Experimental details
(a) Preparation of samples
In order to measure the radon exhalation rates from solid samples such as flyash,
coal, slag, soil, cement, sand, bazari and badarpur, the samples were collected from
different building sites. After collection, the samples were crushed into fine powder,
dried and sieved through a 100 mesh sieve.
(b) Experimental Technique(Can Technique I)
Equal amount of each sample (lOOg) was placed in the cans (diameter 7.0 cm and
height 7.5 cm) similar to those used in the calibration experiment (singh et al, 1997).
In each can a LR-115 type II plastic track detector (2cm x 2cm) was fixed at the top
inside of the can and the can was sealed (Fig 3.1). Thus the sensitive lower surface of
the detector is freely exposed to the emergent radon so that it is capable of recording
the alpha particles resulting from the decay of radon in the can. Radon and its
daughters reach an equilibrium concentration after a week or more and thus the
equilibrium activity of emergent radon could be obtained from the geometry of the
can and the time of exposure.
y >
77
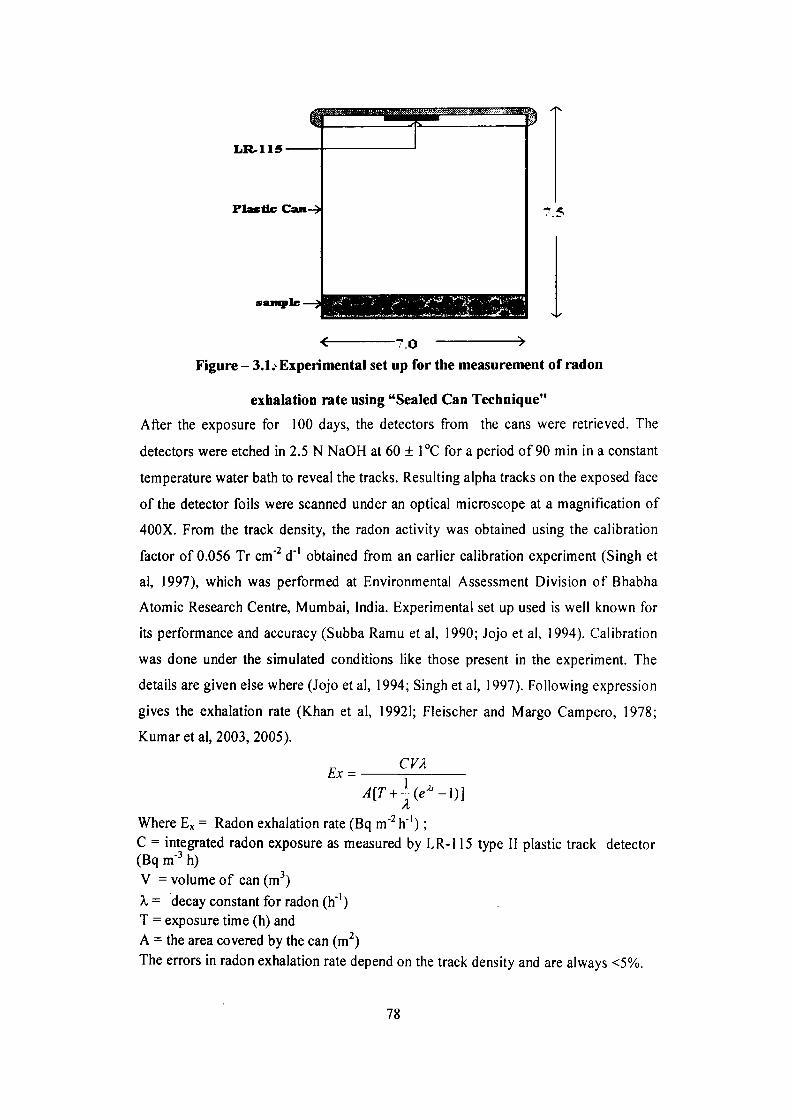
LR.115
Plastic Can-^
s a j i ^ I e -
Figure- 3.1. Experimental set up for the measurement of radon
exhalation rate using "Sealed Can Technique"
After the exposure for 100 days, the detectors from the cans were retrieved. The
detectors were etched in 2.5 N NaOH at 60 ± 1°C for a period of 90 min in a constant
temperature water bath to reveal the tracks. Resulting alpha tracks on the exposed face
of the detector foils were scanned under an optical microscope at a magnification of
400X. From the track density, the radon activity was obtained using the calibration
factor of 0.056 Tr cm" d"' obtained from an earlier calibration experiment (Singh et
al, 1997), which was performed at Environmental Assessment Division of Bhabha
Atomic Research Centre, Mumbai, India. Experimental set up used is well known for
its performance and accuracy (Subba Ramu et al, 1990; Jojo et al, 1994). Calibration
was done under the simulated conditions like those present in the experiment. The
details are given else where (Jojo et al, 1994; Singh et al, 1997). Following expression
gives the exhalation rate (Khan et al, 19921; Fleischer and Margo Campero, 1978;
Kumaretal, 2003, 2005).
Where Ex = Radon exhalation rate (Bq m' h' '); C = integrated radon exposure as measured by LR-115 type II plastic track detector (Bq m- h) V = volume of can (m ) A,= decay constant for radon (h"') T = exposure time (h) and A = the area covered by the can (m ) The errors in radon exhalation rate depend on the track density and are always <5%.
78

(c) Indoor internal exposure due to radon inhalation
The risk of lung cancer from domestic exposure of ' ^Rn and its daughters can be
estimated directly from the indoor inhalation exposure (radon) effective dcse. The
contribution of indoor radon concentration from the f amples can be calculated from
the expression (Nazaroff and Nero, 1988):
_ E^xS VxAy
Where CRn, Ex, S, V, and A,v are radon concentration (Bq m' ), radon exhalation
rate(Bq m" h"'), radon exhalation area (m^), room volume (m ) and air exchange rate
(h"') respectively. In these calculation, the maximum radon concentration from the
building material was assessed by assuming the room as a cavity with SA = 2.0 m"'
and air exchange rate of 0.5 h''. The annual exposure to potential alpha energy Ep
(effective dose equivalent) is then related to the average radon concentration CRP by
the following expression:
Ep (WLM yr"') = 8760 x n x f x CRO /170 x 3700
Where Can is in Bq m'; n, the fraction of time spent indoors; 8760, the number of
hours per year; 170, the number of hours per working month and F is the equilibrium
factor for radon. Radon progeny equilibrium factor is the most important quantity
when dose calculations are to be made on the basis of the measurement of radon
concentration. Equilibrium factor F quantifies the state of equilibrium between radon
and its daughters and may have values 0< F < 1. The value of F is taken as 0.4 as
suggested by UNSCEAR (1988). Thus the values of n = 0.8 and F= 0.4 were used to
calculate Ep. From radon exposure, effective dose equivalents were estimated by
using a conversion factor of 6.3 mSv WLM'' (ICRP, 1987).
79

3.2.2 Radon exhalation rate and radiation doses from fly ash, coal, bottom ash and slag samples collected from Panki Thermal Power Plant.
In recent years fly ash has found diversified appHcations in construction activities
such as in the formation of Bricks, as a binding material and in the production of
cement etc. Thus, it is quite important to estimate the radiation risk to the population
from the radon exhalation rate of fly ash.
About 25 samples of coal, fly ash, slag and bottom ash were collected from Panki
thermal power plant in the state of U.P.(India). In the present study, radon exhalation
rates in these samples have been measured by sealed can technique I using LR-115
type II detectors.
Results and Discussion
The measured data for radon exhalation rate is presented in Table 3.1
80

Table 3.1 Radon activity concentration, radon exiialation rate and indoor inliaiation exposure(radon)-effective dose in coal, flyash, bottom ash and slag samples from Panki tliermal power plant in U.P., India
Sample
Fl F2 F3 F4 F5 F6 F7 F8 F9 FIO Fll F12 F13 F14 F15 Average value; S.D. R.S.D% BFl BF2 BF3 BF4 Average value S.D. R.S.D% CI C2 C3 C4 Average value S.D. R.S.D% SI S2 Average value S.D. R.S.D%
Track Density (Track/ cm d)
189.3 200.0 198.1 202.1 193.6 196.3 178.7 196.8 184.0 174.4 192.0 196.8 206.4 177.6 190.4 191.8 9.43 4.92 252.0 224.0 235.2 208.9 230.0 18.2 7.9 198.4 187.2 174.4 162.1 180.5 15.7 8.7 260.8 264.0 262.4 2.26 0.86
Radon Activity (Bq mO
3380.00 3571.43 3537.14 3608.57 3457.14 3505.71 3191.43 3514.29 3285.71 3114.29 3428.57 3514.29 3658.71 3171.43 3400.00 3422.58 165.44 4.83 4500.00 4000.00 4200.00 3731.43 4107.86 324.34 7.89 3542.86 3342.86 3114.29 2894.29 3223.58 280.79 8.71 4657.14 4714.29 4685.72 40.41 0.86
Exhalation Rate (mBq m- h ')
1215.19 1224.9 1271.69 1297.37 1242.92 1260.39 1147.39 1263.47 1181.29 1119.66 1232.65 1263.47 1325.10 1140.21 1222.38 1227.21 58.72 4.78 1617.86 1438.09 1510.00 1341.54 1476.87 16.61 7.89 1273.74 1201.84 1119.66 1040.57 1158.95 100.95 8.71 1674.35 1694.90 1684.63 14.53 0.86
Effective Dose equivalent (tiSv y ' )
143.29 144.35 149.96 152.99 146.57 148.63 135.30 148.98 139.29 132.03 145.36 148.99 156.26 134.45 144.14 144.71 6.93 4.79 190.78 169.58 178.06 158.19 174.15 13.75 7.89 150.20 141.72 132.03 122.70 136.66 11.91 8.72 197.44 199.86 198.65 1.71 0.86
F BF C S
F y ash, Bottom Ash Coal Slag
81

It is clear from the table that the radon activity for fly ash samples varies from
3114.29 Bq m' to 3658.76 Bq m" with an average value of 3422.58 Bq m"\
Exhalation rate varies from 1119.66 mBq m" h'' to 1325.10 mBq m' h'' with an
average value of 1227.21 mBq m' h"' while effective dose equivalent varies from
132.03 fiSv y"' to 156.26 fiSv y"' with an average value of 144.71 fiSvy''. For bottom
ash radon activity varies from 3731.43 Bq m' to 4500.00 Bq m' with an average
value of 4107.86 Bq m'''; exhalation rate varies from 1341.54 mBq m" h ' to 1617.86
mBq m" h"' with an average value of 1476.87 mBq m' h"' while effective dose
equivalent varies from 158.19^Sv y"' to 190.78^Sv y'' with an average value of
1174.15 fiSv y'' . For coal samples radon activity varies from 2894.24 Bq m' to
3542.86 Bq m' with an average value of 3223.58 Bq m"'', exhalation rate from
1040.57 mBq m' h"' to 1273.74 mBq m' h'' with an average value of 1158.95 mBq
m' h'' while effective dose equivalent varies from 122.70 fiSv y"' to 150.20 jiSv y"'
with an average value of 136.66fiSv y"'. For slag samples radon activity varies from
4657.14 Bq m" to 4714.29 Bq m' with an average value of 4685.72 Bq m' ,
exhalation rate from 1674.35 mBq m" h'' to 1694.90 mBq m" h ' with an average
value of 1684.63 mBq m' h"' while mean effective dose , is 198.65 ^Sv y ' . The
maximum value was found to be for the slag samples collected from inside the
thermal power plant. The higher value of radon exhalation rate of slag may be due to
their grain size and uranium concentration.
3.2.3 Radon exhalation rate and radiation doses from fly ash and coal samples collected from Kasimpur thermal Power Plant.
About 17 samples of coal and fly ash were collected for the measurements of radon
exhalation rates in coal and fly ash samples from the thermal power plant at Kasimpur
(U.P.), India. Radon exhalation rates have been measured using sealed can technique I
having LR-115 type II detectors.
82

Results and Discussion
The results for the values of the radon activity and radon exhalation rates in the coal
and fly ash samples from KTPP, Kasimpur are presented in Table 3.2 .
Table 3.2
Radon activity concentration, radon exhalation rate and indoor inhalation exposure(radon)-effective dose in coal (KP-C) and fly ash (KP-F) samples from Kasimpur Thermal Power Plant (U.P.), India
Sample
KP-C,
KP-C2
KP-C3
KP-C4
KP-C5
KP-C6
KP-C7
KP-Cg
KP-C9
Average value
S.D.
R.S.D%.
K.P.-Fi
K.P.-F2
K.P.-F3
K.P.-F4
K.P.-F5
K.P.-Fe
K.P.-F7
K.P.-Fg
Average value
S.D.
R.S.D%.
Radon Activity (kBq m- )
3.68
3.19
1.99
2.19
3.31
4.07
3.62
2.85
3.75
3.18
0.67
0.21
3.25
1.50
2.90
4.10
3.62
2.89
3.52
2.36
3.02
0.76
0.03
Radon Exhalation Rate(Bqm'^ h')
1.32
1.15
0.71
0.79
1.19
1.46
1.30
1.03
1.35
1.17
0.24
0.02
1.17
0.54
1.04
1.48
1.30
1.04
1.27
0.85
1.09
0.27
0.03
Indoor Inhalation exposure(radon
effective dose raSv y ' )
0.149
0.129
0.080
0.089
0.134
0.165
0.146
0.115
0.152
0.128
0.27
21.2
0.131
0.061
0.117
0.166
0.146
0.117
0.142
0.095
0.121
0.030
0.025
83

In coal samples radon activity is found to vary from 1.99 kBq m" to 4.07 kBq m with
an average value of 3.18 kBq m'^'whereas the radon exhalation rate varies from 0.71
Bq m' h'' to 1.46 Bq m' h ' with an average value of 1.17 Bq m" h'' while in fly
ash samples, radon activity is found to vary from 1.50 kBq m' to 4.10 kBq m' with
an average value of 3.02 kBq m' , the radon exhalation rate varies from 0.54 Bq m' h"
' to 1.48 Bq m' h'" with an average value of 1.09 Bq m" h''. Table 3.2 shows no
appreciable change in radon activity and radon exhalation rate from fly ash samples
from Kasimpur. In our previous measurements fly ash is found to have enhanced
levels of uranium as compared to coal (Jojo et al, 1993; Kumar et al, 2005) due to
combustion of coal. In the present study radon exhalation rate does not show any
increase, confirming our previous conclusions (Jojo et al, 1993; Kumar et al, 2005)
attributing it to the fine texture of the fly ash which fills the voids in the material and
prevents the escape of radon from it. However, present results contradicts the result of
our recent measurements(Mahur et al, 2007) in coal and fly ash samples form thermal
power plant at Kolaghat situated in the state of West Bengal, India in which radon
exhalation rate in fly ash (average value, 1310 mBq m" h'') has been found to be
higher than coal samples. Fig 3. 2 and Fig 3.3 shows the frequency distribution chart
of exhalation rate of different samples studied here.
84
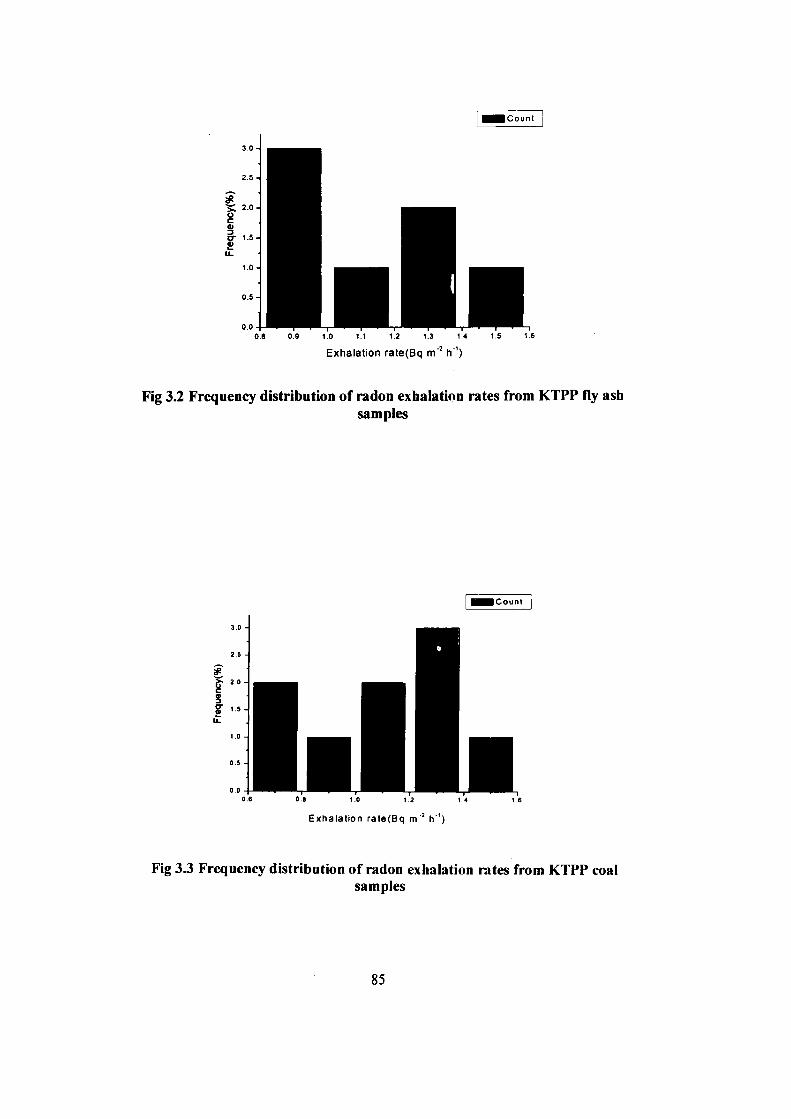
• Count
0.8 0.9 1.0 1.1 1.2 1.3 14 1.5 1.6
Exhalation rate(Bq m"' h ')
Fig 3.2 Frequency distribution of radon exhalation rates from KTPP fly ash samples
Exhalation rate(Bq m ^ h ' )
Fig 33 Frequency distribution of radon exhalation rates from KTPP coal samples
85

3.2.4 Radon exhalation rate and radiation doses from fly ash samples collected from National Thermal Power Corporation (NTPC), Dadri
About 13 samples of coal and fly ash were collected from National Thermal Power
Corporation Plant at Dadri (U.P.), India for the measurements. In the present study,
radon exhalation rates in fly ash samples from NTPC plant at Dadri, situated in the
state of Uttar Pradesh, India were estimated using sealed can technique I having LR
US type II detectors.
Results and Discussion
The results for the radon activity and radon exhalation rates in fly ash samples
collected from NTPC, Dadri are presented in Table 3.3
Table 3.3
Track Density, radon activity and radon exhalation rate in fly ash samples from
NTPC Plant, Dadri (U.P.)
Samples
NTPC-1 NTPC-2 NTPC-3 NTPC-4 NTPC-5 NTPC-6 NTPC-7 NTPC-8 NTPC-9
NTPC-10 NTPC-11 NTPC-12 NTPC-13
Average value S.D.
R.S.D%.
Track Density (track/cm^d)
221.6 146.0 187.3 175.7 159.0 190.0 129.4 147.3 170.8 164.0 146.1 123.8 100.6 158.6 30.5
19.2
Radon activity (Bq m- )
3778.06 2607.1 3344.3 3137.1 2840.0 3392.9 2311.4 2630.0 3050.0 2928.6 2608.6
2211.04 1797.1 2745.3 564.3
20.5
Radon Exhalation Rate
(mBq m- h')
1358.5 937.3 1202.3 1127.9 1021.0 1219.8 831.0 945.6 1096.6 1052.9 937.8 795.1 646.1 987.0 202.09
20.5
Effective dose
equivalent (nSv y-')
160.2 110.5 141.7 133.0 120.4 143.8 97.9 111.5 129.3 124.2 110.5 93.7 76.2 119.5 21.9
18.3
86

Radon activity is found to vary from 2211.4 Bq m" to 3778.6 Bq m' with an average
value of 2745 Bq m , whereas the radon exhalation rate varies from 646.1 mBq m"
h"' to 1358.5 mBq m' h'' with an average value of 987.0 mBq m" h"' The effective
dose equivalent varies from 76.2 |a.Sv y" to 160.2 i Sv y' with an average value of
119.5 fiSvy"'. Fig 3.4 presents the frequency distribution chart of exhalation rate of
different samples studied.
Count
0.6 0.8 1.0 1.2 1.4
Exhalation rate(Bq m' h"')
Fig 3.4 Frequency distribution of radon exhalation rates from NTPC, Dadri fly ash samples
87

3.2.5 Radon exhalation rate and radiation dose from soil samples collected from
different places surrounding the Kasimpur Thermal Power Plant.
The soil or bedrock beneath a building is one of the major sources of radon gas in the
indoor air. The emanation of radon gas from different types of materials can be
estimated to some extent if the content of ^ *U of a samples is known and the ^ Ra
content is only minorly affected. The true emanation is, however, affected by various
parameters, one of these parameters is the possibility for the gas to come out from the
grains into the air through the space between the gr lins of the samples. Soils have
different grain size. The soil and the bedrock beneath a building, the building
material or the tap water are three main sources of the radon gas which may be
present in the indoor air. If the soil has an enhanced content of '' U, the soil may be a
potential source of the radon gas present in the soil air. This source is of importance
as there are certain parameters connected to the soil, affecting the true level of the
radon concentration in the soil air. There are also additional parameters of importance
for the transport of the gas in the soil and upwards into a building (Tell et al, 1994;
Fant, 1997). One parameter of importance is the ability of the gas to leave, when
produced in the grains of the soil. The fraction of radon atoms, generated in the soil
grains and reaching the pore volume of the soil is known as emanation coefficient.
This coefficient depends basically on the soil grain size-distribution, on the porosity
and on the water content of the soil. The geometry and the size of the soil grains and
the pores determine the "Static" emanation coefficient in the sense that they do not
change in time. In this sense the type of soil determines the general radon level in the
soil (Jonsson, 1991). The water content has a large impact on the emanation
coefficient and on the soil transport parameters for radon gas and, therefore, affects
the radon concentration in the soil (Stranden et al, 1984). There are several reports on
88

measurements, where the emanation of radon from different kind of materials are
studied. These reports focus on materials like soil and bedrock (Tanner, 1980;
Wilkening, 1990; Abumurad et al, 1997).
Fly ash from a thermal power plant is spread and distributed in the
surrounding areas by air and may be deposited on the soil of the nearby region. Thus
the radioactivity levels of the soil samples may alter and it is quite important to
estimate the changes. About 15 samples of soil were collected from different places of
the colony and other buildings from the surroundings of Kasimpur Thermal Power
Plant for the measurements.
89
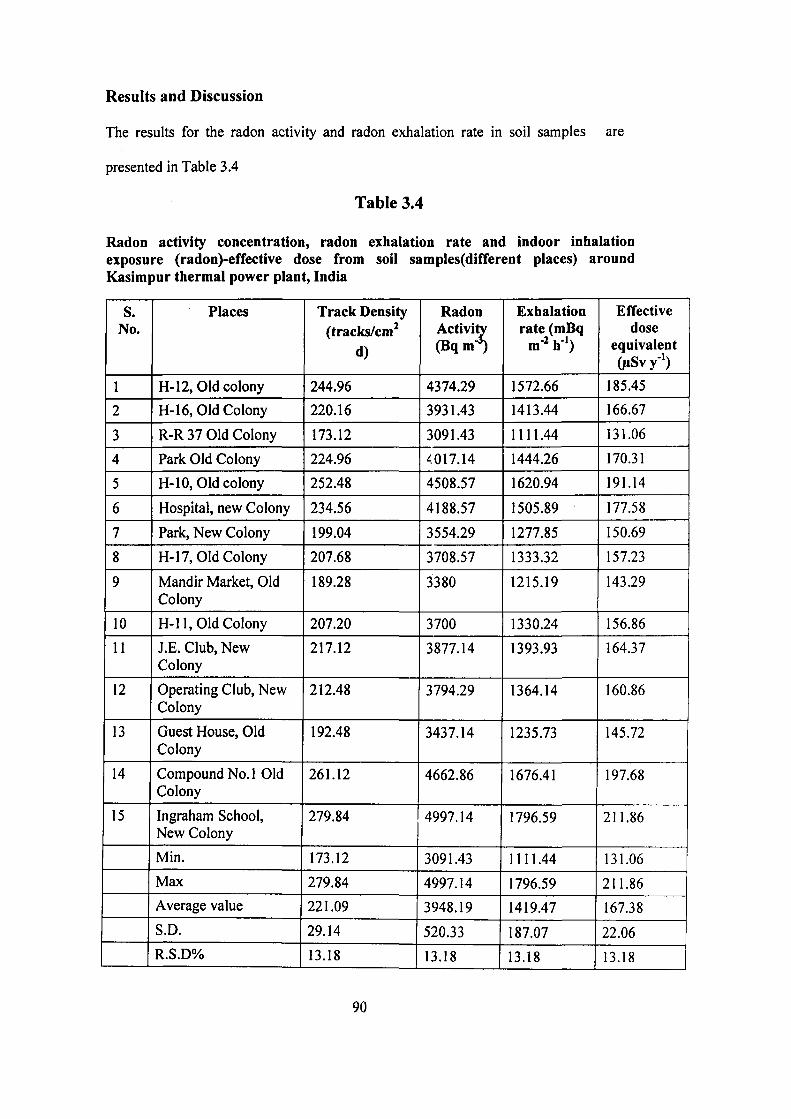
Results and Discussion
The results for the radon activity and radon exhalation rate in soil samples are
presented in Table 3.4
Table 3.4
Radon activity concentration, radon exhalation rate and indoor inhalation exposure (radon)-effective dose from soil samples(different places) around Kasimpur thermal power plant, India
s. No.
1
2
3
4
5
6
7
8
9
10
11
12
13
14
15
Places
H-12, Old colony
H-16, Old Colony
R-R 37 Old Colony
Park Old Colony
H-10, Old colony
Hospital, new Colony
Park, New Colony
H-17, Old Colony
Mandir Market, Old Colony
H-11, Old Colony
J.E. Club, New Colony
Operating Club, New Colony
Guest House, Old Colony
Compound No. 1 Old Colony
Ingraham School, New Colony
Min.
Max
Average value
S.D.
R.S.D%
Track Density (tracks/cm^
d)
244.96
220.16
173.12
224.96
252.48
234.56
199.04
207.68
189.28
207.20
217.12
212.48
192.48
261.12
279.84
173.12
279.84
221.09
29.14
13.18
Radon Activity (Bqm- )
4374.29
3931.43
3091.43
<017.14
4508.57
4188.57
3554.29
3708.57
3380
3700
3877.14
3794.29
3437.14
4662.86
4997.14
3091.43
4997.14
3948.19
520.33
13.18
Exhalation rate (mBq
m" h')
1572.66
1413.44
1111.44
1444.26
1620.94
1505.89
1277.85
1333.32
1215.19
1330.24
1393.93
1364.14
1235.73
1676.41
1796.59
1111.44
1796.59
1419.47
187.07
13.18
Effective dose
equivalent (^Svy-')
185.45
166.67
131.06
170.31
191.14
177.58
150.69
157.23
143.29
156.86
164.37
160.86
145.72
197.68
211.86
131.06
211.86
167.38
22.06
13.18
90

It is clear from the table that the radon activity varies from 3091.43 Bq rn'Mo 4997.14
Bq m''' with an average value of 3948.19 Bq m"''. Exhalation rate varies from 1111.44
mBq m' h'' to 1796.59 mBq m" h'' with an average value of 1419.47 mBq m" h '
while effective dose equivalent varies from 131.06 |iSv y"' to 211.86 fxSv y ' with
an average value of 167.38 \iS\ y'' . The lowest value was found for the soil samples
collected from R.R. 37 while the maximum value was found to be for the soil sample
collected from Ingraham School, New Colony. The higher values of radon exhalation
rates may be due to presence of fly ash in the soil from Kasimpur Thermal Power
Plant in the soil. Fig 3.5 presents the frequency distribution chart of exhalation rate of
different samples studied.
I Count
u.
1 0 1.2 1.4 16 18 2 0 2 2
Exhalation rate(Bq m" h"')
Fig 3.5 Frequency distribution of radon exhalation rates from soil sanipIes(difTerent places) surrounding the Kasimpur thermal power plant.
91

3.2.6 Radon exhalation rate and radiation doses from soil samples from inside and outside the Kasimpur Thermal Power Plant.
To compare the radon exhalation rates of soil from inside and just outside the power
plant, about 20 samples of soil were collected.
Results and Discussion
The data obtained from the measurements are presented in Table 3.5
Table 3.5
Radon activity concentration, radon exhalation rate and indoor inhalation exposure (radon)-effective dose from soil samples from inside and outside the Kasimpur Tthermal Power Plant
Samples
SI
S2 S3 S4 Ss S6 S; Sg S9 Sio
"Sn Sl2 Sl3 Sl4
Sl5 Sl6 Sl7 Sl8 Sl9
S20 Average Value S.D.
R.S.D%.
Track Density (track/cm^ d)
I 285.92
0 225.44 200.96 200.48 176.00 195.36 272.8 231.52 172.96 251.04 260.00 199.36 206.08 277.06 252.8 258.72 258.72 242.72 256.00 248.00 230.84
32.77 14.19
Radon Activity (Bq m" )
nside Power Plant 5105.71
utside Power Plant 4025.71 3588.57 3580.00 3142.86 3488.57 4871.43 4134.29 3088.57 4482.86 4642.86 3560.00 3680.00 4957.14 4514.29 4620.00 4620.00 4334.29 4571.43 4428.57 4122.71
585.87 14.21
Exhalation rate (mBq
m- h')
1835.63
1447.34 1290.18 1287.09 1129.93 1254.23 1751.39 1486.38 1110.42 1611.69 1669.22 1279.91 1323.05 1782.21 1622.99 1661.00 1661.00 1558.28 1643.54 1592.18 1482.21
210.63 14.21
Effective dose equivalent (fiSv
y-')
216.45
170.67 152.14 151.77 133.24 147.89 206.53 175.28 130.94 190.05 196.84 150.93 156.02 210.16 191.38 195.87 195.87 183.75 193.81 187.75 174.78
24.84 14.21
92

It is clear from the table that the radon activity for soil samples inside power plant is
5105.71 Bq m"'' .exhalation rate 1835.63 mBq m' h ' and effective dose equivalent
216.45 \iS\ y"' .while outside power plant radon activity varies from 3088.57 Bq m"
to 4957.14 Bq m''' with an average value of 4122.71 Bq m' ; exhalation rate varies
from 1110.42 mBq m" h"' to 1782.21 mBq m" h"' with an average value of 1482.21
mBq m' h'' while effective dose equivalent varies from 130.94 \iSw y"' to 210.16 iSv
y'' with an average value of 174.78 nSv y"'. The lower values were found for the soil
samples collected from outside the Power Plant as compared to the value for the soil
sample collected from inside the Plant. The higher value of radon exhalation rate of
soil inside Power Plant may be due to the presence of large amount of fly ash
collected there. Fig 3.6 presents the frequency distribution chart of exhalation rate of
different samples investigated.
I Count
>; 15
u. 1.0
10 12 14 16 18 2 0 22
Exhalation rate(Bq m' h')
Fig 3.6 Frequency distribution of radon exhalation rates from soil samples from inside and outside the Kasimpur Thermal Power Plant
93

3.2.7 Radon exhalation rate and radiation doses from soil samples collected from 50m away from Kasimpur Thermal Power Plant
About 20 samples of soil were collected about 50 m away from Kasimpur Thermal
Power Plant to investigate the effect of fly ash spread out from the plant on the nearby
soil.
Results and Discussion
Table 3.6 Presents the measured data for the soil samples collected from the places
50m away from the power plant.
Table 3.6
Radon activity concentration, radon exhalation rate and indoor inhalation exposure (radon)-en'ective dose from soil samples 50 m away from Kasimpur thermal power plant, India
S.No.
1
2
3 4 5 6 7 8 9 10 11 12 13 14 15 16 17 18 19 20 Average value S.D R.S.D%
Track Density (track/cm^ d)
285.92
216.00
209.6 247.2 243.68 185.76 121.76 155.36 170.72 245.28 274.72 224.00 250.24 229.44 223.68 235.2 236.2 253.28 243.84 120.32 215.07
44.19 20.55
Radon Activity (Bq m-')
Inside Power Plant 5105.71
Outside Power Plan 3857.14
3742.86 4414.29 4351.43 3317.14 2174.29 2774.29 3048.57 4380.00 4905.71 4000.00 4468.57 4097.14 3994.29 4200.00 4222.86 4522.86 4354.29 2148.57 3840.75
789.41 20.55
Exhalation rate (mBq m-H')
1835.63 t
1386.73
1345.65 1587.04 1564.44 1192.59 781.71 997.42 1096.03 1574.72 1763.72 1438.09 1606.56 1473.02 1436.04 1510.00 1518.22 1626.08 1565.47 772.46 1380.84
283.81 20.55
Effective dose equivalent (fiSv
216.45
163.52
158.68 187.15 184.48 140.63 92.18 117.62 129.24 185.69 207.98 169.58 189.45 173.69 169.34 178.06 179.03 191.75 184.60 91.09 162.83
33.47 20.56
94

The radon activity for soil samples inside the power plant is 5105.71Bq m"
,exhalation rate 1835.63 mBq m" h'' and effective dose equivalent 216.45^Sv y"',
while from a distance of 50m away from power plant, radon activity varies from
2148.57 Bq m" to 4905.71 Bq m" with an average value of 3840.75 Bq m" ,
exhalation rate varies from 772.46 mBq m' h'' to 1763.72 mBq m" h ' with an
average value of 1380.84 mBq m" h"' while effective dose equivalent varies from
91.09 ^Svy"' to 162.83 fiSvy"' with an average value of 162.83 tiSvy"'. The fly ash
spread over the soil in nearby places of the plant lowers the values of radon activity
and radon exhalation.
Fig 3.7. presents the frequency distribution chart of exhalation rate of different
samples studied.
0.0 0.2 0.4 0.6 0.8 1.0 12 14 1.6 1.8 20
Exhalation rate(Bq m" h"')
Fig 3.7 Frequency distribution of radon exhalation rates from soil samples 50 m away from Kasimpur thermal power plant from soil samples
95

3.2.8 Radon exhalation rate and radiation dose from soil samples collected from nearby Panki thermal power plant
About 27 samples of soil were collected from the places near another Thermal Power
Plant at Panki(U.P.) for comparison with those from Kasimpur thermal Power Plant.
Table 3.7 presents the result of measurements.
Table 3.7
Radon activity concentration, radon exhalation rate and indoor inhalation exposure (radon)-effective dose in soil samples near Panki thermal power plant, India
S.No.
1
2 3 4 5 6 7 8 9 10 11 12 13 14 15 16 17 18 19 20 21 22 23 24 25 26 27
Average value S.D
R.S.D%
Track Density (track/cm^ d)
276.32
C 247.2
226.08 229.6
222.56 234.72
173.76 186.72
176.00 197.28 173.28
189.28
192.00
206.88 220.00
216.00
198.56
204.48
182.88 219.36
209.92
258.08
249.76 214.08 226.24 174.88
238.08
210.29 24.81
11.79
Radon Activity
(Bq m')
inside Power Plant 4934.29
>utside Power Plant
4414.29 4037.14
4100
3974.29
4191.43 3102.86
3334.29 3142.86
3522.86 3094.29
3380.00
3428.57
3694.29 3928.57
3857.14
3545.71
3651.43 3265.71 3917.14
3748.57
4608.57 4460.00
3822.86 4040.00 3122.86
4251.43
3755.28 443.10
11.79
Exhalation
rate (m Bq
m-^h')
1773.99
1587.04
1451.45
1474.05
1428.85
1506.92
1115.55 1198.76
1129.93 1266.55 1112.47
1215.19
1232.65
1328.19 1412.42
1386.73
1274.77
1312.78 1174.10 1408.31
1347.70
1656.89 1603.48
1374.41 1452.48 1122.74
1528.49 1350.11 159.31
11.79
Effective dose equivalent (^Sv
V)
209.19
187.15
171.16 172.77
167.47
177.69 131.55
141.36 133.24
149.35 131.18
143.29
145.36
156.62
166.55 163.52
150.32
154.80 138.45 158.92
166.07
195.38
189.08 162.07 171.28 132.39
180.24
159.13 18.73
11.77
96

Radon activity for soil sample from inside of the power plant is 4934.29 Bq m \
exhalation rate 1773.99 mBq m" h'' and effective dose equivalent 209.19 ^Sv y'',
while outside power plant radon activity varies from 3094.29 Bq m' to 4608.57 Bq
m' with an average value of 3755.28 Bq m" .exhalation rate varies from 1112.47
mBq m' h'' to 1656.89 mBq m" h'' with an average value of 1350.11 mBq m" h"'
while effective dose equivalent varies from 131.18 jiSvy'' to 195.38 ^Svy'' with an
average value of 159.13 (iSv y"'. The maximum value was found to be for the soil
sample inside Panki thermal power plant as also observed in the case of Kasimpur
thermal power plant.
Fig3.8 shows the frequency distribution chart of exhalation rate of different samples
studied.
I Count
Exhalation rate(Bq m" h')
Fig 3.8 Frequency distribution of radon exhalation rates in soil samples nearby Panki thermal power plant.
97

3.2.9 Radon Exhalation rate and radiation dose from soil samples collected from Jaduguda U-mines area (East Singhbhum Shear Zone), Jharkhand, India.
The natural radioactivity in soil comes from U, Th and from natural K. Some
other terrestrial radionuclides, including those of the •' U series, *'Rb, ' *La, ''' Sm
and ' *Lu exist in nature but at such low levels that their contributions to the dose in
the humans are small. Artificial radio nuclides can also be present such as ' ^Cs,
resulting from fallout from weapons testing. The radiological implication of these
radio nuclides is due to the gamma ray exposure of the body and irradiation of lung
tissue from inhalation of radon and its daughters. Therefore, the assessment of
radiation dose from natural sources is of particular importance as natural radiation is
the largest contributor to the external dose of the world population (UNSCEAR,
1988).
Jharkhand state of India is rich in minerals and is called the store house of
minerals. There are huge deposits of bauxite, mica and coal along with iron, copper,
chromites, tungsten, lime stone, feldspar and quartz etc. Naturally occurring radio
nuclides of terrestrial origin ( *U, ^ Th and ''°K) are present in the earth's crust since
its origin and are found in almost all types of soil, rocks, sand and water. About 12
samples of soil were collected for the measurement. Radon exhalation rates from soil
samples from East Singhbhum shear zone near U-mining area of Jharkhand state of
India have been measured using sealed can technique I.
98

Results and Discussion
Values of radon activity concentration, radon exhalation rate and indoor
inhalation exposure (radon)-effective dose from soil samples are presented in
Table 3.8
Table 3.8
Radon activity concentration, radon exhalation rate and indoor inhalation exposure (radon)-effective dose in soil samples from East Singhbbum shear zone near U-mining area of Jbarkhand state of India
Sample Code
JS-1
JS-7
JS-12
JS-13 JS-17 JS-19 JS-21 JS-22
JS-23 JS-24
JS-25
JS-26
Min Max
Average value S.D
R.S.D%
Location of Samples
Near Jaduguda limine
Gamaharia Main Market
Tata Swam Rakha River Chanduka Mines
Tata Outer-I Tata Telco
B-Block Bokaro Bokaro Stone
mines River side Bokaro
Sector IX-D Bokaro
Secton IX-C Bokaro
Sector IX-Bokaro
Track Density (track/cm^ d)
234.88
227.20
253.28
212.48 249.76 220.16 269.12 253.12
244.00 260.00
243.36
273.93
212.48 273.93 245.11
18.83 7.68
Radon Activity (Bqm-*)
4194.29
4057.14
4522.86
3794.29 4460 3931.43 4805.71 4520
4257.14 4642.86
4345.71
4891.43
3794.29 4891.43 4368.57
337.91 7.70
Exhalati on rate (mBq m- b" )
1507.95
1458.64
1628.08
1364.14 1603.48 1413.44 1727.77 1625.05
1566.49 1669.22
1562.39
1758.59
1364.14 1758.59 1573.77
120.93 7.68
Effective dose equivale nt(^Sv
177.82
172.00
191.75
160.86 189.08 166.67 203.74 191.63
184.72 196.84
184.24
207.37
160.86 207.37 185.56
14,25 7.68
99

It is clear from the table that the radon activity for soil(near U-mining area) samples
varies from 3794.29 Bq m"' to 4891.43 Bq m"'' with an average value of 4368.57 Bq
m' , exhalation rate varies from 1364.14 mBq m' h'' to 1758.59 mBq m^h' with an
average value of 1573.77 mBq m" h"' while effective dose equivalent varies from
160.86 iSv y"' to 207.37 jiSv y"' with an average value of 185.56 ^Sv y"' . The
maximum value was found to be for the sector IX, Bokaro. The higher values of
radon exhalation rate may be due to the grain size and the uranium concentration. Fig
3.9 shows the frequency distribution chart of exhalation rate of different samples.
Exhalation rate(Bq m" h")
Fig 3.9 Frequency distribution of radon exhalation rates in soil samples from East Singhbhum shear zone near U-mining area of Jharkhand state of India.
100

3.2.10 Measurement of Radon Exhalation Rate and Radiation Doses from some
Building Construction Materials.
For the measurements 19 samples of building materias used in construction activities
in this region of India were collected from various sites. In the present investigations
radon exhalation rates from some building materials lilce fly ash, cement, slag. Bottom
ash, Sand, Bazari, Badarpur and flooring tiles have been estimated using sealed can
technique I.
Results and Discussion
The values of radon exhalation rate and effective dose equivalent in different building
materials are given in Table 3.9
Table 3.9
Radon activity concentration, radon exhalation rate and effective dose equivalent in some building construction materials
Details of samples
Fly ash Fly ash Slag Slag Bottom ash Bottom ash JP cement Shri Altra cement Ambuz cement Birla Shakti cement Birla Plus cement A.C.C. cement Sand Sand Sand Badarpur Bazari Flooring tiles Flooring tiles
Track Density (track/cm^ d)
139.84 114.72 233.76 178.56 143.36 151.52 46.24 89.76 71.52 50.4 41.92 55.04 121.76 113.92 120.48 156.64 104.8 36.16 42.72
Radon activity (Bq mO
2497.14 2048.57 4174.29 3188.57 2560.00 2705.71 825.71 1602.86 1277.14 900.00 748.57 982.86 2174.29 2034.29 2151.43 2797.14 1871.43 645.71 762.86
Exhalation Rate (mBq m'
897.78 736.51 1500.76 1146.37 920.38 972.77 296.86 576.27 459.16 323.57 269.13 353.36 781.71 731.38 773.49 1005.64 672.82 386.47 456.58
Effective dose
equivalent (nSv y-*)
105.87 86.85 176.97 135.18 108.53 114.71 35.01 67.95 54.14 38.16 31.74 41.67 92.18 86.24 91.21 118.59 79.34 45.57 53.84
101

3.3 Measurement of radon exhalation rate and estimation of radiation doses from solid blocks of building materials i.e. mosaic, granite, ceramic tiles, bricks.
In the present investigations radon exhalation rates from mosaic, granite, ceramic
tiles, bricks used in the construction of buildings and collected from different places
of India were carried out through sealed can technique II using LR-115 type II as
track detectors.
3.3.1 Experimental detail
(a) Experimental technique(Can technique H)
Cylindrical plastic can of 7.5cm height and 7.0 cm diameter was sealed to the
individual samples by plasticin (FigS.lO). In each can a LR-115 type II plastic
detector (2cm x 2cm) was fixed at the top inside of the can, such that the sensitive
surface of the detector faces the material and is freely exposed to the emergent radon.
Radon decays in the volume of the can record the alpha particles resulting from the Po
'* and Po ''* deposited on the inner wall of the can. Radon and its daughters will
reach an equilibrium in concentration after one week or more. Hence the equilibrium
activity of the emergent radon can be obtained from the geometry of the can and the
time of exposure. The detectors were exposed to radon for 100 days. After the
exposure the detectors were etched in 2.5 N NaOH at 6Q°C in a constant temperature
water bath for revelation of tracks. The resulting alpha tracks on the exposed face of
the track detector were counted using an optical microscope at a magnification of
400X. The radon exposure inside the can was obtained from the track density of the
detector by using calibration factor of 0.56 tracks cm" d"' obtained from an earlier
calibration experiment (Singh et al, 1997).
102

LR-115 Type n Nuclear Track Detector
-Plastic Can
JBuilding Material
Figure 3.10: Assembly for the measurement of radon exhalation rate using "Can
technique 11"
The exhalation rate is found from the expression (Fleischer and Morgo-Campero,
1978; Khan etal, 1992):
CVX Ex =
Where,
Ex
V
X
T
A
AlT + jie"-!)]
Radon Exhalation rate (Bq m' h"')
Integrated radon exposure as measured by LR-115 type II
solid state nuclear track detector (Bq m- h'').
Volume of can (m )
Decay constant for radon (h'')
Exposure time (h)
Area covered by the can (m )
103

(b) Risk estimates
The risk of lung cancer due to radon and its daughters from these materials used as
building materials can be estimated from the radon exhalation rate. The details are
given in the previous article 3.2.1©
3.3.2 Radon exhalation rate and radiation doses from granite samples.
Knowledge of natural radiation emitted from the building materials are of particular
interest as radiation from building materials are main contributors to radiation
exposure to the human beings. Building materials may be the possible serious source
of radiation exposure in particular if they contain large amount of naturally occurring
radionuclides or man made radionuclides (Radiation Protection 112, 1999, Nuclear
Energy Agency 1979). In addition to soil and water building construction materials
can be the significant contributor (Bertrand et al. 1994; Durrani and Ilic, 1997) of
indoor radon in the dwellings. Radon emanation from building materials has been the
subject of many studies (Bertrand et al, 1994; Durrani and Ilic, 1997; Lubin and
Boice, 1997; Mahur et al; 2005, Al Garallah et al, 2001). studies of radon exhalation
from building material, is important for the estimation of public exposure as people
spend most of their time (~ 80%) indoors (Stoulos et al, 2003). Further more, it is
useful in setting the standards and national guidelihes with regard to the international
recommendations and in assessing the associated radiation hazard. Especially due to
radon inhalation, leading to deposition of its decay products in the respiratory tract.
During the past few year, lot of attention has been devoted to the control of
natural radiation in building materials in European, Asian and some African countries
- (Malanca et al 1995, Khan and Tyagi, 1994, Giuseppe et al, 1996, Ahmad and
Hussein, 1997 UNSCEAR, 1988, Al Jurallah et al, 2001, Muhammad et al, 2001,
Sroor et al 2001, Kovler et al, 2002, Petropoalos et al 2002, Stoulos et al 2003, Arafa
104

2004, Mahur et al, Env. Geochi 8 (2005) 300, Anjos et al, 2005, Ngachin et al, 2006).
Construction materials are sources of airborne radioactivity and external radiation
from the decay series of uranium in buildings.
Radon exhalation ( ^ Rn) from these materials of interest since the short-lived
decay products of radon are the greatest contributors to the lung dose of inhaled
radionuclides. Recently India is becoming a relative large market for local and foreign
granite usage. Granites are widely used for tiling of houses and flooring materials.
Even old houses are renovated by replacing the conventional tiles with granites.
Granites are most abundant igneous rocks and due to their properties such as
color variety heat and scoratch resistance have multiples uses such as work-surface,
flooring and internal cladding (Anjos et al, 2005, Fokianos et al, 2005). In terms of
natural radioactivity granites exhibit enhanced concentration of uranium (U) and
thorium (Th) as compared to the very low abundance of these elements observed in
the mantle and the crust of the Earth (Mason and Moore, 1982; Tzortzis Tsertos,
2004). Certain granites are typical of uranium bearing natural materials. (Aljarallah,
2001; Mahur etal, 2005).
In the present study the estimation of radon exhalation rates from granite
samples used in construction activities in India was carried out using sealed can
technique. Effectively dose equivalents were calculated from the radon exhalation
rates. A total of 21 different type of the main commercial granites were collected
from the local stone market. The samples were classified in accordance to their
colours, site of extraction and minerological compositions. Can technique (Abu-Jarad
et al, 1980, Rawat et al, 1991) was used for the measurements of raodn exhalation
rates.
105

Results and Discussion
Table 3.10 presents the results of measured data for radon exhalation from different
granite samples.
Table 3.10
Radon activity, radon exhalation rate and effective dose equivalent in different
types/colours of granite samples
S.No.
1 2 3 4 5 6 7 8 9 10 11 12 13 14 15
16
17 18 19 20 21
Types/Colours of granite
Green, Black and White Manjholi Katni gray and Pink Oman Yellow Katni cream Pink granite Sunvar Black Black, Pick and white Black and white Black and green Orange, Black and white Gray, Orange and Brown Black, Brown, White-I and Gray Brown, Gray, Black and white-II Ruby red Wonder Marble White-II Black-I Blac
Min Max Average value S.D. R.S.D%
k-II
v..
Radon Activity (Bq m" )
522.86 624.29 442.86 511.43 841.43
4258.57 481.43 494.29 541.43
3008.57 3098.57 468.57
3070.00 2837.14 2832.86
2247.14
3334.29 712.86 515.71 380.00 435.71 380.00
4258.57 1507.62
1316.23 67.31
Radon exiialation rate (mBq m' h'
312.93 373.65 265.06 306.09 503.61
2548.81 288.14 295.84 324.05
1800.67 1854.54 280.45 837.44
1698.07 1695.51
1344.95
1995.62 426.66 308.66 227.44 260.78 227.44
2548.81 854.71
758.09 88.69
Effective dose equivalent (uSvy-')
36.90 44.06 31.26 36.09 59.39
300.56 33.98 34.89 38.21
212.34 218.69 33.07 98.75
200.24 199.94
158.59
235.33 50.31 36.39 26.82 30.75 26.82
300.56 100.79
89.39 88.69
106

Radon activity varies from 380.00 Bq m" to 4258,57 Bq m' with an average value of
1316.23 Bq m'\ exhalation rate varies from 227.44 mBq m' h"' to 2548.81
mBq m' h"' with an average value of 854.71 mBq m' h'' while effective dose
equivalent varies from 26.82 nSv y"' to 300.56 |iSv y"' with an average value of
100.79 ^Sv y''. Thus there is a wide variation in radon exhalation rates in granite
samples and it is observed that granites have higher radon concentration and may be
the main source of radon emanation as compared to other building materials such as
cement, sand , bajari and concrete etc. (the results presented earlier). The frequency
distribution of radon exhalation rate from granite samples is given in Fig 3.11 the
distribution seems to be log-normal. Granites can be a significant source of radon in
houses, when used in tiling large enclosed areas, besides being source of external
gamma radiation from uranium decay series.
• Count
0.5 1.0 1.5 2 0 25
Exhalation rate(Bq m' h"')
Fig 3.11 Frequency distribution of radon exhalation rates from granite samples
107

3.3.3 Radon Exhalation rate and radiation doses from mosaic samples.
In the present study we have made measurement of radon exhalation rate from mosaic
of different brands and colours, commonly used as building construction materials in
India. Samples for investigation were collected from three different major mosaic
producing sites i.e. Jaipur, Kishangarh and Ajmer in the state of Rajasthan, India.
From Kishangarh tiles of different colors were collected. These tiles are
decorative tiles used as wall tiles and also used in interior, exterior, garden and
swimming pools of residential, commercial, multiplexes, Malls, public buildings and
road sides and others. The colours are of permanent nature which are incorporated in
the full size and thickness of the product.
Applications
Wall cladding. Swimming Poll Deck, Landscape Area, Stairways, Sitouts, Walkways,
Internal Floors, Driveways, Foyer Area Corrioors, Skirting, Countyards, Verandahs,
Parches.
Salient Features
High performance, long life, low maintinence, fashionable, save money & time, easy
to lay, sample, eye catching with modern look, less prone to dirt accumulation, least
water adsorption, consistency in colour & textures plus many others.
In order to measure the radon exhalation rate in mosaic used as a building
material, mosaic samples of different brands and colors were collected. Out of total 27
samples collected 10 were from Jaipur, 8 from Kishangarh and 9 from Ajmer.
Results and Discussion
Table 3.11 presents the results of measured data for radon exhalation from various
mosaic samples.
108

Table 3.11
Radon activity concentration, radon exhalation rate and indoor inhalation exposure (radon)-effective dose from mosaic samples
Sample Details
From Jaipur 1. Kasara Marble (Brown) 2. Kasara Marble (Gray with white) 3. Kasara Marble (Light brown with
white) 4. Kasara Marble (Cream with
Brown) 5. Mukesh Marble (light brown) 6. Mukesh Marble (Light yellow) 7. Kota Stone Mukesh Marbles arts
(Gray colour) 8. Mukesh Marble (Brown with
white) 9. Shivshakti Marble (Cream with
Gray) 10. Shivshakti Marble (Cream with
Brown) From Kishangarh (Wall Tiles)
11. Kishangrah (Orange Colour) 12. Galaxio (Red Colour) 13. Galaxio (Cream Colour) 14. Unique (Red Colour) 15. Unique (Cream Colour) 16. Chocobar (Red Colour) 17. Chocobar (Gray colour) 18. Fancy (Cream with Red Wonder)
From Ajmer 19. Red Colour 20. Gray with White 21. White 22. Cream 23. Gray Dark 24. Light Gray 25. Brown with white 26. White, yellow, brown. Green 27. White, Brown, Gray, Phirozi Min Max. Average Value S.D. R. S. D.%
Track Density (track/cm^ d)
56.32 35.04 69.44
64.00
73.92 65.76 45.60
70.72
56.48
45.60
39.52 35.36 61.60 38.40 27.52 36.96 51.68 31.68
77.60 66.24 101.12 49.76 40.64 69.6 64.48 45.76 62.88 27.52 101.12 54.95 17.12
Radon activity (Bqm-5)
1005.71 625.71 1240.00
1142.86
1320.00 1174.29 814.29
1262.86
1008.57
814.29
705.71 631.43 1100.00 685.71 491.43 660.00 922.86 565.71
1385.71 1182.86 1805.71 888.57 725.71 1242.86 1151.43 817.14 1122.86 491.43 1805.71 981.27 305.66
Radon Exhalation
Rate (mBq m'
601.93 374.49 742.16
684.02
790.04 702.83 487.36
755.84
603.64
487.36
422.38 377.92 658.37 410.41 294.13 395.02 552.34 338.59
829.37 707.96 1080.74 531.82 434.35 743.87 689.15 489.07 672.05 294.13 1080.74 587.30 182.94
31.16 34.15 31.15
Effective dose
equivalent (nSvy')
70.98 44.16 87.52
80.66
93.16 82.88 57.47
89.13
71.18
57.47
49.81 44.56 77.64 48.39 34.68 46.58 65.13 39.93
97.80 83.48 127.44 62.71 51.22 87.72 81.27 57.67 79.25 34.68 127.44 69.26 21.57 31.14
109

Radon activity varies from 27.52 Bq m"Mo 101.12 Bq m' with an average value of
54.95 Bq m'\ exhalation rate varies from 491.43 mBq m" h ' to 1805.71mBq m'^h''
with an average value of 981.27 mBq m' h"' while effective dose equivalent varies
from 34.68 ^Sv y'' to 127.44 nSv y ' with an average value of 69.26 nSv y''. Thus
radon emanation from mosaic samples shows a wide variation and the values are quite
less than from the granite samples. It is observed that mosaic used for the same
purpose as granite in building construction may have less radiation risk. The
frequency distribution of radon exhalation rate from mosaic samples is given in Fig
3.12. The distribution does not seem to be lognormal.
0.2 0.4 0.6 0.8 1.0 1.2
Exhalation rate(Bq m" h"')
Fig 3.12 Frequency distribution of radon exhalation rates from mosaic samples
10

3.4 Effect of plastering and paints on the radon exhalation rate and radiation
doses from fired bricks.
Radon appears mainly by diffusion processes from floors, walls and ceilings which
are constructed with cement, sand and other buildings materials. Bricks are made
from soil and fired in Kilns. These bricks are used in the construction of walls of the
house and then the walls are plastered with a mixture of cement and sand.
Construction materials are one of the major sources of indoor radon concentration in
dwellings and largely contribute to the domestic radiation dose rates received by
humans (Lowder et al, and Mcaughlin et al). The walls and roofs are painted with
different kind of paints and may affect the radon exhalation from these construction
materials. As different brands of paints are available in the market and widely used as
a cover for plastered bricks for increasing the life and for ornamental purpose, the
study is important for understanding the effect of the wall coverings on radon
exhalation from the building materials.
In order to investigate the effect of paints available in the market on the radon
exhalation rate from building materials, several bricks were collected. These bricks
were plastered with a mixture of cement and sand. Before measurements bricks were
dried for 24 hours. These plastered bricks were then coated with white wash and again
dried for 1-2 hours. After drying the bricks were coated with different brands and
colors of paints. Radon exhalation rates measurements were carried out for these
painted bricks through sealed can technique II using LR-115 type II detectors.
Results and Discussion
Radon activity and radon exhalation rate are measured from unplastered brick,
plastered brick and plastered bricks painted with different brands and colors of paints.
Computed values of radon activity, radon exhalation rate and effective dose
equivalents are presented in Table 3.12
111

.Table 3.12
Radon activity concentration, radon exhalation rate and efTective dose equivalent
from plastered and painted fired bricks.
Brands/ Colours of Paints
Unplastered Brick
Plastered Brick Gold
Oxford Blue P.O. Red Black Yellow Bus Green
King Lac Black Crimson Bus Green P.O. Red Gold yellow 0.x. Blue Phirozi White
Ganga Silver Asian paints Golden Yellow Phirozi Orange Red Blue Bus Green
Ampro Bus Green White Phirozi Golden Yellow Red
Berger Black Bus green Phirozi Blue Golden yellow Snow white
Touch Silver
Traclc Density (track/cm^d)
65.44
80.00
79.84 70.08 68.96 94.24 62.88
62.24 69.28 70.56 68.64 69.28 64.00 52.00 74.24
62.24
64.8 51.04 80.16 55.84 59.52 73.12
61.76 64.96 60.48 53.28 51.36
47.36 57.44 61.28 85.76 70.56
53.76
Radon activity (Bqm^) 1168.57
1428.57
1425.71 1251.43 1231.43 1682.86 1122.86
1111.43 1237.14 1260.00 1225.71 1237.14 1142.86 928.57
1325.71
1111.43
1157.14 911.43 1431.43 997.14 1062.86 1305.71
1102.86 1160.00 1080.00 951.43 917.14
845.71 1025.71 1094.29 1531.43 1260.00
960.00
Exhalation Rate (mBq m'
699.41
855.02
853.31 748.99 737.03
1007.22 672.05
665.21 740.45 754.13 733.60 740.45 684.02 555.76 793.46
665.21
692.56 545.50 856.73 596.80 636.14 781.49
660.08 694.28 646.39 569.44 548.92
506.17 613.90 654.95 916.58 754.13
574.57
Effective Dose equivalent
82.48
100.82
100.62 88.32 86.91
118.77 79.25
78.44 87.31 88.93 86.51 87.31 80.66 65.54 93.54
78.44
81.67 64.33 101.03 70.38 75.01 92.15
77.84 81.87 76.22 67.15 64.73
59.69 72.39 77.23 108.08 88.93
67.75
12

It can be seen from the Table 3.12 that radon emanation is reduced by plastering. The
effect of paints is not significant although different brands and colors of paints affect
the values by different amounts. The change may be due to different amounts of U
concentration in the plastering materials and paints, and porosity of the material
(Folkerts et al,). Radon activity varies from 845.71 Bq m' to 1531.43 Bq m' .. Radon
exhalation rate varies from 506.17 mBq m' h'' to 916.58 mBq m' h"' whereas the
effective dose equivalent for radon decay products vary from 59.69 nSv y ' to 108.08
fiSv y'' . Radon exhalation is found to increase slightly with golden (yellow), Asian
(orange) and Berger (yellow& snow white) while it decreases with others. UNSCEAR
2000 has reported the exhalation rates from walls and floor of half slab thickness 0.1
m and 0.05 m as 5760 mBq m' h"' and 2860 mBq m" h"' respectively. The values
reported in the present study are less than these values.
3.4.1 Effect of fly ash additives in soils
In order to study the effect on the radon exhalation rates by adding different
amount of fly ash, a separate experiment was performed to measure the exhalation
rate of radon from a homogenous mixture of fly ash and soil. For this purpose,
different percentage of fly ash was introduced into the soil and keeping the total
weight of the sample constant. All the samples were dried and sieved through a 100
mesh sieve before mixing homogenously.
In the present investigations radon exhalation rates for fly ash additive soil
collected from Kasimpur thermal power plant were carried out sealed through sealed
can technique II using LR-115 type II detectors.
Result and Discussion
The values of radon activity, radon exhalation rates and effective dose equivalent
from the fly ash additive soil samples are given in Table 3.13
113

Table 3.13
Radon exhalation rate from soil with different amounts of fly ash (expressed in
% by weight) substituted into the samples of equal total weight
s. No.
1
2
3
4
5
6
Rado
Sample soil
ASo
AS,
AS2
AS3
AS4
AS5
n activity w
Flyash additive
(%)
0
10
20
30
40
50
as found to ^
Track Density (track/cm* d)
277.6
276
266.08
265.12
212.96
189.44
/ary from 3382.9
Radon activity (Bq mO
4957.14
4928.57
4751.43
4734.29
3802.86
3382.86
Bq m"' to 495
Exhalation Rate (mBq
m- h-*)
1782.21
1771.94
1708.25
1702.09
1367.22
1216.24
Effective dose
equivalent (jiSvy-*)
210.16
208.95
201.56
200.71
161.22
143.42
7.1 Bq m'' exhalation rate
varied from 1216.2 mBq m" h'' to 1782.2 mBq m' h'', whereas the effective dose
equivalent varies from 143.4 jiSv y"' to 210.2 jxSv y"'. The effect of fly ash as an
additive to building materials has been studied by several groups and conflicting
results have been reported by different workers. Stranden (1983) and Moraziotis
(1985) reported a reduction in radon exhalation in concrete with fly ash as additive.
The data of Siotis and Wrixon (1984) on cement with different amounts of fly ash
additive in it contradict these results. Ulbak et al(1984) and Karmadoost et al (1988)
concluded that no significant change was found in soil samples after the addition of
fly ash. To investigate statistically relative correlation on the use of fly ash additive,
we have applied t-test to our measurements.
114

Gradual decrease has been observed in the samples having fly ash as an
additive in soil samples. However, experimental values for mixtures of fly ash and
soil are then the values expected from an arithmetic computation based on related
proportions of fly ash and soil. This shows that values for the mixture decrease if the
additive has lower exhalation rate than the base material. This may be due to the
emanation powers of different materials and perhaps, some difference in the grain size
of the materials. The observation can be utilized in suppressing the radon emanation.
The variation of exhalation rate with (%) of fly ash additive is shown in Fig 3.13.
ASO AS1 AS2 ASS AS4 ASS
Fig 3.13 Variation of exhalation rate from soil with different amounts of fly ash (expressed in % by weight) substituted in to samples of equal total weight
115

REFERENCES
Abu-Jarad, F; Fremlin, J.H; Bull, R; 1980. A study of radon emitted form construction
materials using plastic track detectors. Phys. Med. Biol. 25,483-694.
Abumurad, K.M; Al-Tamini, M.H; 2005. Natural radioactivity due to radon in soum
region, Jordan. Radiation Measurements 39, 77-80.
Abumurad, K.M; Tamimi, M. Al; 2001. emanation Power of radon and its
concentration in soil and rocks. Radiation measurements 34,423-426.
Adrovic, F; Proki, M; Ninkovi, M.M; Glisi, R; 2004. Measurement of environmental
background radiation at location of coal fired power plants. Radiation protection
dosimetery Vol. 112, No. 3, Oxford University Press.
Ajay, I.R; Kuforiji, 0.0; 2001. Natural radioactivity measurements in rock samples of
ondo and Ekiti states in Nigeria. Radiation measurement 33,13-16.
Akhtar, Nasim; Tufail, M; Ashraf, M; Iqbal, M. Mohsin 2005. Measurement of
environmental radioactivity for estimation of radiation exposure from saline soil
of Lahore, Pakistan. Radiation measurements 39-,l 1-14.
Al-Jarallah, M.I., Abu Jarad, F; Fazal-ur-Rehman 2000. Determination of radon
exhalation rates from tiles using active and passive techniques. Radiat. Meas. 34
(1-6), 491-495.
Al-Jarallah, M; 2001. Radon exhalation from granite used in Saudi Arbia. A. Environ.
Radioactivity 53(1), 91-98.
Baba 2002. Assessment of radioactive contaminants by - products from yatagan
(mugla, Turkey) Coal- fired power plant. Environ. Geol. 41,PP. 916-921.
Baixeras, C; Erlandsson, B; font, LI; Jonsson, G; 2001. Radon emanation from soil
samples. Radiation measurements 34,441-443.
116

Baytas, A. Filiz; Akbal, Sevgi; 2002. Determination of soil parameters by gamma-ray
transmission. Radiation measurement 35, 17-21.
Bool, S.W., Hole, Mogracxen, 1976. Soil Genesesis and Classification, 3, 288-314.
Chauhan, R.P; Chakarvarti, S.K; 2002. Radon diffusion through soil and fly ash effect
of compaction radiation measurement 35, 143-146.
Diyum, Chen; Xingbao, Yoi, Ruiying, Hu; 2005. Indoor radon survey in indoor
environment in Zhuhai city, China. Radiation measurements 39, 205-207.
Dragovic, S; Jankovic, LJ; Onjia, A; Bacic, G; 2006. Distribution of primordial
radionuclides in surface soil from Serbia and Montenegro. Radiation
measurements 41,611-616.
Durrani, S.A; Ilic, R. (Eds.) 1997. Radon measurement by plastic track detectors.
World Scientific, Singapore.
Durrani,. S.A, Ilic, R. (Eds.), 1997. Radon measurement by etched track detectors.
Application in radiation protection, earth sciences, and the environment. World
Scientific, Singapore.
El- Amri, E.A., Al-Jarallah, M.I; Abu-Jarad, F; Rehman, Fazal-ur; 2003. Uniformity
in radon exhalation from construction materials using can technique. Radiation
measurements 36,453-456.
Jojo, P. J; Rawat A; Kumar A; and Prasad, Rajendra, 1993. Enhancement of trace
uranium in fly ash. Nucl. Geophys. 8, PP. 445 - 448.
Jojo, P.J.; Rawat, A; Prasad Rajendra; 1994. Enhancement of Trace Uranium in fly
ash. Nucl. Geophys. Vol. 8, No. 1. pp 55-59.
Jojo, P.J; Rawat, A; Kumar, Ashavani, Prasad, Rajendra; 1993. Trace Uranium
analysis is Indian coal samples using the fission track technique. Nucl. Geophys.
Vol. 7 No. pp: 445-448.
117
Jundi, J. AI; Salah, W; Bawal, MS; Afaneh, F; 2005. Exposure to radiation from the
natural radioactivity in Jordanian building materials. Radiation protection
dosimetry 118(1), 93-96.
Jundi, Jamal Al; 2002. Population dose from terrestrial gamma exposure in areas near
to old phosphate mine, Russaifa, Jordan, Radiation measurements 35, 23-28.
Karmadoost, N.A., Durrani, S.A., fremlin, J.H., 1988. An investigation of radon
exhalation from fly ash produced in the combustion of Coal- Nucl- Tracks
Radiat.Meas. 15,647-650.
Karmdoost, N.A; Durrani, S.A; Fremlin J.R. 1988. in investigation of radon
exhalation from fly ash produced in the combustion of coal Nucl. Tracks Radiat.
Meas. Vol. 15. No. 1 pp: 647-650.
Khan, A.J., Prasad, R; Tyagi, R.K., 1992. Measurement of radon exhalation rate from
some building materials. Nucl. Tracks Radiat. Meas. 20, 609-610.
Kumar, Ajay; Kumar, Mukesh, Mukesh; Singh, Baldev; Singh Surinder; 2003.
Natural activities of U, Th, and k in some Indian building materials.
Radiation measurements 36,465-469.
Kumar, Rajesh, Kumar, Ashawani; Sengupta, D; Prasad, Rajendra; 2003. Study of
radon and its daughters in Thermal Power Plants. Radiation measurement 36,
521-524.
Kumar, Rajesh; Mahur, A.K., Sengupta. D., Prasad, R., 2005. Radon Activity and
Exhalation Rates Measurements in fly ash from a. Thermal Power Plant. Radiat.
Meas.40,PP-638-641.
Kumar, Rajesh; Mahur; A.K; Senugupta, D; Prasad, Rajendra; (2005), Radon activity
and exhalation rates in fly ash from a Thermal Power Plant, Radiation
Measurements 40,638-641.
118

Kumar, Viresh; Ramachandran, T.V; Prasad, Rajendra; 1999. Natural Radioactivity of
Indian building material and by products. Applied radiation and isotopes 51, 93-
96.
Lowder, W.M. 1990. Natural environmental radioactivity and radon gas, In;
Tommasino, L; Furlan, L.G.; Khan, H.A; Mommin, M. (Eds), Radon
Monitoring in radioprotection. Environmental radioactivity and earth sciences,
world scientific, Singapore, pp-1-17.
Lowder, W-M., 1989. Natural environmental radioactivity and radon gas. In;
Tommosino, et al. (Eds.), Radon monitoring in Radio protection; Environmental
Radioactivity and Earth sciences. World Scientific.
Lu, Xinwei; Jia, Xiaodan; Wang, Fengling, 2006. Natural radioactivity of coal and its
by products in the Baoji coal-fired power plant China. Current science, Vol. 91
No. 11, 10.
Mahur A.K; Mishra M., Kumar R, Sengupta D. and Prasad Rajendra, 2007. An
investigation of radon exhalation rate and estimation of radiation doses in Coal
and fly ash Samples. Appl. Radiat. Isotopes (in Press).
Mahur, A.K; Kumar, Rajesh; Mishra, Meena; Sengupta, D; Prasad, Rajendra; 2008.
An investigation of radon exhalation rate and estimation of radiation doses in
Coal and fly ash samples. Applied radiation and isotope 66,401 - 406.
Mahur, A.K; Kumar, Rajesh; Sengupta, D; Prasad , Rajendra; 2005. Estimation of
Uranium, Thorium, Potassium in fly ash samples and total gamma dose emitted
fi-om the ash Pond. NUCAR.
Mahur, A.K; Kumar, Rajesh; Sengupta, D; Prasad, Rajendra; 2008. Estimation of
radon exhalation rate, natural radioactivity and radiation doses ion fly ash
119

samples from Durgapur Thermal Power Plant, West Bengal. India. Journal by
environmental radioactivity XXX, 1-5.
Mandal, A; Sengupta, D; 2005. Radionuclide and track element contamination around
Kolghat thermal Power Station, West Bengal- Environmental Implications
Current science, Vol. 88, No. 4,25.
Mandal. A., and Sengupta. D., 2003 Radio elemental study of Kolghat thermal Power
plant. West Bengal, India. Possible environmental hazards- Environmental
Geology. 44, PP. 80-186.
Marazioris, E.A., 1985. Gamma activity of the fly ash from a Greek power plant and
properties of fly ash in cement. Heath phys. 49, 302-307.
Matiullah, A. Ahad; Rehman, Shakeel-ur-Rehman, Shafiur; Faheem, M; 2004.
Radiation Protection dosimetry 12 (3): 443-447.
Mclaughlin, J.P. 1989. Proc. Intern. Workshop on radon Monitoring in Radio
protection, environmental and Earth sciences. ICTP, Trieste, Italy.
Mehra, Rohit; Singh, Surinder; Singh; Kulwant; Sonkawade, Rajedra; 2007. ' ^ Ra,
Th, and K. analysis in soil samples from some areas of Malwa region,
Punjab, India using gamma ray spectrometry. Environ. Monit Assess Dol
10.1007/s 10661-007-9624-3
Menon, M.R; Lalit, B.Y; Shuklla, V.K; 1987. Natural radioactivity in building
construction materials in India. Bulletin of Radiation Protection, Vol. 10, No. 1
& 2, Jan-June.
Misdaq, M.A; Ktata, A; Bakhch, A; 2000. A new Method for studying the transport of
radon and thoron in various building materials using CR-39 and LR-115 solid
state nuclear track detectors. Radiation measurements 32, 35-42.
120

\Misdaq. M.A. Amghar, A; 2005. Radon and thoron emanation from various marble
materials. Impact on the workers. Radiation measurement 39, 421-430.
Mishra, U., 2004. Environmental impact of Coal industry and thermal Power Plants in
India. J. Environ, radioact., 72,PP. 34 - 40.
Mondal, T; Sengupta, D; Mandal, A; 2006. Natural Radioactivity of ash and coal in
major Thermal Power Plants of West Bengal, India. Current science, Vol. 91,
No. 10,25.
Mustonen, R; 1984. Natural radioactivity in and radon exhalation from Finnish
construction materials Health Physics 1195-1203.
Nain, M., Chauhan, R.P., Kant, k; Chakarvarti, S.K; 2006. Radon exhalation Rates
from some Building Construction Materials using SSNTDs. Chem Environ Res.
15(3&4).
Nazaroff, W.W. Nero Jr. A.V. 1988. Radon and its decay products in indoor Air.
Wiley- interscience, New York.
Nikolaev, V.A; Ilic, R. (Eds). 1999. Etched track radiometers in radon measurements.
Radiat. Meas. 30, I-I3.
Ramachandran, T.V; Lalit, B.Y; Mishra, U.C. 1987. Measurement of radon
permeability through some membranes Nucl. Tracks Radiat. Meas. Vol. 13, No.
1, pp 81-84, Int. J. Radait. Appl. Instrum, Part D Printed in Great Britain.
Ramola, R.C; Kandari, M.S; Rawat, R.B.S; 1997. Assessment of health risk due to
exposure of radon and its daughter products in the lower atmosphere current
science. Vol, 73, No. 9, 10.
Rawat, A; Jojo, P.J. Khan, A.J., Tyagi R.K. Prasad, R., 1991. Radon exhalation rate
in building materials. Nucl. Tarcks Radiat. Meas. 19, 391-394.
121

Russal, M.B., 1957. Physical Properties in soil. US Agricultural year Book,
Washington Dc, pp. 31-88.
S.M. El-Bahi, Health Physics, 86 (5), 517 (2004). Singh, B.P; Pandit, B; Bhardwaj,
V.N; Rail, S. P. Kumar, R; 2006. Measurement of Radium concentration and
radon exhalation rate in some building materials of Raj- Mahal Area. Chem.
Environ. Res. 15(3&4).
Savidou, A; Rapits, C; Kritidis, 1996. study of natural rasdionuclides and radon
exhalation in bricks used in sea region, Greece. J. Environ. Radioactivity 31, 21-
28.
Sharma D.K; Kumar, Ajay; Kumar, Mukherji Singh, Surinder; 2003. Study of
uranium, radium and radon exhalation rate in soil samples from some areas of
Kangra district, Himachal Pradesh, India using Solid-state nuclear track
detectors. Radiation measurements 36, 363-366.
Shukla, V.K. Sadasivan, S; Sundaram, V.K. Nambi, K.S.V; 1994. Assessment of
natural radiation exposure inside a newly constructed building. Proc. 3 '' Natural
symposium on environment, thiruvananthapuram.
Singh, Surinder; Rani, Asha; Mahajan, Rakesh Kumar; 2005. ^ ^Ra, ^ Th and ""k
analysis in soil samples from some areas of Punjab and Himachal Pradesh, India
using gamma ray spectrometry. Radiation measurements 39,431-439.
Siotis, I., Wrixon, A.B., 1984. Radiological consequences of the use of fly ash in
building materials in Greece. Radiat. Prot. Dosim. 7,101-105.
Srivastava, A., Zaman, M.R., Dwivediv, K.K. Ramachandran, T.V. 2001. Indoor
radon level in the dwellings of the Rajshahi and Chuadanga region of
Bangladesh. Radiat. Meas. 34,497-499.
122

Stranden, E., 1983. Assessment of radiological impact of using fly ash in cement.
Health phys. 44, 145-151.
Tzortzis, M; Svoukis, E; Tsertos, H; 2004. A Comprehensive study of natural gamma
radioactivity levels and associated dose rates from surface soils in Cyprus.
Revised version.
Ulbak, K., Jonnassen, J., Backmark, k., 1984. Radon exhalation from samples of
concrete with different porosities and fly ash additives. Radiat. Prot. Dosim. 7,
45-51.
UNSCEAR, 1988. Sources and effects of Ionizing radiation. United Nations Scientific
Committee on the effect of Atomic Radiation, United Nation, New York.
UNSCEAR, 2000. Sources and effects of ionizing radiation. Untied Nations Scientific
Committee on the Effect of Atomic Radiation, United Nations, New York.
123

Cfiaf tef I^

CHAPTER-IV
Measurement of Natural Radioactivity Through Gamma Ray Spectroscopy
4.1 Introduction
Throughout the history of life on earth, organisms continuously have been exposed to
radiations from radionuclides produced by cosmic ray interaction in the atmosphere,
and radiations from naturally occurring substances which are spatially distributed in
all living and non-living components of the biosphere (Whicker and Schultz, 1982).
The earth's heat content is basically provided and maintained by the heat of decay of
these naturally occurring radionuclides (primordial) such as uranium, thorium and
potassium which occur in nature as a complex of oxides, hydrated oxides, carbonates,
phosphates, sulphates, vanadates and silicates (Whicker and Schultz, 1982; Abdi et al;
2006). Naturally occurring radioactive materials (NORM) generally contains
radionuclides found in nature i.e. thorium, uranium, and their progeny. When NORM
becomes concentrated in radionuclides due to human activity, one can speak about
technologically enhanced naturally occurring radioactive materials (TENORM).
All building materials such as concrete, cement, brick, sand, aggregate,
marble, granite, limestone, gypsum, etc. contain mainly natural radionuclides
including uranium ( U) and Thorium ( Th) and their decay products and the
radioactive isotope of potassium ( °K). The naturally occurring radionuclides in the
building materials contribute to radiation exposure, which can be divided into external
and internal exposure. External exposure is caused by direct gamma radiation while
internal exposure is caused by the inhalation of the radioactive inert gas radon ( ^ Rn,
a daughter product of ^ ^Ra) and its short-lived secondary decay products. Knowledge
of the level of natural radioactivity in building materials is then important to assess
124

the possible radiological hazards to human health and to develop standards and
guidelines for the use and management of these materials. Analysis of distribution of
238y 232yj ^i^j 40pr jj crustal materials is very important for solving many geological
problems such as investigations on contribution of these elements to environmental
radioactivity, estimation of radiogenic heat production of the crust and upper mantle
in geothermal problems.
The great interest expressed worldwide for the study of naturally occurring
radiation and environmental radioactivity has led to the performance of extensive
surveys in many countries UNSCEAR (2000). Such investigations can be useful for
both the assessment of public dose rates and the performance of epidemiological
studies, as well as to keep reference data records, to ascertain possible changes in the
environmental radioactivity due to nuclear, industrial, and other human activities.
Natural environmental radioactivity arises mainly from primordial
radionuclides such as k, and the radionuclides from the Th and U series and
their decay products, which occur at trace levels in all ground formations. Primordial
radionuclides are formed by the process of nucleosynthesis in stars and are
characterized by half-lives comparable to the age of the earth. The most commonly
encountered radionuclides are U and Th, their decay products and K.
Knowledge about the distribution pattern of both anthropogenic and natural
radionuclides is essential in maintaining some sense of control in prevailing radiation
levels.
4.2 Measurement of Natural Radioactivity Through Low level Gamma Ray Spectroscopy
Experimental Technique
Gamma ray spectrometric measurements were carried out at Inter-University
Accelerator Centre, New Delhi using a coaxial n-type HPGe detector (EG«&G,
125

ORTEC, Oak Ridge, USA) for estimation of the natural radionuclides, Uranium
( *U), thorium (^^^h) and potassium ( °K). Some details of the technique is
described in Chapter II. The samples were crushed into fine powder by using Mortar
and Pestle. Fine quality of the sample is obtained by using scientific sieve of 150
micron-mesh size. Before measurements samples were oven dried at 110°C for 24h
and the samples were then packed and sealed in an impermeable airtight PVC
container to prevent the escape of radiogenic gases radon ( Rn) and thoron ( Rn).
About 300g sample of each material was used for measurements. Before
measurements, the containers were kept sealed about 4 weeks in order to reach
equilibrium of the ^ *U and ^ Th and their respective progenies. After attainment of
secular equilibrium between U and Th and their decay products, the samples
were subjected to high resolution gamma spectroscopic analysis. HPGe detector
(EG&G, ORTEC, Oak Ridge, USA) having a resolution of 2.0 keV at 1332 keV and a
relative efficiency of 20% was placed in 4" shield of lead bricks on all sides to reduce
the background radiation from building materials and cosmic rays ( Kumar et, al;
2001). The detector was coupled to a PC based 4K multi channel analyzer and an
ADC for data acquisition.
The calibration of the low background counting system was done with a
secondary standard which was calibrated with the primary standard (RGU-1) obtained
from the International Atomic Energy Agency (IAEA). The efficiency for the system
was determined using secondary standard source of uranium ore in the same geometry
as available for the sample counting. For activity measurements the samples were
counted for a period of 72000 seconds. The activity concentration of *°K (CK) was
measured directly by its own gamma ray of 1461 keV. As •' U and •' Th are not
directly gamma emitters, their activity concentrations (Cu and CTH) were measured
126
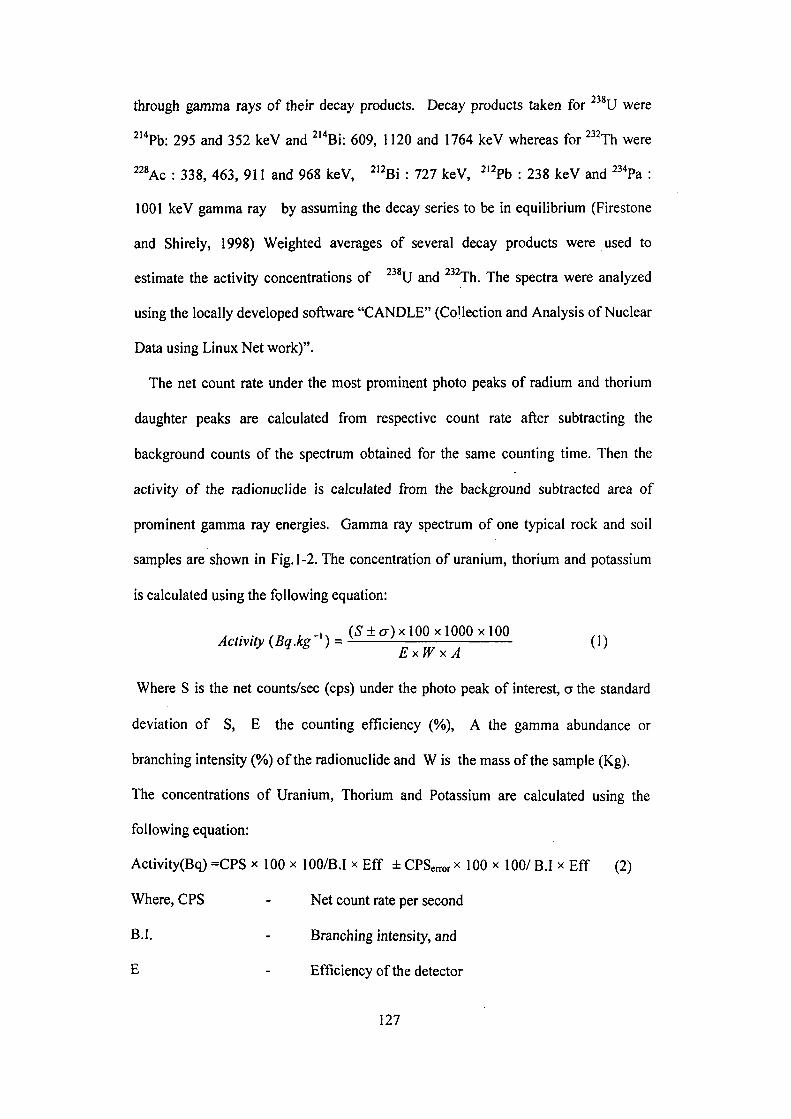
through gamma rays of their decay products. Decay products taken for ^ *U were
^'"Pb: 295 and 352 keV and ^'"Bi: 609, 1120 and 1764 keV whereas for ^ Th were
^ *Ac : 338, 463, 911 and 968 keV, ' Bi : 727 keV, ' Pb : 238 keV and ^ Pa :
1001 keV gamma ray by assuming the decay series to be in equilibrium (Firestone
and Shirely, 1998) Weighted averages of several decay products were used to
estimate the activity concentrations of U and Th. The spectra were analyzed
using the locally developed software "CANDLE" (Collection and Analysis of Nuclear
Data using Linux Net work)".
The net count rate under the most prominent photo peaks of radium and thorium
daughter peaks are calculated from respective count rate after subtracting the
background counts of the spectrum obtained for the same counting time. Then the
activity of the radionuclide is calculated from the background subtracted area of
prominent gamma ray energies. Gamma ray spectrum of one typical rock and soil
samples are shown in Fig. 1-2. The concentration of uranium, thorium and potassium
is calculated using the following equation:
, . . , „ , . , . (5±o-)x 100x1000x100 Activity (Bq.kg ) = - \ (1)
Where S is the net counts/sec (cps) under the photo peak of interest, a the standard
deviation of S, E the counting efficiency (%), A the gamma abundance or
branching intensity (%) of the radionuclide and W is the mass of the sample (Kg).
The concentrations of Uranium, Thorium and Potassium are calculated using the
following equation:
Activity(Bq) =CPS x 100 x 100/B.I x Eff ± CPSerror x 100 x 100/ B.I x Eff (2)
Where, CPS - Net count rate per second
B.I. - Branching intensity, and
E - Efficiency of the detector
127

4.3 Computation of Radiological Effects
From the activity concentrations of the natural radionuclides, uranium C U), thorium
( ^ Th) and potassium (^K), radiological parameters can be calculated. The results are
of great interest in the environmental radiological protection study, since the samples
may widely be used as building construction materials.
4.3.1 Radium equivalent activity (Rajq)
Exposure to radiation is defined in terms of radium equivalent activity (Raeq) in Bq kg'
to compare the specific activity of materials containing different amounts of U
( *Ra), ^ Th and ''°K. It is calculated by the following expression (Yu et al., 1992;
Hayambu et al., 1995):
Ra eq=Cu + 1.43 Cih + 0.07CK (3)
Where Cu. Cn and CK are the activity concentrations of ^ *U, ^ Th and " K in Bq kg"'
respectively. In the above equation for defining Raeq activity it has been assumed that
the same gamma dose rate is produced by 370 Bq kg' of U or 259 Bq kg' of Th
or 4810 Bq kg'' of "" K. There will be variations in the radium equivalent activities of
different materials and also within the same type of materials. The results may be
important from the point of view of selecting suitable materials for use in building
construction materials.
4.3.2 Absorbed gamma dose rate measurement (D)
Outdoor air absorbed dose rate D in nGy h"'due to terrestrial gamma rays at Im above
the ground can be computed from the specific activities, Cu, Cih and CK of ^ *U/ ^ Ra,
^ Th and ''"K in Bq kg''' respectively by Monte Carlo method (UNSCEAR, 2000):
D(nGyh'')= 0.462Cu + 0.604CTh+0.0417CK (4)
To estimate the annual effective dose rate, E, the conversion coefficient from
absorbed dose in air to effective dose (0.7 Sv Gy'') and outdoor occupancy factor
128

(0.2) proposed by UNCSEAR (2000) were used. The effective dose rate in units of
mSv y'' was calculated by the following relation:
E (mSv y'') = Dose rate (nGy h ') x 8760 h xO.2 xO.7 Sv G/'xlO'^ (5)
4.3.3 External (HeO^nd Internal ( Hjn) hazard index
The external hazard index is obtained from Raeq expression through the supposition that
its allowed maximum value (equal to unity) corresponds to the upper limit of Raeq (370
Bq kg" ). For limiting the radiation dose from building materials in Germany to 1.5
mGy y"' . Krieger (1981) proposed the following relation for Hex:
C C C / / „ = - ^ + ^ + - ^ ^ < l (6)
" 370 259 4810
This criterion considers only the external exposure lisk due to y-rays and corresponds
to maximum Raeq of 370 Bq kg"' for the material. These very conservative
assumptions were later corrected and the maximum permission concentrations were
increased by a factor of 2 (Keller and Muth, 1990) which gives
C C C / / „ = — ^ ^ ^ — r + — ^ ^ ^ ^ + — ^ — r ^ i (7)
7405^*:^-' 5205^%-' 9620Bqkg-'
Internal exposure to ^ Rn and its radioactive progeny is controlled by the internal
hazard index (Hin) as given below (Cotton, 1990). H i „ = - ^ + - ^ + - ^ < I (8)
185 259 4810
4.4. Estimation of Activity Concentration of Uranium, Thorium and Potassium in Mosaic Samples
Mosaic slabs and mosaic pieces are commonly used as flooring material in the
buildings. The state of Rajsthan produces wide variety of mosaic slabs. As the rocks
have different and higher amount of natural radionuclides. In order to measure the
natural radioactivity in mosaic slabs, different brands and colours of mosaic samples
129

were collected. These samples were collected in Jaipur, Kishangarh and Ajmer,
situated in the state of Rajasthan of India. After collection the samples were crushed
into fine powder. Fine quality of the sample were dried in an oven at about 110°C for
24 hours. Each sample was packed and sealed in an airtight PVC container and kept
for about 4 weeks period to allow radioactive equilibirium between the radon ( ^ Ra),
Thoron ( °Ra), and their short-lived decay products.
The gamma ray spectrum recorded with the spectrometer of a typical mosaic in shown
in Fig. 4.1
Spectra of mosaic
I
Id
itf
Id
Id
Id
. T h - 2 3 2 " K-4ri
Markers ll^ ihi.3ri
14; Ltl^L^i
Id 170.7 53SJ S003 66S.2 830.0 994.8
Energy (kcV> 1159.7 1324^
Fig.4.1 gamma ray spectra of a mosaic samples
130

The activity concentration of ^ *U and '' Th and ''°K with their average values in
mosaic samples are given in Table 4.1.
Table 4.1
Activity concentration of U, Th, and k, in Mosaic Samples
Sample Code
Ml M2 M3 M4 M5 M6 M7 M8 M9 MIO Mil M12 M13 M14 M15 Min Max
Average value S.D
(Bqkg') 25.69 ± .97 3.33 ±.018 15.63 ±.29
128.18 ±2.44 21.18±.89 29.71 ±1.10 25.27 ±1.21 18.36 ±.80 25.92 ± .88 29.99 ±1.17 34.68 ±1.28 22.27 ± 0.87 19.36 ±1.49 28.35 ±1.19 32.13 ±1.26
3.33±.18 128.18±2.44 30.67± 1.06 28.06± 0.54
(Bq kg-') 23.45 ± .83 6.25 ± .28 27.09 ± .66 51.69 ±1.42 18.72 ±0.70 33.87 ±1.08 12.39 ±.35 20.46 ± .86 35.52 + 1.26 2978 ±1.09 15.89 ±0.64 23.61 ±0.82
BDL* 20.37 ±0.76 22.40 ± 0.85
6.25± .28 51.69±1.42 24.39± .83 11.13±.31
""k (Bq kg')
271.55 ±3.81 0
475.21 ±6.18 833.67 ± 9.70
0 417-09 ±5.54 252.53 ± 3.60
51.95 ±.85 327.82 ±4.51 410.29 ±5.46 217.52±3.15 399.19 ±5.33
0 253.24 ± 373 29].13±4.18
0 833.67±9.7
270.29± 3.74 226.95± 2.69
BDL* Below detection limit
The activity concentrations of ^ *U and ^ Th varies from 3.33± 1.8 to 128.18± 2.44
Bq kg-' with an average value of 30.67± 1.06 Bq kg"' and from 6.25±0.28 to 51.69±
1.42 Bq kg-' with a mean value of 24.39±0.83 Bq kg'' respectively. ^\ in mosaic
samples ranges from 0 to 833.67± 9.7 Bq kg"' with an average value of 270.29± 3.74
Bq kg-'. To establish the correlation between ^ *U and ^ Th activity concentration
and Th and K activity concentrations in the mosaic samples, the plots are shown
in Figs. 4.2 and 4.3.
131

140
120
CT cn r o m c 8 c o o 3 g
100-
BU-
BO-
40-
20-
B Linear Fit of Data 1 B
- 1 — I — 1 — I — 1 — I — 1 — I — I — I — 1 — I — 1 — I — 1 — r
10 15 20 25 30 35 40 45 50 55
^^^Th concentration (Bq kg"')
Fig 4.2 Variation of ^ *U activity concentration versus ^ Th activity in mosaic samples
900
7 750-
m^eoo-c o '•g 450-k_
c 0) g 300 o o
<J^ 150-1
0-K"—I . I
B Linear Fit of Data 1 B
T—' 1 • 1 ' 1 i 1 ' 1 ' 1 ' 1 ' 1
5 10 15 20 25 30 35 40 45 50 55 60
" ^ h concentration (Bq l<g"')
232n Fig 4.3 Variation of K activity concentration versus Th activity in mosaic
samples
132

A positive correlation exists between different quantities. Fig. 4.4 shows the variation
of radon exhalation rate (data from chapter III) with their uranium concentrations for
the mosaic samples.
1100-,
• B Linear Fit of Data1 B
,-- 1000-
!c 'E 900 -
a-OQ £ 800-
0) •5 700-^ c .O 600 -*.< JO 5 500-X 0) ^ C 400-o T3 2 300-
C
•
-'-'
)
•
• •
•
• •
• •
_ • •
* •
1 ' 1 20 40
_,.
1 60
1 80
1 100
•
^„.--
1 ' 120
1 140
Uranium concentration (Bq kg")
Fig 4.4 Radon exhalation rate versus uranium concentration in mosaic samples
There is a weak correlation between these quantities. It is worth mentioning that it is
difficult to predict the radon exhalation rate from the concentration of uranium or its
decay series products in a sample, since the radon exhalation rate depends also on the
texture and grain size composition.
Table 4.2 presents the radiation risk quantities obtained from ^ *U, ^ Th and '*°K
activity concentrations.
133

Table 4.2
Radium equivalent activity, absorbed gamma dose rate, annual effective doses. External hazard index and internal hazard index in mosaic samples.
Samples Code
Ml
M2
M3
M4
M5
M6
M7
M8
M9
MIO
Mil
M12
M13
MM
M15
Average value
S.D
R.S.D%
Radium equivalent
activity Raeq (Bq kg')
78.23
12.27
87.63
260.45
47.95
107.34
60.66
51.25
99.66
101.29
72.63
83.98
19.36
75.21
84.54
82.83
56.50
68.21
Absorbed gamma dose rate D(nGy
h')
37.36
5.31
43.39
125.20
21.09
51.58
29.69
23.00
47.09
48.95
34.69
41.19
8.94
35.96
40.51
39.59
27.39
69.18
Annual effective dose (mSvy')
Indoor 0.18
0.03
0.21
0.61
0.10
0.25
0.15
0.11
0.23
0.24
0.17
0.20
0.04
0.18
0.19
0.19
.13
68.42
Outdoor 0.05
0.05
0.05
0.15
0.03
0.06
0.04
0.03
0.06
0.06
0.04
0.05
0.01
0.04
0.05
0.051
.030
58.82
External Hazard
Index (Hex)
0.22
0.03
0.25
0.71
0.13
0.29
0.17
0.14
0.28
0.28
0.20
0.23
0.05
0.21
0.23
0.23
0.15
65.22
Internal Hazard Index (Hi„)
0.29
0.04
0.29
1.07
0.19
0.38
0.24
0.19
0.35
0.36
0.33
0.29
0.10
0.28
0.32
0.31
0.23
74.19
Absorbed gamma dose rate varies from min. value of 5.31 nGy h'' to max. value
125.20 nGy h''. The corresponding indoor and outdoor annual effective doses vary
from 0.03 to 0.25 mSv y"' and 0.01 to 15 mSv y"'. The International Commission on
Radiological Protection (ICRP) has recommended the annual effective dose
equivalent limit of 1 mSv y"' for the individual members of the public and 20 mSv y '
for the radiation workers (ICRP, 1993). It is clear that radiation dose equivalent
134

observed for the mosaic are lower than the recommended value. The calculated values
of Hex for mosaic samples vary from 0.03 to 0.71 (shown in fig 4.5). Since all these
values are lower than unity, the mosaic is safe and can be used as a construction
material without posing significant radiological threat to population. But according to
conservative estimate as calculated from eq.(6) Hex is close to unity in some cases.
Thus according to radiation protection 112 (European Commissions, 1999) report,
care must be taken in using the mosaic as building material.
I
I
1 2 3 4 5 6 7 8 9 10 11 12 13 14 15
Sample number
Fig 4.5 Bar diagram showing the values of external hazard index at locations
135

Fig 4.6 shows a frequency plot of IJ, Th, K activity concentration and absorbed
dose rate in different samples.
1000
1
I i B D
600
600-
400-
200-
i%' Q ^ ^ ^ Ait
Fig 4.6 Bar diagram showing activity concentration of U, Th, and K and absorbed gamma dose rate in different samples
136

4.5 Measurement of Natural Radioactivity in Granite Samples
Natural radioactivity in granite samples used as ornamental and flooring materials in
building construction has been measured by low level gamma ray spectrometer
discussed in previous section. Gamma ray spectra of one typical granite sample is
shown in Fig, 4.7.
Spectra of Granite
i2 c g
^. iU-116 m Th-232 • K-40
ADC-OtS
Id
Id
Id
Id
Id
Id 300.1 464.9 629.8 794.6 959.4 1124.2 12^.1 14535
Energy(keV)
MAikei-"
Fig 4.7 Spectra of a granite samples
Measured '' U, "^Th, and '**'K activity concentrations in the granite samples and
computed Radium equivalent activity, absorbed gamma dose rate, annual effective
doses, external hazard index and internal hazard index in granite samples are
presented in Tables 4.3 and 4.4.
137

Table 4.3
Activity concentration of "^U, "^Th, and ''"k, in granite Samples
Sample Code
Gl
G2
03
04
05
06
07
08
09
GIO
Oil
012
Min
Max
Average Value
S.D
''"U (Bqkg')
12.01±.61
267.76±3.83
44.92+1.35
35.80±1.47
33.58±1.28
32.02±1.37
137.23±2.44
21.34 ±.89
26.88±1.17
91.30± i.85
24.59+ .98
234.1913.46
12.01±.61
267.76± 3.83
80.1411.73
87.4011.01
(Bq kg')
8.931.37
446.1515.53
5.671.27
5.881.18
23.041.81
14.041.58
103.8712.25
14.161.55
10.731.47
133.9312.66
26.741.91
325.5214.59
5.6710.18
446.1515.53
93.2211.59
145.0311.80
40k
(Bq kg-')
140.9012.12
3415.56126.59
59.941.96
138.2612.09
396.95 1 5.29
152.9912.29
1553.04115.44
236.2213.38
226.1713.22
1350.02113.96
739.6718.82
2812.62123.39
59.941.96
3415.56126.59
935.1918.96
1135.9418.87
138
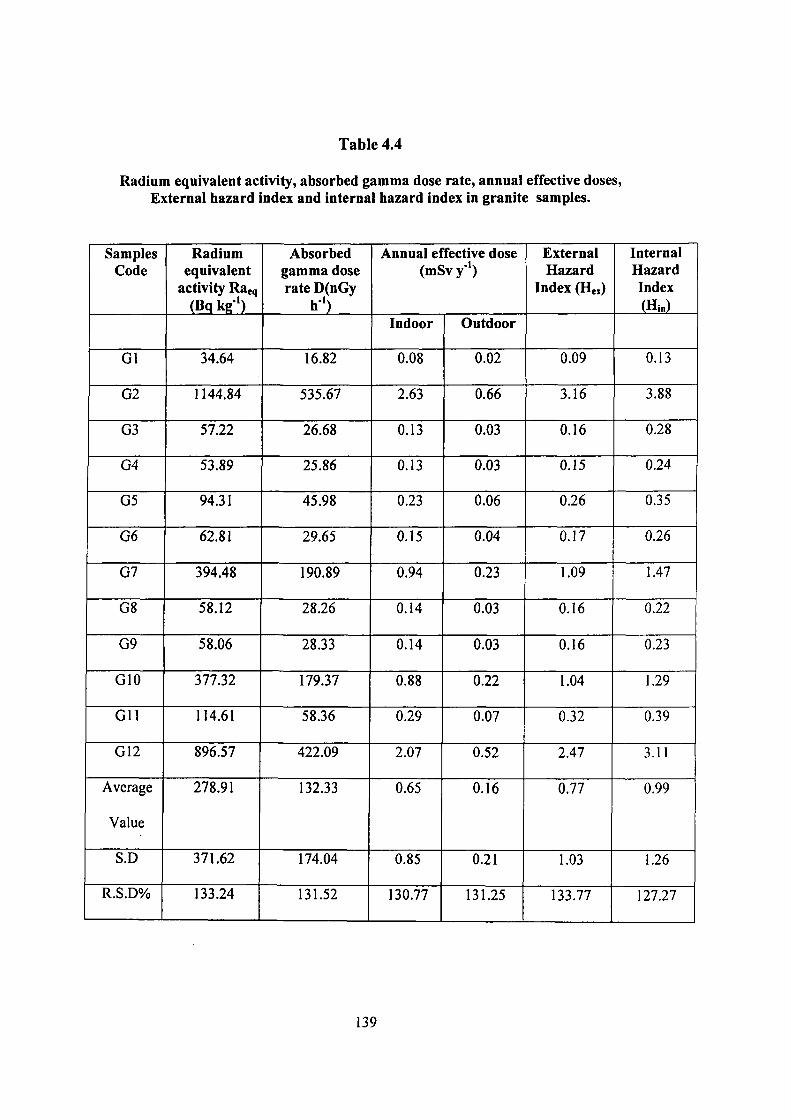
Table 4.4
Radium equivalent activity, absorbed gamma dose rate, annual effective doses, External hazard index and internal hazard index in granite samples.
Samples Code
Gl
G2
03
G4
G5
G6
07
08
09
OlO
Oil
012
Average
Value
S.D
R.S.D%
Radium equivalent
activity Raeq (Bq kg')
34.64
1144.84
57.22
53.89
94.31
62.81
394.48
58.12
58.06
377.32
114.61
896.57
278.91
371.62
133.24
Absorbed gamma dose rate D(nGy
h')
16.82
535.67
26.68
25.86
45.98
29.65
190.89
28.26
28.33
179.37
58.36
422.09
132.33
174.04
131.52
Annual effective dose (raSvy-')
Indoor
0.08
2.63
0.13
0.13
0.23
0.15
0.94
0.14
0.14
0.88
0.29
2.07
0.65
0.85
130.77
Outdoor
0.02
0.66
0.03
0.03
0.06
0.04
0.23
0.03
0.03
0.22
0.07
0.52
0.16
0.21
131.25
External Hazard
Index (He,)
0.09
3.16
0.16
0.15
0.26
0.17
1.09
0.16
0.16
1.04
0.32
2.47
0.77
1.03
133.77
Internal Hazard Index (Hi„)
0.13
3.88
0.28
0.24
0.35
0.26
1.47
0.22
0.23
1.29
0.39
3.11
0.99
1.26
127.27
139

Activity concentrations were found to vary from 12.0 ± 0.61 to 267.76 ± 3.83 Bq kg'
with an average value of for ^ *U , from 5.67 ± 0.27 to 446.15 ± 5.53 Bq kg"' with an
average value of 93.22 ± 1.59 for ^ Th and 59.94 ± .96 to 3415.56 ± 26.59 Bq kg'
with an average value of 935.19 ± 8.96 for ''"K. The plots between ^ U and ^ Th
activity concentration and ^ Th and '*°K activity concentrations are shown in Figs. 4.8
and 4.9. These establish the correlation between ^ *U and ^ Th activity concentration
and ^ Th and '*°K activity concentration in the granite samples.
300
250-
0 -200
S-c .2 150 2 0) 100 o
Z3 S
50
• B Linear Fit of Datal B
— I — 100 200 300 400 500
"Th concentration (Bq kg"')
Fig 4.8 Variation of ^ *U activity concentration versus '' Th activity in granite samples
140

3500-
'O)3000•
S-2500 c o •g 2000-(0
•*-»
0) 1500
c 8 1000-o
500-
0-
• B Linear Fit of Data 1 B
— I • 1 • 1 ' 1 1 1 100 200 300 400 500
"^Th concentration (Bq kg')
Fig 4.9 Variation of *"K activity concentration versus "^ Th activity in granite samples
A positive correlation exists between ^ *U and ^ Th activity concentration and a
negative correlation between ^ Th and '"'K activity concentration in the granite
samples studied here. Fig 4.10 shows the variation of radon exhalation rate (data
from chapter IIII) with ^ *U activity concentration. There seems to be negative
correlation between these quantities.
2500
E O- 2000
£ <u •S 1500
c o
;S 1000-(0
X <0 c o
•o (0
a:
500
• B Linear Fit of Data1 B
— I — 50
— I — 100 200 250 300
Uranium concentration (Bq l<g'')
Fig 4.10 Radon exhalation rate versus uranium concentration in granite samples
141

Radium equivalent activity (Ragq) due to the presence of radio nuclides varies from
34.64 to 1144.84 Bq kg"' with an average value of 278.91 Bq kg''. Total absorbed
gamma dose rates in the surrounding air are found vary from 16.82 to 535.61 nGy h"
with an average value of 132.33 nGy h"'. Fig 4.11 shows a frequency plot of the
variation of U, Th, K and absorbed dose rate in these granite samples.
10 11 12
Fig 4.11 Bar diagram sliowing activity concentration of "*U, "^Th, and ^"K and absorbed gamma dose rate in different samples
Indoor and outdoor annual effective dose rate from these granite samples vary
from 0.08 to 2.63 mSv y'' and 0.02 to 0.66 mSv y"' respectively. External hazard
index, Hex for the granite samples studied in this work ranges from 0.09 to 3.16 with a
mean value of 0.77. The internal exposure to ^ Rn and its radioactive progeny is
controlled by the internal hazard index lli,,. Computed values of 11,,, vary from 0.15 to
4.76 with an average value of 0.99. since most of the values of Hex are less than unity
except four' granite samples 02, 07, OlO, 012 showing higher values than
unity(shown in Fig 4.12). The use of these granite as construction material can be
142

done without posing significant radiological threat. But care should be taken in the
use of any granite slab.
Fig 4.12 Bar diagram showing the values of external hazard index
143

4.6 Measurement of Natural Radioactivity in Soil Samples from near Jharkhand U-mines region
The natural radioactivity in soil comes from ^ *U, ^ Th and from natural '*°K. Some
other terrestrial radionuclides, including those of the ^ U series, The radiological
implication of these radionuclides is due to the gamma ray exposure of the body and
irradiation of lung tissue from inhalation of radon and its daughters. Therefore, the
assessment of gamma radiation dose from natural sources is of particular importance
in addition to radon measurements.
Jharkhand state of India is rich in minerals and there are huge deposits of bauxite,
mica and coal along with iron, copper, chromites, tungsten, lime stone, feldspar and
quartz etc. along with deposits of uranium. Naturally occurring radionuclides of
terrestrial origin ( U, Th and K) are present in the earth's crust and are found in
almost all types of soil, rocks, sands and waters. The measurement of natural
radionuclides ( U, Th and K) activities is important for the estimation of
radiation risk and has been the subject of interest of research scientists all over the
world. As the soil is the basic ingredient used in construction materials in India in the
formation of bricks etc., estimation of the radiation risk from the soil samples to the
population is quite important and can be computed from the activities of the radio
nuclides present in the sample. In the present study natural radio nuclides ("^U, ^ Th
and K) concentration from the soil samples from some areas around the East
Singhbhum shear zone U-mining area of Jharkhand state of India are measured using
high resolution y -ray spectroscopic system for the estimation of effective radiation
dose to assess the radiation risk to the inhabitants. Natural radionuclides ( ^ U, ^ Th
and K) activity concentrations are given in Table 4.5. Radium equivalent activity.
144

absorbed gamma dose rate, annual effective dose rate, external hazard index and
internal hazard index for the soil samples are presented in Table 4.6.
Table 4.5
Activity concentrations of ^U, "^Th and ^"K in soil samples collected from East Singhbhum shear zone U-mining area of Jharkhand state of India
Sample code
JS-1
JS-7
JS-12
JS-I3
JS-17
JS-19
JS-21
JS-22
JS-23
JS-24
JS-25
JS-26
Location of Samples
Near Jaduguda U-mine
Gamaharia main Market Tata Swam Rakha River Chanduka
Mines Tata outer-I
Tata Telco
B-Block Bokaro
Bokaro Stone Mines
River Side Bokaro
Sector IX-D Bokaro
Sector IX-C Bokaro
Sector IX-Bokaro
^^U ( Bq kg-')
826.3 ± 8.5
40.9 ±1.6
6.1 ±0.2
21.6 ±0.4
61.4±1.1
273.2 ±3.1
61.1 ±0.8
26.7 ±0.6
19.8 ±0.5
18.3 ±0.3
12.5 ±0.3
61.2 ±0.9
"^Th (Bq kg-*)
53.0 ± 2.2
17.9 ±1.6
24.1 ±0.8
8.7 ±0.3
130.6 ±2.6
236.7 ±3.2
73.2 ±1.5
19.5 ±0.5
,35.5 ±0.9
40.1 ±0.5
12.3 ±0.6
122.4 ±2.1
^"K(Bq kg-*)
291.5 ±4.4
349.5 ± 5.0
401.3 ±5.4
BDL
757.8 ±10.1
710.7 ±9.2
1399.1 ±14.3
626.1 ±7.7
901.0 ±9.9
981.3 ±10.9
304.4 ±4.1
941.9 ±10.6
No. ofsa Max. 14.3 Min. Average 7.6
mples
Standard deviation 3.8
12 826.3 ± 8.5
6.1 ±0.2 119.1 ±1.5
224.0 ± 2.2
236.7 ±3.2
8.7 ± 0.3 64.5 ±1.4
64.9 ± 0.9
1399.1
BDL 638.7 ±
371.5 ±
*BDL- Below Detection Limit.
145

Table 4.6
Radium equivalent activity, absorbed gamma dose rate, indoor and outdoor effective dose rates, external and internal hazard Index in soil samples collected from around the East Singhbhum shear zone and U-mining area of Jharkhand state, India
Sample code
JS-I
JS-7
JS-12
JS-13
JS-17
JS-19
JS-21
JS-22
JS-23
JS-24
JS-25
JS-26
Average Value S.D.
Rel.Std.%
Radium equivalent
activity (Raeq) Bqkg'
922.5
91.0
68.7
34.0
301.2
661.4
263.7
98.4
133.6
144.3
51.4
302.2
256.0
261.2
102.0
Absorbed gamma
dose rate (D)
nGy h'
425.9
44.3
34.1
15.2
138.8
298.8
130.8
50.2
68.2
73.6
25.9
141.5
120.6
118.7
98.4
Inddor effective
dose rate (mSvy')
2.08
0.21
0.17
0.07
0.68
1.46
0.64
0.25
0.33
0.33
0.13
0.69
0.59
0.58
98.3
Outdoor effective
dose rate (mSvy-^)
0.52
0.05
0.04
0.02
0.17
0.37
0.16
0.06
0.08
0.09
0.03
0.17
0.15
0.15
100
External Hazard Index (Hex)
2.46
0.24
0.18
0.09
0.83
1.80
0.74
0.28
0.38
0.40
0.14
0.83
0.70
0.70
100
Internal Hazard Index (Hi„)
4.76
0.35
0.20
0.15
0.99
2.56
0.90
0.35
0.44
0.44
0.18
0.18
0.96
1.31
136.1
146

Gamma ray spectra of one typical soil sample is shown in Fig 4.13
Spectra of soil samples
•1.1 328.8 (i58.7 988.6 1318.5 1648.4 1978J 2308.1
Energy (keV)
Fig. 4.13 Spectra of the soil samples from East Singhbhum shear zone U-mining area of Jharkhand state of India. The legends are: Ra-226 (V), Pb-214 (•), Bi-214(4)
Activity concentration was found to vary from 6.1 ± 0.2 to 826.3 ± 8.5 Bq kg"' with an
average value of 119.1 ± 1.5 Bq kg' for ^ *U, from 8.7 ± 0.3 to 236.7 ± 3.2 Bq kg"' with an
average value of 64.5 ± 1.4 Bq kg"' for ^ Th and 291.5 ± 4.4 to 1391 ± 14.3 Bq kg"' with
an average value of 638.7 ± 7.6 Bq kg"' for ""K. The variation of "*U with ^ Th activity
concentration and ^ Th with ''"K activity concentrations in the soil samples of the present
147

study as shown in Figs, 4.14 & 4.15. There seems to be weak correlation between them .
Fig 4.16 shows the variation of radon exhalation rate (data from chapter 111) with ^ U
activity concentration. A positive correlation exists between different quantities.
800-
•^ 600 o-CO
c o
••= 4 0 0 S c 8 8 200 ID S
50
• B Linear Fit of Data 1 B
— I — 150 200 250 300
^Th concentration (Bq kg"')
Fig 4.14 Variation of ^ U activity concentration versus '' Th activity in granite samples
1400
.r^ 1200
CQ 1000
c o "S 800 c 8 8 ' "
5 400
200
• B Linear Fit of Data 1 B
— 1 • , 1 1 1 1 1 1 —
50 100 150 200 250
"^Th concentration (Bq kg')
Fig 4.15 Variation of **K activity concentration versus "^ Th activity in granite samples
148

1800-
1700 E m E, <U 1 6 0 0 TO
CO CO
s: X c o x> to
DC
1400
1300-
B LinearFit of Data1 B
200 400 600 800
Uranium concentration (Bq kg'')
Fig 4.16 Radon exhalation rate versus uranium concentration in granite samples
Radium equivalent activity (Raeq) due to the presence of radionuclides is calculated
and varies from 34.0 to 922.5 Bq kg"' with an average value of 256.0 Bq kg"'. Total
absorbed gamma dose rates in the surroundings air are found to vary from 15.2 to 425.9
nGy h'' with an average value of 120.6 nGy h"'. Fig. 4.17 shows a plot of the variation of
238y 232jj ^ 40j ^^^ absorbed dose rate in these soil samples.
Fig 4.17 Bar diagram showing activity concentration of ^ *U, "^Th, and '"'K and absorbed gamma dose rate in different samples
149

Indoor and outdoor annual effective dose rate from these soil samples vary from 0.07
to 2.08 mSv y'' and 0.02 to 0.52 mSv y' respectively. External hazard index, Hex for the
soil samples studied in this work, ranges from 0.09 to 2.46 with mean a value of 0.70
(shown in fig 4.18).
1 2 3 4 5 6 7 8 9 10 11 12
Sample number
Fig 4.18 Bar diagram showing the values of external hazard index at locations
The internal exposure due to ^ Rn and its radioactive progeny,is controlled by
the internal hazard index Hjnand Hjn varies from 0.15 to 4.76 with an average value
of 0.96. Most of the values of Hex are less than unity except two soil samples JS-1
and JS-19 showing higher values than unity (shown in fig 4.18).
4.7 Natural Radioactivity in soil samples Collected from the distance of 50m from Kasimpur Thermal Power Plant
Natural radioactivity measurements were carried out in soil samples, collected from a
distance of 50 m from Kasimpur thermal power plant to investigate the effect of fly
150

ash spreading from the thermal power plant through air and its deposition on soil. The
gamma ray spectra of a typical soil sample is shown in Fig 4.19. .
Spectra of kasimpur soil
I u
Id
Id
Id
Id
Id
. Th-232 7 K-40
ADC-OIS
•9
^
"•Himly
Islai-kers I I ! JSl . i -
125 542.75
\}\ 1460 J5
Id 299.8 464.4 629.0 793.7 9583 1122.9 1287.5 14S2J
Energy (kcV)
Fig 4.19 gamma ray spectra of a soil sample
Tables 4.7 and 4.8 present the measured values of activity concentration of '"'U,
Th, and K and the computed values of radium equivalent activity, absorbed
gamma dose rate, annual effective dose, external hazard index and internal hazard
index in soil samples.
151
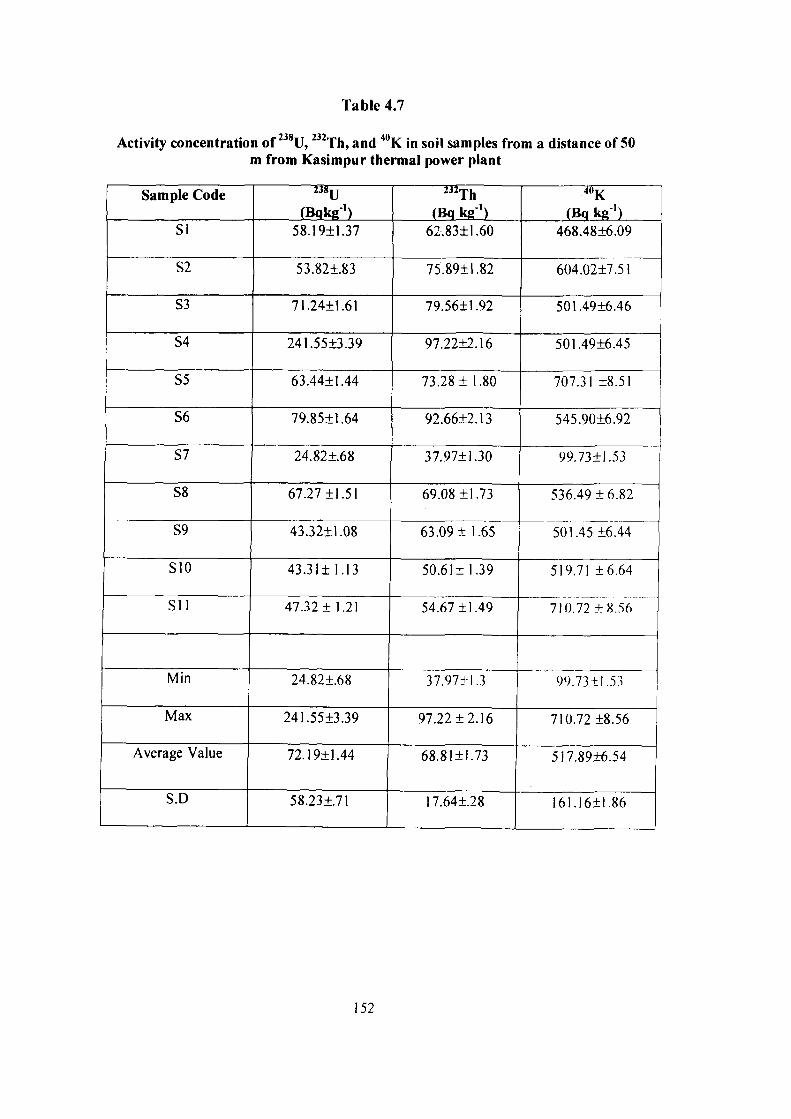
Table 4.7
Activity concentration of ""U, "^Th, and "K in soil samples from a distance of 50 m from Kasimpur thermal power plant
Sample Code
SI
S2
S3
S4
S5
86
S7
S8
89
810
SIl
Min
Max
Average Value
S.D
(Bqkg-') 58.19±1.37
53.821.83
71.2411.61
241.5513.39
63.4411.44
79.85+1.64
24.821.68
67.2711.51
43.3211.08
43.3111.13
47.32 + 1.21
24.82+68
241.5513.39
72.1911.44
58.231.71
(Bq kg ') 62.8311.60
75.89+1.82
79.56+1.92
97.2212.16
73.281 1.80
92.6612.13
37.9711.30
69.08 11.73
63.0911.65
50.61+1.39
54.6711.49
37.97+1.3
97.2212.16
68.8111.73
17.641.28
(Bq kg-') 468.4816.09
604.0217.51
501.4916.46
501.4916.45
707.31 18.51
545.9016.92
99.7311.53
536.4916.82
501.4516.44
519.71 +6.64
710.72+8.56
99.73 + 1.53
710.72 18.56
517.8916.54
161.1611.86
152

Table 4.8
Radium equivalent activity, absorbed gamma dose rate,annual effective doses. External hazard index and internal hazard index in soil samples.
Samples Code
SI
S2
S3
S4
S5
S6
87
S8
S9
SIO
Sll
Average
value
S.D
R.S.D%
Radium equivalent
activity Raeq (Bq kg")
180.83
204.62
220.12
415.68
217.74
250.57
86.09
203.61
168.64
152.06
175.25
206.84
81.58
39.44
Absorbed gamma dose
rate D(nGyh"')
84.37
95.89
101.88
191.23
103.07
115.62
38.56
95.17
79.03
72.25
84.52
96.51
37.36
38.71
Annual effective dose (mSvy-')
Indoor
0.41
0.47
0.49
0.94
0.51
0.57
0.19
0.47
0.39
0.35
0.41
0.47
0.18
38.29
Outdoor
0.10
0.12
0.12
0.23
0.13
0.14
0.50
0.12
0.09
0.09
0.10
0.12
0.04
33.33
External Hazard
Index (Hex)
0.49
0.56
0.60
1.13
0.60
0.69
0.23
0.56
0.46
0.42
0.49
0.57
0.22
38.59
Internal Hazard Index (Hi„)
0.65
0.71
0.79
1.79
0.78
0.09
0.30
0.74
0.58
0.54
0.61
0.76
0.38
50
Activity concentrations were found to vary from 24.82 ± 0.68 to 241.55 ± 3.39 Bq kg"
' with an average value of 72.19 ± 1.44 Bq kg' for "*U, from 37.97 ± 1.3 to 97.22
±2.16 Bq kg"' with an average value of 68.81 ± 1.73 Bq kg"' for "^Th and 99.73 ±
153

1.53 to 710.72 ± 8.56 Bq kg'' with an average value of 517.89 ± 6.54 Bq kg'" for
'"'K. The correlation between ^ *U and "^Th activity concentration and ^ Th and ^°K
activity concentrations in the soil samples of the present study are shown in the
graphs are shown in the Figs. 4.20 & 4.21.
250
O-200 CO
c o
150
100-
s 50
• B Linear Fit of Data1 B
^Th concentration (Bq kg' )
- 1 — i — I — I — 1 — I — 1 — I — 1 — I — 1 — I — 1 — I — 30 40 50 60 70 80 90 100
232-,
Fig 4.20 Variation of ^*U activity concentration versus '' Th activity in soil samples
800-1
700-
^^-^ 600-
'o> CT 500-
S. O 400
2 C 300-(!) O c
g 200-
° 100-
• B Linear Fit of Data 1 B
- • — I — > — 1 — I — I — ' — r -30 40 50 60 70
232-80 90
t h concentration (Bq l<g"') 100
Fig 4.21 Variation of''"K activity concentration versus "^ Th activity in soil samples
154

Weak correlation is found to exist between different quantities. Fig 4.22 shows the
variation of radon exhalation rate(data from chapter III) with ^ *U activity
concentration.
2000
''p 1800 u-m E^ 1600
0) 4—> (0 •- 1400
I 1200 x: X 0) c 1000 o T3 CO Q^ 800
600
• B Linear Fit of Data 1 B
—r-50
— I — 100 150 200
— I — 250
Uranium concentration (Bq l g')
Fig 4.22 Radon exhalation rate versus uranium concentration in soil samples
There seems to be weak correlation between them. From Table 4.8 it can be observed
that radium equivalent activity (Raeq) due to the presence of radio nuclides varies
from 86.09 to 415.68 Bq kg'' with an average value of 206.84 Bq kg"'. Total absorbed
gamma dose rates in the surrounding air are found to vary from 38.56 to 191.23 nGy
h"' with an average value of 96.51 nGy h"'. Fig. 4.23 shows the frequency plot of the
variation of U, Th, K and absorbed dose rate in these soil samples. Indoor and
outdoor annual effective dose rate from these soil samples changes from 0.19 to 0.94
mSv y'' and 0.05 to 0.23 mSv y'' respectively. External hazard index, Hex for the soil
samples studied in this work range from 0.23 to 1.13 with mean a value of 0.57.
Internal hazard index Hin varies from 0.3 to 1.79 with an average value of 0.76. Since
155

most of these values of Hex are less than unity except one soil samples S-4 showing
higher value than unity(shown in Fig 4.24), the use of soil from this region can be
used as construction material without posing significant radiological threat to
population.
750
675
600
a- Uranium b-Thorium c- Pottasium d- Ab«orb0d dose rate
4 6 6 7 Nufflb«r of samples
9 10 11
Fig 4.23 Bar diagram showing activity concentration of ^ *U, ^ Th, and ^"K and absorbed gamma dose rate in different samples
Fig 4.24 Bar diagram showing the values of external hazard index at locations
156

4.8 Measurement of Natural Radioactivity in Fly Ash Samples from Kasimpur Thermal Power Plant
In recent years fly ash has been used as a replacement of sand and cement in pre
mixed concrete, manufacture of blended fly ash Portland cement, aerated concerete,
fly ash clay bricks and blocks and for filling for underground cavities etc. Thus it is
quite important to estimate the radiation risk to the population from the radioactivity
of fly ash. Fly ash samples were ollected from Kasimpur thermal power plant. The
gamma ray spectra of a fly ash sample is shown in Fig 4.25.
Spectra of kas impur Fly asli
s o
Id
Id
Id
Id
Id
Id 299.» 464A 629.0 793.7 958J 1122.9 1287.5 1452.1
Energy (keV)
Fig 4.25 Spectra of fly ash samples
Mark(!i-s a . J i l 7;
The activity concentration of U, Th and K together with their average values in
fly ash samples collected from Kasimpur Thermal Power Plant (U.P) are given in
Table 4.9. Computed values of radium equivalent activity, absorbed gamma dose
rate, annual effective doses, external hazard index and internal hazard index in fly ash
samples are given in Table 4.10.
157

Table 4.9
4U, Activity concentration of U, Tli, and K in Hy asli Samples
Sample Code
KFI-
KF2
KF3
KF4
KF5
KF6
KF7
KF8
KF9
KFIO
Min
Max
Average Value
S.D
""U (Bq kg-')
I12.66±2.I5
93.15±1.84
112.27+2.18
61.45+1.37
108.17+2.09
104.83 ±2.04
90.98±1.23
110.62+2.10
105.98±2.06
106.45+2.12
61.45 ±1.23
112.66±2.18
100.66+1.92
I5.64+.34
(Bq kg-')
109.01±2.33
99.8812.21
106.85±2.29
68.04+1.70
102.31 ±2.23
108.26+2.32
97.26+1.61
107.05+2.27
102.62+2.23
117.08+2.49
68.04 ±1.61
117.08+2.49
101.84+2.17
13.10+ .28
^"k (Bq kg-')
520.03±6.63
437.96±5.73
467.52±6.08
236.06±3.39
492.19+6.37
519.99+6.65
444.29±5.84
510.09 ±6.54
489.59 + 6.33
493.08+6.36
236.06 ±3.39
520.03 ±6.65
461.08+5.99
84.09 ±.97
158

Table 4.10
Radium equivalent activity, Absorbed gamma dose rate, Annual effective doses, External hazard index and Internal hazard index in fly ash samples.
Samples Code
KFl
KF2
KF3
KF4
KF5
KF6
KF7
KF8
KF9
KFIO
Average
Value
S.D
R.S.D%
Radium equivalent
activity Raeq (Bq kg-')
304.95
266.64
297.79
175.27
288.93
296.04
261.16
299.41
286.99
308.39
278.56
39.42
14.15
Absorbed gamma dose
rate D(nGy h')
139.58
121.63
135.90
79.33
132.29
135.50
119.30
137.04
131.36
140.46
127.24
18.25
14.34
Annual effective dose (mSv y')
Indoor
0.68
0.59
0.67
0.39
0.65
0.66
0.59
0.67
0.64
0.69
0.62
0.09
14.52
Outdoor
0.17
0.15
0.17
0.09
0.16
0.17
0.15
0.17
0.16
0.17
0.16
0.02
12.5
External Hazard
Index (Hex)
0.83
0.37
0.81
0.48
0.79
0.8'
0.71
0.82
0.78
0.84
0.76
0.11
14.47
Internal Hazard Index (Hi„)
1.14
0.98
1.12
0.64
1.08
0.81
0.96
1.12
1.07
1.13
1.01
0.16
15.84
238 232n The activity concentration of U and Th varies from 61.45± 1.37 Bq kg to
112.66± 2.15 Bq kg"' with an average value of 100.66± 1.92 and from 68.04 ±1.70
Bq kg"' to 117.08± 2.49 Bq kg"' with a mean value of 101.84± 2.17 Bqkg"'
respectively. ''°K in fly ash samples ranges from 236.06± 3.39 Bq kg"' to 520.03±6.63
159

Bq kg'' with an average value of 461.08± 5.99 Bq kg'. Figure 4.26 shows the
variation of radon exhalation rate(data from chapter III) with ^ U activity
concentration. There seems to be positive correlation between them. It is worth
mentioning that it is difficult to predict the radon exhalation rate from the
concentration of uranium or its decay series products in a sample. Since the radon
exhalation rate depends also on the texture and grain size composition. To establish
the correlation between ^ U and ^ Th activity concentration and ^ Th and ' ''K
activity concentrations in the fly ash samples of the present study, the values are
plotted as shown in Figs. 4.27 & 4.28.
1600
« 1400
'E or CD .§, 1200 0) 2 C 1000 o m to a> c o "g 600 on
400
• B Linear Fit of Data1 B
60 70 80 — I ' 1 ' 1 ' 1
90 100 110 120
Uranium concentration (Bq kg' )
Fig 4.26 Radon exhalation rate versus uranium concentration in fly ash samples
160

120-
,i-^ 110 o>
J£
rr m "^ r o ni
c 0) o c 8 3 s
• 1UU-
. 9 0 -
•
SO
TO-
60
60 70 — r
80 232'
— I
100 — I — 110
B Linear Fit of Data1 B
90 100 110 120
t h concentration (Bq kg')
Fig 4.27 Variation of '**U activity concentration versus ^ Th activity in fly asli samples
550
500-
o> ^ CT m c o
^ r f
}" r a> o c
450-
400-
350-
300-
250
200 60
— I — 70 80
~ 1 — 90
— I — 100
— I — 110
232. t h concentration (Bq leg"')
8 Linear Fit of Data1 B
— I — 120
Fig 4.28 Variation of **K activity concentration versus ^^^ Th activity in fly ash samples
161

Calculated values of radium equivalent activity (Racq) varies from 175.27 Bq kg"'
to 308.39 Bq kg'' with an average value of 278.56 Bq kg"' . Total absorbed gamma
dose rates are found to vary from 79.33 nGy h"' to 140.46 nGy h' with an average
value of 127.24 nGy h"' as shown in Table 4.10. Fig 4.29 shows a plot of the ^ U,
^ Th and ''"K activity concentration and absorbed dose rate in these fly ash samples.
600
3 4 5 6 7 Number of samples
Fig 4.29 Bar diagram showing activity concentration of "*U, "^Th, and ""K and absorbed gamma dose rate in different samples
Indoor and outdoor annual effective dose rate from these fly ash
samples are determined from 0 .39 mSv y"' to 0.69 mSv y"' and 0.09 mSv y"' to 0.17
mSv y'' respectively. Computed values of Hjn vary from 0.64 to 1.14 with an average
value of 1.01. External hazard index, Hex for the soil samples studied in this work
range from 0.48 to 0.84 with a mean value of 0.76. since most of the values are less
than unity (shown in Fig. 4.30), the fly ash may be safe to be used as a construction
material without posing any radiological implications. But according to conservative
estimate as calculated from eq. Hex is close to unity . thus according to radiation
protection 112 (European Commissions, 1999), report care must be taken in using the
fly ash as building material.
162

Fig 4.30 Bar diagram sliowing tlie values of external hazard index at locations
Health risks are especially high in the area downward of the power plant. Being very
minute, fly ash particles may tend to remain airborne for long periods leading to
serious health problems as the airborne ash can enter the lungs through inhalation and
may stick to lung tissues. Due to higher radon emanating power the lung tissues may
be irradiated with a- particles from radon progeny to a high degree, increasing the
possibility of lung cancer. These radionuclides in the fly ash may migrate from the
waste disposal site to the underlying ground water body and may also accumulate in
the top soil giving sufficient chances for the radionuclides to become enriched in soil.
163

REFERENCES
Abdi; M.R; Faghihian, H; Mustajubodda vatu, M; Hasanzadeh, A; Kamali, M., 2006.
Distribution of natural radionuclides and hot points in Coasns of Hormozgan-
Persian Gulf. Iran. J. Radioanal. Nucl. Chem. 270 (2), 319-324.
Alam MN; Miah MMH; chowdhury, MI; Kamal, M; Ghose, S; Islam, MN; Mustafa,
MN; and Miah, MSR; 1999. Radiation dose estimation from the radioactivity
analysis of lime and cement used in Bangladesh J.Environ. Radioactive. 42.
77-85.
Cottens, E., 1990.Actions against radon at the international level. In: Proceeding of
the Symposiumon SRBIl, Journee Radon, Royal Society of Engineers and
. Industrials of Belgium, 17 January 1990, Brussels
RC, 1999. European Commission report on radiological protection principles
concerning the natural radioactivity of building materials. Radiation
protection 112.
Forlkerts, K.H. Keller and G., Muth, R., (1984). Radiat. Prot. Dosim. 9, 27, 27-34.
Hayambu, P., Zaman, M.B., Lubaba, N. C.H., Munsanje, S.S., Muleya,
D., 1995.Journal of Radioanalytical and Nuclear Chemistry 199 (3), 229-
238.
ICRP, International Commission on Radiological Protection (1993). ICRP Publication
65, Annals. Of the ICRP 23 (2). Pergamon Press, Oxford.
Isinkaye, Omoniyi M; 2008. Radiometric assessment of natural radioactivity levels of
bituminous soil in Agbabu, Southwest Nigeria. Radiation Measurement 43,
125-128.
164

Keller, C, Muth, H., 1990. Natural radiation exposure in medical radiological. In
Scherer, Streffer, Ch., Toll, K.R. (Eds). Radiation and occupational Risks.
Springer Verlag, Berlin.
Krieger, R. 1981. Radioactivity of construction materials. Betonwerk Fertigteil
Tech.47,468-473
Kumar, A., Narayani, K.S., Sharma, D.N. and Abani, M.C., (2001). Radiation
Protection and Environ. Vol. 24, No. I & 2., 195-2000.
Mahur, A.K. Kumar, Rajesh., Sengupta, D., Prasad, Rajendra; 2008. 'Estimation of
radon exhalation rate, natural radioactivity and radiation doses in fly ash
samples from Durgapur Thermal Power Plant, West Bengal, India. Journal of
Environmental Radioactivity xxx, 1-5.
Matiullah, A. Ahad; Rehman, Shakellur; Rehman, Shafiur, Faheem, M., 2004
Measurement of radioactivity in the soil of Bahawalpur Division, Pakistan.
Radiation Protection Dosimetry, 112 (3), 443-447.
Mehra, Rohit., Singh Surinder, Singh, Kulwant., Sonkawade, Rajedra; 2007. ^ *Ra,
^ Th, and ''"k analysis in soil samples, from some areas of Malwa region,
Punjab, India using gamma ray spectrometry. Environ. Mohit Assess DOI 10.
1007/s 10661-007-9624-3.
Singh, Surinder; Rani, Asha; Mahajan, Rakesh Kumar ; 2005. ^ ^Ra, "^Th, and ""K
analysis in soil samples from some areas of Punjab and Himachal Pradesh,
India using gamma ray spectrometry. Radiation Measurements 39, 431 -439.
Somlai, J., Jobbagy, V; Somlai, K; Nemeth, CS; Kovasc, T; 2008. Connection
between radon emanation and some structural properties of coal-stag as
building material. Radiation measurement (43), 72-76.
165

Tufail, M; Akhtar, N; Javied, S; and Hamid, T; 2007. Natural radioactivity hazards of
building bricks fabricated from Saline soil of two districts of Pakistan J.radio).
Prot.27, 481-92.
Turhan, S., baykan, U.N., Sen, K., 2008. Measurement of the natural radioactivity in
building materials used in Ankara and assessment of external doses. J. Radiat.
Prot. 28, 83-91.
Tzortzis M., Svoukis, E., Tsertos, H., 2004. A Comprehensive Study of Natural
Gamma Radioactivity Levels and Associated Dose Rates from Surface Soils
in Cyprus. Revised Version.
UNSCEAR (1993). Sources and Effects of Ionizing Radiation. United Nations
Scientific Committee on the effect of atomic radiation New York: Unites
Nations.
UNSCEAR 2000. Sources and Effects of Ionizing Radiation. Report to General
Assembly, with scientific Annexes, United Nations, New York.
UNSCEAR, 2000. Sources and Effects of Ionizing Radiation. United Nations
Scientific Committee on the Effect of Atomic Radiation, United Nations, New
York.
Whicker, F.W. Schultz, V; 1982. Radioecology Nuclear energy and environment vol.
1, CRC Press Inc. Bo Ca Raton, FL, 73 pp.
Yu, K.N., Guan, Z., Stoks, M.J., Young, E.G., 1992. J. Environ. Radioactivity 17,
31-48.
166

cf^v tef 1/

CHAPTER-V
Measurements of Radon, Thoron and their Progny in dwellings
5.1 Introduction
The behavior of ubiquitous radon and its progeny in the indoor atmosphere generally
reflects a complex interplay between a number of processes, the most important of
which are radioactive a- decay, ventilation, attachment to aerosols and deposition on
the surfaces. Indoor Rn exposure depends in a complex way on the characteristics of
the soil, the type and details of the building structure, meteorology, ventilation
conditions and occupant behavior. The measurements of time integrated concentration
of indoor radon and its daughters are important since indoor radon and its progeny is
responsible for more than half of the total yearly radiation dose to human beings.
Study of radon and its progeny in air is indispensable, as these deliver the highest
radiation dose to human beings among all natural radioactive sources. It has been
estimated that inhalation of short-lived radon progeny accounts for more than half of
the effective dose from natural sources (UNSCEAR, 1993). Airborne concentrations
of radon and its progeny vary from time to time, depending upon the meteorological
conditions, such as temperature, relative humidity, wind speed, rainfall etc. Among all
sources of background radiation that deliver significant doses to the tissues or cells of
respiratory tract. The inhaled radon progeny are dominant and is about 55% of the
total doses. There is increasing concern about exposure to radon and its progeny due
to their detrimental effects on the health of inhabitants (Durrani, 1993). For an
individual person exposed to radon gas for a long time, there is, from medical point of
view, an increase in the risk for growth of a lung cancer (ICRP, 1987), although low
dose radiation lower the risk of cancer (Toth et al., 1998 ). The earth's crust contains
trace amounts of ^*U and ^ Th which decay to ^ Rn and ^ °Rn respectively. The
167

radon gas molecules can migrate into the atmosphere from the ground through cracks
and fissures via transport mechanism (diffusion, fluid convection). Radon enters
living area mainly through floor from subsoil and building materials and starts
accumulating in poorly ventilated dwellings. So, concentration of radon and its
progeny are usually higher in indoor air than in outdoor air. The seventh generation
decay product of Uranium, radon, in indoor environment, contributes some what more
than one half of the collective dose received by human population from all sources of
exposure. Precisely, out of 98% of average radiation dose received by man from
natural sources, about 52% is due to breathing of radon, thoron and their progeny
present in the dwellings (UNSCEAR,1988). Concentrations of radon and its decay
products in the indoor air of a room depend on their input rates into the air and the
rates at which they are removed from the air. Exposure of indoor radon levels is
significantly influenced by factors like topography, house construction, soil
characteristics, weather and even the life-style of the dwellers. The main contributions
of indoor radon are: (i) diffusion from building elements, 21%; (ii) diffusion from
subjacent earth, 15%; (iii) advection from subjacent earth, 41%; (iv) infiltration by
outdoor air, 20% (v) de-emanation from water supply, 2% (vi) consumption of natural
gas, l%i. There has been increasing interest in indoor radioactivity measurements
motivated by the concern about the possible consequences of long time exposure to
higher concentrations of ^ Rn and ^ °Rn and their progeny (Subba Ramu et al., 1991).
While indoor radon exposure has received wide public attention vis-a-vis lung cancer
risk due to inhalation, not much information is known about the levels and risk
associated with thoron ( °Rn) in indoor air because of its short half life. However,
half-lives of its daughter products ' Pb (10.6h) and ' Bi (60. 6 min.) are comparable
with biological elimination rate. The inhalation lung dose is relatively smaller than
168

that from radon progeny. Radiation exposure due to inlialation of thoron progeny is
estimated to be of the order of 10-20% compared with short-lived radon progeny
(Nambi,1994). Environmental radiation is ubiquitous and all these years living beings
have been exposed to such environment. Exposure to radon and its progeny is known
to contribute the largest fraction to collective dose. In some places presence of higher
values of thorium contributes to significant levels of thoron and its progeny.
Generally, living standards are related to the industrial developments. Some of the
industries contribute radiation pollution to the environment and uranium mining is
such an activity.
Radon contributes to a large part of the radiation exposure to the general public
(Metters, 1992) and it might produce lung cancer if inlialed in high concentration for
long period (ICRP 65, 1993; Lubin and Boice, 1997; BIER VI, 1999). This high
exposure level may be harmful for people residing in the region.
5.2 Action Level Limits
The radon concentration at which the measures would need to be undertaken to
reduce radon exposure is known as the action level.
The action level for radon in the work place is given in IAEA report- 2003 as an
yearly average concentration of lOOOBq m' which would, for an assumed occupancy
of 2000 hours per year, equate to an effective dose of about 6 mSv. This value of
1000 Bq m" is at the midpoint of the range 500-1500 Bqm' recommended by the
International Commission of Radiological Protection (ICRP), and some regulatory
bodies may wish to adopt a lower level than was specified in IAEA report, 2003. It
should be noted that the range of values given by the ICRP was based on an assumed
equilibrium factor of 0.4 between radon and its progeny.
169

There is a practical advantage for adopting a single value for the action level which
may be applied in all situations, irrespective of the equilibrium factor. Nevertheless,
although not explicitly stated in IAEA report, 2003, other action levels may be
appropriate if the equilibrium factor is significantly different from 0.4. For example, if
the actual equilibrium factor is 0.8, then in theory at least a value for the action level
of 500 Bq m'"' might be appropriate.
Nevertheless, this action level for radon in workplaces does not mark a boundary
between 'safe' and 'unsafe' exposures. Unless the exposure is excluded or the
practice or the source is exempted, regulatory bodies are free to establish an
occupational action level below 1000 Bq m" if national circumstances make this
practicable.
5.3 Indoor Radon and its Progeny
Among many surveys carried out for radon studies the largest and most recent of
these was an international study led by the National Cancer Institute (NCI), USA
which examined the data on 68,000 underground miners who were exposed to a wide
range of radon levels. The study on miners shows the probability of death due to lung
cancer five times more than expected for the general population. Several surveys
performed in Europe and North America (Samet et al., 1989; McGregor et al, 1980;
Swedjemark et al, 1984; Nero et al., 1986; Cohen et al, 1985) revealed that some
countries have high radon concentration in many of their dwellings. It has been well
recognized all over the world that high radon concentration in the houses may pose a
significant risk of lung cancer to the people living there. Studies form all over the
world show that a well planned and systematic measurement of indoor radon
concentration is necessary to calculate the actual dose due to exposure of indoor radon
concentration.
170

Experimental Details
With the growth of solid state nuclear track detectors (SSNTD's) into a powerful
experimental tool in the detection and measurement of charged particle radiation, it
has now become an important detection technique to measure radon and its progeny
in the environment. The passive time integrated method of using a solid state nuclear
track detector was employed for measuring the potential alpha energy concentration
(PAEC) of radon daughters in working level(WL) units. Strips of Kadak Pathe LR
US type II film were used as the detector in "BARE MODE".
The pieces of the detector film of size 2 cm x 2 cm fixed on a thick flat card
were exposed in bare mode, shown in Fig.5.1 by hanging the cards on the wall in the
dwellings for a period of 90 days such that the detector viewed a hemisphere of radius
at least 6.9 cm, the range of ^'''Po a- particles in the air.
2 X 2 c m
L R - 1 1 5 Type II Plastic TrackDetector
Fig 5.1 Bare mode Technique
171

No surface should be close to this range as the decay products deposited on it would
act as an additional alpha particle source including a larger error in the measurements.
The track density registered in the detector will, therefore, be a function of radon
progeny concentration in air. The radon concentration in Bq m' was estimated by
using the relation.
R„C(Bqm )= (1) F
Where F is known as the equilibrium factor, our group's measurements for the
equilibirium factor F for radon at different places carried out earlier (Khan, et al.,
1995) gave its mean value as 0.37. Subba Ramu et al.(1990) measured its value in a
large number of Indian dwellings varying from 0.38 to 0.70 with an average value of
0.43. Recently Virk and Sharma (2000) have reported the value of 0.390. Thus we
have taken 0.45 as the value of F for finding the radon concentration(RnC). To know
the potential Alpha energy concentration (PAEC) of radon progeny in mWL it is
essential to calibrate the LR-115 type II detector films with a known radon
concentration under almost similar conditions to those which prevail in Indian
dwellings. For this purpose, the detectors were calibrated in a radon exposure
chamber at the facility available in Environmental assessment division of Bhabha
Atomic Research Centre, Mumbai (Jojo et al., 1994). The mean calibration factor for
LR-115 type II detector was found to be 442 tracks, cm" d'' per WL.
5.3.1 Measurement of Indoor Radon and its Progeny In Dwellings around Kasimpur Thermal Power Plant
Kasimpur has a big coal fired thermal power plant. Large quantity of coal consumed
by coal-fired power plants is likely to increase the quantity of radon in the
surroundings and in neighboring regions as subsequent emission of fly ash to the
environment can cause enhancement in the ambient radiation levels. This increase
172

may be due to the fact that coal contains uranium and radon is a member of uranium
decay series.
In the present study radon dosimeters containing LR-115 type II detector films
in bare mode were placed in 30 rooms in the dwellings around Kasimpur Thermal
Power Plant. Films (LR-15 type II) were exposed in the living room, bed rooms,
kitchens, store rooms, verandahs and Bathrooms etc. for 90 days. After exposure, the
detectors were collected and brought back to the laboratory for analyses. The exposed
films were etched in 2.5 NaOH solution at 60°C for 90 min in a constant temperature
water bath. The counting of alpha tracks was done using a binocular optical research
microscope with a magnification of 400x. At least 300-400 tracks were counted in
each detector film to keep the statistical error of counting to a minimum.
Results and Discussion
Table 5.1 presents the measured PAEC values of radon daughters in mWL units,
radon concentration in Bq m' and annual effective dose equivalents in mSv y"'. The
radiation doses to the basal layer of epithelium are estimated in terms of the effective
dose equivalents using the conversion factor of 9mSv/WLM suggested by ICRP-65.
The measured radon concentration in the dwellings of Kasimpur Thermal
power plant varies from 56.2 Bq m'"' to 241.4 Bq m" with an average value of ('
150.24 Bq m"''. The radon activity may vary with the ventilation conditions, type of
construction materials and other factors. Annual effective dose equivalent in the /
dwelling around Kasimpur Thermal Power Plant varies from 2.1 mSv y"' to 9.2 mSv
y" with an average value of 5.71 mSv y"' . Kitchen shows the maximum radon
concentration . This may be due to the contribution of radon from fuels (gas, kerosene
etc.) and water. Courtyard is fairly ventilated and thus gives minimum value of radon.
173

Table 5.1
Indoor radon levels in dwellings of Kasimpur thermal power Plant
S.No.
1 2 3 4 5 6 7 8 9 10 11 12 13 14 15 16 17 18 19 20 21 22 23 24 25 26 27 28 29 30
Location
Bedroom Store room Varandah Kitchen Drawing room Bed room Bath room Courtyard Store room Study room Drawing room Worship room Bed room Store room Kitchen Dining hall Bed room Varandah Bath room Courtyard Bed room Varandah Kitchen Drawing room Bath room Courtyard Bed room Varandah Drawing room Bed room Average value S.D. Rel. Std%
Track Density (Tr/Sq
cm/day)
8.4 5.5 4.4 11.6 6.6 5.7 11.7 3.0 10.7 5.9 10.3 11.4 6.4 11.2 12.9 6.0 6.8 3.9 10.5 3.2 10.1 3.7 12.1 10.8 9.9 3.4 9.1 4.1 11.0 11.9 8.07 3.26 40.39
Potential Alpha
Activity (mWL)
18.9 12.5 10.1 26.1 14.9 12.9 26.5 6.8 24.1 13.3 23.3 25.7 14.5 25.3 29.4 13.7 15.3 8.8 23.7 7.2 22.9 8.4 27.4 24.5 22.5 7.6 20.5 9.3 24.9 26.9 18.26 7.37 40.36
Radon Activity (Bqm- )
155.4 102.5 82.6 214.9 122.4 105.8 218.3 56.2 198.4 109.1 191.8 211.7 119.1 208.3 241.4 112.4 125.7 72.8 195.1 59.5 188.5 69.4 224.9 201.7 185.2 62.8 168.7 76.1 205.0 221.6 150.24 60.67 40.38
Annual Effective
dose equivalent (mSvy-*)
5.9 3.9 3.1 8.2 4.7 4.0 8.3 2.1 7.5 4.2 7.3 8.0 4.5 7.9 9.2 4.3 4.8 2.8 7.4 2.3 7.2 2.6 8.6 7.7 7.0 2.4 6.4 2.9 7.8 8.4 5.71 2.31 40.46
The system of dose limitation recommended by the International Commission on
Radiological Protection (ICRP-65) applies for protection against radon and progenies
also. A.K. Singh et al summarises the health effects of inhaled radon and its progenies
174

and gives recommendations/ guidelines for the control of exposure to high levels of
radon encountered in dwellings and in work places. The commission in its report has
recommended that some remedial measures against radon in dwellings are always
justified above a continued effective annual dose of 10 mSv. Further, it also
recommends that the action levels Should be set within a range of 3-10 mSv by
appropriate regulatory authorities. On this basis of these recommendations, it is
observed that the radon levels in dwellings surveyed in Kasimpur thermal power plant
are in the action level limit.
The variation of PAEC and radon concentration with type of room are shown
in Fig. 5.2
k3 k6 k9 k12 kIS k18 k21 k24 k27 k30
Fig 5.2 Variation of PAEC(mWL)and radon concentration(Bqni ) with type of room
5.3.2 Measurement of Indoor Radon and its Progeny In Dwellings of Ukhalana Village
Present investigation were carried out to find the indoor radon levels in the dwellings
of Ukhalana village situated about 5 km from Kasimpur Thermal Power Plant to
study the effect of fly ash spreading from the Power Plant in the neighboring region.
175

Radon dosimeters containing LR-115 films were fixed in 20 rooms in the dwellings of
Ukhalana village.
Results and Discussion
Table 5.2 Presents the measured PAEC values of radon daughters in mWL units,
radon concentration in Bq m''' and annual effective dose
Table 5.2
Indoor radon levels in dwellings of Ukhalana village
s. No.
1
2
3
4
5
6
7
8
9
10
11
12
13
14
15
16
17
18
19
20
Location
Living room
Living room
Varandah
Living room
Courtyard
Kitchen
Staircase
Bathroom
Staircase
Varandah
Living room
Store room
Living room
Kitchen
Living room
Varandah
Courtyard
Bathroom
Living room
Staircase
Average value
S.D.
Rel. Std.%
Track Density (Tr/Sq
cm/day)
7.1
7.8
4.4
8.9
2.4
12.7
9.8
7.6
8.7
4.8
8.4
9.6
5.5
10.7
8.2
4.3
3.2
7.3
8
7.5
7.35
2.59
35.24
Potential Alpha
Activity (mWL)
16.0
17.7
10.1
20.1
5.8
28.7
22.1
17.3
19.7
10.9
18.9
21.7
12.4
24.1
18.5
9.7
7.2
16.5
18.1
16.9
16.59
5.85
35.26
Radon Activity (Bqm-')
131.7
145.5
82.7
165.4
44.3
236.1
181.9
162.2
162.0
89.3
155.4
178.6
102.1
198.4
152.1
79.4
59.5
135.6
148.8
138.9
136.49
48.10
35.24
Annual Effective
dose equivalent (mSvy-')
5.1
5.5
3.2
6.3
1.7
9.0
6.9
5.4
6.2
3.4
5.9
6.8
3.9
7.5
5.8
3.0
2.3
5.2
5.7
5.3
5.21
1.82
34.93
176

equivalent in mSv y"'. The radiation dose to the basal layer epithelium are estimated
in terms of the effective dose equivalent using the conversion factor of 9 mSv/WLM,
suggested by ICRP-65.
The measured radon concentration in the dwellings of Ukhalana Village varies
from 44.3 Bq m" to 236.1 Bq m' with an average value of 136.49 Bq m" Radon
activity may vary with the ventilation condition, type of construction materials and
other factors. Annual effective dose equivalent varies from 2.5 mSv y ' to 8.9 mSv y"
' with an average value of 5.21 mSv y"'. In this case also Kitchen shows the maximum
radon concentration which may be due to the contribution of radon from fuels (gas,
kerosene etc.) and water. Courtyard here also gives minimum value of radon due to
fair ventilation. The variation of PAEC and radon concentration with type of room is
shown in Fig. 5.3.
. -3 \ Fig 53 Variation of PAEC(mWL) and radon concentration(Bq m') with type of rooms
177

5.3.3 Measurement of Indoor Radon and its Progeny In the Dwellings of Sunamai Village
Present investigations were carried out to find the indoor radon levels in the Sunamai
village. It is situated about 3 km from Kasimpur Thermal Power Plant. Radon
dosimeters containing LR-115 films were fixed in 10 rooms of different type in the
dwellings of Sunamai village. Table 5.3 presents the measured PAEC values of radon
daughters in mWL units, radon concentration in Bq m''' and annual effective dose
equivalents in mSv y"'. The radiation doses to the basal layer of epithelium are
estimated in terms of the effective dose equivalents using the conversion factor of 9
mSv AVLM suggested by ICRP-65.
Table 5.3
Indoor radon levels in dwellings of Sunamai village
s. No.
1 2 3 4 5 6 7 8 9 10
Location
Varandah Bath room Varandah Bed room Varandah Living room Staircase Courtyard Kitchen Drawing room Average value S.D. Rel. Std.%
Track Density (Tr/Sq cm/day
5.2 8.5 5.3 6.2 4.8 9.4 7.1 3.6 12.6 9.2 7.19 2.72 37.97
Potential Alpha Activity (mWL)
11.7 19.3 12.1 14.1 11.3 21.3 16.1 8.0 28.6 20.9 16.34 6.18 37.82
Radon Activity (Bq m- ^
95.9 158.7 99.2 115.7 92.6 175.3 132.3 66.1 234.8 171.9 134.25 50.81 37.85
Annual Effective
dose equivalent (mSvy-')
3.7 6.0 3.8 4.4 3.5 6.7 5.0 2.5 8.9 6.5 5.1 1.92 37.65
The measured radon concentration in the dwellings of Sunamai village varies from
66.1 Bq m" to 234.8 Bq m' ' with an average value of 134.25 Bq m" .The variation
in radon activity may vary with the ventilation conditions, type of construction
178

materials and other factors. Annual effective dose equivalent varies from 2.5 mSv y'
to 8.9 mSv y'' with an average value of 5.1 mSv y"'. As in previous cases kitchen
shows the maximum radon concentration and courtyard the minimum value of radon.
The variation of PAEC and radon concentration with type of rooms is
presented in Fig 5.4.
I Radon CononlraUon (Bq/m ) • PAEC(inWL)
s1 s2 S3 s4 sS s6 s7 s8 s9 s10
Fig 5.4 Variation of PAEC(mWL)and radon concentration(Bq m') with type of room
5.4 Indoor Radon, Thoron and their Progeny using Twin Chamber Dosimeter Cups
Measurement of radon, thoron and their progeny is important because of the radiation
dose to human population due to inhalation of radon, thoron and their progeny. As the
radon progeny contributes a major part of natural radiation dose to general population,
attention has been given to the large scale and long term measurement of radon and its
progeny. Thoron and its progeny contribute little for the radiation dose in normal
background region due to its small half life. Thoron, " Rn, is a natural decay product
of thoron series. It has a half life of 55.6 seconds and decays through alpha particles.
It is assumed that the inhalation dose to the human beings from thoron and its progeny
179

is negligible although some studies in many countries have revealed that this may not
be entirely correct (Steinhauser et al., 1994).
Experimental Details
Concentration of radon- thoron and their progeny were measured using the twin
chamber solid state nuclear track detector (SSNTD) based dosimeters using 12 (im
thick, LR-115 type II pelliculable, celluslose nitrate based SSNTDs, manufactured by
Kodak Pathe, France. The dosimeter has been developed at Bhabha Atomic Research
Centre (BARC) (Mayya et al., 1998) and is shown in Fig. 5.5. Each cylindrical
chamber has a height of 4.1 cm and a radius of 3.1 cm. one piece of the detector film
(SSNTD) of size 3cm x 3cm, placed in compartment M measures radon only which
diffuses into it from the ambient air through a semipermeable membrane of 25 jxm
thickness having diffusion coefficient in the range of 10'* to 10"' cm" s"' (Eappen and
Mayya, 2004). It allows the build up of about 90% of radon gas in the compartment
and suppresses thoron gas concentration by more than 99%. The mean time for radon
to reach the steady-state concentration inside the cup is about 4.5 hours. Glass fiber
filter paper and thickness of 0.56 mm in the compartment R allows both radon and
thoron gases to diffuse into it and hence the tracks on second piece of the detector
film placed in this chamber are related to the concentration of both the gases. Third
piece of the detector film exposed in bare mode (placed on the outer surface of the
dosimeter) registers alpha tracks attributed to both the gases and their alpha emitting
progeny, namely '*Po, ' Po and ' Po. LR-115 detectors do not develop tracks
originating from the progeny alphas, deposited on them (Durrani, 1997; Eappen et al.,
1998; Nikolaev and Illic Illic, 1999;) and, therefore, are ideally suited for radioactive
gas concentration study. The exposed films were etched in 2.5 NaoH solution at 60%
°C for 90mins. in a constant temperature water bath. The etching processes removes a
180

bulk thickness of 4 )im, leaving a residual detector for thickness of 8 fim. The
detectors are pre-sparked using spark counter (Cross and Tammasino, 1970) at a
voltage of 900V to fully develop the partially etched track holes. The tracks are then
counted at the voltage corresponding to the plateau region of the counter (450V). The
concentrations of radon, thoron and progeny are computed from the observed track
densities using appropriate calibration factors. The calibration factors depend upon
various parameters such as membrane and filter characteristics as well as the energy
of the alpha particles for the cup mode exposure, the parameters of the etching
process and spark counting characteristics.
From the track density, concentration of radon (CR) and thoron (CT) were
calculated using the sensitivity factor determined from the controlled experiment (
Mayya et al, 1998; Sannapa et al, 2003).
CR(Bqm-^) = TJdxSn, (1)
CT(Bqm-^) = Tf-dxQxSrf/dxStf (2)
where
CR = Radon concentration
CT = Thoron concentration
Tm = Track density in membrane compartment
Tf = Track density in filter compartment
d = Exposure time
Sensitivity factor for membrane compartment is
(Sn,) = 0.019 +0.003 trcm-^d"'/Bqm-^
Sensitivity factor for radon in filter compartment is
(Srf) = 0.020 ± 0.004 trc m- d "'/Bq m"
Sensitivity factor for thoron in filter compartment is
181

(S,f) = 0.016 ± 0.005 trc m" d-'/Bq m'
The inhalation dose (D) in mSv y"' is estimated using the relation:
D = [(0.17 + 9 FR ) CR+ (0.11+32FT) CT ] x 7000 x lO"* (3) where FR
and FT are equilibrium factor for radon and thoron respectively. The values are taken
as 0.4 and 0.1 for radon and thoron (UNSCEAR, 2000).
The life time fatality risks were also calculated from the values obtained for
radon and thoron and their daughters concentrations in terms of potential alpha energy
concentration (PAEC) in mWL extracted from bare detector exposure. Measured
radon/thoron concentrations were converted into equilibrium equivalent concentration
(EEC) which was further converted into potential alpha energy concentration (PAEC)
using the relation:
CR or CT= PAEC (WL) x 3700/F (4)
where, F is the equilibrium factor and its value is 0.4 and 0.1 for radon and thoron
respectively (UNSCEAR, 2000). PAEC is converted into annual effective dose by
using dose conversion factors. Radon daughter dose conversion factor for the
population is given as 3.9 mSv per WLM whereas the effective dose equivalent for
thoron is 3.4 mSv per WLM (ICRP, 1981). The life time risk associated with the
exposure due to indoor radon and its progeny was computed by using 1 WLM =
10x10"* case/year. If the risk persists for 30 years, life time fatality risk is 3x10'"*
case/WLM (ICRP, 1981).
182

Membrane Filter
M Randon
Compartment
T 1 • 2 II 1
R Randon + Thron
Compartment
Glass Fibre Filter
Fig 5.5 Radon-Thoron mixed field dosimeter system
5.4.1 Measurement of Indoor Radon, Thoron and their Progeny in Dwellings inside the Kasimpur Thermal Power Plant
In Kasimpur a big coal fired Thermal Power Plant is operational. Due to burning of
coal which contains higher levels of uranium (Jojo et al., 1993) the subsequent
emission to the environment can cause enhancement in the ambient radiation levels.
In the present study, indoor radon/thoron measurements were carried out in the
dwellings in the surroundings of the Plant and in neighboring regions using SSNTDs
in plastic twin chamber dosimeter cups,
Experimental Details
Concentration of radon- thoron and their progeny levels inside the power plant were
measured using the twin chamber solid state nuclear track detector (SSNTD) based
dosimeters using 12 jam thick celluslose nitrate based pellicuiable LR-115 type II
detectors, manufactured by Kodak Pathe, France. Twin chamber dosimeter cups fitted
with LR-115 type II films were placed at 10 places inside the Kasimpur thermal
power plant. All dosimeter cups were exposed for 100 days.
Results and Discussion
The values of radon and thoron concentration and inhalation dose obtained by using
relations 1,2 and 3 are presented in Table 5.4. The results of the life time fatality risks
are given in Table 5.5. Radon concentration is found to vary from 16 ± 2.9 Bq m" to
183

61± 5.6 Bq m"'' whereas thoron concentration varies from 6 ± 0.7 Bq m" to 56 + 5.1
Bq m'''. Radon and thoron PAEC values are found to vary from 1.73 ±0.31 mWL to
6.59 ±0.61 mWL and 0.16 ± 0.02 mWL to 1.51 ± 0.4 mWL. The annual effective
dose from radon, and thoron is found to vary from 0.05 mSv y"' to 0.95 mSv y''. The
life time fatality risk factor was also estimated and it varies from 0.01x10^ to 0.24 x
10'*. The wide variation in the concentration of both radon and thoron and their
daughters may be attributed to the
Table 5.4
Radon and Thoron Concentration and Inhalation dose inside Kasimpur Thermal Power Plant
Location
Oil cooler Water treatment plant Control room Office Near L.P heater Turbine hall 4 BMD store room Near stair case Mechanical workshop Near induced draft fan Minimum Maximum Average
value S.D.
(Tr cm- ) 73.00 54.35
62.25 57.81 44.66
62.00
59.00
31.33
116.8
112.6
31.33 116.8 67.38
27.33
Tf (Tr cm- ) 110.00 118.75
132.56 123.63 57.00
138.00
108.75
122.17
135.25
132.5
57.00 138.00 117.86
23.66
CR (Bq m-')
38 ± 4.4 28 ±3.8
32 ±4.1 30 ±3.9 23 ± 3.4
32 ±4.1
31 ±4.0
16 ±2.9
61 ±5.6
59 ±5.6
16 ±2.9 61 ±5.6 35 ±4.18
14.43±.85
CT (Bq m- )
21 ±2.0 39 ±3.6
42 ± 3.6 39 ±3.5 6 ±0.7
46 ±3.9
29 ±2.8
56±5.1
8 ±0.7
9 ±0.8
6 ±0.7 56 ±5.1 29.5 ± 2.67
17.69± 1.55
D (inhalation dose) (mSv y'*)
1.48 1.64
1.82 1.69 0.75
1.91
1.52
1.71
1.79
1.77
0.75 1.91 1.61
0.33
184

Table 5.5
Radon and Thoron daughters, annual exposure (WLM), life time fatality risk factor inside Kasimpur Thermal Power Plant
Location
Oil cooler Water treatment plant Control room Office Near L.P heater Turbine hall 4 BMD store room Near stair case Mechanical workshop Near induced draft fan Minimum Maximum Average value S.D.
Radon daughters
(mWL)
4.1010.48 3.0210.41
3.45 +0 .44 3.24 1 0.43 2.48 10 .37
3.45 1 0.44
3.35 10 .44
1.7310.31
6.5910.61
6.3810.60
1.7310.31 6.5910.61 3.78 10.45
1.5610.93
Thoron Daughters
(mWL)
0.57 10.05 1.0510.09
1.1410.09 1.0510.09 0.1610.02
1.2410.1
0.78 10 .08
1.51+0.14
0.221.02
0.2410.02
0.1610.02 1.5110.14 0.791.07
48 1 0.04
Annual Exposure (radon + Thoron) WLM
0.149 0.147
0.165 0.154 0.014
0.169
0.149
0.117
0.238
0.238
0.014 0.238 0.154
0.063
Life time fatality risk factor xlO"
0.45 0.44
0.49 0.46 0.04
0.51
0.44
0.35
0.71
0.72
0.04 0.72 0.46
0.19
Effective dose (mSv y'')
0.58 0.55
0.62 0.58 0.05
0.64
0.57
0.43
0.95
0.93
0.05 0.95 0.59
0.25
variation in radioactivity in the region, the soil beneath the house, the ventilation,
construction material and the type of construction etc.. Thoron may contribute a little
towards the radiation dose. The inhalation dose and radon and thorn concentration are
within the permissible limits. The percentage frequency distribution of radon in 10
dwellings is shown in Fig. 5.6. The percentage frequency distribution of thoron and
the percentage frequency distribution for dose rates in these dwellings are shown in
Figs. 5.7 & 5.8 respectively.
185

I Count
^1- y *JS-_ 1
Radon concentration(Bq m")
Fig 5.6 frequency distribution of radon in 10 dwellings inside of Kasimpur thermal power plant.
Thoron concentration(Bq m" )
Fig 5.7 Frequency distribution of thoron in 10 dwellings inside of Kasimpur thermal Power plant
186

1.4 1.6 1.8
Inhalation dose(mSv/Y)
Fig 5.8 Frequency distribution of inhalation dose in 10 dwellings inside of Kasimpur thermal power plant.
As can be seen the maximum frequency of radon concentrations of radon, thoron and
inhalation dose lie between 25 Bq m' to 35 Bq m' and 35 Bq m" to 45 Bq m"' and
1.5 mSv y'' to 1.8 mSv y'' respectively.
5.4.2 Measurement of Indoor Radon, Thoron and their Progeny in the dwellings of Ukhalana village
In the present study, indoor radon/thoron measurements in the dwellings of Ukhalana
village situated about 5 km from Kasimpur Thermal Power Plant were carried out to
obtain the representative data. Twin chamber dosimeter cups were fixed in 10
different type of rooms in the dwellings of the village for these measurements and the
method is described in the previous section 5.4
Results and Discussion
Tables 5.6 and 5.7 present the measured and computed data. Radon concentration is
found to vary from 13 ± 2.54 Bq m" to 42± 4.66 Bq m" whereas thoron concentration
varies from 11 ±1.27 Bqm" to 39 ±4.08 Bq m" as shown in Table 5.6. Radon and
187

thoron PAEC values vary from 1.41 ±0 .27 mWL to 4.54 ±0 .5 mWL and 0.29 ±0 .03
mWL to 1.05 ± 0.11 mWL. The annual effective dose
Table 5.6
Radon and Thoron Concentration and Inhalation dose in Ukhalana village
Location
Drawing
room
Courtyard
Store room
Bed room
Kitchen
Drawing
room
Kitchen
Bed room
Shop store
Varandah
Minimum
Maximum
Average
value
S.D.
T™ (Tr cm" )
25.13
30.83
51.33
81.25
28.00
26.12
28.35
55.50
31.28
29.00
25.13
81.25
38.68
18.34
Tf (Tr cm' )
82.21
85.17
97.67
116.00
91.33
48.33
72.00
75.67
75.00
58.33
48.33
116.00
80.17
19.29
CR (Bq m-')
13.0 ±2.59
16.0 ±2.88
27.0 ± 3.78
42.0 ±4.66
14.0 ±2.65
13.0 ±2.54
14.0 ±2.63
29.0 ±3.89
16.0 ±2.86
15.0 ±2.78
13.0 ±2.54
42.0 ±4.66
19.9 ±3.13
9.7±0.72
CT (Bq m-')
35.0 ±3.86
33.0 ±3.58
27.0 ± 2.73
20.0 ±1.86
39.0 ± 4.08
13.0 ±1.87
27.0 ±3.18
11.0 ±1.27
26.0 ± 3.00
17.0 ±2.23
11.0 ±1.27
39.0 ± 4.08
24.8 ± 2.77
9.4±0.94
D (inhalation dose) (mSv y"')
1.15
1.19
1.34
1.57
1.27
0.64
0.99
1.02
1.02
0.79
0.64
1.57
1.09
0.27
188
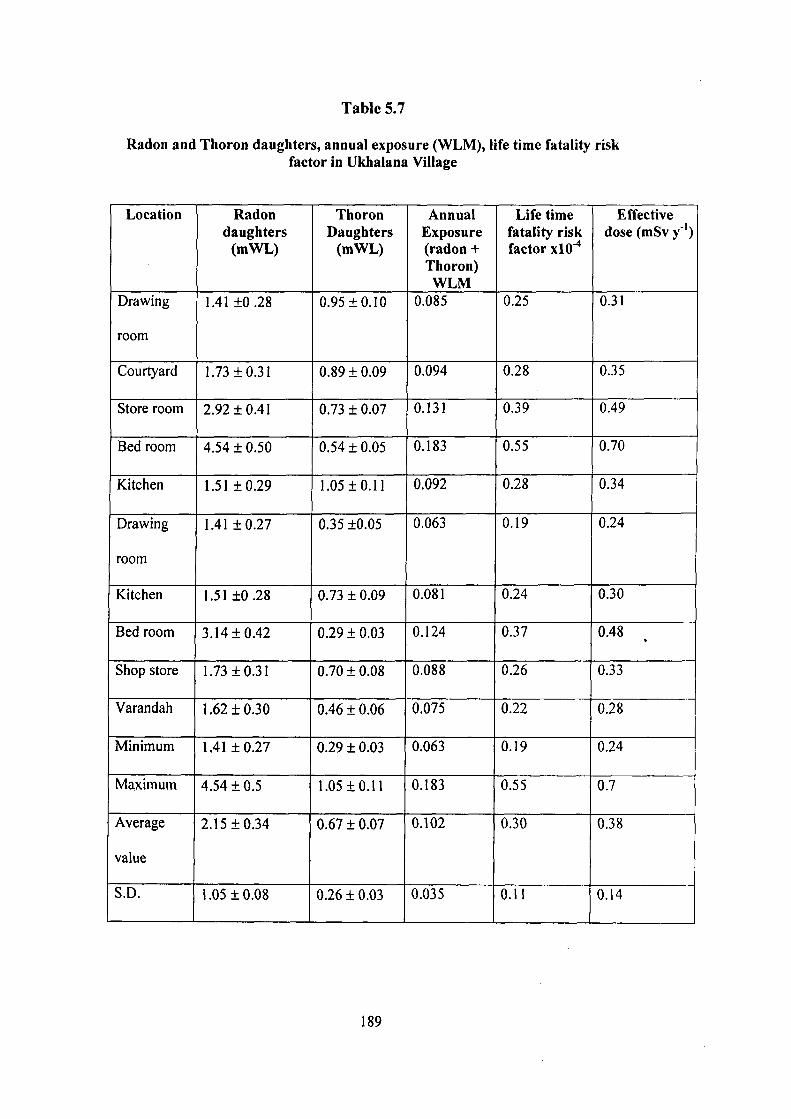
Table 5.7
Radon and Thoron daughters, annual exposure (WLM), life time fatality risk factor in Ukhalana Village
Location
Drawing
room
Courtyard
Store room
Bed room
Kitchen
Drawing
room
Kitchen
Bed room
Shop store
Varandah
Minimum
Maximum
Average
value
S.D.
Radon daughters
(mWL)
1.41+0.28
1.73 ±0.31
2.92 + 0.41
4.54 + 0.50
1.51 ±0.29
1.41 ±0.27
1.51 ±0.28
3.14 ±0.42
1.73 ±0.31
1.62 ±0.30
1.41 ±0.27
4.54 ±0.5
2.15 ±0.34
1.05 ±0.08
Thoron Daughters
(mWL)
0.95 ±0.10
0.89 ± 0.09
0.73 ± 0.07
0.54 ± 0.05
1.05 ±0.11
0.35 ±0.05
0.73 ± 0.09
0.29 ± 0.03
0.70 ± 0.08
0.46 ± 0.06
0.29 ± 0.03
1.05 ±0.11
0.67 ± 0.07
0.26 ± 0.03
Annual Exposure (radon + Thoron) WLM
0.085
0.094
0.131
0.183
0.092
0.063
0.081
0.124
0.088
0.075
0.063
0.183
0.102
0.035
Life time fatality risk factor xlO"'*
0.25
0.28
0.39
0.55
0.28
0.19
0.24
0.37
0.26
0.22
0.19
0.55
0.30
0.11
Effective dose (mSv y"')
0.31
0.35
0.49
0.70
0.34
0.24
0.30
0.48
0.33
0.28
0.24
0.7
0.38
0.14
189

from radon, and thoron is found to vary from 0.063 mSv y ' to 0.183 mSv y"'.
Estimated life time fatality risk factor varies from 0.19x10^ to 0.55xlO" as can be
seen from Table 5.7. The inhalation dose is found to vary from 0.64 mSv y"' to 1.57
mSv y"'. Due to its short half thoron contribution may be very small as expected in
normal background areas. In the present case radon and thorn concentrations are
within the permissible limits.
The percentage frequency distribution of radon in these dwellings is shown in
Fig.5.9. It is clear from the figure that majority of dwellings monitored, have radon
values lying between 10 Bq m" to 15 Bq m" . For thoron the percentage frequency
distribution is shown in Fig. 5.10. Majority of dwellings monitored, have thoron
values lying between 27.5 Bq m" to 35 Bq m" . Frequency distribution for dose rates
as shown in Fig.5.11 indicates that majority of dwellings have dose rate values lying
between 1 mSv y'' to 1.2 mSv y''.
I Count
40 45
Radon concentration(Bq m')
Fig 5.9 Frequency distribution of radon in dwellings of Ukhalana village
190

10 15 20 25 30 35 40 45
Thoron concentration(Bq m" )
Fig 5.10 frequency distribution of thoron in dwellings of Ukhalana village
Inhalation dose(mSv/Y)
Fig5.il Frequency distribution of inhalation dose in dwellings of Ukhalana village
191

5.4.3 Measurement of Indoor Radon, Thoron and their Progeny in Dwellings of Sunamai village.
Indoor radon and thoron measurements in the dwellings of Sunamai village using
twin chamber dosimeter cups was measured to see whether the distribution of fly ash
spreading from the Power Plant may change the ambient radiation level in the indoor
atmosphere. Same method was applied as discussed above.
Results and Discussion
Tables 5.8 and 5.9 present the data for radon, thoron and their daughters. Radon
concentration is found to vary from 14 + 2.67 Bq m" to 58+ 5.51 Bq m" whereas
thoron concentrations varies.
Table 5.8
Radon and Thoron Concentration and Inhalation dose in Sunamai Village
Location
Bath room Bath room Courtyard Store room Stair case Varandah Bed room Kitchen Minimum Maximum Average value S.D.
Tm (Tr cm- )
28.5 64.2 27.5 82.33 38.65 40.7 110.67 57.67 27.5 110.67 56.28
28.92
Tf (Tr cm- )
44.00 124.00 67.5 113.5 131.81 125.33 121.45 85.00 44.00 131.81 101.57
32.23
CR (Bq m-')
15 + 2.81 33 ±4.12 14 + 2.67 43 ± 4.74 20 ± 3.22 21 ±3.29 58 ±5.51 30 ±3.95 14 ±2.67 58 ±5.51 29.25±3.79
15.21 ±.98
CT (Bq m- )
8 ±1.21 36 ± 3.23 24 ±2.92 17±1.59 57 ±4.97 52 ± 4.65 3 ± 0.27 15 ±1.63 3 ±0 .27 57 ±4.97 26.5 ±2.56
19.98±1.67
D (inhalation dose) (mSv y"')
0.58 1.70 0.93 1.53 1.85 1.76 1.60 1.14 0.58 1.85 1.39
0.45
192

Table 5.9
Radon and Thoron daughters, annual exposure (WLM), life time fatality risk factor in Sunamai Village
Location
Bath room
Bath room
Courtyard
Store room
Stair case
Varandah
Bed room
Kitchen
Minimum
Maximum
Average value
S.D.
Radon daughters
(mWL)
1.62 ±0.30
3.57 ±0 .45
1.51+0.29
4.65 ±0.51
2.16 ±0.35
2.27 ±0 .36
6.27 ±0.59
3.24± 0.43
1.51 ±0.29
6.27 ±0 .59
3.16 ±0.41
1.65 ±0.10
Thoron Daughters
(mWL)
0.22 ± 0.03
0.97 ±0 .09
0.65 ± 0.08
0.46 ± 0.04
1.54 ±0.13
1.41 ±0.13
0.08 ±0 .007
0.41 ±0.04
0.08 ±0 .007
1.54 ±0.13
0.72 ±0 .068
0.54 ±0 .046
Annual Exposure (Radon + Thoron) WLM
0.066
0.163
0.078
0.184
0.133
0.132
0.229
0.13!
0.066
0.229
0.139
0.053
Life time fatality risk factor xlO"*
0.19
0.49
0.23
0.55
0.39
0.39
0.69
0.39
0.19
0.69
0.42
0.16
Effective dose (mSv y"')
0.25
0.62
0.29
0.71
0.49
0.49
0.89
0.50
0.25
0.89
0.53
0.21
from 3 ± 0.27 Bq m' to 57 ± 4.97 Bq m" Radon and thoron PAEC values vary from
1.51 ± 0.29 mWL to 6.27 ± 0.59 mWL and 0.08 ± 0.007 mWL to 1.54 ± 0.13
mWL. The annual effective dose from radon, and thoron is found to vary from 0.066
mSv y'' to 0.229 mSv y''. The life time fatality risk factof was also estimated and
193

varies from 0.19x10"^ to .69 x lO" . The inhalation does, radon and thorn
concentration are within the permissible limits.
The percentage frequency distribution of radon, thoron and inhalation dose are
shown in Figs. 5.12, 5.13 and 5.14.
• Count
o 2.5
10 20 30 40 50 60 70
Radon concentration(Bq m"')
Fig 5.12 frequency distribution of radon in 8 dwellings of Sunamai village.
10 20 30 40 50 60
Thoron concentration(Bq m' )
Fig 5.13 frequency distribution of thoron in 8 dwellings of Sunamai village
194

0.4 0.6 0.8 1.0 1.2 1.4 1.6 1.8 2.0 Inhalation dose(mSv/Y)
Fig 5.14 frequency distribution of inhalation dose in 8 dwellings of sunamai village.
It is clear from the Figures that majority of dwellings monitored, have radon values
lying between 10
Bq m'"* to 25 Bq m' and Majority of dwellings monitored, have thoron values lying
between 15 Bq m' to 30
Bq m' and majority of dwellings have dose rate values lying between 1.6 mSv y"' o
2.0 mSv y-'.
195

REFERENCES
BEIRVI, (1999), National Research Council; Health effects of exposures to radon,
National Academy Press, Washington, D.C.
BIERVl, 1999, committee on health risks of exposure to radon Health effects of
exposure to radon. National academy press, washing ton, DC.
Cross, W.G., Tommasino, L., 1970. Rapid reading technique for nuclear particle
damage tracks in thin Foils. Radiat. Eff. 5, 85-89.
Deka, P.C, Sarkar, Subir; Bhattacharjee, B., Goswami, T.D., Sarma, B.K.,
Ramachadran, T.V., 2003 Measurement of radon and thoron concentration by
using LR-115 type II plastic track detectors in the environ. Of Brahmaputra
Vally, Assam, India. Radiation Measurement 36, 431 -434.
Durrani S.A., 1997. Alpha particle etched detectors. In. Durrani, S.A., llic, R. (Eds),
radon measurement by etched track detectors. Application in radiation
protection, earth sciences and the environment. World scientific Singapore, PP.
77-101.
Durrani, S.A; Radon as a health hazard at home: what is the facts? Nucl. Tracks
Radiat. Meas. 22, 303-317.
Dwivedi, K.K. Mishra, R; Tripathy, S.P. Kulshreshtha, A; Sinha, D; Srivastava, A;
Deka, P; Bhattacharjee, B; Ramachandran, T.V. Nambi, K.S.V; 2001,
Simultaneous determination of radon, thoron and their progeny in dwellings;
Radiation Measurements 33, 7-11.
Dwivedi, K.K., Mishra, R; Tripathy, S.P. 2005, An extensive indoor ^ ^Rn/ °Rn
monitoring in North-East India, Radiation Measurements, 40, 621-624.
Eappen, K.P. Mayya YS., 2004. Calibration factors for LR-115 (type II) based radon
thoron discriminating dosimeter. Radiation Meas. 385-17.
196

ICRP, (1993), Protection against radon-222 at home and at work, ICRP publication
65, Annuals of the ICRP 23 (2). Pergamon Press, Oxford.
ICRP, 1891. Limits for inhalation of radon daughters by workers ICRP publication
32, Annals of ICRP 6(1). Pergamon Press, Oxford.
ICRP, 1987 lung cancer risk from indoor exposure to Radon daughters, report 50,
Vol. 17, No. 1.
ICRP; 1993. Protection against Radon-222 at home and at work, ICRP publications
65, Pergamon Press, Oxford.
ICRP-65, International Commission for Radiation protection., protection against
radon - 222 at home and at work. Annals of the ICRP, 23 (2), 1-48,
Pergamon Press,Oxford(1993).
International Commission on Radiological protection (ICRP, 1993). Protection
against radon -222 at home and at work. ICRP publ. 65, Ann. CRIP 23 (2), 1-
38.
Jojo , P. J., et al . 1994, Inter laboratory calibration of track - etch detector for the
measurement of radon and radon daughter levels. Rudiat. Meas., 23. 715-724.
Khan, A.J; et al. 1995. The distribution of radon levels in some Indian dwellings. 3"
International colloquium on Rare gas geochemistry . Amritsar. Proceedings, PP
299-300.
Khayrat, A.H; Al-Jarallah, M.I. Fazal-ur-Rehman, X; Abu-Jarad, F; 2003, Indoor
radon survey in dwellings of some regions in yemen. Radiation Measurements
36,449-451.
Kumar, Rajesh; Mahur, A.K; Varshney, A.K.; Prasad, R., 2003, Concentration of
indoor radon and its daughters in dwellings of Palampur City, Indian J.
environmental protection. Vol. 23, No. 10.
197

Kumar, Rajesh; Mahur. A.K., Varshney, A.K. Prasad, R; 2004, Distribution of Indoor
Radon levels in Dwellings of Palampur and Baijnath, Indian J. Environmental
Protection, Vol. 24, No. 8.
Lubin, J. H., Boice, Jr. J.D. Edling, C, Homung, R.W., Howe, G., Kunz, E., Kuziak,
R.A., Morrison, H.T., Radford, E.P., Samet, J.M. Tirmarche, M; (1995), Lung
cancer in radon exposed miners & estimation of risk from indoor exposure. J.
NatCan. Inst. 87, 817-827.
Lubin, J.H., Boice Jr., J.D., 1997. Lung cancer risk from residential radon. Meta
analysis of eight epidemiological studies. J. Nat. cancer Inst. 89,49-57.
Lubin, J.H., Boice, Jr. J.D. 1997, Lung cancer risk from residential radon, meta
analysis of eight epidemiological studies. J. Nat. Can. inst. 89, 49-57.
Mahur, A.K., Kumar, R., Jojo , P.J., Prasad , R; 2006. Study of Indoor Radon levels
in some Dwellings of Thankassery Town in Kerala.
Mayya Y.S., Eappen, K.P., Nambi, K.S.V., 1998. Methodology for mixed field
inhalation in monazite areas using a twin- cup dosimeter with three- track
detector. Radiat. Prot. Dosim. 77 (3) 177-184.
Metters, J. 1992. Radon in context. Radiat. Prof Dosim. 42 (3), 159-164.
Nambi, K.S.V., 1994. Radon Theron Exposures in hign back ground radiation areas-
bulletin of radiation protection 17, 49-52.
Nikolaev. V.A., Ilic. R., 1999. Etched Track radiometers in radon measurements: a
review. Radiat. Meas. 30, 1-13.
R, Kumar, Mahur, A.K., Kumar , Ashvani Prasad., R.,2005 Study of Radon and its
Daughter in Dwellings of Bhatinda Near Thermal Power Plant, NUCAR.
198

Ramoal, Rakesh Chand; Kandari, Manbrendra Singh; Negi, Manbeer Singh; and
Choubey, Vinay Mohan; 2000. A Study of Diurnal variation of indoor radon
concentrations, journal of health Physics, 35 (2), 211-216.
Reddy, K., Reddy B., Reddy, M., Reddy, Ch., P; Reddy, K. 2003, Baseline studies of
radon (Thoron concentration levels in and around the Lambapur and Peddagattu
areas in Nalgonda district, Andhra Pradesh, India, Radiation Measurement 36,
419-423.
Sannapa, J., Chandrashekara M.S., Sathish, L.A., Paramesh L., Venkataramath P.,
2003. Study of back ground radiation dose in musore city, Karnatka State, India:
Radiat. Meas. 37, 55-65.
Singh Kulwant; Singh, Manmohan; Singh, Surinder; Sahsta, H.S; Pupp, Z., 2005,
Variation of radon ( ^ Rn) progeny concentration in outdoor air as a function of
time, temperature and relative humidity.
Sonakawade , R.G„ Ramola R.C. Kanjilal, D.K. Dhiaryawan, M.P; Gupta, P; 2005.
Dosimeter in the environment of 15 UD Pelltron Accelerator using plastic Track
Detectors, Proc. 27* lARP Conference.
Steinhauser, F., Hofman, W; was and Lettner, H., 1994. Thoron Exposure to manz a
negligible issue Radiat. Prot. Dosim. 56, 1 -44.
Subba Ramu, M.C. Shaikh, A.N; Muraleedharan, T.S., Ramachandran, T.V., 1992.
Measurement of indoor radon levels using SSNTDs. Defence science journal
42,219-225.
Subba Ramu, M.C, et al, 1990. Measure of equilibrium factor for ^ Rn daughter in
dwellings in India. Sci. Total Env.
Toth, E., Lazar, I., Selmeczi, D., Marx, G., 1998. Lower risk in medium high radon
pathol. Oncol. Res. 4/2, 125-129.
199

United Nations Scientific Committee on the Effects of Atomic Radiations
(UNSCEAR), 1988. Sources and effects of ionizing radiation. UNSCEAR. No.
A/Ac 82 R-441.
UNSCEAR (2000), United nations scientific committee of the effect of Atomic
Radiation, Sources, Effects and risks of ionizing radiations. United nations, New
York.
UNSCEAR (United Nations Scientific committee on the effect of Atomic Radiation);
1993. Source Effect of Ionizing Radiation, United Nations New York.
UNSCEAR (United Nations Scientific Committee) on the effects of Atomic
Radiation) 1992. exposures from natural sources of radiation A/Ac. 82/R 511.
UNSCEAR, 1993. United Nations Scientific Committee on the effects of atomic
radiation. Sources and effects of ionizing radiation. Report to the general
Assembly with annexes. United Nations, New York.
Virk, H.S. 2000. Indoor radon/ thoron Survey report from Hamirpur and una districts,
Himachal Pradesh. Appl. Radiat. Isotopes. 52.137-141
200

List of Publications
Papers Published in journals
1. An investigation of radon exhalation rate and estimation of radiation doses in coal
and fly ash samples.
A. K. Mahur, Rajesh Kumar, Meena Mishra, D. Sengupta and Rajendra Prasad
Applied Radiation and Isotope 66 (2008) 401-406.
2. Indoor radon monitoring in some buildings surrounding the national Hydroelectric
Power Corporation (NHPC) project at Upper Siang in Arunachal Pradesh, India.
A. K. Mahur, Rajesh Kumar, Meena Mishra, Ameer Azam and Rajendra Prasad.
Indian Journal of Physics, 2008 (In Press).
Papers Presented/ Accepted in conferences National/ International
3. Measurement of radon exhalation rate and estimation of radiation doses in coal and
fly ash samples from a thermal power plant.
A. K. Mahur. Meena Mishra. Rajesh Kumar, D. Sengupta and R. Prasad
S"' Nuclear and Radiochemistry Symposium, Feb. 14-17, 2007. The Maharaja Sayajirao
University of Baroda, Vadodra, India.
4. Radon exhalation rate in coal and fly ash fiom thermal power plants, environmental
implications.
Ajay Kumar Mahur, Meena Mishra. Rajesh Kumar and Rajendra Prasad
Fifteenth National Symposium on Environment (NSE-15), June 5-7, 2007. Department of
Physics, Bharathiar University, Coimbatore, India.
5. Indoor radon monitoring in some dwelling surrounding the National Hydroelectric
Power Corporation (NHPC) Project at Upper Siang in Arunachal Pradesh, India.
A. K. Mahur, Rajesh Kumar, Meena Mishra and Rajendra Prasad
Fifteenth National Symposium on Solid State Nuclear Track Detectors and their
Applications (SSNTD-15), June 21-23, 2007, Department of Physics, H. N.B. Garhwal
University, Badshahi Thaul Campus,Tehri Garhwal (Uttarkhand), India,
201

6. Assessment of natural radioactivity in soil collected from Jaduguda U-mines area East
Singhbhum shear zone, Jharkhand India and radiological implications.
A. K. Mahur, R. Kumar, M. Mishra. S. A. Ali, R. G. Sonkawade, B. P. Singh, V. N.
Bhardwaj and Rajendra Prasad
International Conference on Radioecology and Environmental Radioactivity at Bergen,
Norway, June 16-20, 2008.
7. Investigations of radon exhalation rates, natural radioactivity and radiation exposure in
fly ash from thermal power plants, India.
A. K. Mahur Rajesh Kumar, Meena Mishra, D. Sengupta and Rajendra Prasad
24"" International Conference on Nuclear Tracks in Solids, Physics Department of
the University of Bologna Italy, September 1-5,2008.
8. Radon exhalation and radiation exposure from Indian commercial granites.
M. Mishra, A. K. Mahur and Rajendra Prasad
24"' International Conference on Nuclear Tracks in Solids, Physics Department of
the University of Bologna Italy, September 1-5,2008.
(Meena Mishra)
202