Core to DFN Model CSPG2017 - CSPG Home slides/2… · fracture characterization from core to...
15
FRACTURE CHARACTERIZATION FROM CORE TO DISCRETE FRACTURE NETWORK MODEL DOUG BEARINGER, CHELSEY HILLIER
Transcript of Core to DFN Model CSPG2017 - CSPG Home slides/2… · fracture characterization from core to...

FRACTURE CHARACTERIZATIONFROM CORE TO DISCRETE FRACTURE NETWORK MODEL
DOUG BEARINGER, CHELSEY HILLIER

Simple models versus observations of complex fracture networks
A good earth model should use fracture characteristics as inputs and yield results that match observations.
SHALE CHALLENGES
2
Tracerrecovery
Frac Pressure hits Microseismic Response
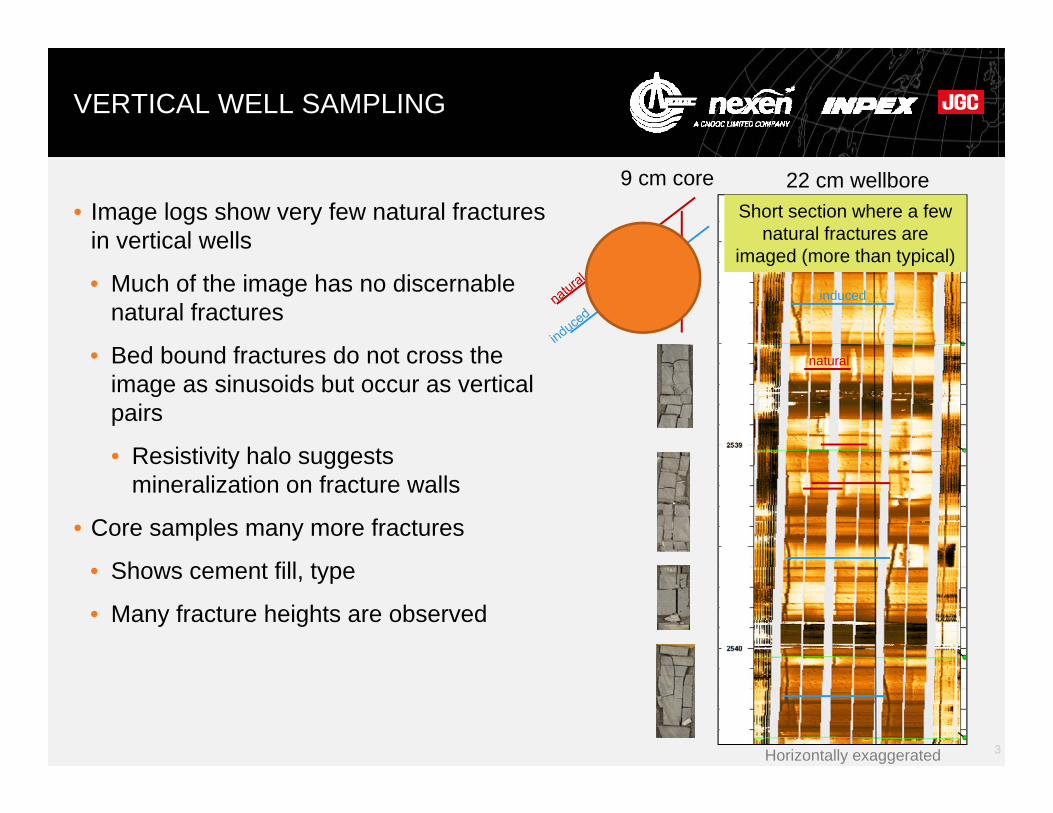
VERTICAL WELL SAMPLING
• Image logs show very few natural fractures in vertical wells
• Much of the image has no discernable natural fractures
• Bed bound fractures do not cross the image as sinusoids but occur as vertical pairs
• Resistivity halo suggests mineralization on fracture walls
• Core samples many more fractures
• Shows cement fill, type
• Many fracture heights are observed
3
Short section where a few natural fractures are
imaged (more than typical)
9 cm core 22 cm wellbore
Horizontally exaggerated
induced
natural

4
NATURAL FRACTURES FROM CORE
mode I fracture SHMAX
coring induced petal to petal-centerline
mode I fracture SHMIN
Fracture orientation Fracture spacing/intensity Mechanical Stratigraphy
Fracture Heights
Sets Properties Zonation
M e
c h
a n
I c
a l
u n
I t s
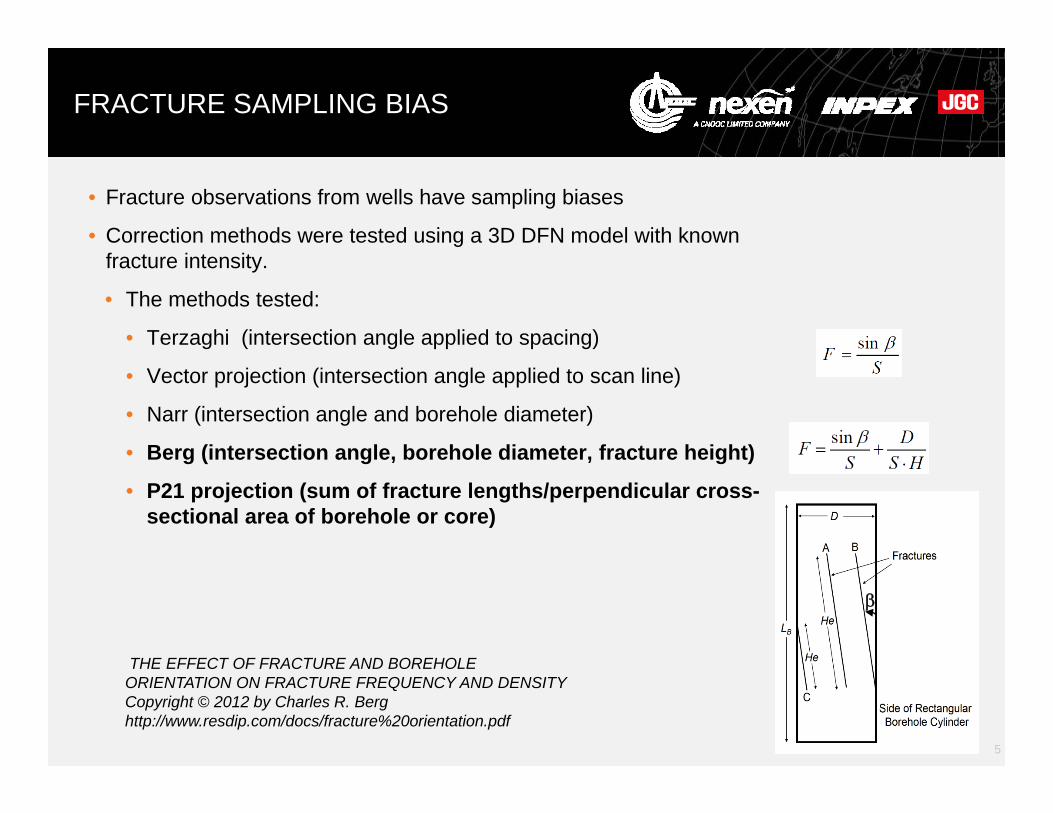
FRACTURE SAMPLING BIAS
• Fracture observations from wells have sampling biases
• Correction methods were tested using a 3D DFN model with known fracture intensity.
• The methods tested:
• Terzaghi (intersection angle applied to spacing)
• Vector projection (intersection angle applied to scan line)
• Narr (intersection angle and borehole diameter)
• Berg (intersection angle, borehole diameter, fracture height)
• P21 projection (sum of fracture lengths/perpendicular cross-sectional area of borehole or core)
5
THE EFFECT OF FRACTURE AND BOREHOLE ORIENTATION ON FRACTURE FREQUENCY AND DENSITY Copyright © 2012 by Charles R. Berg http://www.resdip.com/docs/fracture%20orientation.pdf

3D FRACTURE MODEL
• Test fracture intersection of vertical, horizontal and a slant wells.
• Single fracture set with L=4H, low orientation dispersion
• Repeat for minimum fracture size truncations of 0.2, 0.5, 1, 5, 10m
6

DFN SIMULATION OF INTENSITY MEASURES
• Simulated fracture volume explored by vertical, horizontal and 26° inclined wells
• Mean fracture dip is 3° from vertical
• Scanline method with correction for angle and core width- (vert_corr) (Berg)
• Perpendicular area (traceplane) method
P21
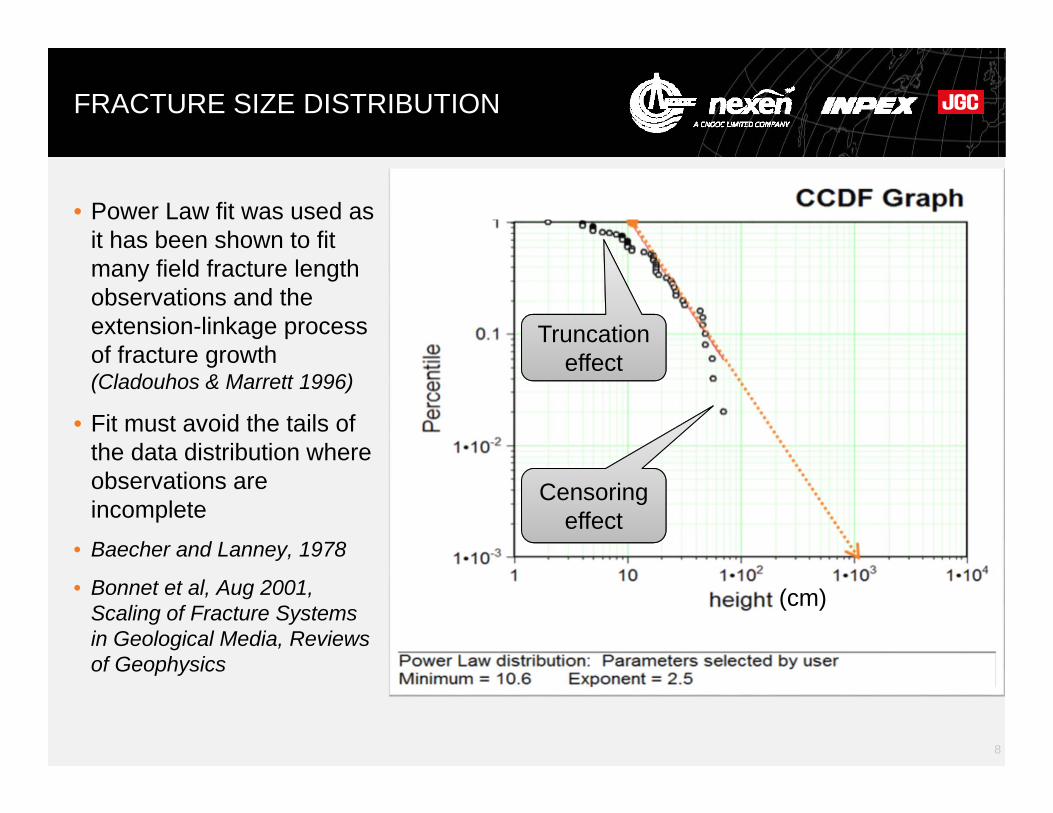
FRACTURE SIZE DISTRIBUTION
• Power Law fit was used as it has been shown to fit many field fracture length observations and the extension-linkage process of fracture growth (Cladouhos & Marrett 1996)
• Fit must avoid the tails of the data distribution where observations are incomplete
• Baecher and Lanney, 1978
• Bonnet et al, Aug 2001, Scaling of Fracture Systems in Geological Media, Reviews of Geophysics
8
Truncation effect
Censoring effect
(cm)
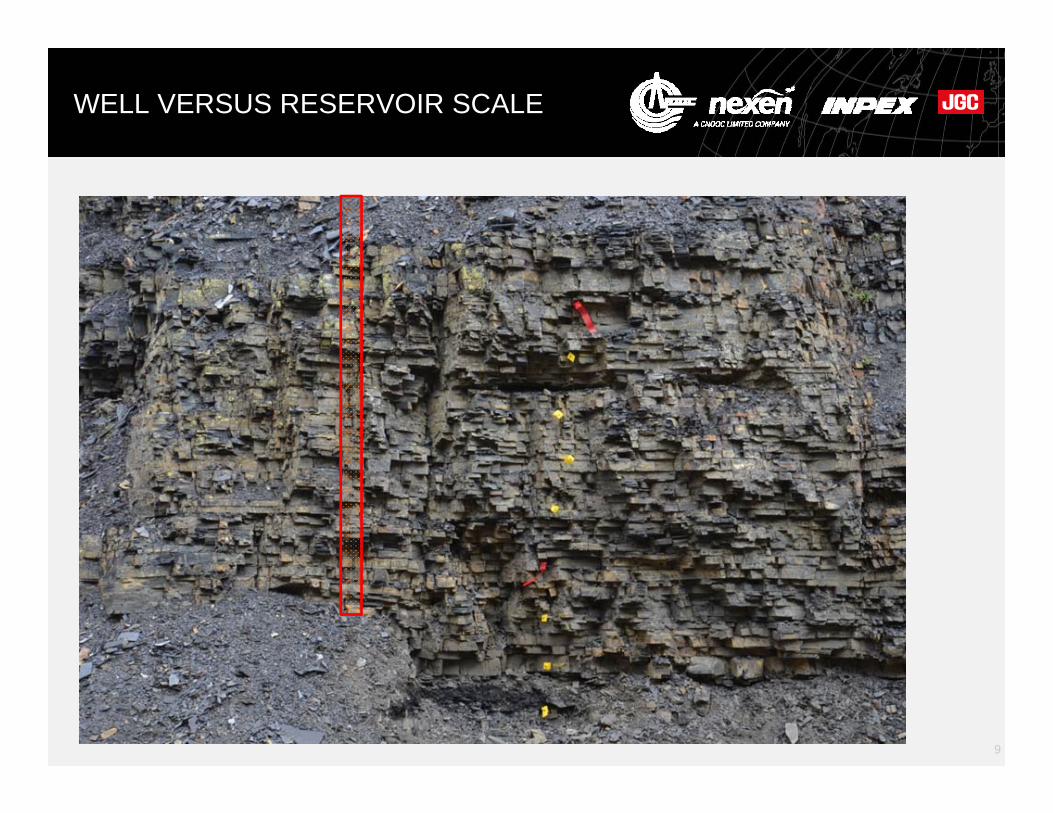
WELL VERSUS RESERVOIR SCALE
9

FRACTURE SIZE AND INTENSITY SCALING
• Relative fracture intensities change with size
• Observations are made at several scales
• Most intensively fractured zone in core is the least fractured at the reservoir scale where all the small fractures are truncated from the distribution
10
Well Observations
Hydraulic Stimulation & Reservoir
Modeling
DFN model Scale Up
Well scale
Model Scale
Inte
nsity
Millions of fractures Millions of fractures
(cm)

SIDE VIEW OF MODEL
11
MOPA
OPBCOPDMDCEV
Fractures generated and clipped to mechanical units

DFN RESULTS (HYDROFRAC SIMULATION)
12
• SRV’s show the radius similar to those determined from Microseismic
• MC>OPA~EV>OPB
• Vertical distributions are also similar to microseismic
• Show that CFT’s would mix between fracs from different completions zones
MC
OPA
OPB
EV
540m
600m
240m
315m
EVOPD-MDC
OPBC
MOPA

MICROSEISMIC EVENT DISTRIBUTION
13
• Modelled microseismicdistribution is similar to field observations
• Major difference is for the OPB zone where fracture size-intensity scaling had the highest fracture intensity
• More compact SRV for OPB fracs
• DFN model does not contain faults
• Adds more distant events and deeper events
Lateral growth Vertical growth
Model
Field
Faults?
Faults?
up
down

ACKNOWLEGEMENTS
• Many thanks to Nexen, INPEX and JGC for supporting this work
• The Horn River Shale Gas team for acquisition and analysis of
• Outcrop data
• Core tests and log petrophysics
• Seismic
• Stresses and pressures
• Geomechanical properties
• Microseismic
• Frac pressure hits
• Chemical tracer recovery
14

15
QUESTIONS?