Copyright Warning &...
71
Copyright Warning & Restrictions The copyright law of the United States (Title 17, United States Code) governs the making of photocopies or other reproductions of copyrighted material. Under certain conditions specified in the law, libraries and archives are authorized to furnish a photocopy or other reproduction. One of these specified conditions is that the photocopy or reproduction is not to be “used for any purpose other than private study, scholarship, or research.” If a, user makes a request for, or later uses, a photocopy or reproduction for purposes in excess of “fair use” that user may be liable for copyright infringement, This institution reserves the right to refuse to accept a copying order if, in its judgment, fulfillment of the order would involve violation of copyright law. Please Note: The author retains the copyright while the New Jersey Institute of Technology reserves the right to distribute this thesis or dissertation Printing note: If you do not wish to print this page, then select “Pages from: first page # to: last page #” on the print dialog screen
Transcript of Copyright Warning &...

Copyright Warning & Restrictions
The copyright law of the United States (Title 17, United States Code) governs the making of photocopies or other
reproductions of copyrighted material.
Under certain conditions specified in the law, libraries and archives are authorized to furnish a photocopy or other
reproduction. One of these specified conditions is that the photocopy or reproduction is not to be “used for any
purpose other than private study, scholarship, or research.” If a, user makes a request for, or later uses, a photocopy or reproduction for purposes in excess of “fair use” that user
may be liable for copyright infringement,
This institution reserves the right to refuse to accept a copying order if, in its judgment, fulfillment of the order
would involve violation of copyright law.
Please Note: The author retains the copyright while the New Jersey Institute of Technology reserves the right to
distribute this thesis or dissertation
Printing note: If you do not wish to print this page, then select “Pages from: first page # to: last page #” on the print dialog screen

The Van Houten library has removed some ofthe personal information and all signatures fromthe approval page and biographical sketches oftheses and dissertations in order to protect theidentity of NJIT graduates and faculty.
ABSTRACT
EFFECT OF GLOVE PORT HEIGHT ON UPPER BODY STRESS FORPERFORMING LABORATORY WORK
byJason Mark Williams
Glove boxes are used in many industries to constrain environmental contamination and
protect the worker from harmful or hazardous exposures. This research specifically
evaluates the effect of height of the glove box arm ports on the efficiency of task
performance and physiological costs of work for the glove box users.
Seven male and two female participants performed liquid mixing and vial filling
tasks within a portable glove box. The tasks were designed to simulate common glove
box tasks performed in pharmaceutical and laboratory settings. Each participant repeated
the designed tasks while the glove port height was set at two different levels, at 122cm
and 132cm.
Electromyography techniques along with discomfort surveys performed before
and after the experimental sessions were used to analyze the data. The electromyography
data was analyzed for localized muscle fatigue in the targeted muscles, (trapezius,
anterior deltoid, bicep, and erector spinae muscle groups). The surveys were used to
gather information on the performed task while using glove boxes and to measure
perceived stress and discomfort at the varying glove port heights.
Results from this study reinforce the ergonomic guidelines for work height and
demonstrates the importance of adjusting the correct glove port height according to the
anthropometry of the user. The research also provides, for the first time, a set of
qualitative data on upper body stresses in such situations with a glove box.

EFFECT OF GLOVE PORT HEIGHT ON UPPER BODY STRESS FORPERFORMING LABORATORY WORK
byJason Mark Williams
A ThesisSubmitted to the Faculty of
New Jersey Institute of Technologyin Partial Fulfillment of the Requirements for the Degree ofMasters of Science in Occupational Health and Engineering
Department of Industrial Engineering
August 2006

APPROVAL PAGE
EFFECT OF GLOVE PORT HEIGHT ON UPPER BODY STRESS FORPERFORMING LABORATORY WORK
Jason Mark Williams
Dr. Arijit Sengupta, Thesis Advisor DateAssociate Professor of Industrial Engineering, NJIT
Dr. George Olsen, Committee Member DateAdjunct Professor of Industrial and Manufacturing Engineering, NJIT
Dr. Anthanassios . Bladikas, Committee Member DateAssociate Professor of Industrial and Manufacturing Engineering, NJIT

BIOGRAPHICAL SKETCH
Author: Jason Mark Williams
Degree: Masters of Science
Date: August 2006
Undergraduate and Graduate Education:
• Master of Science in Occupational Safety and Health Engineering,New Jersey Institute of Technology, Newark, NJ US, 2006
• Bachelor of Science in Industrial and Manufacturing Engineering,Indiana Institute of Technology, Fort Wayne, IN US, 2004
Major: Occupational Safety and Health Engineering

I would like to thank my parents for all of their support over the years. They have always
shown me nothing but compassion, love, and guidance for me, and I am the man I am
today because of them.
Thank you.
ν

ACKNOWLEDGMENT
I would like to thank my advisor Dr. Arijt Sengupta, the committee members, Dr.
Anthanassios Bladikas, Dr. George Olsen and a special thank you to Dr. Norman Van
Houten. Your guidance and tutelage made my education here at the New Jersey Institute
of Technology one of enlightenment and understanding.
I would also like to thank all of my previous professors and past teachers that
made an impact on my life, furthering my education and growth as a person, and being
the best role models a person growing up in this world could ever want.
A special thank you to Rachel Vonck for my inspiration, Molly Adcock for her
friendship and her courage, and all of my friends back home (you knοω who you are)
who mean more to me than they will ever knοω.
And finally, without the financial sponsorship of the National Institute of
Occupational Safety and Health (NIOSH) my education here at NJIT may not have been
possible, and I would like to thank them for their generosity.
vi

TABLE OF CONTENTS
Chapter Page
1 INTRODUCTION 1
1.1 Problem Statement & Research Objective ... 3
1.2 Research Significance... .. 4
2 BACKGROUND AND LITERARY REVIEW ..... 5
2.1 Glove Box Ergonomics .. 6
2.2 Standing Workstations and Work Height .. 9
2.3 EMG and Measurement of Muscle Activity and Muscle Fatigue 11
2.3.1 Physiological Basis of EMG 11
2.3.2 Interpretation of Muscle Activity Levels from EMG Recording .. 16
2.3.3 Physiology of Muscle Fatigue 17
2.3.4 Interpretation of Localized Muscle Fatigue from EMG ... 20
3 EXPERIMENTAL METHOD .. 23
3.1 Experimental Setup ..... 24
3.2 Experimental Procedure and Data Collection 27
3.3 Recording EMG 28
4 RESULTS AND ANALYSIS .. 31
4.1 Body Discomfort Ratings and Questionnaire Survey ..... 31
4.2 Rectified Average EMG Levels .. ...... 35
vii

TABLE OF CONTENTS(Continued)
Chapter Page
4.2.1 Normalization of the Average Rectified EMG Signals ..... 36
4.2.2 Comparison of the Normalized EMG .. 36
4.3 Analysis of Muscle Fatigue 39
5 CONCLUSION •• 42
APPENDIX A INFORMED CONSENT FORM..... .. 44
APPENDIX B PHOTO RELEASE FORM .•. 48
APPENDIX C CONTACT INFORMATION ... 49
APPENDIX D PRE SURVEY QUESTIONNAIRE ... 50
APPENDIX E POST SURVEY QUESTIONNAIRE .. 51
APPENDIX F BODY DISCOMFORT RATINGS .. 53
APPENDIX G GENERAL SURVEY RESULTS 54
APPENDIX H ANTERIOR DELTOID MUSCLE DATA ..... 55
APPENDIX I BICEP MUSCLE DATA 56
APPENDIX J ERECTOR SPINAE MUSCLE DATA 57
APPENDIX K POWER SPECTRUM GRAPH 58
REFERENCES .. 59
viii

LIST OF TABLES
Table Page
3.1 Anthropometric and Demographic Data of Participants 23
4.1 Subject-wise Body Discomfort Ratings and t-test of DifferenceBetween Glove Port Heights 33
4.2 Average Rating Scores of Task Difficulty Levels in a Scale of 0 to 10 . 34
4.3 Average EMG Activity of the Trapezius Muscles inparticipants at 122 cm and 132 cm Glove Port Heights .. 37
4.4 Statistical Analysis of Difference in Average Activity in Muscle Groups ..... 39
F.1 Body Discomfort Ratings in 0-10 Scale After Completion
of the Laboratory Tasks ... 53
G.1 General Survey Questions Asked After the Laboratory Activities . 54
H.1 Average EMG Activity of the Anterior Deltoid Muscle .. 55
1.1 Average EMG Activity of the Biceps Muscle in Participants
of 122cm and 132cm Glove Port Heights . 56
J.1 Average EMG Activity of the Erector Spinae Muscle .. 57
ix
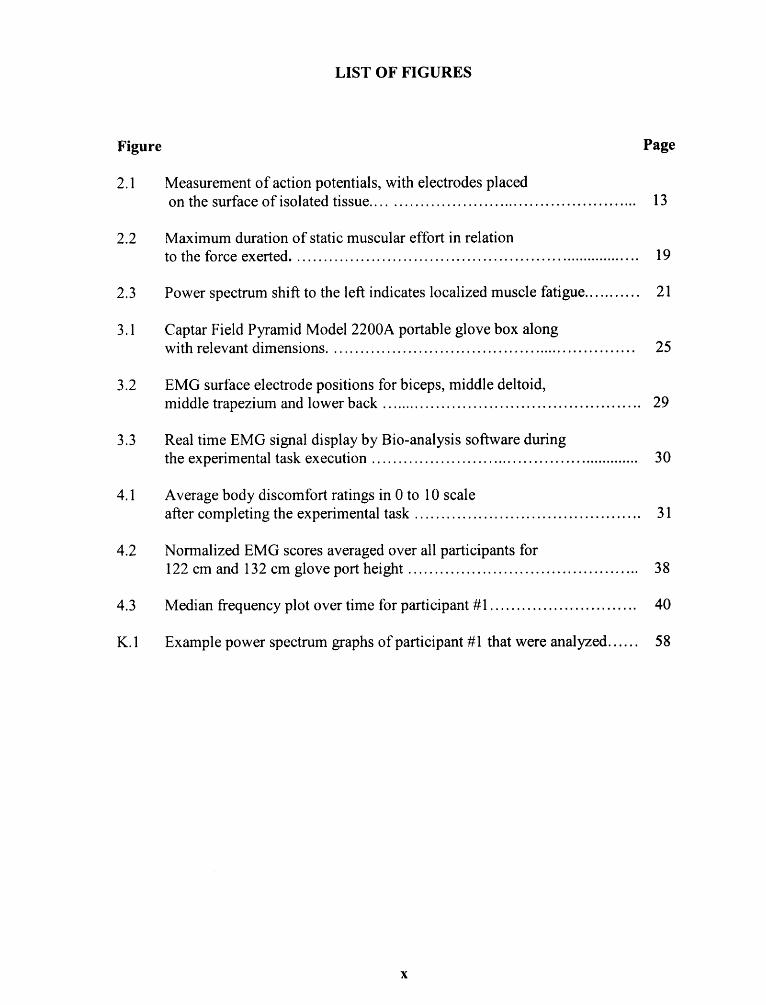
LIST OF FIGURES
Figure Page
2.1 Measurement of action potentials, with electrodes placedon the surface of isolated tissue . 13
2.2 Maximum duration of static muscular effort in relationto the force exerted. ... 19
2.3 Power spectrum shift to the left indicates localized muscle fatigue 21
3.1 Captar Field Pyramid Model 2200A portable glove box alongwith relevant dimensions. 25
3.2 EMG surface electrode positions for biceps, middle deltoid,middle trapezium and lower back.. . 29
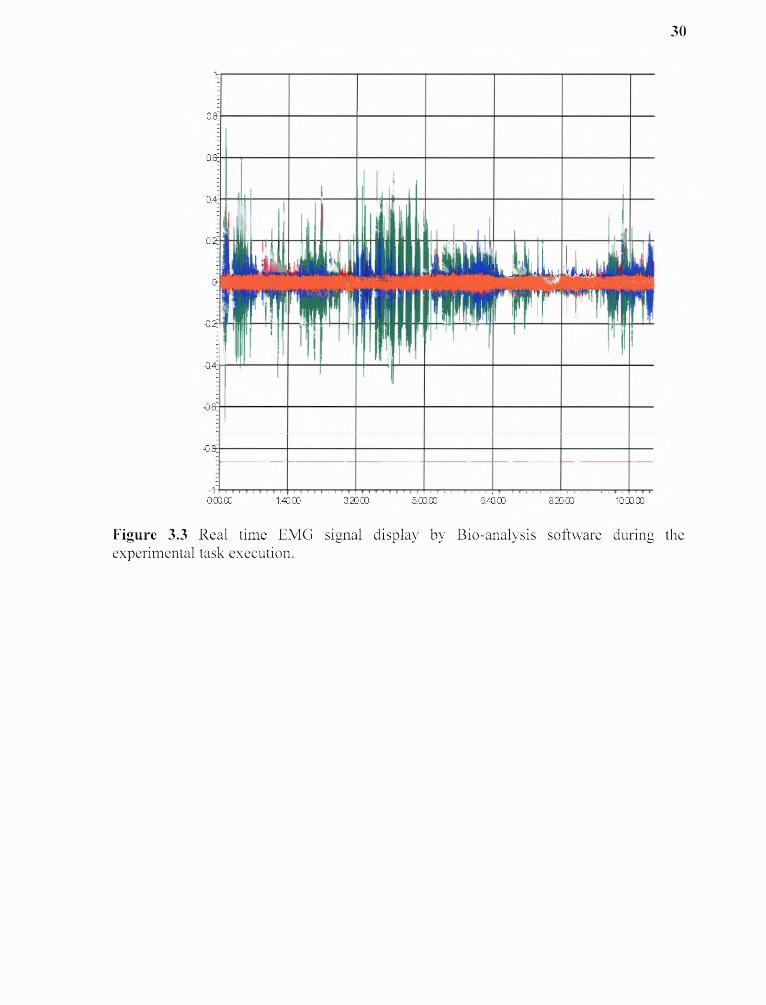
3.3 Real time EMG signal display by Bio-analysis software duringthe experimental task execution .. 30
4.1 Average body discomfort ratings in 0 to 10 scaleafter completing the experimental task . 31
4.2 Normalized EMG scores averaged over all participants for122 cm and 132 cm glove port height .. 38
4.3 Median frequency plot over time for participant #1 . 40
K.1 Example power spectrum graphs of participant #1 that were analyzed 58
χ
CHAPTER 1
INTRODUCTION
Glove box use began in early 1940's to contain radioactive materials and to protect the
workers that were working with them. The Department of Energy, NASA, and many
military research facilities used glove boxes for potentially dangerous objects from
handling rocks from the moon to plutonium. Today, electronics, pharmaceutical, health
care, food processing and other industries use glove boxes in some form or another to do
variety of tasks. A glove box is an enclosure used to handle potentially hazardous and
hard to contain objects. The glove boxes are used to protect a worker from direct contact
with a harmful or hazardous material or to protect a product from environmental
contamination.
The performance of tasks in a glove box is subject to the constraints on arm
movement and body leaning imposed on the operator by the fixed position of arm ports
(glove ports). There are also visual restrictions that may interact with the postural
limitations to make an otherwise easy task very awkward to perform. In addition to
these, the operator wears gloves, which further reduces his or her dexterity. The
American Glovebox Society has developed a detailed standard and guidelines that
specify ventilation, seals, glove attachments and necessary services within the glove box,
but according to Eastman Kodak (1983), ergonomic considerations of glove box design
are not well studied. The majority of the glove boxes used today are purchased from
outside vendors as mainly off the shelf glove boxes or custom made for the industry.
Glove boxes are used either placed on table tops for seated configurations or attached on
1
Ζ
top of instrumentation cabinets for standing configurations. Standing configurations are
more common because in majority of the cases the plumbing lines and instrument
connections are contained under the cabinet below.
For light manipulative type of work, the compatibility of the worker
anthropometry and working height is an important determinant of worker productivity
and comfort. Too low of a work height necessitates leaning forward of the torso and
consequent increased static muscle stress in the lower back and neck. Too high of work
height necessitates constant elevation of ones arm and shoulder imposing static stress in
the upper arm and shoulder region. Both types of postures need static muscle
contractions in lower back or the shoulder, respectively, which is known to be fatiguing.
In determining the appropriate work height, the height of the objects handled over the
work surface, manual force requirements to perform the job and visual requirement
should also be considered. The optimum work heights for several types of manual
industrial tasks have been studies in detail, but no such studies have been performed for
the glove port height.
Based on 95th percentile adult male anthropometry, Eastman Kodak Co. (1983)
recommends that the center of the glove ports for standing glove box configurations
should be 132 cm from the floor. For shorter workers they recommend raising the
worker by providing platforms of appropriate thicknesses. In reality such platforms are
never used in industry, possibly due to tripping hazards and storage difficulties.
Furthermore, the suggested height of the glove ports are purely based on anthropometry,
and never been validated by experimental trials. The American Glove Box Society is in
the process of setting standards and acquiring more research on the ergonomic impacts of

3
glove boxes. This is a proactive approach to problems that may develop from long-term
glove box use and to help in the future design of glove boxes that will better protect the
worker's physical health and comfort.
1.1 Problem Statement and Research Objective
In a review of the literature, no experimental data were found regarding the effect of
glove port height on the muscular work, fatigue and work efficiency of glove box users.
Based on the performance reports from the users, the American Glove Box Society is
considering revising this existing guideline for the glove port height of 132 cm (Eastman
Kodak Company, 1983) which they think to be too high for the general user population.
The objective of this research is to evaluate the effect of glove port height on the
muscular work, fatigue and work efficiency of glove box users through a laboratory
experiment. The specific research objectives are the following:
(1) Select a group of subjects with no previous upper body injuries who willparticipate in this experiment.
(2) Design and conduct an experiment to determine the upper body stress in theseworkers while performing a of set simple laboratory tasks using glove boxes atvarying heights.
(3) Measure muscle strains through surface Electromyography and to conduct awritten survey as to comforts and discomforts while using differing glove boxdesigns.
(4) Record all prevalent data and analyze it to determine the effect of glove portheight in terms of muscle fatigue and strain while comparing this data to theperceived discomfort and fatigue acquired through written survey by the subjects.

4
1.2 Research Significance
The results of this experiment will provide for the first time physiological effects of
varying glove port height which will help in recommending a better standard for the
glove port heights. The findings will provide a reference for designing glove boxes and
setting standards for glove box requirements. Better designed glove boxes will reduce
muscular strains and possibly will lead to reduced users fatigue and in the long run risk of
work related upper body musculoskeletal disorders. Reduced fatigue should improve
worker performance.
CHAPTER 2
BACKGROUND AND LITERARY REVIEW
Working with glove boxes (also known as containment cabinets, clean boxes, dry boxes
and anaerobic chambers) requires extended static muscle loading on the shoulders.
Extending the arms for more than a couple of minutes can be very tiring and put
additional stress on the shoulder muscles. Furthermore, repeated and sustained forceful
exertions have been associated with the development of musculoskeletal disorders in the
hands, wrists, fingers, and shoulders. There are several general ergonomics design
recommendations which are applicable to glove box work. These include using anti-
fatigue matting for laboratory personnel who must stand for long periods of time, taking
frequent micro-breaks to perform stretching exercises, move all needed materials for the
experiment from the side chamber to the main chamber at one time to reduce the amount
of side reaching, and if necessary use a sit-stand seat to alleviate stress on the lower back.
The performance of tasks in a glove box or chemical hood is very constrained due
to the limitations on arm movements by the armholes and front shields. Higher or lower
glove port height with respect to the relaxed elbow level of the operator may require
constant shoulder elevation or excessive leaning forward at lower back, respectively, to
maintain the forearm position within the glove ports. These problems coupled with the
awkward postures imposed on workers due to the visual restrictions of the glove boxes
and chemical hoods make working in them quite difficult for extended periods of time.
Glove boxes having a strictly vertical frontal shield pose a greater constraint to the upper
body and neck postures, while a glove box with a more slanted front allows the worker to
5

6
assume a more neutral posture. And in most chemical handling operations workers will
be wearing gloves, further reducing their dexterity and strength in most tasks.
2.1 Glove Box Ergonomics
Several guidelines have been provided by the American Glovebox Society (AGS) for the
design of glove boxes and hoods that specify certain seals, glove attachments, ventilation,
necessary services inside the contained areas, decontamination and cleaning facilities
(http://www.gloveboxsociety.org , 2006). However the human factors considerations are
less well studied.
In the Eastman Kodak book (1983), the authors recommended the following:
glove port height for seated and for standing workstations, glove port diameter,
separation width between the glove ports, reach limitations, biomechanical aspects (task-
dependent), visual constraints, seat height and adjustability (for seated operations),
location of controls and switches, location of pass-through compartments into and out of
the box, access for cleaning, decontamination, or product changes, design of tools, trays,
and containers to be used inside the box, and task durations.
Ideally, the determination of a sitting or standing workplace for hoods and glove
boxes should be determined by the nature of the task to be done and the general work
environment and placement of the hood or glove box. Reaches should be kept within 15
to 41 cm of the front of the work surface for seated operations and 51 cm for standing
operations. For glove box operations, seated workplaces are preferred, since workers can
easily adjust their workplace height using a chair, e.g. a pneumatic chair. Leg clearances
should be at least 66cm in length or depth. Some tasks are easier to do with a chair

7
adjusted to its lowest level, while others are best done with the chair adjusted to its
highest level. An example would be in which the force is exerted downward; or
conversely if the task involves extending reaches of the arms. Work can be done more
efficiently if some means are provided to enable an operator to adjust the chair to a
comfortable height for the arms and shoulders without having to remove his or her hands
from the gloves. Providing height adjustment by foot pedal, forearm switch, or a similar
method allows the operator to move the chair to suit the task. Time is not lost in manual
adjustments then, and muscle fatigue from awkward working postures is less probable.
Chair adjustability should be around the range of 15cm, and adequate clearance must be
provided so that the workers legs are not wedged underneath the workstation.
According to Eastman Kodak research (1983) if a standing glove box is needed,
the center of the arm ports should be 132cm (52 inches) from the floor. This height
should be comfortable for taller people; shorter operators should get a retractable step
stool or platform with standing levels at 8 and 15cm above the floor. Since there is less
flexibility in adjusting these platforms, every effort should be made to adapt the work to a
seated operation, especially if the glove box is used regularly and the worker uses the
glove box for a majority of the time that the worker is at the workstation. As has been
stated earlier, standing glove boxes are quite common in industry, and availability of
variable height platforms are practically non existent, without adjustable platforms this
standard glove port height of 132cm may pose serious strain on medium or short height
operators. The Eastman Kodak (1983) recommended height of 132cm is based on using
platforms to elevate shorter workers to the glove box openings.

8
A study by Whitemore and Bergen (1996) conducted with six subjects, (three
male and three female), evaluating ergonomic aspects of workstations in microgravity
found that flexible arm holes were better than rigid ports for repetitive fine manipulation
tasks to allow maximum range of arm movement. The study showed, through video
posture analysis, that very similar postures were assumed by both the smallest and tallest
subjects. Also, EMG profiles revealed that consistent muscle performance was found in
glove box operations, whereas in the general purpose workstation variability was found
in the EMG data which was attributed to the subjects' attempts to provide more
stabilization for themselves in microgravity.
Another study was done by Whitemore et al. (1994) evaluating ergonomics of
Spacelab Glove Boxes for NASA (National Aeronautics & Space Administration). The
study consisted of a video analysis of posture and a compilation of crew comments on the
design and interface and their perceived discomfort levels. This study was done on the
Columbus Space Shuttle using four astronauts as subjects. The objectives of the study
were to evaluate the design of the glove box interface and to evaluate the astronauts'
working posture in microgravity at the glove box. Science experiments were conducted in
the Spacelab for extended periods of time (approximately 6 to 8 hours a day). Results
from the study showed that the crewmembers rated the overall glove box design
marginally acceptable if there were some design modifications. The posture analysis of
the crewmembers revealed that they had a hunched shoulder posture approximately 40%
of the total time at the glove box. It was observed that the crewmembers needed to be
very close to the viewing window while working at the glove box.

9
These studies discussed in this section provide some important insights into glove
box design but do not address the height issue of glove ports, which is the primary
objective of investigation of this research. The objective of this research is to investigate
the effect of glove port height on muscle stress and fatigue. The following two sections
provide details on (1) working height for standing workstations, and (2) the application of
EMG on the measurement of muscle stress and muscle fatigue.
2.2 Standing Workstations and Work Height
Standing for long periods of time to perform a job should be avoided whenever possible.
Long periods of standing work can cause back pain, leg swelling, problems with blood
circulation, sore feet and tired muscles, lowered productivity, and usually more mistakes
made on the job, equating to a greater risk of injury to themselves and others (Konz,
1995). Because standing workstations provide more freedom of movement and greater
reach (Sengupta and Das, 2000) capability over the work surface, standing workstations
are not uncommon in industry. Here are some guidelines taken from Eastman Kodak
(1983) to follow when standing work cannot be avoided:
- If a job must be done in a standing position, a chair or stool should be providedfor the worker and he or she should be able to sit down at regular intervals.
- Workers should be able to work with their upper arms at their sides and withoutexcessive bending or twisting of the back.
- The work surface should be adjustable for workers of different heights and fordifferent job tasks.

10
- If the work surface is not adjustable, then provide a pedestal to raise the worksurface for taller workers. For shorter workers, provide a platform to raise theirworking height.
- A footrest should be there to help reduce the strain on the back and to allow theworker to change positions. Shifting weight from time to time reduces the strainon the legs and back.
- There should be a mat on the floor so the worker does not have to stand on ahard surface. A concrete or metal floor can be covered to absorb shock. The floorshould be clean, level and not slippery.
- There should be adequate space and knee room to allow the worker to changebody position while working.
Working height is of critical importance in the design of a standing work station.
If work is raised to high the shoulders must be frequently lifted up to compensate, which
may lead to discomfort, fatigue, or even painful cramps in the neck and shoulders. If the
work surface happens to be too low, then the back must be kept at a flexed position,
which may lead to backache. In general, the ideal work surface height should correspond
to the relaxed elbow height of the operator. According to Konz (1995), the optimum
work height for manipulative hand-arm work should be 50mm below the elbow, or
slightly below heart level. Konz stated that work height should be defined in terms of
elbow height rather than a fixed height from the floor, since peoples heights will always
differ. Optimum height from the elbow is the same for both sitting and standing. This
means work height from the floor will differ for sitting and standing, unless the chair
height is adjusted. It was also mentioned that work height is not table height. Most items
(table tops, keyboards, tools and other objects handled) have a thickness. Thus, if the
thickness of the object being handles is 50mm thick, the table surface height should be
about 100mm below the elbow.

11
The height of the workstation also depends on the nature work being performed.
If a worker is performing fine dexterous work, which requires visual acuity then the work
station should be higher to keep him/her from bending over. If the worker is performing a
strength intensive task, such as cutting meat or material, a lower work station is needed
so the worker can use his/her weight to their advantage. The American Glove Box
Society recommends that the arm ports of glove boxes should be placed at 132 cm from
the ground, which corresponds to 95 th percentile male elbow height. This guideline has
been adopted from Eastman Kodak Co. (1983). Unless the average or shorter operators
are provided with platforms to stand upon, this height can be excessive. Furthermore,
according to Das and Sengupta (1996), the maximum height of standing workstation
height for women should be no more than 120cm.
2.3 EMG and Measurement of Muscle Activity and Muscle Fatigue
2.3.1 Physiological Basis of EMG
The specific sequence of muscle activation and movement initiation requires complex
interactions between the muscles and nervous system. Skeletal muscle cells are arranged
in parallel to produce force, through the muscles tendon, at a common point in the bone.
For all of these cells, (muscle fibers collectively), to contract, they must be activated by
signals from motor neurons; these fibers and a neuron combinations form motor units
(MU). MUs, are the `final common pathway' for motor control of movement. Each unit
will contain an anterior motor neuron and all of the muscle fibers innervated by its motor
axon. The entire motor unit follows the all-or-none rule by which if the anterior motor
unit is activated; all fibers supplied in it are contracted.

12
The technique of EMG, or electromyography, is based upon the theory of
electromechanical coupling in muscles. In a resting state, the cell membrane of a muscle
fiber is in equilibrium, meaning on the inside it is negatively charged and on the outside it
is positively charged. This polarized state is due to the presence of positive and negative
ions inside and outside of the cell membrane in specific concentrations. When a nerve
impulse, in the form of a neurotransmitter chemical, reaches a motor end plate, it changes
the permeability of the muscle cell membrane at the neuromuscular junction, causing a
flow of charged ions across the cell membrane at this junction. This flow of ions causes a
local depolarization of the cell membrane. This local depolarization, in turn, sets up a
potential difference between the polarized and the adjacent depolarized region of the cell
membrane. This potential difference again changes cell membrane permeability in the
adjacent regions, causing more flow of ions and consequently depolarizing the adjacent
regions. As the adjacent regions are being depolarized, the previously depolarized
regions are repolańzed by active ion transport. This process of depolarization-
repolarization wave, called action potential, propagates from the neuromuscular junction
in two directions until it cover the entire length of the muscle fiber and which mediates
the muscle contraction.
As a single or a train of action potentials sweep the sarcolemma (muscle
membrane), the electrical potential differences travel deep into the muscle cells through t-
tubules. This unique organization allows the electrical potential to travel to the deepest
parts of the muscle almost instantly as it sweeps the surface of the muscle. These action
potentials trigger the release of Calcium ions (Ca2+) from the sarcoplasmic reticulum
into the muscle cytoplasm. The calcium ions are responsible for starting muscle
13
contraction which in turn manifests into motion of the muscle and the generation of force.
Hence, there is an electromechanical coupling of the muscle that is mediated through
biochemical means.
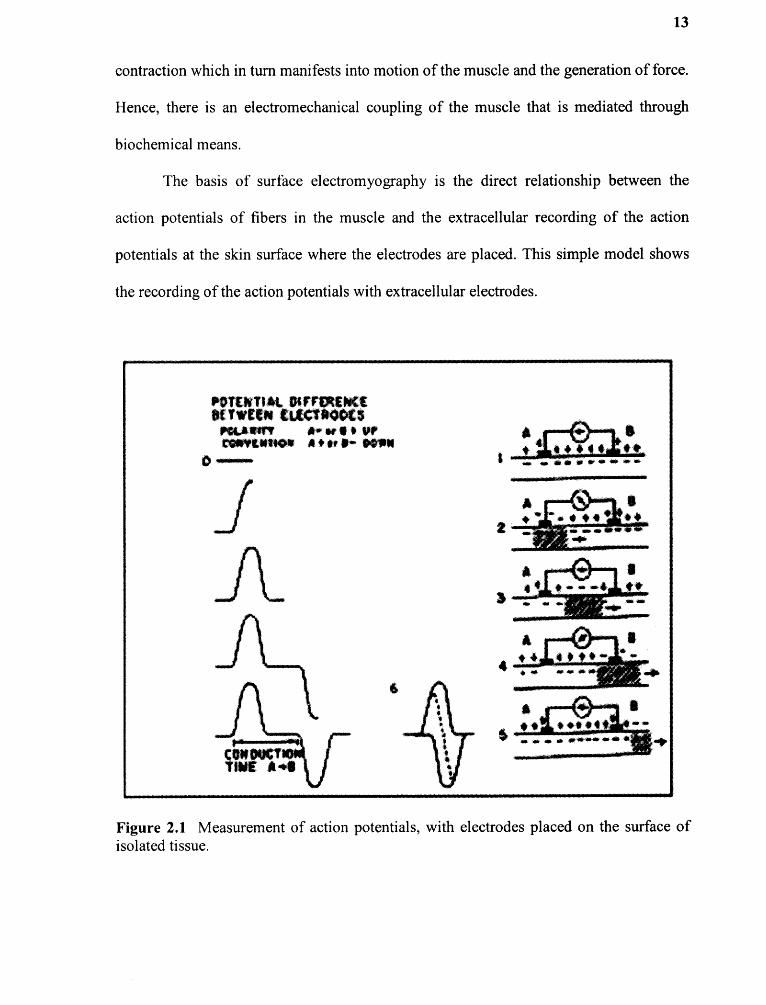
The basis of surface electromyography is the direct relationship between the
action potentials of fibers in the muscle and the extracellular recording of the action
potentials at the skin surface where the electrodes are placed. This simple model shows
the recording of the action potentials with extracellular electrodes.
Figure 2.1 Measurement of action potentials, with electrodes placed on the surface ofisolated tissue.

14
Two electrodes (A and B respectively) that are connected to an oscilloscope are
placed on a muscle a certain distance apart. In a resting state, entire length of the muscle
fiber is in equilibrium and thus there is no potential difference between the two electrodes
showing no changes in reading from the oscilloscope baseline. If the muscle fiber is
excited to the left of electrode A, it becomes negative with respect to electrode B, and the
oscilloscope deflects upward. As the action potential continues toward electrode B, the
area under electrode A repolarizes, and the oscilloscope returns to the baseline. When the
action potential is between electrodes A and B, the area under electrode A has recovered
and the area under electrode B has not depolarized, making the difference between the
electrodes zero again, returning the oscilloscope to baseline, staying there, until the area
under the electrode B is depolarized. Now, as the action moves from under electrode B,
the area becomes negative with respect to A, and the oscilloscope dips downward, and as
the repolarization occurs under electrode B, the difference in potential returns to baseline.
The graph resulting from this is a set of monophasic waves separated by a short period of
time when no potential difference is measured. The time between the waves depends on
distance between the electrodes and the conduction velocity of the muscle fiber. Now, if
the electrodes are placed close together, the waves temporarily summate forming a
biphasic wave with smaller peak to peak amplitude then the monophasic wave. The
biphasic wave is similar in appearance to a muscle fiber action potential.
The above model shows the EMG generated by the action potential from one
muscle fiber. In reality, the CNS regulates the force production from a whole muscle by
employing two mechanisms; rate coding and recruitment. Rate coding is employed by
changing the frequency of the release of neurotransmitter at the neuromuscular junction.
15
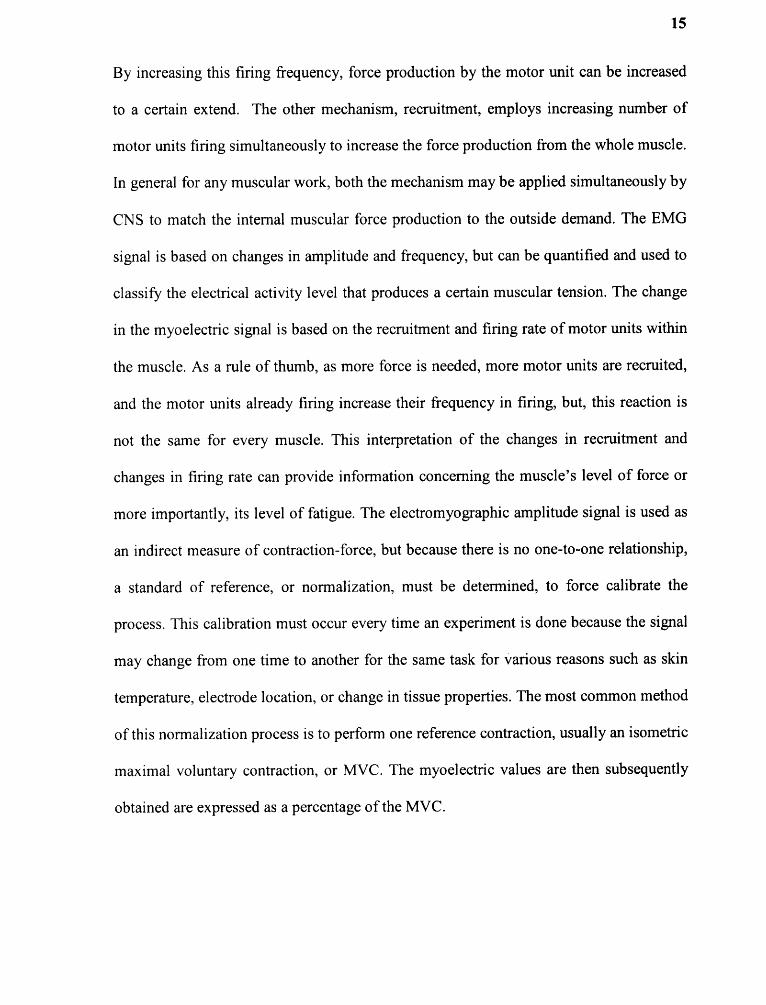
By increasing this firing frequency, force production by the motor unit can be increased
to a certain extend. The other mechanism, recruitment, employs increasing number of
motor units firing simultaneously to increase the force production from the whole muscle.
In general for any muscular work, both the mechanism may be applied simultaneously by
CNS to match the internal muscular force production to the outside demand. The EMG
signal is based on changes in amplitude and frequency, but can be quantified and used to
classify the electrical activity level that produces a certain muscular tension. The change
in the myoelectric signal is based on the recruitment and firing rate of motor units within
the muscle. As a rule of thumb, as more force is needed, more motor units are recruited,
and the motor units already firing increase their frequency in firing, but, this reaction is
not the same for every muscle. This interpretation of the changes in recruitment and
changes in firing rate can provide information concerning the muscle's level of force or
more importantly, its level of fatigue. The electromyographic amplitude signal is used as
an indirect measure of contraction-force, but because there is no one-to-one relationship,
a standard of reference, or normalization, must be determined, to force calibrate the
process. This calibration must occur every time an experiment is done because the signal
may change from one time to another for the same task for various reasons such as skin
temperature, electrode location, or change in tissue properties. The most common method
of this normalization process is to perform one reference contraction, usually an isometric
maximal voluntary contraction, or MVC. The myoelectric values are then subsequently
obtained are expressed as a percentage of the MVC.
16
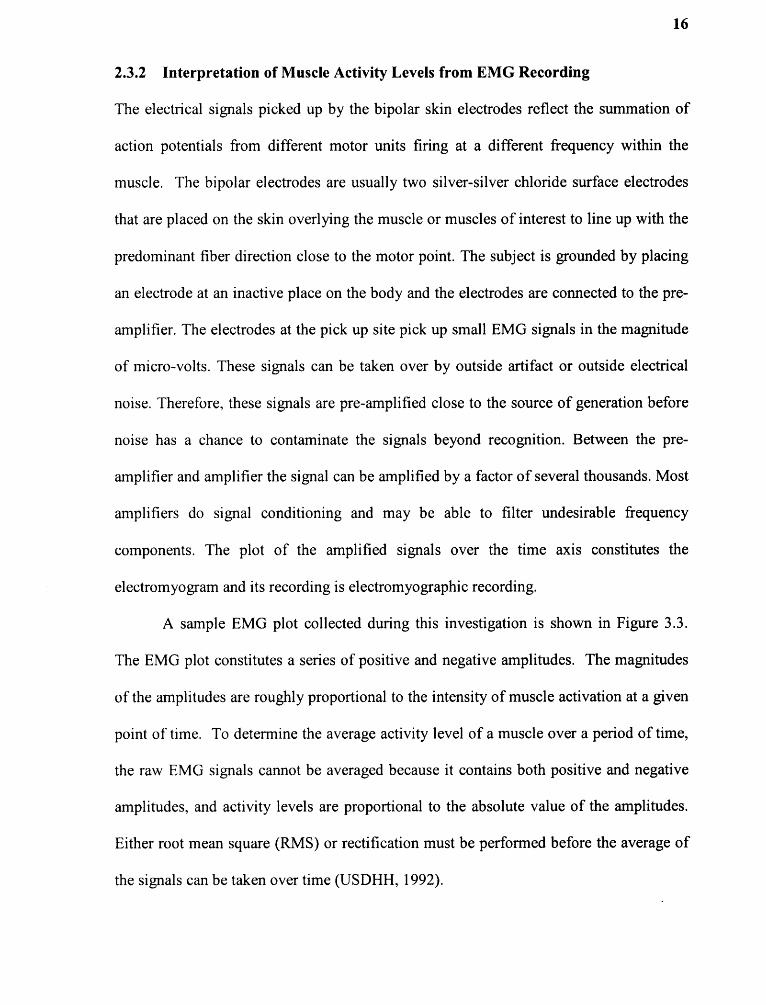
2.3.2 Interpretation of Muscle Activity Levels from EMG Recording
The electrical signals picked up by the bipolar skin electrodes reflect the summation of
action potentials from different motor units firing at a different frequency within the
muscle. The bipolar electrodes are usually two silver-silver chloride surface electrodes
that are placed on the skin overlying the muscle or muscles of interest to line up with the
predominant fiber direction close to the motor point. The subject is grounded by placing
an electrode at an inactive place on the body and the electrodes are connected to the pre-
amplifier. The electrodes at the pick up site pick up small EMG signals in the magnitude
of micro-volts. These signals can be taken over by outside artifact or outside electrical
noise. Therefore, these signals are pre-amplified close to the source of generation before
noise has a chance to contaminate the signals beyond recognition. Between the pre-
amplifier and amplifier the signal can be amplified by a factor of several thousands. Most
amplifiers do signal conditioning and may be able to filter undesirable frequency
components. The plot of the amplified signals over the time axis constitutes the
electromyogram and its recording is electromyographic recording.
A sample EMG plot collected during this investigation is shown in Figure 3.3.
The EMG plot constitutes a series of positive and negative amplitudes. The magnitudes
of the amplitudes are roughly proportional to the intensity of muscle activation at a given
point of time. To determine the average activity level of a muscle over a period of time,
the raw EMG signals cannot be averaged because it contains both positive and negative
amplitudes, and activity levels are proportional to the absolute value of the amplitudes.
Either root mean square (RMS) or rectification must be performed before the average of
the signals can be taken over time (USDHH, 1992).

17
2.3.3 Physiology of Muscle Fatigue
Fatigue is a loss of efficiency and a disinclination for effort but it is not a single, defined
state (Kroemer & Grandjean, 1997). There are many different types of fatigue such as
eye, mental, general, nervous, chronic, and circadian, but for this study, concentration
will be placed on localized muscular fatigue and its effects. This form of fatigue reduces
performance of a muscle after prolonged stress at low muscle intensity through decreased
strength and force.
Studies have shown that during muscle contraction chemical processes occur
which provide energy necessary for physical exertion. After the contraction, energy
supplies are replenished, both of these processes are going on in any particular healthy
muscle while work is being performed. Fatigue occurs when the demand of energy
exceeds the replenishment capabilities of the resting period, lowering muscular
performance overall. Under heavy amounts of stress, the muscles use up its energy
supply while the muscles waste products build up turning the muscle slightly acidic and
accounting for the burning sensation in over used muscles. In ergonomics the problems
associated with sustained muscular effort evoke pain and discomfort, that the
biomechanical loading on body structures may cause tissue damage in the long run, and
that muscular fatigue may impair the possibility to carry out the working task. Muscle
fatigue can also help contribute to tremors and reduces fine motor control.
Fatigue does not occur on its own. It is an effect of what happens after one exerts
his or her self through work. Work is traditionally defined as force multiplied by the
distance that the force is applied over. For the purpose of this study though, work will be
related to muscle contractions. There are two different types of muscular work, dynamic

18
and static. Dynamic work is characterized by muscle contraction alternating with
relaxation, and resulting in the movement of a body part. Static work is work without
alternating between relaxation and contraction, but usually involves simply the constant
contraction of a muscle or muscle group. Work can be translated into muscular efforts,
static and dynamic. In a dynamic situation, the muscles effort is sometimes expressed as
the product of the force developed and the shortening of the muscle (work=force x
distance). During static effort of the muscle, the muscles length does not change but
remains at a constant length under increased tension, with force exerted over a certain
length of time. When this is occurring, no useful work is externally visible nor can it be
defined as simply in terms of force and distance as in dynamic work.
There is a major difference between static and dynamic muscular effort, and that
is blood flow occurring through the muscle. During a static effort, the blood vessels in the
muscles are compressed by the pressure of the muscle tissue around it from being used,
relatively halting the blood flow through the muscle. Therefore, if a muscle is undergoing
heavy static work, it is receiving no fresh blood that carries with it energy and oxygen
that it needs to perform, and must rely on its reserves. More importantly no waste
products are being removed from the muscle, so waste products are accumulating in the
muscle, causing discomfort and fatigue. In dynamic work, the opposite is happening. As
a person moves, the muscles contraction and relaxation act as a pump, compressing and
squeezing blood out of the muscle, and relaxation bringing fresh blood back in. With
dynamic work of the muscle, the muscle can get up to 20 times more blood than it can
while resting. According to Kroemer and Grandjean, (1997) static effort can be said to be
considerable if a high level of effort is maintained for more than 10 seconds, if moderate
19
effort persists for more than 1 minute, or if slight effort lasts for more than 5 minutes.
Constrained postures are the most frequent of static muscular work because of carrying
our trunk, arms, and head in unnatural positions.
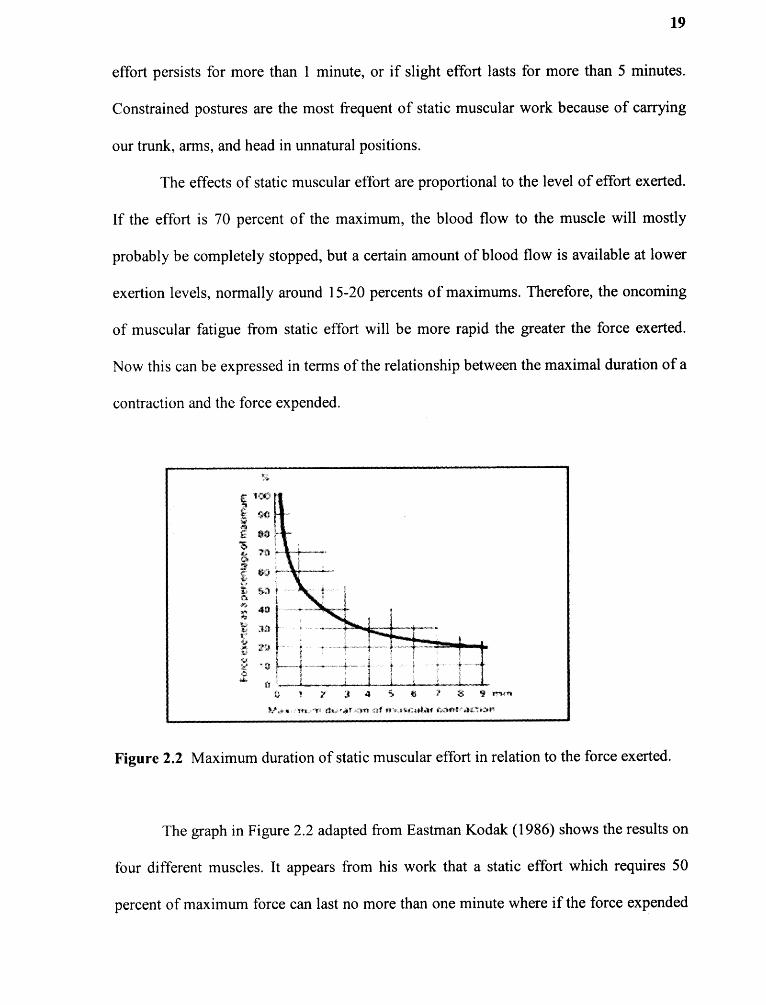
The effects of static muscular effort are proportional to the level of effort exerted.
If the effort is 70 percent of the maximum, the blood flow to the muscle will mostly
probably be completely stopped, but a certain amount of blood flow is available at lower
exertion levels, normally around 15-20 percents of maximums. Therefore, the oncoming
of muscular fatigue from static effort will be more rapid the greater the force exerted.
Now this can be expressed in terms of the relationship between the maximal duration of a
contraction and the force expended.
Figure 2.2 Maximum duration of static muscular effort in relation to the force exerted.
The graph in Figure 2.2 adapted from Eastman Kodak (1986) shows the results on
four different muscles. It appears from his work that a static effort which requires 50
percent of maximum force can last no more than one minute where if the force expended
20
is less than 20 percent of maximum, the muscular contraction can last for quite a long
time.
2.3.4 Interpretation Localized Muscle Fatigue from EMG
Usually when discussing fatigue effects on the EMG signal, power spectrum properties
are addressed. The surface electromyography power spectrum contains a large amount of
data. Hence, studies of spectral alterations needs reduction of spectral data to a single
index like the median frequency or the mean power frequency. In this study, the median
frequency was used because of the superior high-frequency noise immunity. The median
frequency is defined as the frequency which divides the power spectrum in tow parts with
equal areas. Conventionally, the power spectrum is calculated and thereafter the median
frequency.
It is well documented that any spectrum index decreases at a sustained strong
contraction. Chaffin (1973) was the first to suggest surface electromyographic power
spectrums alterations as indicators of local muscle fatigue. The physiological background
for these alterations has been a matter of controversy and a complete explanation of this
phenomenon is still lacking. However, three major events are pointed out to occur in
muscle fatigue studied through electromyographical means, (Kumar and Mital, 1996).
Action Potential Conduction Velocity (APCV) decrease is one of them. The second is
synchronization of motor unit firings which imply increased peaks in the low frequency
band of the surface electromyographical power spectrum. Third, additional recruitment of
new motor units most likely also influence the alteration during a sustained contraction.
Motor units with higher initial action potential conduction velocity are recruited,
increasing index readings. However, when more fatiguable type II motor units are

21
recruited the action potential conduction velocity decrease is accelerated. The APCV
decrease is a genuine local muscular event while the others are related to CNS factors.
During localized muscle fatigue changes occur in the surface recording EMG.
Figure 2.3 shows the effect during sustained, isometric contraction with a frequency
spectral shift resulting from local muscle fatigue during a sustained, isometric contraction
of the first dorsal interosseous muscle (USDHH, 1992).
Figure 2.3 Power spectrum shift to the left indicates localized muscle fatigue.
The median frequency is calculated for a block of samples whose length is
defined by the filter constant, (64, 128, 256,512, 1024, 2048, 4096, 8192). This
calculation is repeated as many times as necessary across the trace and the resulting
22
frequencies plotted as a series of lines connecting the median frequencies. The following
steps are performed:
- Α block of samples defined by the filter constant is taken and zero padded to thenearest power of 2.
- Α Windowing Function applied to the data as specified by the selection at thebottom left of the Settings Window.
- Α Fast Fourier Transform (FFT) is performed and, if selected, FFT High PassFilters are used to Remove DC and to Remove Very Low Frequencies from thecalculations. Note that a large DC component can seriously degrade the accuracyof the median frequency calculation.
- The amplitude magnitude of each FFT output frequency is squared.
- The median frequency is determined such that the area of the amplitude-squaredfrequency graph below the median frequency is the same as above the medianfrequency i.e. there is equal power either side of the median frequency.
- The process is repeated for the next block of examples.

Chapter 3
EXPERIMENTAL METHOD
The experiment was conducted in NJIT Safety Laboratory over the course of six weeks
with the use of nine participants. There were seven males and two females who were
tested. Flyers placed around the NJIT Newark campus were used to recruit participants in
this study, and each participant was paid 10 dollars an hour for their work. The
participants were able bodied and were free of illness or injury contraindicated for
manual work. The ages ranged from 19 to 26, with an average age of 22 years.
Participant height ranged from 160cm (63 inches) to 190cm (75 inches), with an average
height of 177cm (69.8 inches). Masses ranged from 52.7kg (116 Ibs) to 111.4 kg (245
Ibs). The demographics of the participants are provided in Table 3.1.
Table 3.1 Anthropometric and demographic data of participants
23

24
Each participant was asked to perform the set of experimental tasks twice with an
approximately 48 hour's interval between the two sessions. The glove port height was
set either at 132 cm or at 122 cm from the floor for these sessions. The participants were
not told which heights they were working at to avoid subjective bias.
3.1 Experimental Setup
A Captar Field Pyramid Model 2200A portable glove box constructed with transparent
plastic was used (Figure 3.1) to simulate the restrictive nature of the glove box, extra
muscle strength required for fine motor work, and sometimes awkward positioning
required for utilization of the glove box while performing the required tasks. It was
placed on an adjustable height table which was used to change the working height of the
glove ports to 122cm (48 inches) and 132cm (52 inches). This glove box is designed for
industrial use and had integrated gloves in the glove ports. The participant stood in front
of the glove box with their forearms inserted in the gloves. The participants were
instructed to stand as close as possible to the glove box that allows them to perform the
experimental tasks conveniently. This position was selected by trial and error method.
Once the position was selected by a participant, that position was maintained through out
the experimental session.

25
Figure 3.1 Uaptar r ιeld Yyramιd Model 2200Α portable glove box along with relevantdimensions.

26
Six 250 mL graduated cylinders with screw tops, three plastic spoons, two
porcelain bowls, one pipette, 12 microfuge tubes, one microfuge tube rack, one half
gallon container of water, and sugar and colored lemonade mix was used as
`replacement' chemicals, within the portable glove box. The tasks that were performed by
the participants were a series of simple measurement, pouring, and stirring tasks that
were predetermined and repeated in every test. The series of steps that were taken by
every participant were told to them verbally by the investigator identically before every
test, to limit the potential stress on the neck and eyes from trying to read and comprehend
a list of instructions while using a glove box. The tasks that were given to the participants
were as follows in this order:
1. Place your arms through the glove ports and situate your arms comfortably inthe gloves
2. Take the caps off the 250mL bottles (in any order)
3. Place one scoop of the lemonade mix (the pink powder) in each of the six250mL bottles with the plastic spoon labeled `mix' (in any order)
4. Place three scoops of sugar (white powder) into each of the six 250mL bottleswith the plastic spoon labeled `sugar' (in any order)
5. Using the half gallon jug of water, pour approximately 150mL of water intoeach of the 250mL bottles (in any order)
6. Using the unmarked spoon, stir until mixed all six 250mL containers
7. Place cap back on half gallon jug of water
8. Using the plastic pipette, take a large sample from the 250mL bottle marked '1'and use that sample to fill up the two microfuge capsules that correspond with thenumber 1. Repeat for bottles 2-6 and microfuge capsules 2-6.
9. Screw the caps back on all six 250mL containers
10. Place the lids on the tops of the 12 microfuge containers.

27
11. Take hands out of gloves and place arms by your side
These exact steps were repeated for the working height of 132cm, (52 inches) or
122cm, (48 inches) in two different days in a random order. Each participant took
approximately 15 minutes to complete each of the sessions.
3.2 Experimental Procedure and Data Collection
Before the experiment was started, the participant had to fill out a series of forms. These
included: (1) participation consent form approved by the NJIT Institutional Review
Board that gave the participants their rights as being a willing subject in the experiment
and potential dangers of being in the study, (2) a photo-release form stating that their
picture may be taken using the digital video camera, and a (3) pre-survey questionnaire
which included contact information along with various questions on how the participant
was feeling before the experiment started (Appendix A to D). Once these forms were
filled out and completed, the experiment could begin.
A digital video recorder was set up next to the work station to record all the
events and upper body posture of the experimental subject. All containers were cleaned
and refilled and placed back in there proper order within the glove box. Once the
participants information was filled out, the video recorder set up, and the experimental set
up was arranged in the pre-determined places, the participant could be connected to the
EMG electrodes for the duration of the experiment.

28
3.3 Recording EMG
An eight channel Biometrics Data Link Base Unit, a Biometrics amplifier with a ground
and four bipolar skin electrodes with preamplifiers was used in this study to collect the
EMG data signals. The electronic equipment was connected to a desktop computer and
the Bio-analysis Software facilitated the data collection and analysis of the EMG signals.
The EMG data collection system was set up in this order:
1. The computer with Bio-Analysis Software was turned on the program wasstared.
2. Once the program is running, the four skin electrodes were connected to theparticipant on the right lower back, the right bicep, the right middle trapezius,and the anterior deltoid muscle using the sticky double-sided adhesive tapeprovided by the manufacturer. The electrode positions for muscle groups areshown in Figure 3.2. Once the electrodes are in place, the participant stands infront of the work station in a neutral and relaxed position (hands to the side,standing straight up). At this position, all four channels were initialized tozero and Sampling Rates were set to 1000 Hz.
3. After the EMG channels were initialized, the subject was asked to perform astandard task of holding a 5 lb weight in the right hand for approximately 15seconds while the arm and the forearm were kept horizontal at the shoulderlevel. During this standard task, EMG signals were collected at a rate of 1000Hz for the duration of the task and saved in the computer hard disk. A DCchannel and a hand switch was used for marking the precise start and finish ofthe standard task. This EMG recording was used later for normalization oftask EMG signals.
4. After a brief rest period of approximately 2 minutes, the experimental taskbegan. The camera was turned on and while the subject performed thepredefined experimental task, EMG signals were collected at a rate of 1000Hz. The data collection was continued for the entire period of theexperimental task.
5. After the experimental tasks are completed, the camera was turned off, andEMG data was saved on a separate file for further analysis.
6. This procedure was repeated for the next height setting of the experiment.
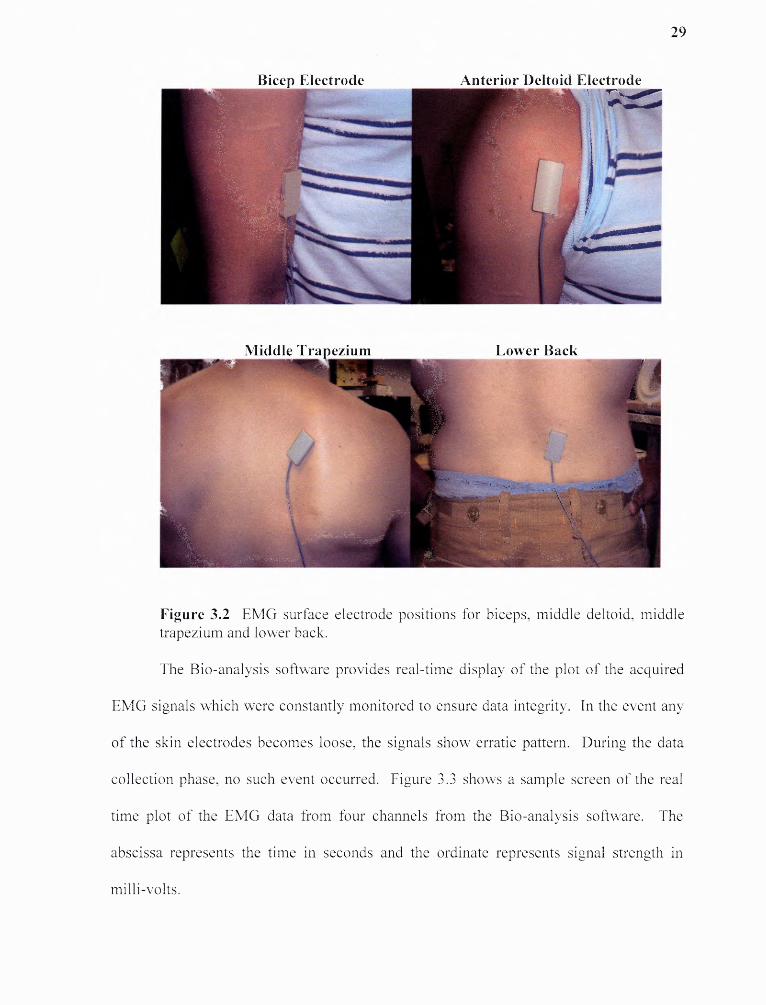
Figure 3.2 EMG surface electrode positions for biceps, middle deltoid, middletrapezium and lower back.
The Bio-analysis software provides real-time display of the plot of the acquired
EMG signals which were constantly monitored to ensure data integrity. In the event any
of the skin electrodes becomes loose, the signals show erratic pattern. During the data
collection phase, no such event occurred. Figure 3.3 shows a sample screen of the real
time plot of the EMG data from four channels from the Bio-analysis software. The
abscissa represents the time in seconds and the ordinate represents signal strength in
millivolts.
30
0 8-
ο.6-
0.4-
0.2-
ο
-0.2Η
-0.4-
-0.6-
-0.α-
1:40.00 3:2000 5:0000 6:4000 8.00 1000.00
Figure 3.3 Real time EMG signal display by B10-analysis software during theexperimental task execution.

CHAPTER 4
RESULTS AND ANALYSIS
4.1 Body Discomfort Ratings and Questionnaire Survey
The questionnaires were created to assess a participants overall feeling of fatigue after the
performance of the experimental tasks. Before the start of the experimental session,
participants were well rested with no perceivable body discomfort. Thus, the discomfort
ratings perceived at the end of the experimental session can be attributed to the
performance of the experimental tasks. Body discomfort rating was assessed in a scale of
0 to 10 with 10 being discomfort, 5 being some (moderate) discomfort and 0 being no
discomfort. Appendix E contains the raw discomfort scores by the participants. Figure
4.1 summarizes the average body discomfort ratings by the subjects for 122 cm and 132
cm glove port height sessions.
Figure 4.1 Average body discomfort ratings in 0 to 10 scale after completing theexperimental task.
31

32
The average ratings were all below 3, which indicate that most of the participants
perceived discomfort between no discomfort and moderate discomfort. Highest three
ratings were given to upper arm (2.6), shoulder (2.4) and lower back (2.4). This is
consistent with the expected muscle group strains that will mostly be stressed by the
experimental task, which has been discussed earlier in this thesis. The other body regions
that obtained average ratings higher than 2 were hand (2.1) and arm (2.1). The rest of the
body regions scored less than 2. The low scores in each body region indicate minor or no
discomfort, which was expected because the experimental task was quite light and the
duration was approximately 15 minutes.
When the average discomfort ratings were compared for two glove port heights,
the shoulder and upper arm scored 0.33 and 0.67 points less for 122cm, respectively, but
for the lower back the score was higher by 1.0 points. Such scoring patterns are again
consistent with the fact that at lower glove port height requirement of shoulder and arm
elevation will be less and thus a less stressful muscle activity; a lower glove port height
will necessitate more bending of the back and hence more stress level of the back.
Table 4.1 shows the subject-wise scores of these three body regions for 122cm
and 132cm glove port heights. To verify the statistical significance of this difference in
scores, a paired one tailed t-test of the difference has been conducted with test
hypothesis:
where, (μ ι - μ2 1 is the absolute difference in the average scores with 122cm and
132cm glove port heights, respectively.

33
Based on the post experiment surveys, practically all participants perceived that
the experimental task was not too long or not too hard. Only the subject # 6 though the
experimental task was too long when the glove port height was set at 122cm. All

34
participants found the lighting level adequate for the experimental task. Average scores
of general survey questions about the task difficulty levels are summarized in Table 4.2.
Task difficulty ratings were assessed in a scale of 0 to 10 with 10 being stressful, 5 being
some (moderate) stress and 0 being no stress. Highest average score for stressfulness
score of 5.8 was given to the "pouring water to the beaker or bottle" task. It appeared
within the compact enclosure of the glove box, handling liquid filled bottle was perceived
to be most stressful. This was probably the precise muscular control required for the
task, as well as trying to avoid spilling liquid. The average scores were not appreciably
different for the two glove port level for any specific tasks. Appendix F contains the raw
stressfulness scores by the participants. A subject-wise matched paired t-test revealed no
effect (a=0.05) of glove port height on any of the individual tasks.

35
4.2 Rectified Average EMG Levels
EMG raw data in milli-volts was collected from four muscle groups at a rate of 1000 Hz
for approximately 15 seconds for the normalization task and on an average 13 minutes for
the experimental task. Thus total number of data points per subject for each experimental
session was 15*1000*4 =60,000 for normalization and 13*60*4*1000 = 3,120,000 for
each experimental session. Raw EMG data contains both positive and negative voltage
values, depending on the direction of the action potentials with respect to the bipolar skin
electrodes. At any instant, a positive or a negative voltage is collected at the bipolar
electrode. The positive or negative sign represents only a direction in current, but the
amplitude of the signals represents the strength of the action potentials generated within
the muscle, which is an indicator of the internal muscle contraction force generated at
that moment. Figure 3.2 shows a sample plot of the raw EMG data from four muscle
groups for one session of the experimental task.
Each set of raw EMG signals in millivolts was first rectified, and then the
average score was taken. The mean amplitude of the rectified EMG signals for each of
the four muscle groups both for the normalization and experimental task were determined
using the Bio-analysis software. For the normalization process, markers were used to
indicate the starting and completion when the normalization task was being done. The
time interval between these markers was used for averaging the normalization of EMG
data. This time interval was approximately 15 seconds. For the task EMG, the time
interval selected was over the entire task duration over which the average amplitude was
determined.

36
The strength of EMG signals sensed at the bipolar electrode is highly sensitive to
the electrical conductivity of the skin layer which separates the muscle and the electrode.
This conductivity is affected by the condition of the skin where the electrodes are applied
and also on the location of the electrodes with respect to the muscle. As a result of this
the task EMG amplitudes for 122 cm and 132 cm glove port heights cannot be compared
directly, because the EMG data was collected on two different days with new surface
electrodes placement on the second day, which may change the conductivity drastically.
4.2.1 Normalization of the Average Rectified EMG Signals
To compare the average EMG amplitude between the two task conditions, the rectified
average amplitude was normalized by dividing it by the rectified average amplitude of
the normalization task. Because in each of the experimental session, both normalization
and experimental tasks were performed without disturbing electrode placements, so no
changes in conduction properties are expected. Thus the normalized task EMG
amplitudes measured on two different days, now expressed in terms of the percent of the
normalization EMG, can be compared.
4.2.2 Comparison of the Normalized EMG
Table 4.3 provides the rectified average EMG values from trapezius muscle for
normalization and experimental task in volts and normalized task EMG in percent both
for 122cm and 132cm glove port heights. The last column of the table provides increase
in normalized EMG level which is calculated by subtracting the normalized EMG score
of 132cm from that of the 122cm. Similar computations for other three muscle groups —
anterior deltoid, biceps and erector spinae are provided in Appendices H — J.

37
For the trapezius muscle, normalized EMG (NEMG) increased for all subjects for
the 132cm height, with an average increase of 33.1/41.7 = 79% of trapezius muscle
activity when compared to that of 122cm height.
For the anterior deltoid, (Appendix H), seven participants out of nine showed and
increase in normalized EMG. The overall average increase of NEMG was 2.9, which
constitutes 2.9/20.9 = 13.9% increase over NEMG for the 122cm height, (Appendix H).
For the bicep muscles, (Appendix I), an increase and decrease in NEMG is
equally distributed among the participants, except for participant #3. Participant #3 hand
an abnormally high increase of 77.5. Upon scrutiny of the raw data, no explanation could
be found for such an unusually high value. Since the data point could not be discarded,
the average NEMG for the biceps increased by 10.3 for the 132cm height which
constitutes 10.3/24.0 = 42.9% increase over the 122cm value.

38
During processing of the normalization, data for erector spinae muscle for the
132cm heigh was lost for participant #1. As a result, participants NEMG values could be
compared, (Appendix J). The rest of the participants NEMG varied widely in both
directions. Overall, there was a (14.2/103.8 = 13.7%) decrease in the NEMG for the
132cm height.
Figure 4.2 Normalized EMG scores averaged over all participants for 122 cm and132 cm glove port height.
Figure 4.2 summarizes the average NEMG's over all participants for the four
muscle groups. Clearly, the first three muscle groups, i.e., trapezius, anterior deltoid and
biceps, show a decline for a glove port height of 122cm. As opposed to that of erector
spinae experienced an increase. This is exactly the effect that was anticipated.
Here it should be stressed that average NEMG values from the individual muscles
should not be compared to each other. For example, average NEMG for a trapezius
muscle is 74.9 as opposed to that of biceps is 24.0 for 122cm height. Even though it
shows that the bicep was comparatively carrying a lesser load, but the ultimate fatigue

39
characteristics depends on the maximum voluntary contraction capacity, (MVC), of the
individual muscles. MVC's for the individual muscle groups were not determined in this
research.
A one tailed t-test of difference of NEMG has been performed (Table 4.4). At
α = 0.05, the increase in trapezius NEMG was proved to be significant, where other
differences were not.
4.3 Analysis of Muscle Fatigue
The Median Frequency was used as a filter for all four muscles to analyze the raw EMG
signal. When using the Median Frequency Filter, options are given to choose the amount
of data points to be lumped together for analysis. The number of data points that were
chosen for this analysis was 4096. This was selected after given trials with other
selections. This option provided a smoother plot. The program was set up before hand to
record 1000 readings per second, so for each point in the median frequency plot, there is
approximately four seconds of data analyzed. What was expected to be found, if there
was indeed any fatigue, would be a general decrease (negative slope) of the median
frequency over time. But, upon examination, no discernable trends were evident while
using the median frequency filter on any of the participants muscle groups for either test
condition. Figure 4.3 shows the median frequency plot for participant #1.

Figure 4.3 Median frequency plot over time for participant # 1.
40
41
The power spectrums for all four muscles at both 122cm and 132cm were
analyzed for a downward shift that would indicate that fatigue took place. Three of the
first four participants had a shift in their power spectrums (mean frequency) for the
trapezius muscle, while the other muscle groups were found to have weak or no
discernable shifts. The other participants had little or no shifts in all other muscle groups
from 122cm to 132cm. Appendix K shows Participant #1 Power Spectrum `shift' from
122cm to 132cm. Both median frequency plot and power spectrum analysis could not
establish any change in fatigue level in any of the muscle groups for the glove port
heights. This is possibly due to the fact that the total experimental tasks were of small
duration and light in nature. Longer experimental tasks would probably bring out any
difference in the fatigue levels when working at different heights.

CHAPTER 5
CONCLUSION
This research investigated the effect of glove port height on upper body muscle stress in a
simulated laboratory experiment. The experiment allowed for a wide range of muscle
groups to be used along with varying degrees of dexterity while being constrained in an
effective simulation of a real glove box work station. The adjustable table used to raise
and lower the workstation and glove port heights allowed for physiological effects
different from previous studies with glove boxes.
Previous studies (Whitemore et al. 1994; Whitemore and Berman, 1996) found
similar survey results to this study when comparing two work stations, whether it was
height of the workstation or positioning at the workstation. This study found results that
reinforce posture sensitivity in workstation design. On average, the lower work station
found a higher perceived stress on the lower back, which was found to be statistically
significant (p = 0.05) attributed to bending forward. Also, it was anticipated that higher
workstations put more stress on the shoulders and upper arms. Findings of this study
were not statistically significant for trapezius, anterior deltoid and biceps. However,
average perceived discomforts were lower for those muscles, when working with lower
heights.
Results of this study in terms of Normalized EMG scores found that on average,
the trapezius, anterior deltoid, and bicep muscles had higher Mean Activities at 132cm
than were found with the 122cm glove port height, suggesting that more muscle
42
43
activation was used at 132cm than at 122cm. Increase in NEMG of trapezius was
statistically significant when glove port height was set to 132 cm.
Results of this study in terms of power spectrum analysis, where as the mean
frequency is analyzed for a shift in the average frequency, indicating fatigue, found that
several participants showed a small shift their power spectrums for the trapezius muscle
groups, but little or no shifts were found in any other muscle groups. No definite
conclusion could be drawn from the data that was given from the program. Therefore, no
muscle fatigue was found anywhere except for in several participants in the trapezius
muscle groups. This may be attributed to the short duration of the experimental tasks.
In conclusion, results from this study reinforced the ergonomic guidelines for
work height and demonstrates the importance of adjusting the correct glove port height
according to the anthropometry of the users. The research also provides, for the first time,
a set of quantitative data on upper body stresses in such situations. Further research with
larger numbers of participants would be necessary to find an optimum glove port height
when no height adjustment facility is available. Future studies can experiment with larger
populations of participants while performing longer durations than the 15 minute task
used in this study to better determine the fatiguing aspects of glove boxes. Also, if a
larger group of participants is studied, finding the relationship between worker height and
upper body muscle fatigue would be useful upon breaking the participants into subgroups
that are separated by height.

44
APPENDIX A
INFORMED CONSENT FORM
OCCUPATIONAL SAFETY AND HEALTH ENGINEERING PROGRAMDEPARTMENT OF INDUSTRIAL AND MANUFACTURING ENGINEERINGNEW JERSEY INSTITUTE OF TECHNOLOGY323 MARTIN LUTHER KING BLVD.NEWARK, NJ 07102
CONSENT TO PARTICIPATE IN A RESEARCH STUDY
TITLE OF STUDY: Effect of Glove Port Heights in Glove boxes on Work Performanceand Comfort of the workers for Performing Laboratory Work.
RESEARCH STUDY:
I, , have been asked toparticipate in a research study under the direction of Dr. Arijit Sengupta. Otherprofessional persons who work with him as study staff may assist to act for them.
PURPOSE:
The objective of this study is to find body comfort levels and performanceefficiency at differing arm port heights while performing laboratory tasks using a glovebox. This information is being sought after by the American Glove Box Society toprovide guidelines for better design of glove boxes in industry.
PROCEDURES:
I have been told that, during the course of this study, the following will occur:1. I will be asked to fill out a pre-survey and contact information questionnaire
pertaining to my current physical well being and fatigue and stress levels prior totesting.
2. Electromyography electrodes will be placed on my lower back, shoulders and armmuscles after lightly abrading the skin with an emery paper and cleaning the sitewith alcohol. These electrodes will be connected to the EMG preamplifier bymeans of electrical leads.
3. After I am connected for EMG, I will be asked to lift a 10 lb load and hold it for 2minutes at three different upper arm positions: outstretched horizontally, 45degrees from horizontal and vertically downward. In each of these position, EMGsignals will be recorded and will be used for normalization of EMG signals.
4. After normalization, I will perform a series of simple laboratory tasks in a glovebox (see attached Experimental Procedures), which will take approximately 15 to20 minutes. During this time I will be video taped for finding out later mypostural load and task completion times.

45
5. Immediately after the completion of the experimental task, I will be asked to fillout a post-survey to obtain my body discomfort levels due the performance of theexperimental tasks.
6. EMG electrodes will be removed and I will be asked to come back 2 days later toperform similar tasks and repeat the steps previously stated with a different heightof the workstation.
PARTICIPANTS:
I will be one of about 20 participants to participate in this trial.
EXCLUSIONS:
I will inform the researcher if any of the following apply to me:
If I am not between the ages of 18 and 65.
If I have had any previous major reconstructive surgery on either shoulder in thepast.
If I have a weak heart, shortness of breath, dizziness, or am diagnosed by a doctorthat I should not be working for extended periods of time.
If I have had any muscular-skeletal disorders or any other conditions/diseaseswhich may impact on the ability to perform the experimental tasks.
RISKS/DISCOMFORTS:
I have been told that the study described above may involve the following risksand/or discomforts.
Soreness of shoulder, neck, back, arm muscles. Minor itch at the electrode sites.
There also may be risks and discomforts that are not yet known.
I fully recognize that there are risks that I may be exposed to by volunteering inthis study which are inherent in participating in any study; I understand that I amnot covered by NJIT's insurance policy for any injury or loss I might sustain inthe course of participating in the study.
In case of an emergency, the principal investigator is trained and instructed to call911.
If I am not at least 62 inches of height, I will be provided with a platform of atleast 3 inches and no greater than 6 inches to perform the experiment.

46
If I am taller than 78 inches of height, I will be provided with a stool or chair toperform the experiment.
If you experience soreness or other adverse effects please contact yourphysician immediately and contact the principal investigator.
CONFIDENTIALITY:
I understand confidential is not the same as anonymous. Confidential means thatmy name will not be disclosed if there exists a documented linkage between myidentity and my responses as recorded in the research records. Every effort will bemade to maintain the confidentiality of my study records. If the findings from thestudy are published, I will not be identified by name. My identity will remainconfidential unless disclosure is required by law.
PAYMENT FOR PARTICIPATION:
I have been told that I will receive $10 dollars per hour compensation for myparticipation in this study. If I withdraw without finishing the experiment to itscompletion, or I am unable to finish the experiment due to excessive pain,discomfort, or unforeseen medical condition, I will be paid $5 dollars minimumfor my effort.
RIGHT TO REFUSE OR WITHDRAW:
I understand that my participation is voluntary and I may refuse to participate, ormay discontinue my participation at any time with no adverse consequence. I alsounderstand that the investigator has the right to withdraw me from the study atany time.
INDIVIDUAL TO CONTACT:
If I have any questions about my treatment or research procedures, I understandthat I should contact the principal investigator at:
Assocaite Professor Arijit SenguptaNew Jersey Institute of Technology2517, Guttenburg Information Technologies Center (GITC)973-642-70'73
If I have any additional questions about my rights as a research subject, I maycontact:
Dawn Hall Apgar, PhD, IRB Chair

47
New Jersey Institute of Technology323 Martin Luther King BoulevardNewark, NJ 07102(973) [email protected]
SIGNATURE OF PARTICIPANT:
I have read this entire form, or it has been to me, and I understand it completely.All of my questions regarding this form or this study have been answered to mycomplete satisfaction. I agree to participate in this research study.
SubjectName:
Signature:
Date:
SIGNATURE OF READER/TRANSLATOR IF THE PARTICIPANT DOES NOTREAD ENGLISH WELL:
The person who has signed above, does not read English well or at all, I can read English well and am fluent in , a language the subject understands well. I havetranslated for the subject the entire content of this form. To the best of myknowledge, the participant understands the content of this form and has had anopportunity to ask questions regarding the consent form and the study, and thesequestions have been answered to the complete satisfaction of the participant.
Reader/Translator Name:
Signature:
Date:
SIGNATURE OF INVESTIGATOR OR REPSONSIBLE INDIVIDUAL:
To the best of my knowledge, the participant, Has understood the entire content of the above consent form, and comprehendsthe study. The participants and those of his/his parent/legal guardian have beenaccurately answered to his/their complete satisfaction.
Investigator's Name: Signature: Date:

APPENDIX B
PHOTO RELEASE FORM
New Jersey Institute of TechnologyUniversity Heights
Newark, NJ 07102-1982Tel: (973) 596-3433
I hereby irrevocably grant to New Jersey Institute of Technology the absolute right andpermission to copyright and/or publish or take or use my name, voice or photographicportraits or pictures, or in which I may be included in whole or in part, or in compositeform in conjunction with my name and other identifying information, or reproductionsthereof in color or otherwise, made through any media for art, print, web, advertising,film, telecast or any other lawful purpose whatsoever. I also grant New Jersey Instituteof Technology the same right and permission to us written or verbal statements ortestimonials made by me.
Date
Print Name
Signature
Address
City State Zip Code
Parent (if under 18 years old) or Guardian
48
APPENDIX C
CONTACT INFORMATION
Name:
Address:
Phone Number:
E-Mail Address:
Particpant Number #: Date: (1) TimeDate: (2) Time
49

50
APPENDIX D
PRE-SURVEY QUESTIONNAIRE
Height:Weight:Age:
Sex: Male Female
I have never had any serious shoulder injuries?Yes No
I do not have a weak heart, shortness of breath, or diagnosed by a Physicianthat I cannot perform physical work for extended periods of time:
Yes No
I did not any do any fatiguing upper body exercises in the past 2-3 daysYes No
I do not feel tired or fatigued for the performance of the experimental task?Yes No
I understand that my personal information will only be used for the purposes of this studyand that all of my information is correct.
Signature:

10 5 0
Lower back —
Stomach -
Thigh —
Knee —
Foot -
Upper back —Hand—
Arm—
Upper arm —
Shoulder —
Neck —
APPENDIX E
POST-SURVEY QUESTIONNAIRE
Participant Number #:
51
Body Part Stress/Discomfort Scale
Date:
Stress/Discomfort Some(moderate) Stress/Discomfort No stress/Discomfort
Using the above scale, rate the stress/discomfort at the following body parts in the tablebelow:
Using the above rating scale, what level of stress did you perceive while performing thesespecific tasks? :
Holding your arms through the arm ports and into the gloves:
Using the plastic spoon to scoop either drink mix or sugar into the
Containers:
Pouring water into either the beaker or the 250mL bottles:
Using the plastic pipette:
Screwing the caps onto the plastic bottles:

General Survey
Did the task seem too hard? Yes No
If yes, what was hard about it?
Did the task seem to be long in duration? Yes No
Was the lighting adequate? Yes No
Anywhere on your person that was in pain besides those indicated by earlier questions?
Any other remarks you may have to the experimental task:
If you experience soreness or other adverse effects please contact your physicianimmediately and contact the principal investigator
Associate Professor Arijit SenguptaNew Jersey Institute of Technology2517, Guttenburg Information Technologies Center (GITC)973-642-7073Department of Engineering Technology
52
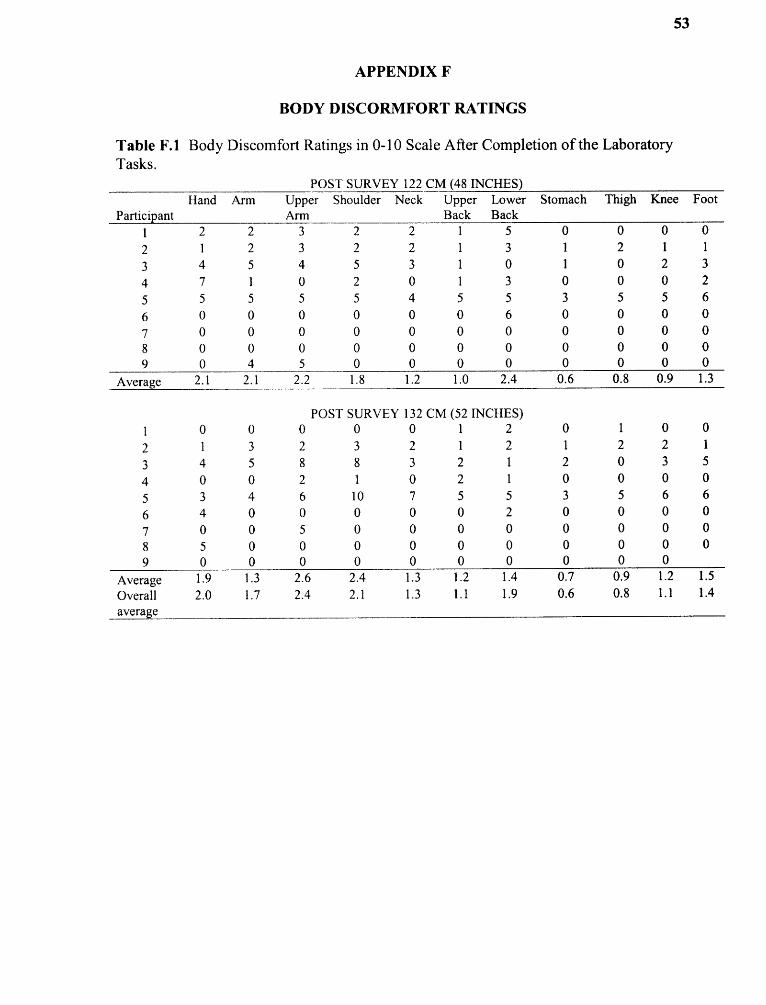
53

54

55
APPENDIX H
ANTERIOR DELTIOD MUSCLE DATA
Table H.1 Average EMG Activity of the Anterior Deltoid Muscle in Participants at 122cm and 132 cm Glove Port Heights
Participant
122 cm 132 cmI innoo rmm
aallized
EMG (%)
Rectified average EMG(volt) Normalized
EMG (%)
Rectified average EMG(volt) Normalized
EMG (%)Norm Task Norm Task
1 0.128 0.020 15.8 0.141 0.033 23.2 7.4
2 0.202 0.028 14.0 0.279 0.023 8.1 -6.03 0.116 0.040 34.2 0.103 0.026 24.8 -9.4
4 0.076 0.015 20.0 0.100 0.021 21.0 1.0
5 0.129 0.010 7.6 0.110 0.016 14.6 7.1
6 0.188 0.016 8.4 0.068 0.013 19.4 11.0
7 0.092 0.036 38.8 0.093 0.041 43.8 5.18 0.176 0.027 15.2 0.087 0.021 24.0 8.8
9 0.064 0.022 33.9 0.061 0.022 35.1 1.2
Average 20.9 23.8 2.9
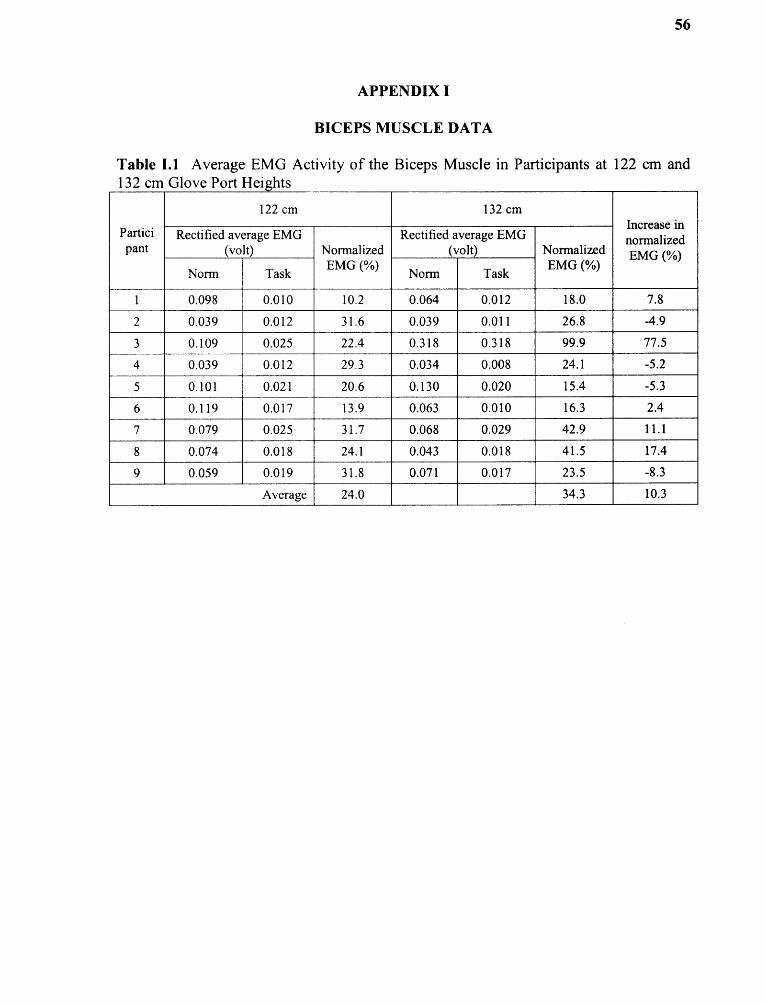
56
APPENDIX I
BICEPS MUSCLE DATA
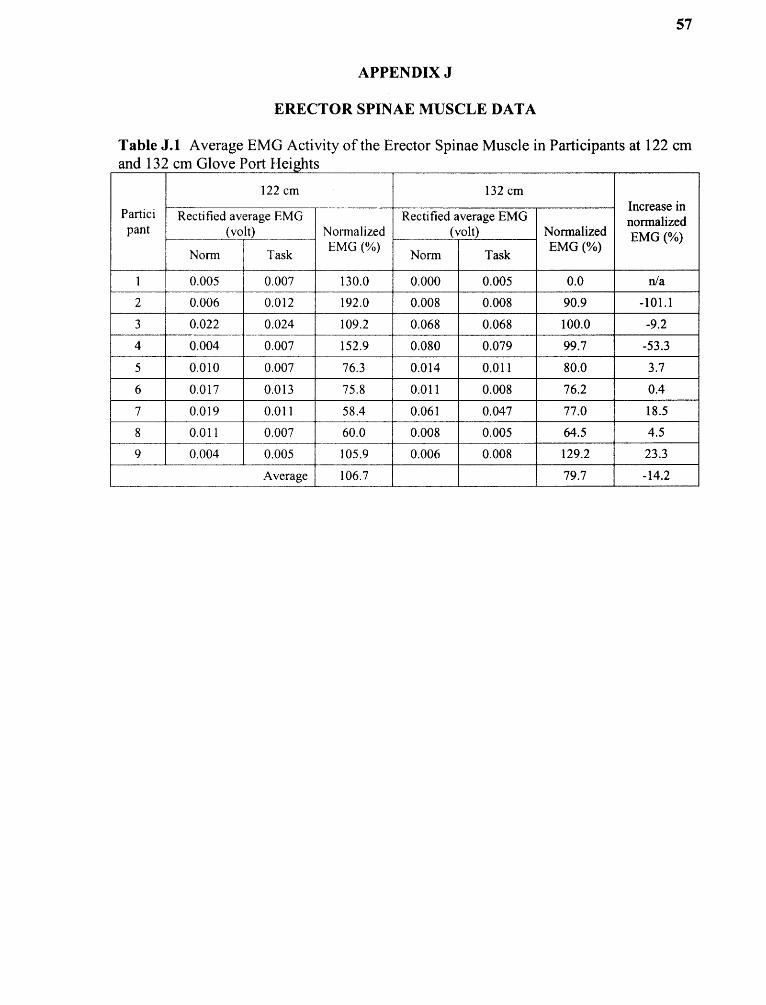
57
APPENDIX J
ERECTOR SPINAE MUSCLE DATA

APPENDIX Κ
POWER SPECTRUM GRAPH
58
Figure K.! Example power spectrum graphs of participant #1 that were analyzed.

59
REFERENCES
1. Chaffin, D B. (1973), Surface electromyography frequency analysis as aDiagnostic Tool, Journal of Occupational Medicine 11: 109-115.
2. Das, B. Sengupta, A: (1996), Industrial Workstation Design: A Systematicergonomics Approach, Applied Ergonomics, Volume 27, No. 3, 157-163.
3. Eastman Kodak, (1983), Ergonomic Design for People at Work Volume 1 HumanFactors Section Health Safety and Human Factors Laboratory 1983 30-50.
4. Eastman Kodak, (1986), Ergonomic Design for People at Work. Volume 2, 20-30,217-230.
5. Kroemer,K.H.E. Grandjean, E. (1997), Fitting the Task to the Human, (FifthEdition) 35, 53, 147-150.
6. Konz, S. (1995), Work Design Industrial Ergonomics (Fourth Edition)Part 4,Chapterl5, 200-211.
7. Kumar, S. Mital, A. (1996), Electromyography in Ergonomics, 1-48, 163-182.
8. Schudlt, K, Ekholm J, Harms-Ringdahl K, et al. (1986), Effects of Changes inSitting Work Posture on Static Neck and Shoulder Muscle Activity,Ergonomics, 1525-1537.
9. Sengupta, A.K Das, B. (2000), Maximum Reach Envelope for the Seated andStanding Males and Females for Industrial Workstation Design, Ergonomics44(g): 1390-1404.
10. USDHH (U.S. Department of Health and Human Services), (1992), SelectedTopics in Surface Electromyography for use in the Occupational Setting: Expert Perspective, publication number 91-100, March 1992.
11. Whitemore, Mihriban, McKay, Timothy D., Mount, Frances E. (1994),Ergonomic Evaluation of a Spacelab Glove box, International Journal ofIndustrial Ergonomics 16, 155-164.
12. Whitemore, Mihriban and Berman, Andrea H. (1996), Ergonomic Evaluation ofMicrogravity Workstations NASA CR — 1996 — 201378. 1-20.
13. Website: Internet Explorer, http://www.gloveboxsociety.org, 2006.