Copyright · vii Thank you to the Ysleta Independent School District, Mr. Manny Soto and to Mr....
235
Transcript of Copyright · vii Thank you to the Ysleta Independent School District, Mr. Manny Soto and to Mr....


Copyright
by
Susan Brooks Lair
2003

The Dissertation Committee for Susan Brooks Lair certifies that this is the
approved version of the following dissertation:
A STUDY OF THE EFFECT SCHOOL FACILITY CONDITIONS
HAVE ON STUDENT ACHIEVEMENT
COMMITTEE:
Donald Phelps, Supervisor
Barbara Robles, Supervisor
Nolan Estes
William Moore
Jay Scribner

A STUDY OF THE EFFECT SCHOOL FACILITY CONDITIONS
HAVE ON STUDENT ACHIEVEMENT
by
SUSAN BROOKS LAIR, B.S., M.S.
DISSERTATION
Presented to the Faculty of the Graduate School of
The University of Texas at Austin
in Partial Fulfillment
of the Requirements
for the Degree of
DOCTOR OF PHILOSOPHY
The University of Texas at Austin
May 2003

DEDICATION
to James, forever

v
ACKNOWLEDGMENTS
First, I would like to thank Gary and Dixie Boyd. Without their
recommendation and encouragement, I am certain I would not have been a
member of the Cooperative Superintendency Program. My association with this
group and my ability to say that I am a member of Cycle XIII fills me with pride.
My dissertation committee is second to none. Their knowledge and
experience give me pause. I am a better person for knowing them, and I am
honored to walk in their shadow. Dr. Nolan Estes is not just an educator; he is a
Texas education legend. I applied for this program hoping to have him as a
teacher. He has come to my rescue more than once during this arduous ordeal
called a dissertation, and I will be eternally grateful for his instruction and
friendship. Dr. William Moore inspires me to be a better person and a better
educator. He opened my eyes to my need for scholarly reading and my
responsibility as an educator to share the best of those readings with my colleagues
and students. I am still amazed that there really is a Dr. Jay Scribner. I often
referenced his work during my master’s program, but I never dreamed I would
have the honor of his instruction. I am especially indebted to Dr. Barbara Robles,
my dissertation co-chair, for meeting with me to explain again and again the
concepts and procedures for statistics. I never felt alone while sitting at my desk in
the early hours of the morning. The knowledge that assistance from Dr. Robles

vi
was just an email away kept me working. I owe a tremendous debt to Dr. Donald
Phelps for agreeing to be my dissertation chairman. He provided guidance and
direction, but, most importantly, he is my mentor and my role model. Of all his
endearing qualities, I admire his commitment to excellence and his dedication to
equity. Dr. Phelps pointed the way; it was up to me to make the journey, and I am
thankful he was by my side.
I am grateful to others within The University of Texas. I almost minored in
Dr. Schott’s courses. I am a life member of the Dr. Schott fan club. Dr. Northcutt
did not have to help me. His work with me was finished the day I completed his
course, and yet his door was always open to me. I do not know what I would have
done without him. Dr. Martha Ovando is the only woman instructor I had from the
Department of Educational Administration. Her course is a legendary elective.
Her help with my first three chapters gave me strength and a sense of
accomplishment that I was halfway home. Many of us owe our graduation to Dr.
Ovando. I am especially thankful to my friends James Lani, Judy Baker, Sarah
Jimenez, Hortensia Palomares, Sheryl Powell and Naomi Alford—without their
assistance, expertise and friendship, this dissertation would not be a reality.
Thank you to the faculties of Saint Mary’s Hall and St. Francis Episcopal
Day School, who encouraged me and who were patient with my distraction. A
special thank you and acknowledgment goes to the Board of Trustees at St. Francis
and especially Jan Pakalka for understanding my need to finish this degree.

vii
Thank you to the Ysleta Independent School District, Mr. Manny Soto and
to Mr. Tony Trujillo. You had the courage to do what others said was impossible.
The legacy you leave is in the capable hands of your city’s children and the fine
school buildings that stand as daily reminders of your confidence in their future.
Thank you to my Cooperative Superintendency Cohort and especially to
my friend, Sara McAndrew. The readings, the studying, the projects, the late
hours, the long drives, the worry, the laughter are behind us but our friendship is
ours to keep. Hats off to Dr. Sara McAndrew and my Cycle XIII Cohort friends.
Most importantly, thank you to my family. Jesse and Lou Brooks, my
parents, did not formally go to college, but their inspiration and support went daily
with me. I regret that my Dad is not here to see me finish, but I am truly grateful
my mother is. My children, Dianne, Kimberly and Logan have spent a lifetime
traveling with me to school. Each one was barely in this world when I was off
again to serve other people’s children. Amazingly, they have never complained. I
am blessed by their lives and their love. Thank you, Jimmy and Crystal for joining
our family, and for Hayden and Cyndle the joy of our lives.
For over 35 years, James Lair has supported my private hopes and chased
away my worries and regrets. He is a jack-of-all-trades and a master of most. He
has sacrificed for me, shared his talents, his name and his life. He is a remarkable
man: my inspiration, my hero and my love. At last, I am finished. Thank you for
waiting.

viii
A STUDY OF THE EFFECT SCHOOL FACILITY CONDITIONS
HAVE ON STUDENT ACHIEVEMENT
Publication No. ______________
Susan Brooks Lair, Ph.D.
The University of Texas at Austin, 2003
Supervisors: Donald G. Phelps and Barbara Robles
The purpose of this study was to explore the effect school facilities have on
student achievement as measured by the Texas Assessment of Academic Skills,
TAAS, test in a high-performing, high-poverty school district in Texas. A
relationship between the condition of school facilities and student achievement,
while assumed, is difficult to assess. This study contains a presentation of the
information and data findings from the Ysleta Independent School District and its
decision in 1994 to include school facilities as a component of its student
achievement initiative. The schools were randomly selected and the case study

ix
research was conducted using a mixed-method approach. Data provided by the
schools’ principals on building structure, maintenance, and housekeeping were
collected using a questionnaire based in part on the “Commonwealth Assessment
of Physical Environment” used by Cash (1993), Hines (1996) and Lanham (1999)
in Virginia. Student achievement was measured using the percent of students at
each school passing the TAAS sub-tests of reading, mathematics, and writing and
the percent passing all the TAAS tests from 1994 to 2001. The effect school
facility conditions have on student achievement found definition through the major
themes of risky decisions, powerful people, buildings matter and accountability.
The study resulted in findings that merit attention and support previous
research that points to building age, overall building maintenance and cleanliness
as elements that help explain student achievement. These findings were limited
due to the self-reported nature of information collected using surveys, the small
sample size of schools, and the aggregate nature of the data that can obscure or
neglect important evidence. Nevertheless, since the goal of the Texas education
system is to improve student achievement, the identification of barriers to
achievement brought on by the condition of school facilities is important.

x
TABLE OF CONTENTS
List of Tables....................................................................................................xiiChapter I: The Study.........................................................................................1
Introduction ...................................................................................................1Research Questions ........................................................................................6Purpose of the Study ......................................................................................7Significance of the Study ...............................................................................7Methodology..................................................................................................9Definitions ...................................................................................................10Limitations and Delimitations ......................................................................15Summary......................................................................................................15
Chapter II: Review of Related Literature.......................................................18Historical Perspective of School Facilities....................................................19
Physiological Effects of Facilities...........................................................21Psychological Effects of Facilities ..........................................................26Educational Effects of Facilities .............................................................28Access Obstacles to State Aid and to Adequate Funds for Maintenance, Renovation, and Construction of Facilities...........................................35Litigation Regarding Access, Equity, and School Facilities ....................41Texas’ Policies Regarding School Facilities ...........................................45
The Need for Further Study Linking Facilities and Achievement in High-Performing, High-Poverty Districts ...............................................48Shortcomings of Previous Studies ................................................................49Theoretical Framework ................................................................................51Summary......................................................................................................52
Chapter III: Methodology ...............................................................................54Population....................................................................................................54Setting..........................................................................................................55Research Design...........................................................................................56Case Study Research ....................................................................................59
The Role of the Researcher.....................................................................60Description and Selection of Participants .....................................................61Procedure.....................................................................................................64The Interviews .............................................................................................66
Interview Data Analysis .........................................................................67Trustworthiness and Credibility of Interviews ........................................67
Data Collection and Instrumentation ............................................................69

xi
Survey Administration .................................................................................71Response Rate ........................................................................................72Scoring...................................................................................................72Reliability and Validity ..........................................................................72
Texas Assessment of Academic Skills..........................................................73Data Analysis...............................................................................................73Limitations of the Study ...............................................................................75Summary......................................................................................................76
Chapter IV: Findings of the Study..................................................................77The Interviews .............................................................................................79Context ........................................................................................................81
Risky Decisions .................................................................................................82Determination ........................................................................................83Symbolic Trust.......................................................................................84Economic Value .....................................................................................86Politics ...................................................................................................87Pride.......................................................................................................88
Powerful People.................................................................................................89Determination ........................................................................................92Symbolic Trust.......................................................................................84Economic Value .....................................................................................86Politics ...................................................................................................92Pride.......................................................................................................93
Buildings Matter ................................................................................................95Determination ........................................................................................95Symbolic Trust.......................................................................................97Economic Value .....................................................................................98Politics ...................................................................................................99Pride..................................................................................................... 101
Accountability ................................................................................................. 102Determination ...................................................................................... 102Symbolic Trust..................................................................................... 103Economic Value ................................................................................... 103Politics ................................................................................................. 104Pride..................................................................................................... 106
Survey of TAAS Results.................................................................................. 106The Survey........................................................................................... 106Survey Responses................................................................................. 107
Section I: Questions Related to Demographics and School Structure................ 107Section II: Questions Related to School Maintenance....................................... 123Section III: Questions Concerning Housekeeping............................................. 132

xii
Variable Description and Criteria ............................................................... 146Predictors and Criterion Variables.............................................................. 147Regression Equations ................................................................................. 149Seemingly Unrelated Regression (SUR)..................................................... 150Building Conditions, Student Subgroups, and TAAS Scores ...................... 151
First Regression.................................................................................... 152Second Regression ............................................................................... 153Third Regression .................................................................................. 154Fourth Regression ................................................................................ 155Fifth Regression ................................................................................... 156
Change in TAAS Scores Over Time........................................................... 156Sixth Regression – Seemingly Unrelated Regression System (SUR)........... 160Summary.................................................................................................... 161
Chapter V: Discussion, Conclusions, and Recommendations for Future Research ....................................................................................... 163
Summary of the Study................................................................................ 163Analysis of Findings .................................................................................. 165
Interview Findings................................................................................ 165Survey Findings ................................................................................... 173Regression Findings ............................................................................. 176
Conclusions ............................................................................................... 180Implications ............................................................................................... 183Limitations................................................................................................. 187Recommendations for Further Study .......................................................... 189
Appendices ..................................................................................................... 192References ...................................................................................................... 208Vita ................................................................................................................. 220

xiii
List of Tables
Table 1: Neighborhood Demographics ............................................................. 109Table 2: Facilty Age in Years........................................................................... 110Table 3: Windows in Each Classroom.............................................................. 111Table 4: HVAC System ................................................................................... 111Table 5: Air Conditioning ................................................................................ 112Table 6: Heat Control....................................................................................... 113Table 7: Flooring of Instructional Spaces ......................................................... 114Table 8: Interior Ceilings ................................................................................. 114Table 9: Type of Lighting ................................................................................ 115Table 10: Adequate Lighting............................................................................ 116Table 11: Wall Color ....................................................................................... 116Table 12: Furniture Condition .......................................................................... 117Table 13: Science Utilities and Equipment ....................................................... 118Table 14: Science Equipment Updated............................................................. 119Table 15: Classroom Availability..................................................................... 120Table 16: Portable Buildings............................................................................ 121Table 17: Noisy Environment .......................................................................... 122Table 18: Condition of School Grounds ........................................................... 123Table 19: Condition of Lockers........................................................................ 124Table 20: Windows Operational....................................................................... 125Table 21: Floors Maintained ............................................................................ 126Table 22: Ceiling Tiles..................................................................................... 126Table 23: Interior Walls Painted....................................................................... 127Table 24: Exterior Walls Painted...................................................................... 128Table 25: Roof Leaks....................................................................................... 129Table 26: Adequate Maintenance Staff............................................................. 130Table 27: Maintenance Requests ...................................................................... 131Table 28: Overall Structural Condition............................................................. 132Table 29: Frequency Floors Swept or Vacuumed ............................................. 133Table 30: Instructional Floors Mopped or Cleaned........................................... 133Table 31: Graffiti ............................................................................................. 134Table 32: Graffiti Removal .............................................................................. 135Table 33: Condition of theWalls ...................................................................... 136Table 34: Appearance of Building and Classrooms Is Adequate....................... 137Table 35: Hallways Kept Clean........................................................................ 137Table 36: Does School Smell Good.................................................................. 138Table 37: Is Housekeeping Staff Adequate....................................................... 139Table 38: Overall Cosmetic Condition of Facility ............................................ 140

xiv
Table 39: Academic Performance Affected by Facilities .................................. 141Table 40: Current Condition of Educational Facility ........................................ 142Table 41: Approximate Square Footage of Facility .......................................... 143Table 42: Approximate Acreage of School Campus ......................................... 144Table 43: Variable Descriptions and Criteria.................................................... 146Table 44: TAAS Scores Means, Standard Deviations, Minimum and Maximum,
and Frequency By Race..................................................................... 148Table 45: Beta Weights, T value, and Probability for T value when TAAS Total is
the Criterion ...................................................................................... 153Table 46: Beta Weights, T value, and Probability for T Value When TAAS
Disadvantaged Students is the Criterion............................................. 154Table 47: Beta Weights, T value, and Probability for T Value When TAAS for
Hispanic Students is the Criterion...................................................... 155Table 48: Beta Weights, T value, and Probability for T value when TAAS for
White Students is the Criterion .......................................................... 156Table 49: TAAS All Tests Taken – All Students
Percent Passing – 1994-2001 ............................................................. 157Table 50: TAAS All Tests Taken – Hispanic Students – Percent Passing ......... 158Table 51: TAAS All Tests – Economically Disadvantaged
Percent Passing 1994-2001................................................................ 159Table 52: Percent of Change in TAAS All scores from 1994 to 2001 ............... 160Table 53: Beta Weights, T value, and Probability for T value when
TAAS is the Criterion........................................................................ 161

1
CHAPTER I
THE STUDY
Introduction
Before some Texas principals can recruit and retain qualified teachers,
implement programs designed for academic excellence and nurture a student body
that cares about themselves and their community, they must grapple with the
problems created by overcrowded, poorly maintained, and pitifully outdated
school facilities (Earthman, 1996). Texas is not alone. More than one third of the
nation’s public schools need major repairs. The National Education Association
(NEA) estimates these repairs will cost taxpayers over $322 billion. The National
Center for Education Statistics projects elementary and secondary enrollments will
swell to 54.4 million by 2006. To serve additional students, state and local
governments will need to build approximately 6,000 new schools in the next
decade. The average price for a new school will be near $10 million (“Efforts to
fix,” 1996). In 1995 over half of the schools reporting to the United States General
Accounting Office (GAO) listed at least one major building feature in disrepair
requiring extensive repair or replacement (Health, Education, and Human Services
Division, February, 1995). As a result, debate and litigation concerning access to

2
one of the few quantifiable elements of quality education continues to be heard in
state legislatures and courthouses across the country.
As Hanson (1992) pointed out, 31 percent of American schools were built
prior to World War II. As a result of increasing demands on public funds, facility
improvement and maintenance are often deferred. Deferred maintenance has
emerged as a trouble spot because of school districts’ need to divert funds
earmarked for maintenance to other educational reform measures (Lanham, 1999).
Poor districts are caught in a trap of needing funds, yet not having the tax base to
support higher costs. Decision-makers are faced with the difficult decision to cut
existing programs and services or defer routine maintenance. Unfortunately,
maintenance is often the target since the effects are not immediately visible.
According to the GAO, one-third of all schools serving 14 million students need
extensive repair or replacement; 28,100 schools serving 15 million students have
less-than-adequate heating, ventilation, and air-conditioning systems; 23,100
schools serving 12 million students have less-than-adequate plumbing; and 21,000
schools serving 11 million students have less-than-adequate roofs. It is easy to see
why many educators and public officials believe that the next crisis in education
will involve facilities.
Equity, efficiency, and accountability have emerged as central themes for
educators and lawmakers across the country. In his 2001 State of the Union
address, President George W. Bush called for continued emphasis on equity,

3
accountability and a resolution to the problems of our nation’s crumbling school
infrastructure. The relationship between building conditions and student
achievement has been debated since the early 1960’s. In fact, debate over equity,
efficiency, and accountability started in Texas.
The 1869 Texas Constitution established a public education system for the
citizens of Texas. Authority over the education of children within their boundaries
was given to cities in 1875. Although attending school was optional, enrollment
across the state grew. According to the 1875 amendment, public education would
be funded through local property taxes and expenditures for school buildings
funded through public bonds. In 1908, an additional amendment mandated the
education of all elementary-aged children within the boundaries of a city. Cities
soon became aware of the inequities of a system that relies on property taxes for
support. Rural towns and cities with a small tax base found it increasingly difficult
to keep their doors open and practically impossible to obtain a reasonable rating
for their bonds.
In 1949, a new plan for financing Texas education was introduced through
the Gilmer-Aikin Bill. The bill contained incentives for cities to consolidate in
order to alleviate their debt. Unfortunately, cities were reluctant to take advantage
of consolidation. As a result, the Guaranteed Bond Program was established in
1984 and was backed by the state’s Permanent School Fund. This bond program

4
supported districts and assisted in them in securing bonds at the best interest rate
possible.
Facilities became an issue of equity in the original brief filed on behalf of
the plaintiffs in Texas in May of 1984. In Edgewood Independent School District,
et al. v. Raymon L. Bynum, Commissioner of Education, et. al., the parties
bringing the suit alleged that the state’s finance system contained the following
inequities:
• extreme ranges of wealth in taxable property value among school
districts;
• lack of money to fund building, renovation or capital improvements;
• hold harmless clauses, that increase expenditure disparities and
decrease state funds available for redistribution;
• actual accountable costs of financing an equitable education were not
considered;
• flat per-capita grants given regardless of wealth;
• the use of property values that are two or more years old, thus
providing lag time that is an advantage to wealthy, growing districts;
• equalization aid that is inadequate to fund educational programs in
property-poor districts;
• property poor districts inability to pay competitive salaries and attract
superior teachers is due to personnel unit funding;

5
• advantages to wealthy districts due to local fund assignment levels that
result in savings to wealthy districts and less money for equalization
aid;
• per capita amounts that are too low for bilingual education, affecting
property-poor districts more heavily than wealthier districts;
• a finance system that is complicated and which gives an advantage to
wealthy districts;
• formulas, statutes, and rules implemented with the knowledge that they
result in continued disparities in the ability to provide equitable
education to the children of the state (Strain, 1985).
The plaintiffs claimed that the system discriminated against taxpayers,
parents and children in property-poor districts, thus violating the individual
plaintiffs’ rights as guaranteed in the Texas Constitution. Several of the original
claims were settled following House Bill 72, but the original plaintiffs filed an
amended brief on March 5, 1985. Among other inequities, they cited the state’s
continued negligence by not providing funds for construction and renovation of
school buildings or capital improvements. They also pointed out that when
property-poor districts were faced with rectifying facility shortages, remodeling or
replacing inferior facilities, they had to tax themselves at significantly higher
levels than property-rich districts in order to get funds for construction.

6
Following Judge Clark’s 1987 ruling, the Texas Legislature has tried to
address facility equity in several different ways. In 1989, the School Facilities
Advisory Committee was established. It was charged with conducting school
facilities inventories and establishing facility standards. In 1995, the legislature
authorized $170 million for the Facilities Assistance Grant program. Although it
helped somewhat, property-poor school districts still struggled to obtain funds for
school improvements. In 1997, $200 million was placed in a program called the
Instructional Facilities Allotment (IFA). This allotment guaranteed state aid for
debt service payments. While Instructional Facility Allotment has helped districts
across Texas, access to this allotment by property-poor districts continues to be
hotly debated.
Research Questions
Three research questions guided this study:
1. What factors directly affect the decision to include facilities as a
component of educational adequacy?
2. How does availability of funds impact priorities regarding maintenance,
renovation, and construction of facilities?
3. To what extent can student achievement on the TAAS test be explained
by socio-economic condition, school size, building age, cleanliness,

7
maintenance, and the condition of the school’s structure? (Lanham,
1999)
Purpose of the Study
The educational process is a complex system. No one part can stand alone,
and the influence of each is intermingled. The purpose of this study was to
explore the effect that school facilities have on student achievement as measured
by the TAAS test in a high-performing, high-poverty school district in Texas.
Since the goal of the Texas education system is to improve student achievement,
the identification of barriers to achievement brought on by the lack of access to
money for facility improvement or local budget constraints that prevent needed
facility upgrades is important.
Significance of the Study
Educators and lawmakers must consider the role that school facilities play
in providing an equitable, efficient and quality education as they continue their
efforts to improve student achievement. Identification of specific factors that
contribute to student achievement can help facility planners, administrators,
teachers, and lawmakers prioritize their struggle to provide access to a quality
education for all Texas youth.

8
Issues concerning equity, adequacy and access continue in Texas. Recent
studies have investigated links between facilities and student achievement in both
rural and urban settings. Since most students spend up to 24,000 hours between
grades one and 12 within the walls of a school, educators must investigate possible
links between building conditions and student achievement (Cash, 1993;
Lemasters, 1997). This study examined the change in student achievement over an
eight-year period in a high-performing, high-poverty district in Texas and explored
the role facilities played in that achievement. Since Texans are asked to spend
millions of dollars each year maintaining, improving and constructing school
facilities, it is important to know if the dollars spent through this effort contribute
to student achievement.
This study was timely in its examination of school facility conditions and
student achievement in light of discussions surrounding the budget cuts on the
state level and access to funds by poor districts. While Texas lawmakers have
Texas students’ best interest at heart, without supporting data, it is difficult for
them to understand the financial impact of their decisions on individual districts
and student already marginalized due to their socio-economic condition. Local
school boards are often faced with difficult decisions concerning the use of funds
that have not grown proportionally to meet the increasing demands of student
growth, program development, school facility maintenance, teacher salaries, and
general inflation. Local districts must prioritize their money to enact mandated

9
programs and provide the funds for expenditures necessary to meet accreditation
standards even though these expenditures might not address the district’s most
pressing needs as defined by the district. The results from this study combined
with those of Edwards (1991), Cash (1993), Hines (1996), Lanham (1999), and
others can provide Texas citizens and lawmakers with additional information as
they debate necessary changes in Texas school funding procedures and equal
access issues for all Texas schools.
Methodology
Since the days of the one-room schoolhouse, communities have joined
together to provide their children with places to learn. As a result, city planners
often point to school facilities as examples of their stewardship and the importance
education is to their community. Time, effort, and expense have contributed to the
planning of these structures. In fact, many changes in school facility design are a
result of facility research, pointing out a connection between particular
components of school facilities and student achievement (Cash, 1993; Hines,
1996; Lemasters, 1997; Lanham, 1999).
This research used a mixed-method design investigating the link between
school facilities and student achievement in the Ysleta Independent School
District. Ysleta is a high-poverty, high-achieving school district and has been

10
included in recent studies investigating student achievement. This study
investigated whether the condition of Ysleta’s school facilities contributed to the
improved student achievement over an eight-year period. Information was
gathered concerning the district’s access to funds for facility maintenance and
improvement, as well as decisions made by the district regarding those funds that
it considers instrumental to student achievement.
Definitions
Average Daily Attendance (ADA) is the average number of students in
attendance. This number is used to entitle the school district to funding allotments
based on the state’s foundation funding formulas (Texas School Law Bulletin,
1994).
Bonds are certificates of debt issued by a government or corporation
guaranteeing payment of the original investment plus interest by a specified future
date. Municipal bonds are issued by a city or its government and require public
approval.
Classroom Structure is the way in which a teacher arranges the
presentation of the course content.
Climate Conditions are the temperature and humidity of the building.

11
Color is the hue of paint used for interior and exterior walls and
furnishings.
Commonwealth Assessment of Physical Environment (CAPE) is an
instrument developed by Cash (1993) and used by Hines (1996) and Lanham
(1999) to rate facilities on such factors as climate control, acoustics, illumination,
student density, science equipment adequacy, building age, and cosmetic facility
condition.
Density is the number of students versus the classroom square footage.
Economically Disadvantaged Student is a student who is eligible to
participate in the National Free or Reduced Lunch Program established by 42 USC
1751 Et. Seq. TEC 5.00.
Equalization is the attempt to compensate for differences in order to make
several things equal. Wealth equalization compensates for differences in a school
district’s ability to provide funds for education in order to achieve student equity
or taxpayer equity (Funk, 1980).
Facilities are limited to buildings specifically used for education. These
are often referred to as schools.
Flat Grant provides districts a set amount of money that is legislatively
determined on some distribution basis. Flat grants are available to all districts
within the state and are not dependent on district wealth.

12
Foundation School Program is the program under which Texas public
school districts receive resources to provide basic instruction and facilities to
eligible school districts. It refers to the amount the state has determined is
necessary for an adequate education. This program also establishes the fiscal
obligation by the state.
Full State Support implies a major commitment by the state to a building
program. Under this plan, the state accepts the responsibility for education rather
than the local district (Thompson, 1988).
Instructional Facilities Allotment is a program contained in House Bill 4
(HB 4) enacted by the 75th Texas Legislature to equalize the burdens of debt
service in financing school construction and which appropriated $200 million
toward school construction. The 76th Legislature appropriated an additional $150
million for new applications in the 1999-2001 biennium.
Lighting is the process used to illuminate the classroom or the school
building.
Maintenance and Operation Taxes (M & O Taxes) are local school
taxes determined by the city in which the district resides.
Maintenance is the process of maintaining the integrity of the
infrastructure of the school building.
Noise is sound that competes or interferes with student concentration.

13
Percentage Matching Grants provide funds to districts on the same cost-
share basis as equalization grants only with a fixed level of state commitment
(Thompson, 1988).
Public Education Information Management System (PEIMS), founded
through the Texas Education Code, contains only the data necessary for the
legislature and the Texas Education Agency (TEA) to perform their legally
authorized functions in overseeing public education in Texas.
Statistical Package for the Social Sciences (SPSS) is a software package
used for conducting statistical analyses, manipulating data, and generating tables
and graphs that summarize data. Statistical analyses range from basic descriptive
statistics, such as averages and frequencies, to advanced inferential statistics, such
as regression models, analysis of variance, and factor analysis.
Socioeconomic Status (SES) is defined as the ratio of students on fee and
reduced lunch to the number of students enrolled in the school. This factor is used
as a covariant to control achievement related to SES.
State Board of Education (SBOE) is assigned specific rulemaking
authority under the Texas Education Code. SBOE rules are codified under the
Texas Administrative Code (TAC). The TAC is the official compilation of all final
state agency rules published in the Texas Register.

14
State Loan Programs are programs that many states use to provide funds
to school districts. These loans often have lower interest rates and are backed by
the state.
State and Local Authorities allow the use of private capital to construct
and lease or lease-purchase school buildings.
Student Achievement is measured based on standardized scores on
various achievement tests.
System refers to the components of education, both physical and
psychological, that come together during the educational process.
Texas Administrative Code (TAC) is rules adopted by the State Board of
Education or Commission of Education under authority granted by state law.
Texas Assessment of Academic Skills is a statewide assessment program
consisting of standardized subtests in verbal, math and writing skills.
Texas Education Agency (TEA) was established by the Texas Legislature
as the accrediting body of the Texas public schools.
Texas Education Code (TEC) was established by the Texas Legislature.
It is the actual articulation of the statutes governing public education in Texas.
Tier II refers to the Texas Legislature’s attempt to equalize school funds
for Texas school districts.

15
Limitations and Delimitations
The complexity of learning and the system of education limit this study.
Although this research can identify the possible effect facilities have on student
achievement, it cannot conclude that school facility conditions alone result in, lead
to, or cause student achievement. Further, while the information gleaned from this
investigation is noteworthy and informative, generalizations should be avoided.
The delimitations of this study are a result of the relatively narrow scope of
this research. It is caused by the use of one school district being purposely chosen
due to its high poverty, based on a ratio of students qualifying for the free lunch,
and its ability to improve student achievement from low performing to recognized
based on its students’ TAAS test results.
The value of this research is that while it cannot establish causal
relationships with any degree of certainty between school facilities, access and use
of funds, and student achievement, it can provide taxpayers, educators and
lawmakers important information regarding a possible barrier to equal access and
adequacy.
Summary
Successful efforts to improve student achievement are targeted, complex
and systemic. While improved curriculum, innovative teacher training, better

16
methods of delivery, and effective administrative leadership cannot be
underestimated, the condition of the buildings that house America’s school
systems call for investigation. Adding to the complexity of the problem is the lack
of study in this area and the difficulty in establishing reliable and valid methods of
investigation.
In Chapter I, the purpose, need and significance of the study are
introduced. The purpose of this study was to investigate the effect school facility
conditions have on student achievement. Educators and lawmakers must continue
to seek ways for all students to access a quality education. It is significant due to
the high cost of maintenance and construction and the need for local districts to
prioritize their spending.
In Chapter II, a review of the literature presents the historical background
of school facilities and the related research that helps to frame the problem of
student achievement. Research on the historic perspective of school facilities, the
physiological effects of facilities, the psychological effects of facilities, the
educational effects of facilities, access obstacles, and litigation regarding access,
equity and school facilities. In addition, the literature review will examine studies
on Texas policies regarding school facilities as well as forecast needs for further
study.
In Chapter III, the methodology of the study will be described, and in
Chapters IV and V, the findings will be analyzed. Chapter IV will include a

17
description of the risky decisions, powerful people, accountability and the belief
by leaders in the Ysleta ISD that school facility conditions make a difference, as
well as the data resulting from a survey sent to the participating school’s
principals. In Chapter V, an analysis of the findings will accompany a discussion
of the conclusions, implications, and recommendations for further study.

18
CHAPTER II
REVIEW OF RELATED LITERATURE
Fifteen years ago the Carnegie Foundation called for the same level of
commitment as described in the Higher Education Act of the 1960’s to be directed
toward overhauling the nation’s public school facilities (Carnegie Foundation for
Advancement of Teaching, 1988). The Higher Education Act provided colleges
and universities with funds for facilities in order to prepare for the huge influx of
students following World War II. Today billions of dollars are needed to refurbish
public school facilities, fund new construction, accommodate changing programs
and philosophies, and bring public schools into compliance with current safety
regulations.
In Chapter II, relevant literature linking school facility conditions and
student achievement will be reviewed. Specific studies, advocacy papers,
speeches, and reports will be examined to determine the extent to which facilities
could be a factor in a student’s academic success. Further, an examination
concerning the extent to which obstacles prevent high-performing, high-poverty
districts’ access to state aid and money provided through bonds for facility
improvements will be reviewed. The chapter will conclude with information
specific to Texas school facilities and literature pointing to the need for continued

19
attention regarding Texas property poor districts and their students’ rights to an
equitable, adequate and accessible public school system.
Historical Perspective of School Facilities
Americans have always believed that regardless of the odds or the venture;
they will not only dominate but will also lead the world. Unfortunately, the
tendency by Americans to expect 21st century academic excellence using 50-year-
old equipment and facilities has backfired with regards to student achievement.
When it comes to educating their youth, Americans continue to find themselves
woefully behind other industrialized nations (National Center for Education
Statistics, 1999). This has not always been the case. The United States has a
history of leading the world in public education.
In 1647, Massachusetts passed the first law charging its citizens with the
responsibility of establishing public schools for all elementary children. Every
town with more than 50 families was required to form a school. Cities with at
least 100 families were required to establish secondary schools, referred to as
Latin, program. While colonial school buildings were simple log or wood frame
structures with a one-room design, this was not out of line with other structures of
the time. Most churches, businesses and homes consisted of one room, and these
one-room schoolhouses were often the focal point for the community. In 1847, the

20
Quincy Grammar School lead the nation to a new era by dividing the school by
age groups and teaching each group separately. Again in 1848, the Quincy School
set the standard for the American approach to educating children when it moved to
a new building complete with twelve rooms to provide instruction of the different
age groups. Across the nation, schools rushed to upgrade their facilities in order to
accommodate the belief that students needed to be grouped by age. As a result
after 1900, most schools were built of brick, grouped students by age level, and
often served as centers of their communities.
Schools continued to expand and soon housed gymnasiums and community
areas. Following World War II, the baby boom caused communities to establish
massive building plans. During the early 1950’s, schools sprang up across the
country to house this huge group of baby boomers. By the 1960’s, the United
States had successfully placed a man on the moon and American student
achievement led all industrialized nations (Lackney, 1999). Forty years later over
half of American’s school-age children attended class in schools built during the
1950’s. Curiously, when compared to other industrialized nations, the United
States’ student achievement was significantly behind Singapore, Korea, Japan,
Hong Kong, the Netherlands, Czech Republic, Austria, and Australia, holding its
own only against Ireland, Hungary, Canada, Israel, and England (National Center
for Education Statistics, 1998). Certainly many factors contributed to this fall, but

21
the impact the condition of the facilities have on American children while they are
being educated should not be ignored.
Physiological Effects of Facilities
Between grades one and 12, one out of every three children attends a
school that is in disrepair (Lackney, 1999). As a result, many American students
and teachers find themselves in physical environments that may adversely affect
them physically and psychologically. Unfortunately, school districts often elect to
postpone repairs and delay construction of new facilities to save money during
periods of financial shortage. A national survey conducted by the American
Association of School Administrators found that 74 percent of school facilities
should be replaced or repaired immediately; another 12 percent were identified as
inadequate places of learning (Hanson, 1992). Due to fiscal restrains and
obligations to mandated state and federal programs, making cuts in facility
maintenance is often considered less devastating than slashing academic programs.
The fallout of such decisions, however, is that the conditions of school facilities in
the U.S. are rapidly failing.
People are influenced and affected by their environment (Hanson, 1992).
Deferred maintenance can create an environment of peeling paint, crumbling
plaster, nonfunctioning toilets, poor lighting, inadequate ventilation, and
inoperative heating and cooling systems. Research indicates that the quality of air

22
inside public school facilities may significantly affect students’ ability to
concentrate (Lemasters, 1997). The Carnegie Foundation for the Advancement of
Teaching found that in schools that are underfunded, morale is low, facilities are
decaying, and the dropout rate remains high year after year (Carnegie Foundation
for the Advancement of Teaching, 1988).
Several studies have been conducted tying conditions of school facilities to
student achievement. In 1979, Carol Weinstein investigated the “relationship of
facilities and student achievement.” She conducted a meta-analysis of 141
published studies plus 21 additional references and reported her findings in the
Review of Educational Research (p. 577). Three years later, Carrol McGuffey
(1982) compiled a review of the research. These two reviews cited a total of 238
research studies and 21 paper presentations. McGuffey found that old and
obsolete buildings do have a negative effect upon the learning process of students
and that safe, modern, and controlled environment facilities enhance the learning
process. He also stated that school facilities might have a differential impact upon
the performance of students in different ages and subjects. Eight of the nine
studies McGuffey reviewed found a significant relationship between a controlled
environment and student achievement. Good lighting quality was found to relate
positively to increases in student achievement and performance. Unfortunately the
review was hampered by the quality of the individual studies and McGuffey
warned that his research had limitations because it was a “…mixed bag of study

23
types and methodologies presenting diverse problems of sampling, measurement,
and statistical analysis” (p. 272). While McGuffey acknowledged that the
explainable variance in learning that can be attributed to the school building is
small, she went on to say that influences on student achievement caused by
building conditions may be large when considered in relation with all the variables
over which the school system has control.
While attending Indiana State University, Kozol (1991) conducted a study
that examined the effect of the physical features of an elementary classroom on the
learning environment. Three hundred principals were randomly selected from all
K-6 schools in Indiana to complete a survey that examined classroom equipment
and features, floor coverings, wall surfaces, lighting, paint color, windows,
restrooms, storage space, and technology. He found a statistical significance with
every component identified. He recommended the areas found significant to be
included in renovation and construction in Indiana schools. He also recommended
further study using a survey of teachers to compare to the principals’ results.
Kozol’s study was followed by Berner’s (1993) Georgetown University
master’s thesis study relating school facility conditions, parent involvement and
student achievement. This study investigated school facility conditions for 41 of
the 52 Washington, DC schools. She used a multiple regression technique with
two models to analyze the data. In addition, the Committee on Public Education
measurement instrument was used to determine the condition of the buildings.

24
The first regression recorded the school building condition as the dependent
variable. The independent variables included building age, grade designation of
building (elementary, middle, high school, etc), mean neighborhood income, PTA
membership per student, PTA income per student, ethnic breakdown and total
enrollment. School age was found to a significant predictor (p<.10) of building
condition. She found that as the population of the school grew, the building
condition improved. School enrollment was a significant predictor of school
condition (p<.05). She also found that as the PTA budget grew, the condition of
the school improved (p<.10). For the second regression, Berner (1993) used all 52
schools within the District of Columbia Public School System. Building condition
was once again used as the dependent variable. The results were very near the first
regression as building type (p<.01), building age (p<.10), and school enrollment
(p<.05) were found to be significant. One additional variable was found to be
significant. As the mean neighborhood income increased, so did the condition of
the school (p<.10). (Berner, 1993)
In Berner’s (1993) second model, student achievement as measured by the
Comprehensive Test of Basic Skills (CTBS) and student achievement was used as
the dependent variable. School type, school age, mean neighborhood income,
PTA membership per student, PTA income per student, building condition,
ethnicity of the building and total school enrollment were used as the independent
variables. School enrollment was at p<.05 percent, Caucasians was at p<.05,

25
building condition was at p<.05 and mean neighborhood income was at p<.05.
These results were found to be significant. There were several problems with the
study. Berner (1993) noted the small sample size as being a limitation of the
study. Further, information concerning the PTA was noted in her conclusions to
be suspect. She also used .10 as her predetermined alpha. Since this is not
consistent with other studies it made the interpretation difficult. Nonetheless,
Berner’s findings relating academic performance to building conditions are widely
quoted (Berner, 1993).
Lemaster’s 1997 meta-analysis also reviewed the relationship between
student achievement and school facilities. Her investigation found that students
had higher achievement scores in newer facilities. In addition, there were fewer
discipline problems, and attendance records were better in new facilities. Further,
the social climate perceived by students was considerably more favorable in new
schools. Lemasters also found that as the condition of the facility improved,
achievement improved. Her study indicates that higher student achievement was
associated with schools with better science laboratories and that the attitude toward
the science classroom predicted science achievement. In fact, there was higher
achievement in air-conditioned schools and schools with pastel painted walls; a
cause-effect relationship between the variables of color and light was that shades
of blue significantly reduced blood pressure. Finally, Lemasters found that there
was higher student achievement with less external noise.

26
Psychological Effects of Facilities
Schools play a symbolic role in their communities, and their appearance
carries a strong message about community values and the importance of education.
They provide a setting where students, teachers, parents, and the community at
large interact (Uline, 1997). Unfortunately, a building that lacks heat, is unsafe, is
inadequately equipped, and is poorly maintained sends a negative message to
students and faculty (Lackney, 1999). School facilities are loaded with symbolic
overtones (Oritz, 1994).
Edwards (1992) investigated the relationship between parental
involvement, school building condition, and student achievement in Washington,
D.C. schools. She hypothesized that the condition of the school was directly
affected by parent involvement and that the condition of the school affected
student achievement. She found that in those schools where large numbers of
parents were involved through membership in the PTA, the buildings were in
better condition than where parents had limited or no involvement. She further
determined that building condition did have an effect upon student achievement.
Her study revealed that achievement scores could increase 5.455 percentage points
because of the physical condition of the school. In her study, when the school’s
physical environment moved two categories, such as from poor to excellent, the
achievement scores increased 10.9 percentage points. Conversely, based upon
analysis, “the signs of the estimated building condition coefficients are negative,

27
meaning that from our base of excellent schools, a building condition of fair or
poor will reduce the average student achievement score” (Edwards, 1992, p. 24).
Overbaugh (1990) studied the relationship between facilities and the
professional performance of teachers. The study included elementary and
secondary State Teachers of the Year. Of the fifty-three teachers asked to
participate, forty-three completed the questionnaire. Twenty-two were secondary
and sixteen were elementary, and their years of experience were from 5-41 years.
The number of years they had been at their current building was from 1-11 years.
The questionnaire asked twenty questions concerning aspects of their school’s
physical environment. Twenty-seven of the respondents taught in self-contained
classrooms. Respondents found thirteen of the twenty environmental factors
satisfactory or better, and seven factors were listed by the participants as
unsatisfactory (Overbaugh, 1990).
Overbaugh also examined the information by gender, teacher grade level,
and experience. He found gender and teaching level produced the most significant
variance by using chi-square to test the results. Several conclusions were
determined from the study. In individual classrooms, size, acoustics, and thermal
conditions were identified as negative features. The items that most influenced a
teacher’s professional behavior were classroom furnishings, equipment, and
classroom appearance. Further, teachers identified space utilization, classroom
size, thermal conditions, and acoustics as being very important. Elementary

28
teachers also stressed that storage and conference areas were very important.
Secondary teachers ranked a faculty lounge, separate dining areas, and access to a
private phone as being the most important physical features (Overbaugh, 1990).
Educational Effects of Facilities
One of the first studies to investigate student achievement and building
condition was a study by T.C. Chan in 1980. Chan’s study included schools with
eighth graders during the 1975-76 school year. He divided the schools up into
three categories based on age and type of problems. There were older buildings
that had not been renovated, buildings with partial renovation, and new buildings.
School principals were surveyed and provided Chan with data concerning the
building and Iowa Test of Basic Skills achievement scores for the year 1975-76.
Chan used building age and socioeconomic status as the independent variables and
mean test scores in vocabulary, reading, language, work-study, mathematics, and
the school composite number for the dependent variables. Both multiple
regression and analysis of covariance were used to examine the relationships.
When controlling for socioeconomic status, building age was significant for
vocabulary, mathematics, and the composite test results (Chan, 1980). Building
age was found to account for 1.92 percent of the variance in the vocabulary score,
1.13 for mathematics and .98 percent for the composite score. Chan concluded
that building age played a significant role in the achievement of the eighth graders

29
in the study. While the percentages of variance are relatively small, they do
indicate influences on student achievement.
Bowers and Burkett (1987) from East Tennessee State University studied
the relationship between school facility characteristics and student achievement in
two rural Tennessee schools in 1983-84. They studied the division’s oldest and
newest schools. The older school was built in 1939 and contained an addition from
1950, and the new building was built in 1983. The new building housed 758
students and had a capacity of 825. The new building was well-equipped and
contained state of the art equipment and systems that included air conditioning,
central heating, fluorescent lighting, acoustical controls, and appropriate furniture.
The older school had a capacity for 650. It was heated by a coal-fired furnace and
had no central air conditioning unit. Much of the furniture was outdated, and
aesthetically, the building had several outdated colors. The study used fourth and
sixth graders from the 1986-1987 school year who were randomly selected from
the two buildings (Bowers & Burkett, 1988). There were 127 students from the
older building and 132 from the new building. The authors of the study
determined that there was no need to control for socioeconomic status due to their
similarity (Bowers & Burkett, 1987).
They analyzed the data using an analysis of variance, t-tests, and chi-
square. They listed their null hypothesis, as a school’s physical environment does
not produce statistically significant achievement results. The null hypothesis was

30
rejected since the study did indicate a statistically significant difference in
achievement scores. Students at the new school scored higher, had fewer health
problems, and missed fewer days of school. The researchers concluded that the
students attending school in the newer school building had significantly better
educational achievement than those attending the older building, and they
encouraged decision makers to consider the benefits of modern facilities (Bowers
& Burkett, 1987).
In 1993 Cash investigated the relationship between the condition of the
school building and student achievement and student behavior in all 47 small rural
high schools in Virginia. She used the Commonwealth Assessment of Physical
Environment to control for building condition. Student achievement scores were
adjusted for socioeconomic status. Conditions of the school facilities were divided
by structure and cosmetic condition. Cash found that student achievement
improvements were directly related to the facility’s cosmetic factors. Specifically,
Cash found that pastel walls positively influenced student achievement as
compared to white walls (Cash, 1993).
Hines conducted an investigation in 1996 similar to Cash’s 1993 study and
Earthman, Cash, and Van Berkum’s 1995 study. He used large urban high schools
located in the Commonwealth of Virginia, rather than Cash’s small rural high
schools throughout Virginia. Hines predicted there would be a relationship
between the condition of school buildings and student achievement and behavior.

31
He determined the condition of the building using the Commonwealth Assessment
of Physical Environment instrument. Personnel from each school completed the
instrument and rated their campus as substandard, standard, or above standard.
Student achievement levels were determined by the eleventh grade Test of
Academic Proficiency. Scores were adjusted for socioeconomic status by using
the free and reduced-priced lunch eligibility. Like Cash, Hines found that school
facility conditions influence student achievement.
In 1999, James Lanham studied Virginia’s public elementary schools.
Prior to his study high schools in both rural and urban Virginia were studied
(Cash, 1993; Hines, 1996). During the 1997-1998 school year, all Virginia’s
elementary schools were assessed using a state standardized test, Standards of
Learning Assessments. The Virginia Board of Education had placed benchmarks
for student performance and for the first time tied student performance to school
accreditation (Virginia State Board of Education, 1997). Lanham chose 300
elementary schools out of the 989 schools in the state that contained both 3rd and
5th grades using data from the Department of Education database. One of the
school’s chosen lacked 5th grade and the sample set was reduced to 299. After
sending each school principal a survey, he received 190 of the surveys back.
Although Lanham did not look at them separately, twenty percent of those
responding to the survey indicated their school had undergone significant
renovations within the last five years (Lanham, 1999).

32
Lanham’s survey was based on the Commonwealth Assessment of
Physical Environment (CAPE) and contained thirty-two questions rating specific
features of school buildings and classrooms. The CAPE survey was used by Cash
(1993), Hines (1996), and Earthman, Cash and Van Berkum (1995) for their
investigations of building conditions and student achievement. Lanham eliminated
questions specific to high schools and added questions concerning building age,
acreage of school campus, percentage of student approved for free or reduced
lunch, technology readiness, and specific free response questions.
The survey was designed to obtain either a specific numerical answer from
the respondent or a numerical answer chosen from a list of choices. In all cases the
responses were written in ascending order so that the most positive response was
offered first and received a code of “5,” the next most positive response was
offered second and received a code of “4,” until there was a choice for no response
and it was coded “0.” For questions requiring a yes or not, yes was coded as a “2”
and no coded as a “1”. The numerical responses were analyzed using the
Statistical Package for the Social Sciences (SPSS).
The Standards of Learning Assessment was used to measure student
achievement. This assessment was administered to all third and fifth graders in the
spring of 1998. The Virginia Department of Education’s Division of Assessment
and Testing provides assessment scores. The test includes sub-tests in English,
mathematics, science and social studies. Fifth graders take additional sub-tests in

33
English writing, history, computers and technology. The percentage of students
passing with a score of 70percent or above was used for Lanham’s analysis.
Lanham noted that reliance on the Standard of Learning Assessment limited the
comparability of his results to student achievement in other states.
A Pearson’s product moment correlation matrix and a step-wise multiple
regression analysis was performed on the data. Multiple Regression was used to
provide the researcher with the relationship between the identified dependent
variables and the independent variables. Multiple regression analysis was
conducted for each of the predictor variables. A pre-determined alpha of .05 was
used for significance.
Lanham ran five regressions. A step-wise multiple regression analysis was
conducted using third-grade English Assessment Scores as the criterion variable.
Five predictor variables were found to be significant in explaining the differences
in third-grade English test results. Economically disadvantaged students identified
by their inclusion in the free or reduced lunch program accounted for the largest
portion of the variance (48.6percent). Other significant predictors were ceiling
type (3.0percent), air conditioning (1.6percent), campus size (1.6percent) and
frequency of sweeping (1.7percent). A second step-wise multiple regression was
conducted using fifth grade results on the English Assessment as the criterion
variable. Two variables were found to be significant. They were economically
disadvantaged students (52.2percent) and computer network connection

34
(2.1percent). A third step-wise multiple regression was conducted using third
grade results on the Math Assessment as a criterion variable. Three variables were
found to be significant in explaining the differences. They were economically
disadvantaged students (25.9percent), room structure (3.8percent), and floor
mopping (2.5percent). A forth step-wise multiple regression was conducted using
fifth grade results on the Math Assessment as a criterion variable. Two variables
emerged as significant. They were economically disadvantaged students
(15.8percent) and air conditioning (2.8percent). Finally, a fifth step-wise multiple
regression was conducted using fifth grade results on the Technology Assessment
as the criterion variable. Five variables emerged as significant. They were
economically disadvantaged students (41.9percent), air conditioning (4.8percent),
ceiling type (3.6), overall building maintenance (2.9), and floor type (1.5percent).
No other variables entered the equations.
Economically disadvantaged students emerged as the first significant
variable in each equation. Further, air conditioning emerged in three of the five
regression analyses. Interestingly, the finding relating to air conditioning parallel
the results found by Cash (1993), Hines (1996), and Earthman, Cash and Van
Berkum (1996). Lanham concluded that certain building and cosmetic
characteristics when combined with socio-economic information, can explain the
variance in student achievement on the Standards of Learning Assessment in
English, mathematics and technology. He suggested that improving particular

35
building conditions such as air conditioning could improve student achievement.
Building cleanliness emerged in three of the five regressions as significant in
Lanham, as well as Hines’ (1996) studies. Lanham further recommended that
improving building cleanliness would have a positive impact on student
achievement. Finally, Lanham pointed out that older buildings often lack the
flexibility needed for today’s innovative technology requirements and their
physical structure often limit the building’s adaptability for technology updates.
He further concluded that continued use of older buildings could psychologically
send the wrong message to teachers, parents and students concerning their
importance to the district.
Access Obstacles to State Aid and to Adequate Funds for Maintenance,
Renovation, and Construction of Facilities
Although links between specific financial expenditures and educational
outputs have been extensively reviewed, “little research has been done on the
inability to repair and refurbish school buildings due to lack of funds” (Berner,
1993). There were a few studies that investigated money and student achievement.
Hanushek (1981) found no significant difference when using a production function
equation designed to measure inputs and outputs and their relationship to student
achievement. Likewise Summers and Wolfe (1975) investigated family income
and race as factors in student achievement and found no significant impact.

36
Greenwald, Hedges, and Laine (1994) reviewed Hanushek’s study by using vote-
counting and regression studies to determine if any correlations existed. In their
reanalysis Greenwald, Hedges, and Laine used combined significance tests to
group data from small studies. They looked at teacher education, teacher salary,
and teacher pupil ratio and found a positive significance at p = .05. These results
challenge the notion that money does not matter (Greenwald, Hedges, and Laine,
1994). However the difficulty in defining and isolating expenditure variables and
linking them to student achievement remains difficult and is a weakness of these
studies.
State and federal mandates for educational programs and environmental
safety are seldom accompanied by the funds needed to implement them (Ferguson,
1991). These mandates place a financial burden on local districts, and in most
cases, districts are forced to rely on their taxpayers’ ability or willingness to help
relieve this burden. Although this results in glaring inequities in school
environments among districts in the same state, causal relationships have been
difficult to pinpoint (Lewis, 1989). This lack of causal relationships between
instruction and results makes it difficult to discern a standard measure for student
achievement and building condition (Kazal-Thresher, 1993). It is also extremely
difficult to establish a standard for spending among geographic regions, since most
studies are conducted in single school divisions and are regional in nature
(Wenglinsky, 1997).

37
States regularly grapple with budget shortfalls and nationally costs related
to deferring maintenance quadrupled between 1983 and 1991, from $25 billion in
1983 to $100 billion in 1991 (Hanson, 1992). Consequences of electing to defer
maintenance include premature building deterioration, indoor air problems,
increased repair and replacement costs, and reduced operating efficiency of
equipment. Unfortunately, when energy costs exceed budgeted amounts, 40
percent of districts across the country report using funds earmarked for
maintenance to meet energy-related expenses (Hanson, 1992).
Some of the most noteworthy research that contributed to the litigation
concerning equity issues was conducted in Washington D.C., North Dakota, and
Virginia. In 1991 Edwards conducted a study in Washington, D.C. using 191
facilities that housed approximately 83,000 young people. She believed that
poorly maintained buildings sent negative messages to students and that these
negative messages contributed to poor performance by students. A regression
formula was used to investigate the impact of parent involvement on building
conditions. Building condition was used as a dependent variable, the type of
school, parent involvement, building age, income, race and enrollment was used as
the independent variables. Edwards ran several regressions. The students’
achievement was recorded using the Comprehensive Test of Basic Skills.
Edwards assembled a group of volunteer maintenance workers, engineers, and
architects. These professionals visited each school and reported on the buildings’

38
condition. They estimated the cost of repairing the building and rated the
building’s condition as poor, fair, or excellent. Age was found to be a strong
predictor of the condition of the school. The findings supported that good
infrastructure and well-maintained buildings are the foundation of quality
education. “As a school moved from one category to the next with the evaluation
of the building’s condition, average achievement scores could be expected to
increase by 5.455 points” (Edwards, 1991).
Cash investigated the relationship between certain school building
conditions, student achievement, and student behavior in rural high schools in
Virginia in 1993. A data-gathering instrument used by local personnel determined
the condition. It addressed certain building conditions. Results indicated a
positive correlation between building condition and achievement of students. In
all the sub-tests of the Test of Academic Proficiency (TAP), academic
performance was positively related to the condition of the school building. Cash
found student achievement was higher in those schools with higher quality ratings.
The difference in percentile ranking was as much as five percent.
A similar study was conducted by Earthman, Cash and Van Berkum
(1995), using the same methodology as the Cash study. The self-evaluation
methodology was utilized to obtain rankings of substandard, standard, and above
standard buildings. The study was conducted in North Dakota and included all
199 high school buildings in the state. Student scores on the Comprehensive Test

39
of Basic Skills (CTBS) administered to all 11th graders throughout the state was
used for student achievement. In all sub-tests of the CTBS except two, the
students in above-standard buildings outscored students in substandard buildings.
For those buildings scoring at the above-standard level on the State Assessment of
Facilities in Education (SAFE), there was a significant difference in all sub-tests
except Language Mechanics. The difference ranged from 4 to 11 points.
Although the percentile differences were not as great as those found in the Cash
study, this study does support the findings of both Edwards and Cash.
Hines used the same methodology as Cash but substituted large urban high
schools in Virginia for the large rural school districts as the population variable
(Hines, 1996). School administrators completed the Commonwealth Assessment
of Physical Environment (CAPE) to determine the condition of the school. The
instrument allowed them to rank the school buildings as substandard, standard, and
above standard. Further, building conditions were divided into cosmetic and
structural. The results of his study were the same. In fact, some of the differences
were as high as 11 percentile points. All four studies used building condition as a
factor to classify the school buildings for analysis. The factor of building
condition was determined by the responses to questions relating to certain
attributes or conditions in the building. Each question concerned building
attributes and conditions that were individually identified in previous research
studies to be directly related to student achievement. Like previous studies,

40
building condition was found to influence student achievement. Washington D.C.,
North Dakota, and Virginia have used these studies to help redefine state spending.
With the cost of construction skyrocketing, efforts to justify these costs
academically become increasingly more important. More than $15 billion was
spent on school remodeling and new construction in 1998 (Glass, 1999).
Nationally a building costs an average of $100 per square foot, but there are many
hidden costs (Rivera-Batiz & Marti, 1995). Inefficiency of school design is one of
the important and expensive hidden costs. Most districts lack the qualified
personnel needed to challenge inadequate building design and as a result hidden
costs and change orders account for an average of approximately 25percent of the
project contract (Abramson, 1998). Further, building designs that incorporate ease
in retrofitting future school needs are seldom available. The average new
elementary school eight years ago costs about $6 million, and the average
secondary school about $15 million to construct (GOA, 1995). Unfortunately,
high poverty school districts encounter difficulty supporting even routine budgeted
expenditures due to their low tax base. Historically these districts’ own buildings
with the most severe maintenance needs. Because of deferred maintenance these
40-plus-year-old buildings are in extreme need of repair and renovation. This
problem is exasperated by these districts’ inability to secure much needed
construction bonds (Wenglinsky, 1997). If there is a link between student
achievement and the environment that school facilities provide, access to facility

41
improvement funds could provide the key that unlocks low performance by
American students across the country.
Litigation Regarding Access, Equity and School Facilities
Despite an almost 50-year history, the impact of litigation regarding access
and equity in education is still unclear. There are no universal guidelines for
school finance. There is no checklist available concerning an allocation system
that will result in quality schools. There is neither a magic potion nor an exact
model of teaching that results in high achievement. There is no description of the
family structure, socioeconomic status, or level of involvement that consistently
results in a successful student. There is no managerial model that, if followed,
guarantees students will achieve. Unfortunately, educators, legislators, and the
judicial system continue to grapple with the moral dilemma of access and equity;
they find it difficult to place quantitative descriptions on this issue of quality.
Understandably, the inherent pitfalls of defining and describing quality have led
legislators and the court system to move toward the few tangible areas in education
that exist. As a result, litigation over schools and, specifically, school finance has
been modified to include the question of facility equity. The availability of funds
for adequate and equitable school facilities continues to be included in the
language of litigation pointing to state funding.

42
This quest to secure an American right to equal opportunity began with
Brown v. Board of Education of Topeka (1954, 347 U.S. 483). Texas joined the
fight in 1973 with Rodriquez v. San Antonio Independent School District (411
U.S. 547) when the Supreme Court ruled that education was not a federal
responsibility and left this fundamental right to the states. Prior to 1973, most
states had altered their method of funding due to Serrano v. Pries (1971, 364 U.S.
479) to include their general fund expenditures in their equalization formulas. The
Rodriquez case is important to Texas because it challenged the state’s school
funding policy. The Shofstall v. Hollins (1973, 427 U.S. 160) decision required
Arizona to include capital outlay expenditure and the ability to raise funds through
bond elections in their equity formulas. In the New Jersey Robinson v. Cahill
(1973, 443 U.S. 449) decision, New Jersey’s, and ultimately other states’,
obligation grew to include capital outlay expenditures. It further stated that without
equitable capital expenditures, required educational opportunity would not be
possible. The Board of Education of the City of Cincinnati v. Waiter (1977, 102
S. Ct. 3211) found that “qualifications for a thorough and efficient system of
schools are not met if any school is starved for funds, teachers, buildings, or
equipment.” Diaz v. Colorado State Board of Education (1977, 102 U.S. 563)
found that “some districts were better able than others to provide adequate
facilities.” This was followed by Luian v. Colorado State Board of Education
(1982, 391 U.S. 563), in which the Supreme Court noted that the “ability of school

43
districts to raise revenue for bond reduction and capital reserve was a function of
property wealth.”
A key decision concerning school facilities occurred in 1979. The question
of equal opportunity as defined by adequate school buildings came before the
West Virginia court in Pauley v. Kelley (1979, 424 U.S. 693). Further articulation
of the state’s responsibility regarding facilities was included in Pauley v. Bailey
(1982, 424 U.S.693) and Pauley v. Gainer (1986, 424 U.S. 693). In 1986, the
West Virginia State Supreme Court ruled that education is a constitutional right
and districts must provide equal access to all students. The Virginia court defined
equal access and included school facilities. They further defined adequate facility
space to include elementary, middle, and high school programs. Although Pauley
was eventually modified, it set the stage for future cases to include facilities in
equal access litigation, and it remains the standard against which potential capital
outlay litigation is measured. New Jersey followed West Virginia with Robinson
v. Cahill (1973, 443 U.S. 449) and Abbot v. Burke (1988, 395 F. Supp. 294). The
courts ruled that the state system of school finance could be found to violate the
state constitution. They ruled that socioeconomic status and geographic location
could not be a barrier to equal access when determining equal educational
opportunity. Texas was ordered to correct similar access issues in schools
following Edgewood Independent School District v. Kirby (1987, 777 S. W 2nd
391). The court enjoined Texas state aid distributions but stayed the order to allow

44
the legislature time to remedy the finance system. The 1987 Edgewood decision
was reversed by the Kirkwood case in 1988 but concern over local wealth
continues in Texas as well as access issues due to property poor district’s inability
to access facility funds.
State budget cuts require local districts in Texas to make budget-cutting
decisions. Keeping in mind that many Federal and state mandated programs often
come without funding and ongoing expenditures for payroll, employee benefits,
program costs, state testing, transportation and utilities are immediate and must be
met, districts are forced to search their Operational Budgets line-item by line-item
for available funds. Facility maintenance repair and renovation budget line items
continue to be among the few places available to local districts. While districts
know that depleting the money earmarked for facilities to patch budget shortfalls
exasperates ongoing and future facility problems, they are often left with no other
choice. While property wealthy districts are struggle, property poor districts are
profoundly impacted by state budget cuts.
The Texas state constitution promises an equitable educational system. If
the condition of Texas school facilities impact student achievement, do the current
formulas, statutes, availability and rules for state school funding, when
implemented, result in a known continuation of disparity in the ability of local
districts to provide an equitable education to the children of Texas (Edgewood,
1987)? Further defining litigation is inevitable.

45
Texas’ Policies Regarding School Facilities
Students, parents, and educators “have a right to expect the state to support
education to such an extent that variations in local wealth will not have an adverse
effect on local ability to provide an adequate educational system” (Thompson,
1988, p. 27). There are several funding procedures used across the country.
State Loans – This method provides funds to districts using the most
favorable interest rates available due to a very strong rating for investors. The
district repays the loan directly to the state. The advantage of this method is that
districts do not have to seek the funds. Money becomes available to districts and
favorable treatment reduces repayment costs. In some circumstances, the state has
the ability to forgive the loan for districts unable to pay the loan back. The
disadvantage is that districts in need of assistance are the districts that cannot
afford the added expense of borrowing money (Texas Law Bulletin, 1994).
State or Local Building Authorities – This method is used in states that
have laws that allow for private capital use to construct, lease, or lease-purchase
school buildings. The advantage is that a local district is able to access funds for
local construction. In addition, the district is able to access resources separate
from the school tax base. The disadvantage is that voter opinion can be ignored
because a bond election is unnecessary. Another disadvantage is that it
intermingles tax dollars with for-profit money (Texas Law Bulletin, 1994).

46
Full State Funding – Because full state funding translates to the support of
the entire state, the advantage of this method is that it provides the broadest
possible tax base and provides access to multiple resources from the state to local
school districts. The disadvantage is that local school districts lose control over
local education due to the state’s sole or a major role as the funding source (Texas
Law Bulletin, 1994).
Flat Grants – This method provides a set amount of money to the district.
The money is distributed to districts in equal amounts. The advantage is that
districts receive some funds. The disadvantage is that there is no relationship
between the districts’ ability to pay for their own needs and the aid received
(Texas Law Bulletin, 1994).
Equalization Grant – This method is similar to most equalization
formulas. It became popular following the Serrano case. Awards are made using
a variety of elaborate percentage matching agreements. In theory, the grant award
increases as the ability of the local district to pay decreases. This method ensures
poor districts receive more funds than wealthy districts. The major weakness of
this method is that the state may not have the financial ability to fund all the
identified needs of the districts (Texas Law Bulletin, 1994).
Percent-Matching Grant – This method provides local districts with
funds based on a cost-share basis. The level of support is determined by the state
legislature. The major advantage to this method is the incentive to local effort

47
because districts may increase their portion and in that way increase their matching
funds. The disadvantage is that the district must have money to receive money.
Property poor districts often lack the money (Texas Law Bulletin, 1994).
Texas has tried repeatedly to provide equitable state funding for local
districts. In 1997, House Bill 4 of the 75th Legislature created the Instructional
Facility Allotment (IFA) to equalize the burdens of debt service in financing
school construction and appropriated $200 million toward school construction.
The 76th Legislature appropriated an additional $150 million for new applications
in the 1999-2001 biennium. In order to receive funds, districts must make
application to the Texas Education Agency (TEA). This bond or lease purchase
agreement must be used for construction or renovation of a school facility used for
instruction. Unfortunately for property poor districts, “instructional facilities” are
narrowly defined. Further, the lack of state standards regarding school facilities
place the burden of proof on the district with the least amount of resources. The
Texas Education Code (TEC) states that the maximum amount a district may
receive is determined by their annual debt service or $250 times each student’s
average daily attendance (ADA). The maximum allowed for districts with fewer
than 400 students is $100,000 per year or their actual debt payment (Mac Inroe,
1994).
While the Instructional Facility Allotment (IFA) is designed to assist
districts in need, there are several additional barriers for property poor districts. A

48
district must make application for the funds after a successful bonds election or 60
days after they notify taxpayers concerning a lease-purchase agreement. If the
voters call for a referendum, it must take place before the application is submitted.
In addition, the district must make their application prior to pricing the bonds.
They must plan to pay their portion of the bond for at least eight years, and they
must levy sufficient taxes to cover the local share of the IFA. If it is a lease-
purchase agreement, the district must levy sufficient M&O taxes to generate
adequate Tier II funds to cover the local share. Since property poor districts have
a history of unsuccessful bond elections and their ability to levy the taxes is
questionable, access to facility funds continues to elude many Texas districts
(Lutz, Betz, Maddirala, 1996).
The Need for Further Study Linking Facilities and Achievement in
High-Performing, High-Poverty Districts
The Virginia and North Dakota studies of Cash, Hines, Lemasters,
Earthman, Van Berkum, and Lanham demonstrate a relationship between student
performance and the condition of schools. Additional research indicated a close
relationship between the built environment and how well students and teachers
perform in it. While extensive research exists connecting leadership, teacher
training and curriculum to successful Texas schools, a limited group of studies

49
exist linking student achievement and building conditions. This research was
limited by the complexity of the topic and the research design. Additional
research is needed that will investigate facilities and student achievement over
time. Further, research is needed to investigate high poverty Texas school districts
that have made a transition from low performing to recognized based on results
from the TAAS test.
Shortcomings of Previous Studies
Educational research is inherently difficult. Investigating possible links
between facilities and student achievement provides additional complexities.
Controls are difficult to acquire, and it is hard in an educational setting to assign
teachers and students randomly or to have the funding necessary to change
randomly the physical settings. There are additional problems in trying to match
teaching methods, student abilities, and physical learning climates while
conducting research.
Historically, much of educational research is conducted using surveys.
While survey research has a long historical tradition as a method of systematic
data collection, relationship generalizations are seldom advised. Fortunately, the
contribution of twentieth century sociologists Lazarsfeld, Hyman and Stouffer has
provided new ways of looking at data. Their development of a procedure to link

50
instruments of data collection to statistical procedures has made it possible for
educators to investigate educational phenomena using surveys.
Studies involving surveys account for a substantial proportion of the
research performed in the field of education. Survey research utilizes a variety of
instruments and methods to study relationships and comparisons. Although it is
assumed that the data collected by survey instruments is quantifiable, any study
based on cross-sectional survey data is subject to source error. Respondents may
not remember information related to a previous time accurately. Such errors are
likely to become larger as the researcher delves farther into the past. Further,
some questions might require information or a knowledge set unavailable to the
respondent. While answers are given with the best intentions, accuracy is difficult
to check. In addition, although factual information may be recalled accurately, the
respondent’s recollection of past attitudes or opinions may be distorted. In
summary, the value of survey research is that it can explore a variety of
relationships in a relatively economical way. Its drawback is that information
gleaned from surveys relies on the quality of the instrument and the respondents’
answers. As a result, it is ill advised to generalize from a survey research study.
The researcher of facilities and student achievement must make
conclusions that weigh the difficulties of control in educational research. Studies
by Cash, Hines and Lanham were based in part on survey results. In all cases
there was a positive difference for students in the better buildings. The range of

51
difference between the test scores of students in substandard and above-standard
school buildings in the Cash, Hines, Earthman, Van Berkum and Lanham studies
was 1 to 11 percentage points. These studies found that some of the most
important factors that influenced learning are those that relate to control of the
thermal environment, proper illumination, adequate space, availability of
equipment and furnishings, building condition and building age. Since the
majority of recent survey studies, like those from Washington D.C., Virginia and
North Dakota, investigate the relationship of student achievement and school
facility conditions are from other states, it is important to investigate similar
phenomena in Texas.
Theoretical Framework
The stakeholders for this research were the children of Texas. Since 1869,
when the Texas Constitution established a public education system, Texans have
been charged with educating their youth. Historically, the issues of inequity due to
a property-tax-based education system have plagued Texas. The Guaranteed Bond
Program was established in 1984, and following several noteworthy court battles,
the Instructional Facilities Allotment fund was established in 1997 (Sharp, 1998).
This allotment guaranteed state aid for debt service payments. Unfortunately,

52
access to this allotment by property poor districts and the limited nature of the
fund’s scope continue to be an issue.
The purpose of this study was to investigate the relationship between
student achievement and school facilities for a selected high achieving, high-
poverty district in Texas. A significant relationship was found in studies outside
Texas and it is assumed that a relationship will be found in Texas schools. If so,
access to funds that will enable poor districts to improve their facilities is essential.
Texas must accept the responsibility for the future of its youth and assure them
that Texas understands that “all the school reforms on earth are worthless if kids
have to come to school in buildings that destroy their spirits. The schoolroom is
secondary if schooling is used as an excuse for pushing the issue of crumbling
buildings far down in the education agenda” (Kozol, 1991).
Summary
Chapter II presented a review of the literature and research that added to
the discussion concerning school facilities and student achievement. This chapter
included a review of Chan’s 1980 study in which he investigated building and
student achievement. McGuffey’s 1982 investigation identified building age,
building maintenance, as well as school size as impacting student achievement.
Cash’s 1993 study developed a survey instrument and analyzed the results against
53
student achievement. Cash identified building age and classroom environment as
significant influences on the achievement of high school students living in rural
Virginia. Hines (1996) and Earthman, Cash and Van Berkum (1995) found
building age, noise, and cleanliness as significant contributors to the variance in
student achievement. Phillip’s (1997) study bolstered their findings by once again
noting school age as an important contributor to student achievement. Lanham
(1999) concluded that socio-economic status, building age, cleanliness and
building maintenance all influenced student achievement.
The following chapter will describe this study’s attempt to extend Cash,
Hines, Earthman and Lanham’s discussion and recommendations concerning the
condition of school facilities and student achievement. In Chapter III, the
methodology and structure of the study will be described. Chapter IV will present
the analysis of the findings, and Chapter V will present the results, make
conclusions and give recommendations for further study.

54
CHAPTER III
METHODOLOGY
Based on research conducted in Washington D.C., Virginia, North Dakota,
and other states, there is an expectation that a relationship between student
achievement and the condition of school facilities will be found in Texas. Many
studies have investigated school facilities; however, this study will focus on an
analysis of Ysleta Independent School District. It will investigate the way in
which this high-performing, high-poverty district views school facilities as a
strategic component to enhancing student achievement. It will investigate:
1. What factors directly affect the decision to include facilities as a
component of educational adequacy?
2. How does availability of funds impact priorities regarding maintenance,
renovation, and construction of facilities?
3. To what extent can student achievement on the TAAS test be explained
by socio-economic condition, school size, building age, cleanliness,
maintenance, and the condition of the school’s structure?
Population
Previous noteworthy studies linking the condition of schools and student
achievement have focused on rural Virginia high schools (Cash, 1993), urban

55
Virginia high schools (Hines, 1996), a synthesis of Virginia schools (Lemasters,
1997), and Virginia elementary schools (Lanham, 1999). The population for this
study is Ysleta Independent School District outside El Paso, Texas. Ysleta was
part of the original 1997-98 Dana Study in which high-poverty, high-performing
districts were investigated. This district targeted several areas they felt were
essential to their success in dramatically impacting student achievement; one of
which was the district’s facility improvement. While restricting the population to
one specifically defined school district limits this study, the data generated can be
used to extend the information on school facilities from other states and shine a
light on possible predictors in Texas.
Setting
The Texas Education Agency (TEA) oversees the operation of all county
and city school districts across the state. Therefore, TEA is responsible for
overseeing the education of students in Ysleta (Texas Education Agency, 2000).
All public schools in Texas are rated using objectives identified within the Texas
Assessment of Academic Skills tests. These objectives are made known through
the Texas Board of Education and approved by the Texas Legislature. These
standards set clear objectives for the State Board of Education, the Texas
Legislature, Texas Education Agency, and local school boards (Texas Education

56
Agency, 2000). The Texas Education Agency has undertaken an extensive review
and revision of the standards for the state. Standards defined by the Texas
Education Agency provide a mechanism for measuring student performance and
tie student performance on these assessments to school accreditation (Texas State
Board of Education, 2000).
Research Design
A mixed method approach was chosen for this case study due to the small
sample set and the difficulty realized in studying a connection between the
condition of school buildings and student achievement. This study of the Ysleta
Independent School District used both qualitative and quantitative methods to
examine in-depth the phenomenal success enjoyed by the Ysleta ISD. This district
is not only property poor, but the majority of its families are economically
disadvantaged. During the 2000–2001 school year, the student population of
Ysleta was 46,394. Approximately 88percent, or 40,860, of Ysleta’s students are
Hispanic, and 34,038 students, or 73.4percent, of its student population is
classified as economically disadvantaged.
Across Texas the percent of Hispanics and economically disadvantaged
students passing the TAAS sub-tests remains in the seventies. Yet in Ysleta,
83.9percent of the Hispanic students passed all the tests taken and 83.3percent

57
economically disadvantaged students passed all the TAAS tests taken during 2001.
During the eight years covered by this study at the state level, there was a
34.4percent increase in the number of Hispanic students passing all tests taken
while Ysleta enjoyed an increase of 39.8percent. Likewise, during the same eight
years at the state level, there was a 34.6percent increase in the number of
economically disadvantaged students passing all tests taken and noteworthy
41.6percent increase in Ysleta. Obviously something positive is happening in
Ysleta.
Due to the variance caused by the research questions in this study, a
qualitative approach was used to research the factors that directly affected the
decision to include facilities as a component of educational adequacy. This
method enabled me to study selected issues in depth in order to “inductively and
holistically understand the human experience in context-specific ways” (Patton,
1990, p. 37). Further, it allowed me to study information not available through
reports and surveys. Decisions are often determined by intangible factors that are
justified through data. This is sometimes referred to as a “gut” feeling. Much of
the district’s decisions to include facility upgrades and renovations were based on
personal bias and learned experience. This mixed method design approach enabled
me to investigate relationships between the administrative staff and school board
and to extract possible clues as to why their learned experience set them on a

58
course that would dramatically change the look of their campuses and the level of
their students’ achievement.
Likewise, a mixed method approach was appropriate for the research
question concerning how the availability of funds impacted priorities regarding
maintenance, renovation and construction of facilities in Ysleta. A qualitative
component allowed me to capture the actual words and thoughts of the decision
makers. As Patton (1990) recommends, “direct quotations from people about their
experiences, opinions, feelings and knowledge” (p. 10) provided a glimpse into
what was special and unique in Ysleta that resulted in a profound difference in
TAAS scores. This descriptive detail allowed analysis of shared priorities, biases
and experience. Patterns were allowed to emerge “without presupposing in
advance what the important dimensions will be” (Patton, 1990, p. 11). It was the
ability to “capture” the participants’ point of view in their own words that helped
connect building condition to gain in student TAAS scores. Lincoln and Guba
(1985) describe this method as discovery-oriented. Discovering how a district
acquired shared vision regarding their priorities and decisions is important to this
study. This study is about how men and women, boys and girls came together as
one to attain one goal through a shared vision. That vision included a belief that
significantly high numbers of economically disadvantaged students can succeed as
measured by the TAAS test and that the conditions of the buildings they attend
contribute to that success. Their partnership as one group in a district with a

59
shared vision and goals enabled me to use a case study model to investigate their
success.
Case Study Research
By its nature, a case study allows for multiple approaches to a single
environment. My extensive teaching experience has provided me with examples
of exceptional student achievement in dilapidated buildings and minimal student
achievement in state-of-the-art new buildings. I believed a flaw in the previous
studies regarding school facilities was their inability to connect school facilities to
a change in student achievement. By narrowing the field of my study, it allowed
me to focus on one school district and investigate how this particular set of
individuals made their decisions to include facilities in their plan to raise TAAS
scores, how the availability of funds impacted their priorities, and, in turn, how
they explained their outcomes based on the TAAS test.
The qualitative component of my case study research enabled me to seek a
rich understanding of the phenomena enjoyed by the Ysleta ISD as an end in itself,
not as an attempt to predict a future outcome (Patton, 1990). It provided a way for
me to look inside the schools and gain a perspective of the individuals in the study.
This required me to go to Ysleta in order to observe and speak to the participants.
It is through their stories that themes as well as personal biases emerged. Yin

60
(1994) defines a case study as an “empirical inquiry that investigates a
contemporary phenomenon within its real-life context, especially when the
boundaries between phenomenon and context are not clearly evident” (1994). The
quantitative component allowed me to statistically investigate how much of the
variance in TAAS scores could be accounted for by predictor variables. This case
study investigates the hows and whys concerning the physical changes in Ysleta’s
facilities as it seeks new insights into student academic success.
The Role of the Researcher
The role of the researcher for this study was twofold. For the collection of
the qualitative data, I relied on good communication skills to gain a rapport and
trust with the participants so as to elicit rich, in-depth responses that were context-
specific and describe the participants’ motivations and ways of knowing. The
qualitative method used in this study consisted of three kinds of data collection
(Patton, 1990), including “in-depth interviews, examination of primary source
documents and direct observation” (p. 10). My role was to attempt to immerse the
reader within the setting and provide a “people-oriented inquiry” (Patton, 1990).
“The qualitative interviewer must get close enough to the people and
situation…to personally understand in depth what is going on” (Patton, 1990, p.
4). I spent time in the field observing and recording verbal and non-verbal data.
To do this, I asked questions before, during and after the data collection to

61
challenge conclusions and open doors for possibilities. I listened without inflicting
bias and then assimilated the information to tell the story. I had to be open to a
variety of possibilities, one of which was that the conditions of the buildings had
nothing to do with student achievement.
On the other hand, I recorded, analyzed and compared eight years of TAAS
data from twenty-nine Ysleta schools. I used the TAAS data to track the progress
of the approximate 24,000 students attending the schools in the study. My
experience of over 30 years of mathematics teaching assisted in interpreting the
scores and making meaning of the statistical findings. To bolster my knowledge
set, I attended classes in SPSS software use and accessed regular assistance from
statistical experts in the field.
Description and Selection of Participants
The focus of this study was change. This is appropriate because over the
eight-year period investigated in this study, students, administrators, teachers and
programs changed and so did student scores. Interviewed participants were
members of the Ysleta community. The participants in this study were the former
superintendent of Ysleta, Dr. Anthony Trujillo, the current associate
superintendent, Manny Soto, the principals of the twenty-nine Ysleta schools
randomly selected for the study, the Ysleta students attending the twenty-nine

62
schools and the buildings that serve as constant reminders to students that the
Ysleta ISD believes that the environment matters.
I used expert opinions provided by the Dana Center Study as well as
opinions by members of the educational community at the University of Texas and
the Ysleta ISD as reference points in selecting the participants. Dr. Trujillo and
Mr. Soto were purposely selected. After a review of the literature, conversations
with the Dana Center in Austin, and meetings with the researchers of Urgency,
Responsibility, Efficacy: Preliminary Findings of A Study of High-Performing
Texas School Districts (Ragland, Asera, & Johnson, 1998), it was obvious that this
story could not be told without them.
The Ysleta ISD hired Dr. Trujillo in 1992. At that time, Ysleta ISD was
struggling. It was known as one of the lowest performing urban cities in Texas,
with no exemplary, one recognized, and forty-eight acceptable campuses. That is
a far cry from the Ysleta ISD of 1998 that ranked number one in Texas among
large urban districts. Ysleta continues to be one of the highest-ranking urban
districts in the state and unlike the Ysleta of 1992, the Ysleta of 2001 boasts nine
exemplary, thirty-four recognized, and eight acceptable schools.
The associate superintendent was chosen by the current Ysleta interim
superintendent as the appropriate contact concerning student achievement and the
history of Ysleta’s inclusion of building condition as a possible link to student
achievement. In addition to the selection of the past superintendent and current
63
associate superintendent of Ysleta ISD, various other participants were casually
interviewed.
The study took place in four phases. Participants for Phase I were selected
through availability sampling during the first visit in January 2002. I went to the
schools selected for the study and spoke casually to a variety of people at the sites.
The purpose of this data collection was to acquaint me with the schools included in
the study and to gather spontaneous impressions of the importance of building
conditions from a variety of viewpoints. Phase II consisted of data collection and
entry. Phase III occurred in March 2002, and included an interview with the
former superintendent of Ysleta ISD. This participant was selected due to his
efforts in upgrading the Ysleta school buildings and the role he played in
convincing this community that the conditions of schools matter. Phase IV
occurred in June 2002 and included an interview with the current associate
superintendent of the Ysleta ISD. The associate superintendent for learning
standards and assessment reports has served the Ysleta ISD for over thirty years
and was the associate superintendent for the district in 1994. This phase also
included a visit to collect documents from the district concerning TAAS scores
and renovation information.
The participating schools were chosen randomly. There are fifty-two
school campuses within the Ysleta ISD. The Ysleta Independent School District
believes in site-based leadership, and principals have the opportunity to refuse

64
participation in any research study. Thirty-three schools were contacted
concerning the study. Each principal was sent a letter of introduction and an
explanation of the study. Four of the thirty-three schools chose to withdraw
participation, resulting in twenty-nine schools or approximately 56percent of the
schools in the Ysleta ISD. Four out of seven high schools participated. All eleven
middle schools participated, and 14 out of 34 elementary schools participated.
Procedure
The data were collected in four phases. Prior to each visit, telephone
conversations and email communications took place with each participant.
Following each interview or visit, a thank you note was sent to each participant,
addressing their willingness to participate in the study and their contribution. For
Phase I, I traveled to Ysleta during January 2002 to gain official permission for the
study from the interim superintendent and meet with the Ysleta Research
Department. During this visit, I drove to each of the campuses included in the
study and took pictures of the buildings. I spoke to randomly selected people at
various buildings. There were no set questions, yet all my inquiries centered on
how they liked the school and what part they played at the school. My aim was to
gain initial impressions of the school environment. I believe the context of the

65
study is critical in qualitative research and essential as a first introduction to the
school district.
Phase II was a six-month data collection period that began in February
2002 and was comprised of two parts. During part one, I collected information
about the Ysleta Independent School District. The information was gleaned from
the Ysleta ISD Public Education Information Management System (PEIMS) data
and the Academic Excellence Indicator System (AEIS) data for the past eight
years. The second part of Phase II consisted of inputting eight years of data, for
each of the twenty-nine campuses, concerning student achievement of TAAS
objectives and other noteworthy information gleaned from the Texas Education
Agency’s website. During this phase, I attended workshops and tutor sessions on
SPSS.
Phase III took place in March and consisted of an interview with the former
superintendent, Anthony Trujillo, at his home. The questions were chosen through
collaboration with the researcher’s committee chairmen. These questions provided
an environment of free-flowing discussion and established a connection between
the former superintendent and me. The questions pertained to how he had
originally included school facilities in his district goals as well as questions
pertaining to the conditions of school buildings and how he believed they related
to student achievement (Appendix A).

66
The Phase IV interview with Mr. Manny Soto, the current Associate
Superintendent of Learning Standards and Assessment Support took place in June
and consisted of similar interview questions. The district chose Mr. Soto for the
interview due to his relationship with Mr. Trujillo and his position as Curriculum
Director during Mr. Trujillo’s years as superintendent.
The Interviews
As suggested by Johnson (1996), the interview protocols followed a non-
fixed format. The questions were determined through conversations with my
committee chairmen and the natural questions that resulted from the study area.
The interviews used a two-step design.
Step one: The participants were interviewed alone for approximately two
hours each using specific questions sent to the interviewees prior to the meeting.
The interviews were transcribed and examined. Emailing specific clarification
questions to the interviewees performed member checks. This communication was
followed with telephone conversations in which the transcripts were examined for
accuracy and clarity.
Step two: The transcripts for the two interviews revealed emergent themes.
The themes were reviewed by a fellow Cooperative Superintendency candidate
and further checked for relevancy by my committee chairmen.

67
Interview Data Analysis
The data collected from the interviews were transcribed immediately
following the interview. Each interview transcription was examined and marked
for themes. The data were highlighted and coded by hand using the techniques of
Miles and Huberman (1994). I checked for specific as well as emergent themes.
Further, the field notes were analyzed using the same procedures. Notes were
highlighted and coded by hand using sequential analysis techniques (Miles &
Huberman, 1994). The interviews and notes were compared to check for similar
themes. The themes were framed together to tell the story of Ysleta.
Trustworthiness and Credibility of Interviews
Finding a possible relationship between school building conditions and
student achievement is difficult at best. For that reason, trustworthiness and
credibility of the data is essential. Lincoln and Guba’s (1985) work on qualitative
research stresses the use of methodologies that establish trustworthiness through a
variety of methods. They define trustworthiness as answering the question of
“How we can increase our and our reader’s confidence in what we’ve found”
(p.263). Likewise, Miles and Huberman (1994) stress that the inquirer must
persuade his or her audience that the findings are worth paying attention. The
researcher used Glesne’s identifying procedures for qualitative research (Glesne,

68
1999). These procedures included but were not limited to: prolonged engagement,
peer review and debriefing, member checks, thick description and triangulation.
Prolonged engagement was established by initiating conversation with the
former superintendent and associate superintendent in January and corresponding
with them through email, mailings and phone conversations in addition to the
actual on-site interviews. To avoid bias caused by my “non-continuous presence”
(Miles & Huberman, 1994, p.264), I systematically maintained a relationship with
the participants throughout the study.
Peer review and debriefing was accomplished through interaction with the
researcher’s Cooperative Superintendency cohort. I met with a cohort and
reviewed the transcriptions and coding prior to and after analyzing the data for
themes.
“The sharing of interview transcripts, analytical thoughts, and drafts of the
final report established member checks with the research participant to make sure
the researcher is representing the ideas accurately” (Glesne, 1999, p.32). Ongoing
communication with the participants as well as a review of the transcripts and
drafts of the actual paper by the participant provided member checks for accuracy.
The participant provided detailed description and thick context through
questions that solicited detailed answers and thought-provoking reflection. This
provided me a window into the research context (Glesne, 1999). Schools for the
study were chosen randomly by placing all the Ysleta school names in a box and

69
drawing twenty school names; of these seventeen chose to participate in the study
(Miles & Huberman, 1994, p. 264). Drawing thirteen more schools out of the box,
of which twelve chose to participate, completed the study group. This random
selection increased reputational sampling and trustworthiness of the data.
My reflexive journal provided an ongoing documentation of experiences,
appointments, feelings, conversations and responses to problems and triumphs
experienced during the study. Questions stressed by Miles and Huberman (1994)
were used by the researcher to conduct an ongoing, internal conversation to avoid
researcher bias.
Finally, triangulation was established through multiple data-collection
methods (Glesne, 1999). These included interviews and conversations with a
variety of individuals, written and electronic documents concerning El Paso and
the Ysleta district, and direct observation of the buildings and people (Miles &
Huberman, 1994).
Data Collection and Instrumentation
Data related to building and classroom conditions, student achievement, the
socio-economic status of the schools, demographics of the schools, schedules of
renovation and construction, criteria used to determine priorities regarding district
capital expenditures and financial information concerning availability of funds was

70
needed for this study. The data on district priorities, sources for funds, and
building and classroom conditions were collected using a variety of techniques one
of which was a survey based in part on work conducted by Cash (1993), Hines
(1996), Lanham (1999) in Virginia, and Earthman, Cash and Berkum (1995) in
North Dakota called the Commonwealth Assessment of Physical Environment
(CAPE). In Cash’s original study, several facility assessment survey instruments
were reviewed. Cash developed a survey using various factors described in
previous studies and also included space for written responses to each question.
The survey was field tested by Virginia Beach City Public Schools research
department in order to determine reliability. Cash checked inter-rater reliability by
fielding the survey at several additional high schools and obtained similar ratings.
The assessment placed schools in condition level categories of substandard,
standard, and above standard. A similar approach was used to test inter-rater
reliability of the questionnaire used for this study.
Demographic information collected for this study came from the Texas
Education Agency’s (TEA) demographic data collected in 2001. The percentage
of students classified as economically disadvantaged came from data supplied by
TEA. Data for student achievement were gleaned from the Texas Education
Agency’s 1994 - 2001 administration of the Texas Assessment of Academic Skills
(TAAS) test.

71
Survey Administration
Procedures defined and articulated by Dillman (1978) were used to
administer the survey instruments. Cover letters were developed to accompany
each of the survey documents. (Appendix B) The cover letter stated the purpose of
the surveys, their individual place in this study, why it was important and why
individuals surveyed should respond. Respondent confidentiality was assured.
Surveys were mailed in a pre-addressed stamped return envelope. Participants had
the choice to sign the actual survey or leave it blank. A postcard was mailed one
week after the initial mailing thanking participants responding to the questionnaire
and reminding those not responding to do so. A follow-up mailing was sent to
non-respondents three weeks after the initial mailing. Another letter and survey
was included asking for the assistance of the respondent in completing the survey.
A final mailing was sent to all non-respondents the seventh week after the initial
mailing making a final request of the participants and included a third copy of the
survey.

72
Response Rate
Ysleta Independent School District was selected for this study, and surveys
were sent to randomly selected building principals within this district. A total of
twenty-nine schools within the district were investigated.
Scoring
Survey items were constructed to obtain either specific numerical answers
generated by the respondent or a selection from a list of responses. These
numerical responses were analyzed using the Statistical Package for the Social
Sciences (SPSS). The surveys concluded with open-ended questions. The
responses to these questions were analyzed thematically. A copy of the survey is
displayed in Appendix C.
Reliability and Validity
The survey items were taken from two survey instruments used and field
tested in prior research. The Commonwealth Assessment of Physical Environment
was initially developed and administered by Cash in 1993 and Hines in 1996, by
Earthman, Cash and Berkum in 1995 with minor alterations, and finally by
Lanham in 1999. The University of Texas in conjunction with the Texas
Education Agency administered the Estes Survey in 1999.

73
The Facility Questionnaire was pre-tested to ascertain if the individual
questions measured what they were intended to measure; whether they were
written clearly, to what extent each reader had the same interpretation of the
question, whether appropriate answer choices were provided; whether the overall
impression made by the survey was positive; and whether any researcher bias was
evidenced in the survey. A second content review was conducted using 15
selected principals in various Texas districts. Adjustments were made following
analysis.
.
Texas Assessment of Academic Skills
The Texas Assessment of Academic Skills is routinely administered to all
third, fifth, eighth, and tenth grade students. The Texas Education Agency
collects, compiles and releases data for each individual school as well as the
district. The third, fifth, and tenth grade results and the 1994-2001 TAAS reports
for each participating school within Ysleta were reviewed for this study.
Data Analysis
There were several forms of data used in this research. It was important for
this project that the data was used to tell the story of Ysleta with an emphasis on
decisions concerning school facilities and their impact on student achievement.

74
For this study, the qualitative and quantitative data analysis does not stand alone
but commingled to provide a basis for the findings. Of equal importance are data
concerning why people made decisions and how well percentages of passing
TAAS scores hover around a best-fit line. Extensive time and effort was used in
analyzing the qualitative data. Interviews were transcribed and analyzed. Themes
were determined and checked by participants and colleagues. The quantitative
data required the same attention to detail.
To determine the extent to which school facilities influence student
achievement, an achievement instrument had to be chosen that was valid and
reliable. The Texas Assessment of Academic Skills has been used by the Texas
public schools since 1994, and was also used by the Dana Center in previous
noteworthy research. It served as the achievement benchmark for this study.
Multiple regression procedures are widely used in social and natural
science research. It allows the researcher to mathematically investigate the best
predictor of an event. The Statistical Program for the Social Science (SPSS, 2001)
was used to conduct descriptive statistics (means, standard deviations, frequencies,
and percentages) and multiple regression analysis. Backward multiple regression
analysis determined how much of the variance in the TAAS scores (the criterion)
was accounted for by the predictor variables (building age, financial disadvantage
of the students, etc.). The use of multiple regressions and a seemingly unrelated
regression (SUR) provided a window of observation into the reasons student

75
achievement might change, and indicated the probability that school facilities
played a part.
Limitations of the Study
This is a case study of the Ysleta Independent School District and its
victory in raising TAAS scores. This study did not attempt to investigate the
condition of schools and their relationship to student achievement at the macro
level, and it is not meant to be generalized. Further, there are several
methodological weaknesses. The study investigated achievement and building
conditions over an eight-year period for twenty-nine schools in the Ysleta ISD.
While the study used over one-half of the Ysleta schools, the sampling is
comparatively small. A larger sampling could result in a more complete study.
The use of a survey provided principals with an instrument to describe their
school yet the study is limited by the questions provided by the survey and the
truthfulness and attention to detail used by each principal in answering it. The
study is further limited by the extent to which information could be obtained
concerning specific renovation, repairs and construction projects from the district.

76
Summary
The purpose of this study was to investigate the relationship between
student achievement and the condition of school facilities in the Ysleta
Independent School District. Chapter III described the research methodology used
for this study. The use of a mixed method case study approach provided a more
detailed, yet statistically analyzed description of the successful attempt by the
Ysleta Independent School District to both improve student achievement and
upgrade their school facilities. As defined by a case study, this approach allowed
for a focus on one district and, therefore, does not lend itself to generalization.
Chapter III described the setting, the research design, the selection of the
participants, procedures of interviews and survey administration, data collection,
the scoring of the survey and the data analysis.
Chapter IV reports the contents of the study concerning the effect school
facilities have on student achievement. Chapter V will describe the results and
address this study’s contribution to the ongoing discussion and literature
concerning school facilities and student achievement, as well as discuss the
findings, conclusions and recommendations of this study.

77
CHAPTER IV
FINDINGS OF THE STUDY
Although Shirley Hansen’s statistics in Schoolhouse in the Red. A Guide
for Cutting Our Losses: Powerful Recommendations For Improving America’s
School Facilities may be somewhat outdated, her survey through the American
Association of School Administrators showed that the condition of school facilities
in the United States is rapidly failing. In her 1991 study, she found that 74percent
of America’s school facilities should be replaced or repaired and as much as
12percent failed to meet minimum building standards. Further, she found that the
consequences of deferred maintenance range from premature building
deterioration, increased repair costs and needs, increased replacement costs and
reduced operating efficiency of equipment to lower efficiency of school personnel
and possible links to student achievement. The price tag for deferred maintenance
quadrupled over the eight years preceding her study, from $25 billion in 1983 to
$100 billion in 1991 and the environment of peeling paint, crumbling plaster,
nonfunctioning toilets, poor lighting, inadequate ventilation, and inoperative
heating and cooling systems can adversely affect people working within the
school’s environment (Hansen, 1992). An earlier study by the Carnegie
Foundation for the Advancement of Teaching found that schools are under-funded,
facilities are decaying, and faculty and student morale is low (Carnegie Foundation

78
for the Advancement of Teaching, 1988). John Sharp, former Comptroller of
Texas Public Accounts, produced a publication in 1998 titled Current and Future
Facilities: Needs of Texas Public School Districts. For it, he surveyed Texas’
1,037 superintendents concerning the status of their facilities, problems with
facilities and their projected needs for facilities. This survey did not focus on
individual districts but aggregated data for the entire state. His report represents
614 district respondents, of which 88.9 percent represent districts with an
enrollment of more than 50,000 students. Together they identified approximately
$9 billion in anticipated facility needs for Texas schools.
A relationship between the condition of school facilities and student
achievement, while assumed, is difficult to assess and lacks rigorous study. This
chapter contains a presentation of the information and data findings for this study
with regard to the Ysleta Independent School District and its decision in 1994 to
include school facilities as a component of its student achievement initiative. This
study used a mixed method approach. A discussion of the interviews with Mr.
Trujillo and Mr. Soto along with the findings from the survey of school principals
is reported. The interview and survey findings are based upon the following
research questions,
1. What factors directly affect the decision to include facilities as a
component of educational adequacy?

79
2. How does availability of funds impact priorities regarding maintenance,
renovation, and construction of facilities?
3. To what extent can student achievement on the TAAS test be explained
by socio-economic condition, school size, building age, cleanliness,
maintenance, and the condition of the school’s structure?
The Interviews
Interviews were conducted for this study and the quoted material in this
chapter resulted from these interviews, unless otherwise referenced. The results of
the interviews are acknowledged through the identification of major and sub-
themes that interweave throughout the interviews. The study of the effect school
facility conditions has on student achievement found definition through the major
themes of risky decisions, powerful people, buildings matter and accountability.
Risky decisions are defined by those pivotal decisions made by key individuals and
members of the school family that were bold, connected to the mission of the
school, were visionary, contributed to the district’s need for change and contained
a high possibility of failure. Powerful people refers to those people within and
outside the school community who wield power and used their power to broker
resistance or initiate new ideas. Buildings matter refers to an intrinsic feeling and
decision by individuals and groups that the conditions of school facilities make a

80
difference to teacher and student morale, to the efficiency of the campus and its
occupants and ultimately to the achievement of the district’s students. The final
theme of accountability refers to a commitment by the Ysleta ISD and the school
community to standards, a consistent adherence to expectations of excellence and
a systematic approach to ensure compliance.
Interwoven into each of the four major themes of risky decisions, powerful
people, buildings matter, and accountability were a series of sub-themes of
determination, symbolic trust, economic value, politics and pride. The sub-theme
of determination refers to commitment and courage as evidenced throughout the
themes of risky decisions, powerful people, buildings matter and accountability.
The sub-theme of symbolic trust refers to the trust that was established and
pervaded the Ysleta community and intertwined throughout the major themes.
Economic value refers to the value that members of the community placed on
themselves and on their schools. It was evidenced through their decisions, their
leaders, their buildings and their accountability. Politics refers to the level of
negotiating and bartering that took place as this fine district set its course toward
academic excellence. And, finally, pride refers to the individual and collective
pride the members of the Ysleta Independent School District feel both for their
district and for their culture. That pride sustains their commitment to students and
to leaving no brick unturned and no student behind.

81
Context
The Ysleta Independent School District serves a student population of
approximately 46,400. The average age of its schools is 50 years old and one-third
are over 75 years old. Ysleta is comprised of a large minority population as well
as a population characterized by poverty. Its ethnic distribution is 40,860 Hispanic
students, 3,975 White students, 1,099 African American, 262 Native American
students and 198 Asian American students. There are 34,038 economically
disadvantaged students, as defined by the Texas Education Agency, and the district
is currently rated as Recognized by TEA. In 1994, the Ysleta Independent School
District was given a rating of Academically Acceptable. At that time only
34.5percent of the tested economically disadvantaged students in grade ten and the
tested economically disadvantaged students in grades three through eight passed
the reading portion of the TAAS test. Likewise, only 31.6percent passed the
writing test, and 22percent passed the math test. In 1994, the leaders of the Ysleta
ISD set out to make a difference, and, indeed, they have. As of 2001,
economically disadvantaged students are passing the TAAS test at a rate of
88.1percent for reading, 89.2percent for writing and 93.6percent for mathematics.

82
Risky Decisions
Antonio Trujillo joined the Ysleta ISD in the spring of 1994. In an
interview, Mr. Trujillo, “One of the places we started was the buildings.” He
asked for permission to spend a few months just to get to know the people in
Ysleta. One of his first risky decisions was to save Ysleta High School. It was the
original high school and was also where the district offices had been. The district
was built around that high school, yet by 1994 it was in very bad shape. The
Texas Education Agency said that the district needed to tear it down and start over.
Mr. Trujillo describes the early days of his superintendency.
I told the board that I would like to spend about two months just
really acclimating myself and getting people acclimated to me. So I
went to every school. I went to every school and I talked to the
faculty at every school. And one of the things that was amazing to
me was the numbers, the number of people that had graduated from
Ysleta High School that were teachers in our district. And the more
I got acclimated to the district the more I got acquainted with them,
the more I realized that the school had graduated a tremendous
number of people that were now in leadership positions throughout
the community an everything else and that to tear the school down

83
would be to tear something down that was very precious to them
and it was very symbolic.
Determination
Trujillo encountered numerous roadblocks. One of them appeared early in
his superintendency. He describes it this way, “When I came to the district I found
a large bureaucracy, if you will, or large overhead in the construction office. One
of my theories was that the money could be eaten up by overhead and that you
needed to put the money to work, the construction money to work.” The
construction group had lost credibility with the Board. Trujillo arranged for the
director of the construction area to leave the district. After the director left the
district, Trujillo laid off the rest of the department. Trujillo was new to the
district, and he had no bond issue at the time. Trujillo explained, “There had been
some alienation between the community, the board and the district over the
previous bond issue because they had built some very inadequate buildings.”
Since there was a history of animosity between the community and the district
about construction, Trujillo decided to move in a new and daring direction.
Trujillo discussed with the chairman of the Board “the notion that we ought to go
on a pay as you go program.” He felt that he could use the Texas finance system
to the district’s advantage. Trujillo and the Board raised local school tax by eight
cents. Due to Ysleta’s poor wealth designation, the state awarded funds two to one.

84
Ysleta had netted the district approximately $3.25 million. The state then awarded
the district between $6-7 million dollars. With $10 million in the bank for
renovation and construction, Trujillo and the Board set out to rebuild the district.
Symbolic Trust
While walking around Ysleta High School, Trujillo ran into two men who
were doing some maintenance work to try to keep the place together. Mr. Trujillo
said,
One of them said to me, “We could fix this school up for you Mr.
Trujillo if you give us the money.” I said, “What do you think it
will take?” And this one fellow spoke up and said he could redo
the whole school for $2 million. So I said to myself, “$2 million to
preserve the school is nothing.”
The district is divided by highway Interstate 10. Trujillo described the
separation to the researcher as the middle class of the district was north of I10 and
the lower income class was south of I10. He indicated that the buildings reflected
the economic conditions of the community. The district’s growth was on the East
side, or north of the freeway, and, therefore, had newer schools. Trujillo said,
“The interesting issue was that the needs of both sides of the freeway were
different and extensive because on the North side there was crowding. We have

85
kind of a freeway migration, as people become more capable they will leave the
South, the lower valley and move to the North side.” Since the district is
predominately Hispanic, he continued, “It is a class issue.”
Trujillo wanted to show the district that they could change the schools and
thereby change student achievement by using their own manpower. Trujillo
explained, “I took the man that was working at this little high school and said he
could redo the building for two million dollars. He was a graduate and an architect.
He had done his architectural studies in Mexico. He had not had an opportunity to
show his creativity. He was a rebel.” Trujillo made his first major risky decision
while talking to the young man. In describing his meeting, Trujillo said, “I don’t
know you, but I’m going to give it a shot, and in the first summer I said I want you
to renovate this high school. Well, I couldn’t believe what he did.”
Trujillo began to systematically change the district. He was concerned
about he lack of trust throughout the district, and he felt the district and the
community of teachers and students needed something concrete that represented
trust in their abilities and faith in their future. He explained:
I think our beginning was the construction program. It was
symbolic. It was something you could touch and feel and see.
There were so many things to be proved by it, that simple people
86
had talents that we could use them, if you gave them the right tools
and encouragement.
Economic Value
Following the Edgewood case, the Supreme Court ordered Texas to
establish a more equitable finance system. Eventually, Texas established a system
that for all practical purposes required the district to raise local property taxes.
Trujillo said, “The state would match the money raised based on the wealth of the
district. In our district it was a two to one match. So we would get two dollars
from the state for every dollar that we raised over property taxes.” Trujillo took a
risk by using the system to fund his construction projects. He also formed an in-
house construction company. This decision is practically unheard of in public
schools, and the in-house construction company was extremely successful. The
district was able to renovate for a fraction of the cost.
Mr. Manny Soto agreed with Mr. Trujillo. Soto said, “There are three legs
to this stool. The facility issue is one of the legs and the other one was
simultaneously the $10 million for the construction program. The third leg of the
stool is the psychology of the workforce.” Mr. Soto emphasized that the district
was able to get more “bang for the buck” by using in-house maintenance workers
as the construction crew. An extra benefit was that the members of the

87
maintenance crew were equipped with the best tools money could buy. The men
worked extra hours to complete renovation projects well under the target dates.
This saved the district money, yet the overtime increased the workers’ salaries. As
the maintenance workers socioeconomic status improved, so did their commitment
to excellence.
Trujillo was determined that the students of Ysleta, regardless of their
circumstances, would graduate, speak Spanish and pass the TAAS test. Trujillo
explained that one of the first conflicts he was presented with was “one hundred
fifty students that had been expelled from the district during that school year. This
was in March. How can you throw one hundred fifty kids out of school? We built
the first alternative school in the history of Texas.” Following a visit by some State
senators and representatives, Texas mandated alternative schools for every district
in the state.
Politics
As with most large systems, Ysleta is not immune to political ups and
downs. Trujillo explained, “If you are a great teacher, what is your reward? You
get more kids.” The chairman of the Board was a member of an organization
called Angry Taxpayers Association. Trujillo said, “He was quite a conservative
gentleman, and he wielded considerable power with the conservative element of El
Paso.” The Board member had an idea about a pay as you go construction

88
program and Trujillo liked it. It was important to both men that the district “not
lay the bills on future populations.” They made a risky decision to raise taxes.
The chairman of the Board was elected based on a campaign of no new taxes.
Now they were raising taxes in order to net a possible $3-3.25 million. Trujillo
was saying that teachers and students matter and their surrounding make a
difference. It did not sit well with everyone. The measure worked but there was
some eventual political fall out from the decision.
Pride
Before Trujillo came to Ysleta, the district had a difficult time recruiting
teachers and non-teaching personnel. It really was not because the pay was
substantially lower than other large towns. Unless you are from the area, El Paso
is far from home. The news concerning Trujillo’s dedication to worker input and
risky strategies began to spread. Trujillo explained, “We proved that dedication,
commitment and intelligence were the major things we were looking for in people.
We were giving people a purpose for their lives.”
The decisions concerning people and buildings began to build pride within
the community. Trujillo proudly stated that maintenance men were finished
“going out with screwdrivers and hammers to try to keep the place together.”
Trujillo explained that finally the district acknowledged “it was a waste of their

89
knowledge, their time and our resources. These men were talented they just lacked
confidence. Well, the place just exploded with creativity.”
Powerful People
Determination
Few would argue that Anthony Trujillo is a very powerful person.
Through his leadership and personal style, Ysleta was the first and largest urban
school district to receive a recognized rating by the state of Texas. He was a hard
worker, and he expected the same from his employees. Early in his tenure at
Ysleta, he let district personnel know he meant business by getting their attention.
He placed a new principal at a historically struggling school. Trujillo said that
around Christmas,
The principal came to me and said that “It’s impossible, this school
is impossible.” So I called the entire staff together right after the
holidays and said, “You are all fired. This school is finished and
we’re starting over.” Every school called a faculty meeting the next
day and said, “This guy is nuts, folks. We’re not going to be the
next one so let’s get to work.”
Trujillo’s belief in excellence and the ability of children to achieve it was
underscored by his determination to make it happen. Unfortunately a member of

90
the school board for the status quo met his resolve for transformation with an equal
resolve. This particular board member complained about the “frills” Mr. Trujillo
was adding to the district. Trujillo said:
She used clichés like, I want meat and potatoes. I don’t want all
these frills. That appeals to the public. That appeals to the press.
But the truth was… when you look to buy a house, what do you
look at? Why should children have any less when they go to school
and they spend six to eight hours of the day? She came off as a big
teacher advocate. So, that was a running, you know, kind of battle
between myself and her about the quality of schools.
Trujillo had also tampered with the local construction industry, and they
were not going to go down without a fight. While Trujillo’s outspoken manner
and gutsy persona provided the kind of leadership necessary to move his district
quickly forward, it gave his opponents a hole in the dike. Trujillo explained:
Architects were upset with me. They called me to a meeting. It was
a very hostile meeting. And basically I took the position, I said,
“I’m not here for your benefit. I came here to do some things with
these children, for this community, and if you can’t make a living
because the district is not putting a lot of money to you, then that’s
too bad.”

91
Although it would seem reasonable for the community to rally behind Trujillo’s
attempt to save money, he misread the construction industry’s ability to use it
against him, and while the district continued to set new standards for facility
excellence, his personal superintendency began to crack.
Symbolic Trust
Trujillo was an “old school” administrator. He understood educators, and
he knew how to get the most from them. He called a meeting with principals and
district level administrator and said, “This is the most unusual district I’ve ever
been in. It has the brightest adults in the world and the dumbest kids.” The district
was ranked at the bottom of the big eight school districts in Texas. Trujillo went
on to say, “I looked at your personnel jackets and all of you exceed expectations.
Now tell me how you can have fantastic adults not making any progress with
children unless those children are stupid.” He got his message across.
Trujillo used the same approach with construction. Trujillo said he felt he
had the “perfect guy who understood the workers, understood their culture and
how to get the most out of them. He was able to give them leeway, use their
talents without dictating everything, while overseeing everything.” Trujillo led his
district by example. He was a powerful person and passionate about his work. He
trusted his employees, and it was infectious.

92
Economic Value
Trujillo was the new man in town. He was making huge changes in the
district, and change is difficult, especially when it involves a local industry’s
income. Local contractors were furious with Trujillo. He was using his own
maintenance crews for renovation projects, and he was seen as an outsider. The
construction industry began slowly to rise up against him. Trujillo explained:
It was not pleasant. It was not a great relationship that I had with
the contracting and building industry.…They funded the campaigns
of several board members with the promise that they would get me
out of here. That they could not do business in this district as long
as I was here. I was not going to take any payoffs. There was
tremendous corruption.
Trujillo was committed to saving money. He explained that instead of working
with local contractors to meet a compromise, “I made a decision based on what I
think is good for the children and that’s the end of it.” Unfortunately, it was the
beginning of the end for Trujillo.
Politics
The needs of the district were diverse. On the North side of town there was
over crowding and on the South side of town there was poverty. It was a class

93
issue. It was economic. The board met and they were, ironically enough,
associated somewhat with construction. One member was a civil engineer.
Another was an electrical engineer. Still another worked for an engineering firm.
There was an insurance salesman and a real estate agent. Trujillo said, “I had this
group of men who had ideas about buildings.” The majority of the board believed
that the physical condition of their school facilities made a difference in the quality
of their schools. They were determined to upgrade the facilities. One member of
the board did not agree. She was very vocal and Trujillo believes she worked
earnestly to sway teachers and the building industry against him and his plans.
Little by little, the original maintenance supervisors left the district.
Trujillo explained, “They no longer had these folks under their thumb and that’s
what they were treating them like. They were treating them like indentured
servants more than skilled workers.” El Paso’s isolation in Texas worked against
Trujillo. The maintenance supervisors left the district, but they did not leave the
town. The movement against Trujillo was a slow growing cancer but a cancer
nonetheless.
Pride
Most of the current employees interviewed by the researcher described the
years while Trujillo was superintendent as the Camelot years. Manny Soto said,
“We were able to get more performance during the mid-nineties from the various

94
categories of employees, because we gave them more respect. We all listened to
them in terms of what tools they needed to do a better job.” Trujillo spent a
million dollars on power tools for the maintenance department his first year with
the district. His administrators wrote grants for technology, and he began to
systematically supply the district with the latest technology. Ysleta High School
had graduated a tremendous number of people that held leadership positions
throughout the community. Slowly many of these leaders joined the Ysleta ISD,
and there was a sense of pride about being associated with Ysleta ISD.
Trujillo said, “The first school building we renovated was located in the
poorest part of town. As the building was transformed back to its heyday, the local
community was energized.” An out of town construction company was not
slapping up a new building. The community’s fathers, brothers and sons were
doing the reconstruction. They were bringing back the building that was once the
pride of the district. Ysleta High School was scheduled for demolition in 1994.
Today it looks like a prestigious private school and is designated as recognized by
the Texas Education Agency.

95
Buildings Matter
Determination
Trujillo was determined that the students of Ysleta ISD would have the
finest schools he could provide. He said, “My theory is that the environment
surrounding people has a great deal to do with their attitudes about everything.”
He was a master at working with the soul of his employees. Trujillo explained,
“They were giving it their finest. So there was a lot of caring that went on about
the facility program all of the sudden. The whole district began to change because
of the facilities.” Trujillo believes that the shareholders of the Ysleta ISD had the
ability but needed a physical sign to rally around. He said:
It was a physical demonstration to people in the community that
they need not settle for second-class anything. And that if we are
going to have great buildings, we are going to have a great
education inside those buildings. So it was very clear to the
teachers and principals. I demanded that people perform at high
levels. So this transferred, when they saw this happening to the
buildings, they knew we meant business
Trujillo had a plan in his head. It was a plan for student achievement and
personal pride. He said, “All of this started with the construction, but it was
leading, it was part of a larger picture. It was part of the final analysis of getting

96
kids to better achievement. We became the first recognized school district of the
urban districts in Texas.”
Trujillo’s resolve was bolstered by the resolve of his top employees.
Manny Soto directed the instructional program for the district. While his reasons
for believing in the benefit of proper maintenance, renovation and construction
differed from that of Trujillo, he was nonetheless determined. Mr. Soto said:
We have got to be in the pocket. We don’t have time for principals
to be worrying about getting drinking fountains, air conditioner, or
a leaky roof being fixed. If I am talking to a principal about
construction, he’s not in the pocket. He’s not focused. So you have
to remove all those issues in order to get instructional leaders back
to where they need to be, talking about teaching and learning.
Talking about teachers and instruction instead of spending time on
drinking fountains.
Mr. Soto has beliefs about educational leaders and their duties to that
position. Soto said, “Your job is to prepare children to go to college. It’s in our
mission statement. That’s everybody’s job. You keep a clean, safe facility at your
school as your part of this equation.” He also feels strongly about barriers to
quality education and leadership. He said, “Having a good facility is a good

97
support element to nurture the instructional process. When you don’t have it, then
it (facilities) becomes a barrier.”
Symbolic Trust
Trujillo decided to renovate the buildings the first day he was walking
around a school slated for demolition. He said:
The first place that was probably more symbolic than anyplace else
was Ysleta High School. This is the school where the district
started. It was in very bad shape. The state had said we must tear it
down and start over. To tear down the school would be to tear down
something that was very precious to them. It was very symbolic.
Trujillo believes there were certain areas of personal pride that transcended
socioeconomic status. He felt he needed to build trust within the school
community by providing a visible sign regarding that understanding and respect.
Trujillo said, “When you go buy a new home, if the exterior of the home isn’t
appealing to you, you aren’t even going to walk into it. You aren’t going to
venture inside.” Likewise, Trujillo believes that students, parents and teachers
needed a visible sign of assurance concerning his attention to detail and his
commitment to excellence. Trujillo continued:

98
If the grounds are not manicured, if there is graffiti on the building,
that’s not going to be inviting, not only to the children but to the
parents as well. There was a clear effort to refresh all the schools so
that we could engage the parent so that they would have something
appealing to come into at everyone of our campuses.
Economic Value
Trujillo used the ability of middle class and poor families to stretch a dollar
to his advantage. He was very vocal about the money he was saving the district by
using their own school personnel for renovation projects. Trujillo said, “Our
schools were not just well built, they were beautiful, gorgeous schools. We were
building them for about half the cost of anybody else. The other school districts
were running initially about $100 a square foot. We never got close to $100 a
square foot. We were running about $50 a square foot. Eventually we got up to
about $75, but they were going over $125.” He began to build a “we can do it”
attitude among his constituents. By providing schools that looked like the schools
affluent families choose, parents could believe their children had the possibility of
competing successfully in that arena and eventually break through the cycle of
poverty that had somehow snared them.

99
Politics
It is evident that the Ysleta ISD has made substantial progress concerning
the condition of their school facilities, but can they compete with wealthy districts?
Mr. Soto believes the barrier is that the Facility Allotment Fund can only be used
for instructional facilities. Soto explained,
We cannot build anything unless it has something to do with
instruction. I can’t pay for bleachers in a gym. Unless I build a new
school, I can’t build a cafeteria because it is not instructional
facility. If it is the content of a total school, then I can build a
cafeteria facility because it is an element of the total school. It ties
my hands to use state funds.
The state has moved in the right direction by providing funds for property
poor districts, but Soto believes “we need facility standards.” Trying to avoid a
bitter tone when discussing the five-story parking garage in Highland Park, Mr.
Soto said,:
I have to marvel at having those advantages at their school. I can
hope that someday to have some of those advantages. We need to
be able to do whatever we want in terms of what we need for a
facility. It should be our decision. It shouldn’t be managed in
Austin. Let Austin hold us accountable with the outcome, that’s

100
fine. Establish standards and hold us accountable but give us all the
discretion we would have if we lived in Alamo Heights.
One of the problems districts like Ysleta have is that facility needs
transcend the narrow definition of instructional set by the state. Many of the
students in Ysleta need more than a decent education to attend college. They need
scholarships. Some of these scholarships are in the form of academic grants and
fellowships, but many can be found through sports and extracurricular activities.
Since the Facility Allotment Fund definition of instruction is narrowly set, the
students in districts like Ysleta often miss out on opportunities because of the lack
of equity afforded by lack of funding. Soto explained:
We have two soccer teams that advanced above our area here. They
went from bi- district, then regional games, and then they were in
the area playoffs for the State 5A tournament. They played in
Coppell. Both our high schools lost one to nothing. The difference
was it was the first time that our kids had ever played on Astroturf.
The question is – Should the state tell us not to spend our money on
Astroturf when our kids need to go and compete against kids that
have it and knowing that on that level of competition, college
scholarships are derived from success in those kinds of
competitions. Where is the equity in that? When we talk about

101
access and equity issues for children across Texas, you are talking
about facilities.
Pride
Trujillo explained that when he started his renovation plan “some of the
bathrooms, the stench was unbelievable and the cafeterias, totally inadequate.
They were unsafe, basically. They were unsafe. The libraries were a joke. There
were a couple of classrooms with the wall knocked out between them and nothing
there at all.” Placed in the hands of people that cared. The workers began to breath
life into the buildings again. Trujillo explained:
The workers set up an assembly line and actually crafted brand new
window frames, unbelievable, that matched these 40-year-old
window frames and they redid the windowpanes. In the 30s and
40s they were artisans in many ways. They weren’t just slapping
up buildings. They were artisans. We had been paying these
people and getting nothing. Now we are getting tremendous
productivity out of them. So, anyway, that was the breakthrough.
The old libraries that in 1994 were just a couple of classrooms
slapped together became a wonderland for children. The guy found

102
a sailboat. He built the library around it. The children go into the
sailboat for their reading. He did the same thing with a fire engine.
It’s gorgeous. They are beautiful. He built not just schools, but
beautiful schools.
One of Trujillo’s theories was that greed and envy were terrific motivators.
He would take the principals around the district in busses and show them the new
construction. Trujillo said, “So I would take them to these wonderful construction
projects. They would see these and say, “I want that.”
Accountability
Determination
Trujillo believes in accountability. They conducted a survey and made lists
of their needs. Trujillo explained, “We gained credibility about a couple of things-
-number one, excellence. It wasn’t just good enough to have a standard building.
That building needed to have a tremendous amount of beauty and functionality. It
had to be comfortable and conducive to learning. Secondly, we had to accomplish
our task.” He was determined to set high standards in every area and to assure his
constituents that each and every child deserved the best. He said, “We were not
going to stand for the have and the have-not kind of system. We were doing away
with the have and the have not.”
103
Symbolic Trust
There had been problems in the district with construction before Trujillo
joined Ysleta. As a result, there was a very low trust level between taxpayers and
the district. Trujillo felt certain that a bond election would not pass. Instead, he
and the chairman of the Board devised the pay as you go plan. There was also a
lack of trust by the employees of the school. Their work was not respected and
their opinion was seldom requested. All this changed with Trujillo’s arrival. Soto
said,
The third leg of the stool is the psychology of the workforce. We
have to give them the same discretion as the wealthy districts. I
hold them accountable to performance standards but I don’t tie their
hands. You have to make sure that you are building a system that
nurtures leadership at all levels. That means they should be able to
make the same kind of building decisions as the leaders in Alamo
Heights or Highland Park.
Economic Value
For all his wheeling and dealing, Trujillo was a man that knew how to get
value for his district’s money. Trujillo explained:

104
We had one school that was going to be gutted and redone and I
think the budget for it was $2 million and it came in at about $3.5
million. I called the architect and said, “You knew what the budget
was, you’re the professional, you will redesign this school and get it
under budget.” And he did at his own expense.
He was also careful not to fall into the trap of less than desirable work all in the
name of the lowest bid. Trujillo explained:
There is a problem with low bid versus best value or total cost of
ownership. You know, what it’s going to cost me ten or fifteen
years out in maintenance. We can’t always take the approach of
which is total cost of ownership less value which may cost you
more money up front. You need to be doing the risk benefit
analysis of both to determine that.
Trujillo knew how to get the best value for the dollar. He managed to keep
the district’s costs well under what the state was willing to pay, and by keeping his
costs down, he was able to pay his employees more.
Politics
It is impossible to discuss Ysleta’s building program without noting, as
Trujillo puts it, “the running battle and hostility between architects and the
105
contractors of this town because we were doing so much of it ourselves and
because we were requiring real accountability.” For whatever reason, Trujillo was
unable to meet local contractors halfway and they likewise refused. In the end,
this battle dismantled the superintendent.
Today Ysleta continues to complain about equity and access issues.
Because Ysleta is a property poor district it must rely on the state for the majority
of their funding. Since the state’s money comes with barriers, Ysleta is unable to
accomplish all the district feels it needs and it points to other more wealthy
districts. Trujillo said:
They have more flexibility in terms of what protocol they have to
meet because they can do it totally on their own revenue stream. So
whatever protocol of fiduciary responsibility is totally up to them
after they meet the minimum issuance of bonds or if they are going
to use the money on a community vote approach. They really have
lots of latitude.
Ysleta on the other hand, must follow narrowly defined definitions of
instruction and need. The district believes this difference is at the heart of the
state’s funding inequity.

106
Pride
Ysleta is a very proud district. They have maintained their dedication to
accountability and yet are still site base managed. Soto said, “We have a 24-hour
rule for graffiti. If it goes up, in 24 hours it is off.” Trujillo’s style of leadership
has contributed to their success. By allowing administrators, teachers and students
to be decision makers, they continue without him. To their credit, academic
success is just as important in 2001 as it was during Trujillo’s superintendency.
Survey and TAAS Results
The Survey
Thirty-three surveys were sent to a random sampling of high schools,
middle schools and elementary schools in the Ysleta Independent School District.
Twenty-nine of the 33 principals returned them. The survey consisted of 44
questions. The first question solicited information concerning the population of
the school’s neighborhood. The principals were asked to check all the categories
that applied. Questions 2-17 consisted of inquiries concerning the structure of the
school. Questions 18-28 pertained to school maintenance and questions 29-38
concerned housekeeping. Question 39 asked the respondent to indicate whether
the shareholders in the school generally believe that the conditions and availability
of educational facilities can affect the level of academic performance. Question 40

107
asked the principals to rank the current conditions and availability of educational
facilities. Questions 41-42 requested specific square footage and acreage
information. Question 43 asked the principal to comment on a possible
relationship between the building’s condition and student achievement, and
question 44 asked for any further information the principal wanted to share with
the researcher regarding the school’s physical environment.
Survey Responses
Ysleta uses a model of site-based management in which principals are the
chief decision makers on each campus. For this study, the principals were asked to
respond to each question based on their own professional opinion as the building’s
chief administrator. Their responses are summarized in the following three
sections.
Section I:
Questions Related to Demographics and School Structure
Demographics
Twenty Ysleta ISD schools were sent a survey. Of those who responded,
approximately 17 percent of the neighborhoods for which the student populations
are drawn contain a significant portion of older families without children

108
(Senior/Empty Nest), are highly mobile families or are middle class families.
Twenty-four percent of the neighborhoods contained single families or families
living in suburban communities. A significant portion or about 31 percent of the
neighborhoods contains a population that mimics the diversity within the city
(normal mix) or is multi-family homes. About 21 percent of the neighborhoods
contain stable residents as opposed to seven percent of neighborhoods that contain
a significant portion of residents in transition. Twenty-seven percent of the
neighborhoods contained single people with only three percent living in new
subdivisions. About 52 percent of the neighborhoods contained a significant
portion of urban families and about 45 percent of the neighborhoods contain a
significant portion of older homes. Only about seven percent of the neighborhoods
contained a significant portion of wealthy families and about 48 percent of the
neighborhoods are predominately mixed income families. By far the largest group
represented within neighborhoods was the group described as poor. About s79
percent of the neighborhoods contained poor families.

109
Table 1: Neighborhood Demographics
N-yes percent-yesSeniors/Empty Nest 5 17.2Normal Mix 9 31.0Rural 0 0.0Stable 6 20.7In transition 2 6.8New subdivision 1 3.4Singles 8 27.6Multi-family 9 31.0Poor 23 79.3Wealthy 2 6.8Urban 15 51.7Suburban 7 24.1Highly Mobile 5 17.2Re-developing 1 3.4Older Neighborhood 13 44.8Single Family 7 24.1Middle-class 5 17.2Mixed Income 14 48.3
Age of Facility
Principals were asked to give their best estimate of the time period during
which most of the space used by students was built. The buildings ranged from
fairly new facilities to two 60-year-old complexes, with a mean facility age of 37
years. An analysis of the results is located in Table 2.

110
Table 2: Facility Age in Years
N percent
60 years old or older 2 06.9050-59 years old 1 03.4540-49 years old 9 31.0330-39 years old 8 27.5920-29 years old 5 17.2410-19 years old 2 06.90Under 10 years old 2 06.90
Total 29 100.0
• “N” represents the number of schools choosing this answer
• “percent” represents the percent of schools choosing this answer
Windows
Principals were asked whether there are windows in each instructional
classroom. Seventy-two percent of the principals who responded indicated that at
least three-fourths of the instructional space has windows. An analysis of the
results is located in Table 3.

111
Table 3: Windows in Each Classroom
N percentLess than 1/4 of instructional space 3 10.34At least 1/4 but less than 3/4 of instructional space 5 17.24At least 3/4 of the instructional space 21 72.42Total 29 100.00_
• “N” represents the number of schools choosing this answer
• “percent” represents the percent of schools choosing this answer
HVAC System
Principals were asked if the HVAC air system provides clean quality air.
Twenty-two of the principals who responded indicated that the HVAC system on
their campus provides clean air. Seven or 24 percent of the principals indicated
that the system does not provide clean air. An analysis of the results is located in
Table 4.
Table 4: HVAC System
N percentYes 22 75.86No 7 24.14
Total 29 100.00 • “N” represents the number of schools choosing this answer
• “percent” represents the percent of schools choosing this answer

112
Air Conditioning
The principals were asked if the instructional areas are air-conditioned. All
the respondents reported that their instructional facilities are air-conditioned. A
summary of their responses is in Table 5.
Table 5: Air Conditioning
N percentYes 29 100.00No 0 00.00
Total 29 100.00 • “N” represents the number of schools choosing this answer
• “percent” represents the percent of schools choosing this answer
Two principals offered additional comments. One principal pointed out that
the air conditioners were “often non-functional.” And the other principal indicated
that his building uses evaporated coolers for some areas and that “several
classrooms share one unit.”
Heat Control
The principals were asked if the majority of classrooms have individual
heat control. The majority or approximately 69 percent of the principals
responded that their schools’ classrooms have individual heat controls. Another

113
thirty-one percent of the principals who responded indicated that the classrooms do
not have individual controls. Their responses are recorded in Table 6.
Table 6: Heat Control
N percentYes 20 69.97No 9 31.03
Total 29 100.00 • “N” represents the number of schools choosing this answer
• “percent” represents the percent of schools choosing this answer
Three principals made additional clarifying comments. The first voiced his
frustration that the heaters “often do not work.” Another principal noted that the
classrooms do not have individual controls and the last principal explained,
“Sometimes the controls don’t work. For example a given classroom might be
extremely hot in wintertime.”
Flooring of Instructional Spaces
Principals were asked what kind of flooring is found in the majority of the
instructional spaces. Of those that responded, over 89 percent of the buildings
have tile or terrazzo floors and only three schools or a little over ten percent of the
schools have carpet. The principals’ responses are recorded in Table 7.

114
Table 7: Flooring of Instructional Spaces
N percentWood Floors 0 00.00Tile or Terrazzo 26 89.66Carpet 3 10.34
Total 29 100.00 • “N” represents the number of schools choosing this answer
• “percent” represents the percent of schools choosing this answer
Interior Ceilings
The principals were asked what type of material is used for the interior
ceilings. Twenty-three of the principals, 79 percent, indicated that acoustical tile is
used throughout their instructional areas. Four, 25 percent, indicated that the
ceiling is a combination of plaster and acoustical tile. A summary of responses is
shown in Table 8.
Table 8: Interior Ceilings
NpercentWood or open beam 0 00.00Plaster or acoustical in at least 3/4 of instructional space 6 20.69Acoustical tile throughout the instructional space 23 79.31Total 29 100.00
• “N” represents the number of schools choosing this answer
• “percent” represents the percent of schools choosing this answer

115
Type of Lighting
The principals were asked what type of lighting is used in the majority of
the instructional areas. Generally schools use incandescent and fluorescent
lighting. Approximately 82 percent of the principals reported that their school
uses fluorescent lighting in instructional area. Only five principals reported that
the lighting is incandescent. A summary of these results is in Table 9.
Table 9: Type of Lighting
N percentIncandescent 5 17.24Fluorescent 24 82.76
Total 29 100.00__ • “N” represents the number of schools choosing this answer
• “percent” represents the percent of schools choosing this answer
Adequate Lighting
The principals were asked if the lighting in the classrooms is adequate.
Not only is it important that the lighting in classrooms is economical, it must be
adequate. Over 96 percent of the principals responded that their school’s
instructional lighting is adequate. Responses are summarized in Table 10.

116
Table 10: Adequate Lighting
N percentYes 28 96.55No 1 03.45
Total 29 100.00__ • “N” represents the number of schools choosing this answer
• “percent” represents the percent of schools choosing this answer
Wall Color
Question 11 asked the principals to indicate the wall color in the
instructional areas. Their choices ranged from dark colors to white. Principals in
twenty schools, 68 percent, reported that the walls in the instructional areas of their
schools are white, while nine principals reported that the instructional areas are
pastel. No principals indicated that the colors of their instructional areas are dark
colors. Responses are summarized in Table 11.
Table 11: Wall Color
N percentDark colors 0 00.00White 20 68.97Pastel colors 9 31.03Does not apply 0 00.00
Total 29 100.00__ • “N” represents the number of schools choosing this answer
• “percent” represents the percent of schools choosing this answer

117
Condition of Classroom Furniture
Principals were asked to indicate the condition of the classroom furniture.
The majority, sixty-two percent, of the principals responding indicated that the
condition of their school’s classroom furniture was functionally sound. Nine
principals or thirty-one percent indicated there are minor scars in the furniture.
Two principals reported that the furniture was scared and damaged. A summary of
the responses is in Table 12.
Table 12: Furniture Condition
NpercentMost scared and damaged 2 6.90At least half minor scars but furniture looks good 9 31.03All classrooms furniture functionally sound 18 62.07
Total 29 100.00_ • “N” represents the number of schools choosing this answer
• “percent” represents the percent of schools choosing this answer
Utilities and Equipment in Science Room
The principals were asked to indicate which utilities or equipment are
available and in usable condition in the science labs. Respondents were asked to

118
circle all choices that applied. There were three schools, about ten percent, that do
not have science labs. Responses are summarized in Table 13.
Table 13: Science Utilities and Equipment
N-yes percent-yesGas 12 41.38Water 20 68.97Sinks 20 68.97Electricity 22 75.86No lab 3 10.34
Total 29 __ • “N” represents the number of schools choosing this answer
• “percent” represents the percent of schools choosing this answer
Several principals offered additional comments. One principal explained
that the sinks do not work in the science lab. Another explained that the science
lab had “one sink and one water faucet” and the last principal that wrote a
comment reported that the building has a new science lab since the science lab was
renovated three years ago.
Update Equipment to Science Standards
The principals were asked to indicate how long ago the science equipment
was updated to current standards. Their responses range from eight principals with

119
updates over ten years ago, to six principals who indicated their science equipment
is not updated. Three schools have no science labs to update. Responses are
summarized in Table 14.
Table 14: Science Equipment Updated
NpercentOver ten years ago 8 30.77Between 5 and 10 years ago 7 26.93Less than 5 years ago or building is less than 5 years old 5 19.23It has not been updated 6 23.77Total 26 100.00
• “N” represents the number of schools choosing this answer
• “percent” represents the percent of schools choosing this answer
• 3 missing
When asked for additional comments, three principals reported poor or
non-working science equipment and one responded, “We just opened the science
lab with limited money from our regular budget.”
Classroom Availability
The principals were asked whether there are enough classrooms to
accommodate the existing educational program in the building. Fifty-eight percent

120
of the principals reported that their school has enough classrooms and 41 percent
said they do not. Responses are summarized in Table 15.
Table 15: Classroom Availability
N percentYes 17 58.62
No 12 41.38
Total 29 100.00__
• “N” represents the number of schools choosing this answer
• “percent” represents the percent of schools choosing this answer
One principal offered an additional comment stating, “Within the last two
years we have been experiencing a significant student increase due to our housing
development.”
Portable Buildings
The principals were asked if their building relies on portable buildings for
instructional areas. The Ysleta Independent School District is working to reduce
the number of portable buildings within the district. At this time almost 66 percent
of the respondents indicate that their instructional area relies on portable buildings.
A summary of their responses is in Table 16.

121
Table 16: Portable Buildings
N percentYes 19 65.52
No 10 34.48
Total 29 100.00
• “N” represents the number of schools choosing this answer
• “percent” represents the percent of schools choosing this answer
Of the 19 principals who currently have portable buildings on their
campus, seven offered additional information. Two principals have two portable
buildings, another principal reported four portable buildings, a principal reported
five portable buildings, a principal responded, “We have six portable classrooms.”
One principal has 19 portables and still another reports, “I’ll be probably
requesting an additional two to four portables this coming school year.”
Noisy Environment
The principals were asked if the building was located near a busy highway,
a frequently used rail line, an area where aircraft frequently pass overhead, or any
other loud noise-producing environment. If the school was located in these areas,
the principal was asked to determine to what extent measures have been taken to

122
reduce the noise. Sixty-five percent of the principals reported that their school is
not in an area of excessive noise. Approximately 21 percent of the principals
reported that their campus is in a noisy area and that no measures have been taken
to reduce the level of noise. Four principals reported that their school is located in
a noisy environment but measures have been taken to reduce the noise. The
majority of the principals, 65 percent, indicate that noise was not a problem. The
respondents’ notations are summarized in Table 17.
Table 17: Noisy Environment
NpercentYes, and no measures have been taken to
reduce the level of noise 6 20.69Yes, but measures have been taken to
reduce the level of noise 4 13.79No 19 65.52
Total 29 100.00 • “N” represents the number of schools choosing this answer
• “percent” represents the percent of schools choosing this answer
Two principals made additional comments. One principal said, “Our
school is close to a major highway but the traffic noise does not reach the
building.” Another principal offered information concerning highway noise, “The
building is far enough from the highway so that noise is not a factor.”

123
Section II: Questions Related to School Maintenance
Condition of School Grounds
The principals were asked to indicate the condition of the school grounds.
Eight years ago Ysleta ISD placed landscaping as a top priority. Ninety-five
percent of the principals responding to this survey indicate that their campus has
landscaping. Responses are summarized in Table 18.
Table 18: Condition of School Grounds.
NpercentNo landscaping and sidewalks damaged 1 03.45
Landscaping and sidewalks present and in good repair 13 44.83
Landscaping and other outside facilities attractive 15 51.72
Total 29 100.00
• “N” represents the number of schools choosing this answer
• “percent” represents the percent of schools choosing this answer
Although all the principals indicated that the sidewalks and grounds were
in good repair. Three principals recorded additional comments. One principal
said, “Sidewalks in good repair – landscaping is minimal.” Another principal
responded, “Needs improvements – We need more help from our district grounds

124
department.” The third principal said, “Front of school is somewhat attractive.
Playground area needs to be upgraded.”
Condition of Lockers
The principals were asked to indicate the condition of the lockers.
Approximately 35 percent of the principals responding are at schools that do not
use the lockers. Of the remaining principals, there was considerable variance in
their answers. Responses to this question are summarized in Table 19.
Table 19: Condition of Lockers
NpercentMost are not functional 1 03.57At least 3/4 of lockers are functional 8 28.57Over 3/4 of the lockers are functional 9 32.14Does not apply 10 35.721 missing
Total 28 100.00_ • “N” represents the number of schools choosing this answer
• “percent” represents the percent of schools choosing this answer
Windows Operational
The principals were asked if the windows in the instructional areas are
operational. Approximately 82 percent of the respondents indicated that the

125
windows are operational with almost 17 percent indicating that the windows are
not operational. A summary of their responses is in Table 20.
Table 20: Windows Operational
N percentYes 24 82.76
No 5 17.24
Does not apply 0 00.00
Total 29 100.00_
• “N” represents the number of schools choosing this answer
• “percent” represents the percent of schools choosing this answer
Floors Maintained
Question 21 asked the principals to indicate if the flooring is maintained in
good condition. One hundred percent of the principals who responded to the
survey indicate that the floors are in good condition. Responses are summarized in
Table 21.

126
Table 21: Floors Maintained
N percentYes 29 100.00
No 0 00.00
Total 29 100.00
• “N” represents the number of schools choosing this answer
• “percent” represents the percent of schools choosing this answer
Ceiling Tiles
The principal was asked if the ceiling tiles in the ceilings are clean and
without stains. Of the principals who responded, 79 percent indicated that the
ceiling tiles are clean and without stains. The principals’ responses are
summarized in Table 22.
Table 22: Ceiling Tiles
N percentYes 23 79.31
No 6 20.69
Total 29 100.00
• “N” represents the number of schools choosing this answer
• “percent” represents the percent of schools choosing this answer

127
Interior Walls Painted
Question 23 asked the principals to record the last time the interior walls,
including classroom spaces were painted. Over 79 percent said their building has
been painted within the last eight years. Responses are summarized in Table 23.
Table 23: Interior Walls Painted
N percentOver 15 years ago 2 06.90
Between 8 and 15 years ago 4 13.79
Less than 8 years ago 23 79.31
Total 29 100.00
• “N” represents the number of schools choosing this answer
• “percent” represents the percent of schools choosing this answer
Four principals made additional comments. One said, “Last summer was
the first time the school cafeteria was painted.” Another principal added, “Some
classes have not been painted for 10 or more years.”The third principal indicated
that work was competed this summer, “We painted one hall per summer. This
summer we took turns to paint one hall consisting of 15 classrooms. We are now

128
complete.” The fourth principal adding comments said, “Painted as needed –
ongoing.”
Exterior Walls Painted
Question 24 requested the principals to state when the last time the exterior
walls, or windows and trim were painted. About 24 percent of the principals report
that the exterior of their building was painted more than seven years ago and a
little over 62 percent report that their building was painted less than four years ago.
The mean was at approximately 4.62 years ago since the exterior walls were
painted. Responses are recorded in Table 24.
Table 24: Exterior Walls Painted
N percentOver 7 years ago 7 24.14
Between 4 and 7 years ago 4 13.79
Less than 4 years ago 18 62.07
Total 29 100.00
• “N” represents the number of schools choosing this answer
• “percent” represents the percent of schools choosing this answer

129
Roof Leaks
The principals were asked if there were any visible signs of a leak in the
roof, any developing signs of a few minor leaks, or if the roof was deteriorating
due to major leaks requiring buckets under them. Over 37 percent of those
responding reported no visible signs of a leak or only a few water stains.
Responses are summarized in Table 25
Table 25: Roof Leaks
N percentCeiling deteriorating or water falls require buckets 3 10.34
Ceiling is developing a few stains due to minor leaks 15 51.72
No visible signs, or only a few water stains 11 37.94
Total 29 100.00
• “N” represents the number of schools choosing this answer
• “percent” represents the percent of schools choosing this answer
Adequate Maintenance Staff
The principals were asked if the number of maintenance staff is adequate
for the building. Of the principals responding, approximately 55 percent said the
amount of people in their maintenance staff was adequate. Responses are
summarized in Table 26.

130
Table 26: Adequate Maintenance Staff
N percentYes 16 55.17
No 13 44.83
Total 29 100.00__
• “N” represents the number of schools choosing this answer
• “percent” represents the percent of schools choosing this answer
Thirteen of the 29 principals indicated that they did not have adequate
maintenance staff and made additional comments. The first said, “Inside – yes;
grounds – no.” The second said, “Always short of plumbers” and the third
principal added, “Need 16 but have only 13 staff.”
Maintenance Requests
The principal was asked if maintenance requests are completed in a timely
manner. Seventy-two percent of the principals responding to the survey indicate
that maintenance referrals are completed in a timely manner. Eight principals
indicated that the requests are not completed in a timely manner. The results of
the principals’ responses are summarized in Table 27.

131
Table 27: Maintenance Requests
N percentYes 21 72.41
No 8 27.59
Total 29 100.00_
• “N” represents the number of schools choosing this answer
• “percent” represents the percent of schools choosing this answer
Overall Structural Condition.
The principals were asked to indicate the overall condition of the facilities
structure. This includes the condition of the grounds, the condition of the floors,
ceiling tiles and windows, the appearance of the walls, and the condition of the
roof. About 72 percent of the schools studied rated their building as standard.
One school was rated below standard, and seven, or 24 percent, rated their school
above standard. Responses are recorded in Table 28.

132
Table 28: Overall Structural Condition
N percentBelow standard 1 03.45
Standard 21 72.41
Above Standard 7 24.14
Total 29 100.00_
• “N” represents the number of schools choosing this answer
• “percent” represents the percent of schools choosing this answer
Section III: Questions Concerning Housekeeping
Frequency Floors Swept or Vacuumed
The principals were asked how often the instructional area floors are swept
or vacuumed. Of the principals responding, over 89 percent said that the floors in
their school facility are swept or vacuumed daily. Responses are summarized in
Table 29.
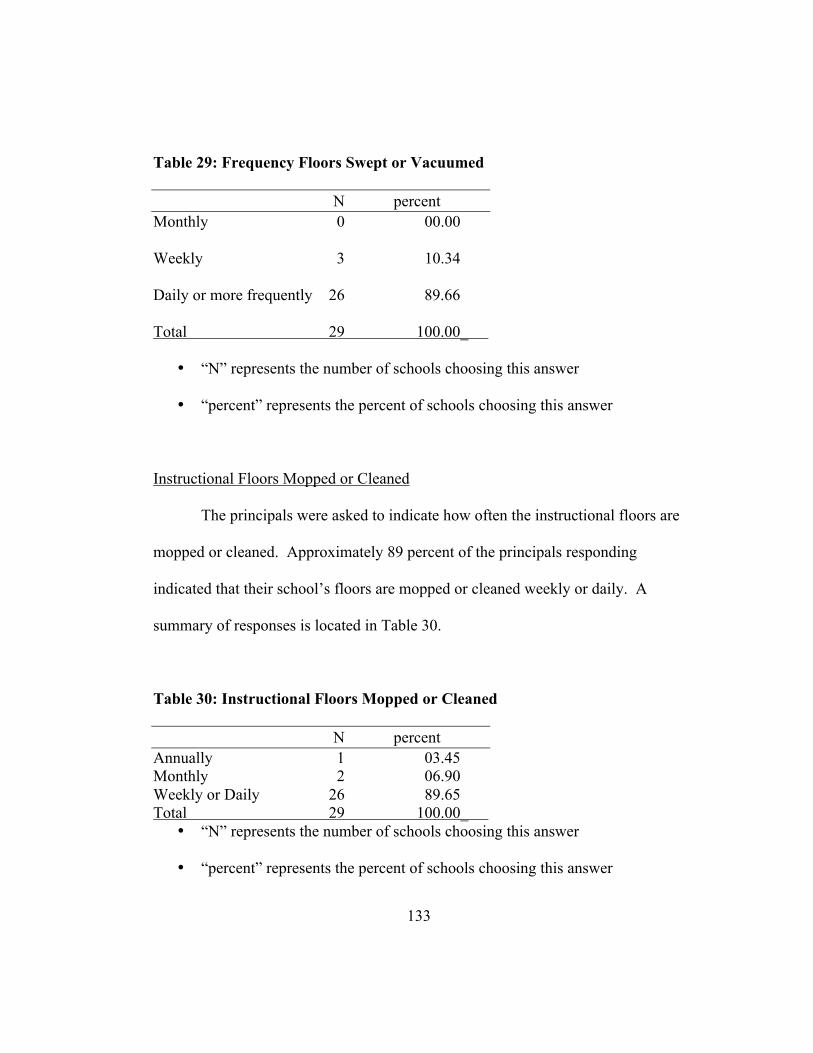
133
Table 29: Frequency Floors Swept or Vacuumed
N percentMonthly 0 00.00
Weekly 3 10.34
Daily or more frequently 26 89.66
Total 29 100.00_
• “N” represents the number of schools choosing this answer
• “percent” represents the percent of schools choosing this answer
Instructional Floors Mopped or Cleaned
The principals were asked to indicate how often the instructional floors are
mopped or cleaned. Approximately 89 percent of the principals responding
indicated that their school’s floors are mopped or cleaned weekly or daily. A
summary of responses is located in Table 30.
Table 30: Instructional Floors Mopped or Cleaned
N percentAnnually 1 03.45Monthly 2 06.90Weekly or Daily 26 89.65Total 29 100.00_
• “N” represents the number of schools choosing this answer
• “percent” represents the percent of schools choosing this answer
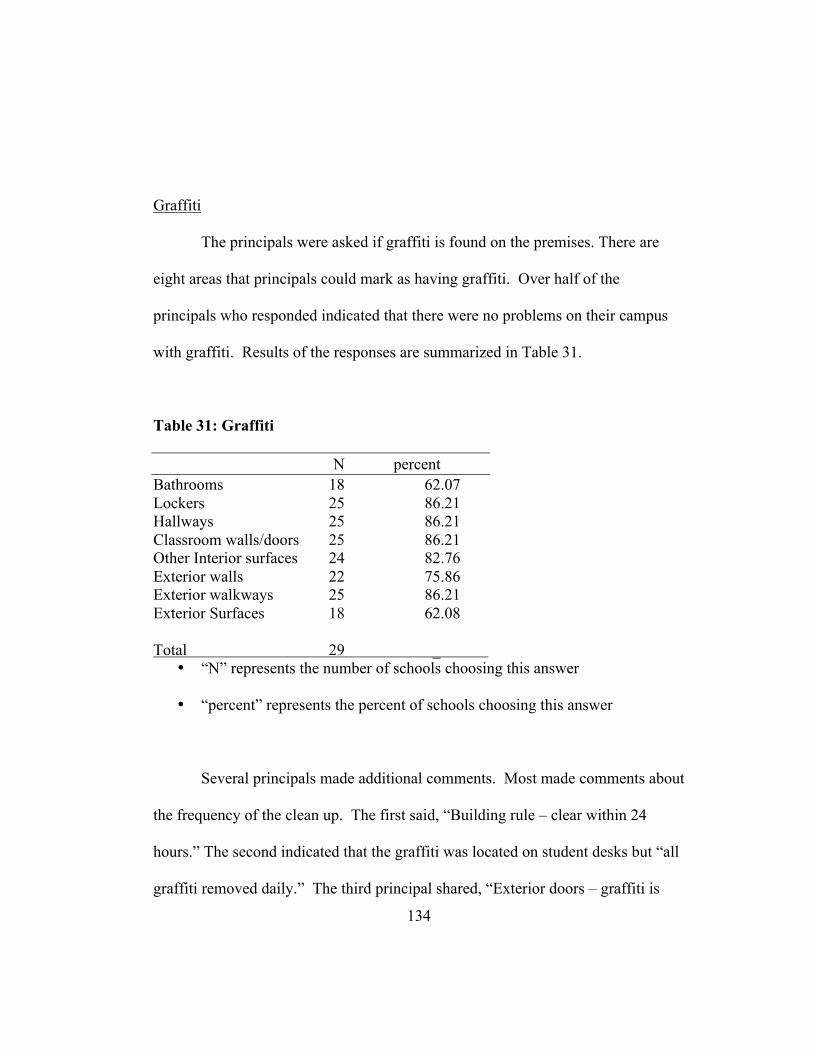
134
Graffiti
The principals were asked if graffiti is found on the premises. There are
eight areas that principals could mark as having graffiti. Over half of the
principals who responded indicated that there were no problems on their campus
with graffiti. Results of the responses are summarized in Table 31.
Table 31: Graffiti
N percentBathrooms 18 62.07Lockers 25 86.21Hallways 25 86.21Classroom walls/doors 25 86.21Other Interior surfaces 24 82.76Exterior walls 22 75.86Exterior walkways 25 86.21Exterior Surfaces 18 62.08
Total 29 _ • “N” represents the number of schools choosing this answer
• “percent” represents the percent of schools choosing this answer
Several principals made additional comments. Most made comments about
the frequency of the clean up. The first said, “Building rule – clear within 24
hours.” The second indicated that the graffiti was located on student desks but “all
graffiti removed daily.” The third principal shared, “Exterior doors – graffiti is

135
removed as soon as it is reported.” A fourth principal indicated the graffiti
problem was on the portable buildings but it is removed the same day.
Graffiti Removal
The principals were asked how long graffiti remains before it is removed.
The Ysleta ISD continues efforts to remove graffiti within 24 hours. Of the
principals responding to the survey, one hundred percent indicate that graffiti is
removed in less a week. Responses are summarized in Table 32.
Table 32: Graffiti Removal
NpercentUntil summer maintenance 0 00.00More than a week but less than a month 0 00.00Less than a week 29 100.00Does not apply 0 00.00Total 29 100.00_
• “N” represents the number of schools choosing this answer
• “percent” represents the percent of schools choosing this answer
Condition of the Walls
The principals were asked to indicate if the walls are in the instructional
areas are clean and in good condition. One hundred percent of the principals

136
responding to the survey indicate that the walls are clean and in good condition.
The responses are summarized in Table 33.
Table 33: Condition of the Walls
N percentYes 29 100.00
No 0 00.00
Total 29 100.00
• “N” represents the number of schools choosing this answer
• “percent” represents the percent of schools choosing this answer
Appearance of Building and Classrooms is Adequate
The principals were asked if the general appearance of the building and
classrooms is adequate. Of the principals who responded to the survey, only one
principal indicated that the general appearance of the building and classrooms is
less than adequate. The results are summarized in Table 34.

137
Table 34: Appearance of Building and Classrooms Is Adequate
N percentYes 28 96.55
No 1 03.45
Total 29 100.00_
• “N” represents the number of schools choosing this answer
• “percent” represents the percent of schools choosing this answer
Hallways Kept Clean
The principals were asked to indicate if the hallways are kept clean during
the day. Of the principals who responded 100 percent indicated that the hallways
are kept clean. The results of the responses are recorded in Table 35.
Table 35: Hallways Kept Clean
N percentYes 29 100.00
No 0 00.00
Total 29 100.00_
• “N” represents the number of schools choosing this answer
• “percent” represents the percent of schools choosing this answer

138
One principal was proud to offer, “Our custodial personnel do an
extraordinary job taking into consideration the size of the school and the limited
custodial personnel we have.”
Does School Smell Good
One hundred percent of the principals who responded to this survey
indicated that the smell in their school was generally good. The results of their
responses are recorded in Table 36.
Table 36: Does School Smell Good
N percentYes 27 93.10
No 2 06.90
Total 29 100.00_
• “N” represents the number of schools choosing this answer
• “percent” represents the percent of schools choosing this answer
Only one principal offered an additional comment. The principal wrote,
“Close to Mexico border raw sewage smell from time to time.”

139
Is Housekeeping Staff Adequate
The principals were asked if the housekeeping staff during the day is
adequate. While approximately 79 percent of the principals responding to the
survey indicate that the staff on their campus is adequate, six principals indicated
that the staff was not adequate. The principals’ responses are summarized in Table
37.
Table 37: Is Housekeeping Staff Adequate
N percentYes 23 79.31
No 6 20.69
Total 29 100.00_
• “N” represents the number of schools choosing this answer
• “percent” represents the percent of schools choosing this answer
Two principals made additional comments. The first was a note of
celebration. The principal wrote, “They are well trained and have all the supplies.”
The second principal shared a concern. The principal responded, “I need custodial
personnel (more students) demand more quality of services. We grew 150-170
more students and the number of custodial personnel is the same.”

140
Overall Cosmetic Condition of Facility
The principals were asked to indicate the overall cosmetic condition of the
facility. Close to 62 percent of the principals responding ranked their school
facility below standard concerning the overall cosmetic condition. Ten principals,
or 34 percent, ranked the cosmetic condition of their school facility as standard.
The results of the principals’ responses are summarized in Table 38.
Table 38: Overall Cosmetic Condition of Facility
N percentBelow standard 18 62.07
Standard 10 34.48
Above standard 1 03.45
Total 29 100.00_
• “N” represents the number of schools choosing this answer
• “percent” represents the percent of schools choosing this answer
Two principals shared comments. The first one had a concern. The
principal said, “My school is one of the oldest schools in the district and major
remodeling has not been done.” The second one made a general comment, “It is
high especially if the colors are bright and clean.”

141
Academic Performance Affected by Facilities
The principals were asked if the shareholders of the school generally
believe the conditions and availability of educational facilities affect the level of
academic performance. Over 93 percent of the principals responding to the survey
indicate that the shareholders of their school believe the condition of the school
affects the level of academic performance by their students. Only two principals
were uncertain. A summary of the responses is located in Table 39.
Table 39: Academic Performance Affected by Facilities
N percentAgree 27 93.10
Disagree 0 00.00
Opinion Uncertain 2 06.90
Total 29 100.00_
• “N” represents the number of schools choosing this answer
• “percent” represents the percent of schools choosing this answer
Current Condition of Educational Facility
The principals were asked to indicate if shareholders believe the current
condition of their school campus and the availability of educational facilities are a

142
positive, negative or have no influence on student achievement. Only two
principals indicated a belief that the condition of the school campus and
availability of educational facilities has no influence. The responses are
summarized in Table 40.
Table 40: Current Condition of Educational Facility
N percentPositive 27 93.10
Negative 0 00.00
No Influence 2 06.90
Total 29 100.00_
• “N” represents the number of schools choosing this answer
• “percent” represents the percent of schools choosing this answer
Approximate Square Footage of Facility
The principals were asked to calculate the approximate gross square
footage of the school facility using the building’s rough dimensions. The
buildings ranged from 50,000 square feet to 960,000 square feet. Nineteen of the
facilities ranged between 50,000 and 100,000 square feet. It is unclear as to
whether these figures include the square footage of the portable buildings reported
by 19 out of the 29 principals.
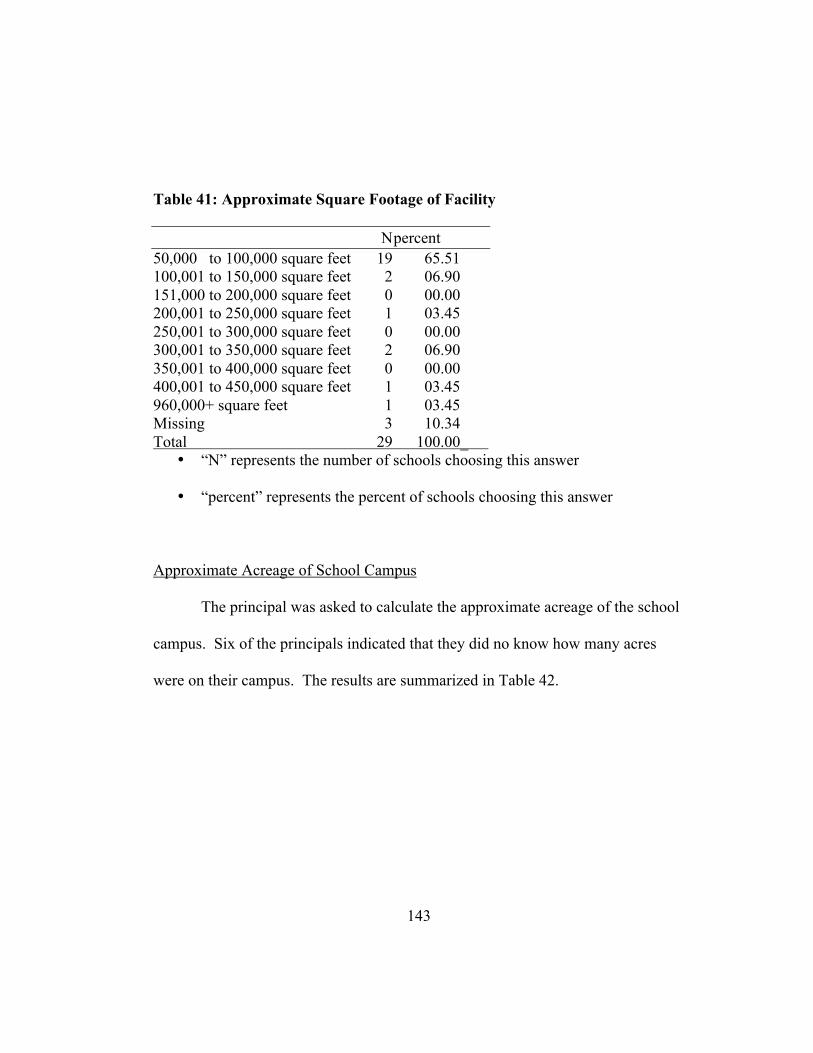
143
Table 41: Approximate Square Footage of Facility
Npercent50,000 to 100,000 square feet 19 65.51100,001 to 150,000 square feet 2 06.90151,000 to 200,000 square feet 0 00.00 200,001 to 250,000 square feet 1 03.45250,001 to 300,000 square feet 0 00.00300,001 to 350,000 square feet 2 06.90350,001 to 400,000 square feet 0 00.00400,001 to 450,000 square feet 1 03.45960,000+ square feet 1 03.45Missing 3 10.34Total 29 100.00_
• “N” represents the number of schools choosing this answer
• “percent” represents the percent of schools choosing this answer
Approximate Acreage of School Campus
The principal was asked to calculate the approximate acreage of the school
campus. Six of the principals indicated that they did no know how many acres
were on their campus. The results are summarized in Table 42.

144
Table 42: Approximate Acreage of School Campus
N percent5 or less acres 7 24.136 to 10 acres 8 27.5911 to 15 acres 2 06.9016 to 20 acres 1 03.4521 to 25 acres 1 03.4526 to 30 acres 0 00.0031 to 35 acres 1 03.4540 to 45 acres 1 06.2545, 46 and 47 2 12.50Missing 6 20.68Total 29 100.00_
• “N” represents the number of schools choosing this answer
• “percent” represents the percent of schools choosing this answer
Additional Comments on Relationship Between Building Conditions and Student
Achievement
Only one principal wrote that in the opinion of this principal the condition
of the building does not impact student achievement. The elementary school
principal wrote, “The building is 30 years old and lacks many current ‘standard’
facilities or features. This condition does not, or at least, has not affected student
performance negatively.” The remainder of the comments made by the principals
pertains to their belief that the condition of their school does make a difference in
student achievement. One principal wrote, “Students feel important when the

145
school is kept clean and well maintained.” Another principal wrote, “Students
take pride in their school when it is well maintained.”
Still other principals indicated that the condition of their school campus
does make a difference. One principal wrote, “The more appropriate the
building’s physical condition the more probability of student progress and/or
success.” Another principal wrote a short note, “Definite correlation.” Still
another principal believes the building impacts both teaching and learning and
said, “The conditions of a building certainly impacts teaching and learning
positively or negatively.” Of course, some principals feel more strongly about a
connection than others. One principal said, “Building and grounds conditions
definitely have an impact or influence on student achievement and expectations.”
Finally, a principal indicated that the condition of a building could negatively
impact student achievement by saying, “I believe that facilities that are unclean
and in poor repair do have a negative impact on student achievement.”
Additional Comments
Only one principal made an additional comment. It was the same principal
that stated the age of the campus did not have an effect on student achievement at
his campus. The principal commented, “This survey equates cleanliness and
minor maintenance with student performance, not to what I would term the
“condition” of the building. If you were asking whether cleanliness and minor

146
upkeep by the campus custodians is related to student performance, then I would
agree.”
Variable Description and Criteria
A complete description of all variables with their code names is located in
Appendix 1. Table 43 contains the variable descriptions and criteria used in the
multiple regression trials.
Table 43: Variable Descriptions and Criteria
Variable Mean Std Dev Min Max N Label
MAINTEN 2.25 .45 1.00 2.50 29
CLEAN 2.27 .17 1.75 2.50 29
COSMETIC 2.33 .49 2.00 3.00 29
STRUCTUR 2.33 .49 2.00 3.00 29
BUILD_AG 4.20 1.42 1.00 7.00 29
TAAS_DIS 84.55 5.22 70.20 90.30 29
TAAS_MEX 84.40 4.86 74.90 91.30 29
TAAS_ALL 84.88 5.17 74.90 90.90 29
TAAS_BLK 86.08 7.43 72.70 95.70 14
TAAS_WHT 90.05 9.98 64.30 100.00 23
DISADVAN 624.10 319.96 318.00 1806.00 29
SCH_SIZE 928.05 643.47 387.00 2624.00 29

147
Predictors and Criterion Variables
The schools had an average of 928 students (SD = 643.47), of which
624.00 (SD=319.96) were disadvantaged. Overall cleanliness was calculated by
averaging four items: are the walls clean (clean33), is the building’s appearance
adequate (appear 34), are the halls clean (hall35), and does the building smell
clean (smell36). Overall maintenance was calculated by averaging two items:
number of staff adequate (staff26) and work completed in a timely manner
(mtreq27.) In terms of the independent variables (i.e., predictors), the average
building age, overall cleanliness, overall structure, overall cosmetic, school size,
and overall maintenance were categorized as “standard.” Table 44 shows the
dependent variables (i.e., criterion), the TAAS scores, means, standard deviations,
minimum and maximum, and frequency by race.

148
Table 44: TAAS Scores Means, Standard Deviations, Minimum and
Maximum, and Frequency By Race.
Race Mean Std Dev Min Max n
All 84.88 5.17 74.90 91.60 29
Black 86.08 7.43 72.70 95.70 14
Disadvantaged 84.55 5.22 70.20 90.30 29
Mexican 84.40 4.86 74.90 91.30 29
White 90.05 9.98 64.30 100.00 23
“Min” represents the minimum percent of students passing All TAAS tests
from a particular school in 2001
“Max” represents the maximum percent of students passing All TAAS tests
from a particular school in 2001
“N” represents the number of schools answering the survey that reported
students of this race.
149
Regressions Equations
The term multiple regression was first used by Karl Pearson in 1908 and is
an extension of his work with statistical relationships (Pearson, 1938). The
purpose of multiple regression is to learn more about the relationship between
several independent or predictor variables and a dependent or criterion variable.
Multiple regression procedures are widely used in social and natural science
research. It allows the researcher to investigate the best predictor of an event.
The regression formula is much like the formula for a line, y = mx + b.
The “y” represents the dependent or criterion variable, the “x” represents the
independent variable or predictor variable and the “m” or slope represents the
regression coefficient or beta weights.
The regression coefficients or beta weights represent the independent
contributions of each independent variable in predicting the dependent variable.
The best predictions are made when the variability of the residual value is small
and hovers around the regression line. If there is no relationship between the “x”
or predictor variable and the “y” or criterion variables, then the variance is equal
to 1.0. If the “x” or predictor variable and the “y” or criterion variables are
perfectly related then there is no residual variance and the ratio of variance will be
between 0.0 and 1.0. This ratio is subtracted from 1.0 to determine the R-square or
the coefficient of the determination. This means that if there is an r-square value

150
of .6 then the variability of the Y values is 1.0 – 0.6 times the original variance.
The data has explained 60percent of the original variability and there is a
40percent residual variability. The r-square value is an indicator of how well the
model or trial fits the data. An r-square value close to 1.0 indicates that the data
has accounted for almost all of the variability.
For multiple linear regressions, it is assumed that the relationship between
the variables of interest is linear. In multiple regression, the R can assume values
between 0 and 1. Beta weight is the coefficient in the regression equation that
describes the relationship between the predictor and the criterion. If the B
coefficient is positive, then the relationship is positive, and if the B coefficient is
negative then the relationship is negative. If the B value is zero, there is no
relationship.
Seemingly Unrelated Regression (SUR)
The seemingly unrelated regression method is a special case of generalized
least squares with a residual covariance matrix of a particular structure. The
seemingly unrelated regression (SUR) model was proposed by Arnold Zellnar in
1962. It is a special case of the Aitken estimator. SUR obtains seemingly
unrelated regression estimates of a set of nonlinear equations. Seemingly
unrelated regression estimates are obtained by estimating a set of nonlinear

151
equations with cross-equation constraints imposed, but with a diagonal covariance
matrix of the disturbances across equations. These parameter estimates are used to
form a consistent estimate of the covariance matrix of the disturbances, which is
then used as a weighting matrix when the model is reestimated to obtain new
values of the parameters. These estimates are consistent and asymptotically
normal, and under some conditions, asymptotically more efficient than the single
equation estimates (Zellnar, 1997). This method was helpful because of its
ability to relate data over time.
Building Conditions, Student Subgroups, and TAAS Scores
Six linear multiple regressions were conducted to examine how much
school size (determined by total square feet of facilities), building age (determined
by years of service), overall cleanliness (determined by the principal ranking
custodial ability to keep the campus clean), overall maintenance (determined by
principal ranking the maintenance workers ability to keep the campus repaired),
overall structure (determined by the principal ranking the efficiency and condition
of the building structure), overall cosmetic (determined by the principal ranking
the esthetic quality of the total school facility), and being classified as
disadvantaged (determined by the student’s acceptance into the federal reduced
lunch program) explain TAAS scores for students of different races. All of the

152
predictor variables were put into the regression equation. The degree of freedom
was determined by the total number of observations minus the number of variables
appearing in the model. Only the variables whose beta coefficients significantly
affected the criterion remained in the equation. That is, the r-square or prediction
of the equation did not increase with variables that dropped out of the equation.
The seemingly unrelated regression method was used on the sixth
regression. TAAS results were stacked for each of the eight years by school and
were used as the criterion. Eight years of data for building age and population size
was stacked and used as the predictors. SUR analyzed the least squares and the
generalized least squares estimators jointly for each equation.
First Regression
The first regression used the percent of all students passing the TAAS test
(TAAS All), as the criterion and school size, building age, overall cleanliness,
overall maintenance, overall structure, overall cosmetic, and the number of
students classified as disadvantage as the predictors. In the regression analysis,
Building age explained 42.5percent of the variability in TAAS All scores for all
students. Table 45 shows the Beta weights for Building age was predictive of
TAAS total scores, F (1, 28) = 4.83, p < .05. No other variable entered the
equation.

153
Table 45: Beta Weights, T value, and Probability for T value when TAAS
Total is the Criterion.
Variable Beta T Prob. T
Age 0.42 2.20 .05
Second Regression
A second regression used the percent of students classified as
disadvantaged by the federal reduced lunch program that passed all subsections of
the TAAS test (TAAS Disadvantaged) as the criterion and school size, building
age, overall cleanliness, overall maintenance, overall structure, overall cosmetic,
and number of disadvantaged students as the predictors. In the regression analysis,
building age and maintenance explained 63.0 percent of the variance in TAAS
disadvantaged scores. Table 46 shows the Beta weights for building age and
maintenance were predictive of TAAS disadvantaged scores, F (2, 27) = 6.92,
p < .01. No other variable entered the equation.

154
Table 46: Beta Weights, T value, and Probability for T Value When TAAS
Disadvantaged Students is the Criterion
Variable Beta T Prob. T
Building Age 0.62 3.45 .01
Maintenance -0.42 -2.34 .05
Third Regression
A third regression used the percent of Hispanic students that passed all the
subsections of the TAAS test (TAAS Hispanic), as the criterion and school size,
building age, overall cleanliness, overall maintenance, overall structure, overall
cosmetic, and number of students classified as disadvantaged as the predictors. In
the regression analysis, Building Age explained 46 percent of the variance in
TAAS Hispanic scores. Table 47 shows the Beta weights for Building Age was
predictive of TAAS Hispanic scores, F (1, 28) = 5.84, p < .05. No other variable
entered the equation.

155
Table 47: Beta Weights, T value, and Probability for T Value When TAAS
for Hispanic Students is the Criterion.
Variable Beta T Prob. T
Building Age 0.46 2.42 .05
Fourth Regression
The fourth regression equation used the percent of white students who
passed all the subsections of the TAAS test (TAAS White) as the criterion and
school size, building age, overall cleanliness, overall maintenance, overall
structure, overall cosmetic, and number of students classified as disadvantage as
the predictors. In this regression analysis, cleaning explained 49.8 percent of the
variance in TAAS White scores. Nine of the participating schools had such a low
number of students classified as white that the Texas Education Agency did not
report the passing percentages. Table 48 shows the Beta weights for cleaning was
predictive of TAAS White scores F(1,19) = 5.94, p<.05. No other variable entered
the equation.

156
Table 48: Beta Weights, T value, and Probability for T value when TAAS for
White Students is the Criterion
Variable Beta T Prob. T
Cleaning -0.498 -2.44 .05
Fifth Regression
The fifth regression equation used the percent of black students that passed
all the subsections of the TAAS test (TAAS Black), as the criterion and school
size, building age, overall cleanliness, overall maintenance, overall structure,
overall cosmetic, and number of students classified as disadvantaged as the
predictors. No variable entered the equation and the F could not be calculated.
Change in TAAS Scores Over Time
Ysleta Independent School District educators and the students within the
Ysleta district have made phenomenal improvements in student achievement
during the past eight years. Part of the evidence of this improvement can be seen
in the individual campus’ percentage of students passing all subsections of the
TAAS test and part can be seen in the district’s percent passing scores over the
past eight years.

157
Table 49: TAAS All Tests Taken – All Students – Percent Passing – 1994-2001
School 1994 1995 1996 1997 1998 1999 2000 2001 Change1 22.0 22.6 33.9 47.7 60.6 59.0 80.3 77.7 +55.72 44.5 51.9 55.3 59.9 78.1 78.6 83.3 89.1 +42.63 44.7 59.2 53.3 69.6 72.1 75.5 85.5 88.2 +43.54 34.5 29.8 56.2 62.1 63.8 68.8 75.7 75.6 +41.35 39.4 47.5 62.3 76.6 79.8 80.3 74.0 77.4 +38.06 60.1 61.7 77.9 80.6 88.2 90.8 92.7 89.8 +29.77 38.7 44.5 57.3 69.9 72.7 79.5 81.2 84.9 +46.28 53.3 51.2 60.2 72.1 76.9 79.7 86.1 90.9 +37.69 38.0 34.6 58.4 67.4 80.3 76.8 75.8 82.2 +44.210 45.7 44.1 67.4 71.5 77.9 82.0 85.1 85.7 +40.011 36.3 33.2 56.4 70.6 75.5 80.2 80.8 85.4 +49.112 58.7 68.4 74.5 79.0 90.7 87.7 90.0 86.7 +28.013 51.7 59.2 68.5 81.6 86.3 89.0 93.6 89.9 +38.214 37.3 54.7 61.3 76.5 88.1 86.5 90.3 90.6 +53.315 45.9 55.9 58.5 75.5 80.5 82.7 77.2 76.1 +30.216 29.2 37.1 46.7 60.6 74.3 75.9 77.8 82.0 +52.817 37.8 47.8 68.7 76.0 86.5 83.1 81.3 80.2 +42.418 46.0 58.3 63.7 73.5 78.5 84.4 91.5 82.4 +36.419 41.7 60.6 71.2 82.2 84.9 84.6 87.5 85.2 +43.520 48.4 62.6 75.8 69.8 83.2 78.2 82.7 74.9 +26.521 61.1 77.3 82.4 82.4 93.1 90.3 85.9 86.5 +25.422 51.3 60.1 70.2 79.7 86.9 89.4 87.3 89;7 +38.423 73.2 73.9 83.3 86.8 93.8 89.9 91.3 91.6 +18.424 52.9 47.3 69.5 73.4 83.7 84.9 86.6 88.1 +35.225 42.6 53.3 64.8 77.1 84.2 80.2 83.3 79.1 +36.526 53.9 50.4 66.7 80.1 86.8 84.2 84.9 85.5 +31.627 35.1 40.5 53.7 67.3 75.2 81.8 85.3 88.9 +53.828 53.9 46.1 66.2 71.4 79.8 78.6 70.6 79.3 +25.729 55.7 72.2 77.8 89.0 92.9 91.7 93.4 92.7 +37.0
District Avg. 47.5 54.5 65.4 73.4 80.0 82.1 83.7 84.6 +37.1• Change – Percent of change between 1994 - 2001

158
Table 50: TAAS All Tests Taken – Hispanic Students – Percent Passing
School 1994 1995 1996 1997 1998 1999 2000 2001 Change1 21.0 23.3 33.9 47.4 59.0 58.4 79.3 76.9 +55.92 39.9 45.8 49.7 55.2 74.2 77.3 83.4 87.0 +47.13 37.7 54.7 47.9 64.2 69.2 72.4 85.2 86.6 +48.94 33.7 30.3 55.5 62.7 63.2 68.0 75.5 57.7 +42.05 41.0 48.7 61.4 76.6 79.2 80.8 74.6 77.1 +36.16 51.2 56.5 74.9 78.4 85.6 89.4 91.7 88.4 +37.27 38.3 43.9 56.9 69.6 72.8 79.6 81.4 84.7 +46.48 45.6 44.0 54.8 68.6 73.5 76.8 84.2 89.2 +43.69 36.2 33.5 57.9 66.9 79.9 77.6 75.3 81.8 +45.610 45.6 44.2 67.3 71.4 78.2 82.1 85.1 85.8 +40.211 37.4 33.1 56.2 70.1 74.5 79.9 81.1 84.8 +47.412 58.8 68.1 72.3 78.3 89.4 85.7 89.9 86.3 +27.513 48.6 58.4 65.8 80.3 85.5 88.6 92.4 89.6 +41.014 36.7 55.3 61.7 76.2 87.6 86.0 90.8 91.3 +54.615 45.7 54.3 57.8 75.2 79.3 83.3 76.9 77.0 +31.316 38.5 36.3 46.0 60.5 74.1 75.5 77.3 81.7 +53.217 37.0 47.0 68.1 75.3 86.4 83.4 81.0 80.5 +43.518 46.6 57.1 64.0 72.1 78.2 83.8 92.1 83.7 +37.119 40.1 61.2 70.6 81.8 84.3 84.0 87.2 84.7 +44.620 46.2 64.6 76.7 72.6 85.6 77.5 81.1 74.9 +28.721 50.0 83.3 80.0 80.0 80.0 100.0 80.0 100.0 +50.022 46.8 56.6 68.6 77.3 85.1 88.4 86.6 89.4 +42.623 69.6 70.1 79.7 84.6 92.7 88.5 91.4 90.5 +20.924 49.1 43.5 66.4 71.7 81.9 84.1 87.2 86.7 +37.625 42.5 54.0 64.8 76.9 83.9 80.0 93.2 78.4 +35.926 53.9 50.5 66.2 79.6 86.3 84.3 85.2 84.4 +30.527 34.1 40.4 54.1 66.6 75.1 81.8 84.8 88.5 +54.428 50.9 43.9 65.4 69.9 80.9 77.5 66.9 77.5 +26.629 55.4 71.5 77.6 88.8 92.5 91.8 93.7 92.5 +37.1
District Avg. 44.1 51.8 63.4 71.9 78.6 81.2 82.9 83.9 +39.8• Change – Percent of change between 1994 - 2001

159
Table 51: TAAS All Tests – Economically Disadvantaged - percent Passing
1994-2001
School 1994 1995 1996 1997 1998 1999 2000 2001 Change1 07.4 22.6 33.6 46.0 56.6 58.3 78.4 77.0 +69.62 * 41.0 41.1 50.9 73.4 75.6 78.5 87.6 *3 - 38.5 45.2 55.7 65.2 59.5 82.6 87.0 -4 32.9 28.5 55.6 57.0 57.1 67.5 73.9 74.2 +41.05 37.1 45.6 59.8 74.5 78.1 79.0 73.1 76.9 +39.86 39.7 42.2 63.5 70.4 79.5 85.3 89.1 87.5 +47.87 * 40.4 54.5 68.4 70.5 78.8 79.4 84.6 -8 48.1 46.7 54.4 69.0 74.1 78.0 83.9 90.3 +42.29 26.0 30.9 56.5 63.7 79.0 77.3 73.7 81.1 +55.110 40.7 41.1 65.1 68.0 75.5 80.6 83.5 85.0 +44.311 31.5 30.7 55.4 69.5 74.3 79.5 79.9 84.2 +52.712 54.2 64.7 72.1 77.9 89.1 87.6 88.2 85.3 +31.113 38.7 54.5 62.9 76.8 82.3 87.5 92.7 87.7 +49.014 32.8 52.9 57.5 78.5 88.2 85.4 89.4 89.5 +56.715 45.6 53.7 56.6 71.8 79.1 81.3 73.6 74.4 +28.816 28.3 35.4 46.0 59.3 72.6 75.6 77.8 82.3 +54.017 31.6 47.3 65.4 73.6 86.2 81.8 79.9 81.6 +50.018 48.5 57.1 62.1 73.4 78.0 83.9 91.5 82.0 +33.519 36.1 61.8 72.2 81.3 84.0 82.9 87.0 84.8 +48.720 47.6 61.7 75.0 69.5 82.4 76.7 83.4 76.7 +29.121 59.7 75.0 81.1 79.4 92.3 89.0 85.1 87.1 +27.422 51.6 65.0 71.9 83.3 87.1 83.8 87.3 *23 67.3 65.5 81.4 79.3 92.0 87.9 89.7 91.4 +24.124 44.6 36.2 62.7 64.6 80.4 80.0 85.0 92.5 +47.925 41.7 51.6 65.4 76.2 83.0 79.6 84.0 77.8 +36.126 52.5 48.7 64.9 78.4 84.7 82.4 82.2 83.2 +30.727 33.5 39.7 54.1 67.7 73.9 80.9 84.8 89.5 +56.028 49.3 41.6 63.8 68.7 77.3 77.5 68.2 79.1 +29.429 * 70.0 76.3 87.8 92.6 91.4 93.2 93.1 *
District Avg. 41.7 49.8 61.8 70.3 77.4 80.1 81.8 83.3 +41.6• Change – Percent of change between 1994 – 2001

160
Table 52: Percent of Change in TAAS All scores from 1994 to 2001
0
5
10
15
20
25
30
35
40
45
All Students HispanicStudents
EdconomicallyDisadvantaged
Ysleta
Texas
Sixth Regression – Seemingly Unrelated Regression System (SUR)
A regression model may contain a number of linear equations. A set of
equations that has cross-equation error correlation can be referred to as a
seemingly unrelated regression. Although the equations may seem unrelated, the
equations are related through the correlation in the errors. This regression method
was chosen to compensate for the small data set resulting from this case study.
Eight years of data for each of the twenty-nine schools was “stacked” to provide
sufficient data points enhancing the information content.
The sixth regression used the percent of All Students passing All
Subsections of the TAAS test at each of the twenty-nine campuses for eight years
as the dependent or criteria variables, with school size and building age as the

161
independent or predictor variables. In the regression analysis, building age and
school size explained 4.0 percent of the variance in TAAS scores. Table 53 shows
the Beta weights for Building Age and School Size were predictive of TAAS
scores, F(2,841) = 16.74, p<.0001.
Table 53: Beta Weights, T value, and Probability for T value when TAAS is
the Criterion
Variable Beta T Prob. T
Building Age 0.07 2.00 .05
School Size -0.20 -5.73 .0001
Summary
This chapter reported the results of the research study conducted over a
period of 10 months in Ysleta Independent School District. The study utilized
several lengthy interviews, a questionnaire to principals concerning the condition
of their buildings and student achievement, various district and state document
reviews, on-site field study and a statistical analysis of the survey and student
TAAS test results.
The interviews contributed to the study through the identification of four
major themes, risky decisions, powerful people, buildings make a difference, and

162
accountability. Within the major themes the five sub-themes of determination,
symbolic trust, economic value, politics and pride emerged. The results of the
survey added to the discussion. Principals were asked questions concerning the
structure, maintenance and cosmetic condition of their school facilities and to
speculate as to the possibility of links to student achievement. Finally, the survey
and student TAAS scores were statistically analyzed using multiple regressions.
This mixed method approach provided an in-depth description of one districts
attempt to improve student achievement and school facilities.
This chapter discussed a single case study of the Ysleta Independent
School District and detailed the findings of the interviews, provided descriptive
characteristics concerning each question in the survey, detailed the results of the
six regressions performed on the collected data, presented findings related to the
three research questions and summarized the results. The effect school facilities
have on student achievement will be revisited in Chapter V and the findings of this
study described in detail. The chapter will conclude with a discussion of the
conclusions brought forth by the data and recommendations for further study.

163
CHAPTER V
DISCUSSION, CONCLUSIONS, AND
RECOMMENDATIONS FOR FUTURE RESEARCH
Chapter V contains a summary of the study and the findings discussed in
Chapter IV, an analysis of those findings, a statement of appropriate conclusions,
implications, limitations and recommendations for further study suggested.
Summary of the Study
This mixed method case study of the Ysleta Independent School District in
El Paso, Texas, investigates questions concerning the effect school facilities have
on student achievement. The study questions are:
1. What factors directly affect the decision to include facilities as a
component of educational adequacy?
2. How does availability of funds impact priorities regarding maintenance,
renovation, and construction of facilities?
3. To what extent can student achievement on the TAAS test be explained
by socio-economic condition, school size, building age, cleanliness,
maintenance, and the condition of the school’s structure?

164
The Ysleta Independent School District research department granted
permission to study eight years of TAAS data for thirty-three randomly selected
schools, conduct interviews with key district administrators and distribute a survey
to each school in the study. Surveys were sent to the thirty-three principals
concerning the condition of their campus facilities. After two weeks, notes were
sent thanking the principals who returned their surveys and asking the rest to
complete and mail the surveys back. Twenty-nine of the thirty-three surveys were
returned. The researcher visited each campus in the study and conducted in-depth
interviews with the former superintendent, Tony Trujillo, and a district appointed
representative, Manny Soto.
The interviews were transcribed, checked for major themes, coded and
recorded. Data from the survey’s were compiled and analyzed. Five regression
analyses were conducted using the 2001 percentages at each of the twenty-nine
schools for All Students, Hispanic Students, White Students, and Economically
Disadvantaged Students passing the TAAS test as the criteria, and building age,
cleanliness, structure, school size, overall maintenance and number of students
classified by the federal reduced lunch program as disadvantaged at each campus
as the predictors. A sixth seemingly unrelated regression analysis was conducted
by stacking the criteria and predictor data for each campus from 1994 until 2001.

165
Analysis of Findings
Interview Findings
The process of educating children is a complex system that contains
people, property and products. Each part intermingles with the next and no part
can stand-alone. This study investigates Ysleta Independent School District’s
successful plan to improve student achievement. Parts of the study’s questions are
best addressed using the voices of the participants and result in a deeper, thicker
description of the story through the context of their lived experience. Through the
themes of risky decisions, powerful people, buildings matter, and accountability,
Mr. Anthony Trujillo, Mr. Manny Soto and the principals of twenty-nine Ysleta
ISD schools express that success with which individuals pass through a given
organization is dependent upon how well his or her personal attributes converge
with or match the institution (Moore, 2000). Lord and Maher (1991) proposed that
the effectiveness of top-level leaders depends on their discretion to make
innovative, major changes in key areas of organizational strategy that will affect
the performance of the organization five to twenty years in the future. For these
and many other reasons, this group of educators banded together to look outside
the box for answers to successful student achievement. They found ways to place
the needs of all children at the focus of their work.

166
What factors directly affect the decision to include facilities as a component of
educational adequacy?
The first and most compelling decision occurred in 1992 and was made by
the Ysleta School Board when it offered Anthony Trujillo, a retired school
superintendent from California, the superintendency of the Ysleta Independent
School District. Through Trujillo’s leadership, the definition of educational
adequacy evolved from hope for a better handout, to faith in the district’s ability to
place Ysleta on an equal playing field with the best districts in Texas.
In 1992, an interesting phenomenon was occurring in El Paso. The Ysleta
school district is cut in half by Interstate 10. As families became more affluent
they migrated from the south side of town to the north. This movement polarized
the city and resulted in class issues. To the north of Interstate 10 were middle-
class Hispanic neighborhoods and crowded schools. To the south of Interstate 10
were poor Hispanic neighborhoods and half-empty schools. The school buildings
mirrored the wealth of the surrounding residential neighborhoods.
Following his arrival to El Paso, Trujillo asked permission of the Board to
spend a few months getting to know the people in the district. It was the first of
several factors that contributed to his decision to include facilities in his plan for
academic success. Mr. Trujillo met with every school and every department office
in the district central office. What he found was a hugely inefficient bureaucracy
with large overhead costs, dilapidated buildings needing repair and renovations,

167
students who’s TAAS scores were some of the lowest in the state and layers of
ineffective decision-making at the central office. He was particularly troubled by
the condition of the central office of Construction and Maintenance.
The state had placed the Ysleta ISD on notice and instructed it to tear down
Ysleta High School. In the opinion of the Texas Education Agency, the school
was unsalvageable. The maintenance workers of Ysleta HS were frustrated
because the school was in the heart of their neighborhood and the oldest high
school in town. They saw the closure of Ysleta High as a continued
marginalization of their neighborhood by the district. The district’s maintenance
workers complained that the district expected them to maintain the buildings
without the proper equipment and then the district stood by when the buildings
began to fall apart.
Interestingly, many of the most prominent members of the El Paso
community and many of the teachers and administrators within the district had
graduated from Ysleta High School. One of the workers at the high school was
from Mexico and was a Mexico University degreed architect. He told Trujillo that
he could, with the proper tools, renovate the building. In fact, the cost would be a
mere two million dollars. Trujillo decided to renovate rather than tear the high
school down.
Trujillo’s decision to accept the man’s offer to renovate Ysleta High
School would eventually place facilities at the heart of his plan for educational

168
adequacy. Trujillo said, “The first school building we renovated was
located in the poorest part of town. As the building was transformed back to its
heyday the local community was energized.” Mr. Soto explained the factors
contributing to the decision as, “There are three legs to this stool. The facility issue
was one leg and the other one was simultaneously the ten million dollars for the
construction program. The third leg of the stool was the psychology of the
workforce.”
Another factor contributing to the decision to include facilities was the
coincidental makeup of the school board. One member of the Board was a civil
engineer. Another was an electrical engineer and one worked at an engineering
firm. There was a salesman and a real estate agent. Due to the Board’s outside
employment and their personal belief systems, the majority of the Board believed
that the physical condition of school facilities made a difference in the quality of
the schools.
Trujillo’s concern about the lack of pride throughout the district was also a
factor in his decision to include facilities. He said, “My theory is that the
environment surrounding people, has a great deal to do with their attitudes about
everything about themselves.” He felt taxpayers, teachers and students needed
something concrete to represent trust and pride in their abilities and faith in the
future. Trujillo said, “If the grounds are not manicured, if there is graffiti on the
building that’s not going to be inviting, not only to the children but to the parents

169
as well.” He believed the facility program could be symbolic for the district and he
began to market it that way. Renovation of their dilapidated buildings was a
component his constituents could see, touch and feel. He used it as a vehicle to
prove that all people regardless of their age, heritage or income have talents and
they can use their talents successfully when they have the right tools and
encouragement. Trujillo explained, “They were giving it their finest. So there was
a lot of caring that went on about the facility program. All of a sudden the whole
district began to change because of the facilities.” Through determination,
symbolic trust, economic value, politics and pride, Trujillo made the decision to
include the condition of facilities as a component of educational adequacy.
How does availability of funds impact priorities regarding maintenance,
renovation and construction of facilities?
The Ysleta Independent School District was listed by the Texas Education
Agency as a property poor district in 1992 and remains on TEA’s property poor
district list today. Further, El Paso is comprised of a large Hispanic population as
well as a population characterized by poverty. Historically on the state level, both
of these groups suffer from low TAAS scores. During the school year preceding
Trujillo’s superintendency, Ysleta spent 9.7 percent of its operating fund on
construction, maintenance and renovation. During the Trujillo’s years as Ysleta’s
superintendent, he spent an average of 11.0 percent of the operating fund on

170
construction, maintenance and renovation each year. Today the district serves
34,038 economically disadvantaged students. This accounts for about 73.4 percent
of the total student population. The district’s total expenditures for 2000 – 2001
school year were $273,841,128 and its total construction, maintenance and
renovation costs were $26,762,308 or 10.3 percent of the operating fund.
Trujillo knew when he accepted the superintendency that the Ysleta ISD
was a poor district but his history of success in a California district with less access
to state aid gave him hope. He believed the key to Ysleta’s financial stability was
to learn how to work the Texas system to his district’s advantage. El Paso
residents were openly frustrated with the Ysleta ISD’s last bond election. The
facilities built using the bond money were inadequate and poorly constructed.
There was talk throughout the district and the community of possible mishandling
of the bond money by the district and insider “deals” with the contractors. Many
of the district’s board members were elected using campaign slogans of “no new
taxes.” Trujillo observed early in his tenure that there were huge questionable
expenditures flowing through the Maintenance and Construction district office.
He arranged for the director of the department and his staff to leave the district.
This decision had a ripple effect.
By removing the director and the department, Trujillo was able to hire his
own team. The new director understood the workers. He understood the culture
and how to get the most from the department. The director gave the maintenance

171
and in-house construction workers leeway to use their talents; he did not dictate
but oversaw. The district changed its procedures for purchasing materials and
either found uses for stored materials or got rid of them. This maneuver saved the
district thousands of dollars and freed hundreds of square feet of storage space.
The Maintenance and Construction Office also placed checks and balances into the
system. Purchase orders were tracked and individual schools were held
accountable for their budgets.
Trujillo formed an in-house construction company. The company was not
designed to build new buildings; it was used to renovate and repair buildings at a
fraction of the cost. While school districts were spending between $100 and $150
per square foot in 1994, Ysleta spent $50 and never went above $75. An extra
benefit was that by saving money on building costs, the district was able to
purchase tools and equipment. The men worked extra hours to complete
renovation projects under the target dates. The district saved money and the
overtime pay helped the workers. As the workers socio-economic status improved
so did their commitment to excellence. The district began to build a “we can do it”
attitude among the constituents and schools within the Ysleta district began to look
like schools affluent families chose.
Although the Board originally opposed a tax increase, they raised the local
school tax by eight cents. They felt they could use the Texas finance system to
their advantage. The school tax raised the district three and a quarter million

172
dollar. Coupled with a state award of six million the Board was ready to enact its
plan. Trujillo discussed with the chairman a “pay as you go” approach to
maintenance, renovation, and construction.
During the 1994-95 school year, Trujillo saved enough money to spend a
million dollars on power tools and equipment for the maintenance department. He
said, “It was a physical demonstration to people in the community that they need
not settle for second class anything. And that if we are going to have great
buildings, we are going to have a great education inside those buildings.” The
district was careful to think strategically and consider the costs of their buildings
and renovation projects ten to fifteen years ahead. They made their determinations
based on best value for the price rather than lowest bidder. Trujillo and his
employees managed to keep the district’s costs well under the state allotment but
did not sacrifice quality.
Trujillo was committed to saving money and he capitalized on the ability
of his middle class workers to stretch a dollar and stay within the budget of money
raised. This was a new concept for Ysleta. He also held all outside contractors to
the parameters of their bids. This culture change came with its own price tag.
While Trujillo was successful in having a local architect redraw a building in order
to come under the budget number, he was not successful in fending off disgruntled
local contractors or politically motivated board members; he saved the city money,
built some of the finest school facilities in Texas, but he did not save his career in

173
the Ysleta ISD. Trujillo left Ysleta in 1998. The benefit of his efforts to improve
the condition of Ysleta’s school facilities is that while innovative curriculum,
masterful delivery of instruction and visionary school leadership can change
overnight; brick and mortar have long-term staying power and can contribute
positively towards issues of access and equity.
To what extent can student achievement on the TAAS test be explained by socio-
economic condition, school size, building age, cleanliness, maintenance, and the
condition of the school’s structure?
Survey Findings
An analysis of the survey responses reveals a profile of the study group.
The responding principals are, for the most part, extremely complementary of their
facilities and rate them highly. Over ninety percent of the principals indicate that
the overall condition of their facility’s structure is standard or above standard.
However, principals recorded several structural and cosmetic concerns. Over sixty
percent indicate that the overall cosmetic condition of their facility is below
standard and many are concerned about overcrowding.
Almost 70 percent of the schools in the study are over 30 years old, and
only two schools were built since 1994. These statistics place the majority of
schools in this study within the range of the General Accounting Office report of

174
1995 that stated over half of America’s school-aged children attend class in aging
buildings over 30 years old and that aging buildings present ongoing challenges
that result in costly repairs and extensive renovations. Older buildings are
historically more expensive to maintain due to their aging infrastructure. Outdated
systems for electricity, air-conditioning, heating and water often result in
maintenance delays and problems due to a lack of available parts for the system
and the scarcity of skilled labor to repair them. Outdated instructional designs
result in problems with instructional flexibility and cause twenty-first century
educators to compromise innovation. Further it is difficult at best to anticipate the
future budget expenditure needs for buildings over thirty years old. The Ysleta
ISD started a systematic renovation and repair program in 1994. Their objective
was to determine specific facility needs at each building in order to bring all
campuses to a standard comparable to the most affluent districts in Texas.
The survey starts with a section concerning the structure of the principal’s
school facilities. Although 75percent of the respondents indicated the HVAC air
system provides clean quality air, several principals comment that the air
conditioner system requires frequent repair. And, while sixty-eight percent of the
principals indicate the instructional areas have individual heat controls, many
report broken controls and problems with their system. Couple that with the fact
that over 30 percent of the principals indicated there are no individual heating and
cooling controls in their buildings, and it is easy to see that many Ysleta principals
175
continue to be distracted by air quality problems. Koval, Berner, Hanson and
Edwards all found that environment and, specifically, air quality affect student
achievement.
Most principals indicated their buildings were adequate and reported a
general satisfaction although space is a problem for many. While most schools
have science labs, over 50 percent of the labs have not been updated or the update
was over ten years ago. Considering the high percentage of older buildings in
Ysleta, the lack of renovation to science labs certainly has implications concerning
student access to science technology. About half the principals said they needed
more classroom space and over 65 percent of them report they must use portable
buildings to accommodate their needs. One principal has nineteen portable
buildings and will request two more next year.
The principals were asked a series of questions concerning the
housekeeping of their buildings. While they are generally complementary of the
staff, they have concerns for their aging facilities. Seventy-two percent of the
principals indicate that their maintenance referrals are completed in a timely
manner, although about 45 percent do not feel their school has enough staff.
Almost 90 percent of the principals in this study report that their floors are swept
and vacuumed daily and mopped at least once a week. Ninety-six percent indicate
the appearance of their building and classrooms are adequate yet 62 percent

176
indicate that the overall cosmetic condition of their facility is below their
standards.
When asked if the members of their school community believe the
conditions and availability of educational facilities affect the level of academic
performance, ninety-three percent of the principals responded that it does. In fact,
only one principal commented that school facilities do not, in his opinion, affect
student performance. The high majority of comments made by principals pertain
to their belief that the condition of the school does make a difference in the
achievement of students at their school. Obviously, in spite of these obstacles,
students made tremendous gains between 1994-2001. The study acknowledges
that education is a complex system and no one element can assure success, but it
suggests that had the obstacles regarding school facilities been removed, student
achievement would be greater.
Regression Findings
An analysis of the six multiple regressions reveal that building age
emerged as the most significant predictor of TAAS scores. Other variables found
to be significant were maintenance, cleanliness and school size.
Cleanliness. When trying to predict the TAAS score for white students,
cleaning accounts for 49.8 percent of the variability. As stated previously, this

177
single case study resulted in a relatively small sample set. The Ysleta
Independent School District’s student population contains only nine percent white
students. Several schools contain so few white students that TEA does not publish
their passing rate. This causes the sample set of white students to be even smaller.
A larger sample set is necessary to check the theoretical prediction gleaned from
this study that for each additional state of cleanliness, a white student’s TAAS
score would likely decrease by .50 times the state of cleanliness (TAAS white
students = -.50 (cleaning). These results indicate that the state of cleanliness
negatively effects the achievement of white students. While curious, these results
could indicate that the distraction of people cleaning interferes in some way with
white students’ achievement.
Building Age, Maintenance, and School Size. In four out of the six multiple
regression analyses conducted, the age of the building accounted for the greatest
percentage of variance in the TAAS scores and was the first variable entering the
equation. When trying to predict the achievement as measured by the TAAS test
for all students, building age accounted for 42.5 percent of the variability in the
scores. The study suggests that out of all the reasons why a student would receive
a particular TAAS score, building age explained 42.5 percent of those reasons.
Although the sample set was relatively small, the predictive nature of the data
indicates that for each additional year of building age, the TAAS All score would
likely increase by .42 times the building age (TAAS All = .42 (Building Age).

178
Since the beta weight describes the relationship between the predictor and the
criterion, these results indicate that building age influences student achievement.
This study indicates that, when trying to predict the achievement as
measured by the TAAS test for disadvantaged students, building age and
maintenance taken together are significantly predictive of achievement and explain
63 percent of the variability in the TAAS scores. Keeping in mind that the sample
set is relatively small, this explanation of variability for building age is predictive.
This predictive nature of the data suggests that for each additional year of building
age and each additional state of maintenance, the TAAS Disadvantaged score
could be the result of .62 times the building age minus .42 times the state of
maintenance (TAAS Disadvantaged = .62(building age) - .42(state of
maintenance). These results indicate that building age is positively related to the
achievement of disadvantaged students yet school maintenance is negatively
related to the achievement of disadvantaged students. Historically maintenance
needs of older buildings are ongoing and costly. Mr. Soto pointed out that when a
principal has to spend time trying to keep the plumbing and heating units working
it distracts his attention from the instructional program. The ongoing demands for
maintenance that older buildings require may also distract students.
When trying to predict the achievement as measured by the TAAS test for
Hispanic students, building age accounts for 46 percent of the variability in the
scores. The sample set is relatively small, but the regression results indicate a
179
fairly strong tendency. Theoretically for each additional year of building age, the
TAAS Hispanic score would increase by .46 times the building age (TAAS All =
.46 (building age). Since all the buildings used in this study were renovated, the
age of the building may be a relative term.
When trying to predict the TAAS score over an eight-year period for all
students, building age and school size taken together are predictive of achievement
as measured by the TAAS test and account for 4.0 percent of the variability.
While this percent of variance accounts for a fairly small percent of all the reasons
why a student would receive a particular TAAS score, this explanation is
extremely reliable and would happen five out of one hundred times by chance for
building age (p<.05) and one out of ten thousand times for school size (p<.0001).
For each additional year of building age, the student’s TAAS score would likely be
the result of an increase of .07 times building age minus .20 times school size
(TAAS score = .07(building age) – .20(school size). These results indicate that
over the eight year period between 1994 and 2001 building age positively
influenced student TAAS scores and school size negatively influenced student
TAAS scores.
This study supports and parallels Lanham’s 1999 study where school size
was found to be a significant predictor of student achievement. On the other hand,
it differs from other studies concerning age of the building. Chan (1980), Edwards
(1991), Cash (1993), Hines (1996) Earthman, Cash, and Van Berkum (1996) and
180
Lanham (1999) found building age to have a negative influence on student
achievement. This study indicates that under certain circumstances students can
make significant academic improvement in older buildings.
Conclusions
The conclusions of this single case study of the Ysleta Independent School
District bolsters many previous research studies finding that improvement to
facilities can positively influence student achievement (Edwards, 1991; Cash,
1993; Hines, 1996; Lemasters, 1997; Lanham, 1999) as well as the studies that
suggest the achievement of economically disadvantaged students is affected by
their environment (Kovol, 1991; Hines 1996). Further, this study supports
previous research that points to school size as an important influence on student
achievement (Cash, 1993; Hines, 1996; Lanham, 1999). This study also supports
Hanson’s 1992 findings that people are influenced and affected by their
environment and McGuffey’s 1982 findings that renovated and controlled
environment facilities may enhance the learning process. The study supports
research that points to renovation and construction as alternatives to new school
facilities (Edwards, 1991; Kovol, 1991; Berner,1993). Finally this study supports
research that suggests that renovated buildings send positive messages to students
and that these positive messages contribute to their performance (Edwards, 1991).

181
This study of Tony Trujillo’s service as the superintendent of the Ysleta
Independent School District supports research connecting high-performing Texas
school districts with dynamic superintendents (Rgaland, Asera, & Johnson,1998)
and offers an example of visionary leadership. This study differs from previous
research on facilities and student achievement in that it represents research that
focused on one particular district with substantial student achievement
improvements following the inclusion of renovation and repair to existing school
facilities as part of the district’s student achievement initiative. The study suggests
that while almost seventy percent of the buildings in this study are at least thirty
years old, over an eight-year period from 1994-2001 the variance in TAAS
achievement could be explained by building age.
Eighty-eight percent of the students in the Ysleta Independent School
District are Hispanic. Three percent of the student population is a combination of
African American, Asian and Native American students and less than nine percent
of the students are white. An overwhelming 73 percent of the students attending
the Ysleta schools are classified by the Texas Education Agency as economically
disadvantaged and yet almost 83 percent of these economically disadvantaged
students passed all their TAAS subtests and 85 percent of all students passed their
TAAS subtests in 2001. Why are so many students passing?
Certainly good teaching played a major part in these dramatic statistics and
a well-defined vertically aligned curriculum was essential. Further, leadership and

182
vision by the superintendent and his staff helped point the way and remove the
barriers but this study reveals that the age of the building when combined with
maintenance, cleanliness and school size provides a partial explanation for the
difference in student achievement on the 2001 Texas Assessment Of Academic
Skills Test and for the change in their scores over an eight year period from 1994-
2001.
Sixty-nine percent of the schools in the study are over thirty years old, and
only two schools were less than ten years old. These statistics place the schools in
this study within the range of the General Accounting Office report of 1995 that
stated over half of America’s school-aged children attend class in aging buildings
over thirty years old. Since previous studies indicate that aging buildings
contribute in a negative way to student achievement, what could explain the
consistently positive results found in the Ysleta Independent School District?
During the spring of 1994, Tony Trujillo and the Ysleta ISD began an
initiative to dramatically improve student achievement. One of the major
components of that plan was the renovation and repair of Ysleta’s aging buildings.
Previous studies found that improving building conditions can positively influence
student achievement; Ysleta improved their facilities and their scores are some of
the highest in the state.
While the results of this study seem to contradict some previous findings
concerning the impact of aging buildings, the documented gains in achievement by

183
all ethic and racial student groups within Ysleta regardless of their socio-economic
status cannot be ignored. An analysis of the data in this study indicates that the age
of renovated buildings helps explain positive gains in student achievement.
Implications
This case study has implications for the Ysleta ISD as they continue to face
increasingly rigorous standards and accountability for student achievement along
with the challenges of the budget constraints and shortfalls inherent in property
poor districts. There are barriers that must be addressed.
1. Older buildings require ongoing and expensive maintenance. Since
districts across Texas are forced to take money from the
maintenance area and defer maintenance needs in order to balance
their operating budgets each year, Ysleta’s reliance on older
renovated buildings may become a problem.
2. Outdated systems for electricity, heating, water, and air-
conditioning often cause delays due to part ordering. Since
building age and maintenance taken together are significantly
predictive of achievement by disadvantaged students and account
for 63 percent of the variability in their TAAS scores, the fact that

184
delays in maintenance are inherent in older buildings could be a
problem.
3. Almost seventy percent of the schools in Ysleta quality for the
aging building classification issued through the Federal General
Accounting Office. Since outdated instructional designs result in
problems with instructional flexibility, the Ysleta ISD will need
funds for continued efforts regarding renovation of its older
buildings. Restrictions by Texas concerning availability of funds
could result in equity and access issues.
4. It is difficult at best to anticipate future budget needs of aging
buildings. This is especially difficult for property poor districts due
to their dependence on state programs. Since there is no state fund
for emergency facility needs, delays and constrains may influence
student achievement.
Clearly, properly renovated aging buildings commingled with quality teaching,
aligned innovative curriculum, and visionary leaders make a difference in student
achievement. For property poor districts, this difference is due in large part to
state funding. State funding provides property poor districts with necessary funds
but at the moment it comes with a price tag and with restrictions. Money from the
Instructional Facility Allotment Fund is restricted to facilities used for instruction
185
and the word “instruction” is narrowly defined. Further, state and federal
mandates for educational programs, environmental safety, and salary structure are
seldom accompanied by the funds to implement them (Ferguson, 1991). This
creates hardships for all Texas schools and additional barriers for property poor
districts like Ysleta. Unless the facility improvements are directed toward
instructionally used areas as defined by the Instructional Facility Allotment, the
district must fund the building through other sources. For most property poor
districts like Ysleta, there is no other source.
Students attending schools in property poor districts compete with and
against students in wealthy districts. For teenagers, this competition reveals itself
in high school through academic competitions won at local, state and national
competitions, through the taking of a multitude of advanced placement courses and
receiving a score of three or better on national tests, and through preparing for and
taking standardized tests. Due to the increasing competition for scholarships and
grants economically disadvantaged students find that academic success is not
enough. They must compete in a variety of areas, one of which is on the athletic
playing field. Students must show evidence that they were at least a member of
academic and athletic teams throughout their high school career. It helps if those
teams won coveted prizes and that the students played an important role in that
victory. Couple this with the knowledge that to compete with students from
affluent school districts for prized scholarships or freshman positions in

186
prestigious universities these economically disadvantaged students must record
hundreds of hours of community service and perform in their high schools’ plays
and musical concerts. Lack of unrestricted funds places districts and ultimately
students at a disadvantage because property poor districts do not have many of
these needed facilities.
Blatant discrimination and denial of needed benefits for disadvantaged
students would not be tolerated in Texas. Yet, some could argue that denial of
access to certain school facilities is a form of discrimination (Edwards, 1991;
Kovol, 1991). Mr. Soto told a story about two 2001 Ysleta soccer teams that
advanced to the regional playoffs. Both teams had progressed easily to the
playoffs handily beating every team they opposed. It was only when they reached
the regional playoffs that Ysleta’s inability to keep up with wealthy districts
confronted the students. The regional playoffs were held in a district that used
Astroturf fields. In fact, all the other districts competing at the playoffs had
Astroturf fields. The Ysleta students’ lacked experience on this new surface and it
inhibited their play. As a result, both teams lost. Mr. Soto put it like this,
The question is – Should the state tell us not to spend our money on
Astroturf when our kids need to go and compete against kids that
have it. Knowing that success on that level of competition is often
how college scholarships are derived, where is the equity in that?

187
When we talk about access and equity issues for children across
Texas, you are talking about facilities.
This example underscores the narrow definition of instructional facilities
set by Texas and the difficulty it causes students’ already hampered by socio-
economic disadvantages. School facility needs transcend classrooms and science
labs. Many of the students in Ysleta need more than a decent education to attend
college. They need scholarships. Some of these scholarships are in the form of
academic grants and fellowships but many can be found through sports and
extracurricular activities. Since the Instructional Facility Allotment Fund’s
definition of instruction is narrowly defined to the classroom, the students in
districts like Ysleta often miss out on opportunities because of the lack of equity
afforded by lack of funding.
Limitations
The complexity of learning and the system of education limit this study,
and the relatively narrow scope of this research results in de-limitations. This
district was purposely chosen due to its success with student achievement. While
this case study of the Ysleta Independent School District identified possible
influences on student achievement, it was limited by its relatively small sample

188
size and cannot conclude that school facility conditions alone result in, lead to or
cause student achievement. Further, the results of this study, while interesting,
cannot be generalized. This school district was purposely chosen due to its
success in improving student achievement from low performing to recognized
based on its students’ TAAS test results. The qualitative part of this study tells the
story of what happened in Ysleta, while the quantitative part suggests why.
As with any survey study, the reliability of the survey results depends on
the quality of the survey and the person filling out the form. This study would be
enhanced had a question been included on the survey regarding the specific date
the building was placed into service and the specific dates renovation and updates
were performed at the school. Further, specific information regarding the scope of
the renovation and updates would have added to the study. Further, although
principals are the decision makers for their buildings, the expertise of those filling
out the survey must always be a concern. The value of this research is that while it
cannot establish a causal relationship with any degree of certainty between the
condition of school facilities and student achievement it can explain a percent of
the variance and provide important information regarding possible barriers to
successful student achievement.

189
Recommendations for Further Study
Unfortunately for students, there is no student achievement checklist that if
followed will guarantee success. There is neither a magic leadership formula nor a
model of teaching that if followed consistently results in high achievers. There is
no genetic blueprint, guidelines to prenatal care, description of family structure,
level of socioeconomic status or steps for child development that will consistently
result in a well-educated successful student. There is no funding package or
mandated law that will assure that students will achieve to his or her potential.
Finally, there is no educational kit containing a building, atmosphere, classrooms,
equipment, and staff that if purchased can guarantee student achievement.
Successful efforts to improve student achievement are targeted, complex,
intermingled, systemic and mystical. Superior curriculum, innovative instruction,
visionary leadership and improved measures of student achievement as well as the
money it takes to provide them are necessary but the buildings that house Texas’
future cannot be ignored.
1. Districts must improve the questions they ask themselves concerning their
educational process. They must keep specific ongoing records and practice
data driven instruction. Specifically, districts across Texas should
investigate the influence their facilities have on their students’
achievement.
190
2. This study could be replicated in Ysleta to include the remainder of schools
in the district. Results could be used to strengthen decisions concerning
future renovation and repair to Ysleta’s school facilities. Further, results
that point to an influence regarding positive gains in student achievement
could be used with other bolstering research to secure possible grants,
bonds and special funding.
3. This study could be replicated in other districts across Texas. With the
change from TAAS to TEKS, information influencing growth in student
achievement is important. Studies must be conducted using TEKS as the
criterion.
4. Consideration must be given to establishing statewide building standards
and a survey questionnaire that reflects them.
5. Additionally, contractors, educators and lawmakers need to be trained to
identify and maintain shared school facility standards.
6. This study with changes could be repeated in other states. The survey
instrument could be modified to include the state’s building standards.
Since there is no national standard for student achievement, states would
need to design an instrument that meets their specific standards for
achievement.
7. Questions should be asked of lawmakers concerning equity and access with
regard to school facilities. This study supports that school facilities

191
influence student achievement in the Ysleta Independent School District. If
property poor districts are hampered by state funding laws in their attempts
to improve student achievement. Questions regarding the constitutionality
of Texas school funding seem to exist.
Tony Trujillo said the building initiative “was a physical demonstration to
people in the community that they need not settle for second class anything. And
that if we are going to have great buildings, we are going to have a great education
inside those buildings. My theory is that the environment surrounding people has
a great deal to do with their attitudes about everything about themselves.” The
Ysleta Independent School District dramatically improved their students’
achievement. This study indicates that the condition of their school facilities
accounts for part of that achievement. Further, debate concerning facility
infrastructure and the role state and Federal governments will play in facility
funding continues. Information that might shed light on their connection is
noteworthy and important.

192
Appendix A
Ysleta Independent School DistrictSuperintendent Interview Questions
The interview will be non-fixed and generally follow the questionsbelow.
1. Generally speaking what were the demographics of the Ysleta ISD district
10 years ago? Have they changed?
2. What prompted the district to originally include improvements to the
Ysleta ISD’s school facilities in their district goals?
3. What role did the conditions and quality of the Ysleta ISD facilities play in
keeping students and attracting others? What is that role now?
3. Do the stakeholders in the Ysleta ISD generally believe that the conditions
and availability of Educational facilities affect the level of academic
performance?
4. How do the stakeholders in the Ysleta ISD see the conditions and
availability of the Educational facilities?
5. How did the Ysleta ISD finance the original improvements to the facilities?
6. How does the district finance the ongoing maintenance of the facilities?
7. Is the Ysleta ISD access to the Facility Allotment Fund adequate?
8. What other funds are used?

193
9. Is there a more appropriate way to finance improvements and
maintenance?
10. Do you feel the improvements to the Ysleta facilities contributed to the rise
in TAAS scores?
11. Do you have any comments regarding the possible relationship between
building conditions and student achievement?
12. What changes would you like to see regarding availability of funds for
improvement and maintenance of school facilities?
13. Are there any areas that you feel require further comment?

194
Appendix BIRB#______
Informed Consent to Participate in ResearchThe University of Texas at Austin
You are being asked to participate in a research study. This form provides youwith information about the study. The Principal Investigator (the person in chargeof this research) or her representative will also describe this study to you andanswer all of your questions. Please read the information below and ask questionsabout anything you don’t understand before deciding whether or not to take part.Your participation is entirely voluntary and you can refuse to participate withoutpenalty or loss of benefits to which you are otherwise entitled.
Title of Research Study:A Study of the Effect School Facility Conditions Have on Student Achievement
Principal Investigator and Telephone Numbers:
Principal Investigator, Susan Lair – with The University of Texas atAustin
Faculty Sponsor, Dr. Don Phelps – with Office of College EducationalAdministration at The University of Texas at Austin
Funding source:
Susan Lair funds this project.
What is the purpose of this study?
The purpose is to shed light on the effects building conditions have onstudent achievement.
What will be done if you take part in this research study?
You will receive a questionnaire. The questionnaire takes about 20 minutes to fillout. You will return the questionnaire to Susan Lair and the information will be

195
used in conjunction with TAAS scores over the last 10 years to determine theeffect school facilities may have on student achievement.
What are the possible discomforts and risks?
The only discomfort is the time it will take to fill out the questionnaire.There may be risks that are unknown at this time. If you wish to discussthe information above or any other risks you may experience, you may askquestions now or call Susan Lair at the numbers listed above.
What are the possible benefits to you and to others?
Shedding light on any barrier to student success benefits educators. Thereare no direct benefits to you by this study.
If you choose to take part in this study will it cost you anything?
No, it will cost you nothing.
Will you receive compensation for your participation in this study?
No, you will not receive compensation.
What if you are injured because of the study?
There is virtually no likelihood of injury due to this study. No treatment will beprovided for research related injury and no payment can be provided in the eventof a medical problem.
If you do not want to take part in this study, what other options are availableto you?
Participation in this study is entirely voluntary. You are free to refuse to bein the study, and your refusal will not influence current or futurerelationships with The University of Texas at Austin or the YslettaIndependent School District.
How can you withdraw from this research study?
If you wish to stop your participation in this research study for any reason, youshould contact the Office of Education Administration. You are free to withdraw

196
your consent and stop participation in this research study at any time withoutpenalty or loss of benefits for which you may be entitled. Throughout the study,the researchers will notify you of new information that may become available andthat might affect your decision to remain in the study. In addition, if you havequestions about your rights as a research participant, please contact, Clarke A.Burnham, Ph.D., Chair, The University of Texas at Austin Institutional ReviewBoard for the Protection of Human Subjects.
How will your privacy and the confidentiality of your research records beprotected?
Authorized persons form The University of Texas at Austin and theInstructional Review Board have the legal right to review your researchrecords and will protect the confidentiality of those records to the extentpermitted by the law. If the research project is sponsored then the sponsoralso has the legal right to review your research records. Otherwise, yourresearch records will not be released without your consent unless requiredby law or a court order.
If the results of this research are published or presented at scientificmeetings, your identity will not be disclosed.
If you are interviewed:a. The interview or session will be audio taped.b. The cassettes will be coded so that no personally identifyinginformation is visible on them.c. They will be heard or viewed only for research purposed by theinvestigator and his or her associates.d. The audio recordings may be retained for possible future analysis.
Will the researchers benefit from your participation in this study?
There will be no benefit beyond publishing or presenting the results.
Signatures:
As a representative of this study, I have explained the purpose, theprocedures, the benefits, and the risks that are involved in this researchstudy:

197
Signature and printed name of person obtaining consent Date
You have been informed about this study’s purpose, procedures, possible benefitsand risks, and you have received a coy of this Form. You have been given theopportunity to ask questions before you sign, and you have been told that you canask other questions at any time. You voluntarily agree to participate in this study.By signing this form, you are not waiving any of your legal rights.
Printed Name of Subject Date
Signature of Subject Date
Signature of Principal Investigator Date
If you were interviewed,
I hereby give permission for the audiotape made for this research study to ealso used for educational purposes.
Signature of Subject Date
We may wish to present some of the tapes from this study at scientificconventions or as demonstrations in classrooms. Please sign below if you arewilling to allow us to do so with the tape of your interview.
Signature of Subject Date

198
Appendix C
Ysletta Independent School DistrictFacility Questionnaire
Position with District
______Principal _________Other “______________” Specify
Respondent Name optional ___________________________________________
1. The demographics of my district may be generally described as:Check all that apply
_____ Seniors/empty nesters _____ young families & singles_____ “normal mix” _____ urban_____ rural _____ suburban_____ stable _____ highly mobile_____ in transition _____ re-developing_____ new subdivisions _____ older neighborhoods_____ multi-family _____ single family_____ poor _____ middle-class_____ wealthy _____ mixed income
Comments:____________________________________________________________________________________________________________________________________
I. STRUCTURE
2. What is the age of your facility?
A facility’s age is your best estimate of the time period during which most ofthe space used by students was built. If the space was fully updated to thebuilding standards of a later time period, consider the school in the later timeperiod.
a. 60 years old or olderb. 50-59 years oldc. 40-49 years oldd. 30-39 years old

199
e. 20-29 years oldf. 10-19 years oldg. Under 10 years old
Comments:____________________________________________________________________________________________________________________________________
3. If there are windows in the instructional areas, how manywindows are in an external wall?
a. less than 1/4 of the instructional areas.b. at least 1/4, but fewer than _ of the instructional areas.c. at least 3/4 of the instructional areas.
Comments: Comments:____________________________________________________________________________________________________________________________________
4. Does the school’s air system provide clean/quality air?a. Yesb. No
Comments:____________________________________________________________________________________________________________________________________
5. Is the instructional area of the facility air-conditioned?a. Yesb. No
Comments:____________________________________________________________________________________________________________________________________
6. Are the classrooms individually heat controlled?c. Yesd. No
Comments:____________________________________________________________________________________________________________________________________
7. What type of flooring is found in the instructional areas?e. Wood floorsf. Tile or Terrazzo

200
g. CarpetComments:____________________________________________________________________________________________________________________________________
8. What is the configuration or make-up of the interior ceilings?a. Wood or beamsb. Plaster or acoustical tiles in at least 3/4 of the instructionalareasc. Acoustical tiles throughout the instructional areas
Comments:____________________________________________________________________________________________________________________________________
9. What is the light source?a. Incandescent Lightingb. Fluorescent Lighting
Comments:____________________________________________________________________________________________________________________________________
10. Does the lighting in the classroom provide adequate light?a. Yesb. No
Comments:____________________________________________________________________________________________________________________________________
11. What color are the walls in the instructional areas?a. Dark colorsb. Whitec. Pastel colors
Comments:____________________________________________________________________________________________________________________________________
12. What is the condition of the classroom furniture?a. Most rooms have furniture that is either facially scarred ordamaged.b. Though the rooms may have some minor facial scars on thestudent desks, all the furniture is sound and looks satisfactory.
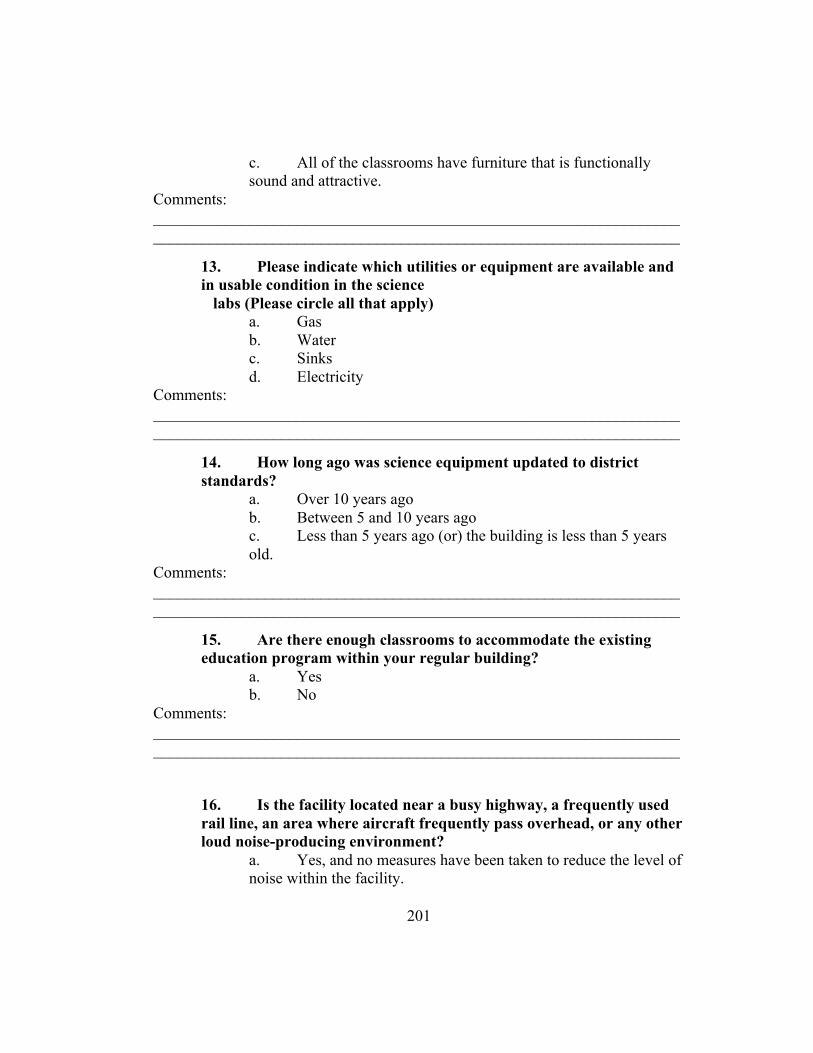
201
c. All of the classrooms have furniture that is functionallysound and attractive.
Comments:____________________________________________________________________________________________________________________________________
13. Please indicate which utilities or equipment are available andin usable condition in the science
labs (Please circle all that apply)a. Gasb. Waterc. Sinksd. Electricity
Comments:____________________________________________________________________________________________________________________________________
14. How long ago was science equipment updated to districtstandards?
a. Over 10 years agob. Between 5 and 10 years agoc. Less than 5 years ago (or) the building is less than 5 yearsold.
Comments:____________________________________________________________________________________________________________________________________
15. Are there enough classrooms to accommodate the existingeducation program within your regular building?
a. Yesb. No
Comments:____________________________________________________________________________________________________________________________________
16. Is the facility located near a busy highway, a frequently usedrail line, an area where aircraft frequently pass overhead, or any otherloud noise-producing environment?
a. Yes, and no measures have been taken to reduce the level ofnoise within the facility.

202
b. Yes, but measures have been taken to reduce the level ofnoise within the facilityc. No
Comments:____________________________________________________________________________________________________________________________________
II. MAINTENANCE
17. What is the condition of the school’s landscape?a. There is no landscaping, and sidewalks are either notpresent or damaged (it is unattractive to the community).b. There is landscaping and the sidewalks are present and ingood repair (it is acceptable to the community).c. The landscaping and other outside facilities are attractiveand well maintained (it is a center of pride for the community).
Comments:____________________________________________________________________________________________________________________________________
18. What is the condition of the student’s academic lockers?a. Most are not functional or not in good repairb. At least 3/4 of the lockers are functional and in good repairc. Over _ of the lockers are functional and in good repair
Comments:____________________________________________________________________________________________________________________________________
19. Can the windows be opened and closed manually?a. Yesb. No
Comments:____________________________________________________________________________________________________________________________________
20. Is the flooring maintained in good condition?a. Yesb. No
Comments:____________________________________________________________________________________________________________________________________

203
21. Are the ceiling clean and without stains?a. Yesb. No
Comments:____________________________________________________________________________________________________________________________________
22. Please give the time interval of interior painting?a. Over 15 years agob. Between 8 and 15 years agoc. Less than 8 years ago
Comments:____________________________________________________________________________________________________________________________________
23. Please give the time interval of exterior painting?a. Over 7 years agob. Between 4 and 7 yearsc. Within the last 4 years (or) no exterior surface requiresperiodic painting
Comments:____________________________________________________________________________________________________________________________________
24. Please indicate evidence of a roof leak?a. Ceiling is deteriorating due to water damage, and/or waterfalls in some areas of facility requiring buckets for water collection.b. Ceiling is currently developing a few new stains due tominor leaks.c. No visible signs, or only a few old water spots in ceiling.
Comments:____________________________________________________________________________________________________________________________________
25. Is the number of maintenance staff adequate for yourbuilding?
a. Yesb. No
Comments:____________________________________________________________________________________________________________________________________

204
26. Are maintenance problems solved in a timely manner?a. Yesb. No
Comments:____________________________________________________________________________________________________________________________________
27. Please consider the overall condition of your school facilitystructure. Is it -
a. Below standardb. Standardc. Above standard
Comments:____________________________________________________________________________________________________________________________________
III. HOUSEKEEPING
28. How often are the instructional area floors cleaned?a. Monthlyb. Weeklyc. Daily or more frequently
Comments:____________________________________________________________________________________________________________________________________
29. How often are the instructional floors maintained (waxed,mopped, stripped and waxed?
a. Annuallyb. Monthlyc. Weekly or Daily
Comments:____________________________________________________________________________________________________________________________________
30. Is graffiti commonly found on the premises? Circle Yes or Nofor each listed area.
a. Bathrooms Yes Nob. Lockers Yes Noc. Hallways Yes Nod. Classroom Walls/Doors Yes Noe. Other Interior Surfaces Yes No

205
Please Specify__________________________________________________
f. Exterior walls Yes Nog. Exterior Walkways Yes Noh. Other Exterior Surfaces Yes No Please Specify__________________________________________________
Comments:____________________________________________________________________________________________________________________________________
31. How long does the graffiti remain before it is removed?a. Until summer maintenance or the next painting cycleb. More than a week, less than a monthc. Less than a week (or) no to all parts of #12
Comments:____________________________________________________________________________________________________________________________________
32. Are the walls in the instructional areas clean and in goodcondition?
a. Yesb. No
Comments:____________________________________________________________________________________________________________________________________
33. Do you consider the general appearance of yourbuilding/classroom adequate?
a. Yesb. No
Comments:____________________________________________________________________________________________________________________________________
34. Are hallways kept clean during the day?a. Yesb. No
Comments:____________________________________________________________________________________________________________________________________

206
35. How would you describe the interior smell?a. Pleasantb. Disturbing
Comments:____________________________________________________________________________________________________________________________________
36. Is the housekeeping staff during the school day adequate?a. Yesb. No
Comments:____________________________________________________________________________________________________________________________________
37. What do you consider to be the overall condition of yourfacility cosmetically?
a. Below standardb. Standardc. Above standard
Comments:____________________________________________________________________________________________________________________________________
PLEASE PROVIDE THE FOLLOWING INFORMATION IF YOU CAN:
38. The conditions and quality of our school’s facilities play what role inkeeping students and attracting others:
_____ high ______ moderate _____ lowComments:____________________________________________________________________________________________________________________________________
39. The people in our school generally believe that the conditions andavailability of educational facilities can affect the level of academicperformance
_____ agree _____ disagree _____ opinion uncertain

207
Comments:____________________________________________________________________________________________________________________________________
40. The stakeholders in our school believe that current conditionsand availability of our educational facilities are a:
_____ positive _____ negative _____ no influence on academicperformance
Comments:____________________________________________________________________________________________________________________________________
41. What is the approximate gross square footage of your facility?(Use building’s rough dimensions)
_________ X _________ = ____________ Length Width Gross Sq. Ft.
42. What is the approximate acreage of your school site?
_________________________________________ Acreage
43. If there are any areas on this assessment instrument, which youfeel require further comment, please note them and your comments inthe space provided. Thank you for your time and assistance incompleting this assessment of your facility’s physical environment.
Comments:
44. If you have any comments regarding the possible relationshipbetween building condition and student achievement, please makethem below.
Comments:
This questionnaire was adapted from the Commonwealth Assessment ofPhysical Environment (CAPE)in conjunction with studies directed by Cash (1993) and Hines (1996) inVirginia.

208
REFERENCES
Abbot v. Burke. F. Supp. 294. 395 (N.J. 1988).
Abramson, P. (February, 1998). 1998 School Planning and Construction
Report. School Planning and Management, 2,2,36.
American Association of School Administrators (1992). Schoolhouse in
the red. Arlington, VA: American Association of School Administrators.
Berner, M. M. (1993). Building conditions, parental involvement, and
student achievement in the District of Columbia Public School System. Urban
Education. 28. 1. 6-29.
Board of Education of the City of Cincinnati v. Waiter. 102 S. Ct. 3211
(Ohio 1977).
Bowers, J.H. & Burkett, C.W. (1987, October) Relationship of student
achievement and characteristics in two selected school facility environmental
settings. Paper presented at the 64th Council of Educational Facility Planners,
International Conference in Edmonton, Alberta, Canada.
Bowers, J. H. & Burkett, C. W. (1988, July-August). Physical environment
influences related to student achievement, health, attendance and behavior. CEFP
Journal.

209
Bowers, J. H. & Burket, C. W. (1989, January-February) Effects of
physical and school environment on students and faculty. Educational Facility
Planner. 27(1), 28-29.
Brown vs. Board of Education, 347 U.S. 483 (1954).
Burkhalter, B. B. (1983, January – February). Impact of physical
environment on academic achievement of high school youth. CEFP Journal. 21(1),
21-23.
Carnegie Foundation for the Advancement of Teaching. (1988). An
Imperiled Generation: Saving Urban Schools. Princeton, New Jersey: Aughor.
ED293 940.
Cash, C. S. (1993). A study of the relationship between school building
condition and student achievement and behavior. Unpublished doctoral
dissertation. Blacksburg, VA. Virginia Polytechnic Institute and State University.
Chan, T.C. (1980). The impact of school building age on pupil
achievement. CEFPI Journal. 18 (2). 13-14.
College Board. (2000). A Secondary School Guide to the Advanced
Placement Program. Redding, VA: Educational Testing Service.
Denzin, N. K., & Lincoln, Y. S. (Eds.). (1996). Handbook of qualitative
research. Thousand Oaks, CA: Sage
Diaz v. Colorado State Board of Education. 391 U.S. 563. (Colo. 1977).

210
Dillman, D.A. (1978). Mail and Telephone Surveys: The Total Design
Method. New York: John Wiley & Sons.
Earthman, G. I., (1986, November). Research Needs in the Field of
Educational Facility Planning. Paper presented at the meeting of EDUSYSTEMS
2000 for the International Congress on Educational Facilities, Values, and Content,
Jerusalem, Israel.
Earthman, G. I. (1996, July) Review of research on the relationship
between school buildings, student achievement, and student behavior. Position
paper for the Council of Educational Facility Planners, International, Scottsdale,
Arizona.
Earthman, G.I., Cash, C.S., & Van Berkum, D. (1995). A statewide study
of student achievement and behavior and school building condition. Paper
presented at the annual meeting of the Council of Educational Facility Planners,
International, Dallas, TX.
Edgewood Independent School District et al. v Raymon L. Bynum,
Commissioner of Education et. al. 250th District Court, Austin, Travis County,
Texas, 1984.
Edgewood I.S.D., et all. V. Kirby, et. Al., Case No. 362,516. 250 District
Court, Austin, Travis County, Texas, August 27, 1987.
Edgewood v Kirby, 777 S.W. 2d 381 (Tex. 1989).
Edgewood v Kirby, 804 S.W. 2d 491 (Tex. 1991).

211
Edwards, M.M. (1991). Building conditions, parental involvement and
student achievement in the D.C. public school system. Unpublished master’s
thesis, Georgetown University, Washington, DC.
Effort to fix, build schools called inadequate by experts. (1996, August).
Dallas Morning News. p. B14.
Evans, G. W., Kliewer, W. & Martin. J. (1991) The role of the physical
environment in the health and well-being of children. In H.E. Schroeder (Ed.) New
Directions in Health Psychology Assessment. New York: Hemisphere.
Ferguson, R. F. (1991). Paying for Public Education: New Evidence on
How and Why Money Matters. Harvard Journal on Legislation. 28, 465-498.
Funk, R.S. (1980). An analysis of school finance equity standards,
principles, and measurements and their application to the Kansas school finance
formula with emphasis on district wealth. Unpublished doctoral dissertation,
Kansa State University.
Glass, T.E. (1999). Hidden Costs of School Construction. School Business
Affairs. July
Gehrke, N. J. (1982). An analysis of teachers’ perceptions of their school
environment. Paper presented at the Annual Meeting of the American Association
of Colleges for Teacher Education. Houston, Texas.
Glesne, C. (1999). Becoming qualitative researchers. An introduction.
New York, NY: Longman.

212
Greenwald, R., Hedges, L.V., & Laine, R.D. (1994). When reinventing
the wheel is necessary: A case study on the use of meta-analysis in education
finance. Journal of Educational Finance. (20), 1-20.
Griliches, Z. (1998). Handbook of Econometrics. New York: North
Holland Publishing.
Hansen, J. M. & Childs, J. (1998). Creating a school where people like to
be. Educational Leadership. 56, 1, 14-17.
Hanson, S. J. (1992). Schoolhouse in the Red. A Guide for Cutting Our
Losses. Powerful Recommendations for Improving America’s School Facilities.
Arlington, Virginia: American Association of School Administrators. ED347 697.
Hanushek, E. (1981). Throwing Money at Schools. Journal of Policy
Analysis and Management. 1(1), 19-41.
Health, Education, and Human Services Division. (February, 1995).
School facilities: Condition of American schools. Gaithersburg, MD: U.S. General
Accounting Office ERIC Document Reproduction Service No. ED 378 703.
Herbert, E. A. (1998). Design matters: how school environment affects
children. Educational Leadership. 56(1), 69-70.
Hines, E.W. (1996). Building conditions and student achievement and
behavior. Unpublished doctoral dissertation. Virginia Polytechnic Institute and
State University.

213
Johnson, S. M. (1996). Leading to change: The challenge of the new
superintendency. San Francisco: Jossey-Bass.
Kazal-Thresher, D. M. (1993). Educational Expenditures and School
Achievement. Educational Researcher. 22, 2, 30-32.
Kozol, J. (1991). Savage Inequalities. Children in America’s schools. New
York: Crown.
Kozol, J. (1991). The effect of selecting physical features of the general
elementary classroom on learning environment. Unpublished doctoral dissertation.
Indiana State University.
Kowalski, T. (1995) Chasing the wolves from the schoolhouse door. Phi
Delta Kappan, 76 (6), 486, 488-489.
Krawitz, K. R. (1987). Effects of portable, temporary, and permanent
classrooms on student achievement and teacher morale at the second, forth, and
sixth grade level. Unpublished doctoral dissertation, University of Kansas.
Lackney, R. A. (1999, September). Briefing to the U.S. House of
Representatives Committee on Science. Sponsored by the Environmental Energy
Study Institute, Washington, D.C.
Lackney, R. A. (1999, December). Why optimal learning environments matter.
Keynote Presentation, annual Meeting of the Alaska Chapter of the Council of
Educational Facility Planners, International. Ontario, Canada.

214
Lanham III, J.W. (1999). Relating building and classroom conditions to
student achievement in Virginia’s elementary schools. Unpublished doctoral
dissertation. Virginia Polytechnic Institute.
Lemasters, L.K. (1997). A synthesis of studies pertaining to facilities,
student achievement, and student behavior. Unpublished doctoral dissertation,
Virginia Polytechnic Institute and State University.
Lewis, A. (1989). Wolves at the schoolhouse door. An investigation of the
condition of public school buildings. Washington, DC: Education Writers
Association. ED306 660.
Lincoln, Y., & Guba, E. (1985). Naturalistic inquiry. Beverly Hills:
Sage Publications.
Lord, R. G., & Maher, K. J. (1991). Leadership and information
processing: Linking perceptions and performance. Boston: Unwin-Hyman.
Lowe, J. M. (1990). The interface between educational facilities and
learning climate. Unpublished doctoral dissertation. College Station, TX: Texas
A&M University.
Lujan v. Colorado State Board of Education. 649 P. 2n 1005 (Colo. 1982)
Lutz, F. W., Betz, L.E., & Maddirala, J.S. (1996). The Texas school
facilities study. 1986-1996. (Monograph No. 1) Commerce, TX: East Texas State
University, Center for Policy Studies and Research in Elementary and Secondary
Education. ED 302 376.

215
MacInroe, H. (1994). Texas school bond elections. Insight. 12(3) 35-36.
McGuffey, C.W. (1982). Facilities. In Chapter 10, W. Herbert (Ed.),
Improving educational standards and productivity. (pp.237-288). Berkeley, CA:
McCutchan Publishing Corp.
Miles, M. B., & Huberman, A. M. (1994). Qualitative data analysis: A
Sourcebook of New Methods. Beverly Hills, CA: Sage.
Moore, W. (2000). Presentation during Social Culture. University of Texas
at Austin.
National Center For Educational Stanards.
Nyhan, R. C. & Alkadry, M. G. (1999). The Impact of School Resources
on Student Achievement Test Scores. Journal of Education Finance. 25, 211-228.
Omstein, A. C. & Cienkus, R. C. (1994). The nation’s school repair bill.
American School Board Journal. 177(2), 2A-4A.
Oritz, F. I. (1994). School housing: Planning and designing educational
facilities. Albany: State University of New York Press.
Overbaugh, B. L. (1990). School facilities: The relationship of the physical
environment to teacher professionalism. An Unpublished doctoral dissertation.
College Station, TX: Texas A&M University.
Patton, M.Q. (1990). Qualitative Evaluation Methods. 2nd ed. Thousand
Oaks, C A: Sage.
Pauley v. Bailey. 424 S. E. 2d 693, 878 (W. Va. 1982).

216
Pauley v. Kelley. 255 S. E. 2d 859, 878 (W. Va. 1979).
Pauley v. Gainer. 424 S. E. 2d 693, 878 (W. Va. 1986).
Pearson, E.S. (1938). Karl Pearson: an appreciation of some aspects of his
life and work. Cambridge University Press.
Peatross, F. D. & Peponis, J. (1995, Winter). Space, education, and
socialization. Journal of Architectural and Planning Research. 12(4). 366-385.
Phillips, R.W. (1997). Educational facility age and the academic
achievement and attendance of upper elementary students. Unpublished doctoral
dissertation. University of Georgia.
Ragland, M., Asera, R., & Johnson, J. (1998). Urgency, Responsibility,
Efficacy: Preliminary Findings of A Study of High Performing Texas School
Districts. Charles A. Dana Center, The University of Texas at Austin, Austin, TX.
Rivera-Batiz, F. & Marti, L. (1995, January). A school system at risk: A
study of the consequences of overcrowding in New York City Public Schools.
(IUME Research Report No 95-1). New York: Columbia University Institute for
Urban and Minority Education. (ERIC Document Reproduction Service No ED
379 381).
Robinson v. Calhill, 303 A. 2d 272 (N.J. 1973).
San Antonio Independent School District v Rodriquez. 411 U.S. 1; 93 S.
Ct. 1278 (1973).

217
Senge, P. Fifth Discipline: The Art and Practice of the Learning
Organization
Serrano v. Priest, 487 P. 2d. 1241 (Cal. 1971).
Sharp, J. (1998). Current and Future Facilities Needs Of Texas Public
School Districts: A survey of Texas school districts. Comptroller of Public
Accounts. Pub. 96-561.
Shofstall v. Hollins, 515 P. 2d 590 (Ariz. 1973).
Statistical Package for the Social Sciences (2001).
Stockard, J., & Mayberry, M. (1992). Effective educational environments.
Newbury Park, CA: Corwin.
Strain, S.A., (1985). The impact of HB 72 on the equalization of school
finance in the state of Texas. Doctoral dissertation. University of Texas at Austin.
Summers, A.A., & Wolfe, B.I., (1975). Which school resources help
learning? Efficiency and equity in Philadelphia public schools. Business Review.
Philadelphia, PA: Federal Reserve Bank of Philadelphia.
Tanner, C. K. (2000). The influence of school architecture on academic
achievement. Journal of Educational Administration. 38, (4), 309-330
Texas Education Agency (2001) 2001 Accountability Manual. On the
Texas Education Agency’s web page. http://www.tea.state.ts.s/perfreport/account
/01/manual.html.

218
Texas Education Agency (2001) 2001 Accountability Ratings. On the
Texas Education Agency’s web page. http://www.tea.state.ts.s/perfreport/ratings
/01/manual.html
Texas School Law Bulletin. (1994). Austin, TX: West Publishing.
Thompson, D.C. (1988). Finance, facilities and equity: Emerging concerns
for the future. Paper presented to the National Rural Educational Research Forum,
Bismarck, ND ED 307 087.
Thompson, D.C. (1989). Financing facilities: A perilous legal path for the
future. Educational Facility Planner, 27 (2), 9-11.
Uline, C.L. (1997). School architecture as a subject of inquiry. Journal of
School Leadership. (7), 194-209.
United States General Accounting Offices Health, Education, and Human
Services Division. (1995). Report to Congressional Requesters, School Facilities:
Condition of America’s Schools. (Report No. GAO/HESHS – 95-61).
Gaithersburg, MD: U.S. General Accounting Office (ERIC Document
Reproduction Service No ED 378 703).
U.S. Department of Education, National Center for Education Statistics.
(1997). Pursuing Excellence: A Study of U.S. Fourth-Grade Mathematics and
Science Achievement in an International Context. Washington, D.C.

219
U.S. Department of Education, National Center for Education Statistics.
(1998). Pursuing Excellence: A Study of U.S. Twelfth-Grade Mathematics and
Science Achievement in an International Context. Washington, D.C.
Virginia Board of Education. (1997). Standards for accrediting public
schools in Virginia. Richmond, VA.
Weinstein, C. S. (1979). The physical environment of the school: A review
of the research. Review of Educational Research. 49(4). 577-610.
Wenglinsky, H. (1997). When money matters: How educational
expenditures improve student performance and how they don’t. Princeton, NJ:
Educational Testing Service.
Yin, R.K. Case Study Research: Design and Methods. (2nd ed.) Thousand
Oaks, CA: Sage, 1994.
Zellner, A. (1997). Bayesian Analysis in Econometrics and Statistics. NH:
Edward Elgar Publishing.

220
VITA
Susan Brooks Lair was born in Fort Worth, Texas on November 25, 1950,
to Eva Lou Brooks and Jesse Howard Brooks. After graduating from Paschal
High School, Fort Worth, Texas in 1968, Susan attended the University of North
Texas and graduated with a Bachelor of Science degree in 1972, with a
concentration in mathematics and physical education. After five years of teaching
in the Fort Worth Independent School District, she moved with her husband and
two daughters to Bryan, Texas, where she became the chairman of the
mathematics department for the Bryan ISD. In 1979, she returned to Fort Worth,
Texas and worked as a mathematics specialist for the Fort Worth ISD. In 1982,
she returned to teaching, and in 1990, enrolled in the Graduate School of Texas
Christian University. In 1993, Susan was awarded a Master of Math Education
degree. From 1995 until 2001, she was employed as the Head of the Upper School
at Saint Mary’s Hall, San Antonio, Texas. She was accepted into the Cooperative
Superintendency Program at the University of Texas in Austin, Texas in 1999.
Susan currently serves as the Head of School at St. Francis Episcopal Day School
in Houston.
Permanent Address: 4807 Pin Oak Park, Apt 5203, Houston, TX 77081.
This dissertation was typed by the author.