COPYRIGHT STARTUP ANNUAL REPORT · PDF file · 2018-02-28FOREWORD This year’s...
28
ANNUAL REPORT COPYRIGHT©2017STARTUPMUSTER
-
Upload
nguyenliem -
Category
Documents
-
view
215 -
download
0
Transcript of COPYRIGHT STARTUP ANNUAL REPORT · PDF file · 2018-02-28FOREWORD This year’s...

A N N U A L R E P O R T
COPYRIGHT
©
2017
STARTUP
MUSTER
FOREWORD
This year’s Startup Muster report tells a positive story about Australia’s small but fast-growing emerging technology sector, and the innovation ecosystem more broadly. Since 2016, the number of first-time founders of startups has increased, the revenue of startups grew, the share of startups whose employees have equity or options went up, and the proportion of startups benefitting from incubators or accelerators also increased.
Early Stage Venture Capital Limited Partnerships (ESVCLP) have increased early stage investment from $620 million in 2015-16 to more than $1 billion in 2016-17, ensuring more funding is available to support our emerging technology sector.
Internationally, Australia’s startup footprint continues to grow and Australian startups are making their presence felt overseas. 79 startups have accessed our global landing pads, with each and every one expecting a positive commercial benefit from their involvement.
AustCyber has also been working hard to promote Australian cyber startups overseas, and the Government recently invested $50 million into the industry to help reinforce the positive growth in the sector.
The Government has also provided support for Startup Muster’s connection feature, which enables high quality, timely and mutually beneficial connections between startups and the businesses that support them.
Since 2014, Startup Muster’s reports – and the survey data that underpins them – has filled an essential gap in understanding of our emerging technology sector. I congratulate Startup Muster for producing the 2017 report and I welcome the informed discussions that this latest report will generate.
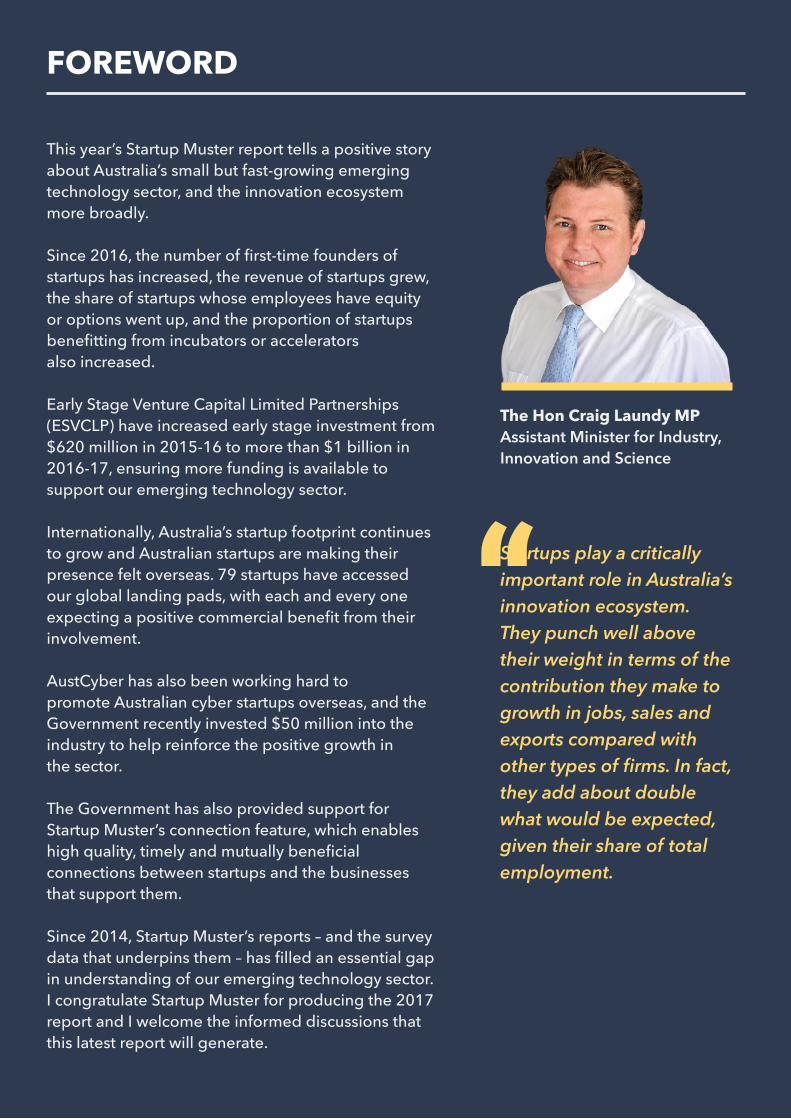
Startups play a critically important role in Australia’s innovation ecosystem. They punch well above their weight in terms of the contribution they make to growth in jobs, sales and exports compared with other types of firms. In fact, they add about double what would be expected, given their share of total employment.
The Hon Craig Laundy MPAssistant Minister for Industry, Innovation and Science

CEO SUMMARY
2017 has been an exciting year for Startup Muster and the local startup ecosystem.
Not only is Australia playing host to more international startup support providers including incubators, accelerator programs, foreign investment and key opinion leaders – but Startup Muster has been lucky enough to contribute to the startup dialog on an international scale. This year we’ve spoken at ecosystem building summits across Germany, and even represented Australia at the G20 Young Entrepreneurs Alliance Summit.
Earlier in the year, the annual Startup Muster national tour saw us traveling far and wide across the country to connect with local startup communities and to build a greater understanding of their challenges, needs and opportunities.
The 19,000+ kilometers travelled coincided with the launch of the 2017 Startup Muster annual collection, and the announcement of some long awaited enhancements: As of 2017, startup founders, businesses that support startups, and individuals thinking of founding a startup will only have to complete the entire survey once. After this, they will have the ability to update their information as they see fit.
Best of all, participating in the Startup Muster survey will be available throughout the year, meaning that new businesses won’t have to wait till the formal collection period.
This year Startup Muster was able to build and launch the connection feature. This feature allows businesses that support startups to be visible and connect with the startups they can specifically assist. This not only minimises the time startups and the support businesses spend trying to find each other, but increases the probability of mutually beneficial outcomes.
The continued development of Startup Muster illustrates our connection and commitment to capturing and accelerating the Australian startup ecosystem, and we look forward to taking things to a new level next year. Deep breath, 2018 is our 5th year anniversary, here we come.
A big thank you to the Startup Muster team: – Murray Hurps– Michael Kedzierski– Tim Paris
And finally, thank you to the Australian startup community for engaging, contributing and championing this work and the community. These are statistics for the community by the community.
MONICA WULFFCEO and Co-founderStartup Muster
– Rick Geremia– Raena Lea-Shannon – Amit Shah
SUPPORTED BY

CONNECTING THE AUSTRALIAN STARTUP COMMUNITY
Sometimes in life success is something we achieve alone, and other times it takes a village. By connecting with the right people at the right time, we’re often unknowingly making choices that can make all the difference between almost reaching a goal, and succeeding beyond our wildest dreams.
This year, Startup Muster is proud to announce the launch of a connection feature, which solves a key problem within the startup community – finding the right support at the right time.
Using Startup Muster survey data, the connection feature links supporters of the startup ecosystem (such as investors, accelerators and professional service providers) with startups they’re in a position to help.
Through our Startup Muster survey questions, supporters can now define the kinds of startups they’d like to support. The connection feature encourages supporters to be specific about the characteristics of the startups they want to work with, by selecting the questions and response
options that their ideal startup would have chosen. This includes everything from location to stage of their business and future business plans.
Next steps include startups receiving a curated list of supporters that have identified the ability to help their particular business, and Startup Muster then connects the two. This list also acts as an education tool, showcasing all of the opportunities available to that specific startup.
At Startup Muster, we know that startups and their environments can change quickly, which is why we now offer the chance for startups to update response fields when their situation changes. The survey and connection feature are available to startups that are new to Startup Muster throughout the year as well.
To take part in Startup Muster as a supporter or a startup, please visit www.startupmuster.com. Here, you can update your information, review your connection lists and provide feedback on previous connections and supporters.
SURVEY METHODOLOGY
The Startup Muster 2017 online survey collection period for Australia was from July 5th until August 14th of 2017 and was available to complete online via www.startupmuster.com. During this time, those engaged in a startup or considering launching startups and businesses that provide support to startups, were able to take part in the survey. From the support community, this included, but wasn’t limited to, accelerators, incubators, investors, mentors, educators, service providers, membership organisations, professional service providers, government and more.
Startup Muster defines a startup as an early stage business that has a large addressable market that utilises technology to capture that market quickly. This definition has also been used by Infocomm Development Authority of Singapore.
In total, 2214 respondents took part, they consisted of 1184 who identified as a startup founder, 472 who identified as wanting to found a startup in the future and 739 who identified as a business that could support startups. Their responses then underwent an exhaustive post survey validation and cleaning process, including manual review of each participant to ensure compliance with our definitions. The final statistical sample for this report consists of 567 verified startup founders, 226 future founders and 452 startup supporters.
The total response rate for each question varied as all the survey responses were not compulsory. Free written text responses were allowed and the relevancy of the questions varied between startups. The report estimates are cross sectional in
nature, meaning that all figures for a given year are based on a responding sample representative of the broader startup population in that year.
Promotion of the survey was conducted via social media channels Facebook, Twitter and LinkedIn, word of mouth through a sharing function built into the survey upon completion, promotion through startup support organisations, media coverage by Anthill, Startup Smart, Startup Daily, InnovationAus, and other media outlets including radio and podcasts.
Our CEO, Monica Wulff, undertook a roadshow across Australia to 13 different cities, meeting with local startup communities, private industry and government. Blogs about the roadshow were shared via LinkedIn, Medium and featured in The Australian.
The launch of the 2017 survey coincided with the launch of the connection feature, which allows supporters to be seen by the startups they’d like to assist. This has led to Startup Muster being open and available to complete, or update, at any time throughout the year. For the purpose of this report only responses provided during the six week timeframe have been included.
For detailed information on the treatment of data after submission, please contact [email protected].
Click here for a CSV downloadof all the statistics in this report.
YEARS SINCE MOVING TO AUSTRALIA
0-55-10
10-1515-2020-2525-30
30+
MOST ATTENDEDEDUCATIONALINSTITUTIONS
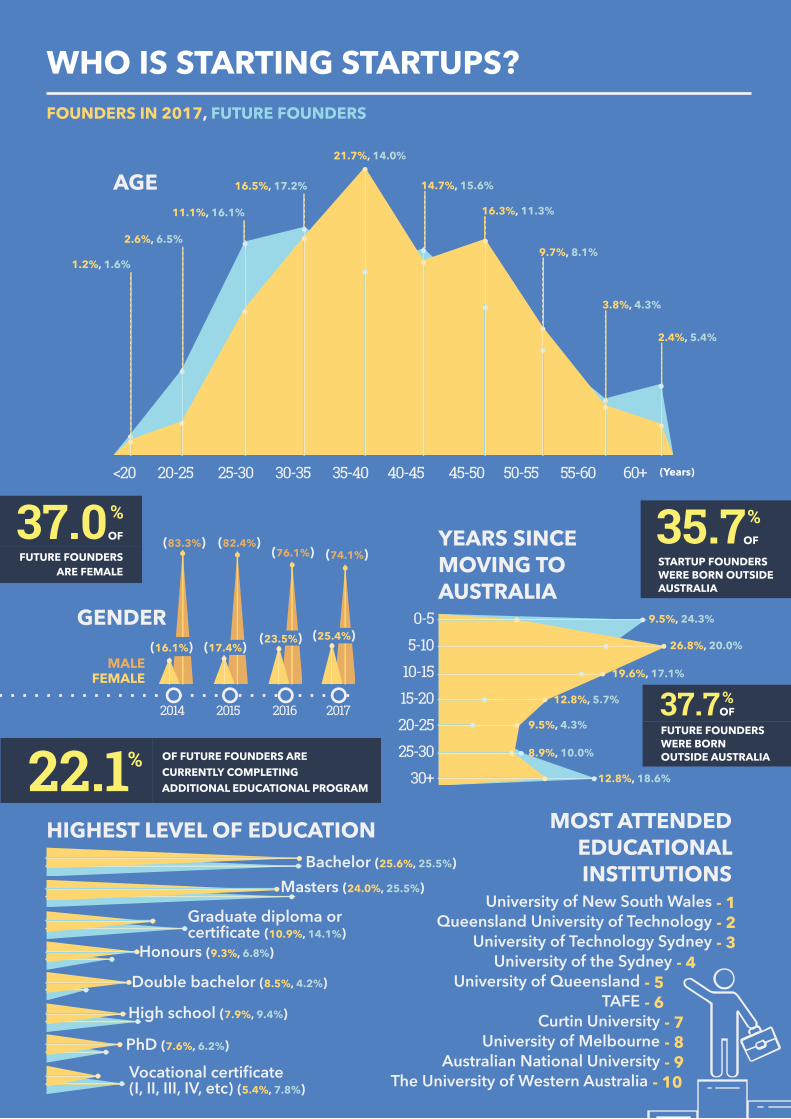
University of New South Wales Queensland University of Technology
University of Technology Sydney University of the Sydney
University of Queensland TAFE
Curtin University University of Melbourne
Australian National University The University of Western Australia
- 1 - 2 - 3 - 4- 5- 6 - 7 - 8 - 9 - 10
HIGHEST LEVEL OF EDUCATION
PhD (7.6%, 6.2%)
Double bachelor (8.5%, 4.2%)
Honours (9.3%, 6.8%)
Vocational certificate(I, II, III, IV, etc) (5.4%, 7.8%)
High school (7.9%, 9.4%)
Graduate diploma or certificate (10.9%, 14.1%)
Bachelor (25.6%, 25.5%)
Masters (24.0%, 25.5%)
8.9%, 10.0%
12.8%, 18.6%
9.5%, 4.3%
12.8%, 5.7%
19.6%, 17.1%
26.8%, 20.0%
9.5%, 24.3%
<20 20-25 25-30 30-35 35-40 40-45 45-50 50-55 55-60 60+
AGE
(Years)
1.2%, 1.6%
2.6%, 6.5%
11.1%, 16.1%
16.5%, 17.2%
21.7%, 14.0%
14.7%, 15.6%
16.3%, 11.3%
9.7%, 8.1%
3.8%, 4.3%
2.4%, 5.4%
WHO IS STARTING STARTUPS?FOUNDERS IN 2017, FUTURE FOUNDERS
35.7 % OF
STARTUP FOUNDERSWERE BORN OUTSIDE AUSTRALIA
37.0 % OF
FUTURE FOUNDERSARE FEMALE
37.7 % OFFUTURE FOUNDERS WERE BORN OUTSIDE AUSTRALIA22.1 % OF FUTURE FOUNDERS ARE
CURRENTLY COMPLETINGADDITIONAL EDUCATIONAL PROGRAM
2015 2016 2017
(17.4%) (23.5%) (25.4%)
2014
GENDER
(82.4%)
(16.1%)
(83.3%)(76.1%) (74.1%)
MALEFEMALE
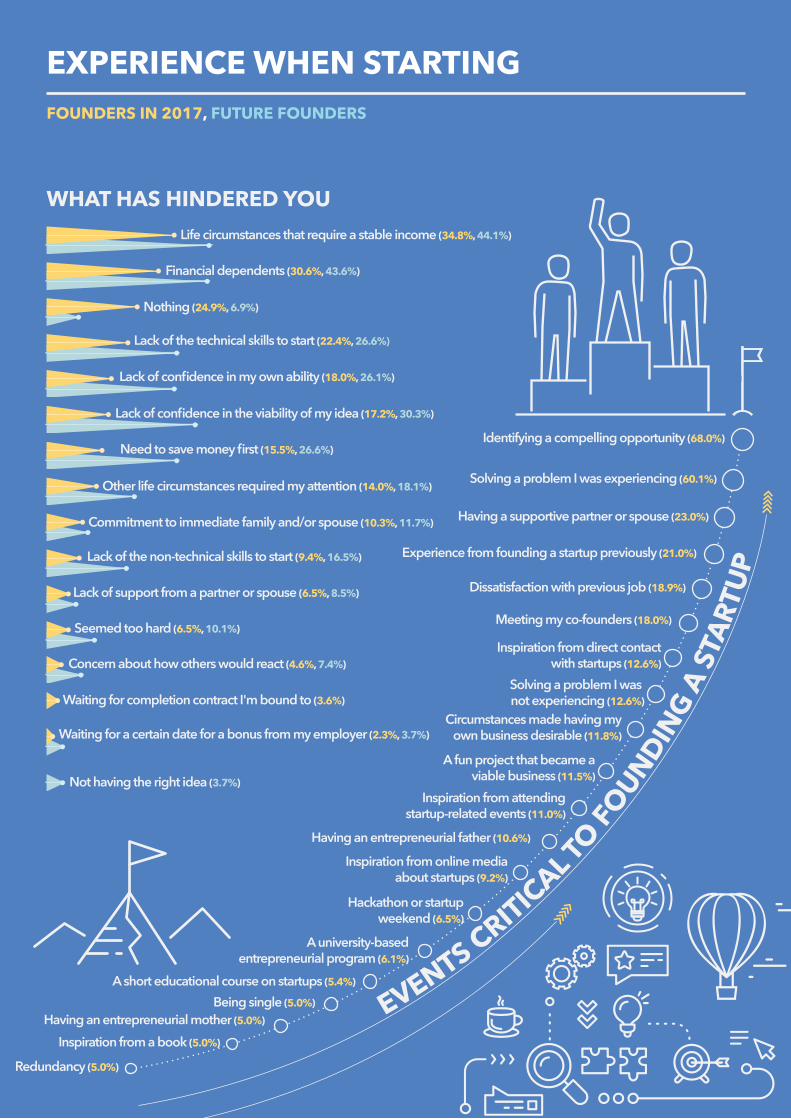
EXPERIENCE WHEN STARTING
EVENTS CRITICAL TO FOUNDING A STARTUP
Identifying a compelling opportunity (68.0%)
Solving a problem I was experiencing (60.1%)
Having a supportive partner or spouse (23.0%)
Experience from founding a startup previously (21.0%)
Dissatisfaction with previous job (18.9%)
Meeting my co-founders (18.0%)
Inspiration from direct contactwith startups (12.6%)
Solving a problem I was not experiencing (12.6%)
Circumstances made having myown business desirable (11.8%)
A fun project that became aviable business (11.5%)
Inspiration from attendingstartup-related events (11.0%)
Having an entrepreneurial father (10.6%)
Inspiration from online mediaabout startups (9.2%)
Hackathon or startupweekend (6.5%)
A short educational course on startups (5.4%)
Being single (5.0%)Having an entrepreneurial mother (5.0%)
Inspiration from a book (5.0%)
Redundancy (5.0%)
A university-basedentrepreneurial program (6.1%)
Life circumstances that require a stable income (34.8%, 44.1%)
Financial dependents (30.6%, 43.6%)
Nothing (24.9%, 6.9%)
Lack of the technical skills to start (22.4%, 26.6%)
Lack of confidence in my own ability (18.0%, 26.1%)
Lack of confidence in the viability of my idea (17.2%, 30.3%)
Need to save money first (15.5%, 26.6%)
Other life circumstances required my attention (14.0%, 18.1%)
Commitment to immediate family and/or spouse (10.3%, 11.7%)
Lack of the non-technical skills to start (9.4%, 16.5%)
Lack of support from a partner or spouse (6.5%, 8.5%)
Seemed too hard (6.5%, 10.1%)
Concern about how others would react (4.6%, 7.4%)
Waiting for completion contract I'm bound to (3.6%)
Waiting for a certain date for a bonus from my employer (2.3%, 3.7%)
Not having the right idea (3.7%)
WHAT HAS HINDERED YOU
FOUNDERS IN 2017, FUTURE FOUNDERS
E
VENTS CRITICAL TO FO
UNDING A
STA
RTUP
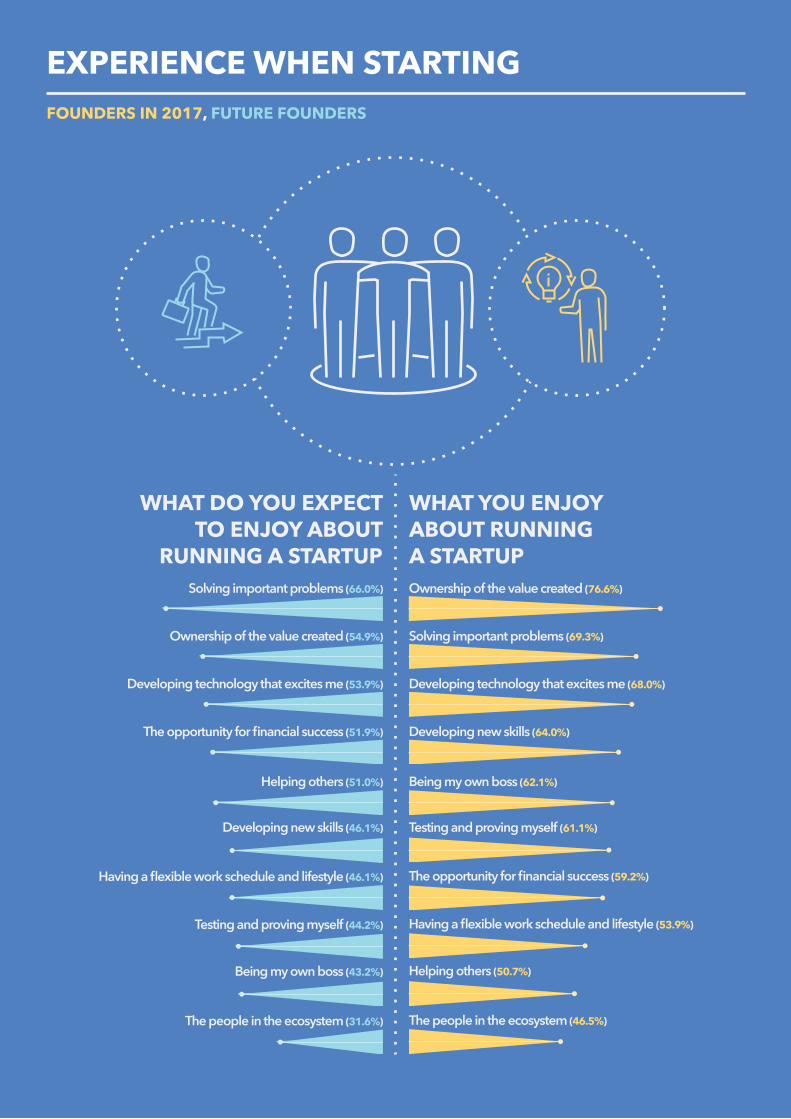
EXPERIENCE WHEN STARTING
Solving important problems (66.0%)
Ownership of the value created (54.9%)
Developing technology that excites me (53.9%)
The opportunity for financial success (51.9%)
Helping others (51.0%)
Developing new skills (46.1%)
Having a flexible work schedule and lifestyle (46.1%)
Testing and proving myself (44.2%)
Being my own boss (43.2%)
The people in the ecosystem (31.6%)
Ownership of the value created (76.6%)
Developing new skills (64.0%)
Solving important problems (69.3%)
Developing technology that excites me (68.0%)
Being my own boss (62.1%)
Testing and proving myself (61.1%)
The opportunity for financial success (59.2%)
Having a flexible work schedule and lifestyle (53.9%)
Helping others (50.7%)
The people in the ecosystem (46.5%)
WHAT YOU ENJOYABOUT RUNNINGA STARTUP
WHAT DO YOU EXPECTTO ENJOY ABOUT
RUNNING A STARTUP
FOUNDERS IN 2017, FUTURE FOUNDERS

59.1%, 54.6%
18.9%, 25.4%
10.5%, 8.6%
6.1%, 6.4%2.9%, 2.1%
1 2 3 4 5+
Stra
tegy
(63.
0%, 5
3.4%
)
Gene
ral b
usine
ss op
erati
ons (
53.5
%, 4
2.4%
)
Proje
ct m
anag
emen
t (40.
8%, 4
2.4%
)
Sales
/ bus
iness
dev
elopm
ent (3
7.0%
, 26.
2%)
Prod
uct m
anag
emen
t (33.
5%, 2
8.8%
)
Mar
ketin
g (2
7.0%
, 32.
5%)
Custo
mer
servi
ce (2
4.6%
, 33.
5%)
Softw
are d
evelo
pmen
t (22
.3%
, 27.
2%)
Finan
cial m
anag
emen
t (19
.8%
, 13.
1%)
Cont
ent c
reati
on (1
9.2%
, 20.
9%)
Busin
ess o
pera
tions
in ov
erse
as m
arke
ts (1
3.7%
, 13.
1%)
UX d
esig
n (1
3.5%
, 11.
0%)
Data
scien
ce / a
nalys
is (1
3.0%
, 19.
9%)
Gran
t writ
ing (1
1.2%
, 12.
6%)
Publ
ic re
lation
s (1
0.9%
, 13.
1%)
Acco
untin
g (1
0.3%
)Sc
ientifi
c res
earch
(10.
1%, 1
1.5%
)
Grap
hic d
esig
n (9
.3%
, 13.
6%)
Oth
er (2
3.6%
, 26.
7%)
Lega
l (6.
7%)
HR / r
ecru
itmen
t (7.4
%, 1
0.5%
)
SKILLS THEY CONSIDER THEMSELVES STRONG IN
0
STARTUPS FOUNDEDPREVIOUSLY
2.5%, 2.8%
SKILLS AND EXPERIENCEFOUNDERS IN 2017, FUTURE FOUNDERS
Passed on company to another (1.9%)
Product too advanced for market (1.9%)
Struggled to recruit the talent needed (1.9%)
Struggled with procurement processes used by the target market (1.9%)
Struggled working inside within the industry (1.9%)
Struggled to be accepted into an accelerator or incubator (7.5%)
Acquired (3.8%)
Still operating (47.0%, 37.7%)
I’m still actively involved (17.8%, 17.0%)
Lost enthusiasm for the idea (10.5%, 15.1%)
Gained a significant user base, but struggled to monetise (9.1%, 13.2%)
Struggled to gain a sufficient user base (11.9%, 11.3%)
Struggled to raise the needed funding (11.4%, 11.3%)
I sold my equity for an amount I'm happy with (16.0%, 9.4%)
Found a better idea to work on (19.2%, 5.7%)
Struggled with team dynamics (8.2%, 5.7%)
I sold my equity for less than I thought it was worth (5.0%, 3.8%)
Circumstances required me to finda better-paying occupation (5.9%, 28.3%)
STATUS OF LAST STARTUP
27.5 OF
FUTURE FOUNDERS HAVE PREVIOUSLY
FOUNDED A STARTUP
%
• FOUNDERS IN 2016
1 2 3 4 5+
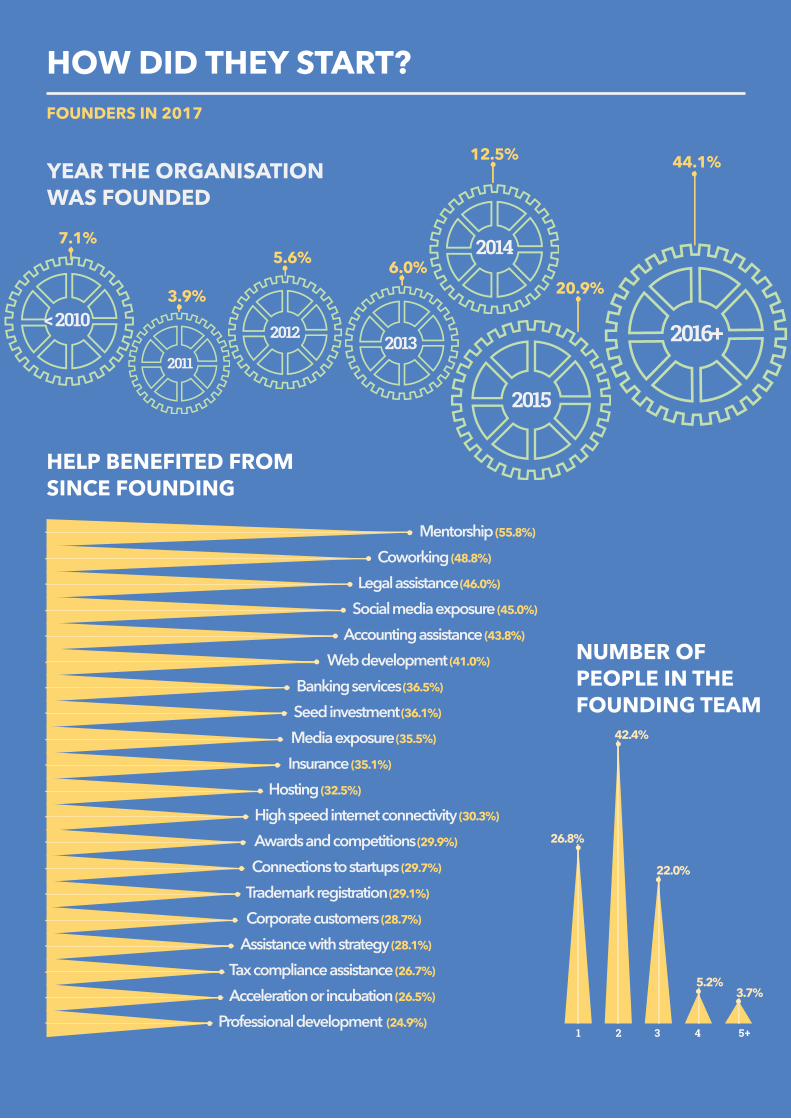
< 2010
2011
2012 2013
2015
2014
2016+
7.1%
42.4%
3.7%
3.9%
5.6% 6.0%
12.5%
20.9%
44.1%YEAR THE ORGANISATIONWAS FOUNDED
NUMBER OFPEOPLE IN THE FOUNDING TEAM
26.8%
22.0%
5.2%
HELP BENEFITED FROM SINCE FOUNDING
Mentorship (55.8%)
Coworking (48.8%)
Legal assistance (46.0%)
Social media exposure (45.0%)
Accounting assistance (43.8%)
Web development (41.0%)
Banking services (36.5%)
Seed investment (36.1%)
Media exposure (35.5%)
Insurance (35.1%)
Hosting (32.5%)
High speed internet connectivity (30.3%)
Awards and competitions (29.9%)
Connections to startups (29.7%)
Trademark registration (29.1%)
Corporate customers (28.7%)
Assistance with strategy (28.1%)
Tax compliance assistance (26.7%)
Acceleration or incubation (26.5%)
Professional development (24.9%)
HOW DID THEY START?FOUNDERS IN 2017
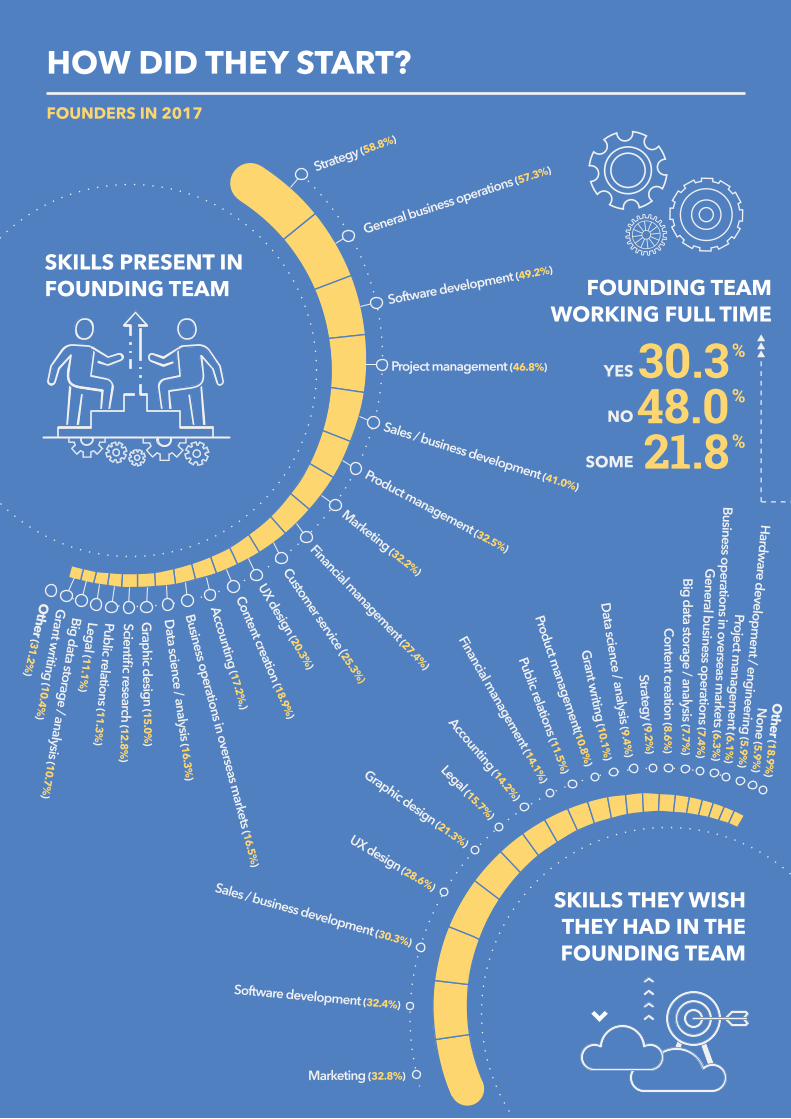
SKILLS PRESENT IN FOUNDING TEAM FOUNDING TEAM
WORKING FULL TIME
30.3 %YES
48.0 %NO
21.8 %SOME
HOW DID THEY START?
SKILLS THEY WISHTHEY HAD IN THEFOUNDING TEAM
Marketing (32.8%)
Software development (32.4%)
Sales / business development (30.3%)
UX design (28.6%)
Graphic design (21.3%)
Legal (15.7%)
Accounting (14.2%)
Financial managem
ent (14.1%)
Public relations (11.5%)
Product managem
ent(10.8%)
Grant writing (10.1%
)Data science / analysis (9.4%
)Strategy (9.2%
)Content creation (8.6%
)
Big data storage / analysis (7.7%)
General business operations (7.4%
)
Business operations in overseas markets (6.3%
)
Project managem
ent (6.1%)
Hardware developm
ent / engineering (5.9%)
None (5.9%
)
FOUNDERS IN 2017
Strategy (58.8%)
Other (31.2%
)
Other (18.9%
)
General business operations (57.3%)
Software development (49.2%)
Project management (46.8%)
Sales / business development (41.0%)Product management (32.5%)
Marketing (32.2%)
Financial management (27.4%)
Customer service (25.3%)
UX design (20.3%)
Content creation (18.9%)
Accounting (17.2%,)
Business operations in overseas markets (16.5%
)
Data science / analysis (16.3%)
Graphic design (15.0%
)
Scientific research (12.8%)
Public relations (11.3%)
Legal (11.1%)
Big data storage / analysis (10.7%)
Grant w
riting (10.4%)

39.4%
36.3%
15.2%14.7%
13.4% 13.4%
9.0%10.3%
5.2%5.9%4.2%
3.5%
1.2%1.1%
SydneyRest of: QLD (5.6%, 6.4%) , NSW (4.6%, 4.8%) , VIC (1.0%, 1.5%) , TAS (0.6%, 0.6%) , WA (0.4%, 1.2%) , SA (0.2%, 0.2%)
Canberra HobartMelbourne AdelaidePerthBrisbane
NSWACT
VIC
TAS
QLD
SA 44.0%/ 41.1%
4.2%/ 3.5%
20.8% / 21.0%
WA9.4%/ 11.5%
5.4%/ 6.1%
%1.8 %/ 1.7
14.4%/ 14.9%
OFFICE LOCATION
TOP 10COWORKINGSPACES USED
FishburnersWeWork
River City Labs Stone & Chalk
Spacecubed York Butter Factory
Hub Regus
Flux Inspire9
WORK LOCATIONS CURRENTLY IN USE Home office (54.6%) Coworking space (48.8%) Our own office (29.3%) Cafes / restaurants / etc (19.1%) Anywhere I can use or tether my smart devices (16.2%) Incubator / accelerator office (11.1%) Public spaces (9.5%) On public transport (7.3%) Client offices (7.1%) Serviced office (6.2%) University campus (6.2%) Public libraries (4.7%) An innovation-focused area in a university (3.1%) Membership lounge (2.9%)Laboratory or research facility (1.6%)
WHERE ARE THEY?FOUNDERS IN 2017, ALL PARTICIPANTS IN 2017
1
34
5
6
7
8
9
10
2
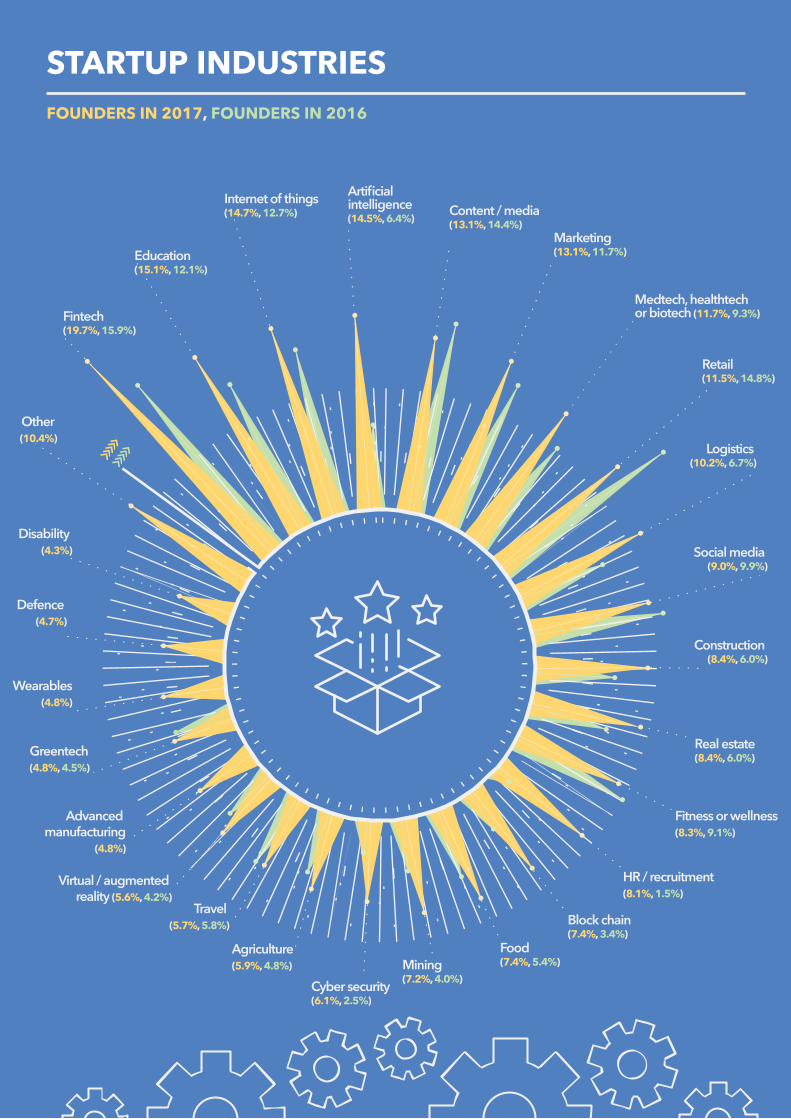
STARTUP INDUSTRIESFOUNDERS IN 2017, FOUNDERS IN 2016
Fintech (19.7%, 15.9%)
Education (15.1%, 12.1%)
Internet of things (14.7%, 12.7%)
Artificial intelligence (14.5%, 6.4%)
Cyber security (6.1%, 2.5%)
Block chain (7.4%, 3.4%)
Content / media (13.1%, 14.4%)
Marketing (13.1%, 11.7%)
Medtech, healthtech or biotech (11.7%, 9.3%)
Logistics (10.2%, 6.7%)
Social media (9.0%, 9.9%)
Construction (8.4%, 6.0%)
Real estate (8.4%, 6.0%)
Fitness or wellness (8.3%, 9.1%)
HR / recruitment (8.1%, 1.5%)
Food (7.4%, 5.4%)Mining
(7.2%, 4.0%)
Agriculture (5.9%, 4.8%)
Travel (5.7%, 5.8%)
Virtual / augmented reality (5.6%, 4.2%)
Advanced manufacturing
(4.8%)
Greentech (4.8%, 4.5%)
Wearables(4.8%)
Defence (4.7%)
Disability (4.3%)
Other (10.4%)
Retail (11.5%, 14.8%)
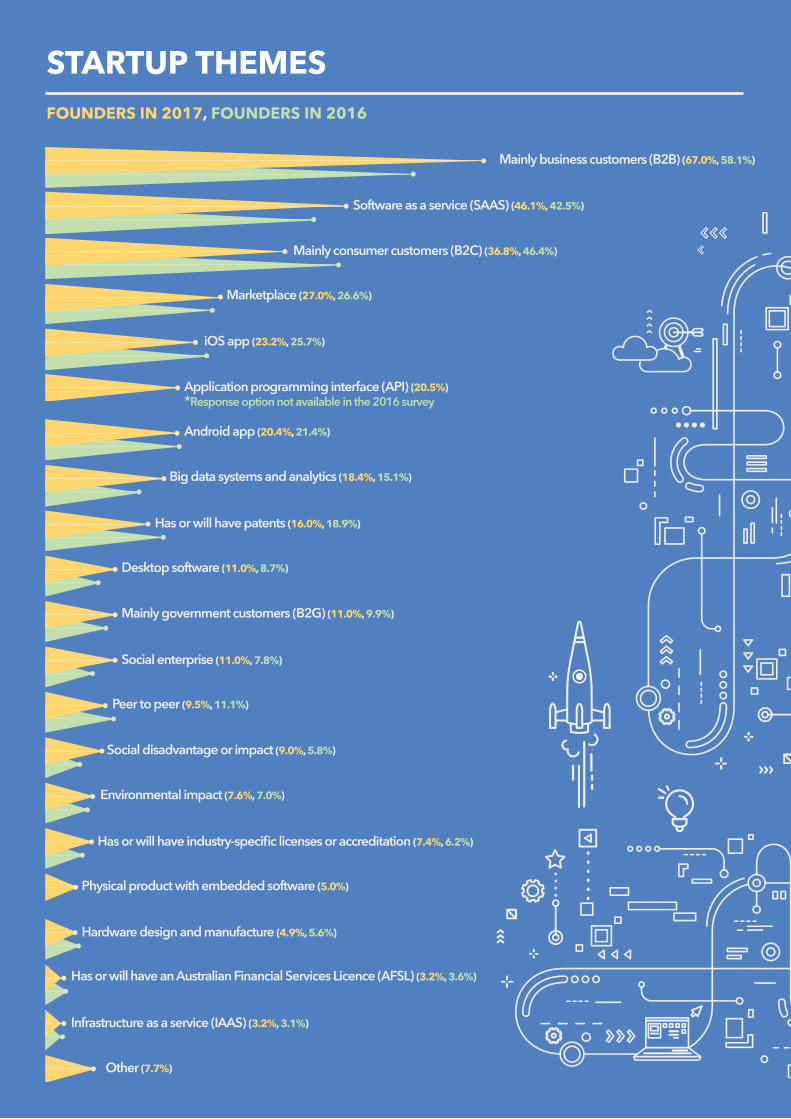
STARTUP THEMESFOUNDERS IN 2017, FOUNDERS IN 2016
Software as a service (SAAS) (46.1%, 42.5%)
Application programming interface (API) (20.5%)*Response option not available in the 2016 survey
Physical product with embedded software (5.0%)
Other (7.7%)
Mainly business customers (B2B) (67.0%, 58.1%)
Mainly consumer customers (B2C) (36.8%, 46.4%)
Marketplace (27.0%, 26.6%)
iOS app (23.2%, 25.7%)
Android app (20.4%, 21.4%)
Big data systems and analytics (18.4%, 15.1%)
Has or will have patents (16.0%, 18.9%)
Desktop software (11.0%, 8.7%)
Mainly government customers (B2G) (11.0%, 9.9%)
Social enterprise (11.0%, 7.8%)
Peer to peer (9.5%, 11.1%)
Social disadvantage or impact (9.0%, 5.8%)
Environmental impact (7.6%, 7.0%)
Has or will have industry-specific licenses or accreditation (7.4%, 6.2%)
Hardware design and manufacture (4.9%, 5.6%)
Has or will have an Australian Financial Services Licence (AFSL) (3.2%, 3.6%)
Infrastructure as a service (IAAS) (3.2%, 3.1%)
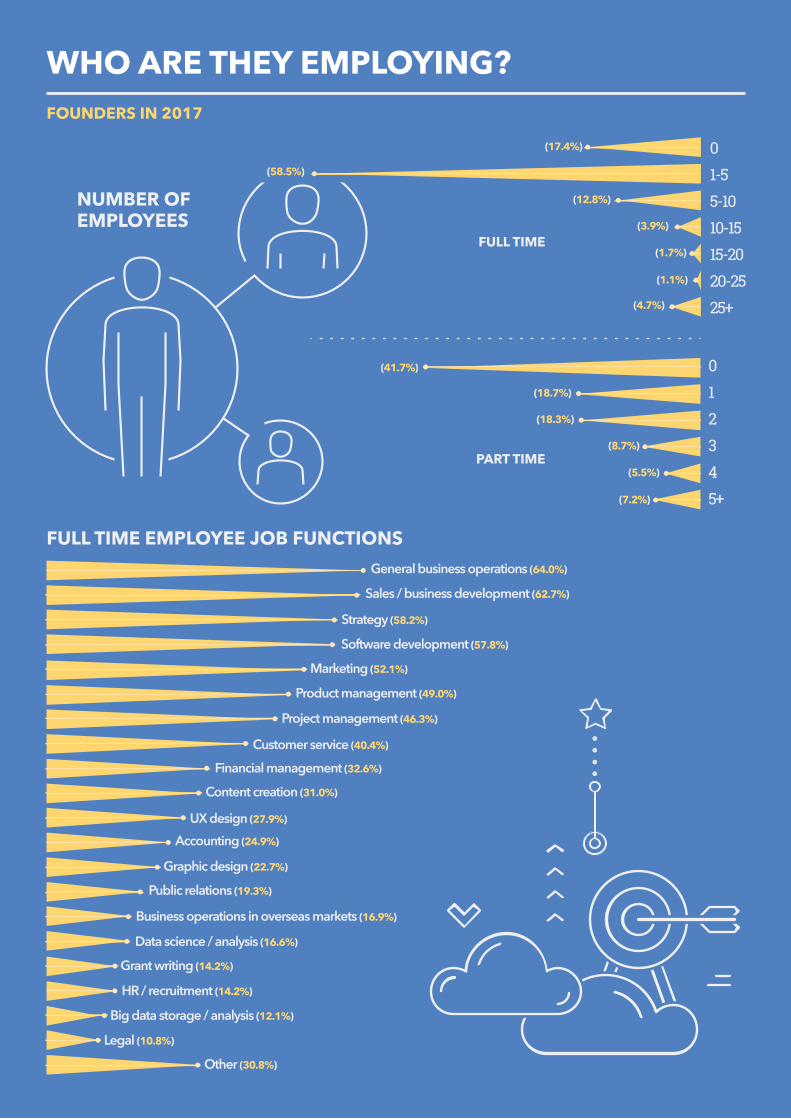
WHO ARE THEY EMPLOYING?FOUNDERS IN 2017
NUMBER OFEMPLOYEES
(17.4%)
(58.5%)
(12.8%)
(3.9%)
(1.7%)
(1.1%)
(4.7%)
01-55-1010-1515-2020-2525+
FULL TIME
012345+
(41.7%)
(18.7%)
(18.3%)
(8.7%)
(5.5%)
(7.2%)
PART TIME
General business operations (64.0%)
Sales / business development (62.7%)
Strategy (58.2%)
Software development (57.8%)
Marketing (52.1%)
Product management (49.0%)
Project management (46.3%)
Customer service (40.4%)
Financial management (32.6%)
Content creation (31.0%)
UX design (27.9%)
Accounting (24.9%)
Graphic design (22.7%)
Public relations (19.3%)
Business operations in overseas markets (16.9%)
Data science / analysis (16.6%)
Grant writing (14.2%)
HR / recruitment (14.2%)
Big data storage / analysis (12.1%)
Legal (10.8%)
Other (30.8%)
FULL TIME EMPLOYEE JOB FUNCTIONS
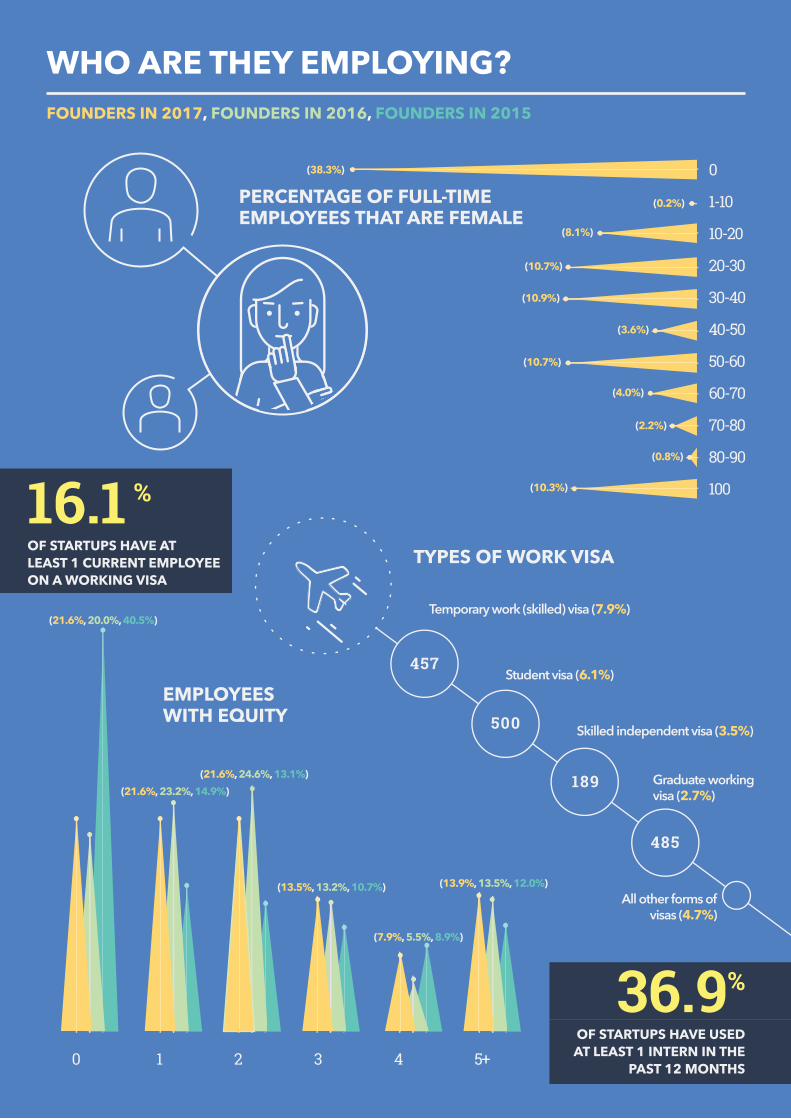
WHO ARE THEY EMPLOYING?
PERCENTAGE OF FULL-TIME EMPLOYEES THAT ARE FEMALE
TYPES OF WORK VISA
0
1-10
10-20
20-30
30-40
40-50
50-60
60-70
70-80
80-90
100 (10.3%)
(0.8%)
(2.2%)
(4.0%)
(10.7%)
(3.6%)
(10.9%)
(10.7%)
(8.1%)
(0.2%)
(38.3%)
EMPLOYEES WITH EQUITY
(21.6%, 20.0%, 40.5%)
(21.6%, 23.2%, 14.9%) (21.6%, 24.6%, 13.1%)
(13.5%, 13.2%, 10.7%)
(7.9%, 5.5%, 8.9%)
(13.9%, 13.5%, 12.0%)
0 1 2 3 4 5+
Temporary work (skilled) visa (7.9%)
Skilled independent visa (3.5%)
Graduate working visa (2.7%)
All other forms ofvisas (4.7%)
Student visa (6.1%)457
500
189
485
16.1 %OF STARTUPS HAVE AT LEAST 1 CURRENT EMPLOYEE ON A WORKING VISA
36.9 %OF STARTUPS HAVE USEDAT LEAST 1 INTERN IN THE
PAST 12 MONTHS
FOUNDERS IN 2017, FOUNDERS IN 2016, FOUNDERS IN 2015

KEY FUNCTIONS PERFORMED BY ALL OUTSOURCED WORKERSAccounting (50.1%)
Legal (46.8%)
Software development (44.6%)
Graphic design (42.6%)
UX design (29.0%)
Marketing (20.8%)
Content creation (14.9%)
Financial management (9.5%)
Public relations (9.5%)
Grant writing (8.0%)
Sales / business development (6.7%)
Strategy (6.4%)
Hardware development / engineering (5.5%)
General business operations (4.7%)
Other engineering (4.7%)
Product management (4.7%)
Data science / analysis (4.4%)
HR / recruitment (4.4%)
Project management (4.4%)
Customer service (4.0%)
Other (19.5%)
0 1 2 3 4 5 6 7 8 9 10+
NUMBER OF PEOPLE USED FOR OUTSOURCED WORK IN THE LAST 12MONTHS
14.6%13.6%
12.8%
8.6%10.0%
6.5%
2.5%3.8%
17.0%
1.3%
9.2%
71.7%7.3%
5.5%
5.0%
9.0%
Australia
India
Philippines
USA
All others
PRIMARY COUNTRY OF ALL OUTSOURCED WORKERS
WHO ARE THEY CONTRACTING?FOUNDERS IN 2017

REVENUE IN PAST 12 MONTHS
$0
$1 - $10k
$10k - $100k
$100k - $1m
$1m - $10m
$10m+ 0.8%
18.4%
21.7%
13.2%
40.4%
5.5%25.9 %
OF STARTUPS HAD REVENUEGENERATED FROM EXPORT
SALES IN THE LAST 12 MONTHS
Subs
cript
ions (
32.9
%, 3
6.4%
)Pu
rchas
es fro
m ou
r web
site (
11.1
%, 1
4.3%
)
Trans
actio
n fee
s (10
.6%
, 11.
2%)
Purch
ases
thro
ugh a
noth
er m
edium
(8.1
%, 4
.6%
)Lic
ensin
g / f
ranc
hising
(3.8
, 3.1
%)
App
purch
ases
(3.0
%, 2
.4%
)Co
mm
ission
s paid
to us
for r
efer
rals
(2.8
%, 5
.5%
)
Purch
ases
from
a ph
ysica
l sto
re (2
.5%
)
Disp
laying
adve
rtisin
g
(2.3
%, 2
.4%
)
Oth
er (1
4.8%
, 7.5
%)
Servi
ces b
illed
by th
e hou
r (8.1
%, 8
.1%
)LARGEST REVENUE SOURCES
AUSTRALIA (83.8%)
USA (10.2%)
UK (2.3%)
ALL OTHER (4.1%)
COUNTRY WITH THE MAJORITY OF
CUSTOMERS
REVENUE AND SALESFOUNDERS IN 2017, FOUNDERS IN 2016
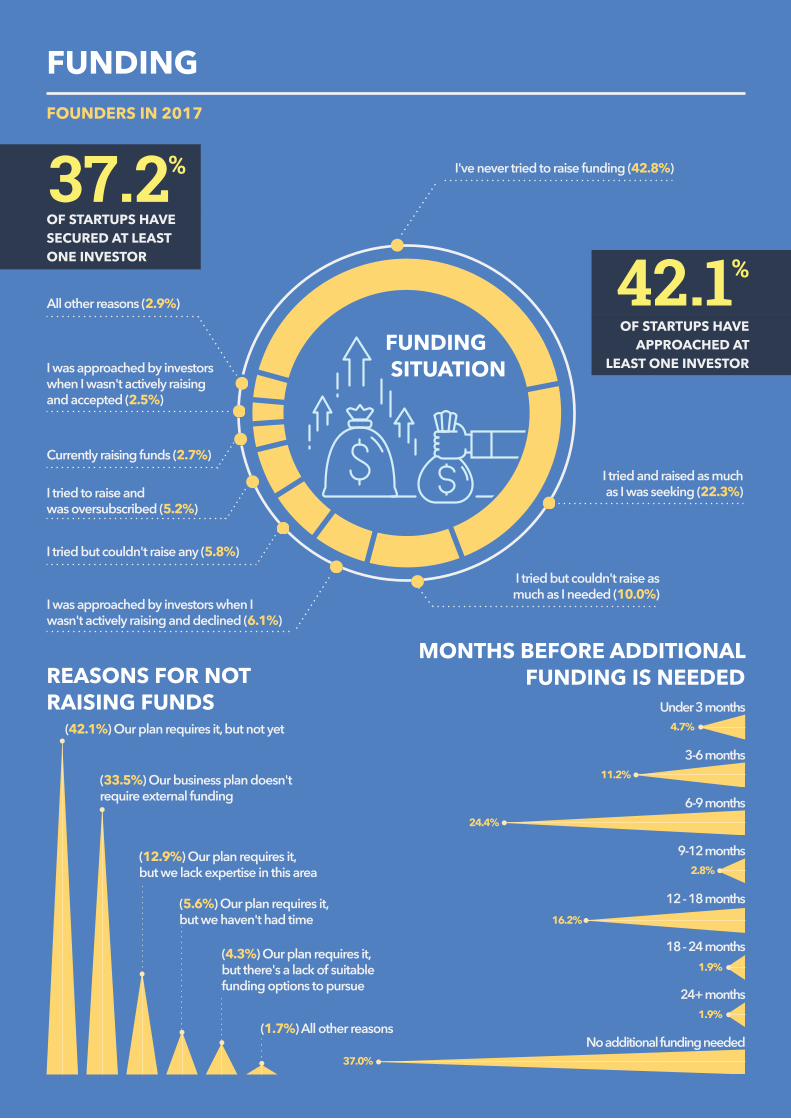
FUNDINGFOUNDERS IN 2017
I've never tried to raise funding (42.8%)
I tried and raised as muchas I was seeking (22.3%)
I tried but couldn't raise asmuch as I needed (10.0%)
All other reasons (2.9%)
Currently raising funds (2.7%)
I tried but couldn't raise any (5.8%)
I tried to raise and was oversubscribed (5.2%)
I was approached by investors when I wasn't actively raising and accepted (2.5%)
I was approached by investors when I wasn't actively raising and declined (6.1%)
FUNDING SITUATION
REASONS FOR NOT RAISING FUNDS
42.1 %OF STARTUPS HAVE
APPROACHED ATLEAST ONE INVESTOR
37.2 %OF STARTUPS HAVE SECURED AT LEAST ONE INVESTOR
(42.1%) Our plan requires it, but not yet
(33.5%) Our business plan doesn't require external funding
(12.9%) Our plan requires it, but we lack expertise in this area
(5.6%) Our plan requires it, but we haven't had time
(4.3%) Our plan requires it, but there's a lack of suitable funding options to pursue
(1.7%) All other reasons
MONTHS BEFORE ADDITIONALFUNDING IS NEEDED
4.7%
11.2%
24.4%
16.2%
Under 3 months
3-6 months
6-9 months
9-12 months
12 - 18 months
18 - 24 months
24+ months
No additional funding needed
2.8%
1.9%
1.9%
37.0%

FUNDINGFOUNDERS IN 2017, FOUNDERS IN 2016
My own cash contributions (67.1%, 70.6%)
Family and friends (32.7%, 28.8%)
Private equity in Australia (29.1%, 32.6%)
R&D tax offset (26.3%, 22.6%)
Credit card (15.0%, 14.9%)
Accelerator or incubator investment (13.0%)
State government grant (10.6%, 7.5%)
Federal government grant (7.7%, 5.2%)
Prize money (7.5%)
Private equity overseas (7.3%, 4.3%)
Bank loan (6.6%, 8.2%)
Private equity in the form of a convertiblenote in Australia (6.4%, 7.8%)
Local government grant (3.3%, 1.6%)
Private equity in the form of a convertiblenote overseas (2.2%, 2.1%)
In my state (65.9%)
In another state (25.1%)
In many different locations (20.6%)
In another country (16.1%)
TYPE OF FUNDING RECEIVED
20162017
AMOUNT OF EQUITY HELD BY INVESTORS
LOCATIONOF INVESTORS
1% - 10%
10% - 20%
20% - 30%
30% - 40%
40% - 50%
50% - 60%
60% - 70%
70% - 80%
80% - 99%
100%
11.3%
20.7%
23.3%
16.7%
9.3%
2.0%
4.0%
2.7%
1.3%
8.7%
34.2 % OF STARTUPS HAVE EQUITY HELD BY INVESTORS

IMPACTFOUNDERS IN 2017, FOUNDERS IN 2016, FOUNDERS IN 2015
PLANNED SIZEOF NEXT RAISE
$1 - $10K
$10K - $100K
$100K - $1m
$1m - $10m
$10m+ (3.1%)
(5.8%)
(42.9%)
(44.6%)
(1.4%)
(33.3%)
(12.1%)
(17.7%)
(6.9%)
(60.6%)
(2.7%)
(45.5%)
(15.8%)
(16.0%)
(16.8%)
(5.5%)
(6.5%)
(21.9%)
(10.6%)
(26.6%)
TOTAL FUNDING RECEIVED
$0
$1 - $10K
$10 - $100K
$100k - $1m
$1m - $10m
$10m+ (0.4%) (1.1%)

GOVERNMENTFOUNDERS IN 2017
GRANTS MOST COMMONLY APPLIED FOR
GRANT APPLICATION DIFFICULTIES
GRANTS MOST COMMONLY RECEIVED
R&D Tax Incentive
Accelerating
Ignite Ideas
MVP Grant
EMDG
R&D Tax Incentive
Accelerating commercialisation
MVP Grant
EMDG
ICon
1
2
3
4
5
1
2
3
4
5
29.2 %OF STARTUPS HAVE
SUCCESSFULLY RECEIVEDA GRANT OR SCHOLARSHIP
47.7 %OF STARTUPS HAVE
APPLIED FOR A GRANTOR SCHOLARSHIP
Nothing comes to mind (35.8%)
Time consuming (17.5%)
Amount of work/detail required (7.7%)
Criteria are confusing (4.9%)
Lengthy process (3.3%)
Time to reach outcome (2.8%)
Professional help is required (2.4%)
Biased to specific type of applicant (2.0%)
Finding information on what grants are available/relevant (2.0%)
Lack of feedback (2.0%)
commercialisation

RECOM
MENDED M
EETUPS AND MEMBERSHIP ORGANISATIONS
Startup Victoria
Silicon Beach
Sydney Startups
Morning Startup
Like Minded Bitches Drinking Wine
Startup Grind
Fintech Australia
Founder Institute
Innovation Bay
Australian Institute of Company Directors
RECOMMENDED BOOKSThe Lean Startup - Eric Ries (47.1%)
No books (32.7%)
Zero To One - Peter Thiel (23.3%)
The Hard Thing About Hard Things - Ben Horowitz (15.0%)
The Innovators Dilemma - Clayton Christensen (11.3%)
Purple Cow - Seth Godin (10.7%)
Running Lean - Ash Maurya (10.3%)
Lean In - Nell Scovell & Sheryl Sandberg (8.4%)
Hooked - Nir Eyal (8.2%)
Creativity Inc - Ed Catmull (4.5%)
Startup Focus - Mick Liubinskas & Phil Morle (3.5%)The Startup Of You - Reid Hoffman
& Ben Casnocha (3.3%)Other (19.8%)
COMMUNITY & RESOURCESFOUNDERS IN 2017, FOUNDERS IN 2016
NEWS SOURCES FREQUENTED
YouTube (50.3%)Stack Overflow / Stack
Exchange (27.8%)Quora (23.1%)
No online educational resources (21.1%)
Udemy (20.9%)
Facebook groups (20.7%)
Coursera (14.5%)
Code Academy (10.2%)
Khan Academy (10.2%)
Lynda (9.4%)
edX (6.3%)
Udacity (5.1%)
OpenLearning (2.9%)
Other (5.9%)
RECOMMENDEDONLINE RESOURCES
STARTUP EVENTS ATTENDED PER MONTH
0 1 2 3 4 5+
(23.4%)
(35.2%)
(16.6%)
(9.2%) (7.6%)
(8.0%)
TechCrunch (42.0%, 40.4%)
Startup Daily (44.7%, 43.7%)
Australian Financial Review (41.0%, 29.6%)
Business Insider (34.2%, 24.4%)
Startup Smart (34.2%, 44.0%)
Sydney Morning Herald (31.7%, 19.6%)
The Australian (24.2%, 15.4%)
Forbes (19.1%, 16.4%)
No particular news sources used frequently (16.1%, 20.1%)
Hacker News (12.8%, 12.5%)
BRW (12.4%, 15.3%)
InnovationAus.com (11.8%)
Paul Bennetts Email (10.6%)
Silicon Beach (6.0%, 9.1%)
This Week in Startups (5.4%, 5.6%)
Slashdot (5.2%, 3.0`%)
Ideas Hoist (2.5%, 3.3%)
Other blog/website (15.9%, 7.0%)
42.4 %OF STARTUPS WOULD
STRONGLY RECOMMENDA MEMBERSHIP BASED
ORGANISATION OR MEETUP

FOUNDERS IN 2017, FUTURE FOUNDERS
SUPPORT NEEDED
Media exposure (40.4%)Mentorship (39.4%)
Seed investment (37.2%)
Mentorship (60.6%)Seed investment (44.1%)
Assistance with strategy (32.4%)Web development (31.2%)
Social media exposure (30.6%)
Acceleration or incubation (28.2%)Coworking (26.5%)
Professional development (training through any medium) (25.3%)Corporate customers (24.1%)
Connections to startups (23.5%)Education on how to raise investment (23.5%)
Legal assistance (22.9%)Media exposure (22.4%)
Tax compliance assistance (22.4%)Creative services (21.8%)
Professional coachingent (21.8%)An event to participate in (20.6%)
Insuranceshipent (18.2%)Regulatory compliance and licensingt (18.2%)
Assistance applying for grants and scolarshipsnt (19.4%)
Social media exposure (32.5%)
Corporate customers (30.7%)
A round investment (30.3%)
Assistance with strategy (24.8%)
Legal assistance (24.4%)
Web development (22.4%)
Awards and competitions (21.2%)Accounting assistance (19.6%)
Government customers (19.4%)
Internships (18.2%)Trademark registration (17.0%)
Coworking (15.2%)Other kinds of investment (14.9%)
Assistance recruiting staff (14.7%) Creative services (14.5%)Promotion of a type other than advertising or media (14.5%)
Assistance with connecting or expanding into overseas markets (18.4%)
NEEDS INTHE NEXT 6 MONTHS
NEEDS INTHE NEXT
6 MONTHS

Mentor (19.5%)
Professional services provider (16.3%)
Coworking space (3.8%)
Digital or creative agency (3.8%)Incubator (3.8%)
Innovation hub (3.8%)Professional coach (3.5%)
Accelerator (3.2%)Education provider (not a university) (3.2%)
Investment fund (3.2%)Membership-based organisation (2.9%)
Individual investor (2.6%)Legal services provider (2.6%)
SAAS product relevant to startups (2.3%)
Media (2.0%)Other (23.5%)
SUPPORTER TYPE
Assistance recruiting board members (14.0%)Awards and competitions (14.6%)
Corporate customers (15.5%)
Event space (16.6%)
Assistance recruiting staff (16.9%) Assistance with connecting or expanding into overseas markets (17.2%)
Assistance applying for grants and scolarships (19.8%)
Coworking (19.8%)
Media exposure (20.1%)Seed investment (20.7%)
Acceleration or incubation (23.9%)Connections to startups looking for support (24.8%)
An event to participate in (25.4%)Professional coaching (26.2%)
Professional development (training through any medium) (28.0%)
Education on how to raise investment (28.9%)Social media exposure (30.3%)
Connections to startups (35.9%)Assistance with strategy (56.3%)
Mentorship (67.9%)
SUPPORT PROVIDED
WHO’S HELPING STARTUPS?SUPPORTERS IN 2017
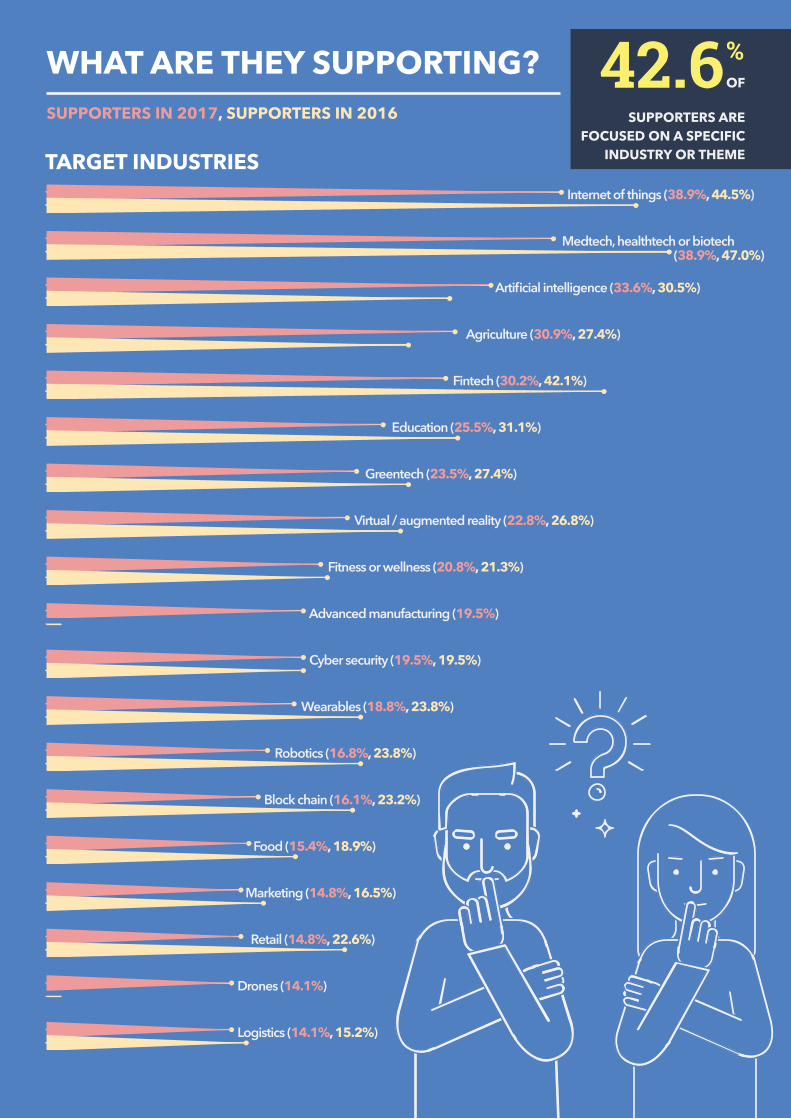
Internet of things (38.9%, 44.5%)
Medtech, healthtech or biotech
Artificial intelligence (33.6%, 30.5%)
Agriculture (30.9%, 27.4%)
Fintech (30.2%, 42.1%)
Education (25.5%, 31.1%)
Greentech (23.5%, 27.4%)
Virtual / augmented reality (22.8%, 26.8%)
Fitness or wellness (20.8%, 21.3%)
Advanced manufacturing (19.5%)
Cyber security (19.5%, 19.5%)
Wearables (18.8%, 23.8%)
Robotics (16.8%, 23.8%)
Block chain (16.1%, 23.2%)
Food (15.4%, 18.9%)
Marketing (14.8%, 16.5%)
Retail (14.8%, 22.6%)
Drones (14.1%)
Logistics (14.1%, 15.2%)
(38.9%, 47.0%)
TARGET INDUSTRIES
42.6 %OF
SUPPORTERS AREFOCUSED ON A SPECIFIC
INDUSTRY OR THEME
WHAT ARE THEY SUPPORTING?SUPPORTERS IN 2017, SUPPORTERS IN 2016

PLANS FOR THENEXT 12 MONTHS
PLANS AFTER 12 MONTHS
FUTURE PLANSFOUNDERS IN 2017, FOUNDERS IN 2016
Under
take
capi
tal r
aising
in Aus
tralia
(60%
, 59.
1%)
Expa
nd sa
les si
gnific
antly
insid
e Aus
tralia
(57.
5%, 6
4.9%
)
Expa
nd sa
les si
gnific
antly
outsi
de A
ustra
lia (3
7.9%
, 43.
1%)
Under
take
capi
tal r
aising
over
seas
(29.
0%, 2
4.7%
)
Trave
l ove
rseas
to ta
ke p
art in
a pr
ogra
m
that
will
add
value
to th
e org
anisa
tion (
18.5
%, 1
5.8%
)
Open a
noth
er of
fice o
verse
as (1
7.7%
, 12.
5%)
Mov
e to a
larg
er of
fice i
n Aus
tralia
(16.
9%, 1
3.4%
)
Rene
w my o
ffice
leas
e in A
ustra
lia (5
.0%
, 4.3
%)
No spe
cific p
lans (
4.8%
, 4.9
%)
Mov
e our
prim
ary o
ffice
over
seas
(4.4
%, 4
.2%
)
Sell t
he or
ganis
atio
n to a
fore
ign p
urch
aser
(2.7
%, 3
.8%
)
Sell t
he or
ganis
atio
n to a
n
Austra
lian p
urch
aser
(2.7
%, 3
.8%
)
Mov
e to a
n offi
ce of
sim
ilar
size i
n Aus
tralia
(2.3
%)
Other
(1.5
%)
Expand sales
significantly
outside Australia
(49.1%, 52.3%)
Expand sales significantly
inside Australia (42.6%, 46.0%)
Undertake capital raising overseas (25.9%, 29.5%)
Undertake capital raising in Australia (22.1%, 26.0%)
Open another office overseas (21.5%, 17.1%)
Move to a larger office in Australia (20.7%, 12.9%)
No specific plans (14.8%, 12.9%)
Travel overseas to take part in a program that
will add value to the organisation (12.5%, 12.4%)
Sell the organisation to a foreign purchaser (10.0%, 12.9%)
Sell the organisation to an Australian purchaser (6.3%, 11.7%)
List on the ASX (4.0%, 5.9%)
Move our primary office overseas (3.3%, 3.3%)
List on a foreign exchange (2.3%, 2.3%)
Other (0.2%)
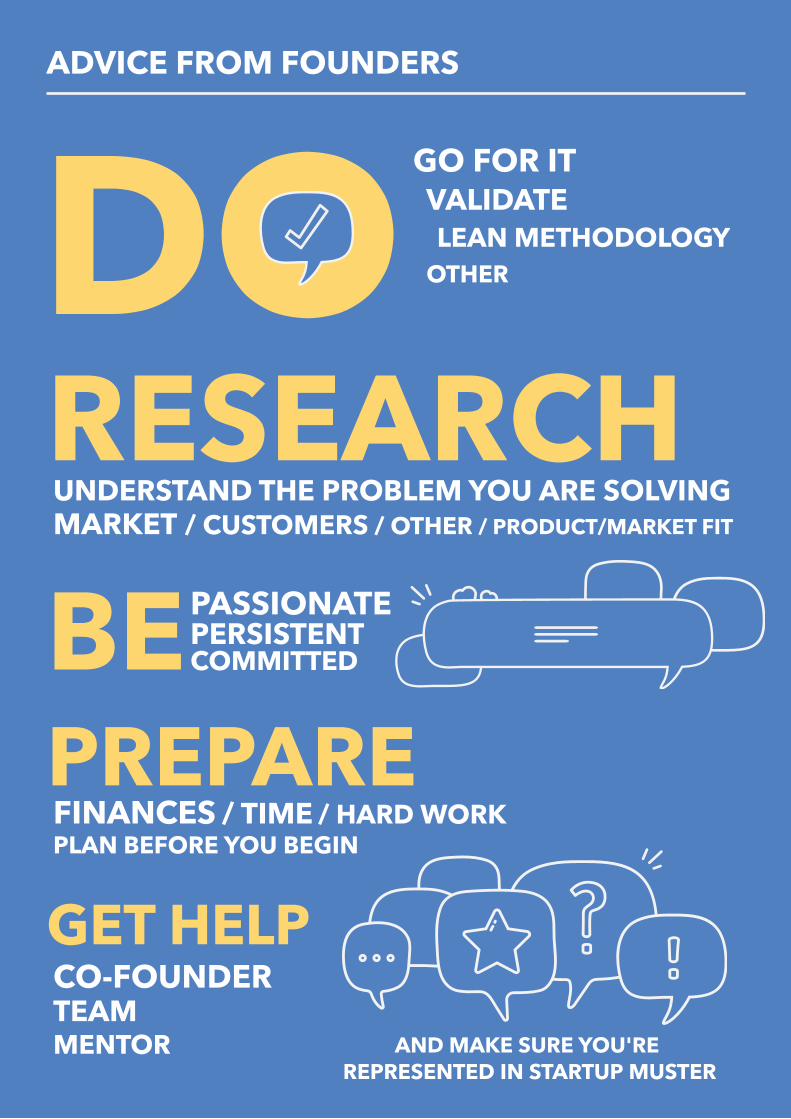
PREPARE
ADVICE FROM FOUNDERS
FINANCES
GET HELPCO-FOUNDERTEAMMENTOR
/ TIME / HARD WORKPLAN BEFORE YOU BEGIN
PASSIONATEPERSISTENTCOMMITTEDBE
RESEARCHUNDERSTAND THE PROBLEM YOU ARE SOLVINGMARKET / CUSTOMERS / OTHER / PRODUCT/MARKET FIT
GO FOR ITVALIDATELEAN METHODOLOGY
OTHER
AND MAKE SURE YOU'RE REPRESENTED IN STARTUP MUSTER
DO