© Copyright Statement Diesel/Devall... · FRANCISM.DEVALL August, 2000 Prepared by: ... case of...
12
© Copyright Statement All rights reserved. All material in this document is, unless otherwise stated, the property of FPC International, Inc. Copyright and other intellectual property laws protect these materials. Reproduction or retransmission of the materials, in whole or in part, in any manner, without the prior written consent of the copyright holder, is a violation of copyright law.
Transcript of © Copyright Statement Diesel/Devall... · FRANCISM.DEVALL August, 2000 Prepared by: ... case of...

© Copyright Statement All rights reserved. All material in this document is, unless otherwise stated, the property of FPC International, Inc. Copyright and other intellectual property laws protect these materials. Reproduction or retransmission of the materials, in whole or in part, in any manner, without the prior written consent of the copyright holder, is a violation of copyright law.
FPC-2 FUEL CATALYST TESTFOR
FUEL EFFICIENCY & EMISSIONSREDUCTIONS BYDEVALL DIESEL
ON THEFRANCIS M. DEVALL
August, 2000
Prepared by:
FPe International, Inc.P.O. BOX 129
PAYSON, UTAH 84097USA
Tel: (801) 465-4123Fax: (801) 465-2955

CONTENTS
Executive Summary Page 1
Introduction Page 1
Test Method Page 2
Instrumentation Page 2
Test Results Page 2-5
Conclusion Page 5
Appendix
"A" Carbon Balance Printouts
"B" Raw Data Sheets
"e" Measurements using Carbon BalanceTechniques

EXECUTIVE SUMMARYThe FPC Catalysts manufactured and marketed by FPC INTERNATIONAL have provenin laboratory and field testing, to reduce fuel consumption in the range 3% to 10% undercomparable load conditions, and to also significantly reduce carbon emissions.
Following discussions with Manager of Devall Diesel, Mr. Mike Devall, it was agreedthat an FPC fuel efficiency study should be conducted on a twin engine, 16V92 Detroitpowered tug boat, operating in the Gulf of Mexico.
Although both engines were operated on FPC fuel catalyst dosed fuel, only one enginewas subjected to the test procedure to determine the effect of the fuel catalyst upon fueleconomy and emissions. A baseline test was conducted, after which the engines weretreated by pouring the catalyst down the sounding tubes.
The 16V92 engine treated with FPC showed an average 10% improved fuel efficiencyduring steady-state testing (bollard pull).
The treated engine also demonstrated a large percentage reduction in smoke in the range31%, and a 50% reduction in carbon monoxide emissions. Carbon Dioxide reductions,based upon the measured reduction in fuel consumption, are also substantial.
INTRODUCTIONBaseline (untreated) fuel efficiency tests were conducted on the 16V92 main engine on 5June, 2000, employing the carbon mass balance (CMB) test procedure.
FPC International supplied three cases of FPC catalyst, containing one gallon containersthat could be carried onboard the Francis M. Devall tor the duration of the test period. Theone gallon containers had graduated treatment markings, which made it easy forcrew members to measure the correct quantity of the catalyst, to pour into the tanks witheach fuelling. The tugboat, Francis M. Devall, was operated on FPC catalyst treated fuel
Pagel

for several hundred hours in order to achieve the complete conditioning of the engineobserved in many laboratories and field studies.
At the end of the engine-conditioning period (July 25, 2000), the engine test was repeatedreproducing all engine parameters. The results of this study are documented in this report.
TEST METHODCarbon Mass Balance (CMB) is a procedure whereby the mass of carbon in the exhaust iscalculated as a measure of the fuel being burned. The elements measured in this testinclude the exhaust gas composition, its temperature and the gas flow rate calculated fromthe differential pressure and exhaust stack cross sectional area. The CMB is central to theboth US-EPA (FTP and HFET) and Australian engineering standard tests (AS2077-1982),although in field testing we are unable to employ a chassis dynamometer. However, in thecase of tugboat trials, the engine can be loaded by means of a bollard pull type testprocedure, simulating a dynamometer.
The carbon balance formulae and equations employed in calculating the carbon flow arecontained in the Appendices.
INSTRUlvfENTATIONPrecision state of the art instrumentation was used to measure the concentrations of carboncontaining gases in the exhaust stream, and other factors related to fuel consumption andengine performance. The instnunents and their purpose are listed below:
«Measuremeru of exhaust gas constituents HC, CO, CO2 and O2 by Horiba-Mexa 4gas infrared gas analyser.• Temperature measurement by Fluke Model 52K1J digital thermometer .• Exhaust differential pressure by Dwyer Magnehelic .•Ambient pressure determination by use of Thommen 2000 TXaltimeter/barometer.• The exhaust smoke particulates are also measured during this test program.• Exhaust gas sample evaluation of particulate by use of a Bacharach TrueSpotsmoke meter.«The Horiba infrared gas analyser was serviced and calibrated prior to each seriesof engine efficiency tests.
TEST RESULTS
1. Fuel EfficiencyA summary of the CMB fuel efficiency results achieved in this test program are provided inthe following table
Page 2

TABLE!Baseline (untreated) and FPC treated fuel CMB data and calculated rate offuel flow
FPC International CARBONBALANCERESULTS
COMPANY Devall LOCATION: Port ArthurDiesel
EQUIPMENT Tugboat UNITNR. : FrancisM.Devall
ENG. TYPE Detroit MODEL 16V92Diesel
RATING FUEL #2D
BASELINE TEST DATE 06105/00
ENG. HOURSIMILES: ENG.RPM: 1550AMB. TEMP (C): 27.3 STACK(mm): 250BAROMETRIC(mb): 1020 LOAD: full push
TEST I TEST 2 TEST 3 TEST 4 TEST 5 AVERAGE % ST.DEVPRES DIFF (Pa): 1417 1417 1417 1417 1417 1417 0.00EXHST TEMP (C): 263.6 263.8 264.7 263.8 269.4 265 0.93HC (ppm) 10 20 20 10 10 14.0 39.12CO(%) 0.06 0.06 0.06 0.06 0.06 0.060 0.00C02 (%) 8.21 8.25 8.28 8.33 8.26 8.27 0.5302(%) 11.70 11.72 11.52 11.70 12.40 11.81 2.89
CARE FLOW(gls): 59.201 59.516 59.687 60.043 59.209 59.531 0.59
REYNOLDS NR. : 1.47E+05
TREATED TEST DATE 7/25/00
ENG. HOURSIMILE:AMB. TEMP (C) :BAROMETRIC(mb):
2100 miles34.21020
ENG.RPM:STACK(mm):LOAD:
1555250
full push
TEST I TEST 2 TEST 3 TEST 4 TEST 5 AVERAGE % ST.DEVPRES DIFF (pa): 1601 1601 1601 1601 1601 1601 0.00EXHST TEMP (C): 282.1 292.7 298.9 309.8 312.7 299 4.19HC (ppm) 20 20 20 20 20 20.0 0.00CO(%) 0.03 0.03 0.03 0.03 0.03 0.030 0.00C02 (%) 7.12 7.12 7.22 7.23 7.31 7.20 1.1202(%) 10.72 12.95 13.50 13.64 13.52 12.87 9.55
CARE FLOW(gls): 53.619 53.032 53.456 53.021 53.473 53.320 0.52
REYNOLDS NR. : 1.51E+05 TOT AL HOURSIMILES ON 2100 milesTREATED FUEL:
PERCENTAGE CHANGE IN FUEL CONSUMPTION «TREATED-BASE)/BASE*100): -10.4 %
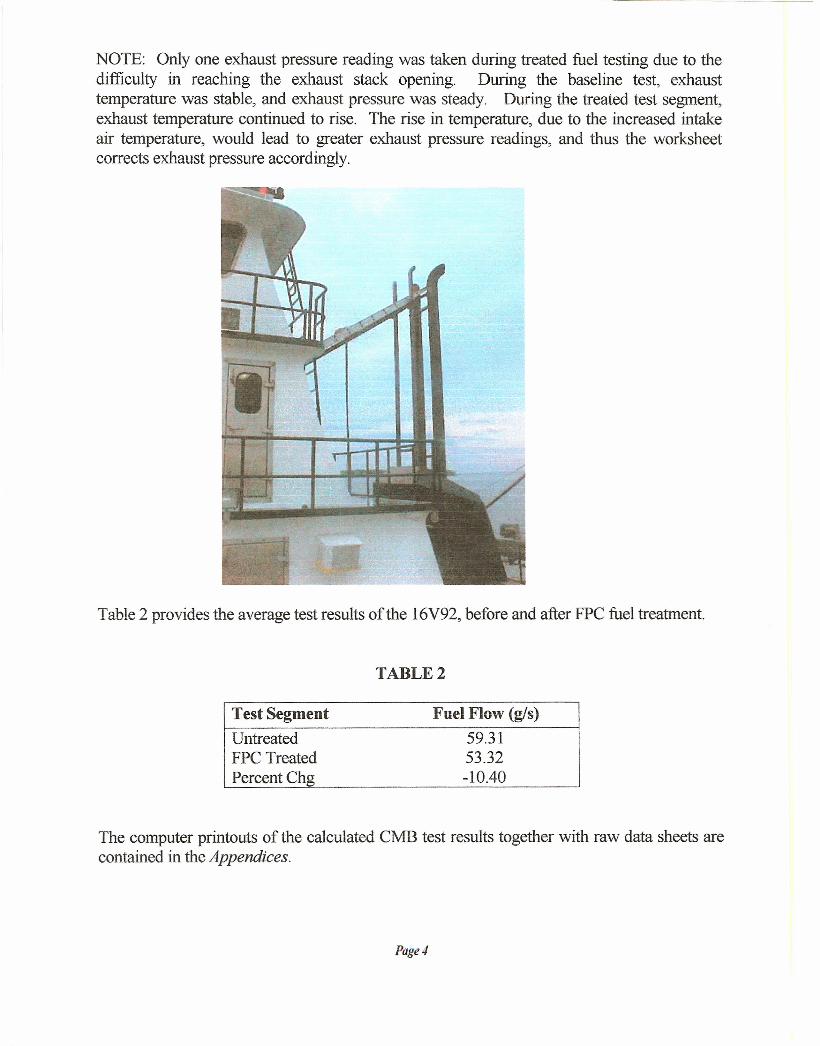
NOTE: Only one exhaust pressure reading was taken during treated fuel testing due to thedifficulty in reaching the exhaust stack opening. During the baseline test, exhausttemperature was stable, and exhaust pressure was steady. During the treated test segment,exhaust temperature continued to rise. The rise in temperature, due to the increased intakeair temperature, would lead to greater exhaust pressure readings, and thus the worksheetcorrects exhaust pressure accordingly.
Table 2 provides the average test results ofthe 16V92, before and after FPC fuel treatment.
TABLE 2
UntreatedFPC TreatedPercentChg
59.3153.32-10AO
Test Segment Fuel Flow (gls)
The computer printouts of the calculated CMB test results together with raw data sheets arecontained in the Appendices.
Pag£!4
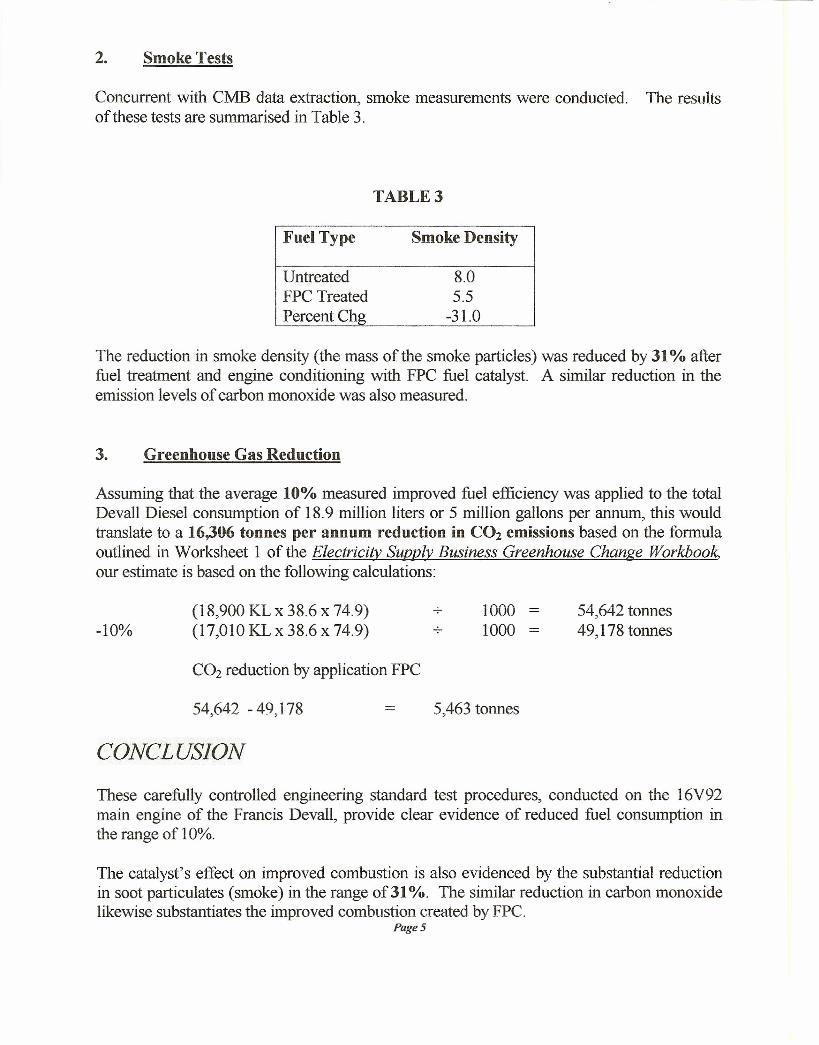
2. Smoke Tests
Concurrent with CMB data extraction, smoke measurements were conducted. The resultsof these tests are summarised in Table 3.
TABLE 3
UntreatedFPC TreatedPercentChg
8.05.5-31.0
Fuel Type Smoke Density
The reduction in smoke density (the mass of the smoke particles) was reduced by 31% afterfuel treatment and engine conditioning with FPC fuel catalyst. A similar reduction in theemission levels of carbon monoxide was also measured.
3. Greenhouse Gas Reduction
Assuming that the average 10% measured improved fuel efficiency was applied to the totalDevall Diesel consumption of 18.9 million liters or 5 million gallons per annum, this wouldtranslate to a 16,306 tonnes per annum reduction in CO2 emissions based on the formulaoutlined in Worksheet 1 of the Electricity Supply Business Greenhouse Change Workbook,our estimate is based on the following calculations:
-10%(18,900 KL x 38.6 x 74.9)(17,010 KL x 38.6 x 74.9)
10001000
54,642 tonnes49,178 tonnes
CO2 reduction by application FPC
54,642 - 49,178 5,463 tonnes
CONCLUSION
These carefully controlled engineering standard test procedures, conducted on the 16V92main engine of the Francis Devall, provide clear evidence of reduced fuel consumption inthe range of 10%.
The catalyst's effect on improved combustion is also evidenced by the substantial reductionin soot particulates (smoke) in the range of31 %. The similar reduction in carbon monoxidelikewise substantiates the improved combustion created by FPC.
PageS
A fuel efficiency gain of 10% over the entire Devall Diesel fleet would reduce CO2
emissions by 5,463 tonnes per annum.
Additional to the fuel economy benefits measured and a reduction in smoke and greenhousegas emissions, a significant reduction, over time, in engine maintenance costs will berealised following treatment with FPC-2. These savings are achieved through lower sootlevels in the engine lubricating oil, which is a result of more complete combustion of thefuel, thereby reducing engine wear rates and resulting in less carbon build-up in combustionareas. FPC also acts as an effective biocide. Experience in North America has alsodemonstrated a substantial reduction in track wayside fires following the introduction of thecatalyst to the fuel supply.

APPENDIX "A"
COMPUTER PRINTOUTS

APPENDIX NB"
RAW DATA SHEETS

Appendix "C"
Measurements using Carbon Balance Techniques