Materials Design and Teaching Yueh-chiu Helen Wang Associate professor National Penghu University.

Copyright
by
Haomin Helen Wang
2013
The Thesis Committee for Haomin Helen Wang Certifies that this is the approved version of the following thesis:
Test of Glass Fiber Reinforced Polymer (GFRP) Anchors
APPROVED BY
SUPERVISING COMMITTEE:
James O. Jirsa, Supervisor
Wassim M. Ghannoum, Co-Supervisor

Test of Glass Fiber Reinforced Polymer (GFRP) Anchors
by
Haomin Helen Wang, B.A.
Thesis
Presented to the Faculty of the Graduate School of
The University of Texas at Austin
in Partial Fulfillment
of the Requirements
for the Degree of
Master of Science in Engineering
The University of Texas at Austin
December 2013

Dedication
To my father, who set the bar high and never stopped believing in me.
To my mother, whose unfailing love and support
has carried me through every endeavor.

v
Acknowledgements
My sincere appreciation to Dr. Jirsa, who gave me the generous opportunity to work on
this project and whose supervision and guidance was invaluable to my education. My thanks
also goes to Dr. Ghannoum, whose thoughtful input and consideration during countless hours
of meetings was integral to shaping the direction of this research. Without their suggestions
and encouragement, the completion of this research would not have been possible.
Thanks go to all of the students at the Ferguson Lab who assisted me along the way,
with my research or otherwise, and made my time at the lab that much more enjoyable. In
particular, thanks to Changhyuk Kim for his meticulous guidance with numerous phases of the
project and to the other members of my research group: Will Shekarchi, Nawaf Alotaibi, Wei
Sun, and Shukui Liu. All of whom, among many things, helped me lift a number concrete beams
for my tests. I could not have done it without their help.
Many thanks also go to the Ferguson Lab staff: David Brailey, Blake Stasney, Dennis
Fellip, Eric Schell, Mike Watson, Anise Langley and Michelle Damvar. Their help and technical
assistance was instrumental in the completion of this research.
This research was also made possible by funding from the Texas Department of
Transportation. TxDOT does not endorse, guarantee, or warrant the accuracy, completeness, or
timeliness of these facts, views, or opinions. Additionally, many thanks to Fyfe Co., LLC. for their
generous donation of materials used in this research.
Immeasurable thanks to my parents, whose personal achievements in higher education
and persistent pursuit of excellence has been an example to me and the greatest source of
inspiration for my own achievements. Finally, thanks to Thien-An Nguyen for encouraging me
through the road bumps and for showing me how to have fun around Austin.
vi
Abstract
Test of Glass Fiber Reinforced Polymer (GFRP) Anchors
Haomin Helen Wang, M.S.E.
The University of Texas at Austin, 2013
Supervisor: James O. Jirsa
Co-Supervisor: Wassim M. Ghannoum
A study to investigate the behavior of glass fiber reinforced polymer (GFRP) anchors was
conducted at the Ferguson Structural Engineering Laboratory as part of a project funded by the
Texas Department of Transportation, Project number 0-6873. The purpose of this study was to
test the effectiveness of GFRP anchors by comparing their performance to that of anchors
made from carbon fiber reinforced polymer (CFRP). The findings of this research give insight
into the advantages and disadvantages of using alternative materials in the design of FRP
anchorage systems and provides a means for developing quality control procedures of GFRP
anchors.
Quantitative comparisons were made between results from beam tests that used GFRP
anchors and the results from those that used CFRP anchors. It was found that specimens with
GFRP anchors exhibited similar trends to specimens with CFRP anchors. Similarities were
achieved in concrete cracking loads, strength capacities, and in some cases duration of force
transfer, suggesting that GFRP anchors are equally as effective as CFRP anchors for strength
development.
vii
However, material differences played a major role in the explanation of GFRP and CFRP
behavior. Notable advantages in material handling was observed with the GFRP anchors since
the fibers were found to be easier to bend as well as easier to install into drilled anchor holes.
On the other hand, the lower tensile strength of GFRP presented a potential need for larger
sized anchors to achieve the equivalent strength of a CFRP anchor.
Finally, a pull-out failure mode was observed in GFRP anchors that had not been
previously observed in CFRP anchors. It was suggested that the pull-out failure mode was a
function of differences in deformation capacity between the two materials. However, little
information regarding the cause of performance differences demonstrates the need for quality
control tests for GFRP anchors. As a result, recommendations for further studies were made.
viii
Table of Contents
CHAPTER 1 Introduction ............................................................................................................................... 1
1.1 MOTIVATION ................................................................................................................................. 1
1.2 OVERVIEW ..................................................................................................................................... 1
1.3 PROJECT OBJECTIVES..................................................................................................................... 2
1.4 ORGANIZATION ............................................................................................................................. 2
CHAPTER 2 Literature Review ....................................................................................................................... 3
2.1 FIBER REINFORCED POLYMERS (FRP) ............................................................................................ 3
2.1.1 Composite Materials............................................................................................................ 3
2.1.2 Material Properties of FRP Composites ............................................................................... 4
2.2 USES OF CFRP ................................................................................................................................ 5
2.2.1 Externally Applied Reinforcement ....................................................................................... 5
2.2.2 Anchors ................................................................................................................................ 6
2.3 PAST STUDIES ON CFRP ANCHORS ................................................................................................ 8
2.3.1 Embedment Depth .............................................................................................................. 8
2.3.2 Hole Diameter ...................................................................................................................... 8
2.3.3 Bend Radius ......................................................................................................................... 9
2.3.4 Size ..................................................................................................................................... 10
2.3.5 End Geometry .................................................................................................................... 12
2.3.6 Spacing ............................................................................................................................... 14
2.4 GFRP ANCHORS ........................................................................................................................... 14
2.4.1 Motivation ......................................................................................................................... 14
2.4.2 Background on Glass Fiber Reinforced Polymers (GFRP) .................................................. 15
2.5 QUALITY CONTROL TEST METHODS ............................................................................................ 16
2.5.1 Flexural Test of Small Beams ............................................................................................. 16
2.5.2 Two-Block Tension Test ..................................................................................................... 17
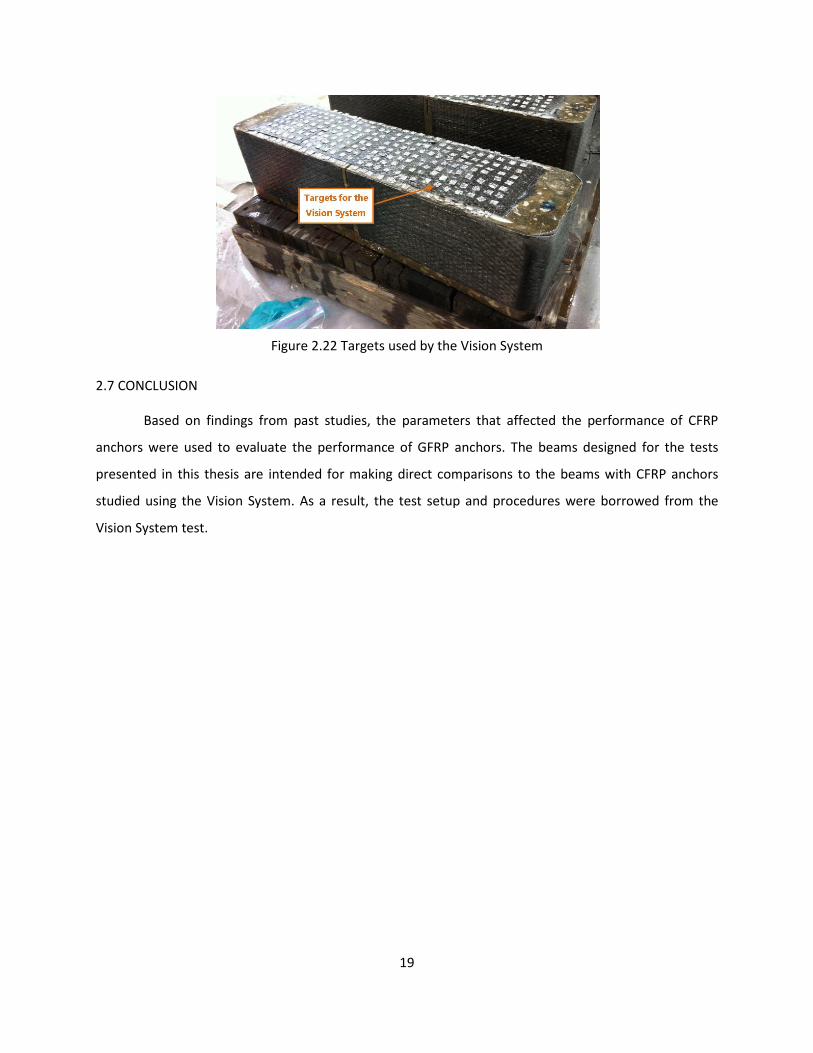
2.5.3 Flexural Test of Small Beams with Vision System .............................................................. 18
2.7 CONCLUSION ............................................................................................................................... 19
CHAPTER 3 Experimental Program ............................................................................................................. 20
3.1 OVERVIEW ................................................................................................................................... 20
3.2 TEST SPECIMEN DESIGN .............................................................................................................. 20
3.3 DEFINITIONS ................................................................................................................................ 22
3.4 ANCHOR DESIGN ......................................................................................................................... 23
ix
3.5 MATERIAL PROPERTIES ............................................................................................................... 24
3.5.1 Concrete ............................................................................................................................ 24
3.5.2 CFRP and GFRP................................................................................................................... 25
3.6 SPECIMEN PREPARATION FOR FRP USE ...................................................................................... 26
3.6.1 ACI 440 Recommendation for Specimen Preparation ....................................................... 26
3.6.2 Surface Preparation ........................................................................................................... 26
3.6.3 Anchor Hole Preparation ................................................................................................... 27
3.6.4 Mid-span Notch Preparation ............................................................................................. 28
3.7 CFRP AND GFRP INSTALLATION PROCEDURES ............................................................................ 29
3.7.1 CFRP Sheet Preparation ..................................................................................................... 29
3.7.2 GFRP Anchor Preparation .................................................................................................. 30
3.7.3 Epoxy Preparation ............................................................................................................. 31
3.7.4 Applying FRP Materials onto Beams .................................................................................. 33
3.8 TESTING ....................................................................................................................................... 33
3.8.1 Instrumentation ................................................................................................................. 33
3.8.2 Hydro-stone ....................................................................................................................... 35
3.8.3 Test Frame and Setup ........................................................................................................ 37
CHAPTER 4 Test Results .............................................................................................................................. 39
4.1 INTRODUCTION ........................................................................................................................... 39
4.2 VARIABLES ................................................................................................................................... 39
4.3 SUMMARY OF FAILURE METHOD AND ULTIMATE LOAD ............................................................ 40
4.4 TEST RESULTS .............................................................................................................................. 41
4.4.1 Bonded Specimen: 9 – 3 – 1/2 – B1 and 9 – 3 – 1/2 – B2 .................................................. 41
4.4.2 Bonded Specimen: 9 – 3 – 5/8 – B1 and 9 – 3 – 5/8 – B2 .................................................. 43
4.4.3 Unbonded Specimen: 9 – 3 – 5/8 – D1 and 9 – 3 – 5/8 – D2 ............................................. 44
4.4.4 Bonded Specimen: 9 – 5 – 5/8 – B1 and 9 – 5 – 5/8 – B2 .................................................. 45
4.4.5 Unbonded Specimen: 9 – 5 – 5/8 – D1 .............................................................................. 48
4.5 DISCUSSION OF THE FAILURE MODES ......................................................................................... 49
4.5.1 CFRP Rupture ..................................................................................................................... 49
4.5.2 Anchor Pull-out .................................................................................................................. 50
4.6 ANCHOR PERFORMANCE COMPARISON ..................................................................................... 52
4.6.1 Parameters for Comparison .............................................................................................. 52
4.6.2 Bonded CFRP Sheet – 5 in. ................................................................................................. 53
x
4.6.3 Bonded CFRP Sheet – 3 in. ................................................................................................. 55
4.6.4 Unbonded CFRP Sheet – 5 in. ............................................................................................ 56
CHAPTER 5 Summary and Conclusions ....................................................................................................... 57
5.1 CONCLUSIONS ............................................................................................................................. 57
5.2 SUMMARY OF FAILURE MODES AND SHEET CAPACITY .............................................................. 57
5.2.1 Rupture of CFRP strengthening sheet ............................................................................... 57
5.2.2 Failure in the anchor .......................................................................................................... 58
5.2.3 Advantages and Disadvantages of GFRP ........................................................................... 59
5.3 RECOMMENDATIONS FOR FUTURE STUDY ................................................................................. 59
APPENDIX A Calculation of Anchor Design Ratio ........................................................................................ 61
A.1 INTRODUCTION ........................................................................................................................... 61
A.2 CALCULATION ............................................................................................................................. 61
A.2.1 CFRP Anchors Made In-House: Tyfo® SCH-41 ................................................................... 61
A.2.2 GFRP Anchors Made By Fyfe©: Tyfo® SEH-51A ................................................................ 63
REFERENCES ................................................................................................................................................ 65
VITA ............................................................................................................................................................. 68
xi
List of Tables
Table 2.1 Tensile properties of carbon, glass, and aramid fiber polymers [ACI 440.2R-08] ......................... 5
Table 2.2 Thermal and tensile properties comparing E-glass and S-glass fibers ........................................ 15
Table 3.1 Design Parameters ...................................................................................................................... 22
Table 3.2 Cylinder Test Results ................................................................................................................... 24
Table 3.3 Material Properties of Tyfo® FRP Materials ................................................................................ 25
Table 4.1 Test Results for Beams with GFRP Anchors ................................................................................ 40
Table A.1 Summary of Design Ratio Calculations for CFRP in-house Anchors............................................ 63
Table A.2 Summary of Design Ratio Calculations for GFRP Anchors .......................................................... 64
xii
List of Figures
Figure 2.1 Classification of Composite Materials [Callister and Rethwisch 2006] ........................................ 3
Figure 2.2 FRP Composite (photo credit by Dingyi Yang) ............................................................................. 3
Figure 2.3 Cross-linked chains in a thermosetting polymer [Callister and Rethwisch 2012] ....................... 4
Figure 2.4 Stress-strain of a typical fiber composite [Callister and Rethwisch 2006]................................... 4
Figure 2.5 CFRP U-wrap system [Kim 2006 (left), Orton 2007 (right)] ......................................................... 7
Figure 2.6 A CFRP anchor system [Pham 2009] ............................................................................................ 7
Figure 2.7 Embedment depth of CFRP anchor [Orton 2007] ........................................................................ 8
Figure 2.8 Reduction in anchor capacity as related to bend radius ............................................................. 9
Figure 2.9 CFRP anchors used by Orton (left) and Kim (right) .................................................................... 10
Figure 2.10 Process of making CFRP anchors ............................................................................................. 11
Figure 2.11 Recommended anchor fan angle [Kobayashi et al. 2001] ....................................................... 12
Figure 2.12 A 360-degree CFRP anchor [Niemitz 2008] .............................................................................. 13
Figure 2.13 Anchor overlap spacing as recommended by Kobayashi ........................................................ 14
Figure 2.14 Anchor and CFRP sheet position [Pham 2009] ........................................................................ 14
Figure 2.15 E-glass fibers (left), SEM image of GFRP at x1000 magnification (right) [Khan 2011]. ............ 15
Figure 2.16 ASTM C 293 test apparatus ...................................................................................................... 16
Figure 2.17 Modified test setup for beams tested by Huaco (2010) and Pham (2009) ............................. 16
Figure 2.18 Typical two-block test specimen [Pham 2009] ........................................................................ 17
Figure 2.19 Test setup for a two-block test [Pham 2009] ........................................................................... 17
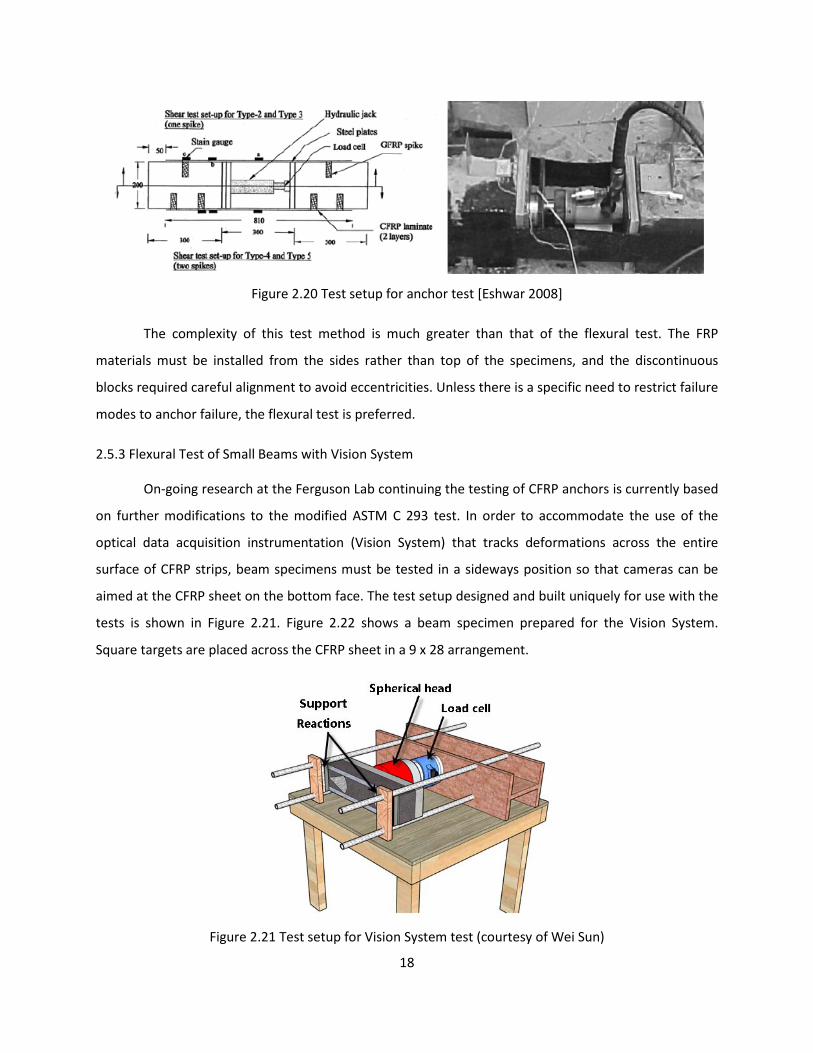
Figure 2.20 Test setup for anchor test [Eshwar 2008] ................................................................................ 18
Figure 2.21 Test setup for Vision System test (courtesy of Wei Sun) ......................................................... 18
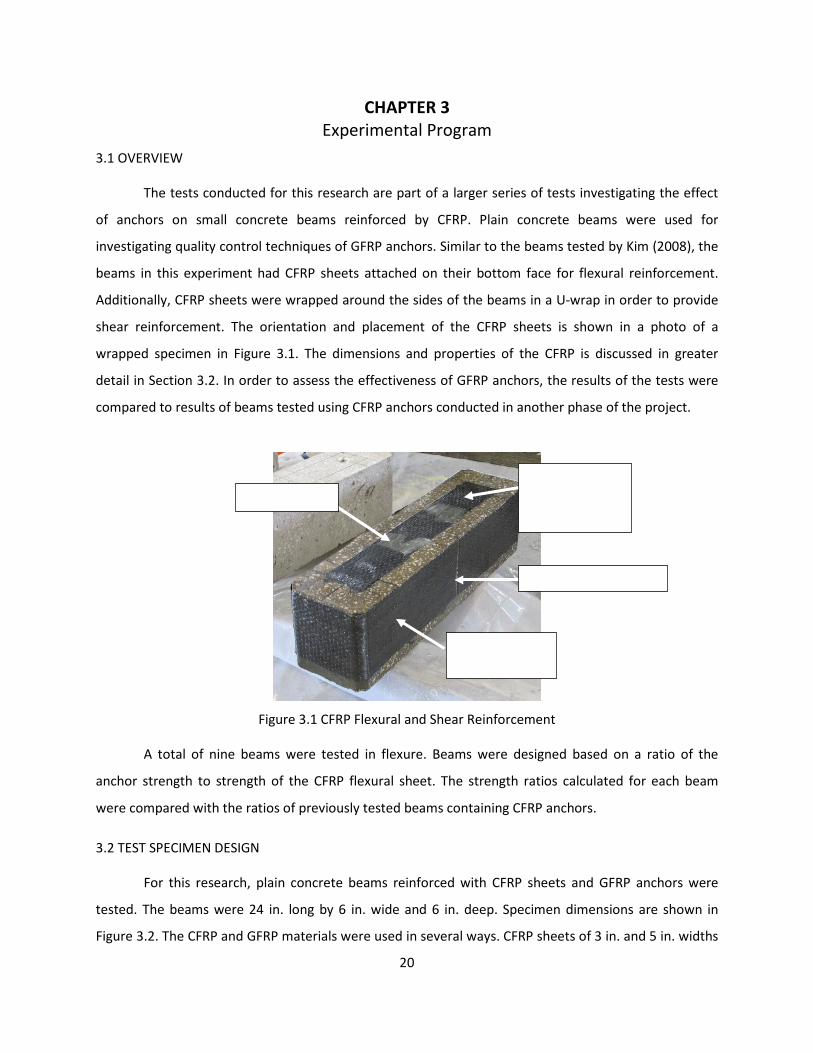
Figure 2.22 Targets used by the Vision System .......................................................................................... 19
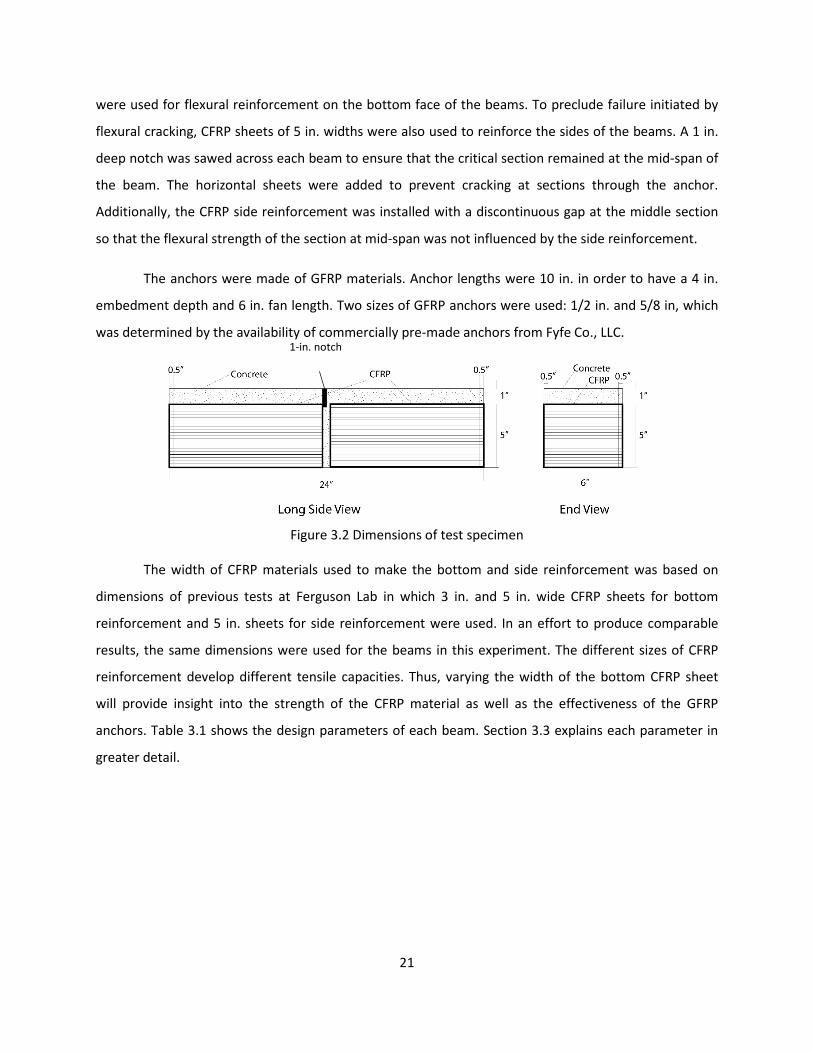
Figure 3.1 CFRP Flexural and Shear Reinforcement.................................................................................... 20
Figure 3.2 Dimensions of test specimen ..................................................................................................... 21
Figure 3.3 Description of specimen nomenclature ..................................................................................... 22
Figure 3.4 Concrete compressive strength from cylinder test ................................................................... 24
Figure 3.5 Comparing stress-strain of Tyfo® CFRP and GFRP materials ..................................................... 25
Figure 3.6 Grinding concrete surfaces to prepare for CFRP installation .................................................... 27
Figure 3.7 Concrete surface before grinding .............................................................................................. 27
Figure 3.8 Concrete surface after grinding ................................................................................................. 27
Figure 3.9 Bend radius of the anchor .......................................................................................................... 28
Figure 3.10 Rounded anchor hole ............................................................................................................... 28
xiii
Figure 3.11 Preparing to saw a 1 in. notch in beams .................................................................................. 28
Figure 3.12 1 inch notch at mid-span of beams .......................................................................................... 29
Figure 3.13 Tyfo® SCH-11UP reinforcing sheets: flexural (left) and transverse (right) .............................. 30
Figure 3.14 Tyfo® SCH-11UP anchor patches ............................................................................................. 30
Figure 3.15 GFRP Anchor (1/2 in.) made by Fyfe© (Tyfo® SEH-51A) ......................................................... 31
Figure 3.16 GFRP Anchor (5/8 in.) made by Fyfe© (Tyfo® SEH-51A) ......................................................... 31
Figure 3.17 Tyfo® S Epoxy Component A and B .......................................................................................... 32
Figure 3.18 Mixing Tyfo® S Epoxy ............................................................................................................... 32
Figure 3.19 BFLA-5-8-5LT composite material strain gauge ....................................................................... 34
Figure 3.20 Specimen with 3 gauges attached on a 5 in. CFRP sheet......................................................... 34
Figure 3.21 Positioning the LVDT in test setup ........................................................................................... 34
Figure 3.22 Mixing hydro-stone and water with a low speed mixer .......................................................... 36
Figure 3.23 Steel plate attached to beam surfaces using hydrostone ....................................................... 36
Figure 3.24 Test setup ................................................................................................................................. 37
Figure 3.25 Hand pump used to load specimens ........................................................................................ 37
Figure 3.26 Specimen in the test setup ...................................................................................................... 38
Figure 4.1 Drawing of FRP dimensions and placement on test specimen (courtesy of Wei Sun) .............. 40
Figure 4.2 Specimen with CFRP rupture failure mode ................................................................................ 41
Figure 4.3 Specimen with anchor pull-out failure mode ............................................................................ 41
Figure 4.4 Specimen with a 3 in. CFRP sheet and 1/2 in. GFRP anchors .................................................... 41
Figure 4.5 Load v. strain data for 9 – 3 – 1/2 – B1 & B2 ............................................................................. 42
Figure 4.6 Load v. strain data for 9 – 3 – 5/8 – B1 & B2 ............................................................................. 43
Figure 4.7 Load v. strain data for 9 – 3 – 5/8 – D1 & D2 ............................................................................. 45
Figure 4.8 Specimen with a 5 in. CFRP sheet and 5/8 in. GFRP anchors .................................................... 46
Figure 4.9 Load v. strain results for specimen 9 – 5 – 5/8 – B1 .................................................................. 47
Figure 4.10 Load v. strain results for specimen 9 – 5 – 5/8 – B2 ................................................................ 47
Figure 4.11 Anchor failure in specimen 9 – 5 – 5/8 – B1 ............................................................................ 48
Figure 4.12 Anchor failure in specimen 9 – 5 – 5/8 – B2 ............................................................................ 48
Figure 4.13 Deflection data of specimens with 5 in. sheets ....................................................................... 49
Figure 4.14 CFRP anchor rupture (left) and GFRP anchor pull-out (right) .................................................. 50
Figure 4.15 Specimens with GFRP anchors exposed .................................................................................. 51
Figure 4.16 Anchor hole condition of Specimen No. 9 – 5 – 5/8 – D1 ........................................................ 51
Figure 4.17 GFRP anchor of Specimen No. 9 – 5 – 5/8 – B2 ....................................................................... 52
xiv
Figure 4.18 Failure modes observed in small beam tests ........................................................................... 53
Figure 4.19 Load v. strain for 5 in. bonded specimens ............................................................................... 54
Figure 4.20 Load v. strain for 3 in. bonded specimens ............................................................................... 55
Figure A.1 Anchor dimensions .................................................................................................................... 62
1
CHAPTER 1 Introduction
1.1 MOTIVATION
An aging infrastructure is quickly becoming one of the nation’s top priorities as the numbers of
bridges and structures in need of repair increases. With the rapid growth of American cities and an
increase in traffic and vehicular loads, the preservation and extension of structural life is more important
now than ever. One cost-efficient method of preserving structures that has risen in popularity in recent
years is utilizing FRP (Fiber Reinforced Polymers) for exterior reinforcement on the surfaces of concrete
structures. As today’s infrastructure is forced to carry more traffic over bridges and roadways originally
designed for much lower loads, rehabilitation and life extension of older bridges are high on the nation’s
list of priorities.
1.2 OVERVIEW
The primary objective of this research project is to study the behavior and performance of
anchors made with Glass Fiber Reinforced Polymers (GFRP) used in structural preservation and
rehabilitation methods, and to compare their performance with Carbon Fiber Reinforced Polymer (CFRP)
anchors used in a similar application. This study is part of an on-going research project exploring the
potential of utilizing novel materials such as Fiber Reinforced Polymers (FRP) for structural
strengthening being conducted at the Ferguson Structural Engineering Laboratory. Previous experiments
have shown that CFRP sheets bonded to concrete surfaces will debond prematurely if they are not
properly anchored and are therefore unable to develop their full capacity. Consequently, a significant
number of studies have been done to obtain a recommendation for ways to anchor CFRP reinforcement
and utilize the full capacity of the material.
Tests conducted in this vein have previously focused on using CFRP materials in a variety of
orientations as reinforcement and also as anchors. A variety of CFRP anchor sizes and development
lengths were tested and the anchors were shown to perform well provided a specific set of parameters
were met. As research in this direction continues, it is of great interest to explore other materials that
have the potential to perform the same functions at possibly greater efficiency. Thus, several tests were
conducted in order to obtain a method for qualifying the usage of GFRP anchors as an alternative to
previously tested CFRP anchors and provide a means for quality control of GFRP anchor design. In
particular, funding for this research comes from the Texas Department of Transportation’s (TxDOT)
2
project on Bi-Directional Application of Carbon Fiber Reinforced Polymer (CFRP) with CFRP Anchors for
Shear-Strengthening and Design Recommendations/Quality Control Procedures for CFRP Anchors
(TxDOT 0-6783).
1.3 PROJECT OBJECTIVES
The purpose of this research is to develop a recommendation for the use of GFRP anchors as
related to the design of CFRP anchors based on the following parameters:
- Anchor size
- Material modulus
- Material tensile capacity
- Anchor strength to reinforcement strength ratio
The GFRP anchors used in the experiments for this project were pre-fabricated by Fyfe Co., LLC
using Tyfo® Fiberwrap® SEH-51A material. The anchors are specified with respect to geometry, size, and
strength as related to previously designed CFRP anchors. Comparisons are made between test results
from GFRP anchors and CFRP anchors of similar size and strength.
1.4 ORGANIZATION
In Chapter 2, past research on the uses of FRP anchors and CFRP reinforcement of concrete is
presented. While extensive studies have been conducted on the effectiveness of CFRP materials as
anchorage systems for surface reinforcement, the use of other FRP materials such as GFRP has yet to be
explored.
Chapter 3 describes the experimental program developed to study the behavior of GFRP
materials as anchorage systems. The design of the test specimens is further explored in this section, as
well as installation procedures for the FRP materials, instrumentation of specimens, and details of the
testing equipment.
In Chapter 4, the results of the experimental tests are presented and compared with those of
results from a previous study containing CFRP anchor systems. Finally, a summary of the findings and
conclusions from the research in this thesis are presented and suggestions for further study are made.
3
CHAPTER 2 Literature Review
2.1 FIBER REINFORCED POLYMERS (FRP)
2.1.1 Composite Materials
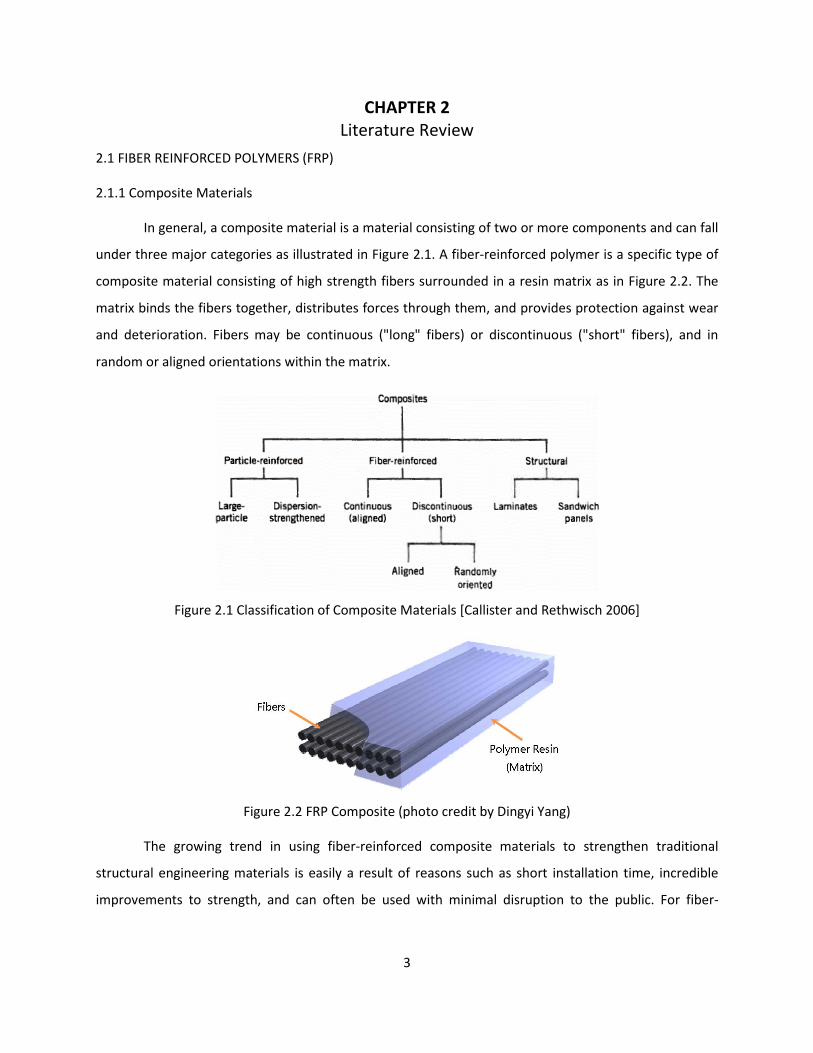
In general, a composite material is a material consisting of two or more components and can fall
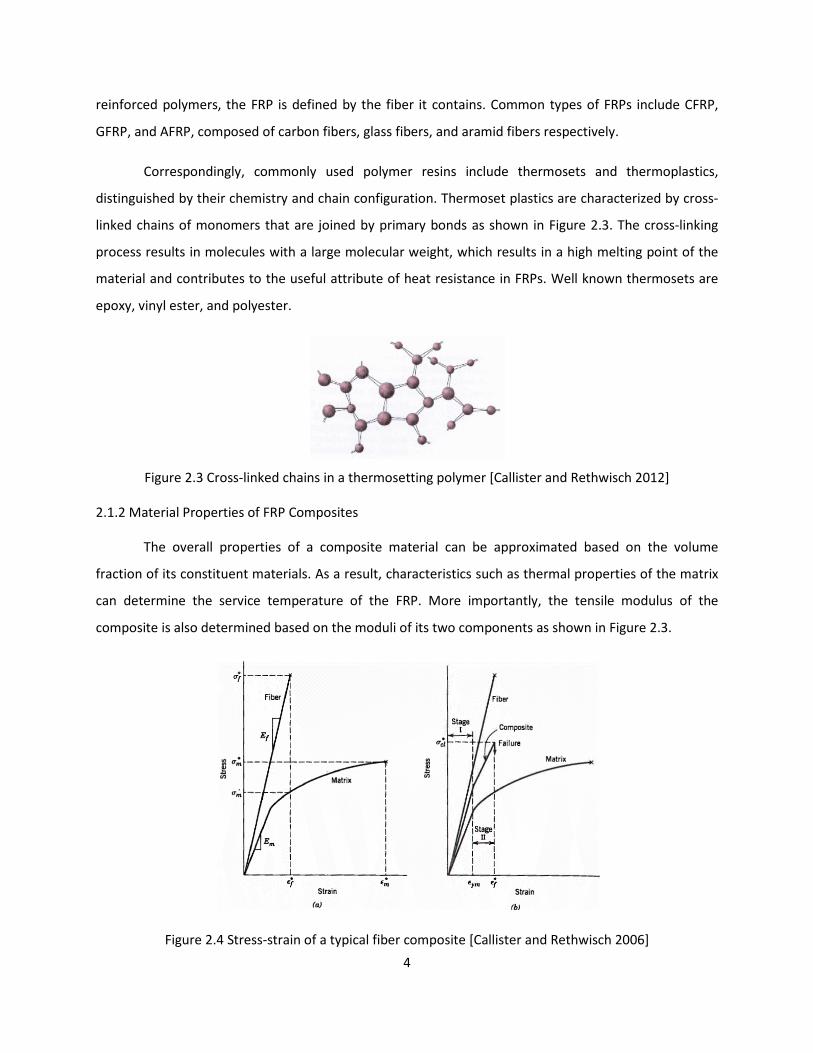
under three major categories as illustrated in Figure 2.1. A fiber-reinforced polymer is a specific type of
composite material consisting of high strength fibers surrounded in a resin matrix as in Figure 2.2. The
matrix binds the fibers together, distributes forces through them, and provides protection against wear
and deterioration. Fibers may be continuous ("long" fibers) or discontinuous ("short" fibers), and in
random or aligned orientations within the matrix.
Figure 2.1 Classification of Composite Materials [Callister and Rethwisch 2006]
Figure 2.2 FRP Composite (photo credit by Dingyi Yang)
The growing trend in using fiber-reinforced composite materials to strengthen traditional
structural engineering materials is easily a result of reasons such as short installation time, incredible
improvements to strength, and can often be used with minimal disruption to the public. For fiber-
4
reinforced polymers, the FRP is defined by the fiber it contains. Common types of FRPs include CFRP,
GFRP, and AFRP, composed of carbon fibers, glass fibers, and aramid fibers respectively.
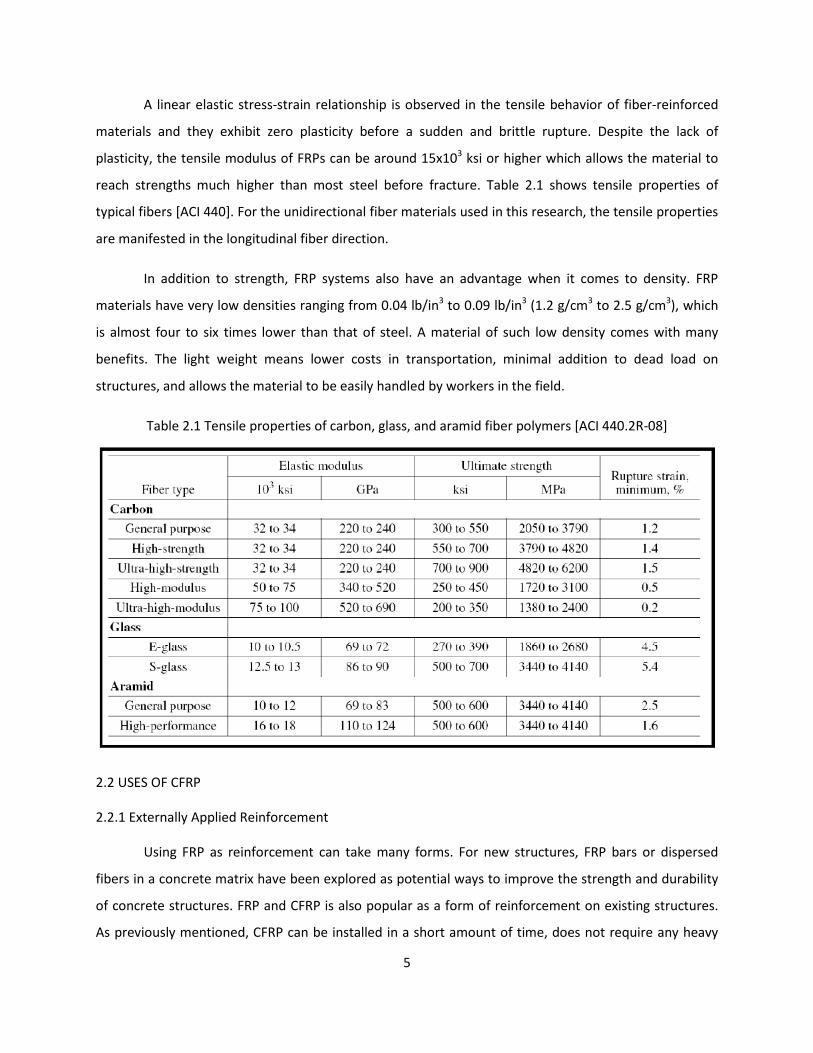
Correspondingly, commonly used polymer resins include thermosets and thermoplastics,
distinguished by their chemistry and chain configuration. Thermoset plastics are characterized by cross-
linked chains of monomers that are joined by primary bonds as shown in Figure 2.3. The cross-linking
process results in molecules with a large molecular weight, which results in a high melting point of the
material and contributes to the useful attribute of heat resistance in FRPs. Well known thermosets are
epoxy, vinyl ester, and polyester.
Figure 2.3 Cross-linked chains in a thermosetting polymer [Callister and Rethwisch 2012]
2.1.2 Material Properties of FRP Composites
The overall properties of a composite material can be approximated based on the volume
fraction of its constituent materials. As a result, characteristics such as thermal properties of the matrix
can determine the service temperature of the FRP. More importantly, the tensile modulus of the
composite is also determined based on the moduli of its two components as shown in Figure 2.3.
Figure 2.4 Stress-strain of a typical fiber composite [Callister and Rethwisch 2006]
5
A linear elastic stress-strain relationship is observed in the tensile behavior of fiber-reinforced
materials and they exhibit zero plasticity before a sudden and brittle rupture. Despite the lack of
plasticity, the tensile modulus of FRPs can be around 15x103 ksi or higher which allows the material to
reach strengths much higher than most steel before fracture. Table 2.1 shows tensile properties of
typical fibers [ACI 440]. For the unidirectional fiber materials used in this research, the tensile properties
are manifested in the longitudinal fiber direction.
In addition to strength, FRP systems also have an advantage when it comes to density. FRP
materials have very low densities ranging from 0.04 lb/in3 to 0.09 lb/in3 (1.2 g/cm3 to 2.5 g/cm3), which
is almost four to six times lower than that of steel. A material of such low density comes with many
benefits. The light weight means lower costs in transportation, minimal addition to dead load on
structures, and allows the material to be easily handled by workers in the field.
Table 2.1 Tensile properties of carbon, glass, and aramid fiber polymers [ACI 440.2R-08]
2.2 USES OF CFRP
2.2.1 Externally Applied Reinforcement
Using FRP as reinforcement can take many forms. For new structures, FRP bars or dispersed
fibers in a concrete matrix have been explored as potential ways to improve the strength and durability
of concrete structures. FRP and CFRP is also popular as a form of reinforcement on existing structures.
As previously mentioned, CFRP can be installed in a short amount of time, does not require any heavy

6
equipment to handle on site, and can also be highly resistant to corrosion. For these reasons, it is an
ideal material to use in applications where external reinforcement is appropriate. In fact, a number of
bridges in Texas have been externally repaired with CFRP composites, allowing extension of the service
life of the bridges.
Much of the experimental work at the Ferguson Lab has explored the use of CFRP in external
applications, using externally bonded unidirectional CFRP sheets and bidirectional CFRP sheets to
improve the strength of concrete structures. However, a crucial issue with the use of externally bonded
CFRP reinforcement is premature debonding from concrete surfaces, preventing the CFRP sheets from
reaching their full capacities and causing failure at just 40-50% of the tensile strength [Orton et al. 2008].
In an effort to utilize the full strength of the CFRP sheets, anchors were developed and studied in many
experimental tests.
2.2.2 Anchors
Many types of anchors were developed and tested in an effort to resolve the issue of debonding.
Using steel plates and bolts to anchor the ends of CFRP sheets have been tested with limited success
[Sato et al. 1997]. Another anchorage system that successfully prevented debonding is the use of
prepreg FRP systems, which are partially cured FRP sheets that are pre-impregnated with a resin and are
secured to the structure by fasteners [Lamanna et al. 2002]. While effective against debonding, these
systems are not ideal for field applications due to corrosion of the steel, cracking caused by installing the
bolts, and stress concentrations that develop at bolted locations.
Anchorage systems made with CFRP materials were also tested. A U-wrap system uses
continuous CFRP sheets installed perpendicular to the reinforcing fiber sheet, thereby increasing the
area of bonded CFRP material and allows the sheet to develop its full strength [Kim 2006, Orton 2007].
Figure 2.5 shows a U-wrap application. While U-wrap systems successfully reduce stress concentrations,
they are not efficient in regards to the amount of material used. Furthermore, the geometry of
structures in the field may sometimes make U-wraps impractical or impossible to install.

7
Figure 2.5 CFRP U-wrap system [Kim 2006 (left), Orton 2007 (right)]
Embedded CFRP anchors were then explored. Numerous studies successfully demonstrated that
these anchors allowed reinforcing sheets to reach their full tensile strength and can be easy to handle
for field applications. Tests also showed that using CFRP anchors will allow the reinforcing sheet to
develop its full strength even when there is no bond between the sheet and the concrete [Kim 2008].
This finding meant that extensive surface preparation of the concrete can be greatly reduced if anchors
are present. However, correct installation of the anchors is critical to their success.
The critical importance of correctly installing CFRP anchors led to attempts to obtain quality
control guidelines for their use. Many parameters affect anchor performance, as shown in Figure 2.6.
Embedment depth ℎ, anchor hole diameter 𝑑 , and bend radius of the anchor 𝑅𝑎 are the main
parameters that affect anchor performance. Other parameters also exist, such as the size of the anchor
as well as the geometry of the anchor end.
Figure 2.6 A CFRP anchor system [Pham 2009]
Anchor end geometry
8
2.3 PAST STUDIES ON CFRP ANCHORS
2.3.1 Embedment Depth
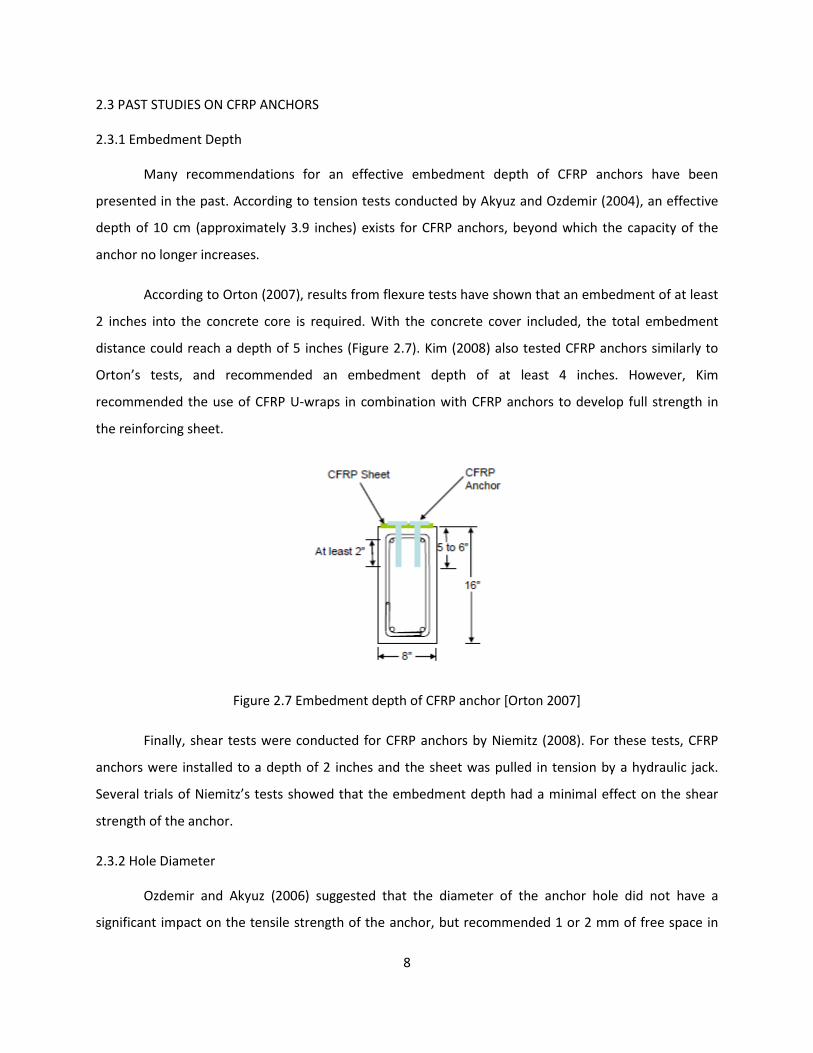
Many recommendations for an effective embedment depth of CFRP anchors have been
presented in the past. According to tension tests conducted by Akyuz and Ozdemir (2004), an effective
depth of 10 cm (approximately 3.9 inches) exists for CFRP anchors, beyond which the capacity of the
anchor no longer increases.
According to Orton (2007), results from flexure tests have shown that an embedment of at least
2 inches into the concrete core is required. With the concrete cover included, the total embedment
distance could reach a depth of 5 inches (Figure 2.7). Kim (2008) also tested CFRP anchors similarly to
Orton’s tests, and recommended an embedment depth of at least 4 inches. However, Kim
recommended the use of CFRP U-wraps in combination with CFRP anchors to develop full strength in
the reinforcing sheet.
Figure 2.7 Embedment depth of CFRP anchor [Orton 2007]
Finally, shear tests were conducted for CFRP anchors by Niemitz (2008). For these tests, CFRP
anchors were installed to a depth of 2 inches and the sheet was pulled in tension by a hydraulic jack.
Several trials of Niemitz’s tests showed that the embedment depth had a minimal effect on the shear
strength of the anchor.
2.3.2 Hole Diameter
Ozdemir and Akyuz (2006) suggested that the diameter of the anchor hole did not have a
significant impact on the tensile strength of the anchor, but recommended 1 or 2 mm of free space in
9
the anchor hole for the epoxy. Kim (2008) tested the effects of different anchor hole diameters,
exploring diameters equal to the anchor and larger than the anchor. Diameters of 5/8”, 1/2”, and 3/4"
were used and based on test results, Kim recommended that the anchor hole area be at least 40% larger
than that of the anchor.
2.3.3 Bend Radius
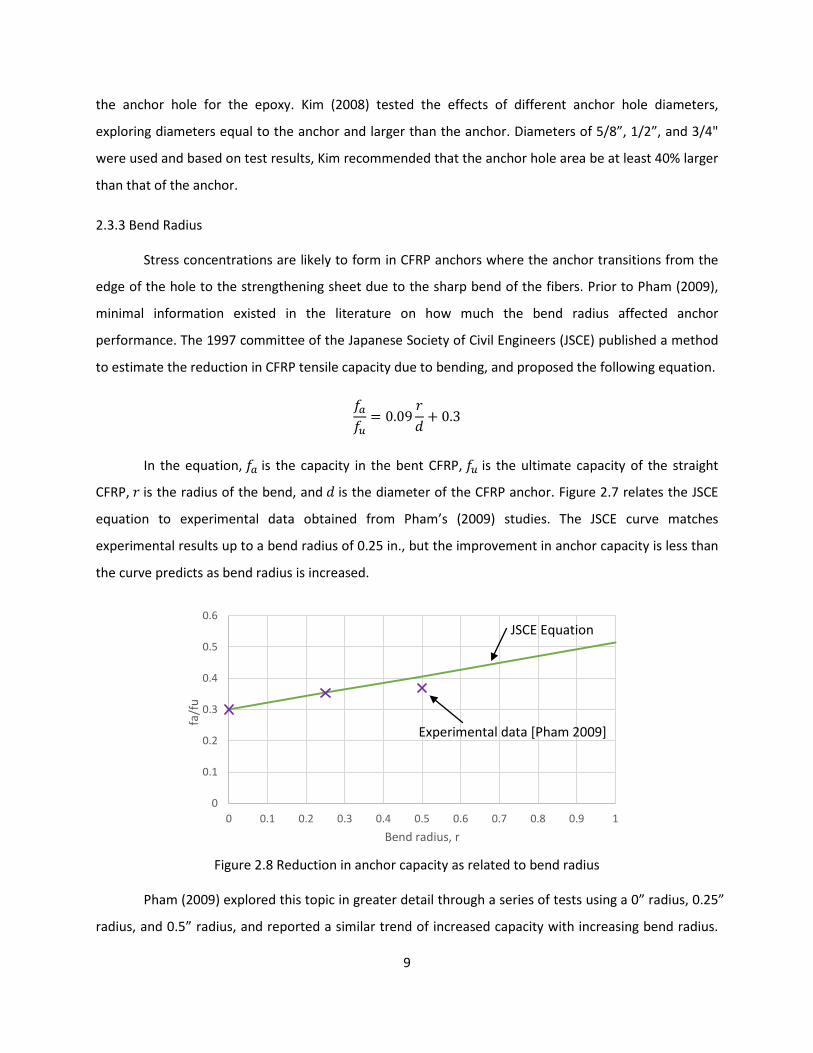
Stress concentrations are likely to form in CFRP anchors where the anchor transitions from the
edge of the hole to the strengthening sheet due to the sharp bend of the fibers. Prior to Pham (2009),
minimal information existed in the literature on how much the bend radius affected anchor
performance. The 1997 committee of the Japanese Society of Civil Engineers (JSCE) published a method
to estimate the reduction in CFRP tensile capacity due to bending, and proposed the following equation.
𝑓𝑎𝑓𝑢
= 0.09𝑟𝑑
+ 0.3
In the equation, 𝑓𝑎 is the capacity in the bent CFRP, 𝑓𝑢 is the ultimate capacity of the straight
CFRP, 𝑟 is the radius of the bend, and 𝑑 is the diameter of the CFRP anchor. Figure 2.7 relates the JSCE
equation to experimental data obtained from Pham’s (2009) studies. The JSCE curve matches
experimental results up to a bend radius of 0.25 in., but the improvement in anchor capacity is less than
the curve predicts as bend radius is increased.
Figure 2.8 Reduction in anchor capacity as related to bend radius
Pham (2009) explored this topic in greater detail through a series of tests using a 0” radius, 0.25”
radius, and 0.5” radius, and reported a similar trend of increased capacity with increasing bend radius.
0
0.1
0.2
0.3
0.4
0.5
0.6
0 0.1 0.2 0.3 0.4 0.5 0.6 0.7 0.8 0.9 1
fa/f
u
Bend radius, r
JSCE Equation
Experimental data [Pham 2009]
10
Pham found that anchors with 0.25” bend radius had an 18% increase in capacity compared to the one
with zero radius, and anchors with a 0.5” bend radius had a 23% increase in capacity compared with
zero radius. Unlike the linear relationship described by the JSCE equation, Pham’s results indicated that
the effect of the bend radius on anchor capacity may not increase substantially more beyond a certain
radius. Furthermore, more labor is required to create larger bend radiuses for these reasons, a bend
radius of at least 0.25” is recommended.
2.3.4 Size
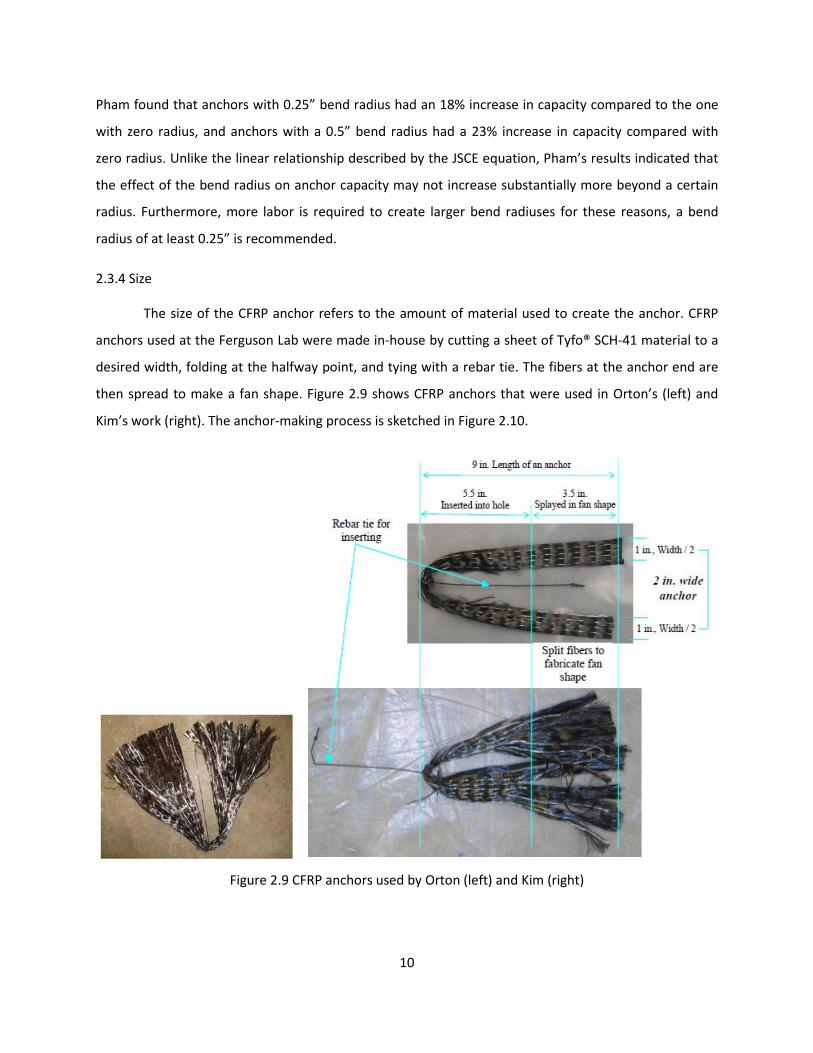
The size of the CFRP anchor refers to the amount of material used to create the anchor. CFRP
anchors used at the Ferguson Lab were made in-house by cutting a sheet of Tyfo® SCH-41 material to a
desired width, folding at the halfway point, and tying with a rebar tie. The fibers at the anchor end are
then spread to make a fan shape. Figure 2.9 shows CFRP anchors that were used in Orton’s (left) and
Kim’s work (right). The anchor-making process is sketched in Figure 2.10.
Figure 2.9 CFRP anchors used by Orton (left) and Kim (right)

11
Figure 2.10 Process of making CFRP anchors
This size of the anchor greatly affects anchor performance since the strength of the anchor is
dictated by the amount of material present. Likewise, the size of the anchor also determines whether
the anchor has sufficient strength to allow the CFRP sheet to develop its full capacity. Orton (2007)
recommends the total cross-sectional area of CFRP anchors should be two times the cross-sectional area
of the CFRP reinforcing sheet.
Kim (2008) tested a variety of anchor sizes and found that an anchor cross-sectional area 1.33
times that of the CFRP sheet was enough to develop the full capacity of the sheet. Therefore, Kim
suggests a 1.50 ratio of anchor to sheet cross-sectional area as a conservative recommendation. Pham
(2009) comments on Kim’s 1.50 ratio after discovering anchor failures despite following Kim’s
Rebar tie cut to 4 in.
12
recommendation, suggesting that the observed anchor failures may have been a result of stress
concentrations at the anchor bend which are not taken into account using the 1.50 ratio.
2.3.5 End Geometry
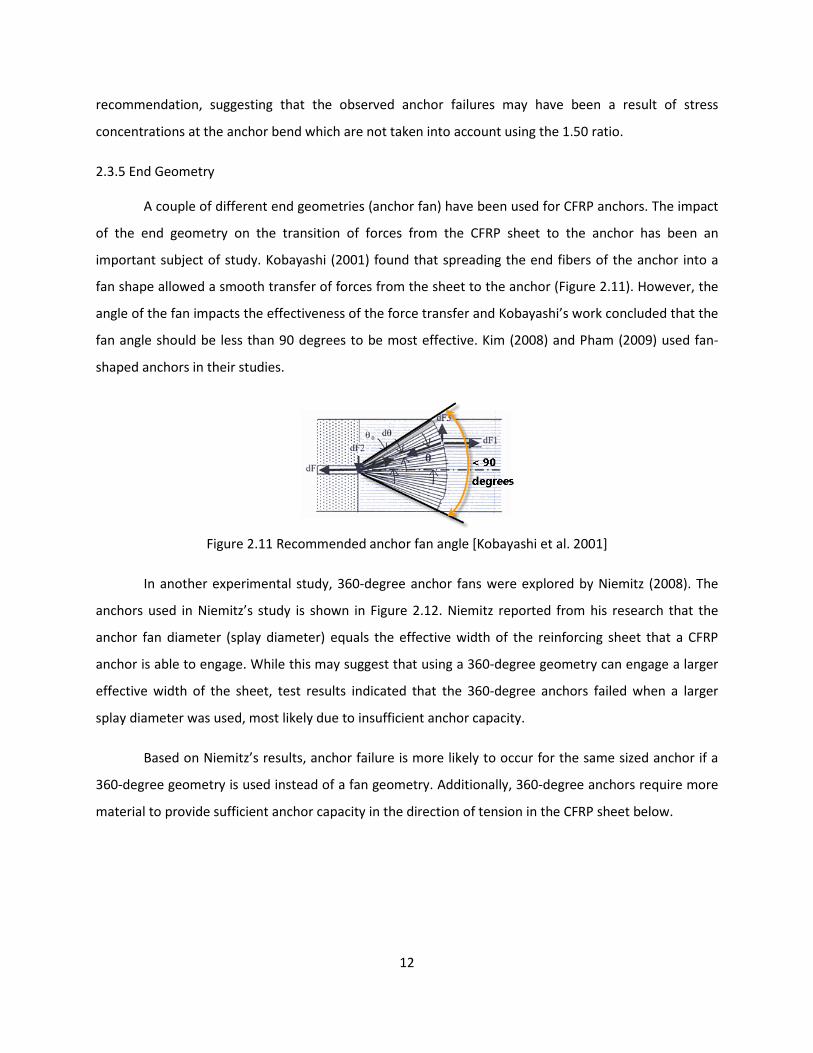
A couple of different end geometries (anchor fan) have been used for CFRP anchors. The impact
of the end geometry on the transition of forces from the CFRP sheet to the anchor has been an
important subject of study. Kobayashi (2001) found that spreading the end fibers of the anchor into a
fan shape allowed a smooth transfer of forces from the sheet to the anchor (Figure 2.11). However, the
angle of the fan impacts the effectiveness of the force transfer and Kobayashi’s work concluded that the
fan angle should be less than 90 degrees to be most effective. Kim (2008) and Pham (2009) used fan-
shaped anchors in their studies.
Figure 2.11 Recommended anchor fan angle [Kobayashi et al. 2001]
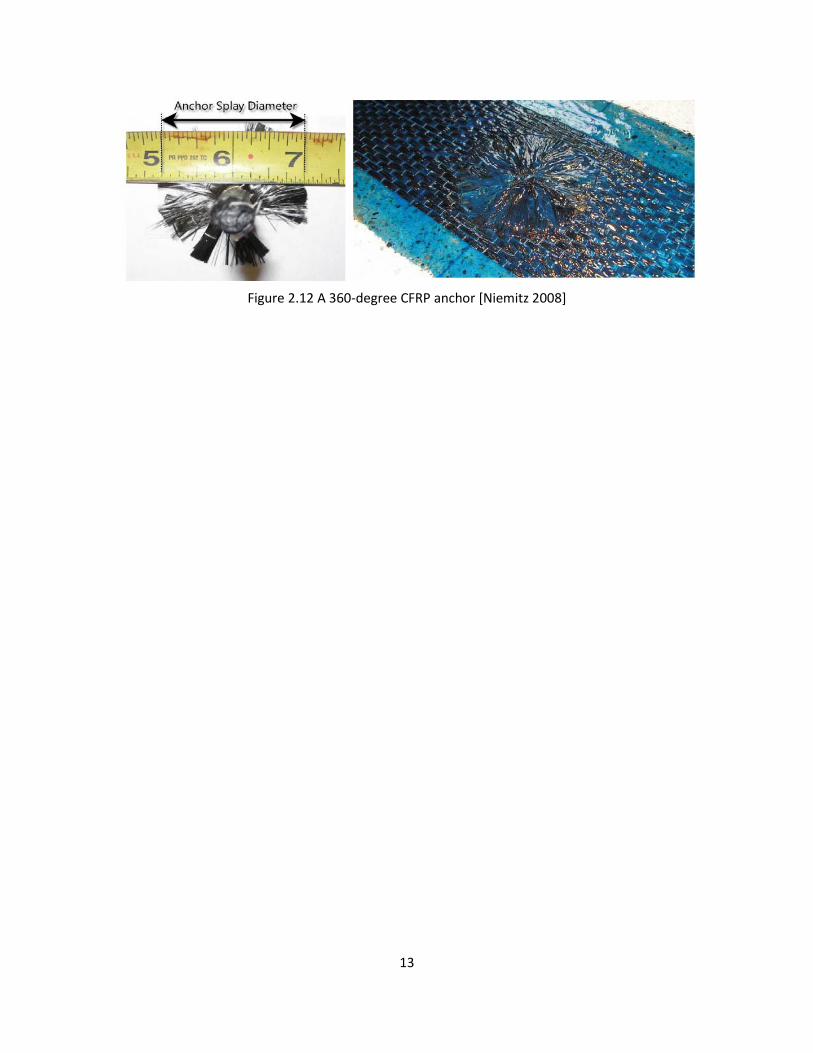
In another experimental study, 360-degree anchor fans were explored by Niemitz (2008). The
anchors used in Niemitz’s study is shown in Figure 2.12. Niemitz reported from his research that the
anchor fan diameter (splay diameter) equals the effective width of the reinforcing sheet that a CFRP
anchor is able to engage. While this may suggest that using a 360-degree geometry can engage a larger
effective width of the sheet, test results indicated that the 360-degree anchors failed when a larger
splay diameter was used, most likely due to insufficient anchor capacity.
Based on Niemitz’s results, anchor failure is more likely to occur for the same sized anchor if a
360-degree geometry is used instead of a fan geometry. Additionally, 360-degree anchors require more
material to provide sufficient anchor capacity in the direction of tension in the CFRP sheet below.
13
Figure 2.12 A 360-degree CFRP anchor [Niemitz 2008]
14
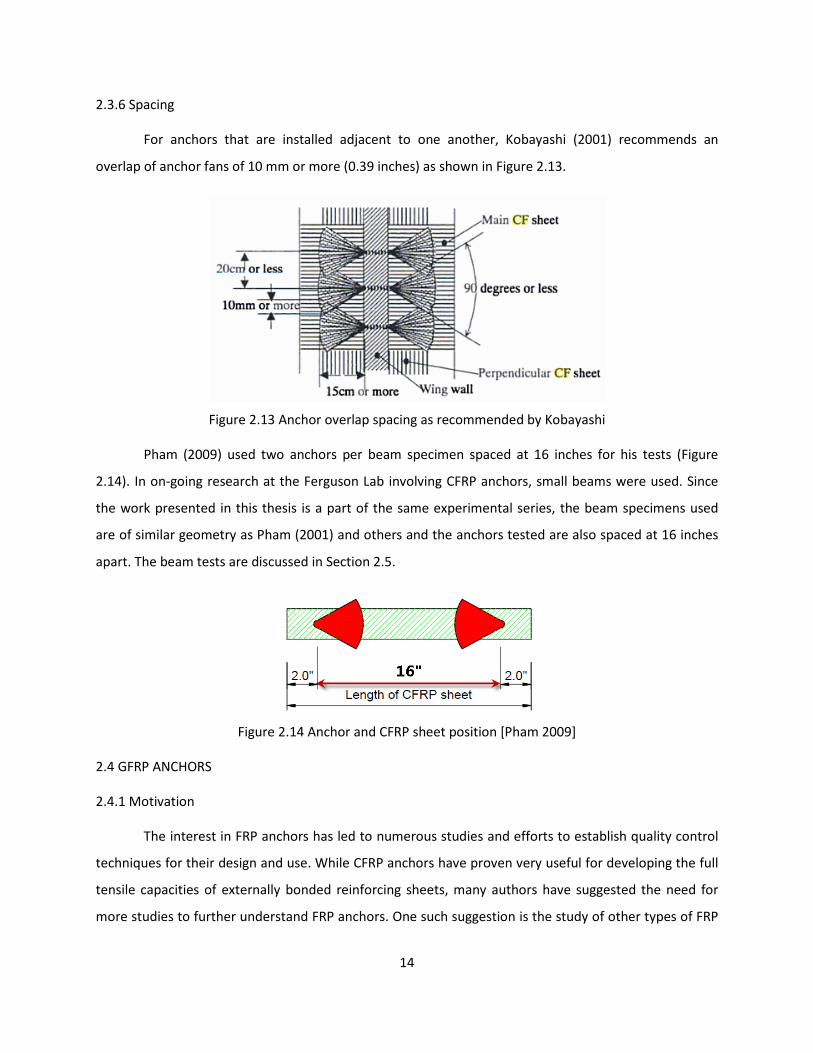
2.3.6 Spacing
For anchors that are installed adjacent to one another, Kobayashi (2001) recommends an
overlap of anchor fans of 10 mm or more (0.39 inches) as shown in Figure 2.13.
Figure 2.13 Anchor overlap spacing as recommended by Kobayashi
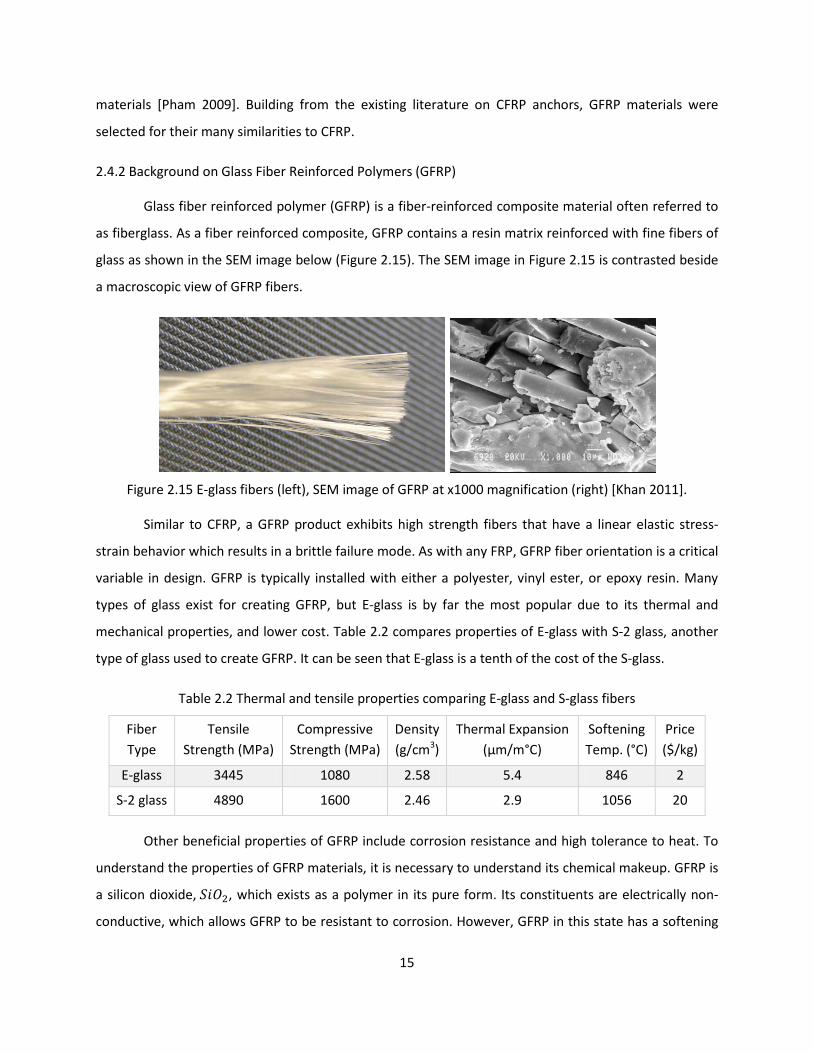
Pham (2009) used two anchors per beam specimen spaced at 16 inches for his tests (Figure
2.14). In on-going research at the Ferguson Lab involving CFRP anchors, small beams were used. Since
the work presented in this thesis is a part of the same experimental series, the beam specimens used
are of similar geometry as Pham (2001) and others and the anchors tested are also spaced at 16 inches
apart. The beam tests are discussed in Section 2.5.
Figure 2.14 Anchor and CFRP sheet position [Pham 2009]
2.4 GFRP ANCHORS
2.4.1 Motivation
The interest in FRP anchors has led to numerous studies and efforts to establish quality control
techniques for their design and use. While CFRP anchors have proven very useful for developing the full
tensile capacities of externally bonded reinforcing sheets, many authors have suggested the need for
more studies to further understand FRP anchors. One such suggestion is the study of other types of FRP
15
materials [Pham 2009]. Building from the existing literature on CFRP anchors, GFRP materials were
selected for their many similarities to CFRP.
2.4.2 Background on Glass Fiber Reinforced Polymers (GFRP)
Glass fiber reinforced polymer (GFRP) is a fiber-reinforced composite material often referred to
as fiberglass. As a fiber reinforced composite, GFRP contains a resin matrix reinforced with fine fibers of
glass as shown in the SEM image below (Figure 2.15). The SEM image in Figure 2.15 is contrasted beside
a macroscopic view of GFRP fibers.
Figure 2.15 E-glass fibers (left), SEM image of GFRP at x1000 magnification (right) [Khan 2011].
Similar to CFRP, a GFRP product exhibits high strength fibers that have a linear elastic stress-
strain behavior which results in a brittle failure mode. As with any FRP, GFRP fiber orientation is a critical
variable in design. GFRP is typically installed with either a polyester, vinyl ester, or epoxy resin. Many
types of glass exist for creating GFRP, but E-glass is by far the most popular due to its thermal and
mechanical properties, and lower cost. Table 2.2 compares properties of E-glass with S-2 glass, another
type of glass used to create GFRP. It can be seen that E-glass is a tenth of the cost of the S-glass.
Table 2.2 Thermal and tensile properties comparing E-glass and S-glass fibers
Fiber Type
Tensile Strength (MPa)
Compressive Strength (MPa)
Density (g/cm3)
Thermal Expansion (μm/m°C)
Softening Temp. (°C)
Price ($/kg)
E-glass 3445 1080 2.58 5.4 846 2
S-2 glass 4890 1600 2.46 2.9 1056 20
Other beneficial properties of GFRP include corrosion resistance and high tolerance to heat. To
understand the properties of GFRP materials, it is necessary to understand its chemical makeup. GFRP is
a silicon dioxide, 𝑆𝑖𝑂2, which exists as a polymer in its pure form. Its constituents are electrically non-
conductive, which allows GFRP to be resistant to corrosion. However, GFRP in this state has a softening
16
temperature of 2000°C but no true melting point, making it impractical for typical use. To make GFRP
workable at reasonable temperatures, material scientists introduce impurities into the silica and are
able to modify its properties for particular applications, such as creating E-glass with a melting
temperature of 850°C [Carter 2007].
2.5 QUALITY CONTROL TEST METHODS
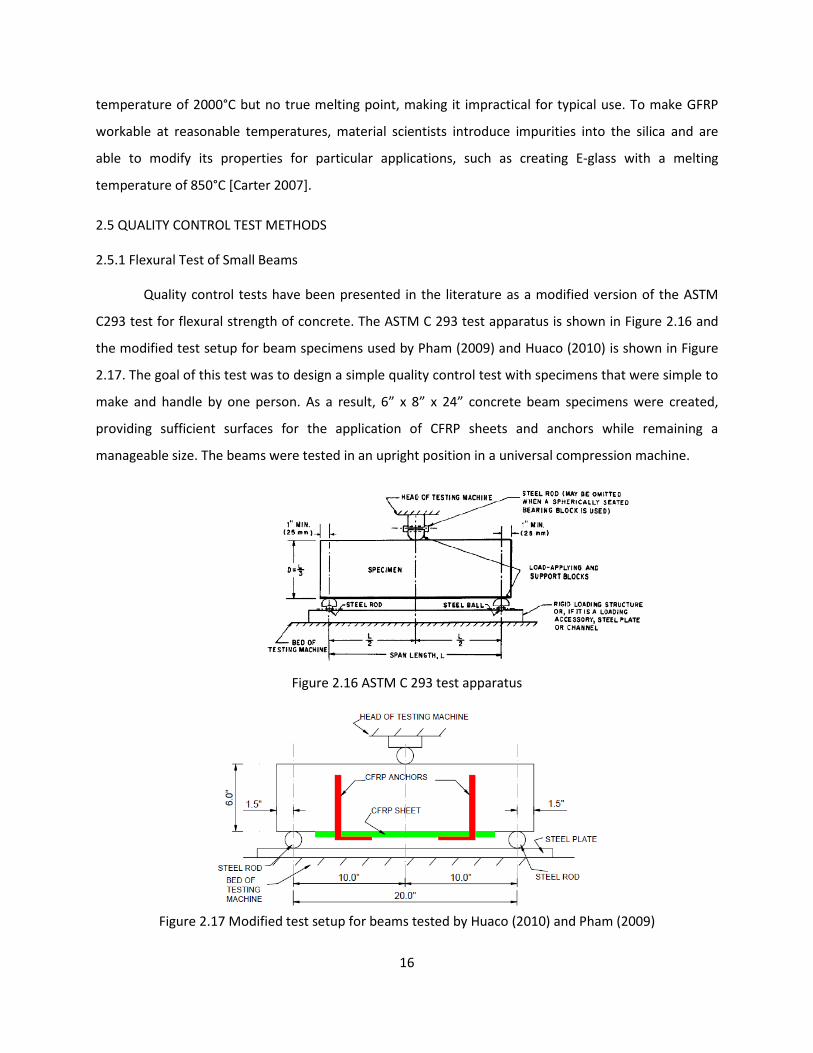
2.5.1 Flexural Test of Small Beams
Quality control tests have been presented in the literature as a modified version of the ASTM
C293 test for flexural strength of concrete. The ASTM C 293 test apparatus is shown in Figure 2.16 and
the modified test setup for beam specimens used by Pham (2009) and Huaco (2010) is shown in Figure
2.17. The goal of this test was to design a simple quality control test with specimens that were simple to
make and handle by one person. As a result, 6” x 8” x 24” concrete beam specimens were created,
providing sufficient surfaces for the application of CFRP sheets and anchors while remaining a
manageable size. The beams were tested in an upright position in a universal compression machine.
Figure 2.16 ASTM C 293 test apparatus
Figure 2.17 Modified test setup for beams tested by Huaco (2010) and Pham (2009)
17
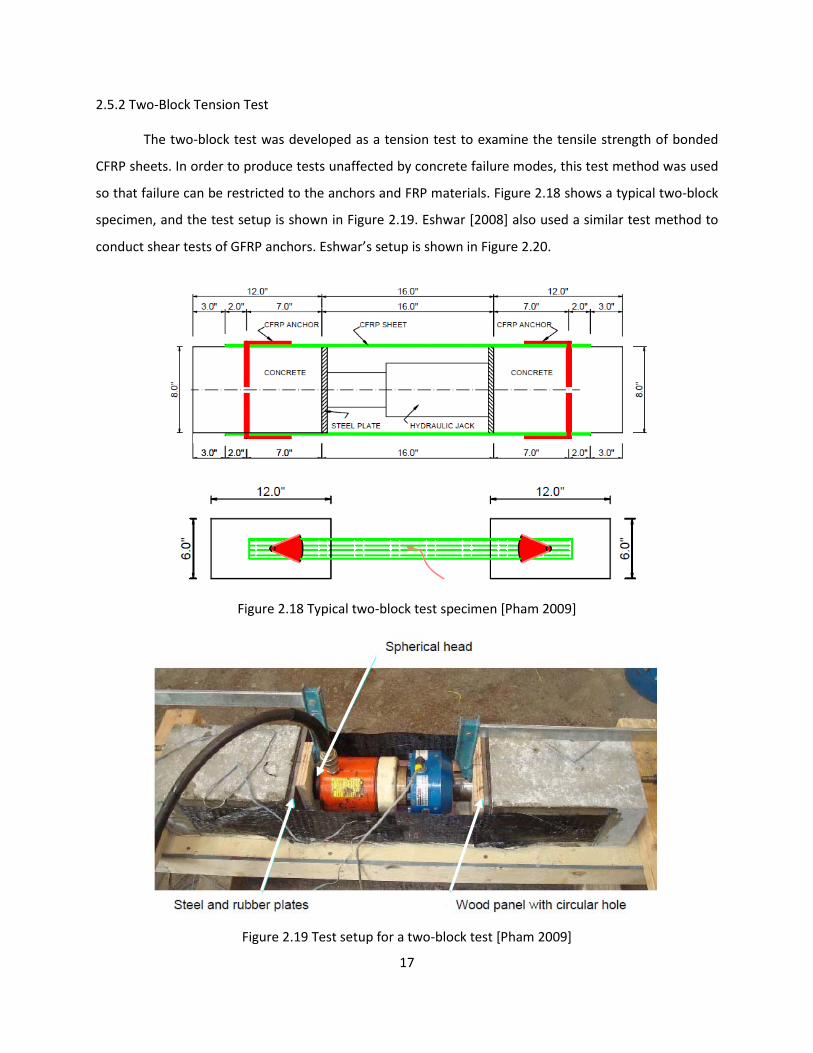
2.5.2 Two-Block Tension Test
The two-block test was developed as a tension test to examine the tensile strength of bonded
CFRP sheets. In order to produce tests unaffected by concrete failure modes, this test method was used
so that failure can be restricted to the anchors and FRP materials. Figure 2.18 shows a typical two-block
specimen, and the test setup is shown in Figure 2.19. Eshwar [2008] also used a similar test method to
conduct shear tests of GFRP anchors. Eshwar’s setup is shown in Figure 2.20.
Figure 2.18 Typical two-block test specimen [Pham 2009]
Figure 2.19 Test setup for a two-block test [Pham 2009]
18
Figure 2.20 Test setup for anchor test [Eshwar 2008]
The complexity of this test method is much greater than that of the flexural test. The FRP
materials must be installed from the sides rather than top of the specimens, and the discontinuous
blocks required careful alignment to avoid eccentricities. Unless there is a specific need to restrict failure
modes to anchor failure, the flexural test is preferred.
2.5.3 Flexural Test of Small Beams with Vision System
On-going research at the Ferguson Lab continuing the testing of CFRP anchors is currently based
on further modifications to the modified ASTM C 293 test. In order to accommodate the use of the
optical data acquisition instrumentation (Vision System) that tracks deformations across the entire
surface of CFRP strips, beam specimens must be tested in a sideways position so that cameras can be
aimed at the CFRP sheet on the bottom face. The test setup designed and built uniquely for use with the
tests is shown in Figure 2.21. Figure 2.22 shows a beam specimen prepared for the Vision System.
Square targets are placed across the CFRP sheet in a 9 x 28 arrangement.
Figure 2.21 Test setup for Vision System test (courtesy of Wei Sun)
19
Figure 2.22 Targets used by the Vision System
2.7 CONCLUSION
Based on findings from past studies, the parameters that affected the performance of CFRP
anchors were used to evaluate the performance of GFRP anchors. The beams designed for the tests
presented in this thesis are intended for making direct comparisons to the beams with CFRP anchors
studied using the Vision System. As a result, the test setup and procedures were borrowed from the
Vision System test.
20
CHAPTER 3 Experimental Program
3.1 OVERVIEW
The tests conducted for this research are part of a larger series of tests investigating the effect
of anchors on small concrete beams reinforced by CFRP. Plain concrete beams were used for
investigating quality control techniques of GFRP anchors. Similar to the beams tested by Kim (2008), the
beams in this experiment had CFRP sheets attached on their bottom face for flexural reinforcement.
Additionally, CFRP sheets were wrapped around the sides of the beams in a U-wrap in order to provide
shear reinforcement. The orientation and placement of the CFRP sheets is shown in a photo of a
wrapped specimen in Figure 3.1. The dimensions and properties of the CFRP is discussed in greater
detail in Section 3.2. In order to assess the effectiveness of GFRP anchors, the results of the tests were
compared to results of beams tested using CFRP anchors conducted in another phase of the project.
Figure 3.1 CFRP Flexural and Shear Reinforcement
A total of nine beams were tested in flexure. Beams were designed based on a ratio of the
anchor strength to strength of the CFRP flexural sheet. The strength ratios calculated for each beam
were compared with the ratios of previously tested beams containing CFRP anchors.
3.2 TEST SPECIMEN DESIGN
For this research, plain concrete beams reinforced with CFRP sheets and GFRP anchors were
tested. The beams were 24 in. long by 6 in. wide and 6 in. deep. Specimen dimensions are shown in
Figure 3.2. The CFRP and GFRP materials were used in several ways. CFRP sheets of 3 in. and 5 in. widths
3” wide CFRP flexural reinforcement
5” wide CFRP reinforcement
GFRP anchor
Gap at critical section
21
were used for flexural reinforcement on the bottom face of the beams. To preclude failure initiated by
flexural cracking, CFRP sheets of 5 in. widths were also used to reinforce the sides of the beams. A 1 in.
deep notch was sawed across each beam to ensure that the critical section remained at the mid-span of
the beam. The horizontal sheets were added to prevent cracking at sections through the anchor.
Additionally, the CFRP side reinforcement was installed with a discontinuous gap at the middle section
so that the flexural strength of the section at mid-span was not influenced by the side reinforcement.
The anchors were made of GFRP materials. Anchor lengths were 10 in. in order to have a 4 in.
embedment depth and 6 in. fan length. Two sizes of GFRP anchors were used: 1/2 in. and 5/8 in, which
was determined by the availability of commercially pre-made anchors from Fyfe Co., LLC.
Figure 3.2 Dimensions of test specimen
The width of CFRP materials used to make the bottom and side reinforcement was based on
dimensions of previous tests at Ferguson Lab in which 3 in. and 5 in. wide CFRP sheets for bottom
reinforcement and 5 in. sheets for side reinforcement were used. In an effort to produce comparable
results, the same dimensions were used for the beams in this experiment. The different sizes of CFRP
reinforcement develop different tensile capacities. Thus, varying the width of the bottom CFRP sheet
will provide insight into the strength of the CFRP material as well as the effectiveness of the GFRP
anchors. Table 3.1 shows the design parameters of each beam. Section 3.3 explains each parameter in
greater detail.
1-in. notch
22
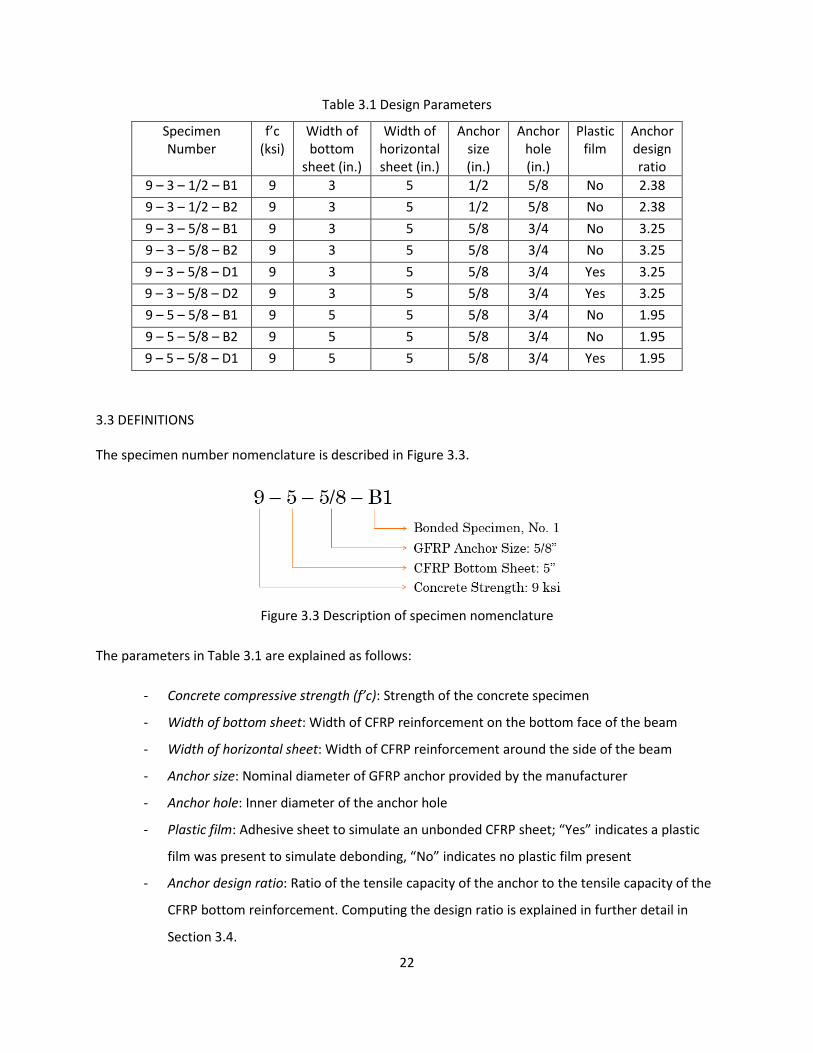
Table 3.1 Design Parameters
Specimen Number
f’c (ksi)
Width of bottom
sheet (in.)
Width of horizontal sheet (in.)
Anchor size (in.)
Anchor hole (in.)
Plastic film
Anchor design ratio
9 – 3 – 1/2 – B1 9 3 5 1/2 5/8 No 2.38 9 – 3 – 1/2 – B2 9 3 5 1/2 5/8 No 2.38 9 – 3 – 5/8 – B1 9 3 5 5/8 3/4 No 3.25 9 – 3 – 5/8 – B2 9 3 5 5/8 3/4 No 3.25 9 – 3 – 5/8 – D1 9 3 5 5/8 3/4 Yes 3.25 9 – 3 – 5/8 – D2 9 3 5 5/8 3/4 Yes 3.25 9 – 5 – 5/8 – B1 9 5 5 5/8 3/4 No 1.95 9 – 5 – 5/8 – B2 9 5 5 5/8 3/4 No 1.95 9 – 5 – 5/8 – D1 9 5 5 5/8 3/4 Yes 1.95
3.3 DEFINITIONS
The specimen number nomenclature is described in Figure 3.3.
Figure 3.3 Description of specimen nomenclature
The parameters in Table 3.1 are explained as follows:
- Concrete compressive strength (f’c): Strength of the concrete specimen
- Width of bottom sheet: Width of CFRP reinforcement on the bottom face of the beam
- Width of horizontal sheet: Width of CFRP reinforcement around the side of the beam
- Anchor size: Nominal diameter of GFRP anchor provided by the manufacturer
- Anchor hole: Inner diameter of the anchor hole
- Plastic film: Adhesive sheet to simulate an unbonded CFRP sheet; “Yes” indicates a plastic
film was present to simulate debonding, “No” indicates no plastic film present
- Anchor design ratio: Ratio of the tensile capacity of the anchor to the tensile capacity of the
CFRP bottom reinforcement. Computing the design ratio is explained in further detail in
Section 3.4.
23
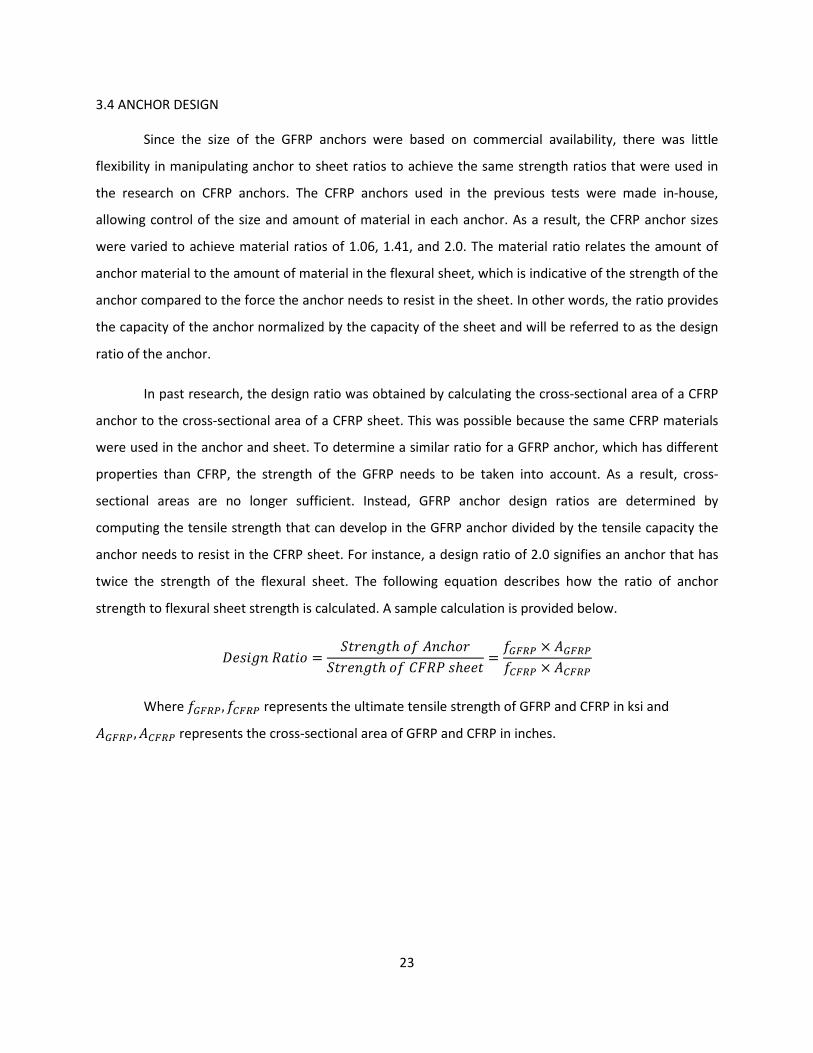
3.4 ANCHOR DESIGN
Since the size of the GFRP anchors were based on commercial availability, there was little
flexibility in manipulating anchor to sheet ratios to achieve the same strength ratios that were used in
the research on CFRP anchors. The CFRP anchors used in the previous tests were made in-house,
allowing control of the size and amount of material in each anchor. As a result, the CFRP anchor sizes
were varied to achieve material ratios of 1.06, 1.41, and 2.0. The material ratio relates the amount of
anchor material to the amount of material in the flexural sheet, which is indicative of the strength of the
anchor compared to the force the anchor needs to resist in the sheet. In other words, the ratio provides
the capacity of the anchor normalized by the capacity of the sheet and will be referred to as the design
ratio of the anchor.
In past research, the design ratio was obtained by calculating the cross-sectional area of a CFRP
anchor to the cross-sectional area of a CFRP sheet. This was possible because the same CFRP materials
were used in the anchor and sheet. To determine a similar ratio for a GFRP anchor, which has different
properties than CFRP, the strength of the GFRP needs to be taken into account. As a result, cross-
sectional areas are no longer sufficient. Instead, GFRP anchor design ratios are determined by
computing the tensile strength that can develop in the GFRP anchor divided by the tensile capacity the
anchor needs to resist in the CFRP sheet. For instance, a design ratio of 2.0 signifies an anchor that has
twice the strength of the flexural sheet. The following equation describes how the ratio of anchor
strength to flexural sheet strength is calculated. A sample calculation is provided below.
𝐷𝑒𝑠𝑖𝑔𝑛 𝑅𝑎𝑡𝑖𝑜 =𝑆𝑡𝑟𝑒𝑛𝑔𝑡ℎ 𝑜𝑓 𝐴𝑛𝑐ℎ𝑜𝑟
𝑆𝑡𝑟𝑒𝑛𝑔𝑡ℎ 𝑜𝑓 𝐶𝐹𝑅𝑃 𝑠ℎ𝑒𝑒𝑡=𝑓𝐺𝐹𝑅𝑃 × 𝐴𝐺𝐹𝑅𝑃𝑓𝐶𝐹𝑅𝑃 × 𝐴𝐶𝐹𝑅𝑃
Where 𝑓𝐺𝐹𝑅𝑃,𝑓𝐶𝐹𝑅𝑃 represents the ultimate tensile strength of GFRP and CFRP in ksi and
𝐴𝐺𝐹𝑅𝑃 ,𝐴𝐶𝐹𝑅𝑃 represents the cross-sectional area of GFRP and CFRP in inches.
24
Sample calculation
Specimen 9 – 5 – 5/8 – B1: GFRP CFRP
Anchor size: 5/8 in. Flexural sheet: 5 in.
𝑓𝐺𝐹𝑅𝑃 = 470 𝑘𝑠𝑖 𝑓𝐶𝐹𝑅𝑃 = 550 𝑘𝑠𝑖
𝐴𝐺𝐹𝑅𝑃 = 0.0935 𝑖𝑛2 𝐴𝐶𝐹𝑅𝑃 𝑠ℎ𝑒𝑒𝑡 = 0.041 𝑖𝑛2
Design Ratio:
𝑓𝐺𝐹𝑅𝑃 × 𝐴𝐺𝐹𝑅𝑃𝑓𝐶𝐹𝑅𝑃 × 𝐴𝐶𝐹𝑅𝑃
=470 𝑘𝑠𝑖 × 0.0935 𝑖𝑛2
550 𝑘𝑠𝑖 × 0.041 𝑖𝑛2= 1.95
Cross-sectional areas of the materials are determined by weight using density values provided
by the manufacturer. For the complete calculations, see Appendix A.
3.5 MATERIAL PROPERTIES
3.5.1 Concrete
The test specimens were cast from a single batch of concrete. The compressive strength of the
concrete was found by testing 4-inch by 8-inch test cylinders in accordance with ASTM C39 “Standard
Test Method for Compressive Strength of Cylindrical Concrete Specimens”. The design strength of the
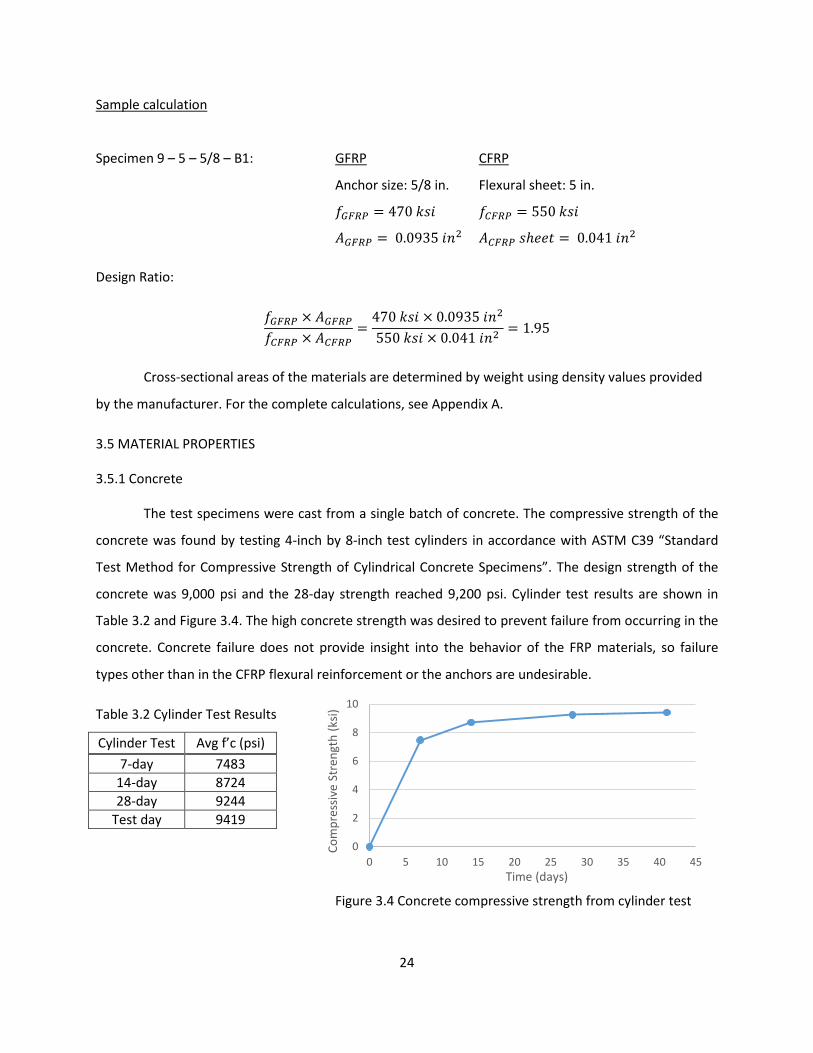
concrete was 9,000 psi and the 28-day strength reached 9,200 psi. Cylinder test results are shown in
Table 3.2 and Figure 3.4. The high concrete strength was desired to prevent failure from occurring in the
concrete. Concrete failure does not provide insight into the behavior of the FRP materials, so failure
types other than in the CFRP flexural reinforcement or the anchors are undesirable.
Table 3.2 Cylinder Test Results
Figure 3.4 Concrete compressive strength from cylinder test
Cylinder Test Avg f’c (psi) 7-day 7483
14-day 8724 28-day 9244
Test day 9419
0
2
4
6
8
10
0 5 10 15 20 25 30 35 40 45
Com
pres
sive
Stre
ngth
(ksi)
Time (days)

25
3.5.2 CFRP and GFRP
The CFRP material used in this study was Tyfo® SCH – 11UP composite and the GFRP material
was Tyfo® SEH – 51A. Tyfo® S Epoxy from FYFE Co. LLC was used to bond FRP materials to the test
specimens according to specifications from the manufacturer. The tensile strength of the CFRP and GFRP
materials were measured using ASTM D 3039 procedures and presented in Table 3.3. Tension coupon
tests confirming the manufacturer specified properties have been conducted as part of a previous
project.
Table 3.3 Material Properties of Tyfo® FRP Materials
Property Tyfo® SCH-11UP (CFRP) Tyfo® SEH-51A (GFRP) Dry Fiber
Tensile Strength 550,000 psi 470,000 psi Tensile Modulus 33.4 x 10⁶ psi 10.5 x 10⁶ psi
Ultimate Elongation 1.7 % 4.5 % Laminate
Tensile Strength 143,000 psi 83,400 psi Tensile Modulus 15.3 x 10⁶ psi 3.79 x 10⁶ psi
Ultimate Elongation 0.93 % 2.2 % Nominal Thickness 0.02 in 0.05 in
Stress-strain curves of the CFRP and GFRP materials are shown in Figure 3.5. Although CFRP
materials are much stiffer and have greater strength than GFRP materials, GFRP has considerably larger
ultimate strains that allows the material much greater deformation capacity. Both materials were one
directional and have very small tensile capacity in the transverse fiber direction.
Figure 3.5 Comparing stress-strain of Tyfo® CFRP and GFRP materials
0
100
200
300
400
500
600
0 0.01 0.02 0.03 0.04 0.05
Stre
ss (k
si)
Strain (in/in)
GFRP Dry CFRP Dry GFRP Lam CFRP Lam
26
3.6 SPECIMEN PREPARATION FOR FRP USE
3.6.1 ACI 440 Recommendation for Specimen Preparation
To ensure proper bonding between FRP materials and the concrete, preparation is needed to
provide an acceptable surface profile for CFRP installation. Careful adherence to installation procedures
according to ACI 440.2R and as provided by the material supplier must be followed. The installation
procedure for FRP materials is described in Chapter 5 of ACI 440.2R and is as follows:
1. Prepare concrete surface
2. Drill holes for anchorage
3. Prepare the epoxy resin (using specified proportions for the two component material)
4. Saturate the concrete surface and holes with epoxy resin
5. Saturate fibers with epoxy and remove excess epoxy
6. Place FRP material on specimen
7. Cure (for appropriate time according to manufacturer)
3.6.2 Surface Preparation
To allow for the best bond between the epoxy resin and concrete, the manufacturer provides
instructions for the preparation of surfaces. According to Fyfe, the surface must generally be clean, dry,
and free of protrusions or cavities to prevent voids from forming behind the composite materials.
Additional instructions depend on the element being reinforced. Surfaces that allow continuous wraps
of FRP (for example, columns) require only a light dusting, while discontinuous wrapping surfaces (like
walls, beams, slabs, etc.) will require sandblasting, grinding, or other similar methods to smooth the
surface for bonding.
Following these specifications, the concrete surface of all test specimens were ground to meet
the surface requirements for bonding Tyfo® products (Figure 3.6). Figures 3.7 and Figure 3.8 show the
concrete surface conditions before and after grinding.
27
Figure 3.6 Grinding concrete surfaces to prepare for CFRP installation
Figure 3.7 Concrete surface before grinding
Figure 3.8 Concrete surface after grinding
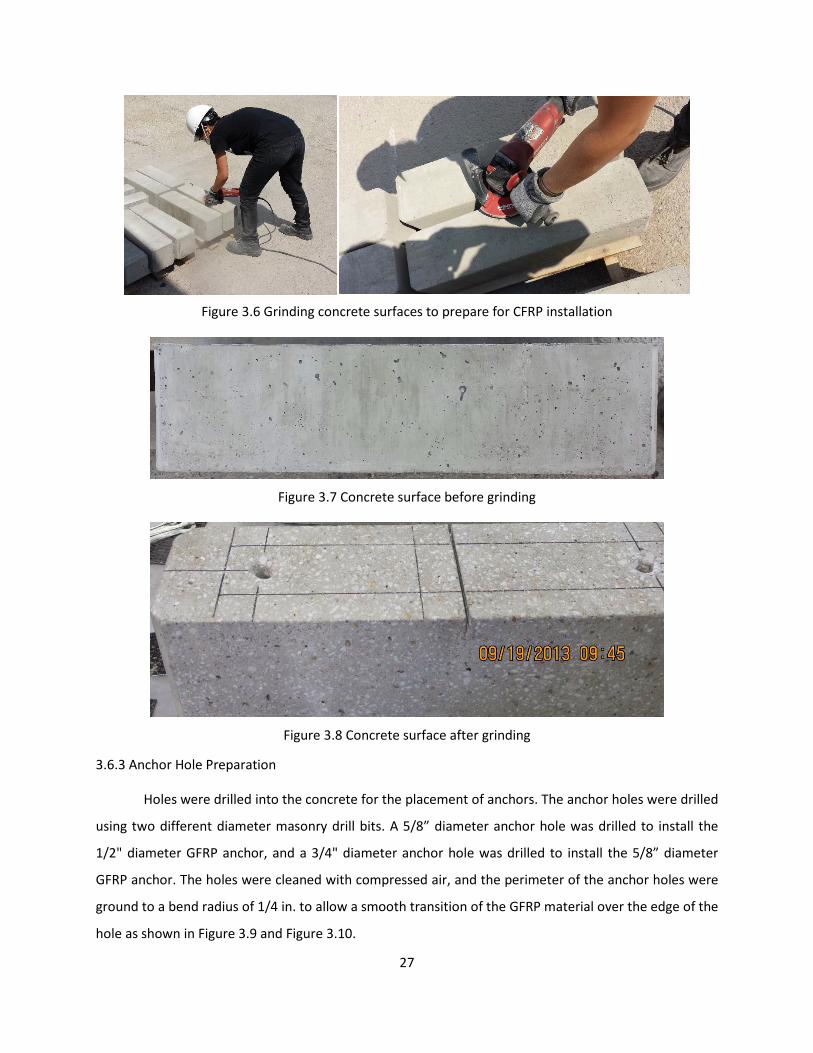
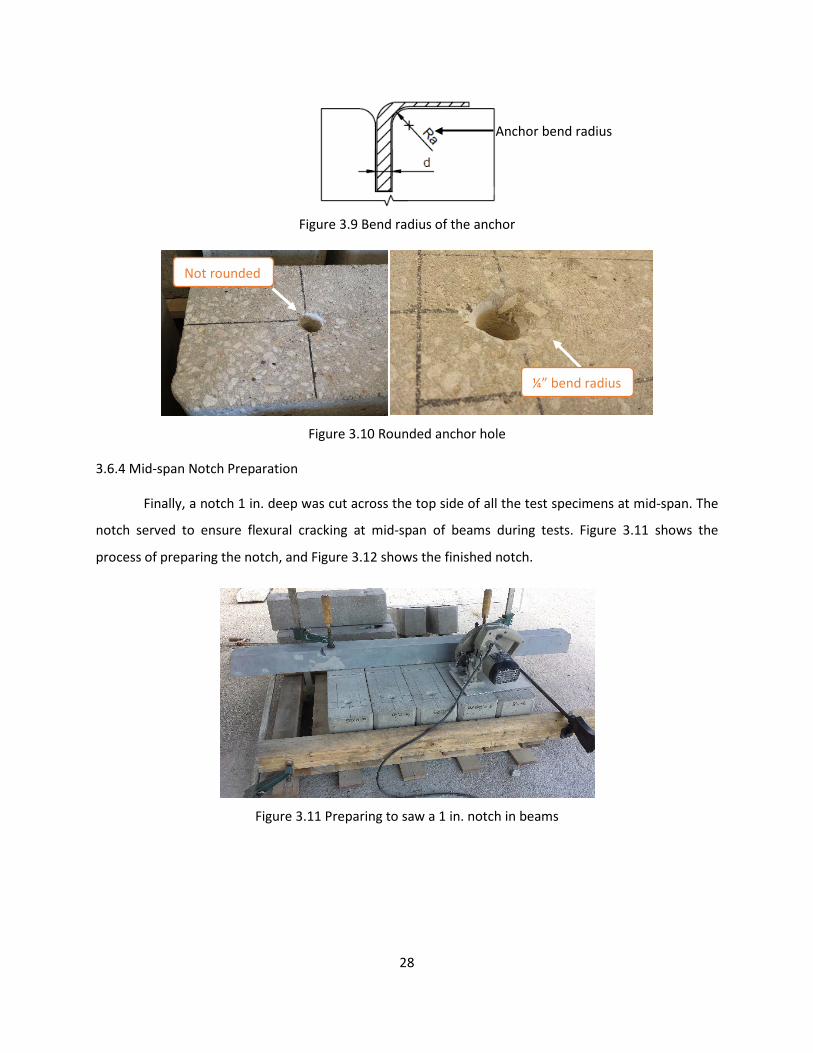
3.6.3 Anchor Hole Preparation
Holes were drilled into the concrete for the placement of anchors. The anchor holes were drilled
using two different diameter masonry drill bits. A 5/8” diameter anchor hole was drilled to install the
1/2" diameter GFRP anchor, and a 3/4" diameter anchor hole was drilled to install the 5/8” diameter
GFRP anchor. The holes were cleaned with compressed air, and the perimeter of the anchor holes were
ground to a bend radius of 1/4 in. to allow a smooth transition of the GFRP material over the edge of the
hole as shown in Figure 3.9 and Figure 3.10.
28
Figure 3.9 Bend radius of the anchor
Figure 3.10 Rounded anchor hole
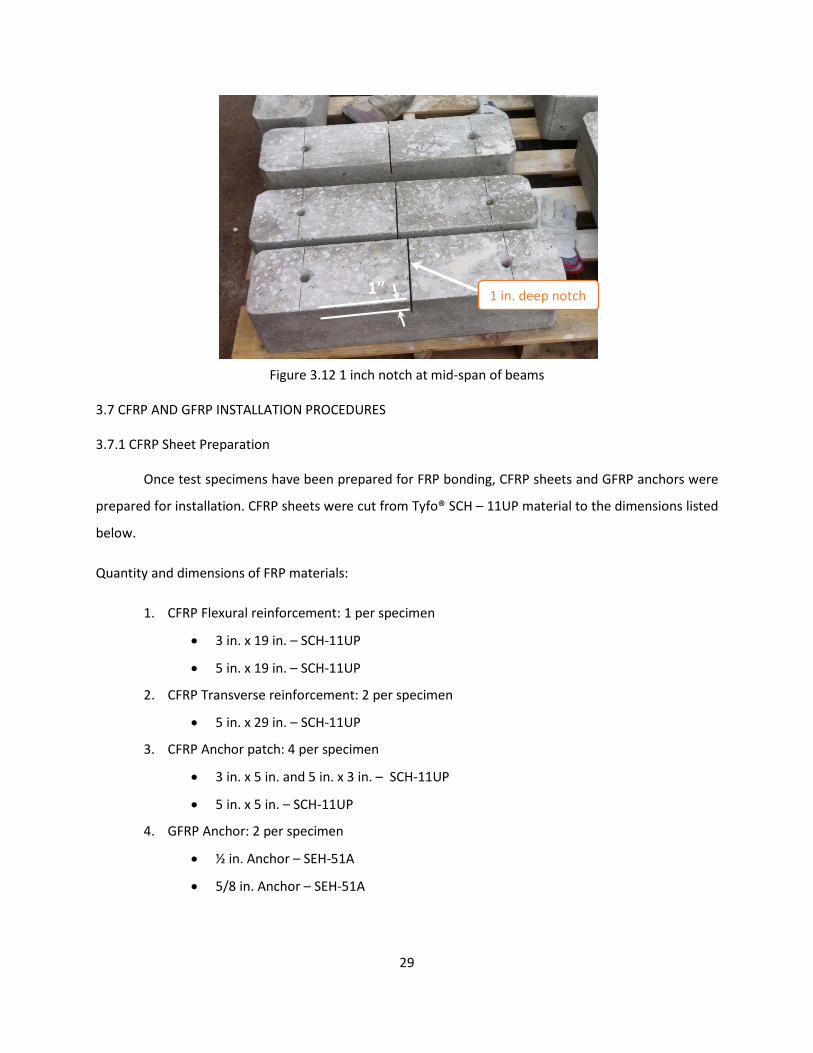
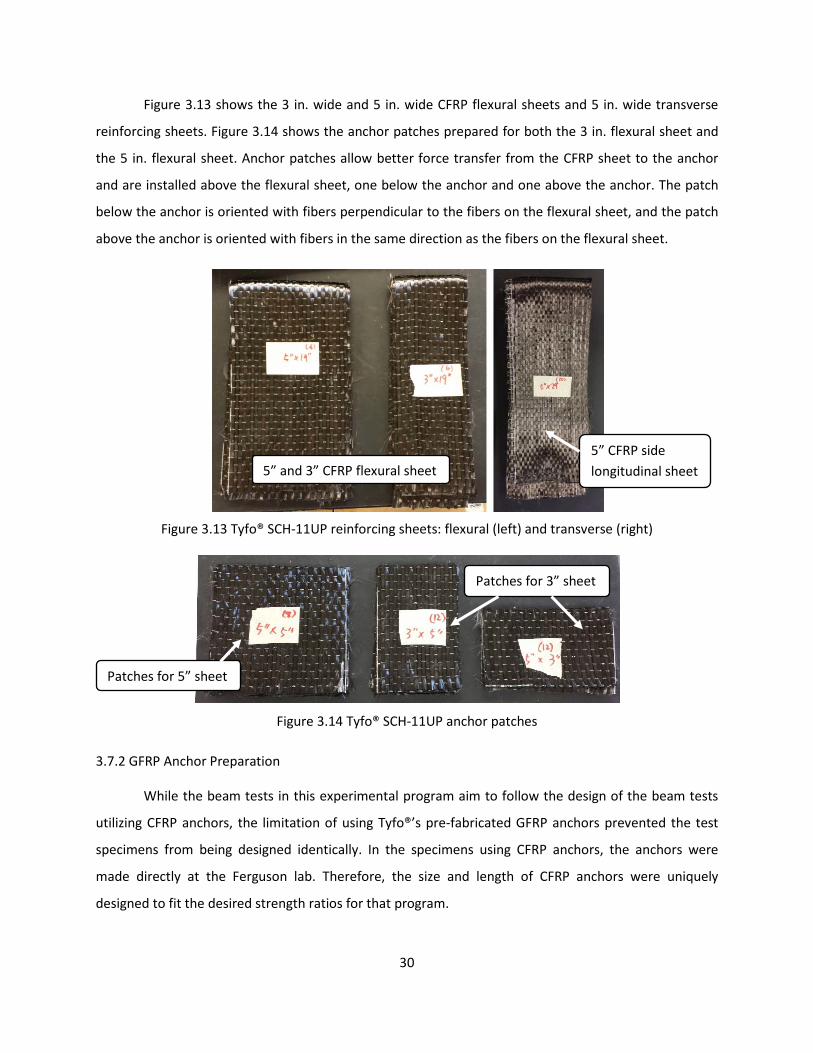
3.6.4 Mid-span Notch Preparation
Finally, a notch 1 in. deep was cut across the top side of all the test specimens at mid-span. The
notch served to ensure flexural cracking at mid-span of beams during tests. Figure 3.11 shows the
process of preparing the notch, and Figure 3.12 shows the finished notch.
Figure 3.11 Preparing to saw a 1 in. notch in beams
Not rounded
¼” bend radius
Anchor bend radius
29
Figure 3.12 1 inch notch at mid-span of beams
3.7 CFRP AND GFRP INSTALLATION PROCEDURES
3.7.1 CFRP Sheet Preparation
Once test specimens have been prepared for FRP bonding, CFRP sheets and GFRP anchors were
prepared for installation. CFRP sheets were cut from Tyfo® SCH – 11UP material to the dimensions listed
below.
Quantity and dimensions of FRP materials:
1. CFRP Flexural reinforcement: 1 per specimen
• 3 in. x 19 in. – SCH-11UP
• 5 in. x 19 in. – SCH-11UP
2. CFRP Transverse reinforcement: 2 per specimen
• 5 in. x 29 in. – SCH-11UP
3. CFRP Anchor patch: 4 per specimen
• 3 in. x 5 in. and 5 in. x 3 in. – SCH-11UP
• 5 in. x 5 in. – SCH-11UP
4. GFRP Anchor: 2 per specimen
• ½ in. Anchor – SEH-51A
• 5/8 in. Anchor – SEH-51A
1” 1 in. deep notch
30
Figure 3.13 shows the 3 in. wide and 5 in. wide CFRP flexural sheets and 5 in. wide transverse
reinforcing sheets. Figure 3.14 shows the anchor patches prepared for both the 3 in. flexural sheet and
the 5 in. flexural sheet. Anchor patches allow better force transfer from the CFRP sheet to the anchor
and are installed above the flexural sheet, one below the anchor and one above the anchor. The patch
below the anchor is oriented with fibers perpendicular to the fibers on the flexural sheet, and the patch
above the anchor is oriented with fibers in the same direction as the fibers on the flexural sheet.
Figure 3.13 Tyfo® SCH-11UP reinforcing sheets: flexural (left) and transverse (right)
Figure 3.14 Tyfo® SCH-11UP anchor patches
3.7.2 GFRP Anchor Preparation
While the beam tests in this experimental program aim to follow the design of the beam tests
utilizing CFRP anchors, the limitation of using Tyfo®’s pre-fabricated GFRP anchors prevented the test
specimens from being designed identically. In the specimens using CFRP anchors, the anchors were
made directly at the Ferguson lab. Therefore, the size and length of CFRP anchors were uniquely
designed to fit the desired strength ratios for that program.
5” and 3” CFRP flexural sheet 5” CFRP side longitudinal sheet
Patches for 3” sheet
Patches for 5” sheet
31
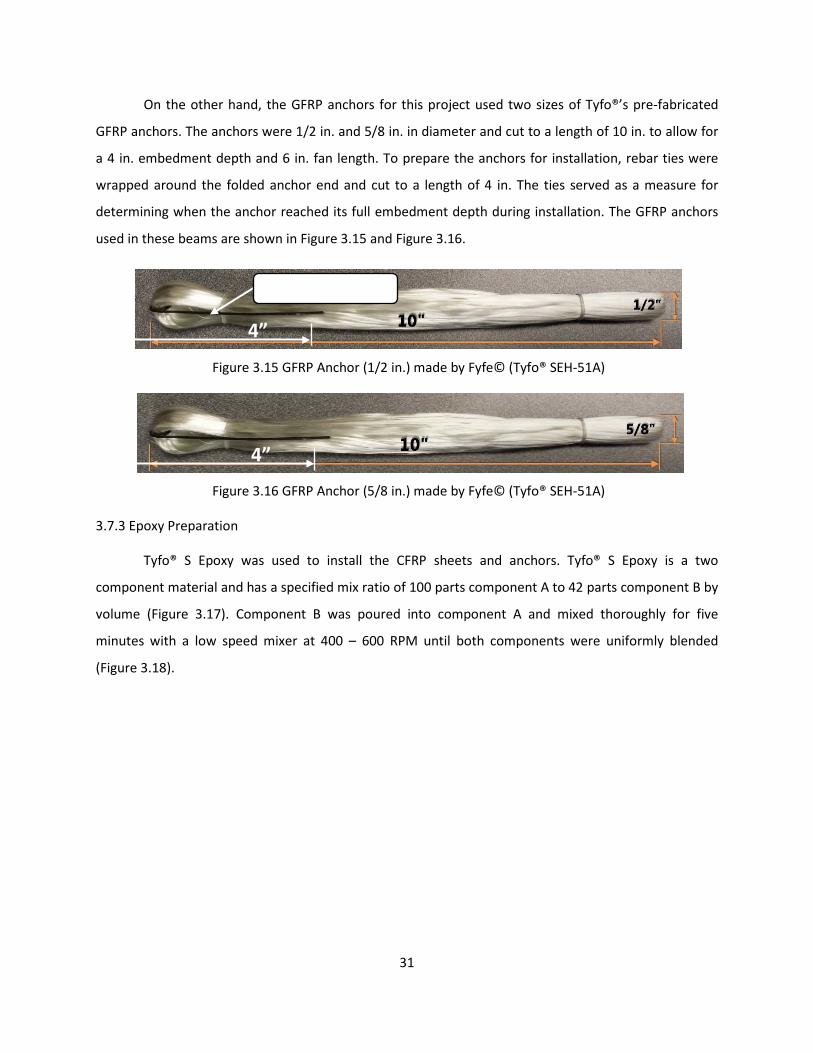
On the other hand, the GFRP anchors for this project used two sizes of Tyfo®’s pre-fabricated
GFRP anchors. The anchors were 1/2 in. and 5/8 in. in diameter and cut to a length of 10 in. to allow for
a 4 in. embedment depth and 6 in. fan length. To prepare the anchors for installation, rebar ties were
wrapped around the folded anchor end and cut to a length of 4 in. The ties served as a measure for
determining when the anchor reached its full embedment depth during installation. The GFRP anchors
used in these beams are shown in Figure 3.15 and Figure 3.16.
Figure 3.15 GFRP Anchor (1/2 in.) made by Fyfe© (Tyfo® SEH-51A)
Figure 3.16 GFRP Anchor (5/8 in.) made by Fyfe© (Tyfo® SEH-51A)
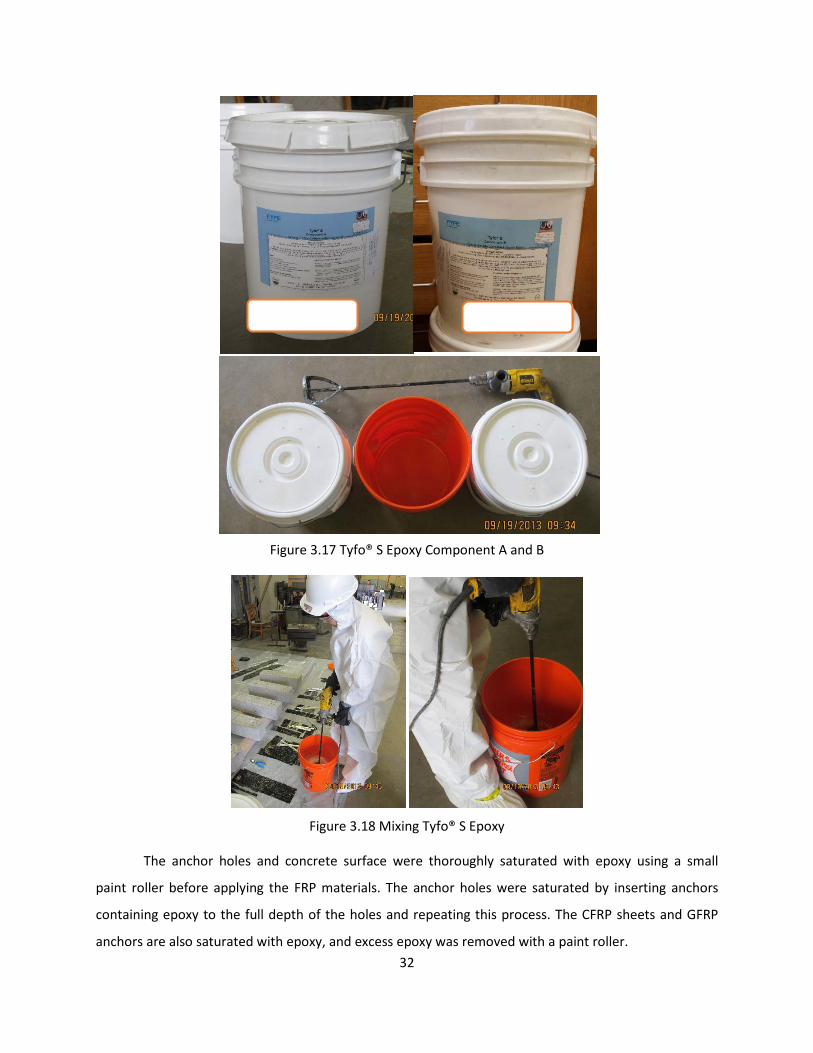
3.7.3 Epoxy Preparation
Tyfo® S Epoxy was used to install the CFRP sheets and anchors. Tyfo® S Epoxy is a two
component material and has a specified mix ratio of 100 parts component A to 42 parts component B by
volume (Figure 3.17). Component B was poured into component A and mixed thoroughly for five
minutes with a low speed mixer at 400 – 600 RPM until both components were uniformly blended
(Figure 3.18).
Rebar tie (4” length)
4”
4”
32
Figure 3.17 Tyfo® S Epoxy Component A and B
Figure 3.18 Mixing Tyfo® S Epoxy
The anchor holes and concrete surface were thoroughly saturated with epoxy using a small
paint roller before applying the FRP materials. The anchor holes were saturated by inserting anchors
containing epoxy to the full depth of the holes and repeating this process. The CFRP sheets and GFRP
anchors are also saturated with epoxy, and excess epoxy was removed with a paint roller.
Component A Component B
33
3.7.4 Applying FRP Materials onto Beams
CFRP sheets were applied using pre-marked guidelines drawn on the beams. Air pockets in the
CFRP were removed by smoothing the sheets with plastic putty knives. GFRP anchors were installed by
applying the first anchor patch on top of the flexural sheet above the location of the anchor hole. The
fiber orientation of the first patch was perpendicular to the direction of the fibers on the flexural sheet.
The fibers were pried apart in their longitudinal directions to create an opening for the GFRP anchor to
be inserted through the CFRP sheets. The anchors were inserted to a full depth of 4 in. by pushing
downward into the anchor hole using the attached rebar ties. Once the rebar ties were fully submerged
inside the anchor hole, the GFRP anchors were considered fully inserted and the remaining 6 in. of
anchor length was spread over the CFRP flexural sheet in a fan. The second patch was used to cover the
top of the anchor. The fiber orientation of the second patch was parallel to the fiber direction of the
flexural sheet.
The specimens were allowed to cure for 72 hours according to instructions from the
manufacturer before testing.
3.8 TESTING
3.8.1 Instrumentation
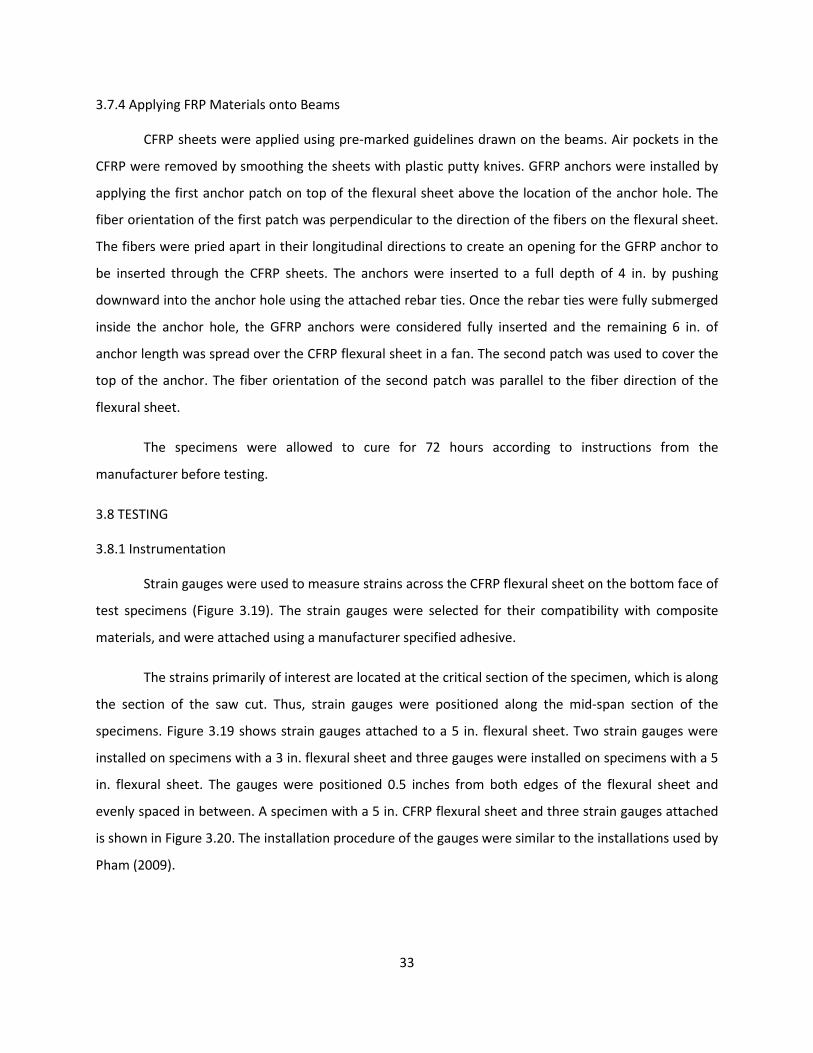
Strain gauges were used to measure strains across the CFRP flexural sheet on the bottom face of
test specimens (Figure 3.19). The strain gauges were selected for their compatibility with composite
materials, and were attached using a manufacturer specified adhesive.
The strains primarily of interest are located at the critical section of the specimen, which is along
the section of the saw cut. Thus, strain gauges were positioned along the mid-span section of the
specimens. Figure 3.19 shows strain gauges attached to a 5 in. flexural sheet. Two strain gauges were
installed on specimens with a 3 in. flexural sheet and three gauges were installed on specimens with a 5
in. flexural sheet. The gauges were positioned 0.5 inches from both edges of the flexural sheet and
evenly spaced in between. A specimen with a 5 in. CFRP flexural sheet and three strain gauges attached
is shown in Figure 3.20. The installation procedure of the gauges were similar to the installations used by
Pham (2009).
34
Figure 3.19 BFLA-5-8-5LT composite material strain gauge
Figure 3.20 Specimen with 3 gauges attached on a 5 in. CFRP sheet
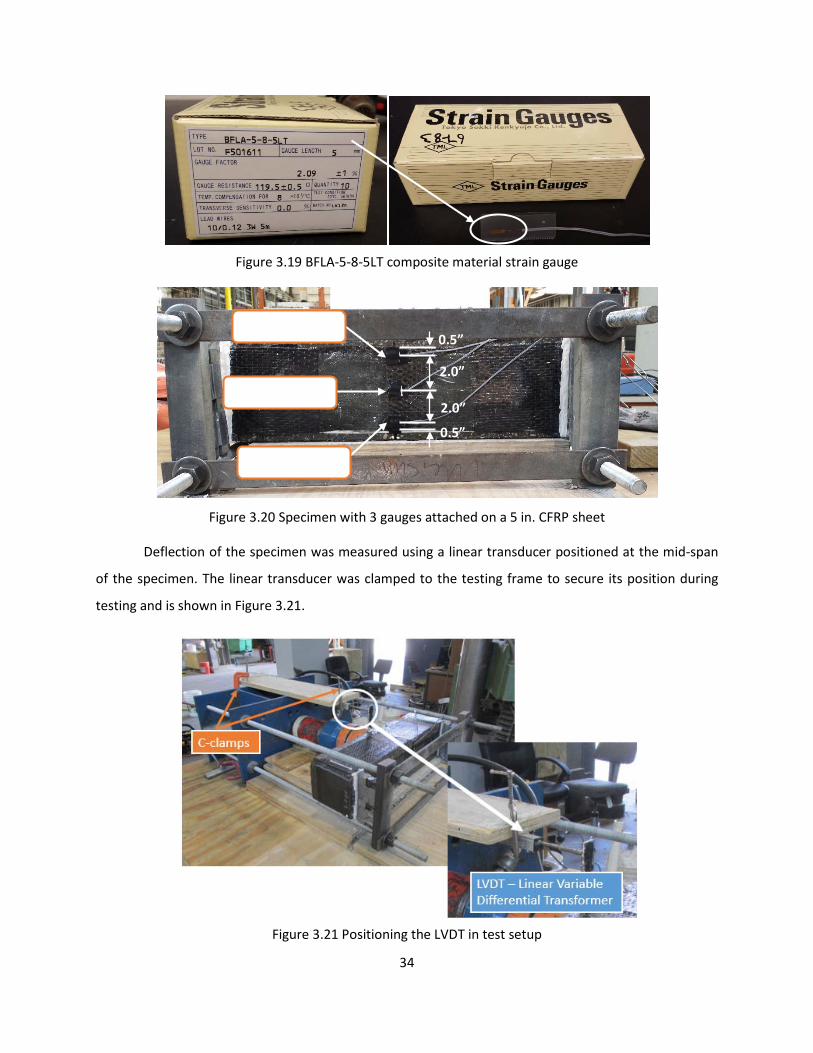
Deflection of the specimen was measured using a linear transducer positioned at the mid-span
of the specimen. The linear transducer was clamped to the testing frame to secure its position during
testing and is shown in Figure 3.21.
Figure 3.21 Positioning the LVDT in test setup
Strain gauge A
Strain gauge B
Strain gauge C
0.5”
0.5”
2.0”
2.0”
35
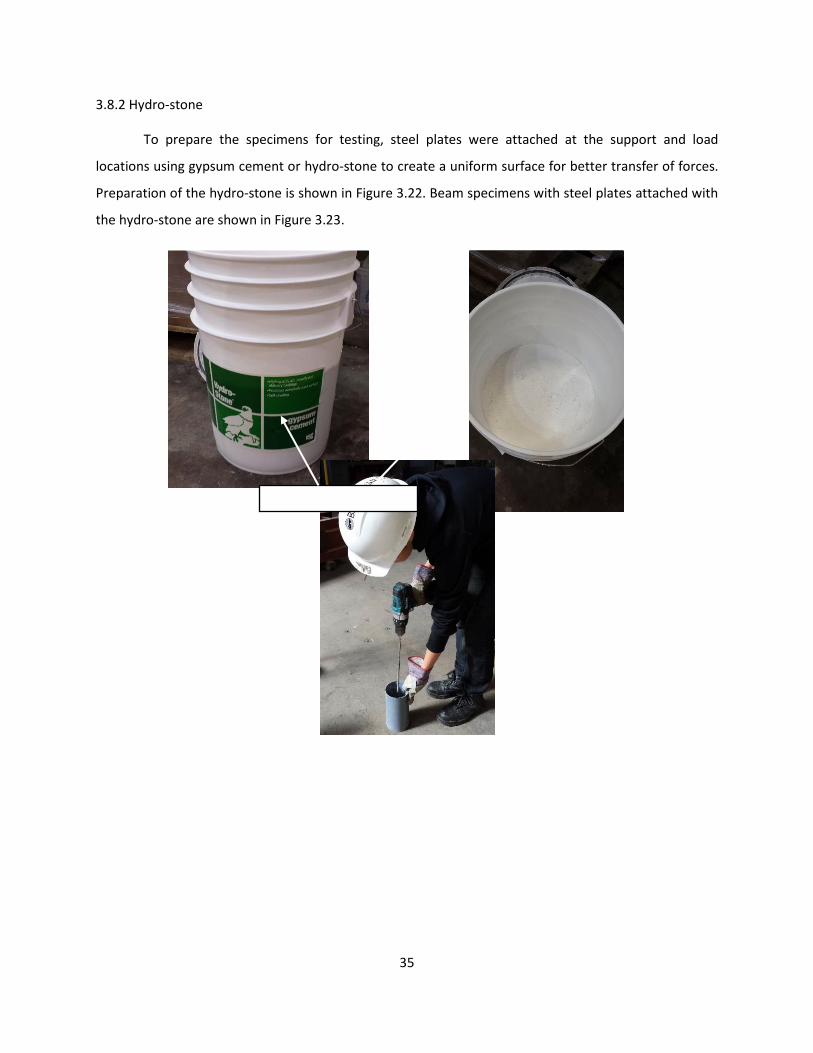
3.8.2 Hydro-stone
To prepare the specimens for testing, steel plates were attached at the support and load
locations using gypsum cement or hydro-stone to create a uniform surface for better transfer of forces.
Preparation of the hydro-stone is shown in Figure 3.22. Beam specimens with steel plates attached with
the hydro-stone are shown in Figure 3.23.
Hydro-stone (powder)
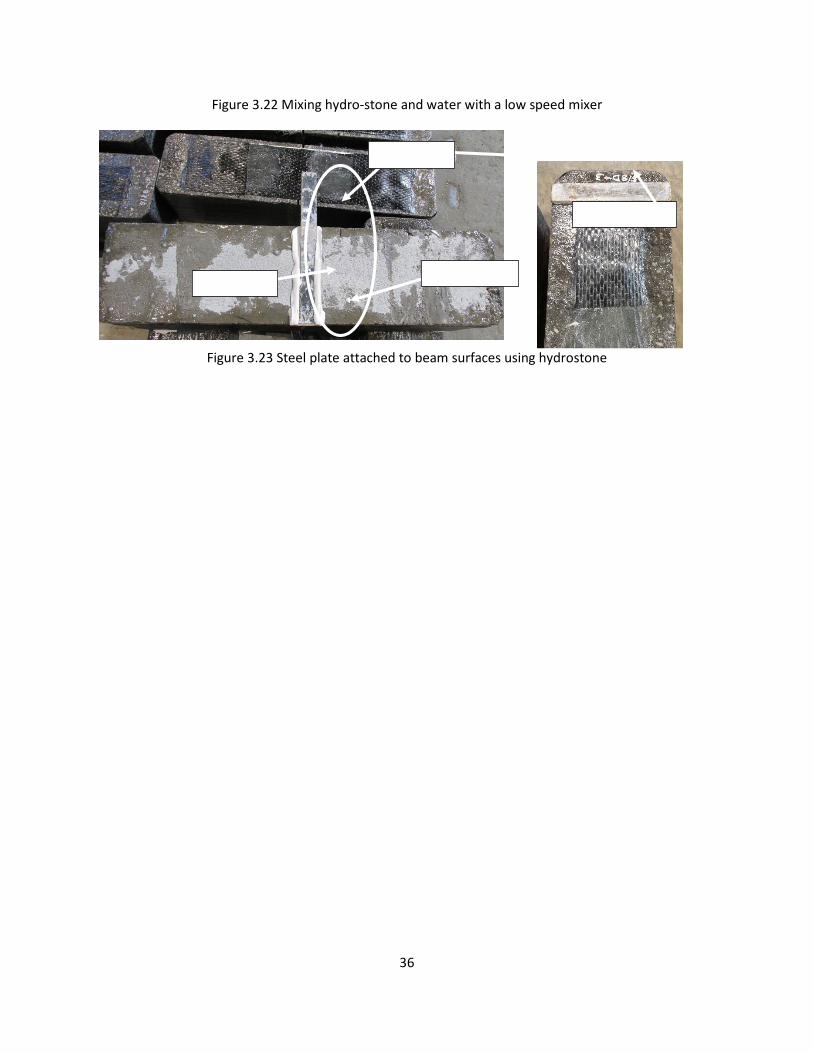
36
Figure 3.22 Mixing hydro-stone and water with a low speed mixer
Figure 3.23 Steel plate attached to beam surfaces using hydrostone
Hydro-stone
Support point
Load point
Steel plate
37
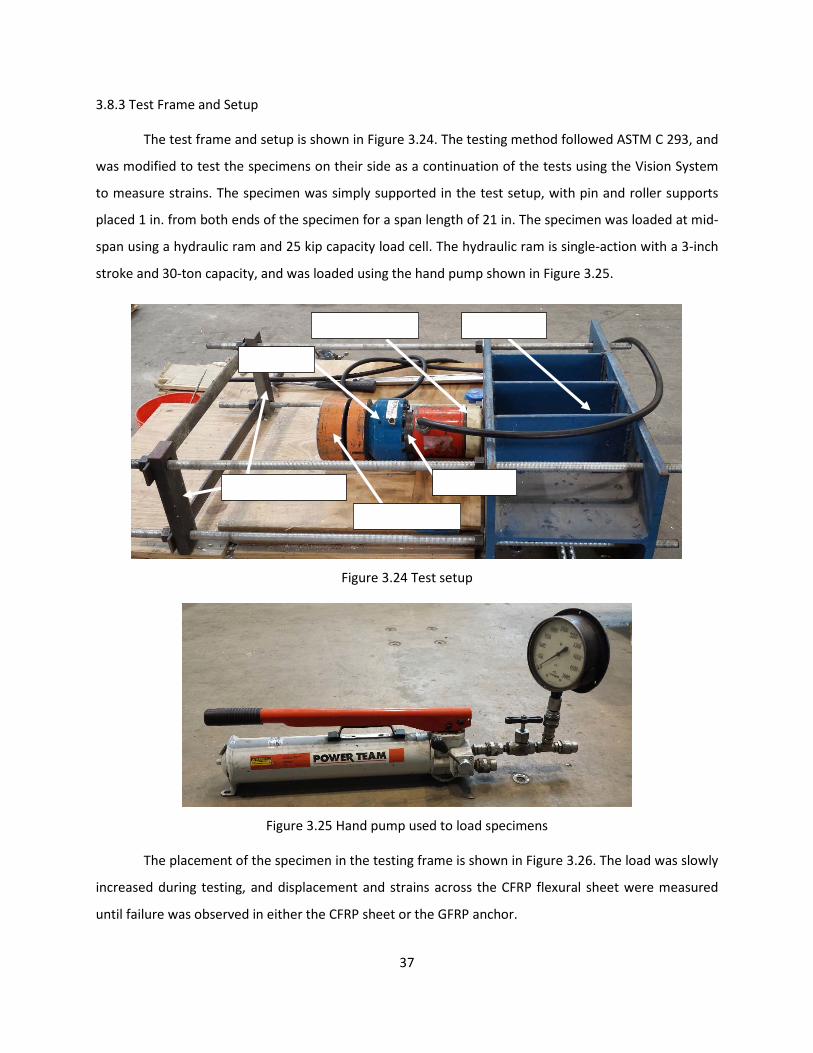
3.8.3 Test Frame and Setup
The test frame and setup is shown in Figure 3.24. The testing method followed ASTM C 293, and
was modified to test the specimens on their side as a continuation of the tests using the Vision System
to measure strains. The specimen was simply supported in the test setup, with pin and roller supports
placed 1 in. from both ends of the specimen for a span length of 21 in. The specimen was loaded at mid-
span using a hydraulic ram and 25 kip capacity load cell. The hydraulic ram is single-action with a 3-inch
stroke and 30-ton capacity, and was loaded using the hand pump shown in Figure 3.25.
Figure 3.24 Test setup
Figure 3.25 Hand pump used to load specimens
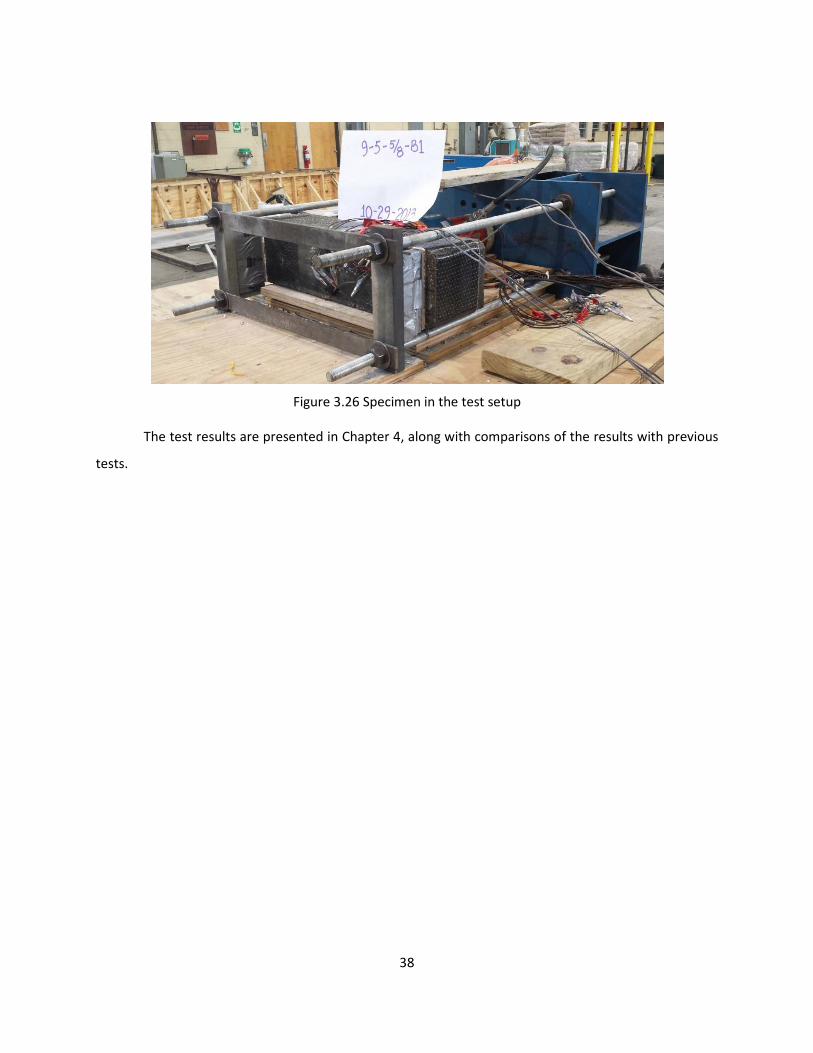
The placement of the specimen in the testing frame is shown in Figure 3.26. The load was slowly
increased during testing, and displacement and strains across the CFRP flexural sheet were measured
until failure was observed in either the CFRP sheet or the GFRP anchor.
Spherical head
Steel plate
Load cell
Hydraulic ram Test frame
Support locations
38
Figure 3.26 Specimen in the test setup
The test results are presented in Chapter 4, along with comparisons of the results with previous
tests.

39
CHAPTER 4 Test Results
4.1 INTRODUCTION
The specimens were tested to examine the performance of glass fiber (GFRP) anchors compared
to the performance of carbon fiber (CFRP) anchors. These tests serve as an extension of earlier tests
conducted under TxDOT Project 0-6783. The specimens were designed to reflect the same parameters
as the beams containing CFRP anchors. However, the pre-fabricated GFRP anchors used in this project
could not be altered to match the capacity of previously tested CFRP anchors, so the GFRP anchored test
specimens were not identical but as similar as possible for comparisons of anchor performance. The test
results of the beams utilizing GFRP anchors are summarized in this chapter.
4.2 VARIABLES
Most beam tests were conducted using CFRP anchors, which has been found to significantly
increase the reliable strength of CFRP reinforcement. However, anchors made from materials other than
CFRP have yet to be explored for their potential. As a result, the following tests designed to examine the
performance of GFRP anchors will follow the same procedures and parameters used in testing CFRP
anchors.
The variables of the tests include:
• alternating the width of the CFRP flexural sheet
• alternating between fully bonded and unbonded CFRP sheets
• alternating the size of the anchor (ratio of anchor to strip capacity)
In previous specimens 3 in. and 5 in. wide CFRP sheets were installed on a 6 in. x 6 in. x 24 in.
plain concrete beam. By varying the size of the sheet, the capacity achieved in the flexural sheet will
change and the effectiveness of anchor ratios can be found by testing different sized anchors on each
sheet.
Some beam specimens were installed with a plastic film between the CFRP and the concrete to
simulate a fully debonded CFRP sheet while other beams were installed with the CFRP sheet fully
bonded to the concrete. Exploring the difference between bonding and debonding in the flexural sheet
gave an indication of the strength of the anchors by transferring all of the forces directly into the
anchors.
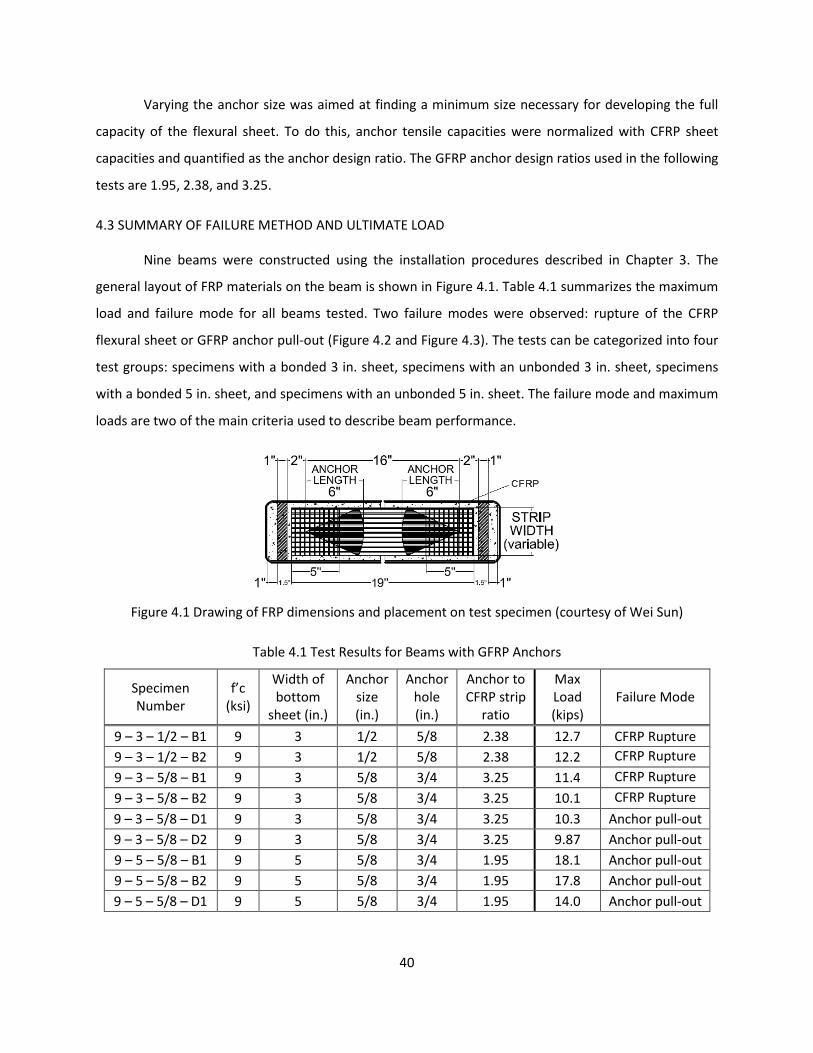
40
Varying the anchor size was aimed at finding a minimum size necessary for developing the full
capacity of the flexural sheet. To do this, anchor tensile capacities were normalized with CFRP sheet
capacities and quantified as the anchor design ratio. The GFRP anchor design ratios used in the following
tests are 1.95, 2.38, and 3.25.
4.3 SUMMARY OF FAILURE METHOD AND ULTIMATE LOAD
Nine beams were constructed using the installation procedures described in Chapter 3. The
general layout of FRP materials on the beam is shown in Figure 4.1. Table 4.1 summarizes the maximum
load and failure mode for all beams tested. Two failure modes were observed: rupture of the CFRP
flexural sheet or GFRP anchor pull-out (Figure 4.2 and Figure 4.3). The tests can be categorized into four
test groups: specimens with a bonded 3 in. sheet, specimens with an unbonded 3 in. sheet, specimens
with a bonded 5 in. sheet, and specimens with an unbonded 5 in. sheet. The failure mode and maximum
loads are two of the main criteria used to describe beam performance.
Figure 4.1 Drawing of FRP dimensions and placement on test specimen (courtesy of Wei Sun)
Table 4.1 Test Results for Beams with GFRP Anchors
Specimen Number
f’c (ksi)
Width of bottom
sheet (in.)
Anchor size (in.)
Anchor hole (in.)
Anchor to CFRP strip
ratio
Max Load (kips)
Failure Mode
9 – 3 – 1/2 – B1 9 3 1/2 5/8 2.38 12.7 CFRP Rupture 9 – 3 – 1/2 – B2 9 3 1/2 5/8 2.38 12.2 CFRP Rupture 9 – 3 – 5/8 – B1 9 3 5/8 3/4 3.25 11.4 CFRP Rupture 9 – 3 – 5/8 – B2 9 3 5/8 3/4 3.25 10.1 CFRP Rupture 9 – 3 – 5/8 – D1 9 3 5/8 3/4 3.25 10.3 Anchor pull-out 9 – 3 – 5/8 – D2 9 3 5/8 3/4 3.25 9.87 Anchor pull-out 9 – 5 – 5/8 – B1 9 5 5/8 3/4 1.95 18.1 Anchor pull-out 9 – 5 – 5/8 – B2 9 5 5/8 3/4 1.95 17.8 Anchor pull-out 9 – 5 – 5/8 – D1 9 5 5/8 3/4 1.95 14.0 Anchor pull-out
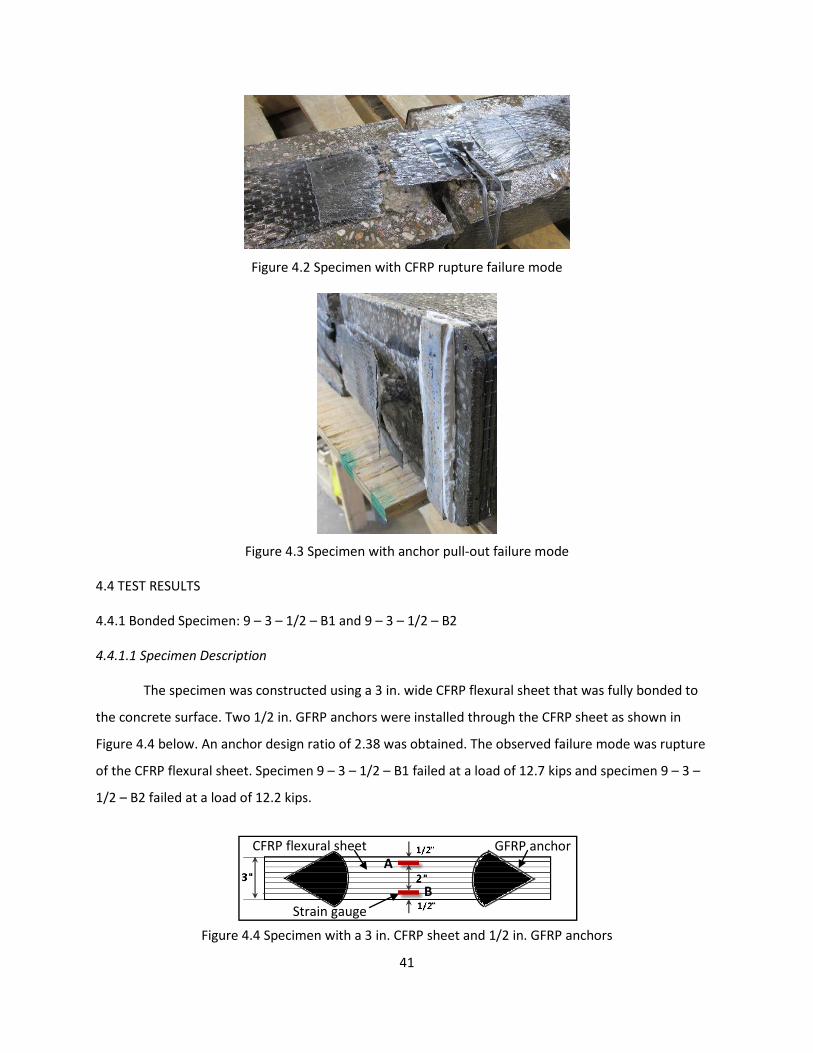
41
Figure 4.2 Specimen with CFRP rupture failure mode
Figure 4.3 Specimen with anchor pull-out failure mode
4.4 TEST RESULTS
4.4.1 Bonded Specimen: 9 – 3 – 1/2 – B1 and 9 – 3 – 1/2 – B2
4.4.1.1 Specimen Description
The specimen was constructed using a 3 in. wide CFRP flexural sheet that was fully bonded to
the concrete surface. Two 1/2 in. GFRP anchors were installed through the CFRP sheet as shown in
Figure 4.4 below. An anchor design ratio of 2.38 was obtained. The observed failure mode was rupture
of the CFRP flexural sheet. Specimen 9 – 3 – 1/2 – B1 failed at a load of 12.7 kips and specimen 9 – 3 –
1/2 – B2 failed at a load of 12.2 kips.
Figure 4.4 Specimen with a 3 in. CFRP sheet and 1/2 in. GFRP anchors
Strain gauge
A
B
CFRP flexural sheet GFRP anchor
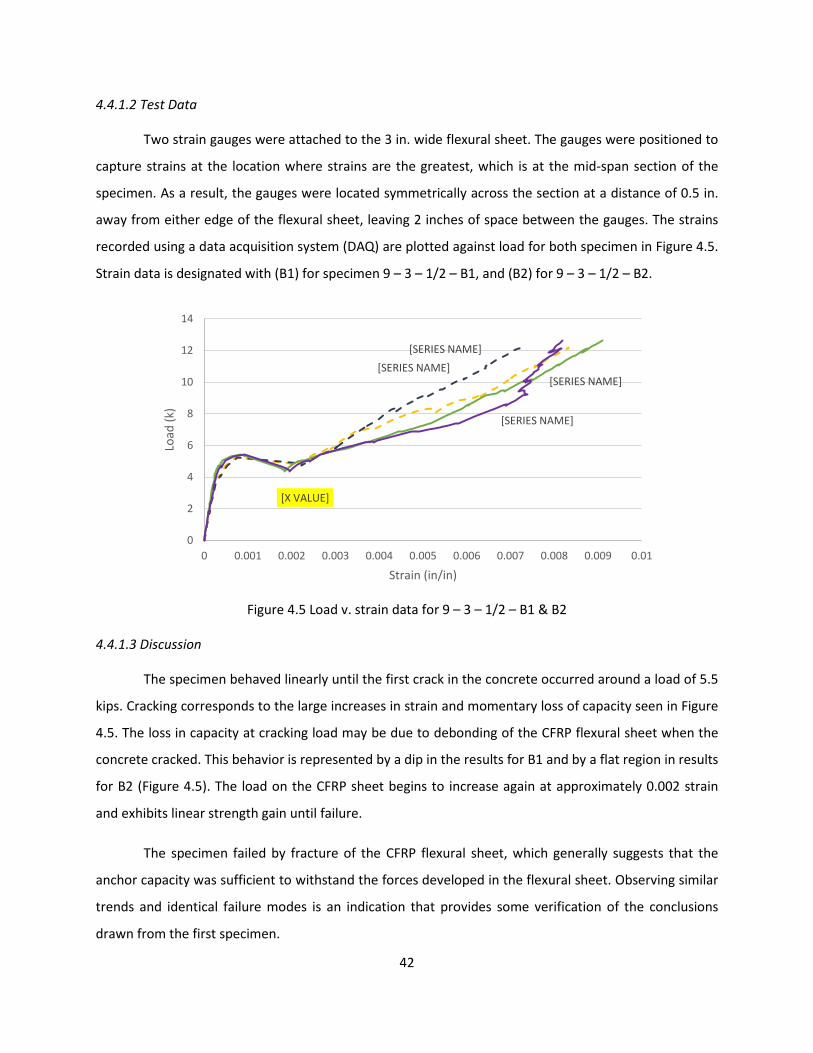
42
4.4.1.2 Test Data
Two strain gauges were attached to the 3 in. wide flexural sheet. The gauges were positioned to
capture strains at the location where strains are the greatest, which is at the mid-span section of the
specimen. As a result, the gauges were located symmetrically across the section at a distance of 0.5 in.
away from either edge of the flexural sheet, leaving 2 inches of space between the gauges. The strains
recorded using a data acquisition system (DAQ) are plotted against load for both specimen in Figure 4.5.
Strain data is designated with (B1) for specimen 9 – 3 – 1/2 – B1, and (B2) for 9 – 3 – 1/2 – B2.
Figure 4.5 Load v. strain data for 9 – 3 – 1/2 – B1 & B2
4.4.1.3 Discussion
The specimen behaved linearly until the first crack in the concrete occurred around a load of 5.5
kips. Cracking corresponds to the large increases in strain and momentary loss of capacity seen in Figure
4.5. The loss in capacity at cracking load may be due to debonding of the CFRP flexural sheet when the
concrete cracked. This behavior is represented by a dip in the results for B1 and by a flat region in results
for B2 (Figure 4.5). The load on the CFRP sheet begins to increase again at approximately 0.002 strain
and exhibits linear strength gain until failure.
The specimen failed by fracture of the CFRP flexural sheet, which generally suggests that the
anchor capacity was sufficient to withstand the forces developed in the flexural sheet. Observing similar
trends and identical failure modes is an indication that provides some verification of the conclusions
drawn from the first specimen.
[SERIES NAME] [SERIES NAME]
[SERIES NAME]
[X VALUE]
[SERIES NAME]
0
2
4
6
8
10
12
14
0 0.001 0.002 0.003 0.004 0.005 0.006 0.007 0.008 0.009 0.01
Load
(k)
Strain (in/in)
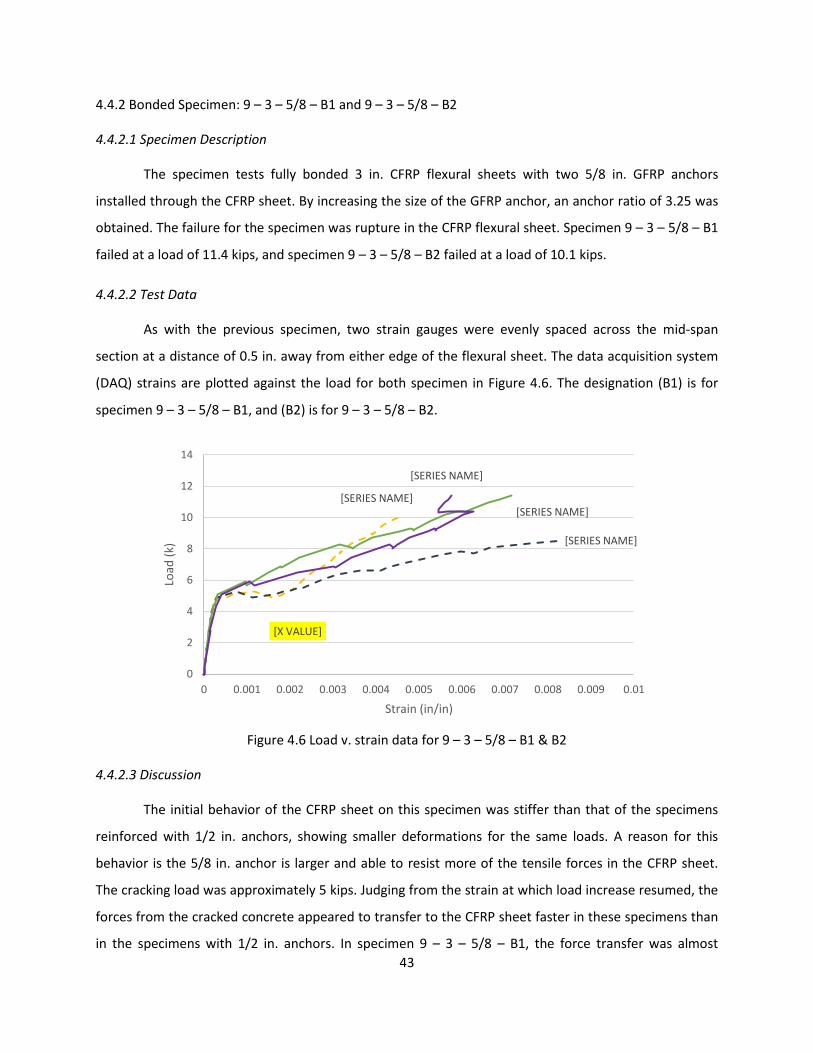
43
4.4.2 Bonded Specimen: 9 – 3 – 5/8 – B1 and 9 – 3 – 5/8 – B2
4.4.2.1 Specimen Description
The specimen tests fully bonded 3 in. CFRP flexural sheets with two 5/8 in. GFRP anchors
installed through the CFRP sheet. By increasing the size of the GFRP anchor, an anchor ratio of 3.25 was
obtained. The failure for the specimen was rupture in the CFRP flexural sheet. Specimen 9 – 3 – 5/8 – B1
failed at a load of 11.4 kips, and specimen 9 – 3 – 5/8 – B2 failed at a load of 10.1 kips.
4.4.2.2 Test Data
As with the previous specimen, two strain gauges were evenly spaced across the mid-span
section at a distance of 0.5 in. away from either edge of the flexural sheet. The data acquisition system
(DAQ) strains are plotted against the load for both specimen in Figure 4.6. The designation (B1) is for
specimen 9 – 3 – 5/8 – B1, and (B2) is for 9 – 3 – 5/8 – B2.
Figure 4.6 Load v. strain data for 9 – 3 – 5/8 – B1 & B2
4.4.2.3 Discussion
The initial behavior of the CFRP sheet on this specimen was stiffer than that of the specimens
reinforced with 1/2 in. anchors, showing smaller deformations for the same loads. A reason for this
behavior is the 5/8 in. anchor is larger and able to resist more of the tensile forces in the CFRP sheet.
The cracking load was approximately 5 kips. Judging from the strain at which load increase resumed, the
forces from the cracked concrete appeared to transfer to the CFRP sheet faster in these specimens than
in the specimens with 1/2 in. anchors. In specimen 9 – 3 – 5/8 – B1, the force transfer was almost
[X VALUE]
[SERIES NAME]
[SERIES NAME]
[SERIES NAME]
[SERIES NAME]
0
2
4
6
8
10
12
14
0 0.001 0.002 0.003 0.004 0.005 0.006 0.007 0.008 0.009 0.01
Load
(k)
Strain (in/in)

44
immediate. In specimen 9 – 3 – 5/8 – B2, the force was fully transferred to the sheet around 0.0015
strain. Strain gauge B in specimen 9 – 3 – 5/8 – B2 reached large deformations, but failed before the
ultimate load was reached.
A sudden rupture of the CFRP sheet controlled the failure mode for this specimen, which shows
that the CFRP sheet had reached its tensile capacity. Since previous specimens indicated that a 1/2 in.
anchor was sufficient for developing the full strength of the CFRP sheet, this failure pattern was
expected with the use of larger anchors. It is interesting that the maximum loads obtained from using
5/8 in. anchors were lower than the maximum loads obtained using 1/2 in. anchors. One reason for this
may be uneven loading or improper handling of the FRP materials during installation.
4.4.3 Unbonded Specimen: 9 – 3 – 5/8 – D1 and 9 – 3 – 5/8 – D2
4.4.3.1 Specimen Description
The specimen was constructed with an unbonded 3 in. CFRP flexural sheet to study the effects
of a flexural sheet that was improperly bonded to the concrete. Two 5/8 in. anchors were used and the
anchor ratio remained 3.25. The failure mode of the specimen was by pull-out of the GFRP anchor.
Specimen 9 – 3 – 5/8 – D1 failed at a load of 10.3 kips and specimen 9 – 3 – 5/8 – D2 failed at 9.87 kips.
4.4.3.2 Test Data
Two strain gauges were used in the same positions as Figure 4.4. The data acquisition system
(DAQ) strains are plotted against the load for both specimen in Figure 4.7. The designation (D1) is for
specimen 9 – 3 – 5/8 – D1, and (D2) for 9 – 3 – 5/8 – D2.

45
Figure 4.7 Load v. strain data for 9 – 3 – 5/8 – D1 & D2
4.4.3.3 Discussion
The initial behavior before cracking is nearly identical in both beams. The first crack for
specimen 9 – 3 – 5/8 – D1 was observed at approximately 4 kips and approximately 3 kips for specimen
9 – 3 – 5/8 – D2. The cracking load was lower than that of bonded 3 in. specimens, which may be a
function of the lack of bond in the CFRP sheet. After the cracking load, all of the forces from the cracked
concrete must transfer to the flexural sheet. The transition is represented by the plateau in the load v.
strain plot in Figure 4.7. Early failure of both strain gauges on specimen 9 – 3 – 5/8 – D2 resulted in loss
of strain data for the remainder of that test.
The failure load of the specimen was similar to those of the bonded specimens, indicating that a
lack of proper bonding between the CFRP sheet and concrete makes little difference in developing the
full capacity of the sheet as long as anchors are properly installed. Failure occurred in the GFRP anchor
by pulling out of the specimen instead of rupturing as seen in studies of CFRP anchors. This behavior
may be due to the differences in the material properties between CFRP and GFRP, and will be explored
in more detail in Section 4.5.
4.4.4 Bonded Specimen: 9 – 5 – 5/8 – B1 and 9 – 5 – 5/8 – B2
4.4.4.1 Specimen Description
The specimen was constructed to study the effect of GFRP anchors on a 5 in. CFRP flexural sheet.
Two 5/8 in. GFRP anchors were installed as in Figure 4.8, and an anchor design ratio of 1.95 was
[X VALUE]
[SERIES NAME] [SERIES NAME]
[SERIES NAME] [SERIES NAME]
0
2
4
6
8
10
12
14
0 0.001 0.002 0.003 0.004 0.005 0.006 0.007 0.008 0.009 0.01
Load
(k)
Strain (in/in)

46
obtained. Failure was characterized by anchor pull-out in both specimens. Specimen 9 – 5 – 5/8 – B1
failed at a load of 18.1 kips and specimen 9 – 5 – 5/8 – B2 failed at a load of 17.8 kips.
Figure 4.8 Specimen with a 5 in. CFRP sheet and 5/8 in. GFRP anchors
4.4.4.2 Test Data
For a 5 in. flexural sheet, three strain gauges were used. As before, the gauges were placed
across the critical section where strains in the CFRP flexural sheet are the greatest. The positions of the
three strain gauges are shown in Figure 4.8. The data acquisition system (DAQ) strains for specimen 9 –
5 – 5/8 – B1 and 9 – 5 – 5/8 – B2 are plotted against the load in Figure 4.9 and Figure 4.10 respectively.
[SERIES NAME] [SERIES NAME]
[X VALUE]
[SERIES NAME]
0 2 4 6 8
10 12 14 16 18 20
0 0.002 0.004 0.006 0.008 0.01 0.012
Load
(k)
Strain (in/in)
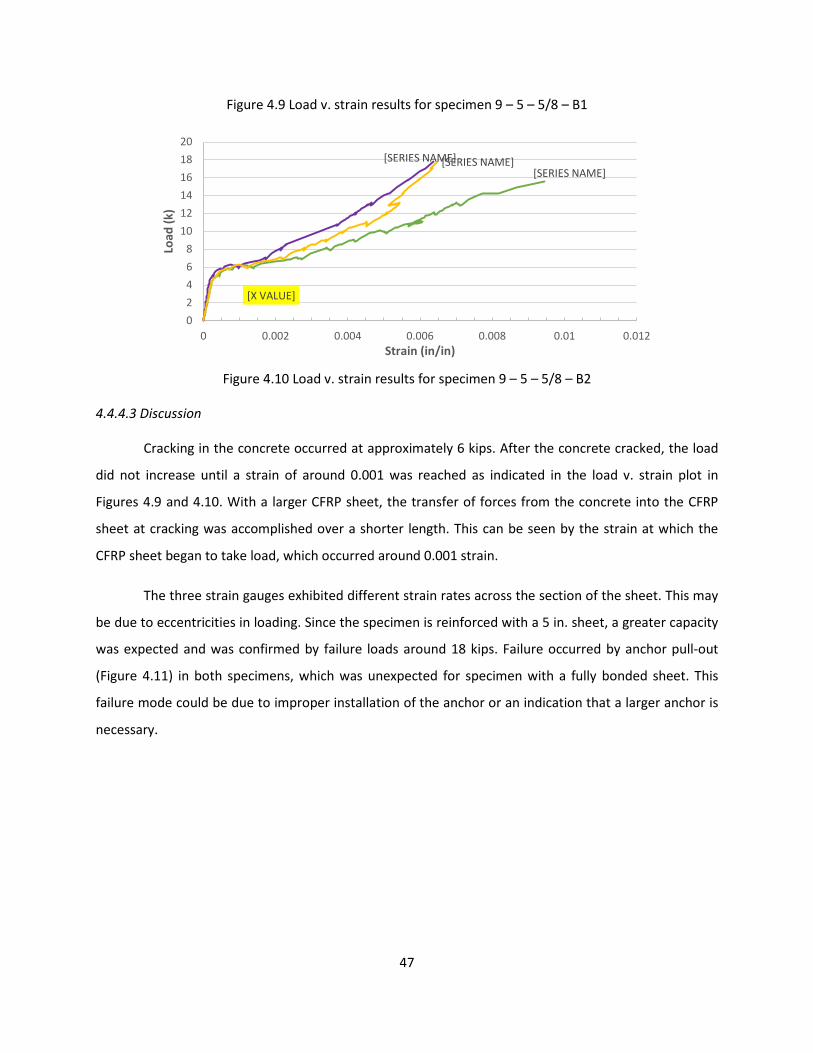
47
Figure 4.9 Load v. strain results for specimen 9 – 5 – 5/8 – B1
Figure 4.10 Load v. strain results for specimen 9 – 5 – 5/8 – B2
4.4.4.3 Discussion
Cracking in the concrete occurred at approximately 6 kips. After the concrete cracked, the load
did not increase until a strain of around 0.001 was reached as indicated in the load v. strain plot in
Figures 4.9 and 4.10. With a larger CFRP sheet, the transfer of forces from the concrete into the CFRP
sheet at cracking was accomplished over a shorter length. This can be seen by the strain at which the
CFRP sheet began to take load, which occurred around 0.001 strain.
The three strain gauges exhibited different strain rates across the section of the sheet. This may
be due to eccentricities in loading. Since the specimen is reinforced with a 5 in. sheet, a greater capacity
was expected and was confirmed by failure loads around 18 kips. Failure occurred by anchor pull-out
(Figure 4.11) in both specimens, which was unexpected for specimen with a fully bonded sheet. This
failure mode could be due to improper installation of the anchor or an indication that a larger anchor is
necessary.
[X VALUE]
[SERIES NAME] [SERIES NAME] [SERIES NAME]
0 2 4 6 8
10 12 14 16 18 20
0 0.002 0.004 0.006 0.008 0.01 0.012
Load
(k)
Strain (in/in)
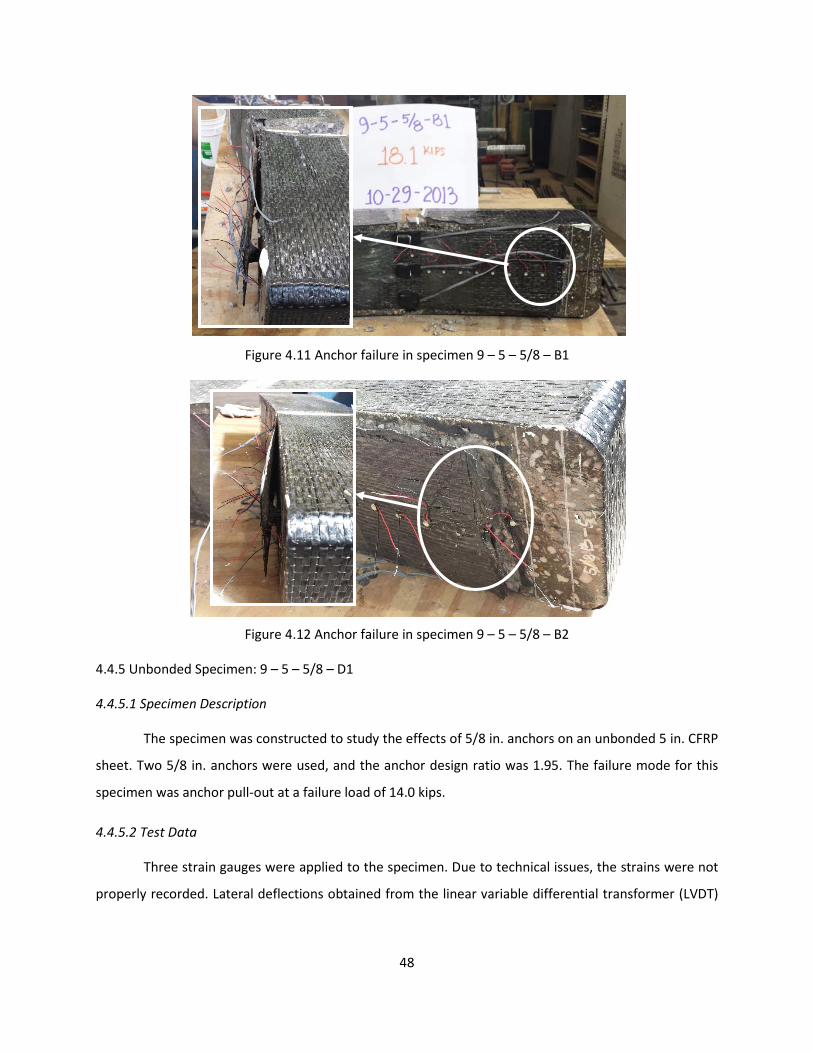
48
Figure 4.11 Anchor failure in specimen 9 – 5 – 5/8 – B1
Figure 4.12 Anchor failure in specimen 9 – 5 – 5/8 – B2
4.4.5 Unbonded Specimen: 9 – 5 – 5/8 – D1
4.4.5.1 Specimen Description
The specimen was constructed to study the effects of 5/8 in. anchors on an unbonded 5 in. CFRP
sheet. Two 5/8 in. anchors were used, and the anchor design ratio was 1.95. The failure mode for this
specimen was anchor pull-out at a failure load of 14.0 kips.
4.4.5.2 Test Data
Three strain gauges were applied to the specimen. Due to technical issues, the strains were not
properly recorded. Lateral deflections obtained from the linear variable differential transformer (LVDT)
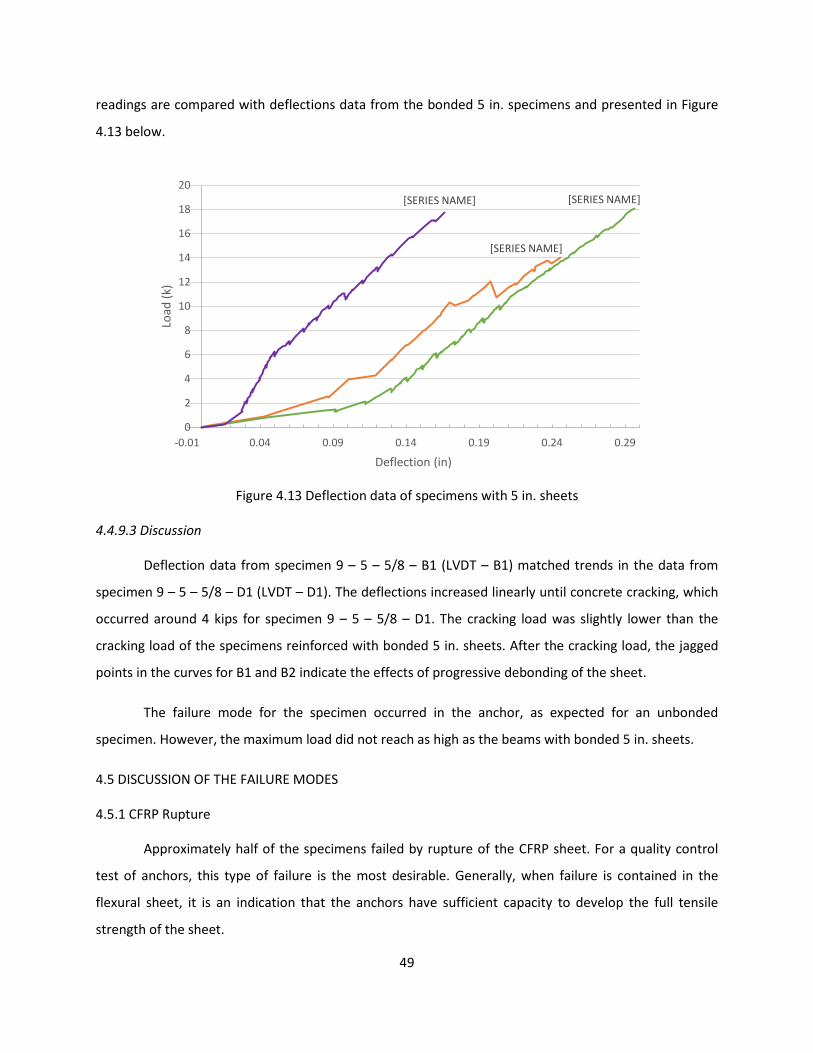
49
readings are compared with deflections data from the bonded 5 in. specimens and presented in Figure
4.13 below.
Figure 4.13 Deflection data of specimens with 5 in. sheets
4.4.9.3 Discussion
Deflection data from specimen 9 – 5 – 5/8 – B1 (LVDT – B1) matched trends in the data from
specimen 9 – 5 – 5/8 – D1 (LVDT – D1). The deflections increased linearly until concrete cracking, which
occurred around 4 kips for specimen 9 – 5 – 5/8 – D1. The cracking load was slightly lower than the
cracking load of the specimens reinforced with bonded 5 in. sheets. After the cracking load, the jagged
points in the curves for B1 and B2 indicate the effects of progressive debonding of the sheet.
The failure mode for the specimen occurred in the anchor, as expected for an unbonded
specimen. However, the maximum load did not reach as high as the beams with bonded 5 in. sheets.
4.5 DISCUSSION OF THE FAILURE MODES
4.5.1 CFRP Rupture
Approximately half of the specimens failed by rupture of the CFRP sheet. For a quality control
test of anchors, this type of failure is the most desirable. Generally, when failure is contained in the
flexural sheet, it is an indication that the anchors have sufficient capacity to develop the full tensile
strength of the sheet.
[SERIES NAME]
[SERIES NAME] [SERIES NAME]
0
2
4
6
8
10
12
14
16
18
20
-0.01 0.04 0.09 0.14 0.19 0.24 0.29
Load
(k)
Deflection (in)
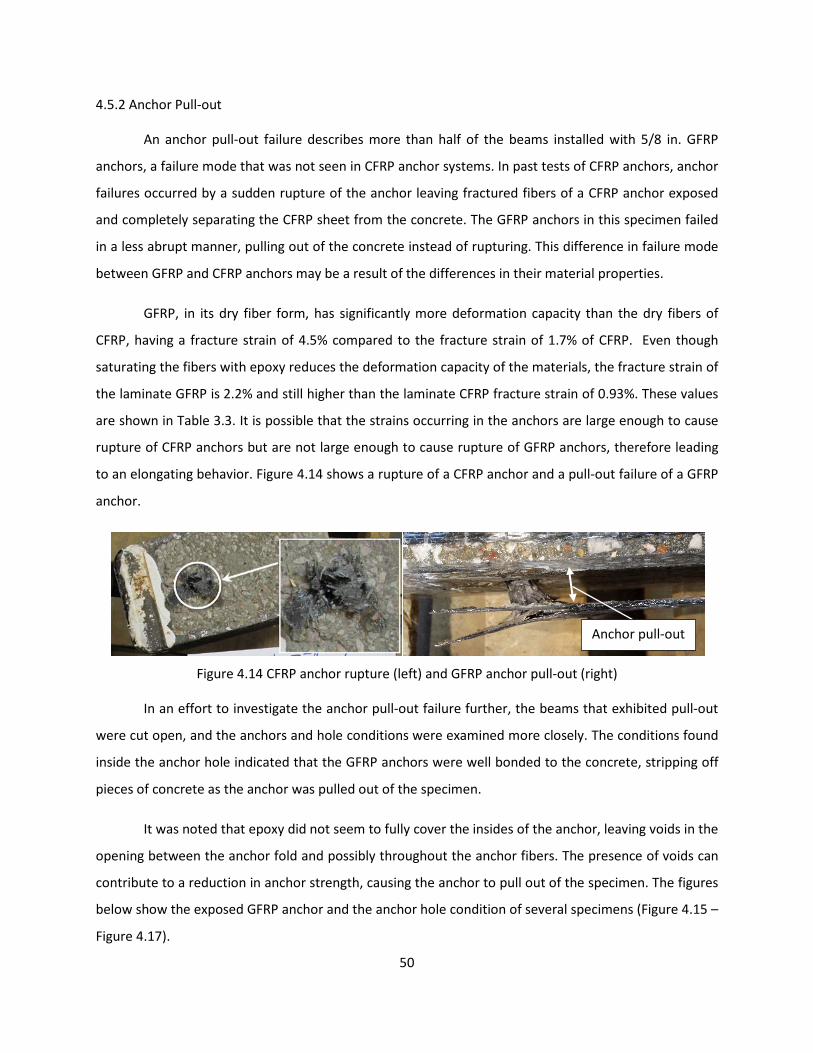
50
4.5.2 Anchor Pull-out
An anchor pull-out failure describes more than half of the beams installed with 5/8 in. GFRP
anchors, a failure mode that was not seen in CFRP anchor systems. In past tests of CFRP anchors, anchor
failures occurred by a sudden rupture of the anchor leaving fractured fibers of a CFRP anchor exposed
and completely separating the CFRP sheet from the concrete. The GFRP anchors in this specimen failed
in a less abrupt manner, pulling out of the concrete instead of rupturing. This difference in failure mode
between GFRP and CFRP anchors may be a result of the differences in their material properties.
GFRP, in its dry fiber form, has significantly more deformation capacity than the dry fibers of
CFRP, having a fracture strain of 4.5% compared to the fracture strain of 1.7% of CFRP. Even though
saturating the fibers with epoxy reduces the deformation capacity of the materials, the fracture strain of
the laminate GFRP is 2.2% and still higher than the laminate CFRP fracture strain of 0.93%. These values
are shown in Table 3.3. It is possible that the strains occurring in the anchors are large enough to cause
rupture of CFRP anchors but are not large enough to cause rupture of GFRP anchors, therefore leading
to an elongating behavior. Figure 4.14 shows a rupture of a CFRP anchor and a pull-out failure of a GFRP
anchor.
Figure 4.14 CFRP anchor rupture (left) and GFRP anchor pull-out (right)
In an effort to investigate the anchor pull-out failure further, the beams that exhibited pull-out
were cut open, and the anchors and hole conditions were examined more closely. The conditions found
inside the anchor hole indicated that the GFRP anchors were well bonded to the concrete, stripping off
pieces of concrete as the anchor was pulled out of the specimen.
It was noted that epoxy did not seem to fully cover the insides of the anchor, leaving voids in the
opening between the anchor fold and possibly throughout the anchor fibers. The presence of voids can
contribute to a reduction in anchor strength, causing the anchor to pull out of the specimen. The figures
below show the exposed GFRP anchor and the anchor hole condition of several specimens (Figure 4.15 –
Figure 4.17).
Anchor pull-out
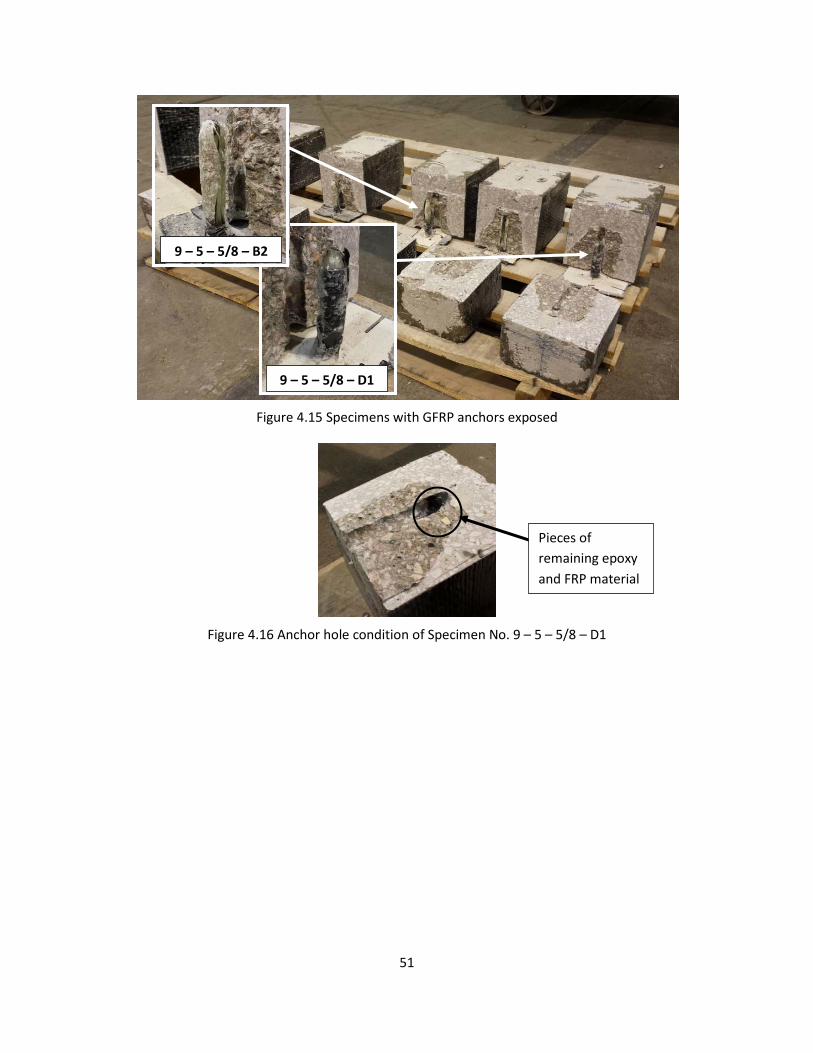
51
Figure 4.15 Specimens with GFRP anchors exposed
Figure 4.16 Anchor hole condition of Specimen No. 9 – 5 – 5/8 – D1
9 – 5 – 5/8 – D1
9 – 5 – 5/8 – B2
Pieces of remaining epoxy and FRP material
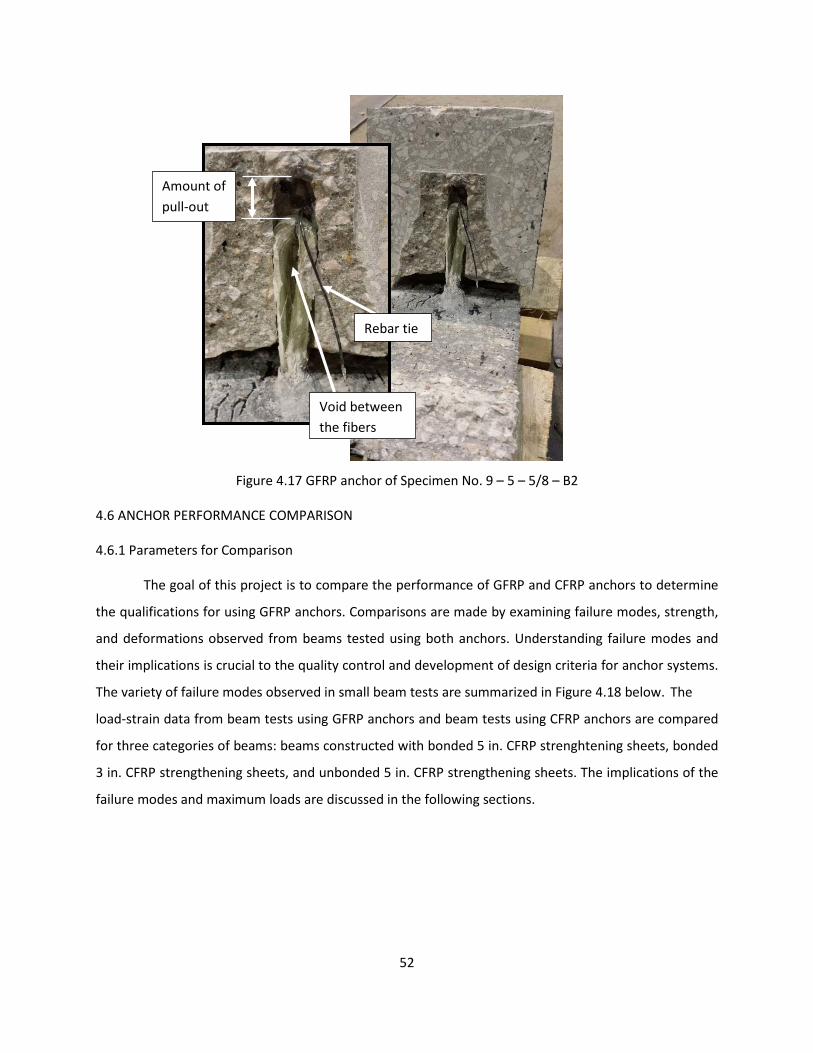
52
Figure 4.17 GFRP anchor of Specimen No. 9 – 5 – 5/8 – B2
4.6 ANCHOR PERFORMANCE COMPARISON
4.6.1 Parameters for Comparison
The goal of this project is to compare the performance of GFRP and CFRP anchors to determine
the qualifications for using GFRP anchors. Comparisons are made by examining failure modes, strength,
and deformations observed from beams tested using both anchors. Understanding failure modes and
their implications is crucial to the quality control and development of design criteria for anchor systems.
The variety of failure modes observed in small beam tests are summarized in Figure 4.18 below. The
load-strain data from beam tests using GFRP anchors and beam tests using CFRP anchors are compared
for three categories of beams: beams constructed with bonded 5 in. CFRP strenghtening sheets, bonded
3 in. CFRP strengthening sheets, and unbonded 5 in. CFRP strengthening sheets. The implications of the
failure modes and maximum loads are discussed in the following sections.
Amount of pull-out
Void between the fibers
Rebar tie

53
a) Rupture of CFRP strengthening sheet
b) Rupture of CFRP anchor c) Debonding of CFRP anchor
d) Concrete fracture behind anchor
e) Pull-out of GFRP anchor
Figure 4.18 Failure modes observed in small beam tests
4.6.2 Bonded CFRP Sheet – 5 in.
Two tests of CFRP anchors using a 5 in. bonded CFRP flexural sheet for an anchor ratio of 2.0
were conducted. This matched closely with GFRP-specimens 9 – 5 – 5/8 – B1 and 9 – 5 – 5/8 – B2, which
had anchor design ratios of 1.95.
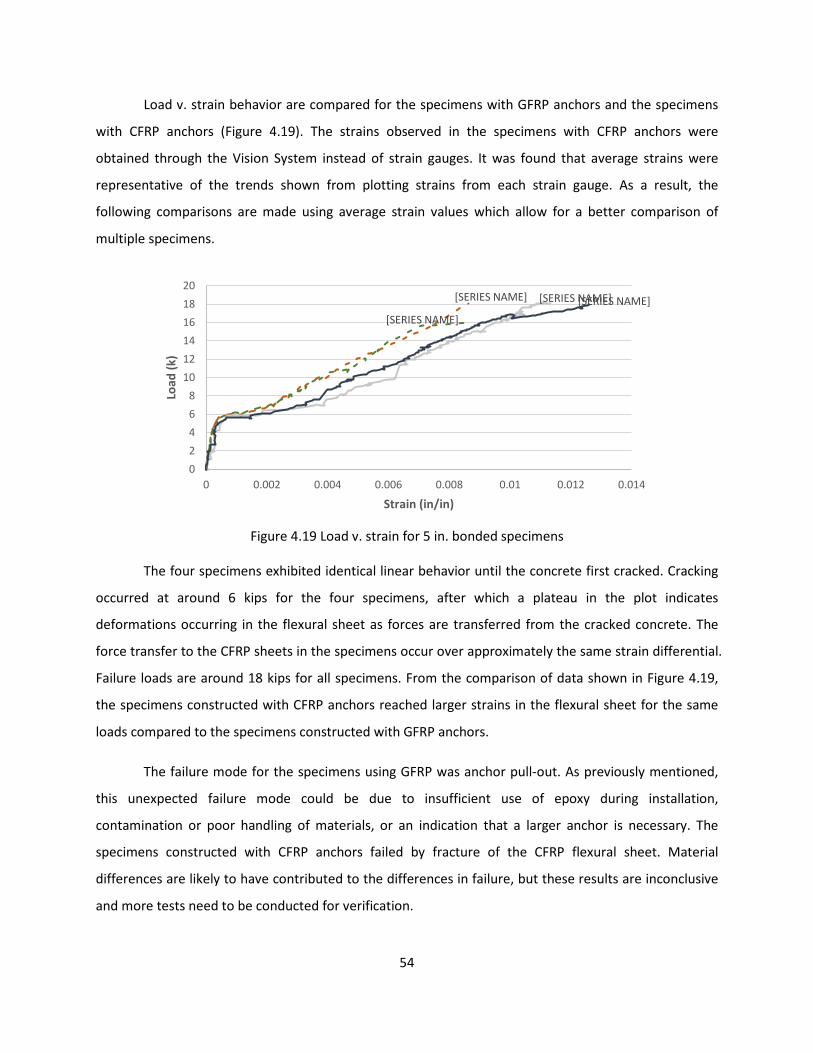
54
Load v. strain behavior are compared for the specimens with GFRP anchors and the specimens
with CFRP anchors (Figure 4.19). The strains observed in the specimens with CFRP anchors were
obtained through the Vision System instead of strain gauges. It was found that average strains were
representative of the trends shown from plotting strains from each strain gauge. As a result, the
following comparisons are made using average strain values which allow for a better comparison of
multiple specimens.
Figure 4.19 Load v. strain for 5 in. bonded specimens
The four specimens exhibited identical linear behavior until the concrete first cracked. Cracking
occurred at around 6 kips for the four specimens, after which a plateau in the plot indicates
deformations occurring in the flexural sheet as forces are transferred from the cracked concrete. The
force transfer to the CFRP sheets in the specimens occur over approximately the same strain differential.
Failure loads are around 18 kips for all specimens. From the comparison of data shown in Figure 4.19,
the specimens constructed with CFRP anchors reached larger strains in the flexural sheet for the same
loads compared to the specimens constructed with GFRP anchors.
The failure mode for the specimens using GFRP was anchor pull-out. As previously mentioned,
this unexpected failure mode could be due to insufficient use of epoxy during installation,
contamination or poor handling of materials, or an indication that a larger anchor is necessary. The
specimens constructed with CFRP anchors failed by fracture of the CFRP flexural sheet. Material
differences are likely to have contributed to the differences in failure, but these results are inconclusive
and more tests need to be conducted for verification.
[SERIES NAME]
[SERIES NAME]
[SERIES NAME] [SERIES NAME]
0 2 4 6 8
10 12 14 16 18 20
0 0.002 0.004 0.006 0.008 0.01 0.012 0.014
Load
(k)
Strain (in/in)
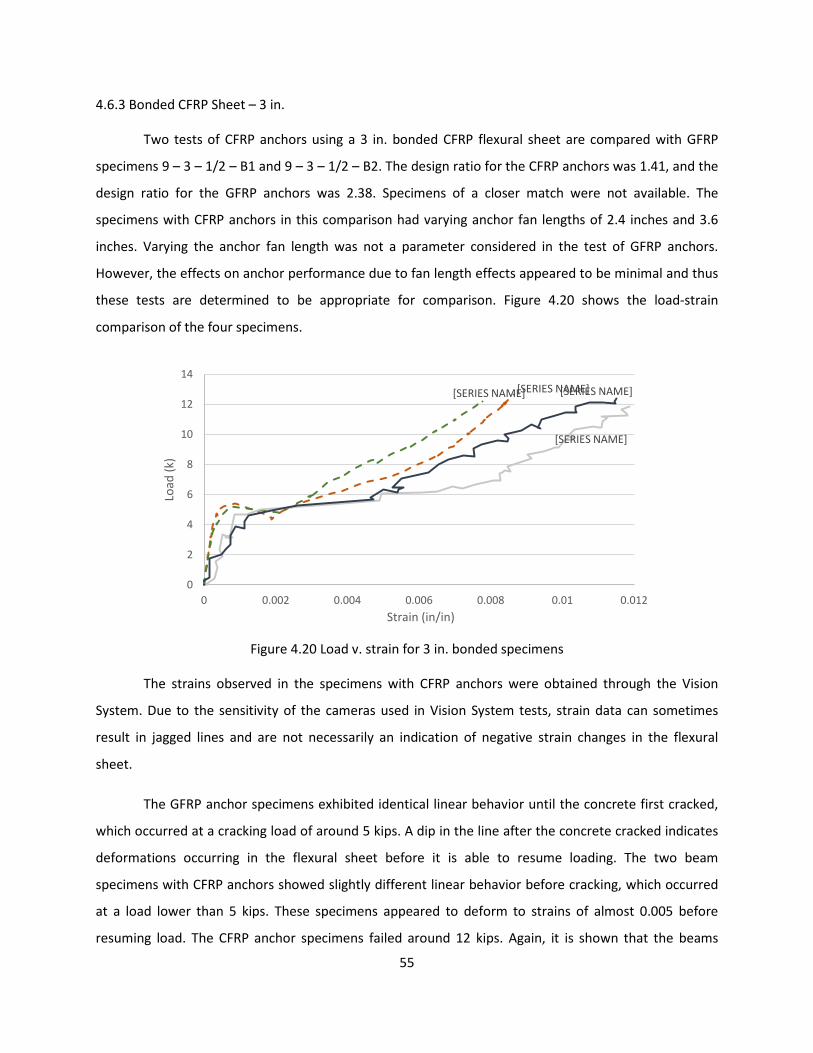
55
4.6.3 Bonded CFRP Sheet – 3 in.
Two tests of CFRP anchors using a 3 in. bonded CFRP flexural sheet are compared with GFRP
specimens 9 – 3 – 1/2 – B1 and 9 – 3 – 1/2 – B2. The design ratio for the CFRP anchors was 1.41, and the
design ratio for the GFRP anchors was 2.38. Specimens of a closer match were not available. The
specimens with CFRP anchors in this comparison had varying anchor fan lengths of 2.4 inches and 3.6
inches. Varying the anchor fan length was not a parameter considered in the test of GFRP anchors.
However, the effects on anchor performance due to fan length effects appeared to be minimal and thus
these tests are determined to be appropriate for comparison. Figure 4.20 shows the load-strain
comparison of the four specimens.
Figure 4.20 Load v. strain for 3 in. bonded specimens
The strains observed in the specimens with CFRP anchors were obtained through the Vision
System. Due to the sensitivity of the cameras used in Vision System tests, strain data can sometimes
result in jagged lines and are not necessarily an indication of negative strain changes in the flexural
sheet.
The GFRP anchor specimens exhibited identical linear behavior until the concrete first cracked,
which occurred at a cracking load of around 5 kips. A dip in the line after the concrete cracked indicates
deformations occurring in the flexural sheet before it is able to resume loading. The two beam
specimens with CFRP anchors showed slightly different linear behavior before cracking, which occurred
at a load lower than 5 kips. These specimens appeared to deform to strains of almost 0.005 before
resuming load. The CFRP anchor specimens failed around 12 kips. Again, it is shown that the beams
[SERIES NAME] [SERIES NAME]
[SERIES NAME]
[SERIES NAME]
0
2
4
6
8
10
12
14
0 0.002 0.004 0.006 0.008 0.01 0.012
Load
(k)
Strain (in/in)
56
constructed with CFRP anchors reached larger strains in the flexural sheet compared to the specimens
constructed with GFRP anchors for the same loads.
While cracking and strength gain behavior appear to differ significantly between 3 in. bonded
specimens containing GFRP anchors and those containing CFRP anchors, all of the specimens in this
comparison reached a capacity of 12 kips. This suggests that the GFRP anchors are just as capable of
developing the full capacity of the flexural sheet as CFRP anchors. Failure modes were also consistent
among the four specimens, occurring by rupture of the flexural sheet.
4.6.4 Unbonded CFRP Sheet – 5 in.
A specimen with CFRP anchors using a 5 in. unbonded CFRP flexural sheet and an anchor ratio of
2.0 was tested. These design parameters matched closely with GFRP-specimen 9 – 5 – 5/8 – D1, which
had an anchor design ratio of 1.95. However, the failure modes for the specimens were not the same
and thus the results from these tests are not comparable and conclusions cannot be drawn.
Nevertheless, it may be valuable to note that some similarities were noticed between the two
specimens and are mentioned in the following discussion. Both specimen had a cracking load of 4 kips.
The specimen with CFRP anchors reached a failure load of 14.8 kips, which is only slightly higher than
the failure load of specimen 9 – 5 – 5/8 – D1 at 14.0 kips. Since strain data does not exist for the
specimen with GFRP anchors, the strains are not compared.
57
CHAPTER 5 Summary and Conclusions
5.1 CONCLUSIONS
In this segment of Project 0-6783 (TxDot), a total of nine beams were tested. The beams were
intended to serve as a qualification test of GFRP anchors to determine their effectiveness compared to
CFRP anchors used in the past. The same parameters used in the design of specimens with CFRP anchors
were chosen to design the beams in these studies. The findings are summarized in this chapter.
5.2 SUMMARY OF FAILURE MODES AND SHEET CAPACITY
Critical to quality control of anchorage systems is the understanding of potential failure modes
that may occur and what each failure indicates. One new failure mode was observed from these studies
in addition to the four modes that have been known to occur from past studies, and are summarized
below:
- Rupture of CFRP strengthening sheet
- Rupture of CFRP anchor
- Debonding between CFRP anchor and strengthening sheet
- Concrete fracture behind anchor
- Pull-out of GFRP anchor
The two failure modes that were observed in these tests were rupture of the CFRP sheet and
anchor pull-out, which were compared with rupture of the CFRP sheet and rupture of the anchor in
equally designed beams from previous tests.
5.2.1 Rupture of CFRP strengthening sheet
With the use of anchors, a CFRP sheet rupture failure indicates that the sheet has developed its
full strength. This failure mode is ideal for determining the sufficiency of the anchors and obtaining
guidelines for anchor design. However, there may be cases in which a sheet rupture does not indicate
the development of full strength. For large CFRP sheets that are anchored with few large anchors,
stresses may not uniformly distribute across the entire sheet and fracture may occur in the sheet in
regions of high stress concentration. This type of sheet rupture will likely result in capacities lower than
the full tensile strength of the sheet, and strains across the width of the sheet should be monitored to
check against non-uniform stress distribution.
58
The beams that exhibited CFRP sheet rupture failures were bonded with 3 in. sheets and had
similar results, failing around a maximum load of 10 kips and rupturing the sheet at the mid-span section.
It was concluded that the capacity of a 3 in. CFRP sheet was around 10 kips, and the anchors were
adequately sized to develop sheet capacity. Compared to beams using CFRP anchors on 3 in. CFRP
sheets, a capacity of 10 kips was also developed in the sheet. However, much smaller CFRP anchors
were used compared to the GFRP anchors used to develop this capacity, suggesting that a larger GFRP
anchor than CFRP anchor is required to develop the same strength in the sheet.
5.2.2 Failure in the anchor
On the other hand, an anchor failure indicates that anchors do not have enough capacity to
develop the full strength of the CFRP sheet and is generally an undesirable failure mode. Previous
studies have determined that anchor failures depend on several factors: the size of the anchor, the force
transfer mechanism between the sheet and anchor (bend radius and CFRP patches), and adherence to
installation procedures.
The anchor failures observed in this study were by pull-out. Unbonded beams were intentionally
constructed to test the capacity of the anchors, and the beams failed by anchor pull-out at lower
maximum loads than their bonded counterparts. This suggested that unbonded CFRP sheets may not
have developed their full strength at failure. Two bonded beams with 5 in. sheets exhibited anchor
failures as well. The beams reached maximum loads of 18 kips which was identical to the maximum
loads reached by comparable CFRP anchored beams that failed by CFRP sheet rupture. From conclusions
drawn from the beam tests involving CFRP anchors, 18 kips is the capacity of a 5 in. CFRP sheet,
indicating that the GFRP anchor succeeded in developing this capacity. The GFRP anchor failure may
suggest that GFRP anchors have lower strength than CFRP anchors resulting in an anchor failure instead
of sheet rupture. Alternatively, the GFRP anchors may have suffered improper handling during
installation which could lead to improper bonding with the concrete inside the anchor hole and cause
the failure.
In studies of CFRP anchors in the past, anchors have failed by rupture. The GFRP anchors tested
in this study exhibited pull-out failures instead. It was concluded form the observations in this study that
the larger deformation capacity of GFRP materials is responsible for the pull-out behavior seen in the
anchor failures.
59
5.2.3 Advantages and Disadvantages of GFRP
From the results in this study, GFRP anchors were able to develop the capacity of externally
bonded CFRP reinforcement with common trends in behavior and similar modes of failure as CFRP
anchors. However, there are both advantages and disadvantages of using GFRP materials in place of
CFRP despite the similarities in performance.
An advantage of using GFRP materials may be attributed to its larger deformation capacity
compared to CFRP materials. At more than twice the tensile strain capacity of CFRP, GFRP can be more
useful for applications that require bending of the fibers, resulting in lower stress concentrations at the
bends and possibly reducing bend radius requirements. During installation, it was also found that GFRP
anchors were easier to insert into the anchor hole because the anchors were able to slip through the
fibers of the CFRP sheets more easily. In addition to easy handling, it was also observed that anchor
failures of GFRP anchors occurred much less abruptly than CFRP anchor failures. Since the GFRP anchors
pulled out of the beams instead of rupturing, the CFRP strengthening sheet remained mostly in contact
with the concrete.
Despite the positive aspects of using GFRP materials in anchor systems, disadvantages were also
apparent. The most obvious disadvantage of GFRP materials is its low tensile strength compared to CFRP.
As a result, a greater amount of fibers is needed to design a GFRP anchor of equal capacity to a CFRP
anchor. The result is a bulkier anchor which may lead to difficulties during installation, cancelling out the
advantages of the smoother installation mentioned above.
5.3 RECOMMENDATIONS FOR FUTURE STUDY
Interest in developing design guidelines for FRP anchors has led to extensive studies of CFRP
anchors. The need for quality control and similar guidelines for the use of GFRP anchors becomes
relevant with the expanding interest of using materials other than CFRP in anchor construction. In this
regard, more studies are needed to verify the findings from this research.
More tests should be conducted to evaluate GFRP anchor and CFRP anchor differences. If pre-
fabricated GFRP anchors (size restrictions) are used in the future, equivalent CFRP anchors should be
constructed to verify if CFRP anchors actually have greater capacity than GFRP anchors. Additionally,
tests should vary CFRP anchor sizes against the same GFRP anchor to quantify the difference in strength
capacity between the materials, and determine the size of a CFRP anchor of equivalent strength.

60
Repetition of the tests of 5 in. bonded specimens is recommended in order to verify failure
modes. Unbonded specimens in general should be explored further to determine whether the cause of
anchor pull-out failure modes is a function of GFRP material properties or improper installation
techniques.
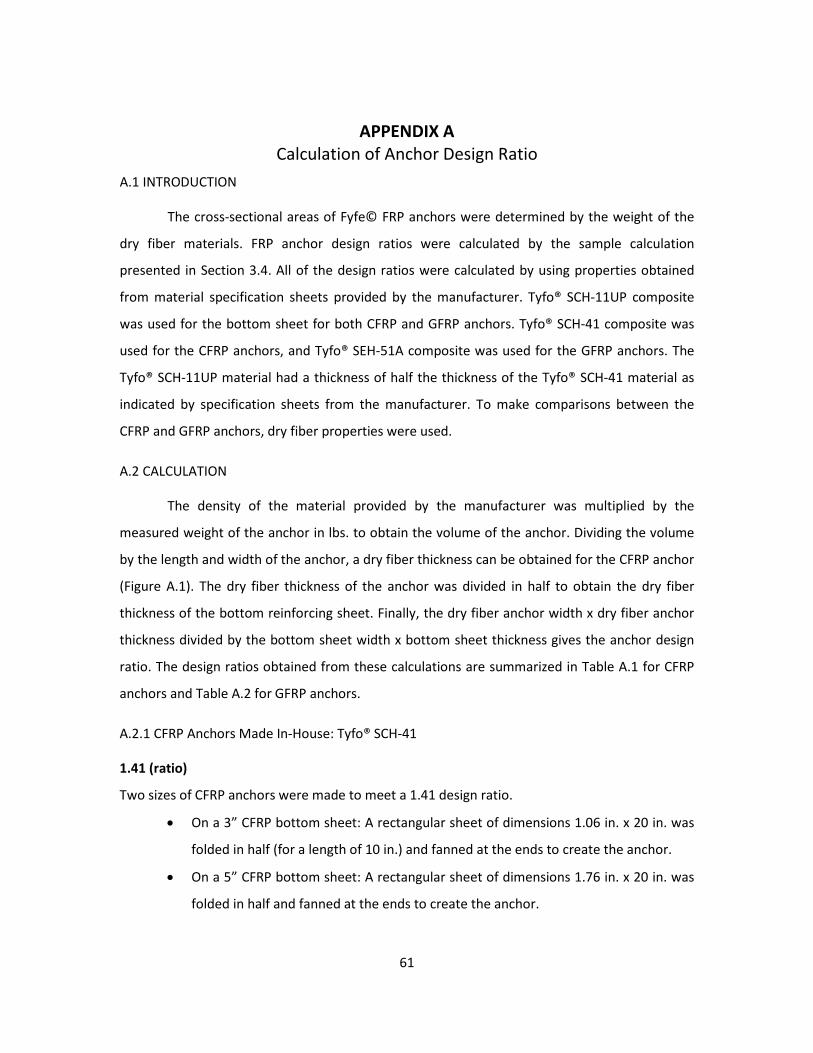
61
APPENDIX A Calculation of Anchor Design Ratio
A.1 INTRODUCTION
The cross-sectional areas of Fyfe© FRP anchors were determined by the weight of the
dry fiber materials. FRP anchor design ratios were calculated by the sample calculation
presented in Section 3.4. All of the design ratios were calculated by using properties obtained
from material specification sheets provided by the manufacturer. Tyfo® SCH-11UP composite
was used for the bottom sheet for both CFRP and GFRP anchors. Tyfo® SCH-41 composite was
used for the CFRP anchors, and Tyfo® SEH-51A composite was used for the GFRP anchors. The
Tyfo® SCH-11UP material had a thickness of half the thickness of the Tyfo® SCH-41 material as
indicated by specification sheets from the manufacturer. To make comparisons between the
CFRP and GFRP anchors, dry fiber properties were used.
A.2 CALCULATION
The density of the material provided by the manufacturer was multiplied by the
measured weight of the anchor in lbs. to obtain the volume of the anchor. Dividing the volume
by the length and width of the anchor, a dry fiber thickness can be obtained for the CFRP anchor
(Figure A.1). The dry fiber thickness of the anchor was divided in half to obtain the dry fiber
thickness of the bottom reinforcing sheet. Finally, the dry fiber anchor width x dry fiber anchor
thickness divided by the bottom sheet width x bottom sheet thickness gives the anchor design
ratio. The design ratios obtained from these calculations are summarized in Table A.1 for CFRP
anchors and Table A.2 for GFRP anchors.
A.2.1 CFRP Anchors Made In-House: Tyfo® SCH-41
1.41 (ratio)
Two sizes of CFRP anchors were made to meet a 1.41 design ratio.
• On a 3” CFRP bottom sheet: A rectangular sheet of dimensions 1.06 in. x 20 in. was
folded in half (for a length of 10 in.) and fanned at the ends to create the anchor.
• On a 5” CFRP bottom sheet: A rectangular sheet of dimensions 1.76 in. x 20 in. was
folded in half and fanned at the ends to create the anchor.
62
Calculations:
Width Weight x density = Volume
1.06 in. 0.021 𝑙𝑏. × 0.063 𝑙𝑏 𝑖𝑛3⁄ = 0.341 𝑖𝑛3
1.76 in. 0.036 𝑙𝑏. × 0.063 𝑙𝑏 𝑖𝑛3⁄ = 0.579 𝑖𝑛3
Width: Volume ÷ Area = Thickness
1.06 in. 0.341 ÷ (1.06 × 20) = 0.016 𝑖𝑛.
1.76 in. 0.579 ÷ (1.76 × 20) = 0.016 𝑖𝑛.
Design ratio:
Width: (𝐴𝐺𝐹𝑅𝑃 × 𝑓𝐺𝐹𝑅𝑃)(𝐴𝐶𝐹𝑅𝑃 × 𝑓𝐶𝐹𝑅𝑃)� = Ratio
1.06 in. (2 × 1.06 𝑖𝑛. × 0.016 𝑖𝑛.)(550 𝑘𝑠𝑖)(3 𝑖𝑛. × 0.008 𝑖𝑛.)(550 𝑘𝑠𝑖)
= 1.41
1.76 in. (2 × 1.76 𝑖𝑛. × 0.016 𝑖𝑛.)(550 𝑘𝑠𝑖)(5 𝑖𝑛. × 0.008 𝑖𝑛.)(550 𝑘𝑠𝑖)
= 1.41
Figure A.1 Anchor dimensions
2.0 (ratio)
The following CFRP anchor was made to meet a 2.0 design ratio.
• On a 5” CFRP bottom sheet: A rectangular sheet of dimensions 2.50 in. x 20 in. was
folded in half and fanned at the ends to create the anchor.
Calculations:
Width Weight x density = Volume
2.50 in. 0.049 𝑙𝑏. × 0.063 𝑙𝑏 𝑖𝑛3⁄ = 0.772 𝑖𝑛3
Width: Volume ÷ Area = Thickness
2.50 in. 0.772 ÷ (2.50 × 20) = 0.015 𝑖𝑛.
Design ratio:
Width: (𝐴𝐺𝐹𝑅𝑃 × 𝑓𝐺𝐹𝑅𝑃)/(𝐴𝐶𝐹𝑅𝑃 × 𝑓𝐶𝐹𝑅𝑃) = Ratio
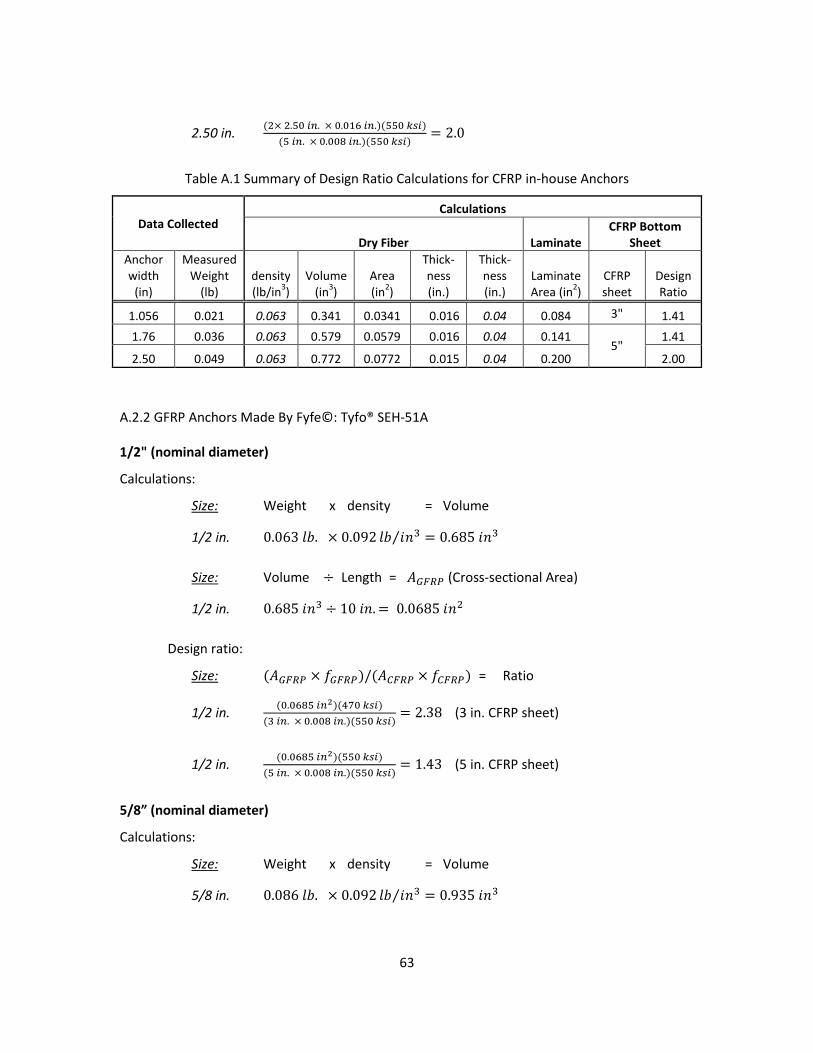
63
2.50 in. (2× 2.50 𝑖𝑛. × 0.016 𝑖𝑛.)(550 𝑘𝑠𝑖)(5 𝑖𝑛. × 0.008 𝑖𝑛.)(550 𝑘𝑠𝑖)
= 2.0
Table A.1 Summary of Design Ratio Calculations for CFRP in-house Anchors
Data Collected Calculations
Dry Fiber Laminate CFRP Bottom
Sheet Anchor width
(in)
Measured Weight
(lb) density (lb/in3)
Volume (in3)
Area (in2)
Thick-ness (in.)
Thick-ness (in.)
Laminate Area (in2)
CFRP sheet
Design Ratio
1.056 0.021 0.063 0.341 0.0341 0.016 0.04 0.084 3" 1.41 1.76 0.036 0.063 0.579 0.0579 0.016 0.04 0.141
5" 1.41
2.50 0.049 0.063 0.772 0.0772 0.015 0.04 0.200 2.00
A.2.2 GFRP Anchors Made By Fyfe©: Tyfo® SEH-51A
1/2" (nominal diameter)
Calculations:
Size: Weight x density = Volume
1/2 in. 0.063 𝑙𝑏. × 0.092 𝑙𝑏 𝑖𝑛3⁄ = 0.685 𝑖𝑛3
Size: Volume ÷ Length = 𝐴𝐺𝐹𝑅𝑃 (Cross-sectional Area)
1/2 in. 0.685 𝑖𝑛3 ÷ 10 𝑖𝑛. = 0.0685 𝑖𝑛2
Design ratio:
Size: (𝐴𝐺𝐹𝑅𝑃 × 𝑓𝐺𝐹𝑅𝑃)/(𝐴𝐶𝐹𝑅𝑃 × 𝑓𝐶𝐹𝑅𝑃) = Ratio
1/2 in. (0.0685 𝑖𝑛2)(470 𝑘𝑠𝑖)(3 𝑖𝑛. × 0.008 𝑖𝑛.)(550 𝑘𝑠𝑖)
= 2.38 (3 in. CFRP sheet)
1/2 in. (0.0685 𝑖𝑛2)(550 𝑘𝑠𝑖)(5 𝑖𝑛. × 0.008 𝑖𝑛.)(550 𝑘𝑠𝑖)
= 1.43 (5 in. CFRP sheet)
5/8” (nominal diameter)
Calculations:
Size: Weight x density = Volume
5/8 in. 0.086 𝑙𝑏. × 0.092 𝑙𝑏 𝑖𝑛3⁄ = 0.935 𝑖𝑛3
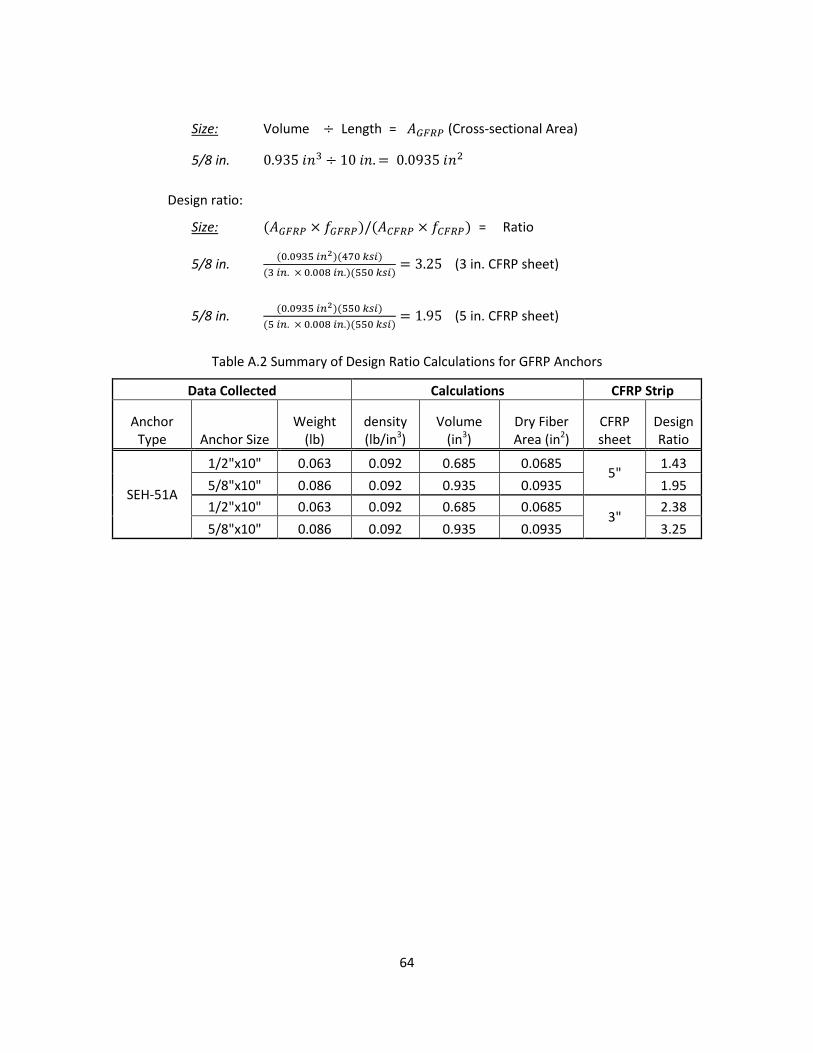
64
Size: Volume ÷ Length = 𝐴𝐺𝐹𝑅𝑃 (Cross-sectional Area)
5/8 in. 0.935 𝑖𝑛3 ÷ 10 𝑖𝑛. = 0.0935 𝑖𝑛2
Design ratio:
Size: (𝐴𝐺𝐹𝑅𝑃 × 𝑓𝐺𝐹𝑅𝑃)/(𝐴𝐶𝐹𝑅𝑃 × 𝑓𝐶𝐹𝑅𝑃) = Ratio
5/8 in. (0.0935 𝑖𝑛2)(470 𝑘𝑠𝑖)(3 𝑖𝑛. × 0.008 𝑖𝑛.)(550 𝑘𝑠𝑖)
= 3.25 (3 in. CFRP sheet)
5/8 in. (0.0935 𝑖𝑛2)(550 𝑘𝑠𝑖)(5 𝑖𝑛. × 0.008 𝑖𝑛.)(550 𝑘𝑠𝑖)
= 1.95 (5 in. CFRP sheet)
Table A.2 Summary of Design Ratio Calculations for GFRP Anchors
Data Collected Calculations CFRP Strip
Anchor Type Anchor Size
Weight (lb)
density (lb/in3)
Volume (in3)
Dry Fiber Area (in2)
CFRP sheet
Design Ratio
SEH-51A
1/2"x10" 0.063 0.092 0.685 0.0685 5"
1.43 5/8"x10" 0.086 0.092 0.935 0.0935 1.95 1/2"x10" 0.063 0.092 0.685 0.0685
3" 2.38
5/8"x10" 0.086 0.092 0.935 0.0935 3.25
65
REFERENCES
American Concrete Institute, (2008). “Guide for the Design and Construction of Externally Bonded FRP Systems for Strengthening Concrete Structures (ACI 440.2R-08).” Farmington Hills, Michigan, USA.
Akyuz, O. and Ozdemir, G., (2004). “Mechanical Properties of CFRP Anchorages”, 13th World Conference on Earthquake Engineering, Vancouver, B.C., Canada, August 1-6, 2004, Paper No. 3349.
ASTM International, (2007), “Standard Test Method for Flexural Strength of Concrete Using Simple Beam With Center-Point Loading, (C293-07),” ASTM International, West Conshohocken, PA, USA, 3 pp.
ASTM International, (2007). “ASTM D 3039/D3039M Standard Test Method for Tensile Properties of Polymer Matrix Composite Materials.” ASTM International, West Conshohocken, Pa.
Breña, S.F., N., Wood, S., and Kreger, M.E., (2008). “Full-Scale Tests of Bridge Components Strengthened Using Carbon Fiber-Reinforced Polymer Composites”, ACI Structural Journal, November-December 2003, 775-784.
Callister, W.D., and David G.R., (2011). "Materials Science and Engineering: An Introduction." Hoboken, NJ: Wiley. pp 535-555.
Carter, C.B., and M. G. Norton, (2007). “Ceramic Materials: Science and Engineering”, New York, NY: Springer. pp 549-50.
Dante, R.C., Santamaría, D.A., Gil, J.M., (2009). "Crosslinking and thermal stability of thermosets based on novolak and melamine", Journal of Applied Polymer Science, Vol. 114, Issue 6, pp. 4059-4065.
Eshwar, N., Nanni, A., and Ibell, T.J., (2008). “Performance of Two Anchor Systems of Externally Bonded Fiber-Reinforced Polymer Laminates”, ACI Materials Journal, January-February 2008, 72-80.
Gunes, O. (2004). “A fracture-based approach to understanding debonding in FRP bonded structural members”. PhD Thesis, Department of Civil and Environmental Engineering, Massachusetts Institute of Technology, Cambridge, MA.
Huaco, G., (2009). “Quality Control Test For Carbon Fiber Reinforced Polymer (CFRP) Anchors For Rehabilitation”, Master of Science Thesis, The University of Texas at Austin, USA, 80 pp.
Japanese Society of Civil Engineers (JSCE). (1997). "Recommendations for Design and Construction of Concrete Structures using Continuous Fiber Reinforcing Materials," Concrete Engineering Series 23, A. Machida (ed.).
Khalifa, A., T. Alkhrdaji, A. Nanni, and S. Lansburg. (1999). "Anchorage of Surface Mounted FRP Reinforcement," Concrete International: Design and Construction, Vol. 21, No.10, pp. 49-54.
66
Kim, I., (2006). “Rehabilitation of Poorly Detailed RC Structures Using CFRP Materials”, Master of Science Thesis, The University of Texas at Austin, USA, 144 pp.
Kim, I., (2008). “Use of CFRP to Provide Continuity in Existing Reinforced Concrete Members Subjected to Extreme Loads”, Ph.D Dissertation, The University of Texas at Austin, USA, 478 pp.
Kim, Y.G., (2007). “Shear Behavior of Reinforced Concrete T-Beams Strengthened with Carbon Fiber Reinforced Polymer (CFRP) Sheets and CFRP Anchors”. Ph.D. Dissertation, The University of Texas at Austin, USA, 405 pp.
Kobayashi, K., Fujii S., Yabe Y., Tsukagoshi H., and Sugiyama T. (2001). “Advanced wrapping system with CF anchor – Stress Transfer Mechanism of CF Anchor.” 5th International Symposium on Fiber-Reinforced Polymer (FRP) Reinforcement for Concrete Structures, Cambridge, UK, 379- 388.
Lamanna, A.J., (2002), “Flexural strengthening of reinforced concrete beams with mechanically fastened fiber reinforced polymer strips”. PhD. Dissertation, The University of Wisconsin at Madison, 2002.
Le, P., (2009). “Development of a Quality Control Test for Carbon Fiber Reinforced Polymer Anchors”, Master of Science Thesis, The University of Texas at Austin, USA, 87 pp.
Mouhmid, B., Imad, A., Benseddiq, N., Benmedakhène, S., Maazouz, A., (2006). "A Study of the Mechanical Behaviour of a Glass Fibre Reinforced Polyamide 6,6: Experimental Investigation." Polymer Testing Volume 25, Issue 4, 544-552.
Niemitz, C.W., James, R., and Breña, S.F., (2010). “Experimental Behavior of Carbon Fiber-Reinforced Polymer (CFRP) Sheets Attached to Concrete Surfaces Using CFRP Anchors”, Journal of Composites for Construction, ASCE, March/April 2010, 185-194.
Niemitz, C.W., (2008). “Anchorage of Carbon Fiber Reinforced Polymers to Reinforced Concrete in Shear Applications”, Master of Science Thesis, University of Massachusetts Amherst, 315 pp.
Orton, S.L., Jirsa, J.O., and Bayrak, O., (2008). “Design Considerations of Carbon Fiber Anchors”, Journal of Composites for Construction, ASCE, Novermber/December 2008, 608-616.
Orton, S.L., (2007). “Development of a CFRP system to Provide Continuity in Existing Reinforced Concrete Buildings Vulnerable to Progressive Collapse”. Ph.D. Dissertation, The University of Texas at Austin, USA, 363 pp.
Quinn, K., (2009). “Shear Strengthening of Reinforced Concrete Beams with Carbon Fiber Reinforced Polymer (CFRP) and Improved Anchor Details”, Master of Science Thesis, The University of Texas at Austin, USA, 272 pp.
Sato, Y., Katsumata, H., and Kobatake, Y. (1997). “Shear Strengthening of Existing Reinforced Concrete Beams CFRP Sheet”. Proceeding of the Third International Symposium on Non-Metallic (FRP)

67
Reinforcement for Concrete Structures (FRPRCS-3), Japan Concrete Institute, Sapporo, Japan, Vol. 1, pp. 507-514.
68
VITA
Haomin Helen Wang was born in Beijing, China in 1989. In 1993, she moved to the U.S. where
she spent her early years in Austin, TX. She attended Cinco Ranch High School in Katy, TX and graduated
from high school in 2007. Afterwards, she attended the University of California, Berkeley where she
received her Bachelors of Arts in Architecture and minor in Civil Engineering in December 2010.
In the fall of 2011, Haomin began her studies at the University of Texas at Austin towards her
master’s degree in structural engineering. During her time at UT Austin, she worked as a graduate
research assistant at the Ferguson Structural Engineering Laboratory, and will graduate with her Masters
of Science in Engineering in December 2013.
Email: [email protected]
This thesis was typed by the author.