Copyright by Gurpreet Kaur 2017
191
Copyright by Gurpreet Kaur 2017
Transcript of Copyright by Gurpreet Kaur 2017

Copyright
by
Gurpreet Kaur
2017
The Thesis Committee for Gurpreet Kaur
Certifies that this is the approved version of the following thesis:
Improving Frontline Supervision in Industrial Construction
APPROVED BY
SUPERVISING COMMITTEE:
William J. O’Brien
John Borcherding
Supervisor:

Improving Frontline Supervision in Industrial Construction
by
Gurpreet Kaur
Thesis
Presented to the Faculty of the Graduate School of
The University of Texas at Austin
in Partial Fulfillment
of the Requirements
for the Degree of
Master of Science in Engineering
The University of Texas at Austin
August 2017

Dedication
To the loving memory of my grandparents.

v
Acknowledgements
As an Indian woman belonging to a conservative society, I am proud to be here
today and grateful to my family who has helped me to reach this point. The decision to
pursue Masters in the United States was never easy, and I thank my family and friends in
India for their constant encouragement and undeterred belief. I would like to express my
gratitude to my late grandparents, without whom I would not be who I am today.
Next, I would like to thank my advisor Dr. William O’Brien for his guidance and
trust. I am grateful for the opportunity you provided me to be a part of the Construction
Industry Institute (CII) and the Research Team- RT330, “Improving Frontline Supervision
in Industrial Construction.” I am thankful to Dr. John D. Borcherding for agreeing to
review the thesis and all the help and support he offered during the endeavour. I would also
express my pride to be a part of the University of Texas at Austin and especially the
Construction Engineering and Project Management (CEPM) department; through the
program, faculty, staff, students, libraries, and the university environment.
Furthermore, I am also thankful to every member of CII and the research team, RT
330, for their wisdom and guidance, both personal and professional. I would also like to
thank everyone who helped in the data collection efforts. Especially, the industry
organizations, interviewees, and respondents who agreed to be a part of this research.
Finally, I would thank those who have supported me through my graduate studies
through friendship and mentorship. I am thankful to everyone for making this journey very
memorable and cherished. I would also extend recognition to my school Convent of Jesus
and Mary, Ambala, my undergraduate university, National Institute of Technology,
Kurukshetra, and Technip India Limited, especially to the people, for being a constant
source of inspiration.

vi
Abstract
Improving Frontline Supervision in Industrial Construction
Gurpreet Kaur, M.S.E.
The University of Texas at Austin, 2017
Supervisor: William J. O’Brien
Frontline supervisors (Foremen and General Foremen) are the first line of supervision and
are an important link between the management and their construction crew (Uwakweh
2005). They play a significant role in maintaining production on industrial capital projects
where along with directly motivating and supervising their crew, and are responsible for a
myriad of imperative yet time-consuming tasks during a typical work day. While many
studies acknowledge the role of frontline supervisors especially foremen in supervising
their crew, construction foremen are known as the marginal men in the industry and are
comparatively understudied. Considering their role in maintaining production on industrial
construction projects, the Construction Industry Institute (CII) sponsored the research titled
“RT330- Improving Frontline Supervision in Industrial Construction”. This research aimed
to understand the role of frontline supervisors in Industrial construction. The efforts
included identifying core competencies in productive frontline supervisors, defining an
ideal productive day, identifying the effect of developmental training, analyzing the
impediments to construction productivity as described by frontline supervisors, and
recommending specific action items to the industry members including owners and
vii
contractors. The research team identifies this effort as monumental, considering the number
of frontline supervisors in industrial projects and the significant difference that is
achievable if the performance of each supervisor in these fast track and complex industrial
construction projects is improved even minutely. It is important to note that the scope of
this thesis and the research study is limited to only heavy and light industrial projects.
However, the recommendations and call to action might be equally applicable to other
construction including commercial and heavy civil/infrastructure construction projects.
This thesis contains the results of the efforts of the CII sponsored Research Team RT330.
viii
Table of Contents
List of Tables ...........................................................................................................x
List of Figures ....................................................................................................... xii
Chapter 1: Introduction ............................................................................................1
Chapter 2: Core competencies in productive Foremen and General Foremen:
Identification and need for improvement ......................................................14
Summary .......................................................................................................14
Introduction ...................................................................................................15
Literature Review..........................................................................................17
Research Questions .......................................................................................19
Research Methodology .................................................................................19
Content ..........................................................................................................21
Results ...........................................................................................................28
Conclusions ...................................................................................................39
Chapter 3: Industrial Construction Frontline Supervisors Time on Tasks ............42
Summary .......................................................................................................42
Introduction ...................................................................................................43
Literature Review..........................................................................................45
Research Questions .......................................................................................46
Research Methodology .................................................................................47
Content ..........................................................................................................48
Results ...........................................................................................................61
Conclusions ...................................................................................................69

ix
Chapter 4: Influence of Advanced Work Packaging on Task Scheduling by Frontline
Supervisors ....................................................................................................72
Summary .......................................................................................................72
Introduction ...................................................................................................73
Literature Review..........................................................................................75
Research Questions .......................................................................................78
Research Methodology .................................................................................79
Content ..........................................................................................................84
Results ...........................................................................................................86
Conclusions .................................................................................................118
Chapter 5: Construction Foremen and General Foremen Perceptions of Impediments
to their Productivity ....................................................................................119
Chapter 6: Conclusions ........................................................................................128
Appendices ...........................................................................................................131
Appendix A- Superintendents and craft managers survey ..........................131
Appendix B- Foremen Survey ....................................................................136
Appendix C- General Foremen Survey.......................................................140
Appendix D- Superintendent survey- Data .................................................144
Appendix E- Foremen and General Foremen Survey- Data, all projects ...159
Appendix F- Interview Questionnaire- Foremen and General Foremen ....174
References ............................................................................................................176

x
List of Tables
Table 1 Foremen and General Foremen Competencies- Detailed responsibilities and scope ..... 23
Table 2. Competency Averages- Importance- Foremen and General Foremen (1-6 scale) .......... 30
Table 3. Competency assessment- Importance to performance- F .............................................. 32
Table 4. Competency assessment- Importance to performance- GF ............................................ 33
Table 5. Competency Averages- Competency level- F and GF (1-6 scale) .................................... 34
Table 6. Competency assessment- Current level- F ...................................................................... 37
Table 7. Competency assessment- Current level- GF .................................................................... 38
Table 8 Foremen tasks during a "Productive Day" ........................................................................ 51
Table 9 General Foremen tasks during a "Productive Day" .......................................................... 53
Table 10 Foremen tasks during a "Productive Day"- Ideal ranges ................................................ 56
Table 11 General Foremen tasks during a "Productive Day"- Ideal ranges .................................. 57
Table 12 Percent of Foremen responding in each range (ideal range is shaded) ......................... 63
Table 13 Percent of General Foremen responding in each range (ideal range is shaded) ........... 64
Table 14 Percentage of Foremen responding in each range- Hard crafts (Ideal range is
highlighted).................................................................................................................................... 66
Table 15 Percentage of General Foremen responding in each range- Hard crafts (Ideal range is
highlighted).................................................................................................................................... 68
Table 16 Foremen tasks during a "Productive Day"- Ideal ranges ................................................ 81
Table 17 General Foremen tasks during a "Productive Day"- Ideal ranges .................................. 82
Table 18 Task 2- Plan/prioritize tasks and fallback work, traditional projects.............................. 88
Table 19 Task 5- Coordinate with other crews, traditional projects ............................................. 88
Table 20 Task 9- Check Materials, traditional projects ................................................................. 89
Table 21 Task 8- Time on tools, traditional projects ..................................................................... 89
Table 22 General Foremen time allocation by percentage on Task 2 – Plan/Prioritize, traditional
projects .......................................................................................................................................... 93
Table 23 General Foremen time allocation by percentage on Task 6 – Work Package
Development, traditional projects ................................................................................................ 93
Table 24 Foremen time allocation by percentage on Task 7 – Plan for future work, AWP projects
....................................................................................................................................................... 96
Table 25 Foremen time allocation by percentage on Task 8 – Work on tools, AWP projects ...... 97
Table 26 General Foremen time allocation by percentage on Task 2 –Plan/Prioritize Tasks and
Fallback work with Foremen, AWP projects ................................................................................. 99
Table 27 Foremen- Difference between AWP and Traditional Time on Tasks ........................... 103
Table 28 Foremen time allocation by percentage on Task 6 –Supervise/Motivate/and Execute,
AWP vs. Traditional ..................................................................................................................... 104
Table 29 Foremen time allocation by percentage on Task 10 –Move crews to contingency work,
AWP vs. Traditional ..................................................................................................................... 105

xi
Table 30 General Foremen- Difference between AWP and Traditional Time on Tasks ............. 107
Table 31 General Foremen time allocation by percentage on Task 3 –Safety Related activities,
AWP vs. Traditional ..................................................................................................................... 107
Table 32 General Foremen time allocation by percentage on Task 4 –Constraint management,
AWP vs. Traditional ..................................................................................................................... 109
Table 33 General Foremen time allocation by percentage on Task 7 –Communication with Field
Engineers, AWP vs. Traditional .................................................................................................... 110
Table 34 General Foremen time allocation by percentage on Task 6 –Work package
development, AWP vs. Traditional .............................................................................................. 111
Table 35 Planning impediments to production- engineering deliverables- Interview Responses
..................................................................................................................................................... 115
Table 36 Completeness of Work Packages- Interview Responses .............................................. 117
Table 37 Field and Planning/Workforce Impediments to Construction Productivity ................. 121
Table 38 General Foremen and Foremen Average scores- Impediments ................................... 122
Table 39 General Foremen Productivity Impediments, Traditional vs. AWP .............................. 124
Table 40 Foremen Productivity Impediments, Traditional vs. AWP ........................................... 126

xii
List of Figures
Figure 1 Concept of Advanced Work Packaging; Source: Construction Industry Institute:
Advanced Work Packaging: Design through Workface Execution, Research Summary RT272-1,
Version 2.1 (Construction Industry Institute 2013b) ....................................................................... 8
Figure 2 Likert scale- Importance of competencies ...................................................................... 26
Figure 3 Likert scale- Current level of Competencies .................................................................... 27
Figure 4 Superintendent survey- Respondents by role in the organization.................................. 29
Figure 5 Productive Day- Foremen ................................................................................................ 52
Figure 6 Productive Day- General Foremen .................................................................................. 54
Figure 7 General Foremen distribution per craft- all projects ...................................................... 59
Figure 8 Foremen distribution per craft- all projects .................................................................... 60
Figure 9 Concept of Advanced Work Packaging; Source: Construction Industry Institute:
Advanced Work Packaging: Design through Workface Execution, Research Summary RT272-1,
Version 2.1 (Construction Industry Institute 2013b). .................................................................... 76
Figure 10 Foremen time allocation by percentage on Task 2- Plan/prioritize task and fallback
work, traditional projects .............................................................................................................. 90
Figure 11 Foremen time allocation by percentage on Task 5- Coordinate with other crews,
traditional projects ........................................................................................................................ 91
Figure 12 Foremen time allocation by percentage on Task 9 – check materials, traditional
projects .......................................................................................................................................... 91
Figure 13 Foremen time allocation by percentage on Task 8 – time on tools, traditional projects
....................................................................................................................................................... 92
Figure 14 General Foremen time allocation by percentage on Task 2 – Plan/prioritize fallback
work, traditional projects .............................................................................................................. 94
Figure 15 General Foremen time allocation by percentage on Task 6- Work Package
Development, traditional project .................................................................................................. 94
Figure 16 Foremen time allocation by percentage on Task 7- Plan for Future work, AWP Projects
....................................................................................................................................................... 98
Figure 17 Foremen time allocation by percentage on Task 8- Work on Tools with the Crew, AWP
Projects .......................................................................................................................................... 98
Figure 18 General Foremen time allocation by percentage on Task 2- Plan/prioritize tasks/
fallback work with Foremen, AWP Projects ................................................................................ 100
Figure 19 Foremen time allocation by percentage on Task 6 –Supervise/Motivate/and Execute,
AWP vs. Traditional ..................................................................................................................... 104
Figure 20 Foremen time allocation by percentage on Task 10 –Move crews to contingency work,
AWP vs. Traditional ..................................................................................................................... 105
Figure 21 General Foremen time allocation by percentage on Task 3 –Safety Related activities,
AWP vs. Traditional ..................................................................................................................... 108

xiii
Figure 22 General Foremen time allocation by percentage on Task 4 –Constraint management,
AWP vs. Traditional ..................................................................................................................... 109
Figure 23 General Foremen time allocation by percentage on Task 7 –Communication with Field
Engineers, AWP vs. Traditional .................................................................................................... 110
Figure 24 General Foremen time allocation by percentage on Task 6 –Work package
development, AWP vs. Traditional .............................................................................................. 111
Figure 25 General Foremen time allocation by percentage on Task 2 – Prioritize tasks and
fallback work, AWP vs. Traditional .............................................................................................. 112

1
Chapter 1: Introduction
Frontline supervisors (Foremen and General Foremen) are the first line of
supervision and are an important link between the management and their construction crew
(Uwakweh 2005). They play a significant role in maintaining production on industrial
capital projects where along with directly motivating and supervising their crew, and are
responsible for a myriad of imperative yet time-consuming tasks during a typical work day.
While many studies acknowledge the role of frontline supervisors especially foremen in
supervising their crew, construction foremen are known as the marginal men in the industry
and are comparatively understudied. Considering their role in maintaining production on
industrial construction projects, the Construction Industry Institute (CII) sponsored the
research titled “RT330- Improving Frontline Supervision in Industrial Construction”. This
research aimed to understand the role of frontline supervisors in Industrial construction.
The efforts included identifying core competencies in productive frontline supervisors,
defining an ideal productive day, identifying the effect of developmental training,
analyzing the impediments to construction productivity as described by frontline
supervisors, and recommending specific action items to the industry members including
owners and contractors. The research team identifies this effort as monumental,
considering the number of frontline supervisors in industrial projects and the significant
difference that is achievable if the performance of each supervisor in these fast track and
complex industrial construction projects is improved even minutely. It is important to note
that the scope of this thesis and the research study is limited to only heavy and light

2
industrial projects. However, the recommendations and call to action might be equally
applicable to other construction including commercial and heavy civil/infrastructure
construction projects. This thesis contains the results of the efforts of the CII sponsored
Research Team RT330.
Several studies recognize the importance of construction foremen in motivating
workers, assuring safety and quality, and efficiently conducting work (Senior 1996). Other
studies have established the importance and their role as a crucial link between the
management and workforce (Uwakweh 2005). Where their duties include a myriad of
responsibilities including managing, planning and defining work, communicating with
workers, and motivating them to perform at acceptable levels. It becomes imperative for
the industry to understand their roles and responsibilities, especially in complex and fast
paced industrial construction projects. The need to increase predictability and performance
in industrial projects reinforces the fact that in the industrial sector 70 % of the projects
exceeded 10 % variation from the expected schedule and cost values (Choo et al. 1999).
Considering the dynamics of production and external impediments and the vital role played
by foremen in increasing construction productivity and maintaining performance, this
research has aimed to provide specific recommendations to the industry including ensuring
developmental training for their frontline supervisors.
The first part of this research study aimed at identifying the core competencies in
productive frontline supervisors. Previous studies have recognized the importance of
identifying the core competencies in frontline supervision to increase construction
productivity and importance. Uwakweh acknowledged that identifying core competencies
3
in frontline supervisors is important to increase construction productivity and performance
(Uwakweh 2005). The preliminary work of Construction Industry Institute in establishing
critical supervisory behaviors and the prerequisite knowledge, skills, abilities, and
personality traits of supervisors has been the basis of this research study to extensively
study the core competencies and measure the performance of frontline supervisors in North
America. The researchers of the study themselves recognize that since the research was
conducted in the 1990s, the scope of recommendations might be limited beyond the 1990s.
Studies to identify characteristics of productive industrial foremen and how they
perceive or perform their jobs differently and their influence on performance have been
done in the past (Lemna et al. 1986; Uwakweh 2005; Maloney and McFillen 1987). Shohet
and Laufer identified that despite the acknowledged role of foremen in the execution of
construction projects, their function had received less importance. They studied the
behavioral patterns of construction foremen and their influence on construction
productivity. They concluded that the role of a foreman as a manager or supervisor is very
important and they can effectively replace replanning with pre-planning to increase
construction performance and productivity (Shohet and Laufer 1991).
Studies that identify the importance of supervisory skills and competencies and the
urgent need of their training were conducted in the past. Hewage et al. researched on-site
construction professionals in Alberta building construction projects and identified weak
supervisory skills of foremen and the urgent need of training programs for field managers
to improve their present skill levels (Hewage et al. 2011). Rojas provided a 360º assessment
of field supervisors and project managers within an unionized electrical contracting

4
company and identified 12 pillars of successful supervision (Rojas 2013). Further, a
competency-based model to analyze the role of construction site supervisors, including
Foremen and General Foremen, has been developed to train, develop, and certify
construction supervisors in Chile and other developing countries (Serpell and Ferrada
2007). However, the authors themselves recognized that the results of the study apply to
only developing countries of that region (Serpell and Ferrada 2007). Dainty et al. presented
a competency-based model for predicting the performance of construction project
managers to facilitate their recruitment and performance management (Dainty et al. 2005).
Fuzzy logic has also been used to predict and evaluate construction trades foremen
performance with specific applications in evaluating performance, factors that affect their
performance on a daily basis and also includes efforts to benchmark their performance
(Poveda and Fayek 2009)
All the above studies have provided evidence to the importance of frontline
supervisors in maintaining construction productivity and performance in industrial
construction projects. Along with establishing their importance and acknowledging their
role, they have also ascertained the importance of defining core competencies in productive
frontline supervisors. However, the research team believes that they have not received
much importance with regards to the investment in training and developmental programs
by the contractors for which they work. The RT330 research team is composed of 18
industry representatives who have extensive construction experience and believe that
improving frontline supervision in industrial construction is imperative to increase
construction productivity and performance. There is enough testimony to the fact that

5
construction productivity is on a steady decline in the past decades and there is an urgent
need that the industry develops and trains their frontline supervisors. The core
competencies would help the industry in developing training programs which would be an
important step in recruiting, training, and retaining the pool of talented and competitive
frontline supervisors. The research hypothesis is that frontline supervisors in industrial
construction projects lack the desired skills and competencies to increase construction
productivity and performance. This thesis addresses the first research question in Chapter
2 of this thesis. “What are the core competencies in frontline supervisors in industrial
construction projects? What is their current level in the industry and what are the key areas
that pose a challenge and have potential room for improvement?”
The second part of this research aimed at identifying the key tasks undertaken by
Foremen and General Foremen on industrial construction projects. Along with identifying
key tasks and their corresponding ideal time ranges, this research surveyed frontline
supervisors in North America to report the key areas in which they were spending their
time. Other studies have recognized the influence of frontline supervisors in supervising
and motivating workers in influencing construction productivity. They have also
established a correlation between the time spent by a foreman during a workday with the
performance of their crews. Argyle et al. investigated the effects of different styles of first-
line supervision on productivity (Argyle et al. 1957). Hinze and Kuechenmeister
investigated the characteristics and common traits of productive industrial foremen (Hinze
and Kuechenmeister 1981). Lemna et al. identified characteristics of industrial foremen
and their effect on construction productivity (Lemna et al. 1986). Maloney and McFillen

6
identified five dimensions of foremen performance and their relationships with worker
motivation, performance, and satisfaction (Maloney and McFillen 1987). Shohet and
Laufer identified the correlation of foremen time spent during a workday with the
performance of their crews (Shohet and Laufer 1991). Senior elaborated on foremen
planning behind short-term task scheduling (Senior 1996). Uwakweh identified seven
foremen scales to establish their relationship with the motivation and performance of
construction apprentices (Uwakweh 2005).
These studies have established where frontline supervisors especially foremen
spend their time on a typical workday, however, do not granulize the tasks and enable the
frontline supervisors to self-report where they are spending their time. The RT330 research
team believes that identifying key tasks along with analyzing the areas where frontline
supervisors which have room for improvement are very helpful for the industry to improve
frontline supervision in industrial construction. The second research question that follows
from this is “What are key tasks that a productive frontline supervisor undertakes during
a day at an industrial construction site? Which key areas indicate room for improvement?”
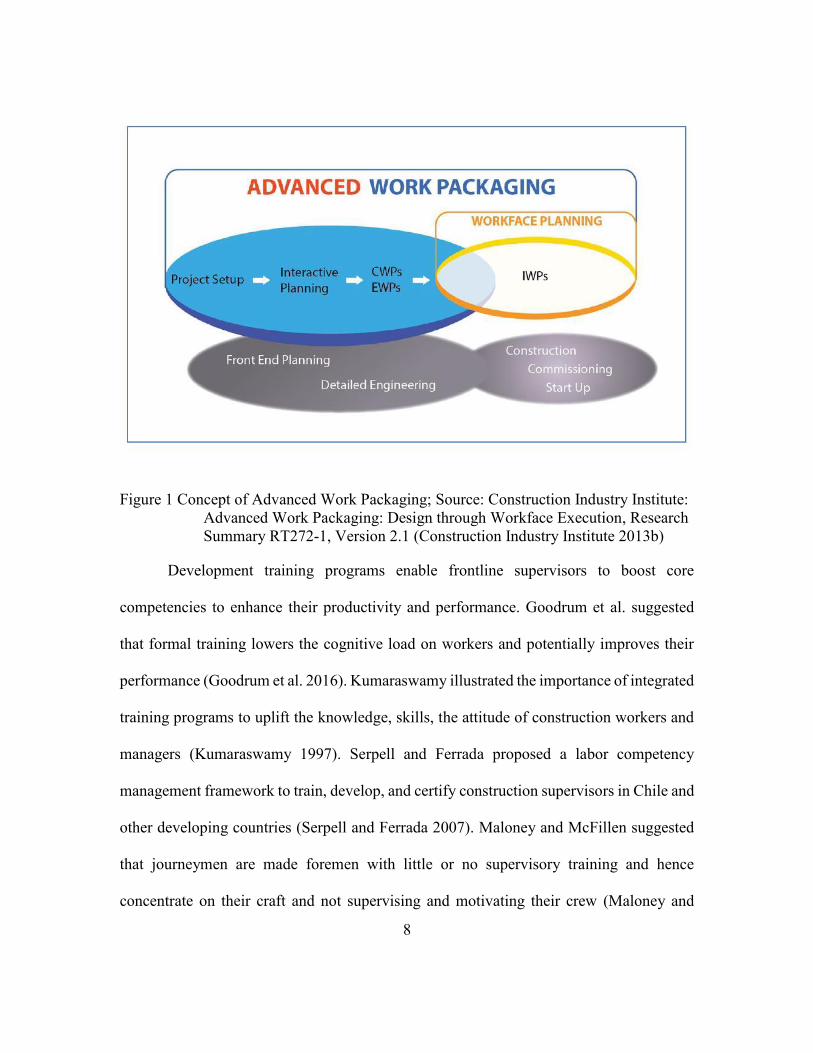
The third part of the research aims at understanding the influence of productivity
enhancing practices including Advanced Work Packaging and AWP developmental
training on the performance of industrial frontline supervisors. Productivity Enhancing
practices including Advanced Work Packaging have been observed to increase
performance and productivity on Industrial Construction Projects. CII RT272 defines AWP
as a disciplined approach to improving productivity and predictability by aligning planning
and execution activities across the project life cycle, from project setup to start up and

7
turnover (Construction Industry Institute 2013a). The background literature on AWP
establishes how AWP aimed towards improving productivity on industrial construction
projects in Alberta oil sands construction projects. Some of the steps included delivering
all resources necessary at the right time, to the right place, and to the right people to execute
construction, to avoid cost overruns and delays. Other steps including relieving the onsite
supervision team from the time-consuming tasks of onsite planning and resource tracking;
thereby allowing them to focus on production and direction of their crews. These two
measures explain that AWP helps in increasing construction productivity by active pre-
planning and reducing external impediments to production. Figure 1 below explains in
detail the concept behind AWP and how does it include active pre-planning right from the
initial stages of an industrial construction project.
8
Figure 1 Concept of Advanced Work Packaging; Source: Construction Industry Institute:
Advanced Work Packaging: Design through Workface Execution, Research
Summary RT272-1, Version 2.1 (Construction Industry Institute 2013b)
Development training programs enable frontline supervisors to boost core
competencies to enhance their productivity and performance. Goodrum et al. suggested
that formal training lowers the cognitive load on workers and potentially improves their
performance (Goodrum et al. 2016). Kumaraswamy illustrated the importance of integrated
training programs to uplift the knowledge, skills, the attitude of construction workers and
managers (Kumaraswamy 1997). Serpell and Ferrada proposed a labor competency
management framework to train, develop, and certify construction supervisors in Chile and
other developing countries (Serpell and Ferrada 2007). Maloney and McFillen suggested
that journeymen are made foremen with little or no supervisory training and hence
concentrate on their craft and not supervising and motivating their crew (Maloney and

9
McFillen 1987). Fayek et al. identify the importance of front-line supervisors in the labor-
intensive construction industry and the need for supervisory training to effectively
undertake their responsibilities (Fayek et al. 2006). These studies establish the importance
of developmental training in ensuring that frontline supervisors effectively perform their
responsibilities in labor intensive and dynamic construction environments.
These studies establish the importance of developmental and supervisory training,
however, do not provide any granular comparisons between the performance of frontline
supervisors with and without any formal training. For this research, comparison of time
spent by frontline supervisors in traditional and AWP projects and those with and without
AWP training is used to demonstrate the importance of productivity enhancing practices,
in particular, Advanced Work Packaging, AWP in increasing performance on Industrial
construction projects. The third research question that follows is “Is there a difference in
the time spent by frontline supervisors in traditional and AWP work environments? What
is the influence of developmental training, in particular, AWP training on the performance
of frontline supervisors in industrial construction projects?”.
Before elaborating on the research questions defined in this section, it is important
to define the various terms used in this thesis. It is necessary to establish these terms and
industry definitions along with defining the scope of our research. This section provides
definitions of terms including Foremen, General Foremen, and Superintendents for the
scope of this research. These terms apply to heavy and light industrial construction projects
and might change with the type of construction environment. The terms Frontline

10
Supervisors and Foremen and General Foremen would be used interchangeably in this
thesis.
General Foreman (GF): GF is the top level of frontline supervision and usually
supervises 3-6 Foremen (F), typically within a specific craft or discipline. Main
responsibilities of a GF include planning for production several days in advance, the typical
duration being three weeks, ensuring that his F have the necessary resources including
equipment, material, scaffolding, cranes, etc. Additionally, they help in assessing
completed progress and forecasting future labor needs.
Foreman (F): Foremen are a crucial link between management and the crew. They
are responsible for supervising and motivating the crew. Typically, Foremen have 8-12
craftsmen in the crew. Their immediate responsibilities include making sure that his crew
is productive, safe, and performs quality work. In some jobs, foremen act as working
foremen or leadmen especially when the crew is small.
Superintendent: Superintendents are the top level of supervision for a specific craft
or area of work and accordingly addressed as a craft or general superintendent. Typically
superintendents supervise a crew of 3-5 General Foremen. Their main responsibilities
include safe and productive execution of work. The next section would provide details on
previous studies on frontline supervisors to establish the importance of this research and to
define the scope.
This thesis consists of a total of six chapters covering each of the areas described
above in detail. Chapter 1 provides a detailed explanation of the past studies on frontline
supervisors. It also defines the research hypotheses and essential research questions. Along

11
with establishing the importance of studying ways to improve frontline supervision in
industrial construction, it presents the past studies on Frontline supervisors and their
importance in defining the hypothesis of this study. It also captures the definitions of
Foremen, General Foremen, and other terms used significantly in the thesis.
Chapter 2 elaborates on the core competencies in productive frontline supervisors
as identified by the research team. Along with establishing the core competencies based on
previous research studies and a Delphi approach within the industry expert members of the
research team, this chapter establishes their importance with the help of electronic surveys
distributed to superintendents and managers with craft knowledge within North America.
This chapter established the ten competencies and discusses the survey results which
reinforce the pressing need for the industry to invest in frontline supervisors.
Chapter 3 defines the ideal productive day for both foremen and general foremen
on industrial construction projects. Along with establishing ten and eight crucial tasks
during a productive day for foremen and general foremen respectively, this chapter
illustrates the different categories in which the frontline supervisors self-report the time
spent when asked on industrial sites within North America. Along with elaborating on the
time spent by the frontline supervisors on all the projects covered during the study, a
separate analysis is done for specific crafts and different production productivity programs.
The three different production programs in this chapter are traditional, maintenance, and
Advanced Work Packaging/Workface Planning programs. This chapter is important to
highlight the differences between the proposed time ranges in which a frontline supervisor
should spend their time and actual industry practices. The difference between the proposed

12
ideal day and actual time spent is used to explain the importance of addressing the problems
faced by frontline supervisors including their competencies and skills and the external
impediments faced.
Chapter 4 further elaborates on the productivity impediments covered in Chapter 3.
It establishes six workforce/planning related impediments and five field related
impediments. Based on the responses from surveys across North America, the overall score
of each of the impediments based on a five-point Likert scale is used to explain the external
impediments to production faced by frontline supervisors on industrial projects. Further, a
comparison of production impediments in the two production programs including
traditional and AWP/WFP environments is presented to suggest ways improve the
performance of the frontline supervisors.
Chapter 5 explains the importance of AWP and developmental training in
improving the performance of frontline supervisors. Along with comparing the time spent
in each of the eight and ten categories for General Foremen and Foremen respectively for
those who received AWP training or not, this chapter further compares the time spent by
frontline supervisors on traditional and AWP projects. The recommendations presented in
this chapter is specific to the industry members to adopt productivity enhancing practices
especially Advanced Work Packaging to improve the performance of frontline supervisors.
Chapter 6 is the concluding chapter that provides consolidated results and discusses
the importance of this study in academic research. Overall this thesis describes in detail the
role of frontline supervision in industrial construction. Along with understanding the role
it aims at improving the frontline supervision. The thesis aims at identifying core
13
competencies in productive frontline supervisors along with identifying crucial tasks and
their proposed ideal time ranges as proposed by the Research Team. This research further
explains the importance of productivity enhancing practices including Advanced Work
Packaging (AWP) in increasing productivity by effectively shielding production from
external impediments. It also researches on the effect of developmental training including
AWP training on the performance of frontline supervisors. The research team believes that
with specific recommendations for both owners, contractors, and for academic
practitioners, this research would be monumental in improving the frontline supervision in
industrial construction.

14
Chapter 2: Core competencies in productive Foremen and General
Foremen: Identification and need for improvement
SUMMARY
Frontline supervisors (Foremen (F) and General Foremen (GF)) have a significant
impact on the productivity, quality, and safety of an industrial construction project. This
chapter focuses on identifying the desired skills and competencies in productive frontline
supervisors in industrial construction, assessment of importance to productivity by
superintendents and related personnel, and finally an assessment of the current skill level
of frontline supervisors by the same population of superintendents and related personnel.
It explains the methodology in finalizing the ten core competencies and substantiates the
findings with appropriate statistical analysis of data from industrial construction sites in
North America (The US and Canada). The ten core competencies described in this chapter
are general construction knowledge, trade specific knowledge, verbal communication,
written communication, pre-planning, problem-solving, ethical value system, people
management, leadership, and proactive and goal driven. The principal findings include that
the core competencies are different on the importance in construction performance for both
Foremen and General Foremen. Three competencies including written communication,
pre-planning, and problem-solving indicate areas that need improvement for both Foremen
and General Foremen. The current competency level shows the need for improvement,
especially for Foremen. Overall the mean score of the competencies for General Foremen
is more than that for Foremen. Identification and assessment of current competencies are
very important to improve the performance of industrial construction frontline supervisors.

15
INTRODUCTION
The importance of construction foremen in motivating workers, assuring safety and
quality, and efficiently conducting work has been recognized in several studies (Senior
1996). They are a crucial link between the management and workforce (Uwakweh 2005).
They are expected to manage, plan and define work, communicate with workers, and
motivate them to perform at acceptable levels (Uwakweh 2005). Their performance has a
significant impact on the cost and schedule of industrial capital construction projects. The
dynamic and complex nature of these projects intensifies the cognitive load and
responsibilities on frontline supervisors. The need to increase predictability and
performance of industrial construction projects is reinforced by the fact that in the industrial
sector 70 % of the projects exceeded 10 % variation from the expected schedule and cost
values (Choo et al. 1999). Both the owner and contractor organizations should undertake
unified efforts to effectively train their frontline supervisors to pursue their responsibilities
crucial for maintaining performance in industrial construction.
However, the transient nature of industrial construction foremen makes it difficult
for contractors to justify the cost of investment in developmental training. The construction
General Foremen are however not a transient workforce. The research team believes that
most contractors continue to select their new foremen from an assortment of the “best” of
an increasingly inexperienced labor craft labor pool, based on recommendations by their
General Foremen and Superintendents. These Foremen assume their new roles, with
minimal onboarding support and rely on daily guidance from their peers and supervisors
to help them transition into their new responsibilities. Typically, over time, these

16
individuals either succeed or fail through their efforts and work opportunities with a variety
of companies, with different cultures and different support structures. Some continue as
Foremen; some fall back to working with their tools and a few advance to the General
Foreman level. Very few are ever formally evaluated to determine their strengths and
weaknesses, and even fewer undergo training and developmental opportunities that they
need to reach their full performance potential. The result is that most Foremen and General
Foremen are never given their best opportunity to do well, and consequently the
performance of craft labor on many projects is much less than optimal.
The purpose of this research is to offer an advantage to the organizations to
benchmark the skills and competencies to recruit effectively, train, and retain productive
frontline supervisors. In industrial capital construction projects, it is also important to
establish the current capabilities and skill sets of frontline supervisors. A comparison of
the current and desired skills would establish a framework to predict and strengthen the
competencies of on-job frontline supervisors in crucial industrial capital construction
projects.
This chapter defines the ten core competencies in productive frontline supervisors
in industrial construction projects. It establishes the results with the help of a two-step
approach. It firstly establishes that the ten proposed competencies are important to maintain
production for both foremen and general foremen. Secondly, demonstrates that the skills
are weak in both foremen and general foremen. The ten core competencies as identified by
the research team are general construction knowledge, trade specific knowledge, verbal
communication, written communication, pre-planning, problem-solving, ethical value

17
system, people management, leadership, and proactive and goal driven. The principal
findings include that the core competencies are different on the importance in construction
performance for both F and GF. Three competencies including written communication,
pre-planning, and problem-solving indicate areas that need improvement for both Foremen
and General Foremen. The current competency level shows the need for improvement,
especially for Foremen. Overall the mean score of the competencies for General Foremen
is more than that for Foremen. Identification and assessment of current competencies are
very important to improve the performance of industrial construction frontline supervisors.
LITERATURE REVIEW
Identifying core competencies in frontline supervisors is important to increase
construction productivity and performance (Uwakweh 2005). However, their evaluation is
a research area that is relatively understudied. The Construction Industry Institute’s
research titled “A framework for continuing supervisory education” identified critical
supervisory behaviors and their prerequisite knowledge, skills, abilities, and personality
traits which it collectively referred to as competencies. Lemna et al. acknowledged that
the results of the study might not be applicable beyond the 1990s (Gary J. Lemna et al.
1986). Studies to identify characteristics of productive industrial foremen and how they
perceive or perform their jobs differently and their influence on performance are done in
the past (Lemna et al. 1986; Uwakweh 2005; Maloney and McFillen 1987). Shohet and
Laufer identified that despite the acknowledged role of foremen in the execution of
construction projects, their function had received less importance. They studied the
behavioral patterns of construction foremen and their influence on construction
18
productivity. They concluded that the role of a foreman as a manager or supervisor is very
important and they can effectively replace replanning with pre-planning to increase
construction performance and productivity (Shohet and Laufer 1991).
Past Studies have identified the importance of supervisory skills and competencies
and the urgent need of their training. Hewage et al. researched on-site construction
professionals in Alberta building construction projects and identified weak supervisory
skills of foremen and the urgent need of training programs for field managers to improve
their present skill levels (Hewage et al. 2011). Rojas provided a 360º assessment of field
supervisors and project managers within an unionized electrical contracting company and
identified 12 pillars of successful supervision (Rojas 2013). Further, a competency-based
model to analyze the role of construction site supervisors, including Foremen and General
Foremen, has been developed to train, develop, and certify construction supervisors in
Chile and other developing countries (Serpell and Ferrada 2007). However, the authors
themselves recognized that the results of the study apply to only developing countries of
that region (Serpell and Ferrada 2007). Dainty et al. presented a competency-based model
for predicting the performance of construction project managers to facilitate their
recruitment and performance management (Dainty et al. 2005). Fuzzy logic has also been
used to predict and evaluate construction trades foremen performance with specific
applications in evaluating performance, factors that affect their performance on a daily
basis and also includes efforts to benchmark their performance (Poveda and Fayek 2009).
All these studies have realized the importance of identifying core competencies in frontline
supervisors. However, this research identifies ten core competencies and also signifies the
19
industry gap and room for improvement by conducting a country-wide survey of
superintendents and managers with craft knowledge.
Overall, frontline supervisors have been under-studied in the past. Less research is
available on General Foremen in comparison to Foremen. The research team deemed
necessary to identify and compare core competencies of productive frontline supervisors,
both Foremen and General Foremen.
RESEARCH QUESTIONS
Based on the literature review, for most of the research studies are either dated or
do not consider frontline supervisors in their scope. Lemna et al. acknowledged that the
results might not be applicable beyond the 1990s (Lemna et al. 1986). Serpell and Ferrada
acknowledged that the research study is applicable developing economies with a large
construction workforce (Serpell and Ferrada 2007). Other studies cover limited scope and
do not dwelve deeper into the competencies and cureent competency level in the industry.
Considering the limited availability of resources and past research studies to define core
competencies in productive frontline supervisors, RT330 concentrated on identifying and
defining the core competencies along with measuring the current industry levels. The two
research questions addressed in this chapter are: What are the skills and competencies of
General Foremen/Foremen in capital construction projects?; What are the current
capabilities and skill sets of industrial General Foremen and Foremen and what is the gap?
RESEARCH METHODOLOGY
The research team started with reviewing the existing literature and determining the
list of competencies which applied to industrial frontline supervisors. The available
20
literature reinforced that limited or dated research is available on frontline supervisors
especially on their competencies. After a detailed evaluation of previous CII sponsored
research studies and inputs from the industry representatives, the research team narrowed
down to a list of ten competencies from about nearly a hundred and fifty. The ten
competencies were deemed to be equally important for both Foremen and General
Foremen. After the research team had finalized the competencies, they defined the scope
of tasks and responsibilities covered under each of the ten categories. After clearly defining
the scope, the next step involved evaluating the competencies. The research team surveyed
a group of superintendents and managers with craft knowledge to report their
understanding of two important aspects. The respondents were asked their opinion on the
importance and current level of competencies in their frontline supervisors on industrial
construction projects. It helped the research team to validate the research hypothesis that
the identified list of competencies is important and also there is a lot of room for
improvement. The electronic survey was created in an Online Survey platform known as
Qualtrics Survey Tool. The Survey is available in Appendix 1 of this thesis. The data
collection started in the summer of 2016. The surveys received were analyzed statistically
to summarize the results. A detailed list of competencies along with an industry survey
helps to identify the areas which need improvement and are helpful to determine training
guidelines that should be adopted in the industry.This chapter presents the results and
conclusions of the research effort. . Appendix 4 would present the results of detailed
statistical analysis of the responses to support the results presented in this chapter
21
CONTENT
The initial Literature review included a CII research RT 40 titled “Continuing
Supervisory Education” conducted in 1995 that identified critical supervisory
competencies in supervisors in an organization. Compiling the competencies defined in the
research team 40 along with the recommended competencies in construction project
managers as identified in RT 306, the research team members narrowed down from a list
of hundred and fifty skills to ten desired competencies. It is also important to note that
along with identifying the core competencies from available Literature, the list consisted
of competencies as defined by competency assessment criteria used within the
organizations of the members of the research team. As a result of several iterations within
the research team members, the list of core competencies as identified by the research team
are as follows:
1) General Construction Knowledge
2) Trade Specific Knowledge
3) Verbal Communication
4) Written Communication
5) Pre-Planning
6) Problem Solving
7) Ethical Value System
8) People Management
9) Leadership
10) Proactive and Goal Driven

22
Each of the above-stated core competencies consists of a list of sub-tasks and
responsibilities that are different in scope for both Foremen and General Foremen. For
example; in pre-planning, Foremen responsibilities include setting crews and goals to
identify daily production tasks and requirements whereas, General Foremen tasks are set
on a broader scale and involve multiple crews and a schedule for several weeks. Each of
the above competency is important for both Foremen and General Foremen, however, the
scope of application varies between each of them. Table 1 below presents a detailed list of
tasks and responsibilities for each of the ten competencies for both Foremen and General
Foremen. This table explains the scope of each of the stated competencies identifying the
Foremen and General Foremen definition, side by side, to explain the perspective of the
research team in creating a comprehensive list of the desired competencies. It is important
to note here that for competencies including 7. Ethical, 9. Leadership, and 10. Proactive
and Goal Driven, there are no sub-tasks or examples included in the list as the team believes
that the above-said competencies are self- explanatory.

23
Table 1 Foremen and General Foremen Competencies- Detailed responsibilities and
scope
Skills/ Competencies Foreman Definition General Foreman Definition
1. General Construction Knowledge
Incident prevention
(Safety Management)
Daily / Specific to work area
hazard analysis / Crew monitoring
/ coaching
Broader view, holding Foreman
accountable, writing JSA / PTA,
Auditing Process
How well do you
prepare daily area hazard
analysis
Maintaining good
housekeeping on the job
Specific to work area Broader work area for all crews
2. Trade Specific Knowledge
Maintain quality of
production
Similar to GF -
Quality control
procedures
Implements procedure Understands QC overall plan and
assigns individual pieces of plan to
Foremen for implementation
Determine work access
needs and availability
Identify need of access to work Identify best form of access for work
site
3. Verbal Communication
Ability to explain tasks Ability to get craft to understand Ability to lay out broader plan
Ability to give concise,
complete and accurate
instructions
Ability to get craft to understand Ability to lay out broader plan
Communicating with
other Supervisors
Ability to get accurate
information to GF and receive
instruction of plan. Coordination
with other craft Foreman
Ability to speak with Management
clearly and provide clear
communication to Foreman.
Coordination with other craft Foreman
4. Written Communication
Develop, Write, monitor
and maintain pre-task
plans
Use of Foreman's card to identify
daily task analysis in more detail
than what is shown on a JSA/PTA
Development of JSA / PTA spelling
out all tasks, hazards, and hazard
solutions.
5. Pre Planning
Setting and Knowing
current priorities
Set for crews on daily basis Set for all crews

24
Table 1 contd. Skills/ Competencies Foreman Definition General Foreman Definition
Pre Planning contd.
Managing time (using
scheduled hours
efficiently)
Daily / task oriented Ability to multitask / coordination with
other disciplines / broader scope
Planning and scheduling
production
Setting goals for crews for
daily production of tasks
Understanding productivity rates and
planning work to crew size and schedule
for several weeks
Maintain an adequate
workforce
Manages craft workers to get
most out of them.
Recommending increase or
decrease in workforce.
Identify size of workforce based on
experience and expected production.
Will monitor overall productivity of
crews to ensure meeting schedule and
budget.
6. Problem Solving
Ability to anticipate and
avoid problems
Challenges and opportunities
with task / craft
Problems with sequence / process /
manpower, material & equip availability
/ inter-discipline activity conflicts
Ability to recognize job
conditions / signals that
should prompt action
Challenges and opportunities
with task / craft
Problems with sequence / process /
manpower, material & equip availability
/ inter-discipline activity conflicts
Knowing how and why to
take actions
Relative to scope (problems
and opportunities) - specific
vs. broader for GF
Relative to scope (problems and
opportunities) - specific vs. broader for
GF
Ability to be introspective
and examine oneself
Emotional Quotient Expect GF to better at it
Evaluate new employees
to identify strengths and
weaknesses
Craft level Foreman and Craft level
Willingness to learn,
participate, and show
improvement
Similar to GF
-
Willingness to take
responsibility and be
accountable when
necessary
- -
Willingness / ability to
positively influence others
by reasoning with them
- -
Willingness / ability to
take proactive measures to
avert or mitigate problems
- -
7. Ethical Skills (Trustworthy, fair, empathetic, and even handed)
8. People Management (Task assignments, delegating, conflict resolution, discipline)

25
Table 1 contd. Skills/ Competencies Foreman Definition General Foreman Definition
People Management contd.
Assigning people tasks that match
their skills and aspirations
Specific to craft and
crew
Foreman level
Ability to properly solicit and use
others’ opinions and ideas
Specific to craft and
crew
Foreman level
Managing work behavior of crew
members
Specific to craft and
crew
Foreman level
Influence overtime and related
crew fatigue
Identify when
crew/craft are
ineffective
Identify when crew/craft are ineffective
- know when to elevate / take action
9. Leadership
10. Proactive and Goal Driven
After defining the list of core skills and competencies, the research team progressed
with data collection. The above list of core competencies was then distributed across
superintendents and related personnel in North America (U.S. and Canada) in an online
survey generated on a platform known as Qualtrics. The data collection effort electronically
started in the Summer of 2016 to maintain the confidentiality of the respondents. The
categories of respondents as identified in the survey are as follows:
1) Site Manager
2) Construction Manager
3) General Superintendent
4) Craft Superintendent
5) Project Manager
6) Project Director
7) Others

26
The importance to the productivity of the above-stated competencies was
established with a 6 point Likert scale. The ratings included the following (1 No
Importance, 2 Limited, 3 Slight, 4 Moderate, 5 High, 6 Extremely High Importance).
Superintendents and related personnel responded to ascertain importance to productivity
for both F and GF. The reason for preferring a 6-point scale is that studies emphasize that
data from Likert scales becomes significantly inaccurate when the scale points are below
5 or above 7 points. The reason for not choosing 5 or 7 point scale is that the respondents
feel comfortable in selecting the middle value in such cases and hence make the results
insignificant. The scale is as follows:
Figure 2 Likert scale- Importance of competencies
The research defines the importance to competencies on a 6-point scale. The ratings
included the following (1 Inadequate/ Quite low, 2 Fair/ needs improvement, 3 Adequate/
neither low nor high, 4 Good- above average/ slightly high, 5 Very good/ quite high, 6
Excellent/ extremely high. To reinforce the findings from Superintendents and related
personnel surveys on construction sites in North America (U.S. and Canada) were also
asked to respond to the same question. An important distinction to be noted here is that GF
surveys were distributed manually across construction sites maintaining the confidentiality

27
of respondents. It was deemed necessary to increase the response rate considering that all
GFs do not necessarily have access computer at their workplace.
Figure 3 Likert scale- Current level of Competencies
After defining the Likert scales, the research team identified the survey population
and ways to collect data. The surveys were distributed electronically to superintendents
and managers with craft knowledge including site managers, construction managers,
superintendents and project directors. The data collection effort commenced in the Summer
of 2016. Before distributing the surveys, the electronic link to the survey was distributed
within the internal network of participating team members to understand the areas of
concern that might arise when the survey is distributed electronically to a larger audience.
The surveys were created in an online platform Qualtrics. Qualtrics is a survey tool that is
widely used in Social Sciences research and is an accepted medium to conduct statistical
research in the University of Texas at Austin. Qualtrics survey tool provided detailed
reports that along with providing the surveys as filled by each of the respondents, provided
consolidated reports to analyze and compare data as considered necessary by the research
team. Overall, an approach including statistical analysis of surveys reinforced with
interviews across sites in North America collectively helped in establishing the research
findings. It was found necessary to include both quantitative and qualitative analysis to

28
substantiate the findings. The sections below would explain the process utilized in
competencies assessment.
After a successful pilot of the survey, the team distributed the surveys to the
participating CII members. 61 Owner and 64 companies were screened to identify the
participating companies to distribute the surveys electronically. The liaisons from target
companies were contacted and recruited as a part of data collection efforts. RT330 is
greatly obliged to the enthusiasm of CII member companies to help in data collection
efforts.
Data analysis included analyzing mean scores and distribution of responses for each
of the ten identified competencies for both importance and measurement for Foremen and
General Foremen. The section below provides the list of competencies along with mean
scores and percentages of distribution. By mean scores and distributions, the research team
identified areas of improvement for both Foremen and General Foremen. This chapter
provides industry-specific recommendations by statistical analysis of results.
RESULTS
A total of 72 respondents identified themselves as superintendents and managers
with craft knowledge in the survey. The respondents included 7 site managers, 5
construction managers, 12 general superintendents, 26 craft superintendents, 12 project
managers, one project director, and nine others. 5 out of 9 respondents in the Others
category identified themselves as QA/QC welding manager, technical services manager,
area manager, warehouse manager, and division manager.The chart below gives a breakup
of the number of respondents. 53 % of respondents are general and craft superintendents.

29
Figure 4 Superintendent survey- Respondents by role in the organization
The 10 competencies identified by the research team are found to be important to
both F and GF. The data analysis effort included calculating averages of responses by
Superintendents and Managers of craft knowledge. The ratings included in the 6-point
survey scale are, 1 No Importance, 2 Limited, 3 Slight, 4 Moderate, 5 High, 6 Extremely
High Importance. Importance rating averages are in Table 2 below. The lowest score for
Foremen (F) is 4.45, and lies halfway between moderate and high importance, whereas the
lowest score for General Foremen (GF) is 4.93, between moderate and high importance
and tending towards high importance. In all cases, GF importance score is more than F.
The top 5 competencies for F are ethical value system (5.46), trade specific knowledge
(5.29), leadership (5.28), proactive and goal driven (5.24), and verbal communication
(5.17). The top 5 competencies for GF are ethical value system and trade specific
10%
7%
17%
36%
17%
1%12%
Respondents per role in organization
Site Manager
Construction Manager
General Superintendent
Craft Superintendent
Project Manager
Project Director
Other

30
knowledge (5.58), leadership and pre-planning (5.57), proactive and goal driven and people
management (5.53), verbal communication (5.43) and problem-solving (5.37). Hence, top
5 competencies are same for both F and GF and all but 2 competencies rank in top 5 for
GFs. With a mean score between 4 to 6 for each of the competencies defined by the research
team for both Foremen and General Foremen, the research team concluded that all the
proposed competencies are important in productive frontline supervisors.
Table 2. Competency Averages- Importance- Foremen and General Foremen (1-6 scale)
Competency Foremen General Foremen
General Construction Knowledge 4.73 5.32
Trade Specific Knowledge 5.29 5.58
Verbal Communication 5.17 5.43
Written Communication 4.45 4.93
Pre-Planning 5.12 5.57
Problem Solving 4.87 5.37
Ethical Value System 5.46 5.58
People Management 5.15 5.53
Leadership 5.28 5.57
Proactive and Goal Driven 5.24 5.53

31
As seen in Table 3 below, the percentage of respondents in the range of 1 to 3 ( No
importance to slight importance) is below 10 % for all competencies, but written
communication for F. Maximum standard deviation is 0.98 for written communication.
Another important observation is that only 1% of the respondents believe that out of the
proposed list of competencies, are of limited importance (Likert point scale 2). 90 % of
respondents believe that proposed competencies are within moderate and extremely high
importance (Likert point scale 4-6) for all competencies but written communication. 85 %
of respondents believe that written communication is within Likert point scale 4 and 6.
Hence, overall the list of competencies as proposed are importance in increasing
performance of F.
As seen in Table 4 below, the percentage of respondents in the range of 1 to 3 ( No
importance to slight importance) is below 5 % for all competencies but written
communication for GF. The maximum standard deviation is 1.13 for written
communication. Another important observation is that only 1% of the respondents believe
that out of the proposed list of competencies, are of limited importance (Likert point scale
2) ). 95 % of respondents believe that proposed competencies are within moderate and
extremely high importance (Likert point scale 4-6) for all competencies but written
communication. 90 % of respondents believe that written communication is within Likert
point scale 4 and 6. Hence, overall the list of competencies as proposed are importance in
increasing performance of GF. Another important observation for both Foremen and
General Foremen is that the maximum number of respondents who rated them with regards
to the importance of maintaining performance is 76 for Pre-Planning for both Foremen and

32
General Foremen. It is different from the counts of respondents who self-identified
themselves at the beginning of the electronic survey. The percentages given below are by
the counts presented in Tables 3 and 4.
Table 3. Competency assessment- Importance to performance- F
Competency Likert Scale (Range 1-6) Count
1 2 3 4 5 6
General Construction
Knowledge
0.0% 0.0% 4.0% 34.7% 45.3% 16.0% 75
Trade Specific Knowledge 0.0% 0.0% 0.0% 13.7% 43.8% 42.5% 73
Verbal Communication 0.0% 0.0% 8.0% 12.0% 34.7% 45.3% 75
Written Communication 0.0% 2.7% 12.0% 38.7% 30.7% 16.0% 75
Pre-Planning 0.0% 0.0% 6.6% 14.5% 39.5% 39.5% 76
Problem Solving 0.0% 1.3% 4.0% 33.3% 29.3% 32.0% 75
Ethical Value System 0.0% 0.0% 2.8% 9.7% 26.4% 61.1% 72
People Management 0.0% 0.0% 4.1% 18.9% 35.1% 41.9% 74
Leadership 0.0% 0.0% 4.0% 12.0% 36.0% 48.0% 75
Proactive and Goal Driven 0.0% 0.0% 5.3% 10.7% 38.7% 45.3% 75

33
Table 4. Competency assessment- Importance to performance- GF
Competency Likert Scale (Range 1-6) Count
1 2 3 4 5 6
General Construction
Knowledge 0.0% 0.0% 0.0% 14.7% 38.7% 46.7% 75
Trade Specific Knowledge 0.0% 0.0% 0.0% 8.2% 26.0% 65.8% 73
Verbal Communication 0.0% 0.0% 4.0% 9.3% 26.7% 60.0% 75
Written Communication 1.3% 0.0% 8.0% 22.7% 30.7% 37.3% 75
Pre-Planning 1.3% 0.0% 2.6% 6.6% 15.8% 73.7% 76
Problem Solving 0.0% 1.3% 1.3% 10.7% 32.0% 54.7% 75
Ethical Value System 0.0% 0.0% 1.4% 8.3% 20.8% 69.4% 72
People Management 0.0% 0.0% 2.7% 5.4% 28.4% 63.5% 74
Leadership 0.0% 0.0% 2.7% 6.7% 21.3% 69.3% 75
Proactive and Goal Driven 0.0% 0.0% 2.7% 6.7% 25.3% 65.3% 75
A significant finding of the research team is that competencies of F and GF are
below desired levels. The data analysis effort included calculating averages of responses
by Superintendents and Managers of craft knowledge. The ratings included in the 6-point
survey scale are, 1 Inadequate, 2 Fair, 3 Adequate, 4 Good, 5 Very Good, 6 Excellent.
Table 5 below provides competency rating.
The competencies range between adequate (3) and good (4) for foremen and good
(4) to very good (5) for general foremen. These ratings are consistent with the general

34
industry approach of promoting talented crew to be F. It is also noted during several
interviews of GF that the skill level of F is declining in the industry. Also, Industrial F are
a transient workforce, and hence, less investment is seen in the industry to recruit, retain
and train them effectively.
Table 5. Competency Averages- Competency level- F and GF (1-6 scale)
Competency Foremen General Foremen
General Construction Knowledge 3.64 4.28
Trade Specific Knowledge 4.05 4.53
Verbal Communication 3.75 4.21
Written Communication 3.29 3.92
Pre-Planning 3.56 4.20
Problem Solving 3.56 4.17
Ethical Value System 4.15 4.45
People Management 3.76 4.32
Leadership 3.85 4.38
Proactive and Goal Driven 3.81 4.24
The lowest score for F is 3.29, is between adequate and good and tends towards
adequate competency level, whereas the lowest score for GF is 3.92, between adequate and
good and tending towards good. In all cases, GF competency level is more than F. The
bottom 5 competencies for F are written communication (3.29), pre-planning and problem

35
solving(3.56), general construction knowledge (3.64), verbal communication (3.75), and
proactive and goal driven (3.81). The bottom 5 competencies for GF are written
communication (3.92), problem-solving (4.17), pre-planning (4.20), verbal communication
(4.21), and proactive and goal driven (4.24). The overall competency level for GF is more
than that for F. However, the list of competencies is the same for both F and GF. Written
communication is the lowest rated competency for both F and GF (3.29 and 3.92). Another
important observation is that for both Foremen and General Foremen the 3 competencies
with the lowest scores remain written communication, pre-planning, and problem-solving.
Considering the responsibilities on both Foremen and General Foremen and the nature of
work done on a day to day basis, these three areas which are concluded to be inadequate
shows a need for improvement in the competencies for our frontline supervisors.
In Table 6 below for Foremen, the percentage of respondents in the range of 1 to 3
(Inadequate to adequate) is in the range of 40% to 55% for all competencies but trade
specific knowledge (28.8%) and ethical value system (31.1%). Maximum standard
deviation is 1.28 for proactive and goal driven. Further, as can be seen in the table, most of
the 10 skills have a significant percentage of ratings in the inadequate and fair levels (levels
1 & 2). Similarly, only 2 competencies have 10% or more of the ratings in the excellent
level (level 6). A large percentage of responses in the range of inadequate to the adequate
range and a diminutive percentage in excellent level indicates room for improvement.
Further for F, for written communication, nearly 30 % of the F fall in the inadequate (1) to
fair zone (2). Similarly for pre-planning nearly 22 % of the F fall in the range. For problem-
solving nearly 17 % of the F fall in the range.
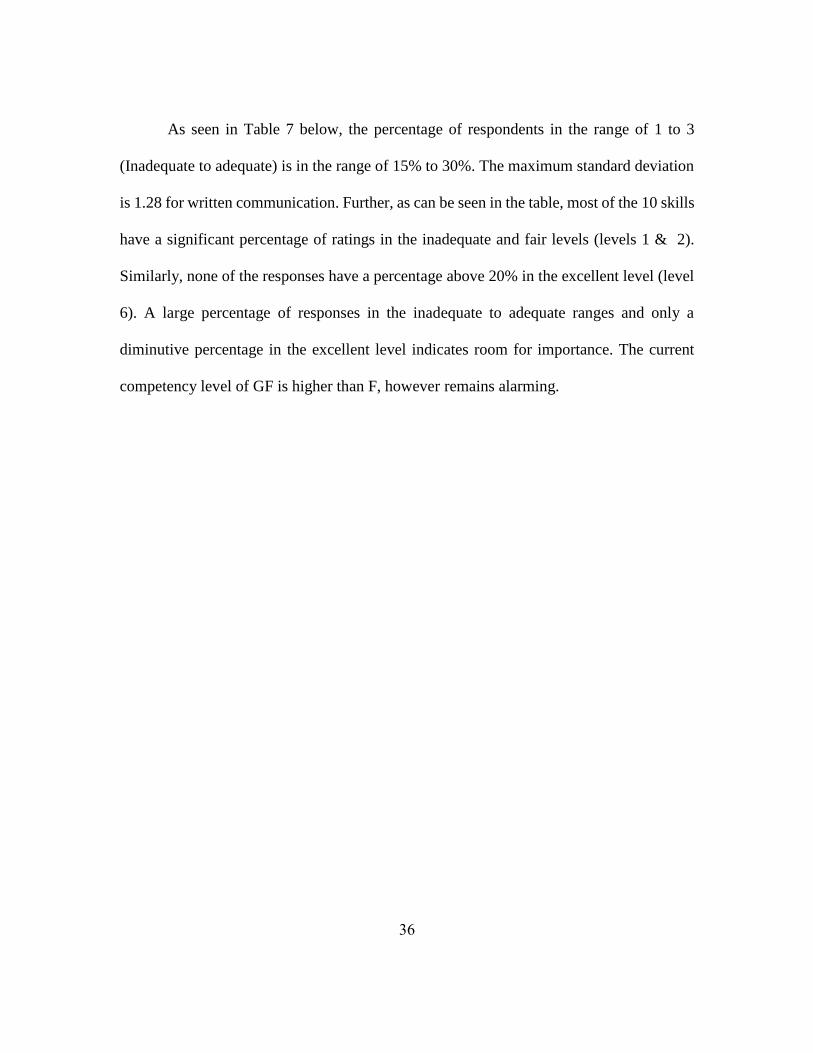
36
As seen in Table 7 below, the percentage of respondents in the range of 1 to 3
(Inadequate to adequate) is in the range of 15% to 30%. The maximum standard deviation
is 1.28 for written communication. Further, as can be seen in the table, most of the 10 skills
have a significant percentage of ratings in the inadequate and fair levels (levels 1 & 2).
Similarly, none of the responses have a percentage above 20% in the excellent level (level
6). A large percentage of responses in the inadequate to adequate ranges and only a
diminutive percentage in the excellent level indicates room for importance. The current
competency level of GF is higher than F, however remains alarming.

37
Table 6. Competency assessment- Current level- F
Competency Likert Scale (Range 1-6) Count
1 2 3 4 5 6
General Construction
Knowledge
1.4% 5.6% 40.3% 34.7% 16.7% 1.4% 72
Trade Specific Knowledge 0.0% 6.9% 21.9% 37.0% 27.4% 6.9% 73
Verbal Communication 1.4% 14.1% 23.9% 36.6% 16.9% 7.0% 71
Written Communication 5.6% 23.6% 25.0% 31.9% 9.7% 4.2% 72
Pre-Planning 1.4% 21.4% 28.6% 25.7% 14.3% 8.6% 70
Problem Solving 2.8% 14.1% 29.6% 35.2% 14.1% 4.2% 71
Ethical Value System 0.0% 4.2% 26.8% 32.4% 22.5% 14.1% 71
People Management 2.8% 11.3% 26.8% 31.0% 22.5% 5.6% 71
Leadership 0.0% 12.5% 31.9% 23.6% 22.2% 9.7% 72
Proactive and Goal Driven 1.4% 15.3% 27.8% 23.6% 20.8% 11.1% 72

38
Table 7. Competency assessment- Current level- GF
Competency Likert Scale (Range 1-6) Count
1 2 3 4 5 6
General Construction
Knowledge
0.0% 1.4% 19.7% 39.4% 28.2% 11.3% 71
Trade Specific Knowledge 1.4% 1.4% 12.3% 30.1% 37.0% 17.8% 73
Verbal Communication 0.0% 7.1% 20.0% 32.9% 24.3% 15.7% 70
Written Communication 2.8% 11.1% 23.6% 29.2% 20.8% 12.5% 72
Pre-Planning 0.0% 7.1% 24.3% 30.0% 18.6% 20.0% 70
Problem Solving 0.0% 8.3% 18.1% 33.3% 29.2% 11.1% 72
Ethical Value System 0.0% 1.4% 19.7% 28.2% 33.8% 16.9% 71
People Management 0.0% 4.2% 18.3% 36.6% 22.5% 18.3% 71
Leadership 0.0% 4.2% 25.0% 22.2% 26.4% 22.2% 72
Proactive and Goal Driven 0.0% 8.3% 20.8% 29.2% 22.2% 19.4% 72
The mean score of responses for foremen indicate that the current skills and
competencies for frontline supervisors especially foremen are week and need
improvement. It indicates a need for the industry to make a unified effort to increase the
performance of frontline supervisors by recruiting, training, and retaining them effectively.
Frontline supervisors have a significant role in supervising and motivating their crew and
this research highlights the need and challenge for the industry to assist them to be better
performers.

39
CONCLUSIONS
The results of surveys conducted have validated the hypothesis that in general,
Foremen and General Foremen competency levels in the industry are below desirable
levels. Survey data supports the hypothesis that both. It is exacerbated by the fast track
progress in industrial construction projects, increased cognitive load, and employee
management procedures. These, in turn, raise the visibility of Foremen and General
Foremen inadequacies and with it rises a concern to improve the competency level in
frontline supervisors to increase construction productivity on industrial construction
projects.
Further, three competencies including written communication, pre-planning, and
problem-solving are weak in both Foremen and General Foremen. As explained above,
considering the importance of frontline supervisors in maintaining construction
productivity and the huge number of frontline supervisors in large and complex industrial
construction projects, there is a challenge in the industry to make a unified effort to address
the challenges due to skill shortage in the leaders of the workforce.
The research identifies the 10 core competencies in productive frontline
supervisors. The competencies identified by the research are general construction
knowledge, trade specific knowledge, verbal communication, written communication, pre-
planning, problem-solving, ethical value system, people management, leadership, and
proactive and goal driven. It also establishes that the overall skills and competencies of
frontline supervisors are weak. Three competencies including written communication, pre-
planning, and problem-solving are weak and indicate room for improvement. The mean
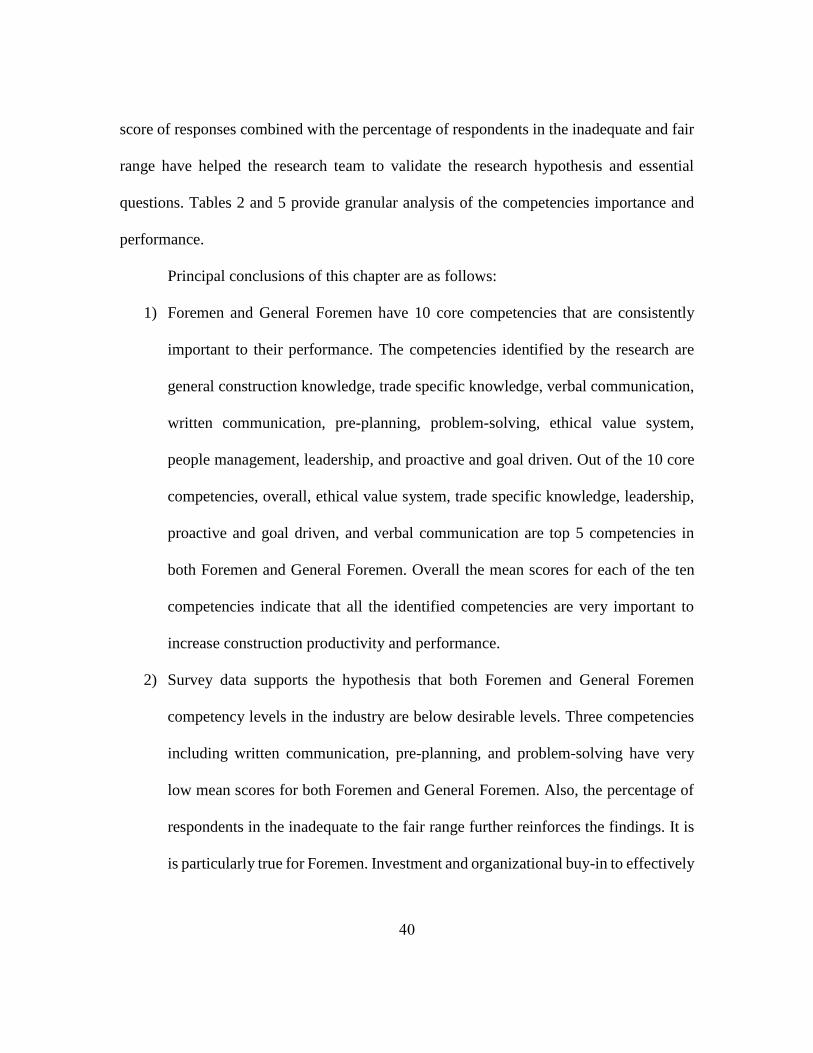
40
score of responses combined with the percentage of respondents in the inadequate and fair
range have helped the research team to validate the research hypothesis and essential
questions. Tables 2 and 5 provide granular analysis of the competencies importance and
performance.
Principal conclusions of this chapter are as follows:
1) Foremen and General Foremen have 10 core competencies that are consistently
important to their performance. The competencies identified by the research are
general construction knowledge, trade specific knowledge, verbal communication,
written communication, pre-planning, problem-solving, ethical value system,
people management, leadership, and proactive and goal driven. Out of the 10 core
competencies, overall, ethical value system, trade specific knowledge, leadership,
proactive and goal driven, and verbal communication are top 5 competencies in
both Foremen and General Foremen. Overall the mean scores for each of the ten
competencies indicate that all the identified competencies are very important to
increase construction productivity and performance.
2) Survey data supports the hypothesis that both Foremen and General Foremen
competency levels in the industry are below desirable levels. Three competencies
including written communication, pre-planning, and problem-solving have very
low mean scores for both Foremen and General Foremen. Also, the percentage of
respondents in the inadequate to the fair range further reinforces the findings. It is
is particularly true for Foremen. Investment and organizational buy-in to effectively

41
recruit, train, retain may be one of the biggest opportunities for improvement of the
construction industry productivity and performance.
3) Also, training and organizational buy-in to support training of frontline supervisors
is important to increase the performance of frontline supervisors.

42
Chapter 3: Industrial Construction Frontline Supervisors Time on
Tasks
SUMMARY
Frontline supervisors directly motivate and supervise craftsmen and are responsible
for maintaining productivity and performance on industrial construction projects. With a
complex role including a myriad of responsibilities, there is an increased cognitive demand
on the frontline supervisors. To maintain production and effectively undertake their
responsibilities including supervising and motivating their crew, it is essential to gauge key
areas where frontline supervisors spend their time on a daily basis. This chapter focuses on
identifying the crucial tasks executed by productive frontline supervisors, their respective
ideal time ranges and an assessment of time spent on industrial construction sites in North
America (The US and Canada) by surveying frontline supervisors. It also illustrates
separately time spent by specific crafts including the following crafts: Ironworkers,
Mechanical/Millwrights, Pipefitters and Welders, Electrical/Instrumentation,
Carpenters/Scaffolders, and Boilermakers. The reasoning behind performing analysis on
these crafts is that in industrial construction, these crafts have maximum influence in
supporting and maintaining production and hence are sometimes known as direct crafts.
The principal findings include frontline supervisors spend their time in wide ranges across
tasks that vary both from each other and the ideal ranges. Identification and assessment of
time spent by frontline supervisors on crucial tasks are great opportunities for improving
the performance of industrial frontline supervisors.

43
INTRODUCTION
The importance of construction foremen in motivating workers, assuring safety and
quality, and efficiently conducting work has been recognized in several studies (Senior
1996). They are a crucial link between the management and workforce (Uwakweh 2005).
They are expected to manage, plan and define work, communicate with workers, and
motivate them to perform at acceptable levels (Uwakweh 2005). Their performance has a
significant impact on the cost and schedule of industrial capital construction projects. The
dynamic and complex nature of these projects intensifies the cognitive load and
responsibilities on frontline supervisors. The need to increase predictability and
performance of industrial construction projects is reinforced by the fact that in the industrial
sector 70 % of the projects exceeded 10 % variation from the expected schedule and cost
values (Choo et al. 1999). Both owner and contractor organizations need a unified effort
to improve the performance of frontline supervisors in industrial construction.
However, the transient nature of industrial construction foremen makes it difficult
for contractors to justify the cost of investment in developmental training or performance
improvement. The research team believes that to improve the performance of industrial
construction frontline supervisors, it is imperative to understand the key areas where they
spend their time on a typical work day. An analysis of time spent and key tasks undertaken
would be useful to understand the areas which pose opportunities for the industry to
improve.
The purpose of this research is to identify the major tasks and responsibilities
undertaken by construction foremen and general foremen during a typical work day. The
44
efforts involved identifying ten and eight major tasks and responsibilities for Foremen and
general foremen respectively by utilizing a Delphi Approach. Along with identifying the
tasks, the proposed time ranges are also provided in this chapter. The ten tasks for foremen
include, attending meetings, planning and prioritizing fallback work, performing safety
related activities, completing paperwork, coordinating with other crews, supervising,
motivating, and executing, planning for future work, working on tools with the crew,
receiving and verifying materials, and moving crews to contingency work. The eight tasks
for general foremen include attending meetings, planning and prioritizing fallback work,
performing safety related activities, constraint management, following up with foremen
and crews, work package development, communicating with field engineers, and
completing progress sheets.
This chapter firstly establishes what composes a “Productive Day” for Foremen and
General Foremen. It secondly establishes that frontline supervisors in industrial
construction projects are not spending their time in the proposed ideal time ranges as
defined by the research team. The research efforts included surveying a population of
frontline supervisors on different construction sites spread demographically across North
America working in different production environments. By analyzing the responses, the
research team concluded which tasks and responsibilities reflect the areas of improvement
and pose a challenge for the industry.
Foremen tasks including task 5 “Coordinating with other crews,” task 6,
“Supervising/Motivating/Executing,” task 9 “Receiving and checking Materials,” and task
10 “Moving Crews to contingency work” are the areas which demand the industry attention
45
and pose areas for improvement. General Foremen tasks including task 2
“Planning/Prioritizing tasks,” task 4 “Constraint Management,” and task 6 “Work Package
Development” are the areas where General Foremen are spending less time than the
proposed time ranges, which is also reflected in the Foremen Time allocation. The research
team believes that identification of potential areas is crucial to increase construction
productivity and performance of frontline supervisors in industrial construction projects.
LITERATURE REVIEW
Frontline supervisors play a vital role in increasing construction productivity and
performance. They influence their crews and play a significant role in their performance.
Previous studies have elaborated on the influence of frontline supervisors on their crews and
the different tasks undertaken by them during a typical workday. Argyle et al. investigated
the effects of different styles of first-line supervision on productivity (Argyle et al. 1957).
Hinze and Kuechenmeister investigated the characteristics and common traits of productive
industrial foremen (Hinze and Kuechenmeister 1981). Lemna et al. identified characteristics
of industrial foremen and their effect on construction productivity (Lemna et al. 1986).
Maloney and McFillen identified five dimensions of foremen performance and their
relationships with worker motivation, performance, and satisfaction (Maloney and McFillen
1987). Shohet and Laufer identified the correlation of foremen time spent during a workday
with the performance of their crews (Shohet and Laufer 1991). Senior elaborated on
foremen planning behind short-term task scheduling (Senior 1996). Uwakweh identified
seven foremen scales to establish their relationship with the motivation and performance of
construction apprentices (Uwakweh 2005).

46
These studies illustrate the influence of frontline supervisors on their craftsmen and
increasing construction productivity and performance. They also illustrate that the time
spent by frontline supervisors on different tasks during a workday influences the
performance of their crew and construction productivity. However, they do not deeply
delve and elaborate on the typical work day of frontline supervisors. However, this research
identifies the tasks and responsibilities and also identifies the room for improvement by
conducting a country-wide survey of Foremen and General Foremen. Also, the wealth of
survey responses helps the research team to establish the research results and analyze the
responses across projects in the North America. The research team believes that the
research effort is important and imperative to firstly understand and then improve the
performance of frontline supervisors in industrial construction projects.
RESEARCH QUESTIONS
As illustrated in the previous section, past studies provide diminutive analysis of
typical workday of a frontline supervisor. Considering the importance of frontline
supervisors in motivating and supervising their crew, the research team puts forward the
importance to understand where do frontline supervisors spend their time on a typical work
day. This chapter elaborates on the time spent on crucial tasks by industrial construction
foremen and general foremen. Along with establishing the ideal ranges for each of the ten
crucial tasks for foremen and eight crucial tasks for general foremen, this chapter publishes
results of statistical analysis of surveys to support the research hypothesis that frontline
supervisors spend time away from the ideal time ranges as defined by the research. The
research questions addressed in this chapter are as follows:

47
1. What are the critical tasks and their corresponding ideal times executed by
productive frontline supervisors during a typical workday?
2. Where do the industrial frontline supervisors spend their time during a typical
workday and what is the difference between the proposed ideal and actual times?
RESEARCH METHODOLOGY
Use of statistical analysis to measure the performance of industrial construction
foremen is seen historically. Lemna et al. (1986) statistically determined the characteristics
which differentiated productive industrial construction foremen from less productive
industrial construction foremen by Kendall correction analysis (Lemna et al. 1986). Shohet
and Laufer established a correlation between the way a construction foreman divides his
time and the performance of his crew by performing student t-tests on a sample of
construction foremen in the US and Israel (Shohet and Laufer 1991). Warr and Bird
assessed the training needs of foremen by establishing a correlation between foremen
attitudes and their relationship with their subordinates and superiors in different
construction environments (Warr and Bird 1967). Gilmour and Lansbury identified the
training and development needs of first-line supervisors by studying the managerial
behavior of 1200 first-line supervisors (Gilmour and Lansbury 1986).
Keeping in mind, the research hypothesis and questions, the research team firstly
establsihed the tasks for both foremen and general foremen. The research team believed
that to analyze the perfromance of frontline supervisors, it was important to benchmark the
tasks and identify ideal ranges to compare the responses received. After several iterations
within the research team, firstly a list of tasks and their corresponding times was piloted
48
within a small population of respondents. The responses received convinced the research
team to simplify the approach and present proposed ranges of times within the survey, to
help respondents with their thought process and correctly identify the time ranges for tasks
on a typical work day. This established the list of tasks and their corresponding time ranges.
Foremen and General Foremen surveys are presented in Appendix 2 and 3 of this thesis
respectively. After identifying the crucial tasks and finalizing proposed ideal time ranges
or the proposed “Productive Day”, the surveys were distributed electronically and on paper
to industrial construction sites in North America. Responses were received from different
states and also represented different construction environments and trades. The
overwhelming response rate helped the research team to present the results and support the
research hypothesis. Next stage involved statistical analysis of the responses. A detailed
analysis and the evidences to support resarch hypothesis have been presented in this
chapter. Appendix 5 would present the results of detailed statistical analysis of the
responses to support the results presented in this chapter. The next section would explain
the tasks and also present in detail the survey instruments and mode of analysis.
CONTENT
The Stage 1 included identifying crucial tasks that a foreman and general foreman
should undertake ideally on a productive day. The research efforts started with developing
a survey instrument to identify the time spent by frontline supervisors on seventeen
preselected tasks. The survey was piloted, and the responses received provided evidence
that frontline supervisors did appropriately address the time spent, as the total of the
number of minutes spent on those tasks during a day did not account for the number of

49
minutes in one shift of 10 hours i.e. 600 minutes. Preliminary survey responses supported
the need to provide the respondents with fixed time ranges that would facilitate them to
answer the questions by choosing amongst three available options rather than summing up
the time allotted to activities during a typical workday.
The second iteration involved finalizing ten crucial foremen tasks and eight crucial
general foremen tasks on a typical work day of an industrial construction site. The Delphi
method was used to identify and finalize the above tasks. Hallowell and Gambatese defined
the Delphi method to be a systematic and interactive research technique for obtaining the
judgment of a panel of independent experts on a specific topic (Hallowell and Gambatese
2010). After multiple rounds of discussion between the expert panelists who have served
the construction industry in different production environments and a facilitator, the group
came up with the proposed tasks and their corresponding ideal percentages of time. These
percentages were finalized considering the ideal percentages to allow frontline supervisors
to focus their efforts to increase their crew productivity.
Table 8 below illustrates the ideal percentages for a “Productive day” for a foreman.
The ten crucial foremen tasks include meetings, planning for future work, safety-related
activities, completion of paperwork, coordination with other crews, supervising and
motivating their crew, receiving and verifying materials, and moving crews to contingency
work. Out of the ten tasks, on a productive day, the foremen should ideally spend maximum
time in supervising and motivating their crew. Considering that out of a typical shift time
of 10 hours; an industrial construction foreman should be ideally spending no less than 6
hours in motivating his crew. This portion of work should be where a construction Foreman
50
in industrial construction projects should be spending maximum time. Of the remaining
forty percent of the time, he should spend nearly ten percent in planning for future work.
It can be seen in Table 9 below that necessarily not all tasks might be considered as
productive tasks but are seen as a necessary evil by the members of the research team. For
example, during a typical workday Foremen should ideally spend no more than 7 % in
doing paperwork. For example in a 10 hour day, a foreman should not be spending more
than approximately half an hour in doing paperwork. Similarly, holds for checking and
verifying materials on the site, a foreman should ideally not be spending more than 10
minutes in receiving material.

51
Table 8 Foremen tasks during a "Productive Day"
Foremen Task “Productive Day”
1. Meetings – Client/Coordination/Scheduling/Look Ahead 8 %
2. Plan/Prioritize Tasks & Fallback Work (Plan “B”) 4 %
3. Safety Related Activities – Meetings/JHA
Development/Inspections/Action Items/Sign/Review
FLHAs
2 %
4. Complete Paperwork 7 %
5. Coordinate with other Crews/Support 2 %
6. Supervise/Motivate/Execute 60 %
7. Plan for Future Work 10 %
8. Work on Tools with Crew 3 %
9. Receive/Check/Verify Materials in Area 2 %
10. Move Crews to Contingency Work 2 %
Figure 5 below depicts the same data in the form of a pie chart. Previous literature
divides time into productive and non-productive days. However, a detailed and granular
analysis which asks the frontline supervisors to self-report where they are spending their
time on a typical work day has not been done in the past. The intent of the research team
was to provide a detailed analysis which would help in identification of specific areas of
concern and assist in specific action items and recommendations to the industry.
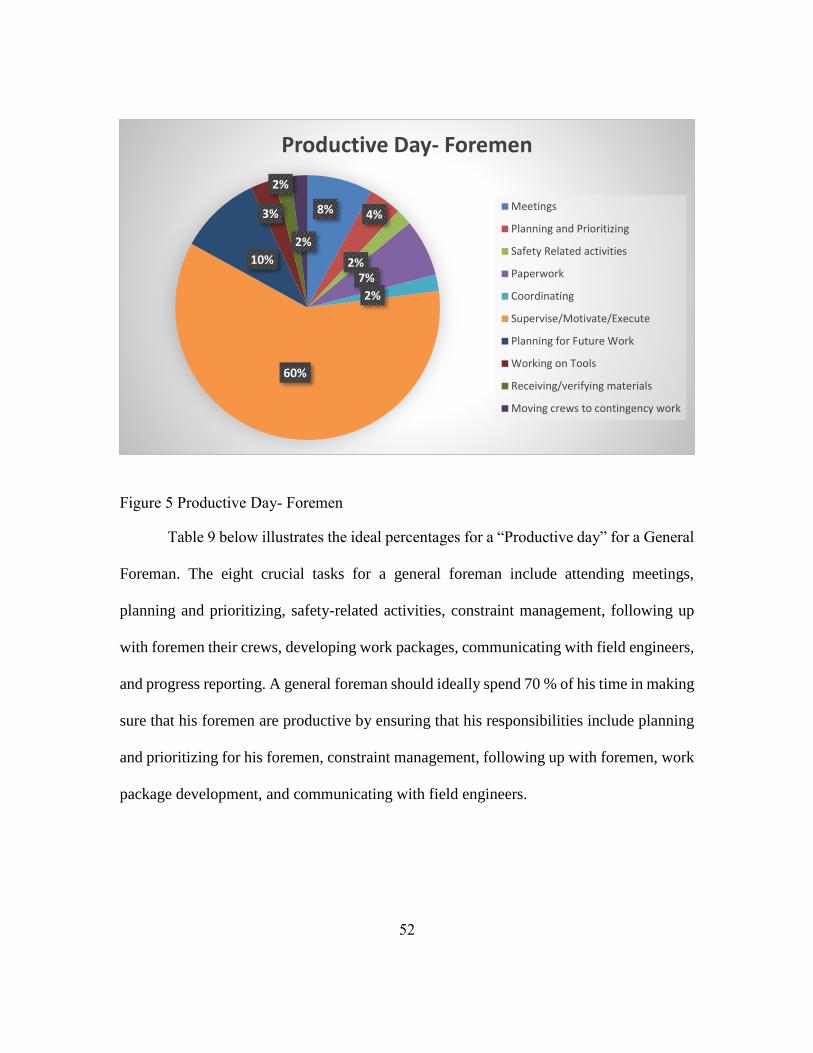
52
Figure 5 Productive Day- Foremen
Table 9 below illustrates the ideal percentages for a “Productive day” for a General
Foreman. The eight crucial tasks for a general foreman include attending meetings,
planning and prioritizing, safety-related activities, constraint management, following up
with foremen their crews, developing work packages, communicating with field engineers,
and progress reporting. A general foreman should ideally spend 70 % of his time in making
sure that his foremen are productive by ensuring that his responsibilities include planning
and prioritizing for his foremen, constraint management, following up with foremen, work
package development, and communicating with field engineers.
8% 4%
2%7%
2%
60%
10%
3%
2%
2%
Productive Day- Foremen
Meetings
Planning and Prioritizing
Safety Related activities
Paperwork
Coordinating
Supervise/Motivate/Execute
Planning for Future Work
Working on Tools
Receiving/verifying materials
Moving crews to contingency work

53
Table 9 General Foremen tasks during a "Productive Day"
General Foremen Task “Productive Day”
1. Meetings – Client/Coordination/Scheduling/Look Ahead 20 %
2. Plan/Prioritize Tasks & Fallback Work (Plan “B”) with
Foremen
10 %
3. Safety Related Activities – Meetings/JHA
Development/Inspections/Action Items/Sign/Review
FLHAs
7 %
4. Constraint Mgt. – Ensure FM has all Crane
support/crane/scaffold/Material/Equipment
12 %
5. Follow up with FM & Crews Throughout Day – Work
Area Reviews/Productivity Check in Field
25 %
6. Work Package Development – Model Review/FIWP
Review/FIWP Schedule/Close-Out FIWPs
15 %
7. Communicate with Field Engineers – Develop Estimates
for Extra Work/RFIs
5 %
8. Complete Progress/Timesheets/Forecasts/Review
Installed Quantities/Cost Codes
6 %
Figure 6 below depicts the same data in the form of a pie chart. Previous literature
divides time into productive and non-productive days. However, a detailed and granular
analysis which asks the frontline supervisors to self-report where they are spending their
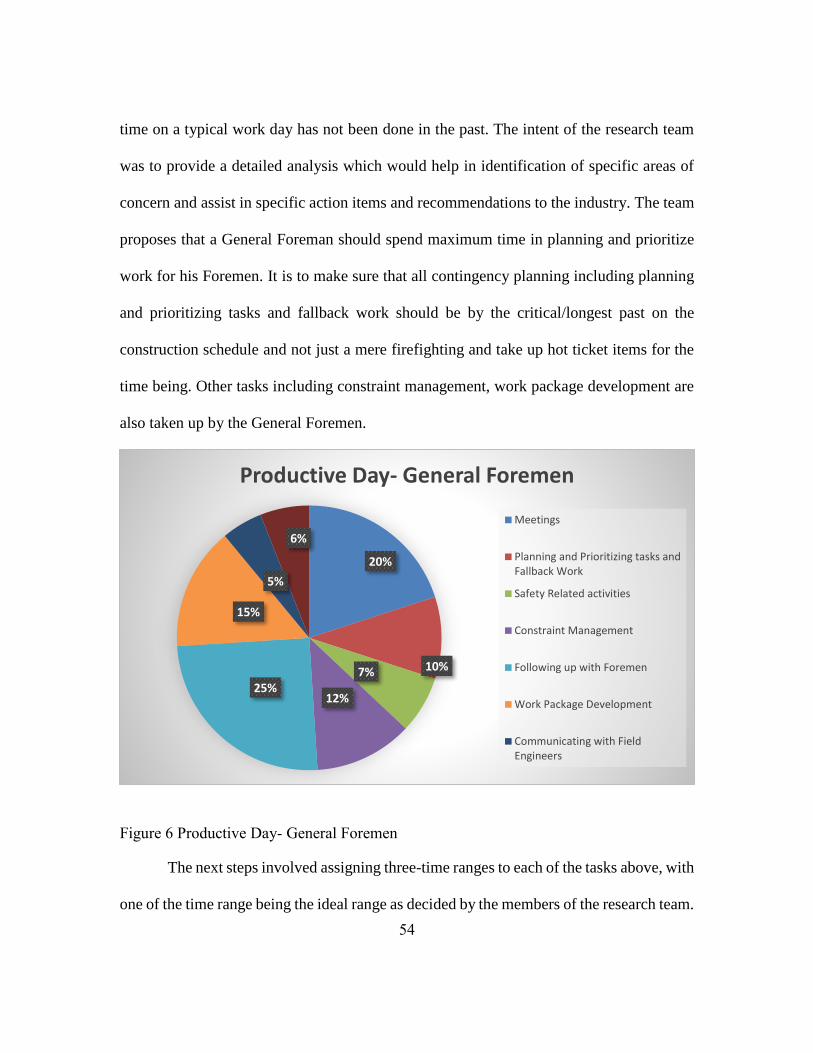
54
time on a typical work day has not been done in the past. The intent of the research team
was to provide a detailed analysis which would help in identification of specific areas of
concern and assist in specific action items and recommendations to the industry. The team
proposes that a General Foreman should spend maximum time in planning and prioritize
work for his Foremen. It is to make sure that all contingency planning including planning
and prioritizing tasks and fallback work should be by the critical/longest past on the
construction schedule and not just a mere firefighting and take up hot ticket items for the
time being. Other tasks including constraint management, work package development are
also taken up by the General Foremen.
Figure 6 Productive Day- General Foremen
The next steps involved assigning three-time ranges to each of the tasks above, with
one of the time range being the ideal range as decided by the members of the research team.
20%
10%7%
12%25%
15%
5%
6%
Productive Day- General Foremen
Meetings
Planning and Prioritizing tasks andFallback Work
Safety Related activities
Constraint Management
Following up with Foremen
Work Package Development
Communicating with FieldEngineers
55
For each of the crucial tasks, the three time ranges for all of the ten and eight tasks
respectively for foremen and general foremen are defined in Tables 10 and 11 below. The
time ranges highlighted in yellow correspond to the percentages as defined in Tables 8 and
9 and hence are the proposed ideal time ranges as defined by the research team. For
instance, a foreman should ideally spend 60 percent of his time in supervising and
motivating his crew. Considering, a typical day of usually 8 or 10 hours, 60 % would
correspond to a time range of 5-6 hours, as defined as the ideal range for this sub-task in
Table 10. The team performed an analysis on all ten foremen tasks considering a typical
shift time of 10 hours to reinforce the ideal time ranges. To pick up a category randomly
for a General Foreman, as per percentages are given in Table 9, a General Foreman should
ideally spend 25 % of his time on following up with his foremen and their crews. In a
typical day of 8 or 10 hours, 25 % would correspond to a time range of 2-2.5 hours, as
defined as the ideal range for this sub-task in Table 11. The team performed an analysis on
all eight general foremen tasks considering a typical shift time of 10 hours to reinforce the
ideal time ranges. The tables below are valid for all 8,10, and 12 hour days on an industrial
construction site for both Foremen and General Foremen.

56
Table 10 Foremen tasks during a "Productive Day"- Ideal ranges
Task Minutes/Hours Per Day Spent
1. Meetings –
Client/Coordination/Scheduling/Look
Ahead
15-60
mins. 1.5-2 hrs. 2-4 hrs.
2. Plan/Prioritize Tasks & Fallback Work
(Plan “B”)
0-30
mins.
45-90
mins. 2-3 hrs.
3. Safety Related Activities – Meetings/JHA
Development/Inspections/Action
Items/Sign/Review FLHAs
0-15
mins.
30-60
mins. 1.5-3 hrs.
4. Complete Paperwork 10-25
mins.
30-60
mins.
65-90
mins.
5. Coordinate with other Crews/Support 0 mins. 5-15
mins.
16-25
mins.
6. Supervise/Motivate/Execute 4 hrs.
or less 5-6 hrs.
8 hrs.
or more
7. Plan for Future Work 15-35
mins.
45-1.25
hrs. 1.5-2 hrs.
8. Work on Tools with Crew
0-15
mins. 15-45
mins. 1-2 hrs.
9. Receive/Check/Verify Materials in Area 0 mins. 5-15
mins.
16-25
mins.
10. Move Crews to Contingency Work 0 mins. 5-15
mins.
16-25
mins.
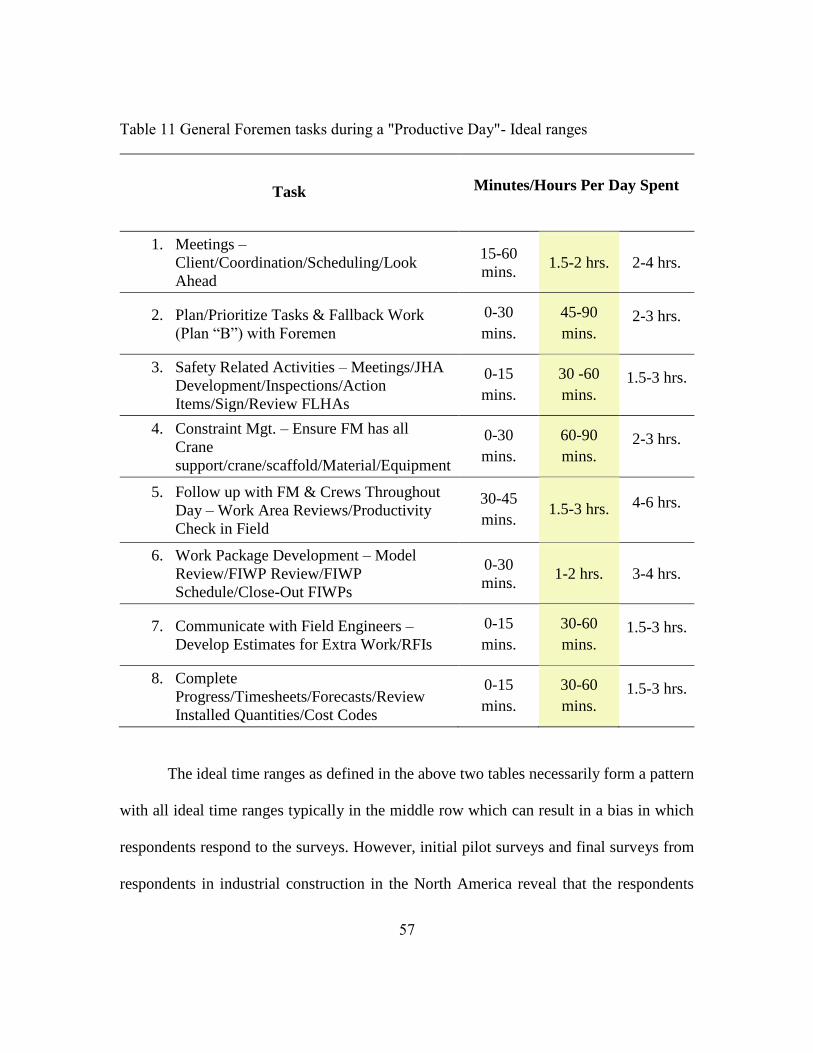
57
Table 11 General Foremen tasks during a "Productive Day"- Ideal ranges
Task
Minutes/Hours Per Day Spent
1. Meetings –
Client/Coordination/Scheduling/Look
Ahead
15-60
mins. 1.5-2 hrs. 2-4 hrs.
2. Plan/Prioritize Tasks & Fallback Work
(Plan “B”) with Foremen
0-30
mins.
45-90
mins. 2-3 hrs.
3. Safety Related Activities – Meetings/JHA
Development/Inspections/Action
Items/Sign/Review FLHAs
0-15
mins.
30 -60
mins. 1.5-3 hrs.
4. Constraint Mgt. – Ensure FM has all
Crane
support/crane/scaffold/Material/Equipment
0-30
mins.
60-90
mins. 2-3 hrs.
5. Follow up with FM & Crews Throughout
Day – Work Area Reviews/Productivity
Check in Field
30-45
mins. 1.5-3 hrs. 4-6 hrs.
6. Work Package Development – Model
Review/FIWP Review/FIWP
Schedule/Close-Out FIWPs
0-30
mins. 1-2 hrs. 3-4 hrs.
7. Communicate with Field Engineers –
Develop Estimates for Extra Work/RFIs
0-15
mins.
30-60
mins. 1.5-3 hrs.
8. Complete
Progress/Timesheets/Forecasts/Review
Installed Quantities/Cost Codes
0-15
mins.
30-60
mins. 1.5-3 hrs.
The ideal time ranges as defined in the above two tables necessarily form a pattern
with all ideal time ranges typically in the middle row which can result in a bias in which
respondents respond to the surveys. However, initial pilot surveys and final surveys from
respondents in industrial construction in the North America reveal that the respondents

58
responded over a wide range of responses different from each other and the ideal time
ranges. The surveys were carefully constructed and piloted to provide useful answers that
could also easily be responded. The ideal time ranges are proposed to apply equally to all
production environments including Advanced Work Packaging (AWP), traditional, and
maintenance environments. AWP is a disciplined approach to improving project
productivity and predictability by aligning planning and execution activities throughout the
project lifecycle, from project set-up to start-up and turnover (Construction Industry
Institute 2013a)
Stage 2 commenced with the beginning of data collection efforts. Representatives
were contacted on industrial sites in North America to recruit them to distribute surveys on
their respective industrial sites. In this process, the representatives distributed chapter-
based surveys to the respondents, maintaining the confidentiality of respondents.
A total of 1135 responses (812 Foremen, 323 General Foremen) responded from
the sites across North America. Of them, 240 responses from Advanced Work Packaging/
Workface Planning (AWP/WFP), with 188 Foremen and 52 General Foremen. 631
responses from traditional sites with 438 Foremen and 193 General Foremen. 264
responses from Maintenance sites, with 186 Foremen and 78 General Foremen. Out of
these responses including crafts Ironworkers, Mechanical/Millwrights, Pipefitters,
Electrical/Instruments, Carpenters/Scaffolders, and Boilermakers, a total of 787 responses
out of which 577 were Foremen, and 210 were General Foremen. The research received a
wide range of projects including petrochemical projects, power plant projects, and
chemical plant projects. Respondents from a total of 24 projects in Canada, Central US,
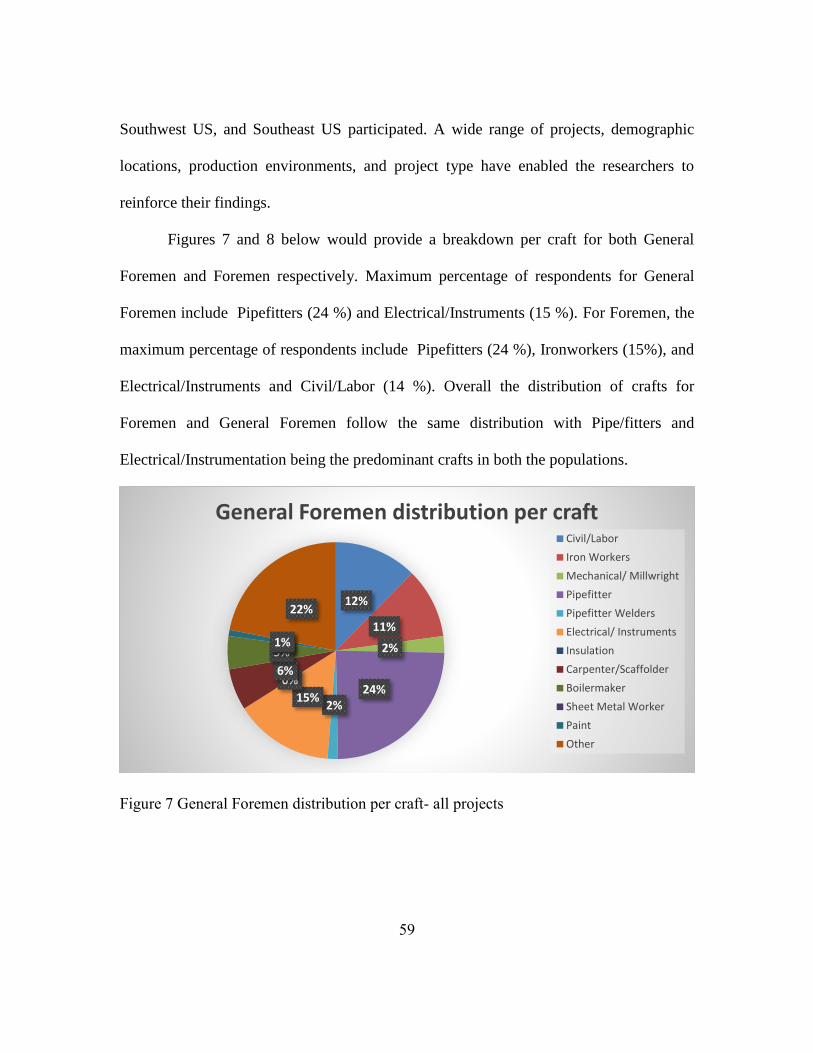
59
Southwest US, and Southeast US participated. A wide range of projects, demographic
locations, production environments, and project type have enabled the researchers to
reinforce their findings.
Figures 7 and 8 below would provide a breakdown per craft for both General
Foremen and Foremen respectively. Maximum percentage of respondents for General
Foremen include Pipefitters (24 %) and Electrical/Instruments (15 %). For Foremen, the
maximum percentage of respondents include Pipefitters (24 %), Ironworkers (15%), and
Electrical/Instruments and Civil/Labor (14 %). Overall the distribution of crafts for
Foremen and General Foremen follow the same distribution with Pipe/fitters and
Electrical/Instrumentation being the predominant crafts in both the populations.
Figure 7 General Foremen distribution per craft- all projects
12%
11%
2%
24%2%
15%
0%6%
5%0%1%
22%
General Foremen distribution per craftCivil/Labor
Iron Workers
Mechanical/ Millwright
Pipefitter
Pipefitter Welders
Electrical/ Instruments
Insulation
Carpenter/Scaffolder
Boilermaker
Sheet Metal Worker
Paint
Other

60
Figure 8 Foremen distribution per craft- all projects
Stage 3 involved analysis of responses for each of the ten and eight categories for
both Foremen and General Foremen. The analysis was done in two steps, first for all
projects and all crafts. The second part of the analysis was performed only for crafts
mentioned in the section above including Iron Workers, Mechanical/Millwrights,
Pipefitters and Welders, Electrical and Instrumentation, Carpenters, and Boilermakers. A
separate analysis for these crafts was performed to understand better how these crafts spend
their time. The reasoning behind performing a separate analysis for these crafts is that they
are directly involved and share more responsibility to increase performance and
productivity in industrial construction projects.
The next stage involved providing industry specific recommendations based on the
findings of the analysis of surveys. The suggestions and recommendations are for both
owners and contractors specific to industrial construction projects. The RT 330 research
team identifies that the time spent and productive day suggestions typically apply to
13%
14%
3%
24%3%13%
1%
9%
6%1%0%
13%
Foremen distribution per craftCivil/Labor
Iron Workers
Mechanical/ Millwright
Pipefitter
Pipefitter Welders
Electrical/ Instruments
Insulation
Carpenter/Scaffolder
Boilermaker
Sheet Metal Worker
Paint
Other

61
industrial construction projects, however, may have applicability to commercial and heavy
civil construction projects.
RESULTS
The researchers analyzed the responses from 1135 frontline supervisors on
industrial projects to account for how they spend their day. The survey results indicate that
there is a great variation in how frontline supervisors spend their time on the 10 and 8
Foremen and General Foremen tasks respectively as described in the above sections.
Foremen and General Foremen indicate that they spend their day in a wide spread
of times that vary considerably from the ideal. Table 12 shows percentages in each of the
ranges for Foremen surveyed, representing approximately 800 respondents. Further, the
reasoning behind the observation that all not rows for the ten categories total up to 812 that
is the total number of respondents is because all of the respondents did not respond to each
of the category listed in the survey. It illustrates that a significant percentage of Foremen
could be allocating time more productively. While the researchers expected some spread
in a survey, widespread of percentages indicates significant opportunities for improvement.
As highlighted in Table 12, Considering Task 6, “Supervise/Motivate/Execute”, findings
indicate that 24 % of the respondents spend 4 hours or less on this task when the ideal is 5-
6 hours (8 hours or more is not seen as ideal- while not necessarily not a wrong thing to
spend more time in the field with the crew, too much time on one task takes time from
other valuable efforts). It is evident from this finding that nearly a quarter of foremen are
spending less than 4 hours in supervising and motivating their crew. With evidence that a
construction foremans main responsibility includes maintaining production and

62
supervising their crew, this finding indicates a challenge and room for improvement. For
other tasks including Task 5, “Coordinate with other Crews/ Support,” Task 9
“Receive/Check/Verify Materials in Area,” and Task 10 “Move Crews to Contingency
Work” majority foremen spend 16-25 minutes were they should not be spending more than
5-10 minutes in each task. For task 5 “Coordinate with other crews/support” nearly half of
the respondents are spending more time than the ideal time range as proposed by the
research team. Corresponding percentages of time spent by General Foremen in tasks
including constraint management and work package development which is in detail in
Table 13, definitely indicate a misbalance in the distribution of responsibilities between
Foremen and General Foremen. Similarly, 55 % of Foremen spend more time than the
proposed ideal time range by the team in receiving, checking, and verifying the material.
Increased problems in the quality and availability of construction material, as would be
discussed in the section of production impediments can be a testimony to this.

63
Table 12 Percent of Foremen responding in each range (ideal range is shaded)
Foremen Tasks Count
1. Meetings Client/Coordination/Scheduling/Look
Ahead
68.1% 26.5% 5.4% 803
2. Plan/Prioritize Tasks & Fallback Work (Plan B) 50.4% 43.7% 5.9% 794
3. Safety Related Activities/ Meetings/Job Hazards
Analysis (JHAs) Development/Inspections/Action
Items/Sign/Review
19.5% 72.4% 8.2% 810
4. Complete Paperwork 29.4% 52.6% 18.0% 812
5. Coordinate with other crews/support 2.4% 47.1% 50.5% 802
6. Supervise/ Motivate/ Execute 24.1% 36.5% 39.4% 803
7. Plan for Future Work 33.7% 49.9% 16.4% 793
8. Work on Tools with Crew 40.8% 33.8% 25.4% 802
9. Receive/ Check/ Verify Materials in Area 5.4% 39.7% 55.0% 802
10. Move Crews to Contingency Work 6.8% 50.3% 43.0% 796
Table 13 shows percentages in each of the ranges for General Foremen surveyed
across all projects, representing nearly 300 respondents. Similarly, for General Foremen,
all the rows corresponding to each of the eight General Foremen tasks does not total up to
the total number of respondents as 323. It illustrates that a significant percentage of General
Foremen could be allocating time more productively. While the researchers expected some

64
spread in a survey, widespread of percentages indicates significant opportunities for
improvement.
Table 13 Percent of General Foremen responding in each range (ideal range is shaded)
General Foremen Tasks Count
1. Meetings Client/Coordination/Scheduling/Look Ahead 49.5% 36.1% 14.3% 321
2. Plan/Prioritize Tasks & Fallback Work (Plan B) 28.9% 53.7% 17.4% 322
3. Safety Related Activities Meetings/Job Hazards Analysis
(JHAs) Development/Inspections/Action Items/Sign/Review
Field Level Hazard Assessments (FLHAs)
12.7% 74.9% 12.4% 323
4. Constraint Management Ensure Foreman has all Crane
support/scaffold/material/equipment
47.9% 38.7% 13.4% 313
5. Follow up with Foreman & Crews Throughout Day Work
Area Reviews/Productivity Check in Field
18.3% 47.8% 33.9% 322
6. Work Package Development Model Review/Field
Installation Work Package (FIWP) Review/FIWP
Schedule/Close-Out FIWPs
49.7% 45.8% 4.6% 308
7. Communicate with Field Engineers Develop Estimates
for Extra Work/Request For Information’s (RFIs)
33.7% 53.2% 13.1% 312
8. Complete Progress/Timesheets/Forecasts/Review
Installed Quantities/Cost Codes
12.9% 70.0% 17.0% 317
On Task 4 for General Foremen- “Constraint Management- Ensure Foreman has
all crane support/scaffold/material/equipment, 48 % of the respondents indicate that they
spend time between 0 and 30 minutes a day performing. The ideal range for this task is 60-

65
90 minutes, In this case, the data indicates that there is a great opportunity for the General
Foremen to spend more time in ensuring that constraints are resolved for Foremen and their
crews to be more productive.
The research team infers that the General Foremen are not performing this task
which in turn puts more burden on Foremen, which may be why for example, 55 % of
foremen spend time in the highest time range for Task 5 and Task 9 as captured in the
paragraph above. Similarly for Task 2 “Plan/ Prioritize Tasks and Fallback Work (Plan B)”
60 % of the respondents answer in the highest two-time ranges. Similarly for Task 6 “Work
package development,” 50 % of the General Foremen spend less time than the proposed
ideal range by the research team. Foremen struggle in maintaining production due to
inefficient engineering drawing management and information missing on the drawings.
When General Foremen spend less time than the proposed time ranges by the research team
in work package development, a considerable number of Foremen (24 %) spend less time
than the proposed ideal ranges in supervising and motivating the crew. The main purpose
of the research is to identify the key areas of improvement for both Foremen and General
Foremen along with the external impediments to production.
The next stage in the analysis included aggregating responses from crafts including
Ironworkers, Mechanical/Millwrights, Pipefitters/Welders, Electrical Instruments,
Carpenter/Scaffolders, and Boilermakers. Table 14 below shows the percentage of
Foremen responses for each of the ten foremen tasks for hard crafts. The total number of
respondents as described above is 577 Foremen.
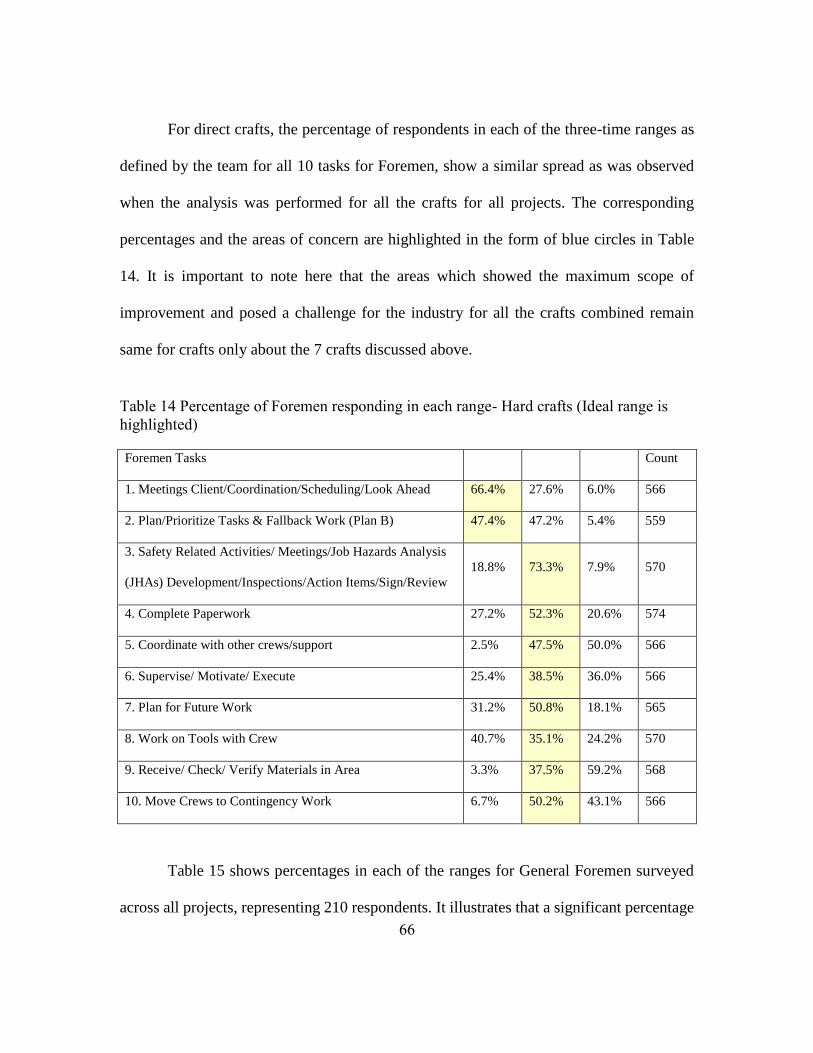
66
For direct crafts, the percentage of respondents in each of the three-time ranges as
defined by the team for all 10 tasks for Foremen, show a similar spread as was observed
when the analysis was performed for all the crafts for all projects. The corresponding
percentages and the areas of concern are highlighted in the form of blue circles in Table
14. It is important to note here that the areas which showed the maximum scope of
improvement and posed a challenge for the industry for all the crafts combined remain
same for crafts only about the 7 crafts discussed above.
Table 14 Percentage of Foremen responding in each range- Hard crafts (Ideal range is
highlighted)
Foremen Tasks Count
1. Meetings Client/Coordination/Scheduling/Look Ahead 66.4% 27.6% 6.0% 566
2. Plan/Prioritize Tasks & Fallback Work (Plan B) 47.4% 47.2% 5.4% 559
3. Safety Related Activities/ Meetings/Job Hazards Analysis
(JHAs) Development/Inspections/Action Items/Sign/Review
18.8% 73.3% 7.9% 570
4. Complete Paperwork 27.2% 52.3% 20.6% 574
5. Coordinate with other crews/support 2.5% 47.5% 50.0% 566
6. Supervise/ Motivate/ Execute 25.4% 38.5% 36.0% 566
7. Plan for Future Work 31.2% 50.8% 18.1% 565
8. Work on Tools with Crew 40.7% 35.1% 24.2% 570
9. Receive/ Check/ Verify Materials in Area 3.3% 37.5% 59.2% 568
10. Move Crews to Contingency Work 6.7% 50.2% 43.1% 566
Table 15 shows percentages in each of the ranges for General Foremen surveyed
across all projects, representing 210 respondents. It illustrates that a significant percentage
67
of General Foremen could be allocating time more productively. This finding is of
particular importance in General Foremen of the crafts mentioned above as these are the
maximum beneficiaries of productivity enhancing practices as would be discussed in detail
in the next chapter. While the researchers expected some spread in a survey, widespread of
percentages indicates significant opportunities for improvement. The spread of responses
across the three categories is slightly different for General Foremen in the 7 crafts discussed
above. The areas of concern and tasks and responsibilities which indicate a challenge for
the industry and room for improvement remain same, however. The three tasks including
Planning and Prioritizing work for foremen, constraint management, and work package
development are shown in Table 15 below.

68
Table 15 Percentage of General Foremen responding in each range- Hard crafts (Ideal
range is highlighted)
General Foremen Tasks Count
1. Meetings Client/Coordination/Scheduling/Look Ahead 49.5% 38.6% 11.9% 210
2. Plan/Prioritize Tasks & Fallback Work (Plan B) 28.1% 54.8% 17.1% 210
3. Safety Related Activities Meetings/Job Hazards Analysis
(JHAs) Development/Inspections/Action Items/Sign/Review
Field Level Hazard Assessments (FLHAs)
11.0% 77.6% 11.4% 210
4. Constraint Management Ensure Foreman has all Crane
support/scaffold/material/equipment
45.4% 42.9% 11.7% 205
5. Follow up with Foreman & Crews Throughout Day Work
Area Reviews/Productivity Check in Field
16.7% 52.2% 31.1% 209
6. Work Package Development Model Review/Field
Installation Work Package (FIWP) Review/FIWP
Schedule/Close-Out FIWPs
37.7% 56.4% 5.9% 204
7. Communicate with Field Engineers Develop Estimates
for Extra Work/Request For Information’s (RFIs)
25.6% 58.0% 16.4% 207
8. Complete Progress/Timesheets/Forecasts/Review
Installed Quantities/Cost Codes
11.1% 71.6% 17.3% 208
The aggregate findings of the survey indicate that F and GF are spending
considerable time on tasks apart from what the researchers consider to be the ideal or target
ranges. The researchers believe that even small moves toward target ranges in aggregate
can make an enormous difference. The researchers also acknowledge the fact that there are
many reasons to why frontline supervisors spend their times differently than the ideal/

69
targeted ranges, including dynamic and complex project conditions, resource, and
manpower ability. A widespread in the ranges within the respondents and variance from
the ideal ranges indicate huge room for improvement.
CONCLUSIONS
The ten identified tasks for a Foremen as defined by the Research Team include
attending meetings, planning and prioritizing tasks and fallback work, performing safety-
related activities, completing paperwork, coordinating with other crews and support,
supervising and motivating, planning for future work, receiving/checking/and verifying
materials, and moving crews to contingency work. The eight identified tasks for General
Foremen include attending meetings, planning and prioritizing fallback work with
foremen, performing safety-related activities, constraint management, following up with
foremen, work package development, communicating with field engineers, and completing
progress/timesheets. This chapter provides detailed overview of the proposed ideal ranges
by the research team.
After identifying the tasks during a “Productive Day,” the Research team surveyed
frontline supervisors in North America to understand where they are spending their time
on a typical work day. The several hundred surveys conducted by RT330 have validated
the research hypothesis that frontline supervisors spend time away from the proposed ideal
time ranges as identified and defined by the Research Team. Their tasks and
responsibilities exacerbates their condition. The steady decline of craft labor skills and
increased safety and employee management processes and procedures have further posed
a challenge to the industry. The Research team by defining the productive day for frontline

70
supervisors and by surveying the industry have identified the key areas and opportunities
for improvement.
Foremen tasks including coordinating with other crews, supervising, motivating,
and executing, receiving/checking/verifying materials, and moving crews to contingency
work indicate that they are spending time away from their main responsibility which should
be to maintain production and supervise their crew. Similarly, General Foremen tasks
including constraint management and work package development indicate a misbalance
between the split of responsibilities of foremen and general foremen on industrial
construction sites.
Overall, the survey results have posed a great challenge to the industry to help
frontline supervisors to divide their time effectively which would, in turn, affect the
performance and productivity of industrial construction projects. The Research team also
acknowledges the fact that external impediments to construction including late or
inaccurate engineering deliverables, issues with the quality of construction material,
unrealistic schedule expectations, lack of detailed pre-planning, and an inadequate support
structure also negatively affect the performance of frontline supervisors. The principal
conclusion of this chapter is that on all project types, Foremen and General Foremen spend
a considerable amount of time away from what the research team designated as ideal or
target time budgeted for their primary tasks. While some variation expected, better
allocation of frontline supervisor time could yield significant productivity improvements.
It is recommended that the industry makes a step towards a unified investment in
training frontline supervisors. Along with the investment, the industry needs to work to

71
reduce the external impediments to production which limits the capability of frontline
supervisors to perform effectively. Efficient Pre-planning will sheild the production from
unexpected production impediments, especially in complex industrial projects.
For problems including declining quality of construction materials, problematic
engineering deliverables, and changes and rework in the field to name a few, should be
tackled before they multiply on the field. Frontline supervisors, specially Foremen should
be equipped to help them concentrate the most on their foremost responsibility to supervise
and motivate their crew and spend maximum time on the field with their crew to increase
construction productivity and performance.
Hence, the research team recommends the industry to analyze where their frontline
supervisors are spending their time. Based on the conclusions of the statistical analysis of
the surveys, the key areas of improvement are identified. It would enable the organizations
to apply specific recommendations which would enable their frontline supervisors to
increase their performance on industrial construction projects. The research team advises
the industry to make unified efforts to address the challenges faced by frontline supervisors
on their industrial construction projects.

72
Chapter 4: Influence of Advanced Work Packaging on Task Scheduling
by Frontline Supervisors
SUMMARY
Frontline supervisors (Foremen and General Foremen) directly motivate and
supervise craftsmen and are responsible for maintaining productivity and performance on
industrial construction projects. With a complex role including a myriad of responsibilities,
frontline supervisors divide their time into many crucial tasks during a typical workday.
Considering the external production impediments in complex industrial construction
environments, frontline supervisors struggle to spend their time productively. This chapter
establishes the influence of a productivity buffering technique, Advanced Work Packaging
(AWP) on the way frontline supervisors divide their time into crucial tasks during a work
day. CII RT 272 defines AWP as a disciplined approach to improving project productivity
and predictability by aligning planning and execution activities across the project life cycle,
from project setup to startup and turnover (Construction Industry Institute 2013a). This
chapter compares the time spent by Foremen and General Foremen on 10 and 8 predefined
crucial tasks respectively during a typical day for those in traditional and AWP
environments on industrial construction sites in North America (The United States and
Canada) (statistical analysis of surveys with support from interviews). The principal
findings include that the frontline supervisors in AWP environments are found to be
spending their time more productively in comparison to their counterparts in traditional
environments on construction projects with similar scope.
73
INTRODUCTION
Frontline supervisors- foremen and general foremen- are the managers who
translate construction execution plans into productive action. Despite their importance,
they have been comparatively understudied. Recent productivity research has focused on
productivity buffering techniques such as Advanced Work Packaging (AWP) or worker
shortage and lessening of craft skills. However, to implement productivity improvement
initiatives or to address worker skills, it is imperative to focus on the capabilities of foremen
and general foremen.
This chapter aims to understand where frontline supervisors spend their time during
a typical work day in different production environments. The study compares responses by
respondents spread demographically in North America from two different production
environments: Traditional and Advanced Work Packaging (AWP). For survey questions,
please refer Foremen and General Foremen surveys at the end of this thesis as Appendix 2
and 3. The reasoning behind this approach is to understand the key areas in which frontline
supervisors in AWP work environment are seen to perform effectively in comparison to
their counterparts in a traditional environment. The comparison between projects of similar
scope including budget and production capabilities helps the researchers to reinforce their
claim. The researchers support the survey results by interviews across different production
environments. More focused responses from respondents in AWP projects in comparison
to their traditional counterparts on the same questions within the interview questionnaire
support the research hypothesis that AWP environment enables the frontline supervisors to
allocate their time effectively.

74
A comparison of time spent on tasks for frontline supervisors with and without
AWP training yielded statistically significant results in both traditional and AWP work
environments. For foremen on traditional projects task 2, “Plan/Prioritize Tasks and
Fallback Work (Plan B), task 5, “Coordinate with other crews/support”, task 9,
“Receive/check/verify materials”, and task 8 “Work on Tools with Crew”, statistically
significant results are seen in differences between those with and without training. For
General Foremen tasks including task 2, “Plan/prioritize tasks and fallback work with
Foremen,” and task 6, “Workpackage Development,” statistically significant differences
are observed between those with and without AWP training. Similarly, a comparison of
time spent for those with and without AWP training on AWP projects also yielded
statistically significant differences between those with and without AWP training. For
Foremen tasks including task 7, “Plan for future work,” and task 8, “Work on tools,”
statistically significant differences are observed. For General Foremen task 2,
“Plan/Prioritize Fallback Work with Foremen.”, statistically significant differences are
observed.
A comparison of responses from traditional and AWP environment depicted
differences in Foremen tasks 6, “Supervise/motivate/execute,” and task 10, “Moving crews
to contingency work.” Similarly for General Foremen tasks 3 “Safety Related Activities,”
task 4 “Constraint management,” and task 7 “Communication with field engineers”
supported the research hypothesis. The results from surveys are also supported in
interviews. Interview questionnaire is available at the end of this thesis as Appendix 6.

75
Categories including “Planning impediments to production- engineering deliverables” and
“work package completeness” support the research hypothesis.
The research team believes that to effectively implement productivity is buffering
techniques including AWP; it is imperative to understand where frontline supervisors
spend their time. At an industry level, this research adds to an enormous opportunity for
improvement, especially in today’s industrial construction projects.
LITERATURE REVIEW
The Construction Industry Institute defines Advanced Work Packaging as “A
disciplined approach to improving productivity and predictability. It accomplishes this by
aligning planning and execution activities across the project life cycle, from project setup
to startup and turnover” (Construction Industry Institute 2013a). Figure 9 below illustrates
the concept of AWP model which includes planning right from the project beginning
during the front end planning and detailed engineering stages.

76
Figure 9 Concept of Advanced Work Packaging; Source: Construction Industry Institute:
Advanced Work Packaging: Design through Workface Execution, Research
Summary RT272-1, Version 2.1 (Construction Industry Institute 2013b).
The Construction Industry Institute further issued a case studies report in 2012
containing seven case studies and three expert interviews collected by the CII Research
Team 272 Enhanced Work Packaging: Design through Work Face Execution (Construction
Industry Institute 2013a). The projects and companies selected for review within this case
studies report were within a range of industrial and commercial construction environments,
including power, oil and gas, government, and commercial projects. High-level benefits
including improved project part alignment and collaboration, site paperwork reduced,
reduced rework, improved project cost and schedule, improved safety awareness and
performance, more time for supervising, decreased supervisor and craft turnover, improved

77
labor productivity, increased reporting accuracy, enhanced turnover and improved client
satisfaction, were observed (Meeks 2011).
The background literature on AWP establishes how AWP aimed towards
improving productivity on industrial construction projects in Alberta oil sands construction
projects. Some of the steps included delivering all resources necessary at the right time, to
the right place, and to the right people to execute construction, to avoid cost overruns and
delays. Other steps including relieving the onsite supervision team from the time-
consuming tasks of onsite planning and resource tracking; thereby allowing them to focus
on production and direction of their crews. These two measures explain that AWP helps in
increasing construction productivity by pre-planning and reducing external impediments
to production.
The research studies on AWP establish the importance of AWP in increasing the
predictability and performance in industrial construction projects. However, as mentioned
earlier, to effectively implement productivity buffering techniques, it is important to
improve the performance of frontline supervisors. They are the first line of supervision and
are directly responsible for production. However, little research is available on the impact
of productivity enhancing practices including AWP on the performance of frontline
supervisors. Hence, the research team analyzed the impact of AWP training on frontline
supervisors in both traditional and AWP environments. They also compared the way
frontline supervisors spend their time differently across the two production environments.
This reasoning forms the basis of the research hypothesis to delve deeply into the impact
of AWP. The research team believes that this effort would be useful to the industry and

78
educational practitioners to help industrial organizations to increase frontline productivity
and performance.
RESEARCH QUESTIONS
Following the literature gap as explained above, the research team decided to
analyze the impact of AWP training on industrial frontline supervisors. The researchers
also compared the way frontline supervisors spend their time between the two production
environments, traditional and AWP. The reasoning was to corroborate the research
hypothesis by analyzing both traditional and AWP construction projects. The research team
found it necessary to understand the influence of AWP training in traditional environments
with lesser constraint management and pre-planning in comparison to AWP environments.
They proposed at the beginning of research that frontline supervisors should perform
differently in the two production environments. This lead to the main hypothesis of the
research and research question “Is there a difference in the time spent by frontline
supervisors in traditional and AWP work environments? What is the influence of AWP
training on the performance of frontline supervisors in industrial construction projects?”.
Further, they also presented that for each of the ten and eight Foremen and General
Foremen tasks respectively, the differences should not be statistically significant. The
explanation follows that some of the tasks are routine tasks that are performed on every
industrial construction project irrespective of the production environment. For example,
Foreman task 1: “Meetings,” task 3: “Safety Related activities,” the research team expected
no statistically significant differences between the two populations. Similarly for General
Foremen task 1: “Meetings,” task 3: “Safety Related activities,” task 8: “Completing

79
progress sheets,” they expected that no difference should exist. This lead to the sub
hypothesis of the research “Of the ten and eight proposed tasks for Foremen and General
Foremen respectively, for tasks common to any construction environment including tasks
1 and 3 for Foremen and tasks 1,3, and 8 for General Foremen, are the differences between
the populations statistically significant?”
Next, the research team expected for Foremen tasks involving planning and
prioritizing, coordinating, supervising and motivating, and contingency planning,
differences should exist between the two populations. Similarly, for General Foremen tasks
including planning and prioritizing, following up, work package development, and
communication with field engineers, statistically significant differences should exist. This
lead to the next sub hypothesis of the research “For Foremen tasks including task 2,5,6,7,
and 10, and for General Foremen tasks including task 2,4,6, and 7, are the differences
between the populations statistically significant?”The next section would provide the
research methodology adopted by the research team to validate the research hypothesis and
sub hypotheses.
RESEARCH METHODOLOGY
The crucial tasks and proposed time ranges are defined in thesis chapter 3 and
Appendices 2 and 3. Foremen and General Foremen tasks already defined in chapter 3 are
again presented as Tables 16 and 17 below to maintain the flow of this chapter. Building
on the crucial tasks already defined, this chapter along with establishing the time spent by
frontline supervisors in traditional and AWP environments, compares their responses to
establish statistical differences. Following the research hypothesis and sub hypotheses

80
defined in the previous section, the research team started analyzing the survey data to
compare the different populations.

81
Table 16 Foremen tasks during a "Productive Day"- Ideal ranges
Task Minutes/Hours Per Day Spent
1. Meetings –
Client/Coordination/Scheduling/Look Ahead 15-60
mins. 1.5-2 hrs. 2-4 hrs.
2. Plan/Prioritize Tasks & Fallback Work
(Plan “B”)
0-30
mins.
45-90
mins. 2-3 hrs.
3. Safety Related Activities – Meetings/JHA
Development/Inspections/Action
Items/Sign/Review FLHAs
0-15
mins.
30-60
mins. 1.5-3 hrs.
4. Complete Paperwork 10-25
mins.
30-60
mins.
65-90
mins.
5. Coordinate with other Crews/Support 0 mins. 5-15
mins.
16-25
mins.
6. Supervise/Motivate/Execute 4 hrs.
or less 5-6 hrs.
8 hrs.
or more
7. Plan for Future Work 15-35
mins.
45-1.25
hrs. 1.5-2 hrs.
8. Work on Tools with Crew
0-15
mins. 15-45
mins. 1-2 hrs.
9. Receive/Check/Verify Materials in Area 0 mins. 5-15
mins.
16-25
mins.
10. Move Crews to Contingency Work 0 mins. 5-15
mins.
16-25
mins.

82
Table 17 General Foremen tasks during a "Productive Day"- Ideal ranges
Task
Minutes/Hours Per Day Spent
1. Meetings –
Client/Coordination/Scheduling/Look Ahead 15-60
mins. 1.5-2 hrs. 2-4 hrs.
2. Plan/Prioritize Tasks & Fallback Work
(Plan “B”) with Foremen
0-30
mins.
45-90
mins. 2-3 hrs.
3. Safety Related Activities – Meetings/JHA
Development/Inspections/Action
Items/Sign/Review FLHAs
0-15
mins.
30 -60
mins. 1.5-3 hrs.
4. Constraint Mgt. – Ensure FM has all Crane
support/crane/scaffold/Material/Equipment
0-30
mins.
60-90
mins. 2-3 hrs.
5. Follow up with FM & Crews Throughout
Day – Work Area Reviews/Productivity
Check in Field
30-45
mins. 1.5-3 hrs. 4-6 hrs.
6. Work Package Development – Model
Review/FIWP Review/FIWP
Schedule/Close-Out FIWPs
0-30
mins. 1-2 hrs. 3-4 hrs.
7. Communicate with Field Engineers –
Develop Estimates for Extra Work/RFIs
0-15
mins.
30-60
mins. 1.5-3 hrs.
8. Complete
Progress/Timesheets/Forecasts/Review
Installed Quantities/Cost Codes
0-15
mins.
30-60
mins. 1.5-3 hrs.
The data collection efforts commenced with distributing paper based surveys across
industrial sites in North America. A mixture of construction environments and industrial
sectors was maintained to compare the different responses and establish the research
hypothesis. Representatives were contacted on industrial sites in North America to recruit

83
them to distribute surveys to their frontline supervisors on their respective industrial sites.
It is important to mention here the researchers knew the organizational structure and the
kind of construction environment on each of the construction sites. The details on the
organizational structure of the projects under consideration are provided in the below
sections.
After the completion of data collection, the third stage involved analyzing and
comparing responses from traditional and AWP environments. The researchers also
proposed to include only the following trades in the analysis: Iron Worker,
Mechanical/Millwright, Pipefitter, Pipefitter Welders, Electrical/Instruments,
Carpenter/Scaffolder, and Boilermaker. The reasoning follows is they are the primary
beneficiaries of AWP as well as drivers of construction productivity. The researchers
decided to exclude the data from support and related crafts.
Also, the research team compared the responses of respondents in two production
environments by conducting face to face interviews involving questions related to
productivity impediments and daily tasks. The researchers believes that this effort is
important to support the survey results qualitatively. The researchers found that
respondents in AWP environemnts gave more focussed answers and faced lesser
productivity impediments in comparison to their traditional counterparts. The next section
would elaborate in detail the analysis approach including number of respondents and
explanation to include the particular analysis.

84
CONTENT
To elaborate on the influence of AWP on the performance of frontline supervisors,
the researchers divide their analysis into two parts. The researchers firstly established the
influence of AWP training on frontline supervisors in traditional and AWP Projects. To
ascertain whether the respondents received training in AWP or not, the survey included the
question “Have you had training in any of the following areas (check all that apply): Safety,
Quality Control, Scheduling, Estimating, Supervisory Skills, 3D/BIM Model, Effective
Communication, AWP/WFP, Time Management, Lean Construction, and Time Motion
Studies”. Even though the survey asked the respondents whether or not they received
training in each of the areas above, this chapter focuses on only AWP training. The
researchers isolated the impact of training by conducting Chi-Squared analysis on a group
of Traditional and AWP projects, separately for the crafts above. The chi-squared test is
used to establish statistical independence between categorical variables of two or more
groups, by establishing the p-value based on the Chi-squared statistic generated on their
comparison. The researchers have presented results for those tasks in which the
corresponding p-value was less than or equal to 0.10. Results for four groups have been
presented in this chapter: Foremen in Traditional projects with and without AWP training
(294 Foremen, 38 with AWP training), General Foremen in Traditional projects with and
without AWP training (124 General Foremen, 27 with AWP training), Foremen in AWP
projects with and without AWP training (157 Foremen, 42 with AWP training), and
General Foremen in AWP projects with and without AWP training (42 General Foremen,
23 with AWP training).

85
In addition to ascertaining the impact of training on frontline supervisors in
traditional and AWP environments, the researchers investigated the differences in how the
frontline supervisors allocate their time across tasks in these two execution methods. The
survey data for AWP projects stems from two large industrial projects. Of these two AWP
projects, one project was facing significant materials delays, as informed by the
representative who was recruited to conduct the survey on that particular industrial
construction job site. The researchers agree that the ability to distinguish between
successful and problematic AWP projects allows for further analysis to ascertain how
external productivity impediments can hamper the performance of AWP projects.
Traditional projects sampled were considered to be performing well for traditional
execution practices. After compiling the responses from AWP and traditional projects, the
researchers compared the responses for each task for foremen and general foremen between
all AWP and Traditional projects to determine differences between the samples. As already
stated above, one of the AWP source projects was sampled at a time when the project was
facing several external impediments that were causing significant disruptions to the site
activities. The researchers decided to repeat the chi-squared analysis by removing that one
project from the comparative sample- to support the ideology of AWP, external
impediments including material problems are not a characteristic of effective AWP
execution. The researchers then performed analysis on the smaller sample size of AWP
projects with 89 Foremen and 20 General Foremen. The researchers have presented results
for those tasks in which the corresponding p-value was less than or equal to 0.10. As
mentioned above, the researchers limited the investigation to the following crafts:

86
Ironworkers, Mechanical/Millwrights, Pipefitters, Pipefitter/Welders.
Electrical/Instruments, Carpenter/Scaffolders, and Boilermakers. For this analysis, on the
AWP projects there were 156 Foremen and 42 General Foremen, and for the Traditional
Projects, there were 294 Foremen and 124 General Foremen.
Along with illustrating the influence of AWP on the performance of frontline
supervisors by performing statistical analysis on the two groups of frontline supervisors.
This chapter presents the results of 113 case study interviews of frontline supervisors across
9 industrial sites spread demographically in the US. The interviews were administered in
person on industrial sites in Alabama, Louisiana, Tennessee, and Texas. Quotes from
interviews are presented to illustrate the difference in execution environments and external
impediments to production in AWP and traditional construction environments. The
sections below elaborate on the results of statistical analysis of surveys along with
presenting a qualitative analysis of the case study interviews.
RESULTS
As discussed above, the analysis presented in this chapter is divided into two parts. The
first part would illustrate the importance of AWP training on frontline supervisors in AWP
and traditional projects separately. It is done to isolate the impact of AWP in traditional
projects separately, with comparatively lesser constraint management and advanced pre-
planning. The second part would illustrate the difference between the time spent by
frontline supervisors in traditional and AWP environments by comparing the two groups
statistically and establishing differences from the proposed time ranges by the researchers.
To illustrate the influence of AWP on industrial frontline supervisors, the researchers
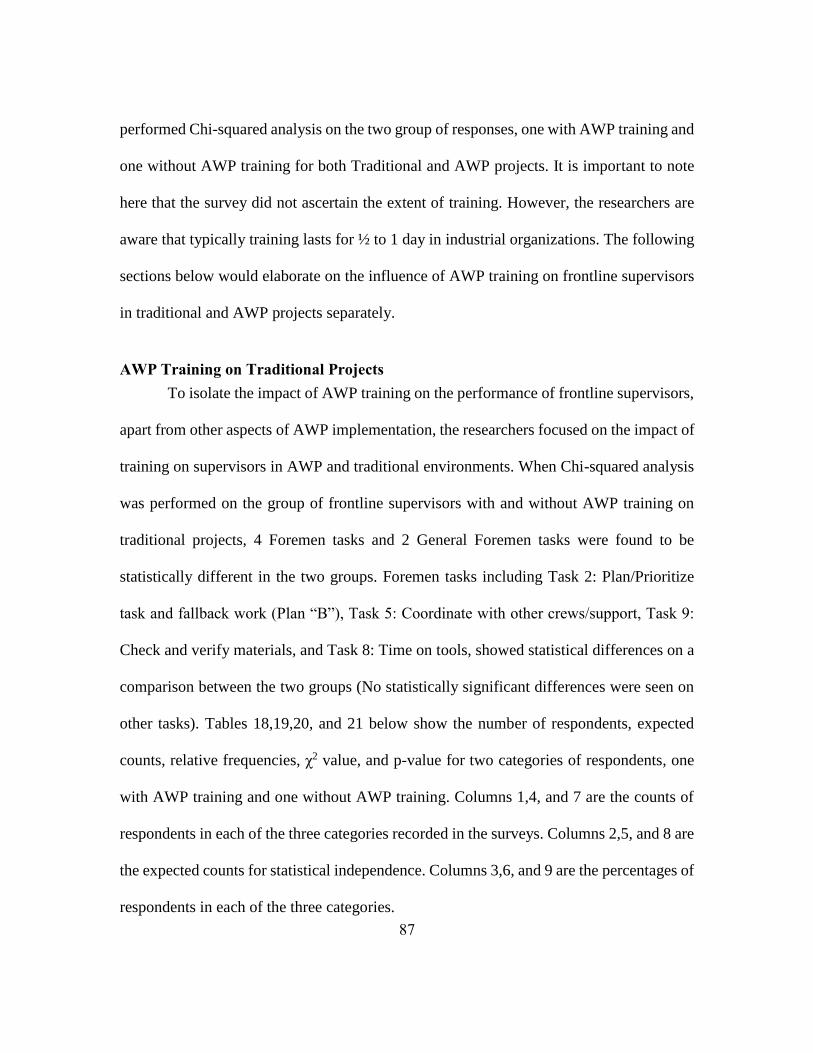
87
performed Chi-squared analysis on the two group of responses, one with AWP training and
one without AWP training for both Traditional and AWP projects. It is important to note
here that the survey did not ascertain the extent of training. However, the researchers are
aware that typically training lasts for ½ to 1 day in industrial organizations. The following
sections below would elaborate on the influence of AWP training on frontline supervisors
in traditional and AWP projects separately.
AWP Training on Traditional Projects
To isolate the impact of AWP training on the performance of frontline supervisors,
apart from other aspects of AWP implementation, the researchers focused on the impact of
training on supervisors in AWP and traditional environments. When Chi-squared analysis
was performed on the group of frontline supervisors with and without AWP training on
traditional projects, 4 Foremen tasks and 2 General Foremen tasks were found to be
statistically different in the two groups. Foremen tasks including Task 2: Plan/Prioritize
task and fallback work (Plan “B”), Task 5: Coordinate with other crews/support, Task 9:
Check and verify materials, and Task 8: Time on tools, showed statistical differences on a
comparison between the two groups (No statistically significant differences were seen on
other tasks). Tables 18,19,20, and 21 below show the number of respondents, expected
counts, relative frequencies, χ2 value, and p-value for two categories of respondents, one
with AWP training and one without AWP training. Columns 1,4, and 7 are the counts of
respondents in each of the three categories recorded in the surveys. Columns 2,5, and 8 are
the expected counts for statistical independence. Columns 3,6, and 9 are the percentages of
respondents in each of the three categories.

88
Table 18 Task 2- Plan/prioritize tasks and fallback work, traditional projects
Time Range -A Time Range -B Time Range -C
1 2 3 4 5 6 7 8 9 Count
Training 12 18.3 31.6% 22 17.8 57.9% 4 1.8 10.5% 38
No
Training 129 122.7 50.8% 115 119.2 45.3% 10 12.2 3.9% 254
Count 141 137 14 292
χ2 value 6.641 p value 0.036
Table 19 Task 5- Coordinate with other crews, traditional projects
Time Range -A Time Range -B Time Range -C
1 2 3 4 5 6 7 8 9 Count
Training 0 0.9 0.0% 9 17.3 23.7% 29 19.8 76.3% 38
No
Training 7 6.1 2.8% 124 115.7 48.8% 123 132.2 48.4% 254
Count 7 133 152 292
χ2 value 10.572 p value 0.005

89
Table 20 Task 9- Check Materials, traditional projects
Time Range -A Time Range -B Time Range -C
1 2 3 4 5 6 7 8 9 Count
Training 0 1.0 0.0% 8 14.3 21.1% 30 22.6 78.9% 38
No
Training 8 7.0 3.1% 104 97.7 40.2% 147 154.4 56.8% 259
Count 8 112 177 297
χ2 value 7.118 p value 0.028
Table 21 Task 8- Time on tools, traditional projects
Time Range -A Time Range -B Time Range -C
1 2 3 4 5 6 7 8 9 Count
Training 24 14.6 63.2% 7 13.6 18.4% 7 9.8 18.4% 38
No
Training 90 99.4 34.9% 99 92.4 38.4% 69 66.2 26.7% 258
Count 114 106 76 296
χ2 value 11.450 p value 0.003
Figures 10,11,12, and 13 depict the difference in responses between the two groups
for the above tasks graphically. As shown in Figure 10 below, on Task 2- Plan/Prioritize
Tasks and Fallback Work (Plan “B”), those with training spend more time on this task than
those with no training (p-value 0.036). Figure 11 below illustrates the results for Foremen
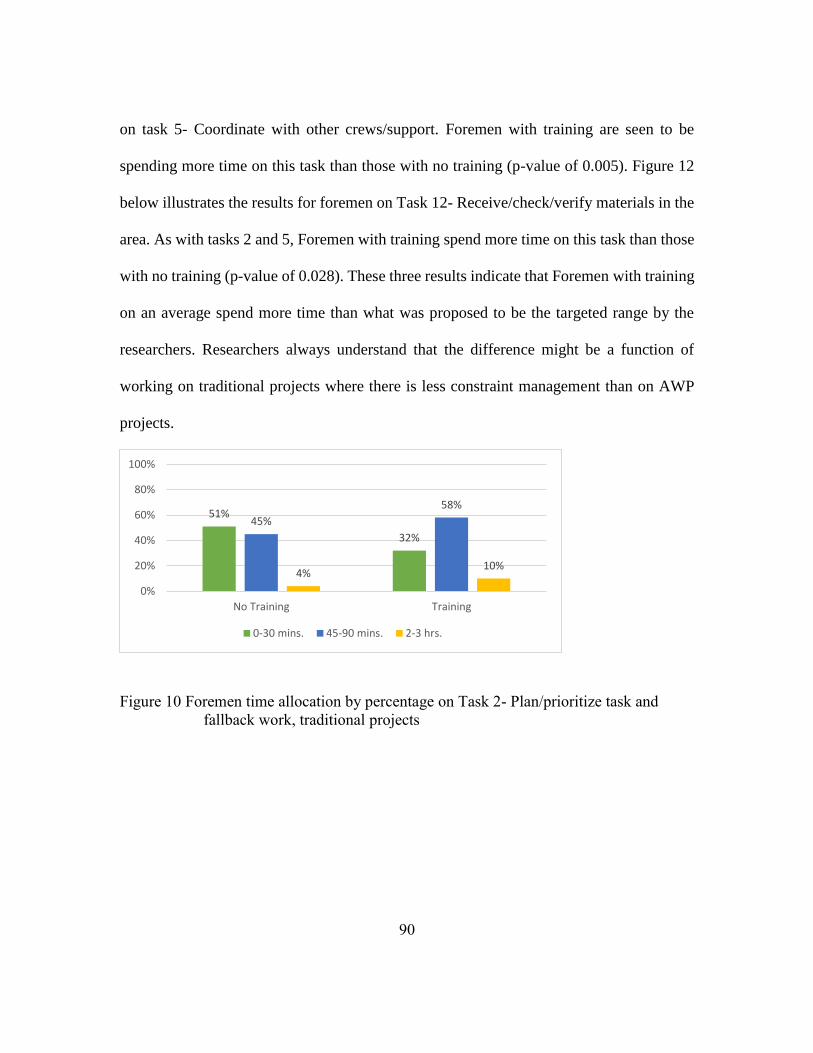
90
on task 5- Coordinate with other crews/support. Foremen with training are seen to be
spending more time on this task than those with no training (p-value of 0.005). Figure 12
below illustrates the results for foremen on Task 12- Receive/check/verify materials in the
area. As with tasks 2 and 5, Foremen with training spend more time on this task than those
with no training (p-value of 0.028). These three results indicate that Foremen with training
on an average spend more time than what was proposed to be the targeted range by the
researchers. Researchers always understand that the difference might be a function of
working on traditional projects where there is less constraint management than on AWP
projects.
Figure 10 Foremen time allocation by percentage on Task 2- Plan/prioritize task and
fallback work, traditional projects
51%
32%
45%
58%
4%10%
0%
20%
40%
60%
80%
100%
No Training Training
0-30 mins. 45-90 mins. 2-3 hrs.
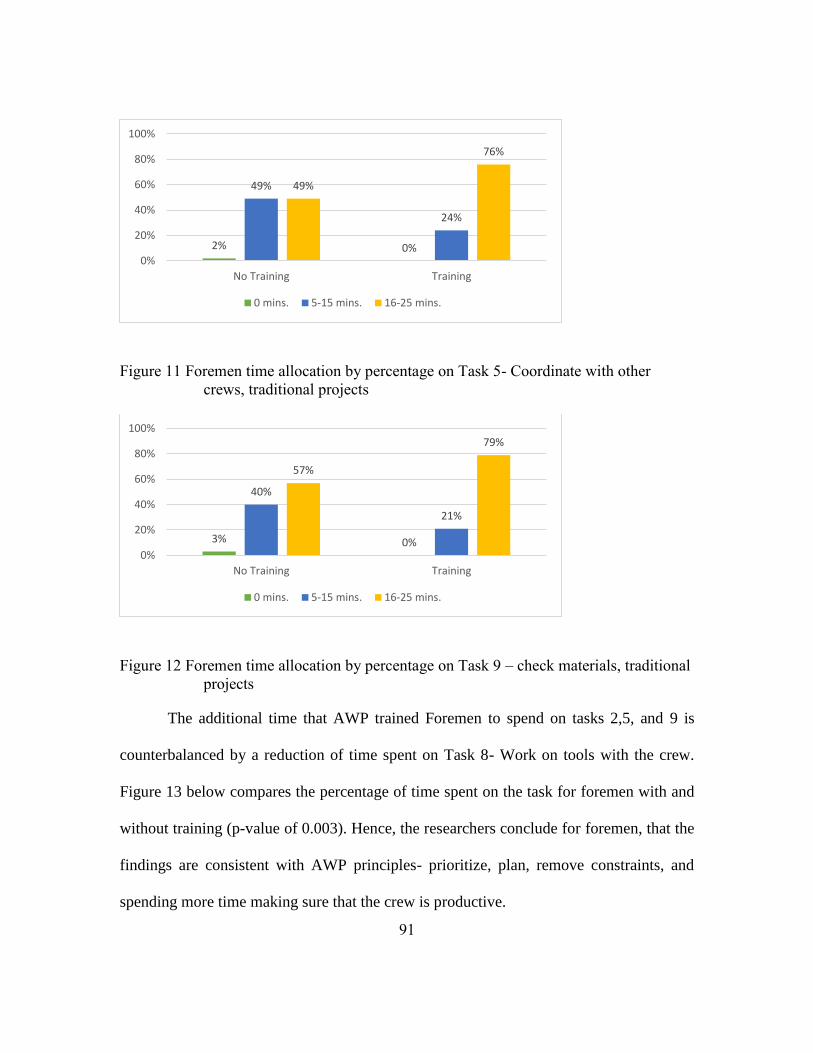
91
Figure 11 Foremen time allocation by percentage on Task 5- Coordinate with other
crews, traditional projects
Figure 12 Foremen time allocation by percentage on Task 9 – check materials, traditional
projects
The additional time that AWP trained Foremen to spend on tasks 2,5, and 9 is
counterbalanced by a reduction of time spent on Task 8- Work on tools with the crew.
Figure 13 below compares the percentage of time spent on the task for foremen with and
without training (p-value of 0.003). Hence, the researchers conclude for foremen, that the
findings are consistent with AWP principles- prioritize, plan, remove constraints, and
spending more time making sure that the crew is productive.
2% 0%
49%
24%
49%
76%
0%
20%
40%
60%
80%
100%
No Training Training
0 mins. 5-15 mins. 16-25 mins.
3% 0%
40%
21%
57%
79%
0%
20%
40%
60%
80%
100%
No Training Training
0 mins. 5-15 mins. 16-25 mins.
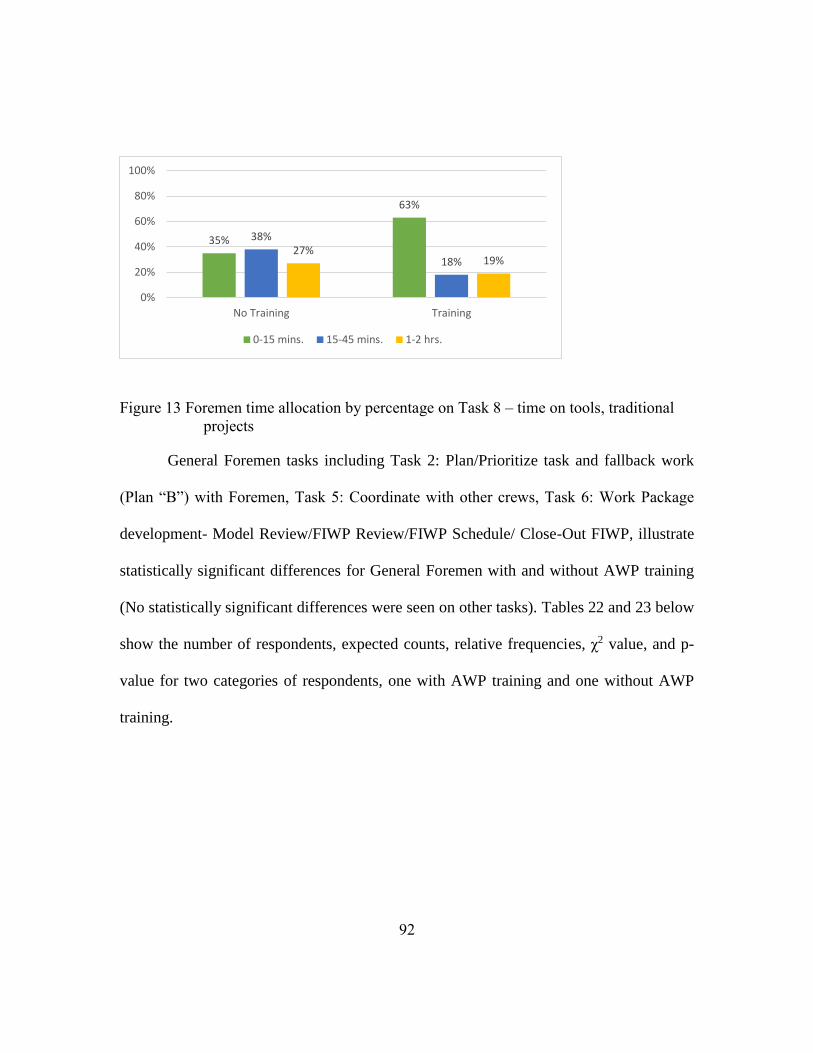
92
Figure 13 Foremen time allocation by percentage on Task 8 – time on tools, traditional
projects
General Foremen tasks including Task 2: Plan/Prioritize task and fallback work
(Plan “B”) with Foremen, Task 5: Coordinate with other crews, Task 6: Work Package
development- Model Review/FIWP Review/FIWP Schedule/ Close-Out FIWP, illustrate
statistically significant differences for General Foremen with and without AWP training
(No statistically significant differences were seen on other tasks). Tables 22 and 23 below
show the number of respondents, expected counts, relative frequencies, χ2 value, and p-
value for two categories of respondents, one with AWP training and one without AWP
training.
35%
63%
38%
18%27%
19%
0%
20%
40%
60%
80%
100%
No Training Training
0-15 mins. 15-45 mins. 1-2 hrs.

93
Table 22 General Foremen time allocation by percentage on Task 2 – Plan/Prioritize,
traditional projects
Time Range -A Time Range -B Time Range -C
1 2 3 4 5 6 7 8 9 Count
Training 5 11.1 18.5% 13 8.5 48.1% 9 7.4 33.3% 27
No
Training 46 39.9 47.4% 26 30.5 26.8% 25 26.6 25.8% 97
Count 51 39 34 124
χ2 value 7.789` p value 0.020
Table 23 General Foremen time allocation by percentage on Task 6 – Work Package
Development, traditional projects
Time Range -A Time Range -B Time Range -C
1 2 3 4 5 6 7 8 9 Count
Training 5 9.7 18.5% 12 13.7 44.4% 10 3.6 37.0% 27
No
Training 38 33.3 40.9% 49 47.3 52.7% 6 12.4 6.5% 93
Count 43 61 16 120
χ2 value 17.876 p value 0.0001
Figures 14 and 15 depict the difference in responses between the two groups for the
above tasks graphically. As shown in Figure 13 below, on Task 2- Plan/Prioritize Tasks

94
and Fallback Work (Plan “B”) with Foremen, those with training spend more time closer
to the ideal than those without training (p-value of 0.02). Figure 14 below illustrates the
results for General Foremen on Task 6- Work Package Development, those with training
spend more on work package development and review (p-value of 0.0001).
Figure 14 General Foremen time allocation by percentage on Task 2 – Plan/prioritize
fallback work, traditional projects
Figure 15 General Foremen time allocation by percentage on Task 6- Work Package
Development, traditional project
47%
19%27%
48%
27%33%
0%
20%
40%
60%
80%
100%
No Training Training
0-30 mins. 45-90 mins. 2-3 hrs.
41%
19%
53%43%
6%
38%
0%
20%
40%
60%
80%
100%
No Training Training
0-30 mins. 60-90 mins. 2-3 hrs.

95
Hence for traditional projects, frontline supervisors with AWP training were found
to time spend time more effectively in comparison to frontline supervisors without AWP
training. The next sections would illustrate the impact of AWP training on AWP projects.
AWP Training on AWP projects
The analysis above presents a strong overview of the impact of AWP training
within a traditional execution context. This section will illustrate the impact of AWP
training on frontline supervisors in AWP projects. The reasoning behind performing the
analysis separately for both AWP and traditional environments is to gauge if there are
substantive differences between the two production environments. The researchers
expected that there would be lesser differences within the frontline supervisors with and
without training in AWP environments, because they are operating within an AWP
environment. For the crafts above, the analysis was performed on a sample of 157 Foremen
(42 with AWP training) and 42 General Foremen (23 with AWP training). After
segregating the two responses in two groups, one with and one without training, the
researchers observed statistically significant differences in how these groups spend their
time on three tasks- 2 for Foremen and 1 for General Foremen.
To isolate the impact of AWP training on the performance of frontline supervisors
in AWP environments, the researchers performed the Chi-Squared analysis on the two
groups. Two Foremen tasks and one General Foremen task were found to be statistically
different (no statistical difference for other tasks). Foremen tasks including Task 7: Plan
for Future Work and Task 8: Work on tools with the crew, showed statistical differences.
Tables 24 and 25 below show the number of respondents, expected counts, relative
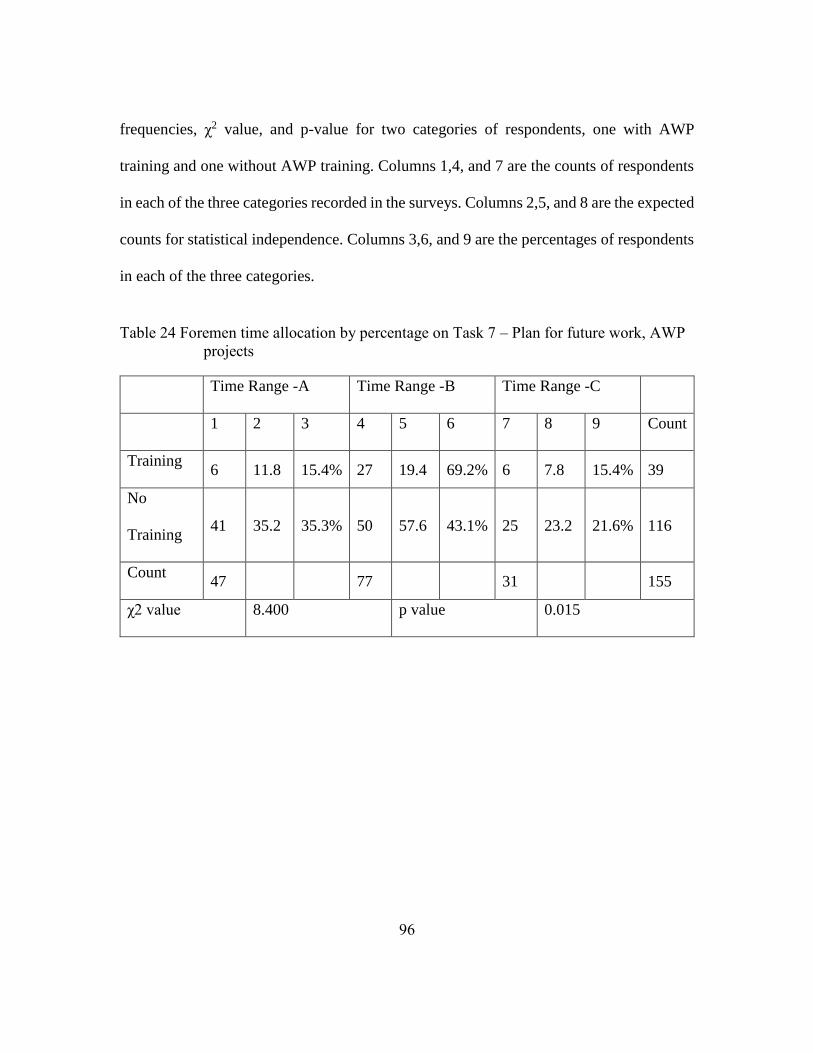
96
frequencies, χ2 value, and p-value for two categories of respondents, one with AWP
training and one without AWP training. Columns 1,4, and 7 are the counts of respondents
in each of the three categories recorded in the surveys. Columns 2,5, and 8 are the expected
counts for statistical independence. Columns 3,6, and 9 are the percentages of respondents
in each of the three categories.
Table 24 Foremen time allocation by percentage on Task 7 – Plan for future work, AWP
projects
Time Range -A Time Range -B Time Range -C
1 2 3 4 5 6 7 8 9 Count
Training 6 11.8 15.4% 27 19.4 69.2% 6 7.8 15.4% 39
No
Training 41 35.2 35.3% 50 57.6 43.1% 25 23.2 21.6% 116
Count 47 77 31 155
χ2 value 8.400 p value 0.015

97
Table 25 Foremen time allocation by percentage on Task 8 – Work on tools, AWP
projects
Time Range -A Time Range -B Time Range -C
1 2 3 4 5 6 7 8 9 Count
Training 28 18.9 70.0% 9 13.8 22.5% 3 7.4 7.5% 40
No
Training 46 55.1 39.3% 45 40.2 38.5% 26 21.6 22.2% 117
Count 74 54 29 157
χ2 value 11.660 p value 0.003
Figures 16 and 17 depict the difference in responses between the two groups for the
above tasks graphically. As shown in Figure 15 below, on Task 7- Plan for Future work,
those with training spend more time closer to the ideal than those without training (p-value
of 0.015). This is particularly a positive influence for Foremen spending less than the ideal
time, a shift of 20 %. Figure 16 below illustrates the results for Foremen on Task 8- Work
on tools with the crew, those with training indicate a considerable shift to less time spent
on tools with the crew, a result that is less than the proposed ideal range by the researchers.
This finding was found to be consistent with the principle of AWP execution, AWP
emphasizes on planning for productivity and removing constraints and ensuring the crew
is productive.
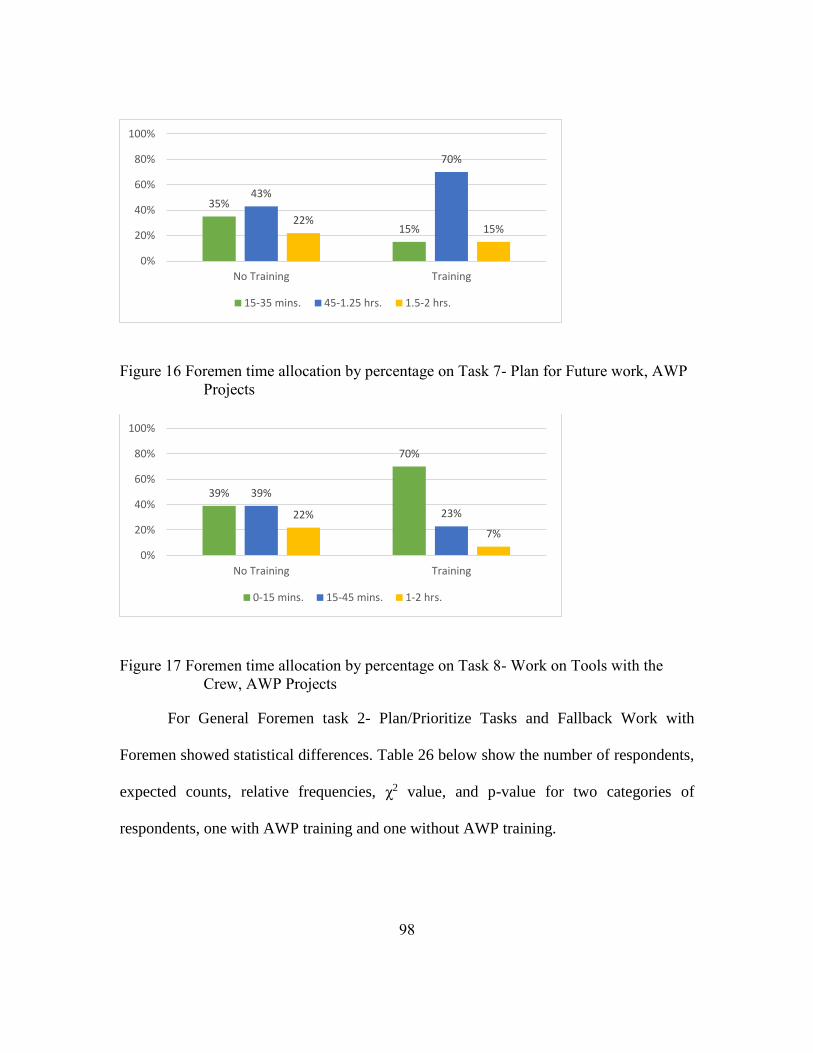
98
Figure 16 Foremen time allocation by percentage on Task 7- Plan for Future work, AWP
Projects
Figure 17 Foremen time allocation by percentage on Task 8- Work on Tools with the
Crew, AWP Projects
For General Foremen task 2- Plan/Prioritize Tasks and Fallback Work with
Foremen showed statistical differences. Table 26 below show the number of respondents,
expected counts, relative frequencies, χ2 value, and p-value for two categories of
respondents, one with AWP training and one without AWP training.
35%
15%
43%
70%
22%15%
0%
20%
40%
60%
80%
100%
No Training Training
15-35 mins. 45-1.25 hrs. 1.5-2 hrs.
39%
70%
39%
23%22%
7%
0%
20%
40%
60%
80%
100%
No Training Training
0-15 mins. 15-45 mins. 1-2 hrs.

99
Table 26 General Foremen time allocation by percentage on Task 2 –Plan/Prioritize
Tasks and Fallback work with Foremen, AWP projects
Time Range -A Time Range -B Time Range -C
1 2 3 4 5 6 7 8 9 Count
Training 4 6.8 21.1% 14 10.4 73.7% 1 1.8 5.3% 19
No
Training 11 8.2 47.8% 9 12.6 39.1% 3 2.2 13.0% 23
Count 15 23 4 42
χ2 value 5.018 p value 0.081
Figure 18 below depicts the difference between two groups, one with training and
one without training. General Foremen with training spend considerably more time with
their foremen than those who do not; the responses are also observed to be closer to the
target ranges as defined by the researchers. As presented above, this result is consistent
with the findings supported in traditional projects.

100
Figure 18 General Foremen time allocation by percentage on Task 2- Plan/prioritize
tasks/ fallback work with Foremen, AWP Projects
Along with presenting tests of statistical significance for comparison between the
two groups on the influence of AWP training on the frontline supervisors in both traditional
and AWP environments, this chapter presents results comparing the way frontline
supervisors divide their time in AWP and traditional execution environments. This section
allows investigation of differences of how Foremen and General Foremen allocate their
time across tasks in the two execution environments. AWP is found to make a meaningful
difference in how Foremen and General Foremen spend their time on projects.
As already stated above, out of the two AWP projects studied in this chapter, one
project was facing significant materials delays, and hence the project is not performing
very well. The site representative who was recruited in the study to collect responses from
frontline supervisors on that site confirmed it. The investigation is limited to the crafts
mentioned above: Iron Workers, Mechanical/Millwrights, Pipefitters, Pipefitter Welders,
Electrical/Instruments, Carpenter/Scaffolders, and Boilermakers. Firstly, the analysis was
performed to compare the responses from traditional and both the AWP projects combined.
48%
21%
39%
74%
13%5%
0%
20%
40%
60%
80%
100%
No Training Training
0-30 mins. 45-90 mins. 2-3 hrs.

101
By removing the project that was facing material problems, the sample size for AWP
comparison that is presented in this chapter is 89 Foremen and 20 General Foremen.
Tables 27 and 30 lists the results of the analysis for Foremen and General Foremen
for each of the 10 and 8 tasks respectively. The following criteria were used to screen the
differences between the two samples: 1) p-value <.1, indicating a 90 % chance that the
samples are meaningfully different. 2) p-value <.2, indicating an 80 % chance that samples
are meaningfully different. It is not accepted in construction research; however, the
researchers have used this analysis to likely identify the differences between the two
samples. 3) A 10 % or greater difference between the number of respondents on at least
one of the three samples. It was found particularly important in smaller sample sizes,
particularly true after removing the AWP project facing external material impediments.
The validity of chi-squared statistic does not hold true when the expected count in either
of the three categories is less than 4.
Each table indicates if the Chi-squared test found a difference between the two
samples of AWP and Traditional, and AWP (adjusted) and Traditional for each task. The
p-value is provided for each of the tasks that meet at least one of the three criteria
mentioned above. The results are presented using the following acceptable criteria: 1) Both
comparisons meet screening criteria 1 (p-value less than .1), the result is strongly
supported. 2) One comparison meets criteria 2 (p-value less than .2), and other comparison
meets criteria 1 (p-value less than .1), the result is supported. 3) One comparison meets
criteria 1, and another comparison has no statistical significance, the result is weakly

102
supported. 4) Both comparisons meet any of the three screening criteria, the result is
possible. 5) One of the comparisons has p-value between .2 and .1, the result is possible.
Foremen
Table 27 below indicates that Foremen have three tasks that are partially supported
and two tasks are supported. Supported tasks are Task 6- Supervise/motivate and execute,
and Task 10- Move crews to contingency work. Findings for Task 6 indicate a shift towards
more time spent in the field in AWP environments. Tables 28 and 29 below show the
number of respondents, expected counts, relative frequencies, χ2 value, and p-value for two
categories of respondents, one in the traditional execution environment and one in adjusted
AWP environment.
On task 10, AWP shows a reduction of time spent in moving crews to contingency
work. This finding is consistent with the hypothesis of this chapter. Table 29 below show
the number of respondents, expected counts, relative frequencies, χ2 value, and p-value for
two categories of respondents, one in the traditional execution environment and one in
adjusted AWP environment.

103
Table 27 Foremen- Difference between AWP and Traditional Time on Tasks
Foremen Task AWP vs.
Traditional
AWP(adjusted) vs.
Traditional
Difference?
1 X X
2 X X
3 X Y (p=.026) Weakly Supported
4 X Y (p=.004) Weakly Supported
5 X Y (p=.029) Weakly Supported
6 Y (p=.19) Y (p=.056) Supported
7 X Y (p=.127) Possible
8 Y (p=.12) X Possible
9 X Y (p=.14) Possible
10 Y (p=.14) Y (p=.042) Supported
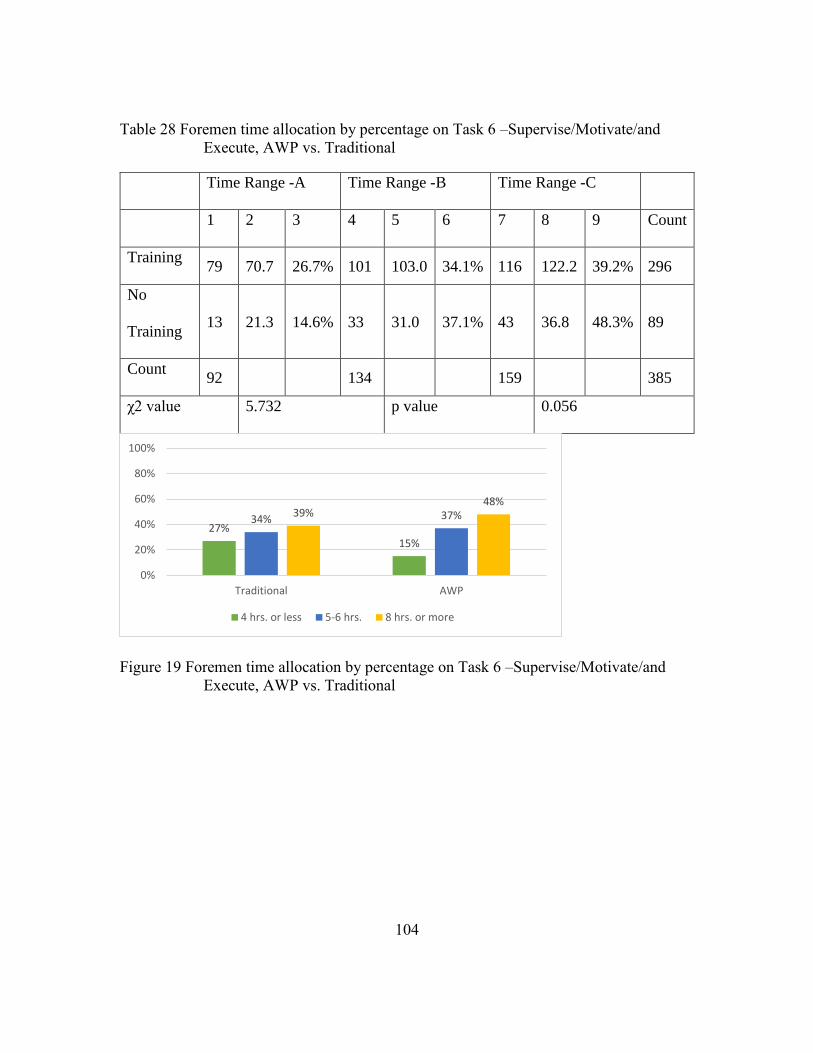
104
Table 28 Foremen time allocation by percentage on Task 6 –Supervise/Motivate/and
Execute, AWP vs. Traditional
Time Range -A Time Range -B Time Range -C
1 2 3 4 5 6 7 8 9 Count
Training 79 70.7 26.7% 101 103.0 34.1% 116 122.2 39.2% 296
No
Training 13 21.3 14.6% 33 31.0 37.1% 43 36.8 48.3% 89
Count 92 134 159 385
χ2 value 5.732 p value 0.056
Figure 19 Foremen time allocation by percentage on Task 6 –Supervise/Motivate/and
Execute, AWP vs. Traditional
27%
15%
34% 37%39%48%
0%
20%
40%
60%
80%
100%
Traditional AWP
4 hrs. or less 5-6 hrs. 8 hrs. or more

105
Table 29 Foremen time allocation by percentage on Task 10 –Move crews to contingency
work, AWP vs. Traditional
Time Range -A Time Range -B Time Range -C
1 2 3 4 5 6 7 8 9 Count
Training 17 20.0 5.7% 147 153.4 49.7% 132 122.6 44.6% 296
No
Training 9 6.0 10.2% 52 45.6 59.1% 27 36.4 30.7% 88
Count 26 199 159 384
χ2 value 6.349 p value 0.042
Figure 20 Foremen time allocation by percentage on Task 10 –Move crews to
contingency work, AWP vs. Traditional
Table 30 below provides evidence that on AWP and traditional projects General
Foremen spend their time differently. For General Foremen, three out of the eight tasks are
supported or strongly supported to illustrate differences between traditional and AWP
environments. For tasks 3,4, and 7 respectively related to Safety Related activities,
constraint management and communication with the field engineers the results illustrate
6% 10%
50%59%
44%
31%
0%
20%
40%
60%
80%
100%
Traditional AWP
0 mins. 5-15 mins. 16-25 mins.

106
that General Foremen in AWP environments have evidence of performing effectively than
their counterparts in traditional environments. Table 31 and Figure 21 below show that on
AWP projects, General foremen spend less time on safety related activities such as
meetings, and JHA development etc. A perception of the researchers is that crews tend to
review safety buzzwords, recite safety pledges, and listen to their supervisor’s review or
recite information that has been passed down from management. Safety related activities
should not be done for safety’s sake; rather, safety activities should be incorporated into
the overall work plan and tasks and should be specific to work at hand. AWP's
incorporation of safety planning into IWPs (Installation Work Packages) and AWP's
constraint analysis to minimize work performed out of sequence supports an inference that
on AWP, GFs can spend less time on safety items that are called out in daily routines and
focus more on planning and supervising the work at hand and include safety considerations
into that planning.

107
Table 30 General Foremen- Difference between AWP and Traditional Time on Tasks
General Foremen
Task
AWP vs.
Traditional
AWP (adjusted) vs
Traditional
Difference?
1 X X
2 Y (p=.23) Y (p=.129) Possible
3 Y (p=.16) Y (p=.028) Supported
4 Y (p=.08) Y (p=.043) Strongly Supported
5 X Y (p=.16) Possible
6 X Y (p=.18) Possible
7 Y (p=.14) Y (p=.034) Supported
8 Y (p=.25) Y (p=.131) Possible
Table 31 General Foremen time allocation by percentage on Task 3 –Safety Related
activities, AWP vs. Traditional
Time Range -A Time Range -B Time Range -C
1 2 3 4 5 6 7 8 9 Count
Training 14 17.2 11.3% 93 92.1 75.0% 17 14.6 13.7% 124
No
Training 6 2.8 30.0% 14 14.9 70.0% 0 2.4 0.0% 20
Count 20 107 17 144
χ2 value 7.141 p value 0.028
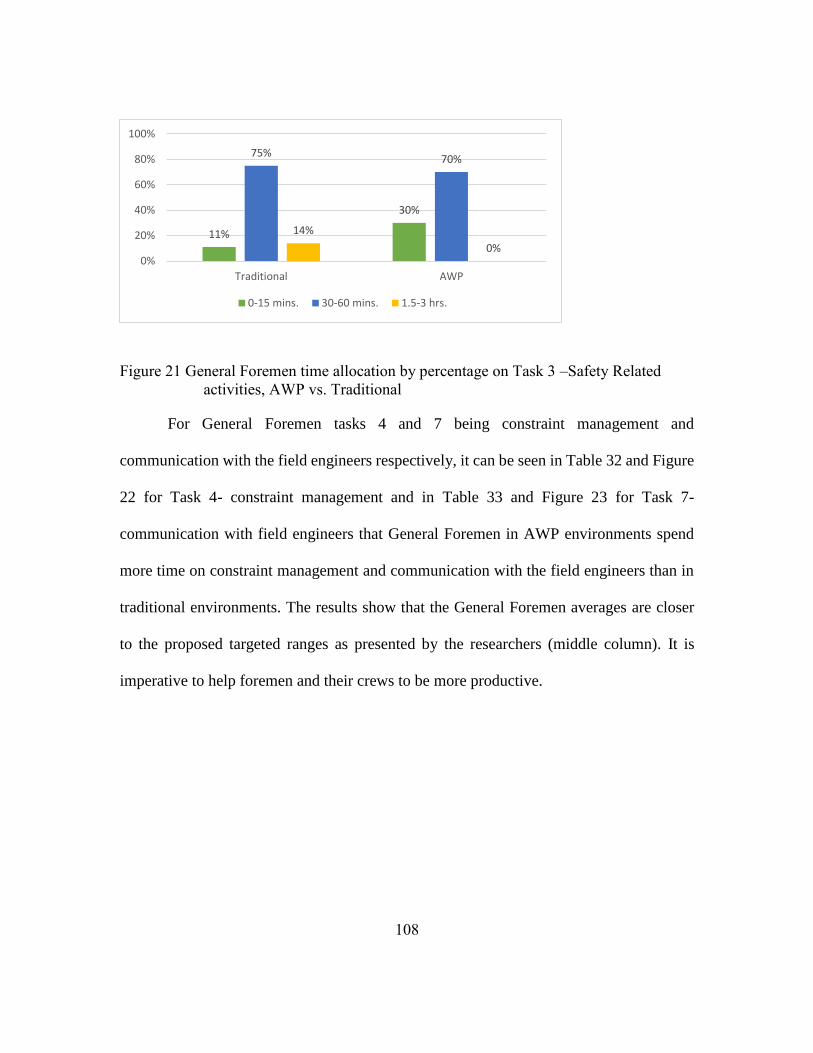
108
Figure 21 General Foremen time allocation by percentage on Task 3 –Safety Related
activities, AWP vs. Traditional
For General Foremen tasks 4 and 7 being constraint management and
communication with the field engineers respectively, it can be seen in Table 32 and Figure
22 for Task 4- constraint management and in Table 33 and Figure 23 for Task 7-
communication with field engineers that General Foremen in AWP environments spend
more time on constraint management and communication with the field engineers than in
traditional environments. The results show that the General Foremen averages are closer
to the proposed targeted ranges as presented by the researchers (middle column). It is
imperative to help foremen and their crews to be more productive.
11%
30%
75%70%
14%
0%0%
20%
40%
60%
80%
100%
Traditional AWP
0-15 mins. 30-60 mins. 1.5-3 hrs.
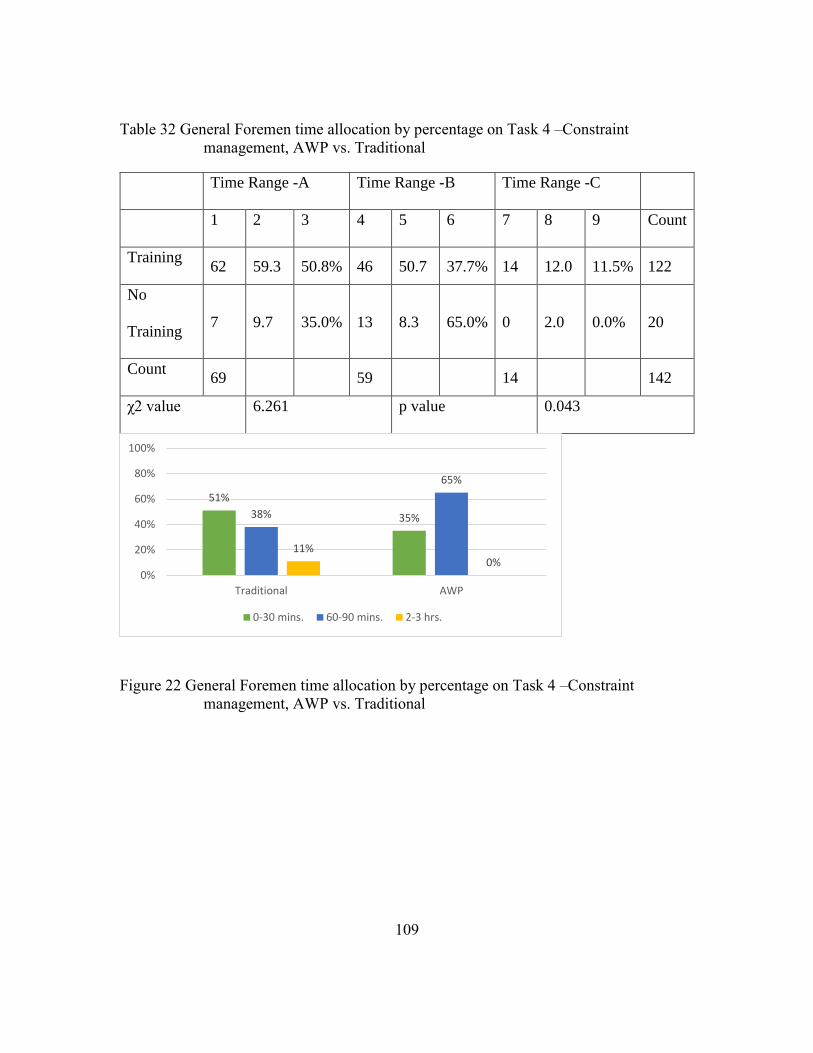
109
Table 32 General Foremen time allocation by percentage on Task 4 –Constraint
management, AWP vs. Traditional
Time Range -A Time Range -B Time Range -C
1 2 3 4 5 6 7 8 9 Count
Training 62 59.3 50.8% 46 50.7 37.7% 14 12.0 11.5% 122
No
Training 7 9.7 35.0% 13 8.3 65.0% 0 2.0 0.0% 20
Count 69 59 14 142
χ2 value 6.261 p value 0.043
Figure 22 General Foremen time allocation by percentage on Task 4 –Constraint
management, AWP vs. Traditional
51%
35%38%
65%
11%0%
0%
20%
40%
60%
80%
100%
Traditional AWP
0-30 mins. 60-90 mins. 2-3 hrs.

110
Table 33 General Foremen time allocation by percentage on Task 7 –Communication
with Field Engineers, AWP vs. Traditional
Time Range -A Time Range -B Time Range -C
1 2 3 4 5 6 7 8 9 Count
Training 32 31.2 26.0% 63 67.6 51.2% 28 24.3 22.8% 123
No
Training 4 4.8 21.1% 15 10.4 78.9% 0 3.7 0.0% 19
Count 36 78 28 142
χ2 value 6.789 p value 0.034
Figure 23 General Foremen time allocation by percentage on Task 7 –Communication
with Field Engineers, AWP vs. Traditional
Also, for General Foremen Task 6 (Table 34 and Figure 24), the survey results show
that the General Foremen in AWP environments spend more time in work package
development and review than in traditional projects. However, the result is not supported
statistically as for AWP adjusted sample, one of the expected counts is less than 4.
26%21%
51%
79%
23%
0%0%
20%
40%
60%
80%
100%
Traditional AWP
0-15 mins. 30-60 mins. 1.5-3 hrs.

111
Table 34 General Foremen time allocation by percentage on Task 6 –Work package
development, AWP vs. Traditional
Time Range -A Time Range -B Time Range -C
1 2 3 4 5 6 7 8 9 Count
Training 45 41.4 37.5% 65 68.2 54.2% 10 10.4 8.3% 120
No
Training 3 6.6 15.8% 14 10.8 73.7% 2 1.6 10.5% 19
Count 48 79 12 139
χ2 value 3.429 p value 0.18
Figure 24 General Foremen time allocation by percentage on Task 6 –Work package
development, AWP vs. Traditional
Other findings for General Foremen are that there is a possible significance on tasks
2: Plan/Prioritize Fallback Work,5: Follow up with Foremen, and 8: Complete timesheets.
While not reaching a level of statistical significance, for Task 2 - Plan/prioritize tasks and
fallback work with foremen, General Foremen spend less time on AWP projects and less
38%
16%
54%
74%
8% 11%
0%
20%
40%
60%
80%
100%
Traditional AWP
0-30 mins. 1-2 hrs. 3-4 hrs.

112
time than the ideal (Figure 25). It may be due to improved planning and constraint
management, requiring less contingency planning. On Task 5 – Follow up with Foremen
and crews, there is a shift with General Foremen spending more time following up with
Foremen throughout the days on the adjusted AWP data, but this is not seen on the larger
set. The researchers also agree that this result might be due to the smaller data sample for
adjusted AWP project. For Task 8 - complete progress reports/timesheets, the General
Foremen on AWP projects note some shift towards the ideal compared to traditional
projects. This may be due to more structured approaches to AWP discipline.
Figure 25 General Foremen time allocation by percentage on Task 2 – Prioritize tasks and
fallback work, AWP vs. Traditional
This chapter aims to justify that the frontline supervisors in AWP environments
spend time more effectively in comparison to their counterparts in traditional
environments. The evidence of lesser external impediments and more constraint
management were also observed during the case study interviews administered on both
traditional and AWP project sites in the US. The section below would compare quotes from
28%
50%51%40%
21%10%
0%
20%
40%
60%
80%
100%
Traditional AWP
0-30 mins. 45-90 mins. 2-3 hrs.

113
frontline supervisors in traditional and AWP environments to qualitatively support the
findings of surveys.
When frontline supervisors were interviewed on industrial sites in North America,
evidence that supports the fact that Advanced Work Packaging enables better constraint
management and helps to improve the performance of frontline supervisors surfaced. Of
total 9 sites on which the interviews were conducted, 2 implemented AWP practices, 3
implemented traditional practices, and 4 were maintenance and rehabilitation sites. As far
as the industrial sector is concerned, 3 were petrochemical plants, 4 were repair and
rehabilitation power production plants, one was manufacturing plant, and one was repair
and rehabilitation chemical plant project. The interview sites were spread demographically
covering four states including Texas, Tennessee, Alabama, and Louisiana. The below
section would provide a comparison of the responses received when frontline supervisors
were interviewed and asked the same questions across the 9 sites interviewed. For
questions pertaining to constraint management, external production impediments faced,
training opportunities available, and work packaging, responses received clearly denote a
difference between the two production environments. These observations are in line with
the previous research studies that support the fact that productivity enhancement practices
including AWP act as a buffer and shield the production from external forces that might
negatively impact the production. It is important to note here that the evidences provided
in the below section highlight the areas which demonstrate qualitative differences between
traditional and AWP environments.

114
Planning impediments to production- engineering deliverables: When questions
related to external impediments to production including problems with engineering
deliverables were asked to the respondents in the two construction environments; the
responses received are elaborated in Table 35 below. A comparison of the responses given
by an Ironworker and Electrical General Foreman in AWP and traditional work
environments on similar scope projects, explains that in AWP construction environments,
accurate engineering deliverables including complete work packages, enable frontline
supervisors in AWP environments to reduce their cognitive load, whereas the frontline
supervisors in traditional environments experience high cognitive load in making decisions
and searching for information which is readily available in work packages in an AWP work
environment.

115
Table 35 Planning impediments to production- engineering deliverables- Interview
Responses
AWP Traditional
Respondent Quote Respondent Quote
Project: AWP site, petrochemical
expansion, Louisiana
Project: Traditional site, petrochemical
expansion, Texas
GF, Ironworker “I have a planner to
keep my stuff
straight. The site is
facing no
engineering issues
and on an average, I
spend 8/10 hours in
the field.
Everything is very
organized, less
rework, injuries,
and more
productive work.”
GF, Electrical “I use my common
sense to plan work
according to the
schedule. Cable
sizes change a lot
and must be changed
last minute.
Coordination
between trades is not
thorough, they get to
know job status only
during
walkthroughs. This
project has serious
issues with errors in
drawings that have
to be sent back for
revision, causing
delays.”
Completeness of Work Packages: When questions related to completeness of work
packages were asked to the respondents in the two construction environments; the
responses received are elaborated in Table 36 below. A comparison of the responses given
by a Workface Planner and Ironworker Foreman in AWP and traditional work
environments on similar scope projects, explains that in AWP construction environments,
work packages are clear and complete and evidence support that after the successful
implementation of AWP, the project was completed in half the time taken by the similar
scope traditional project. Concerns regarding the quality of materials, due to inaccurate

116
drawings was also brought forward to further reinforce the findings of this research chapter.
Similarly, when responses from two other projects, including a petrochemical plant in
Louisiana and a manufacturing plant in Texas, were compared, an Ironworker General
Foreman in AWP environment elaborated on the ease of availability of information in work
packages. However, a Laborer Foreman explained how work packages were incomplete
and the quality of engineering deliverables was not adequate.

117
Table 36 Completeness of Work Packages- Interview Responses
Case 1
AWP Maintenance
Respondent Quote Respondent Quote
Project: Workface planning site,
petrochemical expansion, Texas
Project: Coal power plants, Alabama
Planner, Pipe “Work packages
contain Isometrics
with weld mapping,
model shots, rod
slips, chapterwork,
support details,
equipment
drawings, vessel
drawings, and tower
drawings. High
level of planning
has increased
productivity
figures, for example
in fractionating
tower, without
AWP it took 2
years, whereas with
AWP, only 1 year”
Foreman,
Ironworker
“Parts are fabricated
wrong a lot of
times. They are not
measured as per site
conditions. They
tend to interfere
with the valves.”
Case 2
AWP Traditional
Respondent Quote Respondent Quote
Project: AWP site, petrochemical
expansion, Louisiana
Project: Manufacturing plant, Texas
GF, Ironworker “Work packages
contain model
shots, itemized
materials, cut
sheets, literally
everything”
F, Laborer “Work packages
are not complete,
they are terrible. A
whole lot of
information is
missing. It is not
very well linked up
with other trades.”

118
CONCLUSIONS
The quantitative analysis of surveys including a comparison of time allocation of
frontline supervisors with and without AWP training in both traditional and AWP
environments and comparison of time allocation in traditional and AWP environments
establishes frontline supervisors in AWP environments spend their time more effectively
and in the proposed ideal ranges by the researchers. By qualitative analysis of case study
interviews executed by the researchers in the two environments, the researchers establish
that AWP environments facilitate the frontline supervisors to perform better by providing
complete work packages, engineering deliverables, and active constraint management.
AWP ensures efficient pre-planning from the beginning of the project to turnover of the
facility. Also, the philosophy behind AWP to provide right things to the right people at the
right time ensures that frontline supervisors spend maximum time in supervising and
motivating their crew and ensuring production.
The research team proposes to the industry to make a unified investment to adopt
productivity enhancing practices to ensure that the construction productivity increases.
AWP provides more predictability to the dynamic construction projects and aims to reduce
non-productive time. The participating members of Research team and interviewees on the
AWP sites recommend AWP practices on industrial construction projects. The improved
predictability and productivity on industrial construction projects is imperative.
119
Chapter 5: Construction Foremen and General Foremen Perceptions of
Impediments to their Productivity
The perception of craft workers of the factors affecting their construction
productivity has been quantified in a CII sponsored research project RT 215 titled “Work
Force View of Construction Productivity” which quantified the relative impact of eighty-
three productivity factors and involved nearly two thousand craft workers out of which
nearly twenty-six percent were Foremen and General Foremen (Construction Industry
Institute 2006). This research was conducted in 2006 and it presented the top ten most
significant factors which influenced the productivity of construction craft workers. It was
deduced that seven of the top ten factors involved equipment, tools and consumables, and
materials. The remaining two factors involved engineering drawing management including
errors and incomplete engineering information.
CII RT 215 published the results on workforce view of construction productivity.
The results are based on both Frequency and intensity scales defined. Based on the results
published by the research mentioned above and Delphi Method involving expert opinion
of construction professionals in the CII Research team RT 330 titled “Improving Frontline
Supervision in Industrial Construction” identified five field impediments and six planning
impediments to construction productivity. Along with identifying the impediments, this
research surveyed foremen and general foremen and presented an average of their
responses on a 5-point Likert scale. It also compared the average scores across different
productivity regimes including traditional and AWP projects for both Foremen and General
Foremen. The purpose of this analysis was to compare the results with the results of the

120
research team in 2006 and compare differences if any. Research team RT 330 observed
that the productivity impediments defined in RT 215 remain the top impediments today
faced by the frontline supervisors.
The sections below would firstly list the field and planning impediments identified
by the team. Secondly, they would elaborate on the five-point Likert scale and the
associated ratings. A further analysis is presented which would compare the averages
across the different productivity regimes for both Foremen and General Foremen. T-tests
are also performed on the data sample to compare the averages in two different groups and
establish statistical significance in the difference of means of the two samples being
compared namely traditional and AWP environments. The previous chapters of the thesis
have established the research hypothesis with regards to the difference in AWP and
traditional environments.

121
Table 37 Field and Planning/Workforce Impediments to Construction Productivity
Part A: Field Impediments to Construction Productivity
1. Waiting for Material
2. Waiting for Equipment (for example crane, forklift, etc.)
3. Problems with power tools (availability, reliability, power sources, etc.)
4. Quality problems in case of prefabricated items
5. Scaffolding issues
Part B: Planning/Workforce Impediments to Construction Productivity
1. Errors in Engineering Drawings/ Inadequate Engineering Support
2. Lack of effective Pre-Planning
3. Current skill level of the workforce
4. Field changes/ Rework
5. Manpower Turnover
6. Work disruptions
Along with identifying the impediments, this research asked Foremen and General
Foremen on industrial construction sites in the United States and Canada to rate the
impediments on their respective construction sites on a scale of 1 to 5. The Likert scale is
presented below:
(1)
Never
(2)
Rarely
(3)
Sometimes
(4)
Often
(5)
Always

122
With 1 being that the impediment is never faced, and 5 being that the impediment
occurs very frequently on their construction job site. The scale is by the frequency of
occurrence of the respective construction productivity Impediments. The average results
for each of the above categories for a total of 1140 respondents including 812 Foremen and
328 General Foremen have been presented in this section. The mean scores are presented
in Table 38.
Table 38 General Foremen and Foremen Average scores- Impediments
Part A: Field Impediments GF Avg. F Avg.
Waiting for Material 3.16 3.11
Waiting for Equipment 2.82 2.97
Problems with power tools 2.31 2.30
Quality problems in case of prefabricated items 2.49 2.43
Scaffolding issues 2.57 2.59
Part B: Planning/Workforce Impediments GF Avg. F Avg.
Errors in Engineering Drawings 2.75 2.61
Lack of effective Pre-Planning 2.72 2.63
Current skill level of the workforce 2.91 2.84
Field changes/ Rework 2.94 2.89
Manpower Turnover 2.58 2.57
Work disruptions 2.76 2.74

123
For Field impediments, the average rating for General Foremen varied between
2.31 (between rarely and sometimes) for “Problems with power tools” and 3.16 (between
sometimes and often) for “Waiting for Material”. For Foremen, the average rating varied
between 2.30 (between rarely and sometimes) for “Power Tools” and 3.11 (between
sometimes and often) for “Waiting for Material”. Hence, it is observed that both the
Foremen and General Foremen, the least and most occurring impediments to productivity
remain the same being associated with power tools and material respectively. Generally,
the average rating for each of the field impediments for Foremen is less than that for
General Foremen apart from that in “Waiting for Equipment” and “Scaffolding issues”.
However, the reasoning behind the averages cannot be explained.
For Planning/Workforce Impediments, the average rating for General Foremen
varied between 2.58 (between rarely and sometimes) for “Manpower Turnover” and 2.94
(between rarely and sometimes) for “Field Changes/Rework”. For Foremen, the average
rating varied between 2.57 (between rarely and sometimes) for “Manpower Turnover” and
2.89 (between rarely and sometimes) for “Field Changes/Rework”. Hence, it is observed
that both the Foremen and General Foremen, the least and most occurring impediments to
productivity remain the same being associated with “Manpower turnover” and “Field
changes/rework” respectively. For each of the planning/workforce impediments, the
average rating for Foremen is less than that for General Foremen. However, the reasoning
behind the averages cannot be explained.
After comparing the average of responses for Field and Planning Impediments for
both Foremen and General Foremen for all projects and all responses together. The

124
research team compared the means of the two samples including traditional and AWP
projects for each of the 5 Field Impediments and 6 Planning/Workforce Impediments. After
separating responses in two different sample sets including traditional and AWP
environments, t-tests were performed on each of the categories listed above separately to
establish the difference in means. The results of the t-test including p-values have been
provided in Table 39 and Table 40.
Table 39 General Foremen Productivity Impediments, Traditional vs. AWP
General Foremen
Part A: Field Impediments Traditional AWP p-value
Waiting for Material 3.35 3.19 0.203
Waiting for Equipment 2.94 2.96 0.441
Problems with power tools 2.44 2.20 0.045
Quality problems in case of prefabricated items 2.46 2.98 0.003
Scaffolding issues 2.51 3.15 0.0006
Part B: Planning/Workforce Impediments Traditional AWP p-value
Errors in Engineering Drawings 2.86 2.36 0.002
Lack of effective Pre-Planning 2.84 2.56 0.062
Current skill level of the workforce 2.92 2.75 0.165
Field changes/ Rework 2.98 2.89 0.262
Manpower Turnover 2.72 2.45 0.042
Work disruptions 2.88 2.52 0.009
125
For General Foremen Field impediments based on the frequency of occurrence on
their respective job sites, in accordance with the Hypothesis; 2 out of 5 impediments
including Waiting for material and power tools the General Foremen in AWP environment
rate frequency of impediments lesser than those in traditional environments. According to
the research hypothesis, in AWP work environments, due to effective pre-planning and
shielding of the work environment from external impediments, it is observed that these
working environments face lesser productivity impediments in comparison to the
traditional environments. Further, it is observed that the result is not statistically significant
for a p-value of 0.20 for the category of “Waiting for Material”. It is statistically significant
for a p-value of 0.045 in the category of “Problem with Power Tools”. T-tests are
performed assuming one side hypothesis that the mean of responses for traditional
environments would be more than the mean of responses for AWP environments.
Assuming this hypothesis, and corresponding to the t-value, the software is used to
calculate the p-value. The accepted p-value in social sciences research is 0.10.
For Planning/Workforce impediments, for all the categories, the respondents in
traditional work environments have marked the impediments on a higher scale in
comparison to the respondents in the AWP environments. The result of the difference in
means holds statistical significance with a p-value of less than 0.10 for 4 out of 6 categories.

126
Table 40 Foremen Productivity Impediments, Traditional vs. AWP
Foremen
Part A: Field Impediments Traditional AWP p-value
Waiting for Material 3.35 3.16 0.029
Waiting for Equipment 3.23 2.83 1.81E-05
Problems with power tools 2.41 2.20 0.009
Quality problems in case of prefabricated items 2.46 2.69 0.009
Scaffolding issues 2.44 3.06 2.77E-08
Part B: Planning/Workforce Impediments Traditional AWP p-value
Errors in Engineering Drawings 2.70 2.38 0.0001
Lack of effective Pre-Planning 2.79 2.47 0.0004
Current skill level of the workforce 2.90 2.72 0.032
Field changes/ Rework 3.00 2.82 0.025
Manpower Turnover 2.68 2.42 0.001
Work disruptions 2.78 2.57 0.004
For Foremen Field impediments based on the frequency of occurrence on their
respective job sites, in accordance with the Hypothesis; 3 out of 5 impediments including
Waiting for material, power tools, and waiting for equipment the Foremen in AWP
environment rate frequency of impediments lesser than those in traditional environments.

127
Further, it is observed that the result is statistically significant for all the three above stated
impediments to productivity.
For Planning/Workforce impediments, for all the categories, the respondents in
traditional work environments have marked the impediments on a higher scale in
comparison to the respondents in the AWP environments. The result of the difference in
means holds statistical significance with a p-value of less than 0.10 for all the six
categories.
These results support the hypothesis, as presented by the research that for AWP
environments, the impediments are lessened due to the effective pre-planning and buffers
to production. This is said, keeping in mind that the rating may also be a function of the
organizational structure and other external factors that might not have been covered in the
survey. The research team also suggests further investigation with more demographically
spread projects and different production environments within the heavy and light industrial
projects. The results are also in line with the productivity impediments as highlighted
during another CII sponsored research on “RT 215: Work Force view of Construction
Productivity”.

128
Chapter 6: Conclusions
The several hundred surveys and interviews conducted by RT 330 have validated
the hypotheses that, in general, the Foremen and General Foremen working on today’s
industrial construction sites exhibit room for improvement in the competencies needed to
lead and manage their workforce effectively. Also, frontline supervisors in industrial
construction projects are spending considerable time on tasks apart from what the Research
Team RT330, considers ideal or target ranges. Further, the results also exhibit that frontline
supervisors in AWP environments spend their time more effectively in comparison to their
counterparts in traditional work environments. Also, AWP training is observed to have a
positive impact on frontline supervisors in both traditional and AWP execution
environments. The Research team has also suggested by statistical analysis that the
impediments faced by frontline supervisors in AWP environments are lesser in scale when
compared to their counterparts in traditional settings. Having deduced this, by analysis of
surveys and interviews, the researchers also acknowledge that the results might be due to
the internal characteristics and organizational structures of the projects considered. Hence
the research team further suggests more research demographically and across different
production environments within the industrial sector.
Principal conclusions of the research are that:
1. Foremen and General Foremen have ten core competencies that are
uniformly seen as important to their performance. These fundamental competencies are the
same across all project types (traditional, maintenance, and Advanced Work Packaging).

129
2. Survey and interview data support the hypothesis that both Foremen and
General Foremen competency levels in the industry are below desirable levels. This is
particularly true for Foremen. Investment to improve these competencies may be one of
the biggest opportunities the industry has to improve construction productivity and
performance.
3. On all project types, survey results show that Foremen and General
Foremen spend a considerable amount of time away from what the research team
designated as ideal or target time budgeted for their primary tasks. While some variation is
to be expected, better allocation of frontline supervisor time could yield significant
productivity improvements.
4. There is evidence that Advanced Work Packaging improves frontline
supervision time on task compared to traditional projects. Time differences are significant
in aggregate. Interview results demonstrate AWP project frontline supervisors provide
more uniformly focused answers about their tasks than do traditional project frontline
supervisors.
5. AWP training is generally seen as beneficial to Foremen and General
Foremen on both traditional and AWP projects.
6. 5 Field and 6 Planning impediments are identified in this thesis. For General
Foremen, 2 out of 5 field impediments and all 6 planning impediments, the respondents in
traditional execution environments face impediments on a higher scale than their
counterparts in AWP projects. Similarly for Foremen, 3 out of 5 field impediments and all
6 planning impediments, the respondents in traditional execution environments face

130
impediments on a higher scale than their counterparts in AWP projects. These results
support the hypothesis, as presented by the research that for AWP environments, the
impediments are lessened due to the effective pre-planning and buffers to production.
Concluding Observations
Frontline supervisors are the managers who have the most influence on day-to-day
work that determines field productivity. As an industry, we have underinvested in
education and in associated screening, retention, and promotion of Foremen and General
Foremen. This is seen in poor assessment of their competencies and in the varied way they
allocate their time. Even small changes in how Foremen and General Foremen spend their
day can, in aggregate, make significant improvements to productivity of crews. While the
findings for the industry show significant problems, this also means there is a direct
opportunity to improve. As an industry, we have many challenges to improve the skills and
competencies of the field workforce. Not all of these are easily addressable. However,
investing in Foremen and General Foremen is a tangible action the industry can take to
improve that will show benefits.

131
Appendices
APPENDIX A- SUPERINTENDENTS AND CRAFT MANAGERS SURVEY
The purpose of this survey is to gather data about Foremen and General Foremen skills and competencies. This is part of Construction Industry Institute (CII)
sponsored research regarding the role of frontline supervision in enhancing productivity. Your assistance will help to understand the skills and competencies of
Foremen and General Foremen across the industry and will help focus efforts for improvement. You have been selected to participate in this survey. Your responses in
the survey will be kept highly confidential.
SECTION 1: TRADE FOREMAN/GENERAL FOREMAN SKILL/COMPETENCY COMPARISON
Please consider and give responses only for the trades of which you are
knowledgeable.
Do you believe Foremen/General Foreman skills vary across trades or disciplines?
□ Yes □No
For each trade Foreman/General Foreman below, please provide your feedback on whether each trade is stronger, average, or weaker as compared to all other trades.
(Place an “X” in the appropriate column for each trade)
Table A.1 Table comparing skills among different trades
Trade Foreman/
General Foreman
Stronger Average Weaker Don’t know/
unsure
Civil/ Labor
Millwrights
Iron Workers
Pipefitters
Pipefitter
Welders
Boilermakers
Electricians/
Instrumentation workers
Insulation
workers
Carpenters
Sheet Metal
Workers
Painters
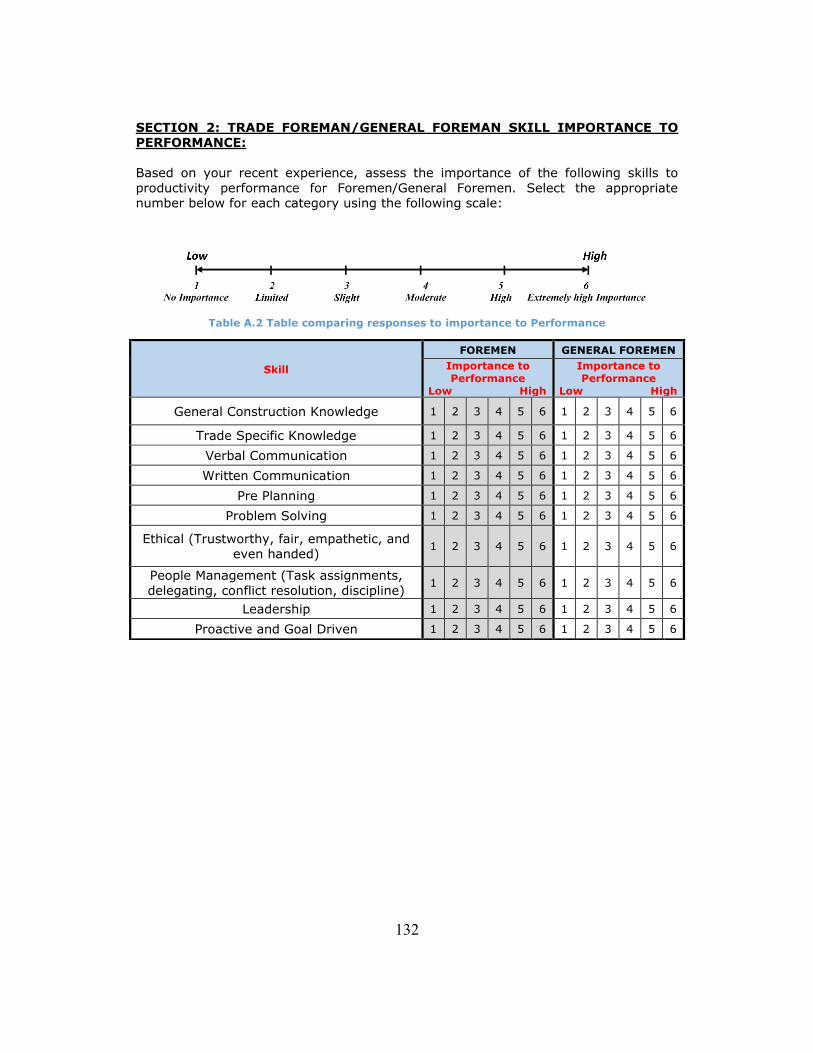
132
SECTION 2: TRADE FOREMAN/GENERAL FOREMAN SKILL IMPORTANCE TO PERFORMANCE:
Based on your recent experience, assess the importance of the following skills to
productivity performance for Foremen/General Foremen. Select the appropriate number below for each category using the following scale:
Table A.2 Table comparing responses to importance to Performance
Skill
FOREMEN GENERAL FOREMEN
Importance to
Performance
Low High
Importance to
Performance
Low High
General Construction Knowledge 1 2 3 4 5 6 1 2 3 4 5 6
Trade Specific Knowledge 1 2 3 4 5 6 1 2 3 4 5 6
Verbal Communication 1 2 3 4 5 6 1 2 3 4 5 6
Written Communication 1 2 3 4 5 6 1 2 3 4 5 6
Pre Planning 1 2 3 4 5 6 1 2 3 4 5 6
Problem Solving 1 2 3 4 5 6 1 2 3 4 5 6
Ethical (Trustworthy, fair, empathetic, and even handed)
1 2 3 4 5 6 1 2 3 4 5 6
People Management (Task assignments,
delegating, conflict resolution, discipline) 1 2 3 4 5 6 1 2 3 4 5 6
Leadership 1 2 3 4 5 6 1 2 3 4 5 6
Proactive and Goal Driven 1 2 3 4 5 6 1 2 3 4 5 6

133
SECTION 3: TRADE GENERAL FOREMAN SKILL ASSESSMENT:
Based on your recent experience, assess the skills for General Foremen. Select the appropriate number below for each category using the following scale:
Table A.3 Table for observed skill level
Skill
FOREMEN GENERAL
FOREMEN
Observed skill
level
Low High
Observed skill
level
Low High
General Construction Knowledge 1 2 3 4 5 6 1 2 3 4 5 6
Trade Specific Knowledge 1 2 3 4 5 6 1 2 3 4 5 6
Verbal Communication 1 2 3 4 5 6 1 2 3 4 5 6
Written Communication 1 2 3 4 5 6 1 2 3 4 5 6
Pre Planning 1 2 3 4 5 6 1 2 3 4 5 6
Problem Solving 1 2 3 4 5 6 1 2 3 4 5 6
Ethical (Trustworthy, fair, empathetic, and even handed)
1 2 3 4 5 6 1 2 3 4 5 6
People Management (Task assignments, delegating, conflict resolution, discipline)
1 2 3 4 5 6 1 2 3 4 5 6
Leadership 1 2 3 4 5 6 1 2 3 4 5 6
Proactive and Goal Driven 1 2 3 4 5 6 1 2 3 4 5 6

134
SECTION 4: GENERAL INFORMATION:
• What is your role in the organization?
□ Site Manager □Construction Manager
□General Superintendent
□Craft Superintendent
□ Project Manager □ Project Director □Other
If you selected other, specify ____________________________________________
• Please indicate your years of construction experience:
□ 0-5 □ 5-10 □ 10-15 □ 15-20 □ 20-25 □ >25
• Primary Geographic Region of work:
□Northwest
(WA, OR,
ID)
□Southwest
(CA, NV,
AZ)
□Mountain
(MT, WY,
ID, UT,
CO, SD,
ND)
□Central
(NE, IA,
KS, MO,
NM, OK,
AR, LA,
TX)
□Midwest
(MN, WI,
IL, OH,
MI, IN)
□Northeast
(PA, WV,
VA, NY,
VT, NH,
MA, RI,
CT)
□Southeast
(KY, TN,
NC, SC,
MS, AL,
GA, FL)
□Canada
(West)
□Canada
(East)
• Please indicate your type of work
□ Heavy Industrial □ Light Industrial
• Please indicate the primary labour contract type you work under:
□ Lump Sum □ Unit Rate □ Reimbursable
• What is the average number of craft/workforce on projects that you manage?
□ 0-50 □ 51-150 □ 151-300 □ 301-500 □ 501-1000 □ >1000
• Primary form of labour agreement you work under:
□ Union □ Open Shop □ Other Labor Agreements
• Does your work typically utilize: (Check all that apply)
□ Advanced Work Packaging (AWP)
□Work Face Planning (WFP)
□ Lean Construction □ Six Sigma
• What is the total project cost of your current project in millions?
□ 0-15 □ 16-50 □ >51

135
SECTION 5: PRODUCTTIVITY IMPEDIMENTS AND SUGGESTIONS:
The next two questions ask you to rate productivity impediments on basis of frequency on a scale of 1 to 5. Select the appropriate number below for each
category using the following scale.
• Rate the following impediments on basis of frequency in terms of effect on productivity.
Field Impediments Frequency
Low High
Waiting for material 1 2 3 4 5
Waiting for equipment (for example crane, forklift, etc.) 1 2 3 4 5
Problems with power tools (availability, reliability, power
sources, etc.)
1 2 3 4 5 Quality problems in case of prefabricated items 1 2 3 4 5
Scaffolding issues 1 2 3 4 5
• Rate the following impediments on basis of frequency in terms of effect on
productivity.
Planning/ Workforce Impediments Frequency
Low High
Errors in engineering drawings/ Inadequate engineering support
1 2 3 4 5
Lack of effective preplanning 1 2 3 4 5
Current skill level of the workforce 1 2 3 4 5
Field changes / rework 1 2 3 4 5
Manpower turnover 1 2 3 4 5
Work disruptions 1 2 3 4 5
• Please state other impediments if they are not in the above lists:
____________________________________________________________________________________________________________________________________
____________________________________________________________________________________________________________________________________
• What suggestions do you have to increase productivity?
____________________________________________________________________________________________________________________________________
____________________________________________________________________________________________________________________________________
(1)
Never
(2)
Rarely
(3)
Sometimes
(4)
Often
(5)
Always
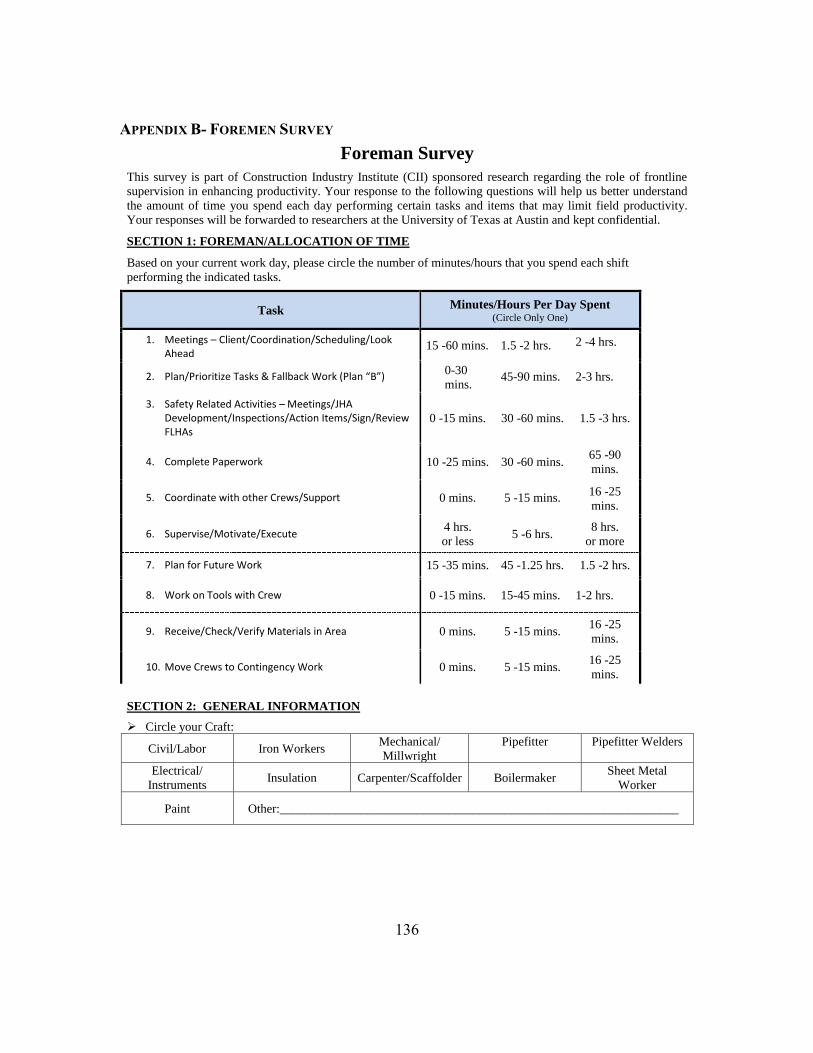
136
APPENDIX B- FOREMEN SURVEY
Foreman Survey
This survey is part of Construction Industry Institute (CII) sponsored research regarding the role of frontline
supervision in enhancing productivity. Your response to the following questions will help us better understand
the amount of time you spend each day performing certain tasks and items that may limit field productivity.
Your responses will be forwarded to researchers at the University of Texas at Austin and kept confidential.
SECTION 1: FOREMAN/ALLOCATION OF TIME
Based on your current work day, please circle the number of minutes/hours that you spend each shift
performing the indicated tasks.
Task Minutes/Hours Per Day Spent
(Circle Only One)
1. Meetings – Client/Coordination/Scheduling/Look Ahead
15 -60 mins. 1.5 -2 hrs. 2 -4 hrs.
2. Plan/Prioritize Tasks & Fallback Work (Plan “B”) 0-30
mins. 45-90 mins. 2-3 hrs.
3. Safety Related Activities – Meetings/JHA Development/Inspections/Action Items/Sign/Review FLHAs
0 -15 mins. 30 -60 mins. 1.5 -3 hrs.
4. Complete Paperwork 10 -25 mins. 30 -60 mins. 65 -90
mins.
5. Coordinate with other Crews/Support 0 mins. 5 -15 mins. 16 -25
mins.
6. Supervise/Motivate/Execute 4 hrs.
or less 5 -6 hrs.
8 hrs.
or more
7. Plan for Future Work 15 -35 mins. 45 -1.25 hrs. 1.5 -2 hrs.
8. Work on Tools with Crew 0 -15 mins. 15-45 mins. 1-2 hrs.
9. Receive/Check/Verify Materials in Area 0 mins. 5 -15 mins. 16 -25
mins.
10. Move Crews to Contingency Work 0 mins. 5 -15 mins. 16 -25
mins.
SECTION 2: GENERAL INFORMATION
➢ Circle your Craft:
Civil/Labor Iron Workers Mechanical/
Millwright
Pipefitter
Pipefitter Welders
Electrical/
Instruments Insulation Carpenter/Scaffolder Boilermaker
Sheet Metal
Worker
Paint Other:________________________________________________________________

137
➢ Circle your current phase of Job:
Mobilization/
Pre-Construction
Construction/
Bulk Construction Start-Up & Commissioning
➢ Circle your Shift:
8 Hour 10 Hour 12 Hour
➢ Circle your years of construction experience:
1-5 6-10 11-15 16-20 21 or more
➢ Circle your years of supervisory experience:
1-5 6-10 11-15 16-20 21 or more
➢ Circle the appropriate current Geographic Region of work:
Northwest (WA, OR, ID)
Southwest (CA, NV, AZ)
Mountain (MT, WY, ID, UT,
CO, SD, ND)
Central
(NE, IA, KS,
MO, NM, OK,
AR, LA, TX)
Midwest (MN, WI, IL,
OH, MI, IN)
Northeast (PA, WV, VA,
NY, VT, NH, MA,
RI, CT)
Southeast
(KY, TN, NC,
SC, MS, AL, GA,
FL)
Canada (West)
Canada (East)
➢ Circle your type of work:
Heavy Industrial Light Industrial
➢ Circle the ‘typical’ crew size you are supervising?
1-5 6-10 11-15 16-20 21+
➢ Are you a union member? □Yes □No
➢ Are you currently working on a union project? □Yes □No
➢ What is the total project cost of your current project cost in millions?
0-15 16-50 >51
➢ Does your work currently utilize: (Check all that apply)?
□Advanced Work
Packaging (AWP)
□Work Face Planning
(WFP)
□Lean
Construction
□Six
Sigma

138
➢ Circle your current phase of Job:
Mobilization/
Pre-Construction
Construction/
Bulk Construction Start-Up & Commissioning
➢ Circle your Shift:
8 Hour 10 Hour 12 Hour
➢ Circle your years of construction experience:
1-5 6-10 11-15 16-20 21 or more
➢ Circle your years of supervisory experience:
1-5 6-10 11-15 16-20 21 or more
➢ Circle the appropriate current Geographic Region of work:
Northwest (WA, OR, ID)
Southwest (CA, NV, AZ)
Mountain (MT, WY, ID, UT,
CO, SD, ND)
Central
(NE, IA, KS,
MO, NM, OK,
AR, LA, TX)
Midwest (MN, WI, IL,
OH, MI, IN)
Northeast (PA, WV, VA,
NY, VT, NH, MA,
RI, CT)
Southeast
(KY, TN, NC,
SC, MS, AL, GA,
FL)
Canada (West)
Canada (East)
➢ Circle your type of work:
Heavy Industrial Light Industrial
➢ Circle the ‘typical’ crew size you are supervising?
1-5 6-10 11-15 16-20 21+
➢ Are you a union member? □Yes □No
➢ Are you currently working on a union project? □Yes □No
➢ What is the total project cost of your current project cost in millions?
0-15 16-50 >51
➢ Does your work currently utilize: (Check all that apply)?
□Advanced Work
Packaging (AWP)
□Work Face Planning
(WFP)
□Lean
Construction
□Six
Sigma

139
The next two questions ask you to rate productivity impediments on basis of frequency on a scale of 1 to 5.
Select the appropriate number below for each category using the following scale.
➢ Rate the following impediments on basis of frequency in terms of effect on productivity.
Field Impediments Frequency
Low High
Waiting for material 1 2 3 4 5
Waiting for equipment (for example crane, forklift, etc.) 1 2 3 4 5
Problems with power tools (availability, reliability, power sources, etc.)
1 2 3 4 5
Quality problems in case of prefabricated items 1 2 3 4 5
Scaffolding issues 1 2 3 4 5 ➢ Rate the following impediments on basis of frequency in terms of effect on productivity.
Planning/ Workforce Impediments Frequency
Low High
Errors in engineering drawings/ Inadequate engineering support 1 2 3 4 5
Lack of effective preplanning 1 2 3 4 5
Current skill level of the workforce 1 2 3 4 5
Field changes / rework 1 2 3 4 5
Manpower turnover 1 2 3 4 5
Work disruptions 1 2 3 4 5 ➢ Please state other impediments if they are not in the above lists:
_______________________________________________________________________________________
_______________________________________________________________________________________
➢ What suggestions do you have to increase productivity?
_______________________________________________________________________________________
_______________________________________________________________________________________
➢ Have you had training in any of the following areas (check all that apply):
• Safety • Quality Control • Scheduling
• Estimating
• Effective Communication
• Lean Construction
• Supervisory Skills
• AWP/WFP
• Time Motion Studies
• 3D/BIM Model
• Time Management
Is there any specific training you would like to receive that would increase your productivity?
_______________________________________________________________________________________
_______________________________________________________________________________________
➢ Do you have clerical or administrative support? □Yes □No
Do you have access to a computer? □Yes □No
(1)
Never
(2)
Rarely
(3)
Sometimes
(4)
Often
(5)
Always

140
APPENDIX C- GENERAL FOREMEN SURVEY
General Foreman Survey
This survey is part of Construction Industry Institute (CII) sponsored research regarding the role of frontline
supervision in enhancing productivity. Your response to the following questions will help us better understand
the amount of time you spend each day performing certain tasks and items that may limit field productivity.
Your responses will be forwarded to researchers at the University of Texas at Austin and kept confidential.
SECTION 1: GENERAL FOREMAN/ALLOCATION OF TIME
Based on your current work day, please circle the number of minutes/hours that you spend each shift
performing the indicated tasks.
Task
Minutes/Hours
Per Day Spent (Circle Only One)
1. Meetings – Client/Coordination/Scheduling/Look
Ahead 15 -60 mins. 1.5 -2 hrs. 2 -4 hrs.
2. Plan/Prioritize Tasks & Fallback Work (Plan “B”) with
Foremen 0 -30 mins. 45 -90 mins. 2 -3 hrs.
3. Safety Related Activities – Meetings/JHA
Development/Inspections/Action Items/Sign/Review
FLHAs
0 -15 mins. 30 -60 mins. 1.5 -3 hrs.
4. Constraint Mgt. – Ensure FM has all Crane
support/crane/scaffold/Material/Equipment 0 -30 mins. 60 -90 mins. 2 -3 hrs.
5. Follow up with FM & Crews Throughout Day – Work
Area Reviews/Productivity Check in Field 30 -45 mins. 1.5 -3 hrs. 4 -6 hrs.
6. Work Package Development – Model Review/FIWP
Review/FIWP Schedule/Close-Out FIWPs 0 -30 mins. 1 -2 hrs. 3 -4 hrs.
7. Communicate with Field Engineers – Develop
Estimates for Extra Work/RFIs 0 -15 mins. 30 -60 mins. 1.5 -3 hrs.
8. Complete Progress/Timesheets/Forecasts/Review
Installed Quantities/Cost Codes 0 -15 mins. 30 -60 mins. 1.5 -3 hrs.
SECTION 2: GENERAL INFORMATION
➢ Circle your Craft:
Civil/Labor Iron Workers Mechanical/
Millwright
Pipefitter
Pipefitter Welders
Electrical/
Instruments Insulation Carpenter/Scaffolder Boilermaker
Sheet Metal
Worker
Paint Other:________________________________________________________________

141
➢ Circle your current phase of Job:
Mobilization/
Pre-Construction
Construction/
Bulk Construction Start-Up & Commissioning
➢ Circle your Shift:
8 Hour 10 Hour 12 Hour
➢ Circle your years of construction experience:
1-5 6-10 11-15 16-20 21 or more
➢ Circle your years of supervisory experience:
1-5 6-10 11-15 16-20 21 or more
➢ Circle the appropriate current Geographic Region of work:
Northwest (WA, OR, ID)
Southwest (CA, NV, AZ)
Mountain (MT, WY, ID, UT,
CO, SD, ND)
Central
(NE, IA, KS,
MO, NM, OK,
AR, LA, TX)
Midwest (MN, WI, IL,
OH, MI, IN)
Northeast (PA, WV, VA,
NY, VT, NH, MA,
RI, CT)
Southeast
(KY, TN, NC,
SC, MS, AL, GA,
FL)
Canada (West)
Canada (East)
➢ Circle your type of work:
Heavy Industrial Light Industrial
➢ Circle the ‘typical’ number of Foreman you are supervising?
1-2 3-4 5-6 7-8 8-10
➢ Are you a union member? □Yes □No
➢ Are you currently working on a union project? □Yes □No
➢ What is the total project cost of your current project in millions?
0-15 16-50 >51
➢ Does your work currently utilize? (Check all that apply)
□Advanced Work
Packaging (AWP)
□Work Face Planning
(WFP)
□Lean
Construction
□Six
Sigma
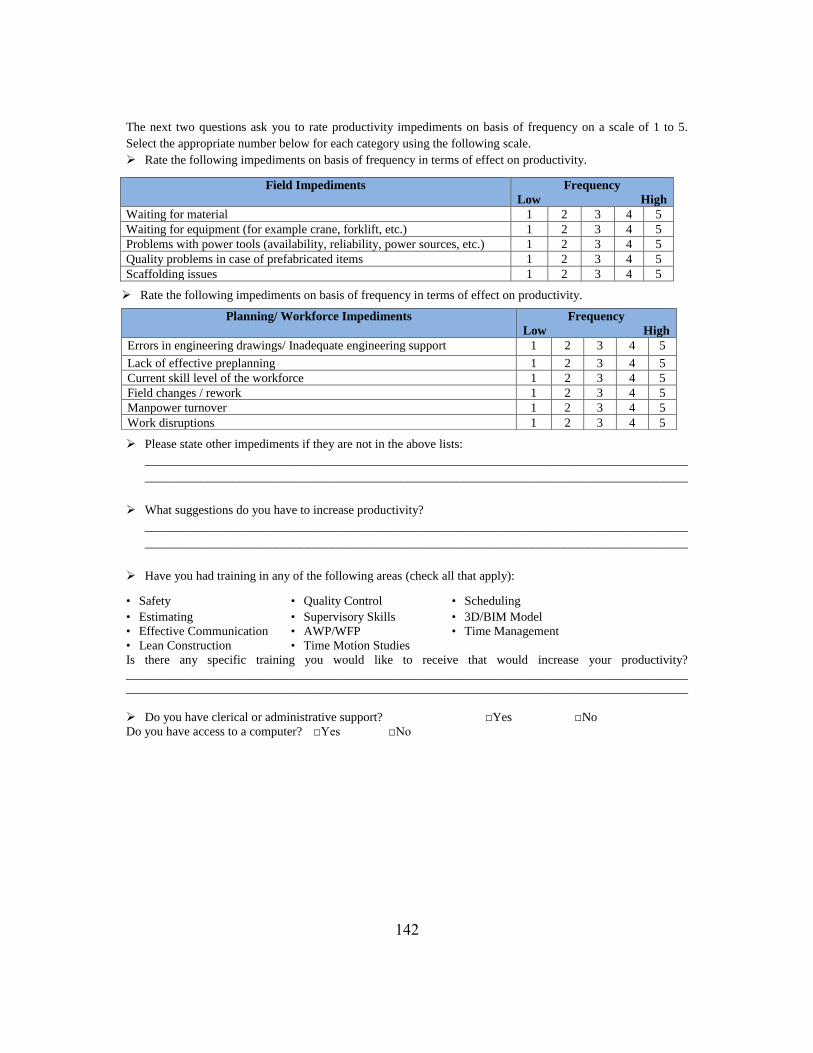
142
The next two questions ask you to rate productivity impediments on basis of frequency on a scale of 1 to 5.
Select the appropriate number below for each category using the following scale.
➢ Rate the following impediments on basis of frequency in terms of effect on productivity.
Field Impediments Frequency
Low High
Waiting for material 1 2 3 4 5
Waiting for equipment (for example crane, forklift, etc.) 1 2 3 4 5
Problems with power tools (availability, reliability, power sources, etc.)
1 2 3 4 5
Quality problems in case of prefabricated items 1 2 3 4 5
Scaffolding issues 1 2 3 4 5 ➢ Rate the following impediments on basis of frequency in terms of effect on productivity.
Planning/ Workforce Impediments Frequency
Low High
Errors in engineering drawings/ Inadequate engineering support 1 2 3 4 5
Lack of effective preplanning 1 2 3 4 5
Current skill level of the workforce 1 2 3 4 5
Field changes / rework 1 2 3 4 5
Manpower turnover 1 2 3 4 5
Work disruptions 1 2 3 4 5 ➢ Please state other impediments if they are not in the above lists:
_______________________________________________________________________________________
_______________________________________________________________________________________
➢ What suggestions do you have to increase productivity?
_______________________________________________________________________________________
_______________________________________________________________________________________
➢ Have you had training in any of the following areas (check all that apply):
• Safety • Quality Control • Scheduling
• Estimating
• Effective Communication
• Lean Construction
• Supervisory Skills
• AWP/WFP
• Time Motion Studies
• 3D/BIM Model
• Time Management
Is there any specific training you would like to receive that would increase your productivity?
__________________________________________________________________________________________
__________________________________________________________________________________________
➢ Do you have clerical or administrative support? □Yes □No
Do you have access to a computer? □Yes □No

143
SECTION 3: TRADE FOREMAN SKILL ASSESSMENT:
Based on your recent experience, assess the average skills of foremen in each of the following categories.
This rating will be used to help focus recommendations for education and skills improvement. Select the
appropriate number below for each category using the following scale:
Skill Observed skill level
Low High
General Construction Knowledge 1 2 3 4 5 6
Trade Specific Knowledge 1 2 3 4 5 6
Verbal Communication 1 2 3 4 5 6
Written Communication 1 2 3 4 5 6
Pre Planning 1 2 3 4 5 6
Problem Solving 1 2 3 4 5 6
Ethical (Trustworthy, fair, empathetic, and even handed) 1 2 3 4 5 6
People Management (Task assignments, delegating, conflict
resolution, discipline) 1 2 3 4 5 6
Leadership 1 2 3 4 5 6
Proactive and Goal Driven 1 2 3 4 5 6

144
APPENDIX D- SUPERINTENDENT SURVEY- DATA
Q1.2 - Please indicate your current role in the organization. Responses include;
1.Foreman 2.General Foreman 3.Superintendents and Managers with craft knowledge.
Please select Option 3 if your role includes but is not limited to the following: Site
Manager, Construction Manager, General Superintendent, Craft Superintendent, Project
Manager, Project Director or equivalent positions
Answer % Count
1 3. Superintendents and managers with craft knowledge 100.00% 86
Total 100% 86
Q2.2 - Do you believe Foremen/General Foreman skills vary across trades or disciplines?
# Field Minimum Maximum Mean Std
Deviation Variance Count
1 Do you believe Foremen/General Foreman
skills vary across trades or disciplines? 1.00 2.00 1.06 0.23 0.05 86
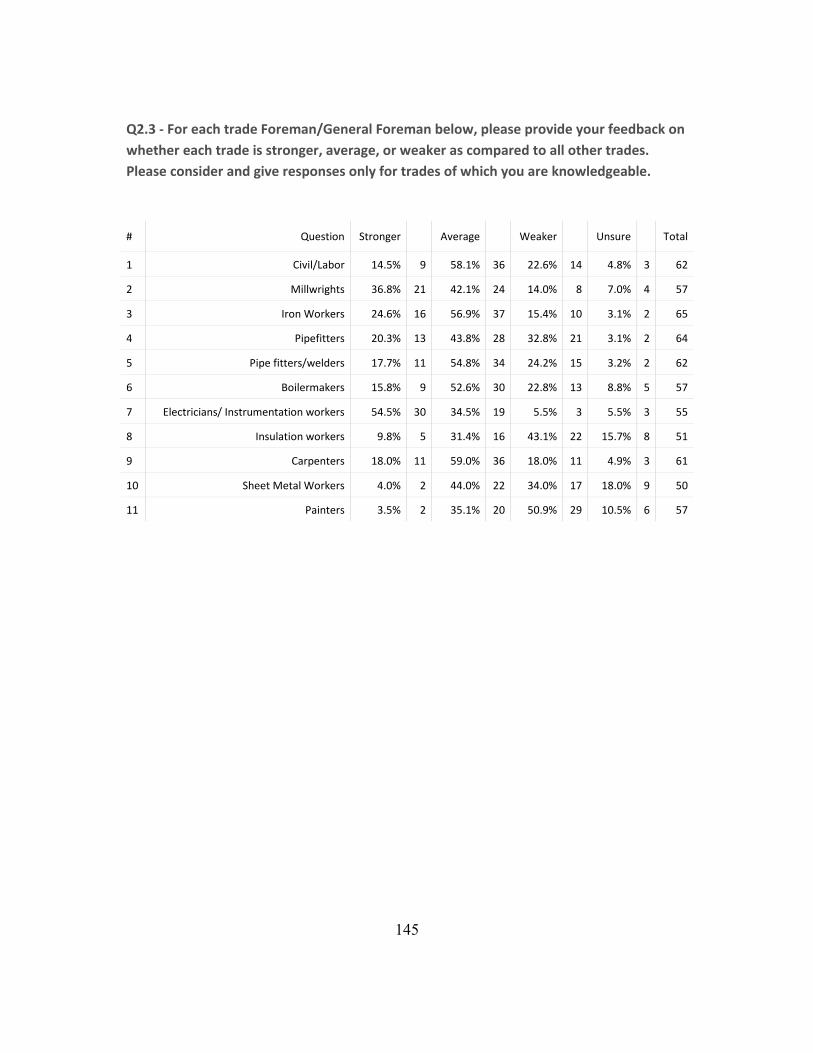
145
Q2.3 - For each trade Foreman/General Foreman below, please provide your feedback on
whether each trade is stronger, average, or weaker as compared to all other trades.
Please consider and give responses only for trades of which you are knowledgeable.
# Question Stronger Average Weaker Unsure Total
1 Civil/Labor 14.5% 9 58.1% 36 22.6% 14 4.8% 3 62
2 Millwrights 36.8% 21 42.1% 24 14.0% 8 7.0% 4 57
3 Iron Workers 24.6% 16 56.9% 37 15.4% 10 3.1% 2 65
4 Pipefitters 20.3% 13 43.8% 28 32.8% 21 3.1% 2 64
5 Pipe fitters/welders 17.7% 11 54.8% 34 24.2% 15 3.2% 2 62
6 Boilermakers 15.8% 9 52.6% 30 22.8% 13 8.8% 5 57
7 Electricians/ Instrumentation workers 54.5% 30 34.5% 19 5.5% 3 5.5% 3 55
8 Insulation workers 9.8% 5 31.4% 16 43.1% 22 15.7% 8 51
9 Carpenters 18.0% 11 59.0% 36 18.0% 11 4.9% 3 61
10 Sheet Metal Workers 4.0% 2 44.0% 22 34.0% 17 18.0% 9 50
11 Painters 3.5% 2 35.1% 20 50.9% 29 10.5% 6 57

146
Q2.5#1 - FOREMEN
# Field Minimum Maximum Mean Std
Deviation Variance Count
1 General Construction Knowledge 3.00 6.00 4.73 0.77 0.60 75
2 Trade Specific Knowledge 4.00 6.00 5.29 0.69 0.48 73
3 Verbal Communication 3.00 6.00 5.17 0.93 0.86 75
4 Written Communication 2.00 6.00 4.45 0.98 0.97 75
5 Pre Planning 3.00 6.00 5.12 0.89 0.79 76
6 Problem Solving 2.00 6.00 4.87 0.96 0.92 75
7 Ethical (Trustworthy, fair, empathetic, and
even handed) 3.00 6.00 5.46 0.78 0.61 72
8 People Management (Task assignments,
delegating, conflict resolution, discipline) 3.00 6.00 5.15 0.86 0.75 74
9 Leadership 3.00 6.00 5.28 0.83 0.68 75
10 Proactive and Goal Driven 3.00 6.00 5.24 0.85 0.72 75

147
Q2.5#2 - GENERAL FOREMEN
# Question 1 2 3 4 5 6 Total
1 General Construction
Knowledge 0.00% 0 0.00% 0 0.00% 0 14.67% 11 38.67% 29 46.67% 35 75
2 Trade Specific
Knowledge 0.00% 0 0.00% 0 0.00% 0 8.22% 6 26.03% 19 65.75% 48 73
3 Verbal Communication 0.00% 0 0.00% 0 4.00% 3 9.33% 7 26.67% 20 60.00% 45 75
4 Written
Communication 1.33% 1 0.00% 0 8.00% 6 22.67% 17 30.67% 23 37.33% 28 75
5 Pre Planning 1.32% 1 0.00% 0 2.63% 2 6.58% 5 15.79% 12 73.68% 56 76
6 Problem Solving 0.00% 0 1.33% 1 1.33% 1 10.67% 8 32.00% 24 54.67% 41 75
7 Ethical (Trustworthy, fair, empathetic, and
even handed) 0.00% 0 0.00% 0 1.39% 1 8.33% 6 20.83% 15 69.44% 50 72
8
People Management (Task assignments, delegating, conflict
resolution, discipline)
0.00% 0 0.00% 0 2.70% 2 5.41% 4 28.38% 21 63.51% 47 74
9 Leadership 0.00% 0 0.00% 0 2.67% 2 6.67% 5 21.33% 16 69.33% 52 75
10 Proactive and Goal
Driven 0.00% 0 0.00% 0 2.67% 2 6.67% 5 25.33% 19 65.33% 49 75
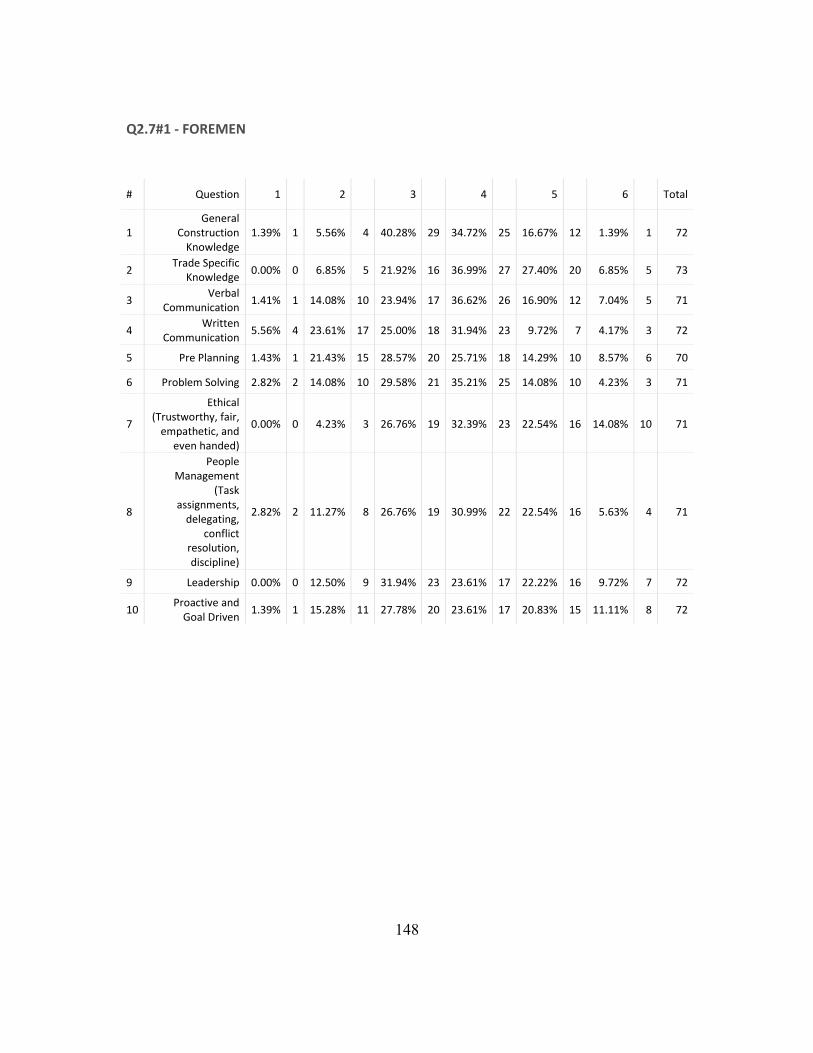
148
Q2.7#1 - FOREMEN
# Question 1 2 3 4 5 6 Total
1 General
Construction Knowledge
1.39% 1 5.56% 4 40.28% 29 34.72% 25 16.67% 12 1.39% 1 72
2 Trade Specific
Knowledge 0.00% 0 6.85% 5 21.92% 16 36.99% 27 27.40% 20 6.85% 5 73
3 Verbal
Communication 1.41% 1 14.08% 10 23.94% 17 36.62% 26 16.90% 12 7.04% 5 71
4 Written
Communication 5.56% 4 23.61% 17 25.00% 18 31.94% 23 9.72% 7 4.17% 3 72
5 Pre Planning 1.43% 1 21.43% 15 28.57% 20 25.71% 18 14.29% 10 8.57% 6 70
6 Problem Solving 2.82% 2 14.08% 10 29.58% 21 35.21% 25 14.08% 10 4.23% 3 71
7
Ethical (Trustworthy, fair,
empathetic, and even handed)
0.00% 0 4.23% 3 26.76% 19 32.39% 23 22.54% 16 14.08% 10 71
8
People Management
(Task assignments,
delegating, conflict
resolution, discipline)
2.82% 2 11.27% 8 26.76% 19 30.99% 22 22.54% 16 5.63% 4 71
9 Leadership 0.00% 0 12.50% 9 31.94% 23 23.61% 17 22.22% 16 9.72% 7 72
10 Proactive and
Goal Driven 1.39% 1 15.28% 11 27.78% 20 23.61% 17 20.83% 15 11.11% 8 72

149
Q2.7#2 - GENERAL FOREMEN
# Question 1 2 3 4 5 6 Total
2 Trade Specific
Knowledge 1.37% 1 1.37% 1 12.33% 9 30.14% 22 36.99% 27 17.81% 13 73
4 Written
Communication 2.78% 2 11.11% 8 23.61% 17 29.17% 21 20.83% 15 12.50% 9 72
6 Problem Solving 0.00% 0 8.33% 6 18.06% 13 33.33% 24 29.17% 21 11.11% 8 72
9 Leadership 0.00% 0 4.17% 3 25.00% 18 22.22% 16 26.39% 19 22.22% 16 72
10 Proactive and Goal
Driven 0.00% 0 8.33% 6 20.83% 15 29.17% 21 22.22% 16 19.44% 14 72
1 General
Construction Knowledge
0.00% 0 1.41% 1 19.72% 14 39.44% 28 28.17% 20 11.27% 8 71
7
Ethical (Trustworthy, fair,
empathetic, and even handed)
0.00% 0 1.41% 1 19.72% 14 28.17% 20 33.80% 24 16.90% 12 71
8
People Management (Task
assignments, delegating, conflict
resolution, discipline)
0.00% 0 4.23% 3 18.31% 13 36.62% 26 22.54% 16 18.31% 13 71
3 Verbal
Communication 0.00% 0 7.14% 5 20.00% 14 32.86% 23 24.29% 17 15.71% 11 70
5 Pre Planning 0.00% 0 7.14% 5 24.29% 17 30.00% 21 18.57% 13 20.00% 14 70
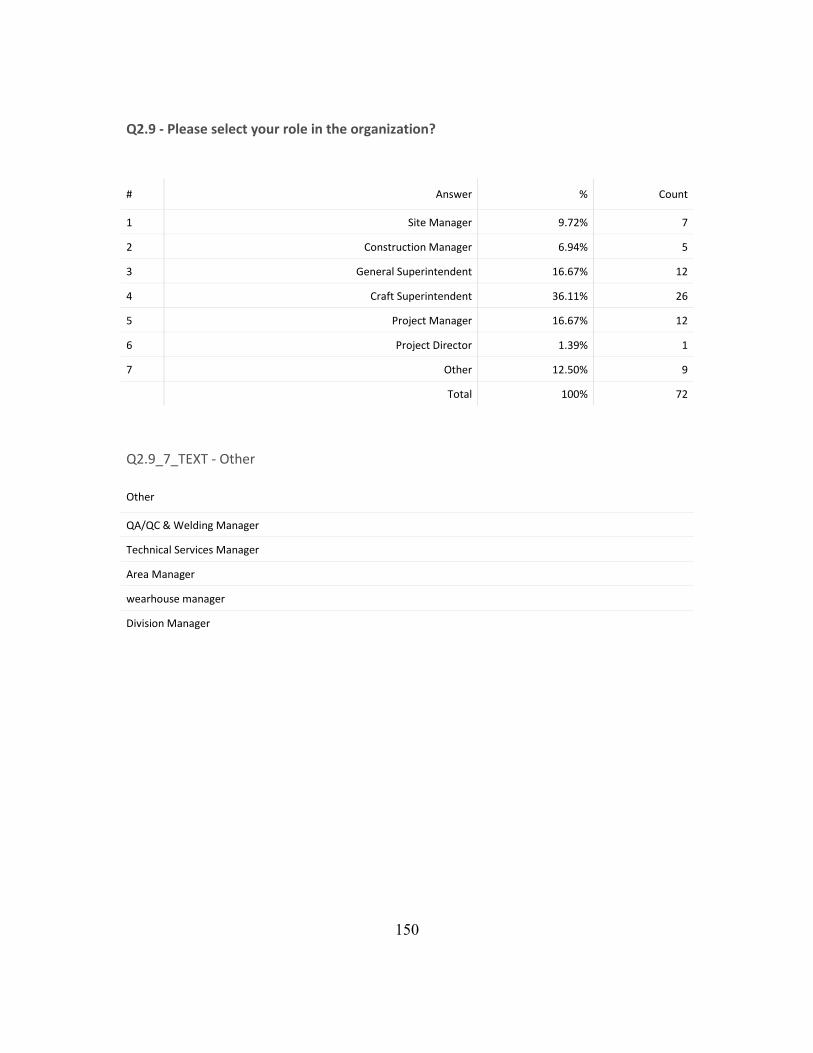
150
Q2.9 - Please select your role in the organization?
# Answer % Count
1 Site Manager 9.72% 7
2 Construction Manager 6.94% 5
3 General Superintendent 16.67% 12
4 Craft Superintendent 36.11% 26
5 Project Manager 16.67% 12
6 Project Director 1.39% 1
7 Other 12.50% 9
Total 100% 72
Q2.9_7_TEXT - Other
Other
QA/QC & Welding Manager
Technical Services Manager
Area Manager
wearhouse manager
Division Manager

151
Q2.10 - Please select the role of your organization in current project.
# Answer % Count
1 Owner 0.00% 0
2 General Contractor/ EPC Contractor 88.73% 63
3 Specialities/ Sub Contractor 11.27% 8
Total 100% 71
Q2.11 - Please select your years of construction experience
# Answer % Count
1 0-5 0.00% 0
2 5-10 4.17% 3
3 10-15 5.56% 4
4 15-20 16.67% 12
5 20-25 11.11% 8
6 >25 62.50% 45
Total 100% 72

152
Q2.12 - Please select the current Geographic region of work
# Answer % Count
1 West (WA, OR, CA, HI, AK) 0.00% 0
2 Southwest (AZ, NM, TX, OK) 73.61% 53
3 Mountain (MT, ID, WY, NV, UT, CO) 0.00% 0
4 Midwest (ND, SD, NE, KS, MN, IA, MS, IL, WI, MI, OH, IN) 12.50% 9
5 Northeast (PA, NY, VT, NH, MA, RI, CT, NJ, ME) 0.00% 0
6 Southeast (KY, TN, NC, SC, MS, AL, GA, FL, WV, DE, MD, AK, LA, VA) 8.33% 6
8 Canada (West) 5.56% 4
9 Canada (East) 0.00% 0
Total 100% 72
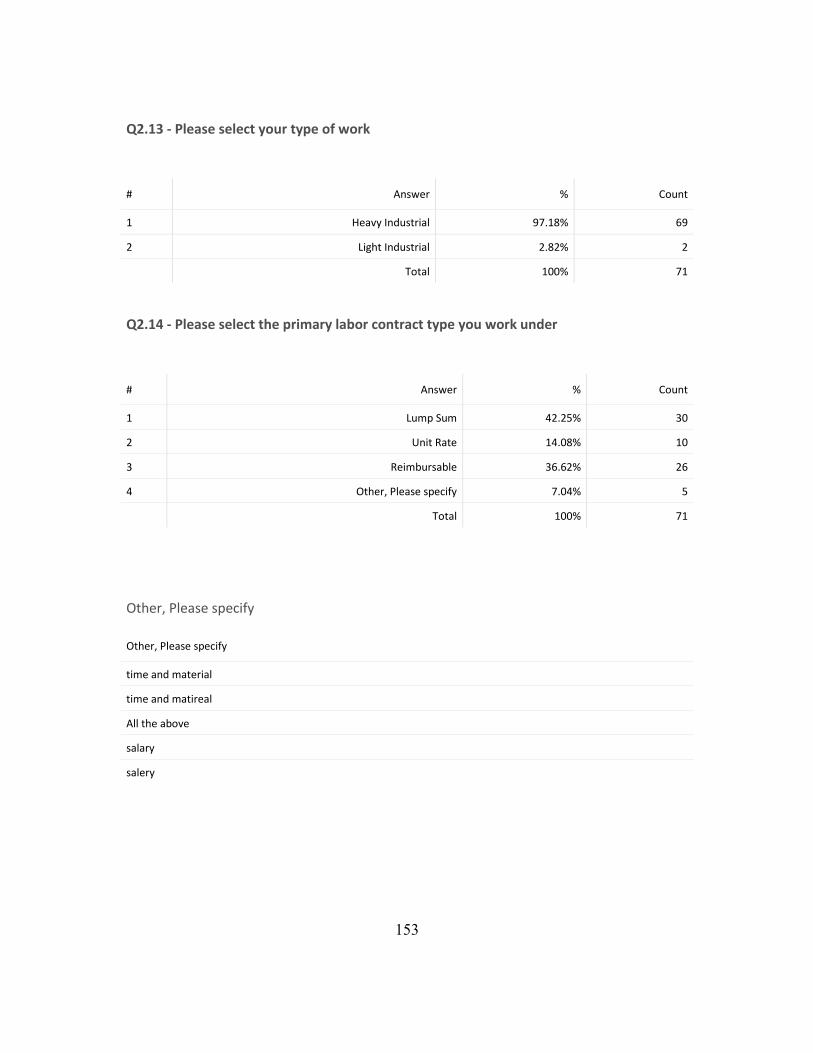
153
Q2.13 - Please select your type of work
# Answer % Count
1 Heavy Industrial 97.18% 69
2 Light Industrial 2.82% 2
Total 100% 71
Q2.14 - Please select the primary labor contract type you work under
# Answer % Count
1 Lump Sum 42.25% 30
2 Unit Rate 14.08% 10
3 Reimbursable 36.62% 26
4 Other, Please specify 7.04% 5
Total 100% 71
Other, Please specify
Other, Please specify
time and material
time and matireal
All the above
salary
salery

154
Q2.15 - What is the average number of craft/workforce on projects that you manage?
# Answer % Count
1 0-50 19.44% 14
2 51-150 27.78% 20
3 151-300 20.83% 15
4 301-350 9.72% 7
5 501-1000 13.89% 10
6 >1000 8.33% 6
Total 100% 72
Q2.16 - Primary form of labor agreement you work under
# Answer % Count
1 Union 13.89% 10
3 Other Labor Agreements 8.33% 6
2 Open Shop 77.78% 56
Total 100% 72
Other Labor Agreements
Other Labor Agreements
nma
All the above
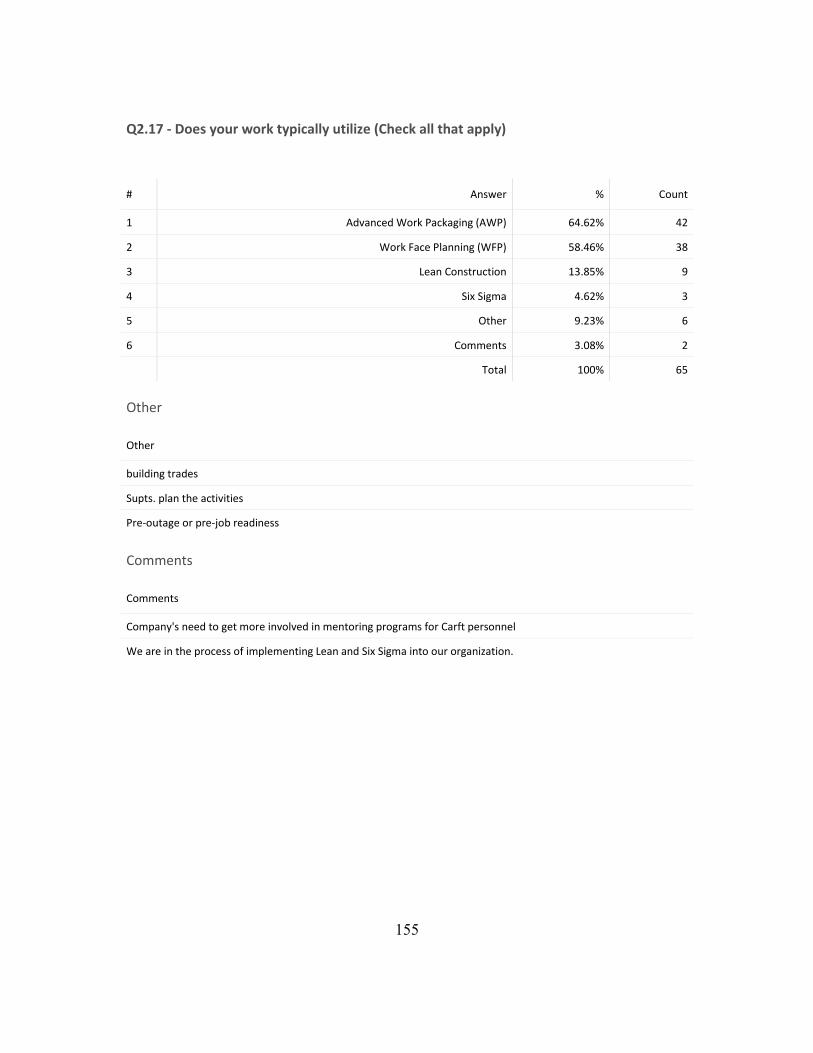
155
Q2.17 - Does your work typically utilize (Check all that apply)
# Answer % Count
1 Advanced Work Packaging (AWP) 64.62% 42
2 Work Face Planning (WFP) 58.46% 38
3 Lean Construction 13.85% 9
4 Six Sigma 4.62% 3
5 Other 9.23% 6
6 Comments 3.08% 2
Total 100% 65
Other
Other
building trades
Supts. plan the activities
Pre-outage or pre-job readiness
Comments
Comments
Company's need to get more involved in mentoring programs for Carft personnel
We are in the process of implementing Lean and Six Sigma into our organization.

156
Q2.18 - Please select the total cost of your current project (in millions)?
# Answer % Count
1 0-15 16.67% 12
2 16-50 12.50% 9
3 51-250 26.39% 19
4 > 250 44.44% 32
Total 100% 72
Q2.20 - PART A Please rate the following field impediments on basis of frequency on a
scale of 1 to 5. Select the appropriate number below for each category using the
following scale: 1 Never 2 Rarely 3 Sometimes 4 Often 5 Always
# Question 1 2 3 4 5
1 Waiting for material 6.25% 1 11.72% 15 27.01% 37 23.88% 16 40.00% 2
2 Waiting for equipment for example
crane, forklift etc. 12.50% 2 21.88% 28 18.25% 25 22.39% 15 20.00% 1
3 Problem with power tools
(availability, reliability, power sources, etc.)
43.75% 7 29.69% 38 15.33% 21 5.97% 4 20.00% 1
4 Quality problems in pre-fabricated
items 0.00% 0 16.41% 21 22.63% 31 26.87% 18 0.00% 0
5 Scaffolding issues 37.50% 6 20.31% 26 16.79% 23 20.90% 14 20.00% 1
Total Total 16 Total 128 Total 137 Total 67 Total 5

157
Q2.21 - PART B Please rate the following planning/workforce impediments on basis of
frequency on a scale of 1 to 5. Select the appropriate number below for each category
using the following scale: 1 Never 2 Rarely 3 Sometimes 4 Often 5 Always
# Question 1 2 3 4 5
1 Errors in engineering drawings/
Inadequate engineering support 0.00% 0 8.99% 8 18.50% 32 16.67% 23 47.06% 8
2 Lack of effective preplanning 28.57% 2 20.22% 18 19.08% 33 12.32% 17 5.88% 1
3 Current skill level of workforce 0.00% 0 16.85% 15 15.03% 26 19.57% 27 11.76% 2
4 Field changes/ rework 0.00% 0 12.36% 11 17.34% 30 19.57% 27 11.76% 2
5 Manpower turnover 42.86% 3 21.35% 19 10.98% 19 19.57% 27 17.65% 3
6 Work Disruptions 28.57% 2 20.22% 18 19.08% 33 12.32% 17 5.88% 1
Total Total 7 Total 89 Total 173 Total 138 Total 17
Q2.22 - Please state other impediments if they are not listed in the above lists in the
space given below.
Please state other impediments if they are not listed in the above lists in...
Lack of superintendents and foreman knowing how to develop a detailed plan and understand why it is so important. Safety Drugs
Clients Compressed schedules, reduction in cost, in most cases clients don't understand the means & methods of construction planning and scheduleing. More understanding of FEP Front End Planning for all projects regardless of size, budgets & schedules
permitting delays, weather delays.
Permitting procedures
Weather (lighting Storms) Often.
Interface with other General Contractor Construction equipment constraints Work ethics of the younger workforce Density in the work area where constructing
STOP PUTTING PEOPLE IN SUPERVISOR POSITIONS WHEN THEY HAVE NO KNOWLEDGE,NOT ONLY DOES THIS EFFECT THERE PRODUCTIVITY IT ALSO EFFECTS OTHER CRAFTS
Waiting on other crafts all the time!

158
Q2.23 - Please state suggestions that have to improve productivity in the space given
below.
Please state suggestions that have to improve productivity in the space giv...
Employees caring about there jobs and taking pride in the work. It seems the two thing employees are worried about now days is pay day and quitting time
Train the superintendents and foreman on expectations. Don't just make someone a foreman and give no training.
More constructiablity with planning/sheduling, AFD, AFE, FEP, Engineering, PEP & CEP
proper training
Increased constructability efforts prior to mobilizing to begin construction Increase accuracy with surveying benchmarks (which decreases rework) Owner allowing Constructor to utilize the expertise they were hired to use
MAKE SURE PEOPLE ARE QUALIFYED FOR THE POSITION THEY HIRE IN FOR
We consistently under-estimate the impacts of late early deliverables from vendors and engineering. During the "Honeymoon" phase of a project no one wants to be the bad guy and call people out for not meeting their obligations, or we signed up a vendor with no teeth in their contract for their deliverables.
More leadership training.
Having equipment per crafts, example forklifts, and cranes.
Realize this industry is for adults not children. Stop babying these folks and require them to do what they hired on to do. You can be respectful and firm at the same time. This kinder more gentle approach does not work. Stop teaching the employees how to play the system and just make it simple, work hard or go home.
none

159
APPENDIX E- FOREMEN AND GENERAL FOREMEN SURVEY- DATA, ALL PROJECTS
Q1.1 - Please indicate your current role in the organization. Responses include;
1.Foreman 2.General Foreman 3.Superintendents and Managers with craft knowledge.
Please select Option 3 if your role includes but is not limited to the following: Site
Manager, Construction Manager, General Superintendent, Craft Superintendent, Project
Manager, Project Director or equivalent positions
# Answer % Count
1 1. Foreman 71.48% 822
2 2. General Foreman 28.52% 328
3 3. Superintendents and managers with craft knowledge 0.00% 0
Total 100% 1150
Q3.7 - Please select your years of construction experience
# Answer % Count
1 1-5 2.18% 7
2 6-10 9.35% 30
3 11-15 17.76% 57
4 16-20 23.68% 76
5 >21 47.04% 151
Total 100% 321
Q3.8 - Please select your years of supervisory experience
# Answer % Count
1 1-5 19.94% 63
2 6-10 28.80% 91
3 11-15 24.05% 76
4 16-20 15.51% 49
5 >20 11.71% 37
Total 100% 316

160
Q3.12 - Are you a union member?
# Answer % Count
1 Yes 35.40% 114
2 No 64.60% 208
Total 100% 322
Q3.13 - Are you currently working on union project?
# Answer % Count
1 Yes 36.02% 116
2 No 63.98% 206
Total 100% 322
Q3.14 - Please select the total project cost of your current assignment (in millions)?
# Answer % Count
1 0-15 17.37% 45
2 16-50 18.15% 47
3 > 51 64.48% 167
Total 100% 259
Q3.15 - Does your work typically apply? (select all that apply)
# Answer % Count
1 Advanced Work Packaging (AWP) 38.15% 140
2 Work Face Planning (WFP) 44.69% 164
3 Lean Construction 16.08% 59
4 Six Sigma 1.09% 4
Total 100% 367

161
Q3.16 - Have you had training in any of the respective areas (select all that apply)
# Answer % Count
1 Safety 82.83% 246
2 Quality Control 42.76% 127
3 Scheduling 46.80% 139
4 Estimating 30.64% 91
5 Supervisory Skills 90.91% 270
6 3D/BIM Model 10.10% 30
7 Effective Communication 60.27% 179
8 AWP/WFP 18.86% 56
9 Time Management 37.71% 112
10 Lean Construction 15.15% 45
11 Time Motion Studies 5.72% 17
Total 100% 297
Q3.18 - Do you have clerical or administrative support?
# Answer % Count
1 Yes 72.35% 225
2 No 27.65% 86
Total 100% 311
Q3.19 - Do you have access to a computer?
# Answer % Count
1 Yes 40.88% 130
2 No 59.12% 188
Total 100% 318

162
Q3.4 - Select your craft
# Answer % Count
1 Civil/Labor 12.35% 40
2 Iron Workers 10.49% 34
3 Mechanical/ Millwright 2.47% 8
4 Pipefitters 24.38% 79
12 Pipefitter Welders 1.54% 5
5 Electrical/ Instruments 14.81% 48
6 Insulation 0.00% 0
7 Carpenter/Scaffolder 6.17% 20
8 Boilermaker 4.94% 16
9 Sheet Metal Worker 0.00% 0
10 Paint 0.93% 3
11 Other 21.91% 71
Total 100% 324
Q3.5 - Select your current phase of job
# Answer % Count
1 Mobilization/ Pre-Construction 4.75% 14
2 Construction/ Bulk Construction 91.19% 269
3 Start-Up and Commissioning 4.07% 12
Total 100% 295
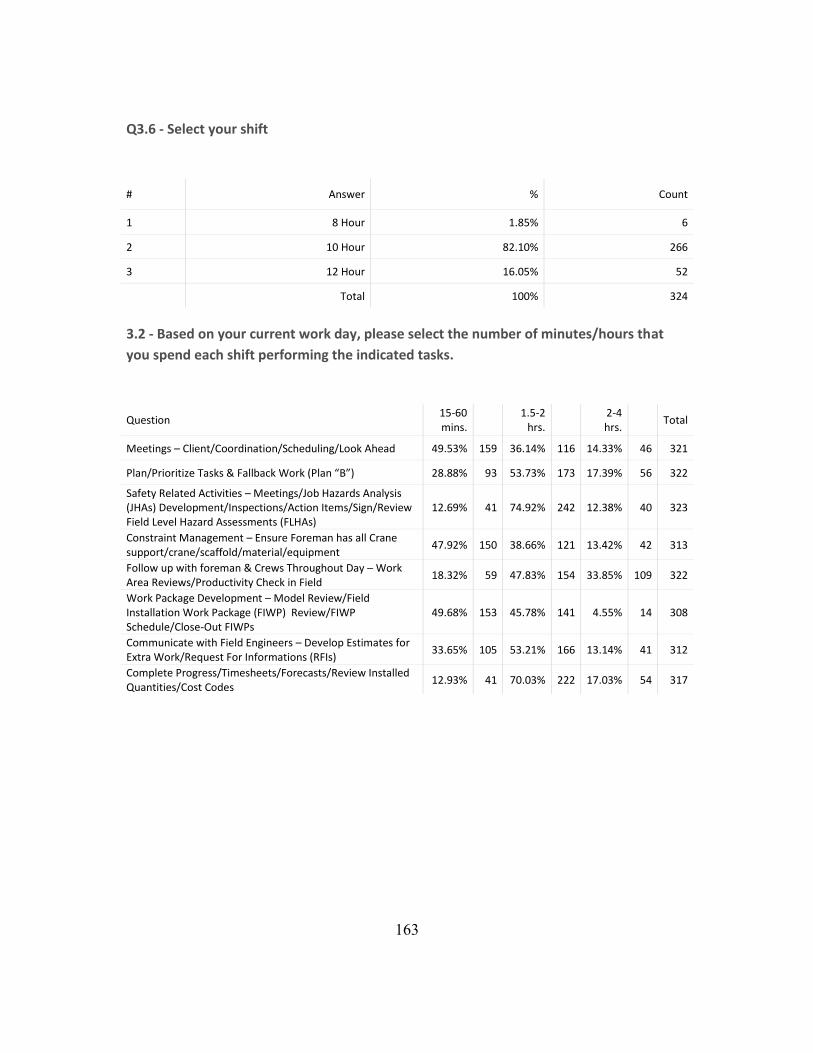
163
Q3.6 - Select your shift
# Answer % Count
1 8 Hour 1.85% 6
2 10 Hour 82.10% 266
3 12 Hour 16.05% 52
Total 100% 324
3.2 - Based on your current work day, please select the number of minutes/hours that
you spend each shift performing the indicated tasks.
Question 15-60 mins.
1.5-2
hrs.
2-4 hrs.
Total
Meetings – Client/Coordination/Scheduling/Look Ahead 49.53% 159 36.14% 116 14.33% 46 321
Plan/Prioritize Tasks & Fallback Work (Plan “B”) 28.88% 93 53.73% 173 17.39% 56 322
Safety Related Activities – Meetings/Job Hazards Analysis (JHAs) Development/Inspections/Action Items/Sign/Review Field Level Hazard Assessments (FLHAs)
12.69% 41 74.92% 242 12.38% 40 323
Constraint Management – Ensure Foreman has all Crane support/crane/scaffold/material/equipment
47.92% 150 38.66% 121 13.42% 42 313
Follow up with foreman & Crews Throughout Day – Work Area Reviews/Productivity Check in Field
18.32% 59 47.83% 154 33.85% 109 322
Work Package Development – Model Review/Field Installation Work Package (FIWP) Review/FIWP Schedule/Close-Out FIWPs
49.68% 153 45.78% 141 4.55% 14 308
Communicate with Field Engineers – Develop Estimates for Extra Work/Request For Informations (RFIs)
33.65% 105 53.21% 166 13.14% 41 312
Complete Progress/Timesheets/Forecasts/Review Installed Quantities/Cost Codes
12.93% 41 70.03% 222 17.03% 54 317

164
Q4.7 - Please select your years of construction experience
# Answer % Count
1 1-5 4.76% 38
2 6-10 18.52% 148
3 11-15 18.90% 151
4 16-20 22.28% 178
5 >21 35.54% 284
Total 100% 799
Q4.8 - Please select your years of supervisory experience
# Answer % Count
1 1-5 41.67% 330
2 6-10 26.64% 211
3 11-15 15.91% 126
4 16-20 8.08% 64
5 >21 7.70% 61
Total 100% 792

165
Q4.9 - Please select the appropriate Geographic region of work
# Answer % Count
1 1. Foreman 71.48% 822
2 2. General Foreman 28.52% 328
3 3. Superintendents and managers with craft knowledge 0.00% 0
Total 100% 1150
Q4.10 - Please indicate your type of work
# Answer % Count
1 Heavy Industrial 93.90% 723
2 Light Industrial 6.10% 47
Total 100% 770
Q4.11 - Circle the ‘typical’ size of crew you are supervising?
# Answer % Count
1 1-5 17.39% 136
3 6-10 56.39% 441
5 11-15 17.26% 135
2 16-20 4.48% 35
4 >21 4.48% 35
Total 100% 782

166
Q4.12 - Are you a union member?
# Answer % Count
1 Yes 36.94% 297
2 No 63.06% 507
Total 100% 804
Q4.13 - Are you currently working on union project?
# Answer % Count
1 Yes 35.74% 287
2 No 64.26% 516
Total 100% 803
Q4.19 - Does your work typically apply? (select all that apply)
# Answer % Count
1 Advanced Work Packaging (AWP) 37.80% 299
2 Work Face Planning (WFP) 42.60% 337
3 Lean Construction 18.08% 143
4 Six Sigma 1.52% 12
Total 100% 791

167
Q4.15 - Have you had training in any of the respective areas (select all that apply)
# Answer % Count
1 Safety 75.63% 540
2 Quality Control 36.83% 263
3 Scheduling 29.69% 212
4 Estimating 17.93% 128
5 Supervisory Skills 85.71% 612
6 3D/BIM Model 4.48% 32
7 Effective Communication 47.76% 341
8 AWP/WFP 15.13% 108
9 Time Management 27.17% 194
10 Lean Construction 14.71% 105
11 Time Motion Studies 4.62% 33
Total 100% 714
Q4.17 - Do you have clerical or administrative support?
# Answer % Count
1 Yes 67.05% 519
2 No 32.95% 255
Total 100% 774
Q4.18 - Do you have access to a computer?
# Answer % Count
1 Yes 32.83% 260
2 No 67.17% 532
Total 100% 792

168
Q4.4 - Select your craft
# Answer % Count
1 Civil/Labor 13.18% 106
2 Iron Workers 13.56% 109
3 Mechanical/ Millwright 2.86% 23
12 Pipefitter 24.38% 196
4 Pipefitter Welders 3.11% 25
5 Electrical/ Instruments 12.56% 101
6 Insulation 1.12% 9
7 Carpenter/Scaffolder 9.20% 74
8 Boilermaker 6.09% 49
9 Sheet Metal Worker 0.62% 5
10 Paint 0.25% 2
11 Other 13.06% 105
Total 100% 804
Q4.5 - Select your current phase of job
# Answer % Count
1 Mobilization/ Pre-Construction 7.64% 54
2 Construction/ Bulk Construction 89.82% 635
3 Start-Up and Commissioning 2.55% 18
Total 100% 707

169
Q4.6 - Select your shift
# Answer % Count
1 8 Hour 2.24% 18
2 10 Hour 84.29% 676
3 12 Hour 13.47% 108
Total 100% 802
Q4.2 - Based on your current work day, please select the number of minutes/hours that
you spend each shift performing the indicated tasks.
Question 15-60 mins.
1.5-2
hrs.
2-4 hrs.
Total
Meetings – Client/Coordination/Scheduling/Look Ahead 68.12% 547 26.53% 213 5.35% 43 803
Plan/Prioritize Tasks & Fallback Work (Plan “B”) 50.38% 400 43.70% 347 5.92% 47 794
Safety Related Activities – Meetings/Job Hazards Analysis (JHAs) Development/Inspections/Action Items/Sign/Review
19.51% 158 72.35% 586 8.15% 66 810
Complete Paperwork 29.43% 239 52.59% 427 17.98% 146 812
Coordinate with other crews/support 2.37% 19 47.13% 378 50.50% 405 802
Supervise/ Motivate/ Execute 24.16% 194 36.49% 293 39.35% 316 803
Plan for Future Work 33.67% 267 49.94% 396 16.39% 130 793
Work on Tools with Crew 40.77% 327 33.79% 271 25.44% 204 802
Receive/ Check/ Verify Materials in Area 5.36% 43 39.65% 318 54.99% 441 802
Move Crews to Contingency Work 6.78% 54 50.25% 400 42.96% 342 796

170
Q3.21 - PART A Please rate the following field impediments on basis of frequency on a
scale of 1 to 5. Select the appropriate number below for each category using the
following scale: 1 Never 2 Rarely 3 Sometimes 4 Often 5 Always
# Question 1 2 3 4 5 Total
1 Waiting for material 8.70% 28 19.88% 64 33.85% 109 22.36% 72 15.22% 49 322
2 Waiting for equipment for
example crane, forklift etc. 12.15% 39 27.73% 89 34.58% 111 17.45% 56 8.10% 26 321
3 Problems with power tools
(availability, reliability, power sources etc.)
24.84% 79 34.59% 110 27.99% 89 9.43% 30 3.14% 10 318
4 Quality problems in pre-
fabricated items 23.25% 73 29.62% 93 27.71% 87 13.69% 43 5.73% 18 314
5 Scaffolding issues 23.81% 75 25.40% 80 28.89% 91 13.65% 43 8.25% 26 315
Q3.22 - PART B Please rate the following Planning/ workforce impediments on basis of
frequency on a scale of 1 to 5. Select the appropriate number below for each category
using the following scale: 1 Never 2 Rarely 3 Sometimes 4 Often 5 Always
# Question 1 2 3 4 5
1 Errors in engineering drawings/
inadequate engineering support 20.89% 47 15.40% 87 15.16% 99 16.92% 56 18.46% 24
2 Lack of effective preplanning 21.78% 49 16.28% 92 15.62% 102 16.62% 55 16.92% 22
3 Current skill level of workforce 15.56% 35 13.27% 75 17.76% 116 21.45% 71 17.69% 23
4 Filed changes/ rework 11.56% 26 14.69% 83 17.92% 117 20.85% 69 17.69% 23
5 Manpower turnover 17.78% 40 22.30% 126 14.85% 97 9.97% 33 15.38% 20
6 Work Disruptions 12.44% 28 18.05% 102 18.68% 122 14.20% 47 13.85% 18
Total Total 225 Total 565 Total 653 Total 331 Total 130

171
Q4.14 - What is the total project cost of your current assignment (in millions)?
# Answer % Count
1 0-15 13.83% 83
2 16-50 18.33% 110
3 > 51 67.83% 407
Total 100% 600
Q4.21 - PART A Please rate the following field impediments on basis of frequency on a
scale of 1 to 5. Select the appropriate number below for each category using the
following scale: 1 Never 2 Rarely 3 Sometimes 4 Often 5 Always
# Question 1 2 3 4 5
1 Waiting for material 10.12% 74 14.36% 161 23.81% 279 29.16% 184 31.18% 106
2 Waiting for equipment for
example crane, forklift etc. 11.63% 85 17.04% 191 23.38% 274 27.58% 174 24.41% 83
3 Problem with power tools
(availability, reliability, power sources, etc.)
27.36% 200 26.23% 294 16.47% 193 13.31% 84 7.94% 27
4 Quality problems in pre-
fabricated items 24.49% 179 23.37% 262 19.28% 226 12.68% 80 12.65% 43
5 Scaffolding issues 26.40% 193 19.00% 213 17.06% 200 17.27% 109 23.82% 81
Total Total 731 Total 1121 Total 1172 Total 631 Total 340
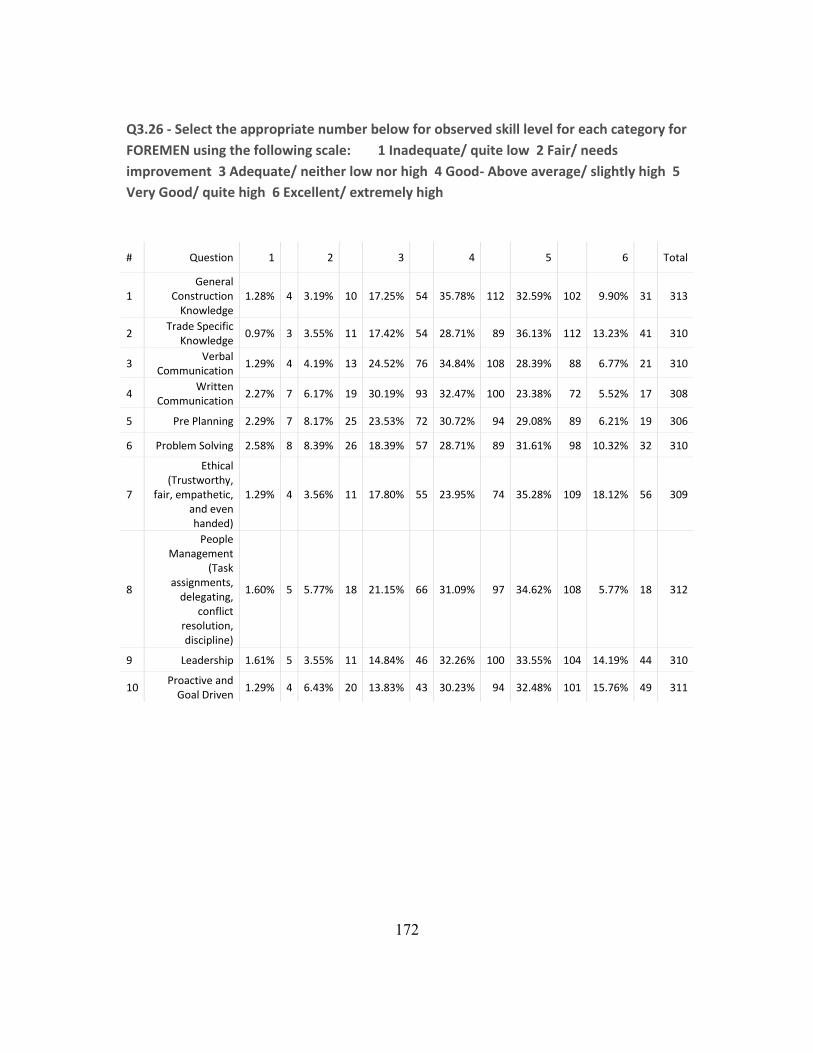
172
Q3.26 - Select the appropriate number below for observed skill level for each category for
FOREMEN using the following scale: 1 Inadequate/ quite low 2 Fair/ needs
improvement 3 Adequate/ neither low nor high 4 Good- Above average/ slightly high 5
Very Good/ quite high 6 Excellent/ extremely high
# Question 1 2 3 4 5 6 Total
1 General
Construction Knowledge
1.28% 4 3.19% 10 17.25% 54 35.78% 112 32.59% 102 9.90% 31 313
2 Trade Specific
Knowledge 0.97% 3 3.55% 11 17.42% 54 28.71% 89 36.13% 112 13.23% 41 310
3 Verbal
Communication 1.29% 4 4.19% 13 24.52% 76 34.84% 108 28.39% 88 6.77% 21 310
4 Written
Communication 2.27% 7 6.17% 19 30.19% 93 32.47% 100 23.38% 72 5.52% 17 308
5 Pre Planning 2.29% 7 8.17% 25 23.53% 72 30.72% 94 29.08% 89 6.21% 19 306
6 Problem Solving 2.58% 8 8.39% 26 18.39% 57 28.71% 89 31.61% 98 10.32% 32 310
7
Ethical (Trustworthy,
fair, empathetic, and even handed)
1.29% 4 3.56% 11 17.80% 55 23.95% 74 35.28% 109 18.12% 56 309
8
People Management
(Task assignments,
delegating, conflict
resolution, discipline)
1.60% 5 5.77% 18 21.15% 66 31.09% 97 34.62% 108 5.77% 18 312
9 Leadership 1.61% 5 3.55% 11 14.84% 46 32.26% 100 33.55% 104 14.19% 44 310
10 Proactive and
Goal Driven 1.29% 4 6.43% 20 13.83% 43 30.23% 94 32.48% 101 15.76% 49 311

173
Q4.22 - PART B Please rate the following Planning/ workforce impediments on basis of
frequency on a scale of 1 to 5. Select the appropriate number below for each category
using the following scale: 1 Never 2 Rarely 3 Sometimes 4 Often 5 Always
# Question 1 2 3 4 5
1 Errors in engineering
drawings/ inadequate engineering support
21.34% 137 17.71% 257 14.74% 241 14.40% 104 17.65% 57
2 Lack of effective preplanning 19.63% 126 17.78% 258 15.66% 256 13.85% 100 18.27% 59
3 Current skill level of workforce 15.11% 97 14.33% 208 16.70% 273 20.50% 148 20.12% 65
4 Filed changes/ rework 11.21% 72 15.78% 229 16.82% 275 20.36% 147 21.98% 71
5 Manpower turnover 20.72% 133 17.78% 258 15.84% 259 15.24% 110 10.84% 35
6 Work Disruptions 11.99% 77 16.61% 241 20.24% 331 15.65% 113 11.15% 36
Total Total 642 Total 1451 Total 1635 Total 722 Total 323

174
APPENDIX F- INTERVIEW QUESTIONNAIRE- FOREMEN AND GENERAL FOREMEN
FOREMAN INTERVIEW GUIDE
GENERAL INFORMATION
1) What is your trade and how long have you been practicing it? 2) I would like to know how long have you been in this company and your years of
experience in this role. 3) Please tell me about the trainings/coaching that helped you to adapt to your new role. 4) Please tell me about your typical work day.
a. Do you come in early to preplan, if so are you paid for it? b. Elaborate on timeline/sequence of important tasks. c. How do you manage your time? d. What activities would you like to spend more or less time on and why?
5) How satisfied are you with the skill level of your crew? 6) Are the work packages you receive from your GFs/planners clear and complete?
Elaborate on what is typically included. Elaborate on what you find most helpful or most needed/missing.
PLAN
7) How do you organize and assign work to your different crews?
RECOVER
8) How frequently do you work on something other than planned? “go to plan B” 9) Tell me the last time you were forced to work on some other work area than planned?
What triggered this change? Was plan B ready for execution? (materials, scaffolding, etc)
a. How did you communicate to your supervisors and what options did you evaluate? (was there communication amongst trades?)
b. How did you encourage your crew to deal with this path change?
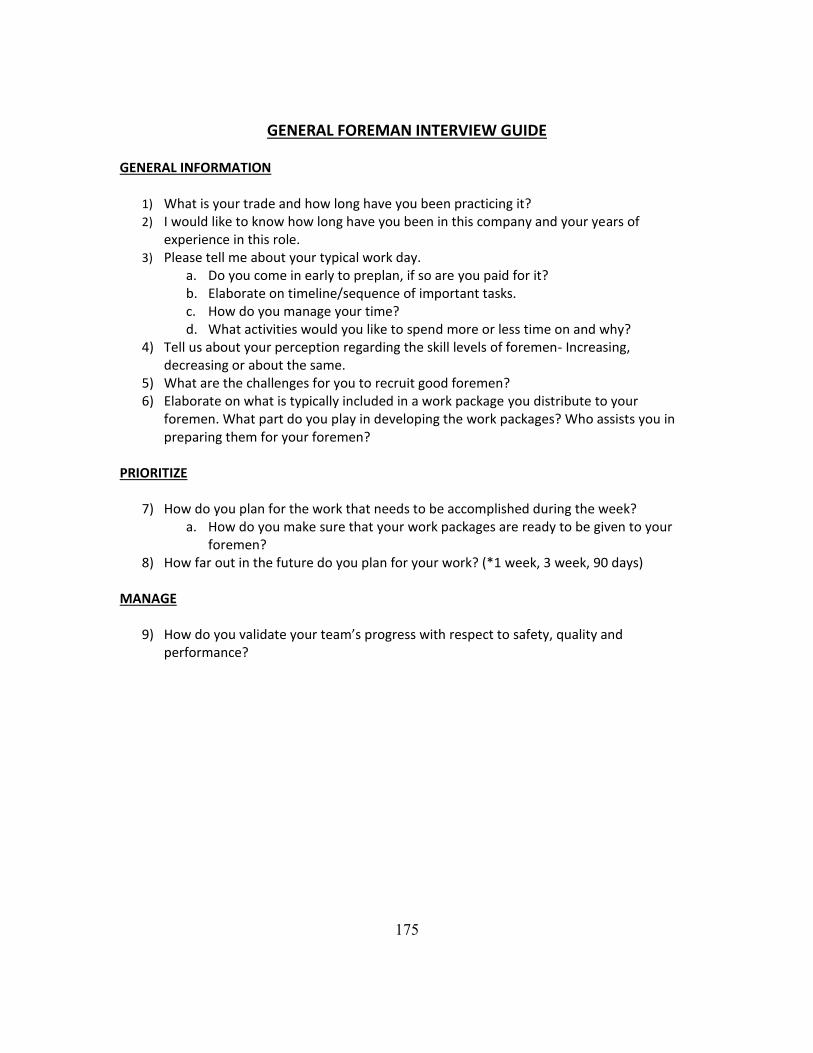
175
GENERAL FOREMAN INTERVIEW GUIDE
GENERAL INFORMATION
1) What is your trade and how long have you been practicing it? 2) I would like to know how long have you been in this company and your years of
experience in this role. 3) Please tell me about your typical work day.
a. Do you come in early to preplan, if so are you paid for it? b. Elaborate on timeline/sequence of important tasks. c. How do you manage your time? d. What activities would you like to spend more or less time on and why?
4) Tell us about your perception regarding the skill levels of foremen- Increasing, decreasing or about the same.
5) What are the challenges for you to recruit good foremen? 6) Elaborate on what is typically included in a work package you distribute to your
foremen. What part do you play in developing the work packages? Who assists you in preparing them for your foremen?
PRIORITIZE
7) How do you plan for the work that needs to be accomplished during the week? a. How do you make sure that your work packages are ready to be given to your
foremen? 8) How far out in the future do you plan for your work? (*1 week, 3 week, 90 days)
MANAGE
9) How do you validate your team’s progress with respect to safety, quality and performance?

176
References
Argyle, M., Gardner, G., and Cioffi, F. (1957). “The measurement of supervisory
methods.” Human Relations, 10(4), 295–313.
Construction Industry Institute (2006). "Research Report RT 215-11, Workforce View of
Construction Labor Productivity." The Construction Industry Institute, Austin, TX
Construction Industry Institute (2013a). “Implementation Resource RT 272-2, Version
3.0 Volume II: Advanced Work Packaging: Design through Workface
Execution.” The Construction Industry Institute, Austin, TX
Construction Industry Institute (2013b). “Research Summary RT 272-1, Version 2.1:
Advanced Work Packaging: Design through Workface Execution.” The
Construction Industry Institute, Austin, TX
Dainty, A. R. J., Cheng, M.-I., and Moore, D. R. (2005). “Competency-Based Model for
Predicting Construction Project Managers’ Performance.” Journal of
Management in Engineering, 21(1), 2–9.
Gary J. Lemna, John D. Borcherding, and Richard L. Tucker. (1986). “Productive
Foremen in Industrial Construction.” Journal of Construction Engineering and
Management, 112(2), 192–210.
Gilmour, P., and Lansbury, R. (1986). “The First Line Supervisor and Their Managerial
Role.” Journal of Management Development, 5(3), 59–72.
Hallowell, M. R., and Gambatese, J. A. (2010). “Qualitative Research: Application of the
Delphi Method to CEM Research.” Journal of Construction Engineering and
Management, 136(1), 99–107.
Hewage, K. N., Gannoruwa, A., and Ruwanpura, J. Y. (2011). “Current status of factors
leading to team performance of on-site construction professionals in Alberta
building construction projects.” Canadian Journal of Civil Engineering, 38(6),
679–689.
Hinze, J., and Kuechenmeister, K. (1981). “Productive Foremen Charactistics.” Journal
of the Construction Division, 107(4), 627–639.
Hyun Jeong Choo, Iris D. Tommelein, Glenn Ballard, and Todd R. Zabelle. (1999).
“WorkPlan: Constraint-Based Database for Work Package Scheduling.” Journal
of Construction Engineering and Management, 125(3), 151–160.

177
Kumaraswamy, M. M. (1997). “Improving industry performance through integrated
training programs.” Journal of Professional Issues in Engineering Education and
Practice, 123(3), 93–97.
Lemna, G. J., Borcherding, J. D., and Tucker, R. L. (1986). “Productive foremen in
industrial construction.” Journal of construction engineering and management,
112(2), 192–210.
Meeks, S. (2011). "Enhanced Work packaging: Design through Workface Execution.
M.Sc. thesis." The University of Texas at Austin
Paul M. Goodrum, Jeffrey Miller, John Sweany, and Omar Alruwaythi. (2016).
“Influence of the Format of Engineering Information and Spatial Cognition on
Craft-Worker Performance.” Journal of Construction Engineering and
Management, 142(9).
Poveda, C. A., and Fayek, A. R. (2009). “Predicting and evaluating construction trades
foremen performance: Fuzzy logic approach.” Journal of Construction
Engineering and Management, 135(9), 920–929.
ROBINSON FAYEK, A., REVAY, S. O., ROWAN, D., and MOUSSEAU, D. (2006).
“Assessing performance trends on industrial construction mega projects.” Cost
engineering, 48(10), 16–21.
Rojas, E. M. (2013). “Identifying, Recruiting, and Retaining Quality Field Supervisors
and Project Managers in the Electrical Construction Industry.” Journal of
Management in Engineering, 29(4), 424–434.
Senior, B. A. (1996). “Electrical Construction Foreman Task Scheduling.” Journal of
Construction Engineering and Management, 122(4), 363–369.
Serpell, A., and Ferrada, X. (2007). “A competency-based model for construction
supervisors in developing countries.” Personnel Review, 36(4), 585–602.
Shohet, I. M., and Laufer, A. (1991). “What does the construction foreman do?”
Construction Management & Economics, 9(6), 565–576.
Uwakweh, B. O. (2005). “Effect of foremen on construction apprentice.” Journal of
construction engineering and management, 131(12), 1320–1327.
Warr, P. B., and Bird, M. (1967). “Assessing the Training Needs of Foremen.” Journal of
Management Studies, 4(3), 332–353.

178
William F. Maloney, and James M. McFillen. (1987). “Influence of Foremen on
Performance.” Journal of Construction Engineering and Management, 113(3),
399–415.