Copyright by Colin John Kubarych 2010
38
Copyright by Colin John Kubarych 2010
Transcript of Copyright by Colin John Kubarych 2010

Copyright
by
Colin John Kubarych
2010

Synthetic and Analytical Studies Aimed at Molecular Recognition
Applications
by
Colin John Kubarych, B.S.
Thesis
Presented to the Faculty of the Graduate School
of the University of Texas at Austin
in Partial Fulfillment
of the Requirements
for the Degree of
Master of Arts
The University of Texas at Austin
May 2010

The Thesis committee for Colin John Kubarych
Certifies that this is the approved version of the following thesis:
Synthetic and Analytical Studies Aimed at Molecular Recognition
Applications
APPROVED BY
SUPERVISING COMMITTEE:
Supervisor: ___________________________
Eric V. Anslyn
__________________________
Philip D. Magnus

Dedication
To everyone who has taken a chance on adventure…I’ll see you soon

v
Acknowledgements
I would not be able to start this thesis without thanking everyone who has helped
me along the way. Mom, Dad and Sarah, always remember there is nothing worth sharing
like the love that let us share our name. Megan, we’re on a road to nowhere, thank you so
much for taking a chance. Justin, you are a true friend, my beard will miss you the most.
Chance, coffee won’t taste the same without your company.
I would also like to thank Dr. Eric Anslyn for his guidance and advice and for
giving me the freedom to help me find my path in life. Also, all of the Anslyn group
members I knew during my stay, I could not have picked a better group.

vi
Abstract
Synthetic and Analytical Studies Aimed at Molecular Recognition
Applications
by
Colin John Kubarych, M.A.
The University of Texas, 2010
SUPERVISOR: Eric V. Anslyn
The creation of small molecule libraries for binding into the NS1A protein of
influenza A viruses and the development of an indicator displacement assay for the
differentiation of fatty acids are reported herein. Using Mitsunobu chemistry, a variety of
structures based on hydroquinone, resorcinol and 2,7-dihydroxynaphthalene cores were
synthesized. Both polar and non-polar functional groups were added to diversify the
cores to help understand which molecule binds best to the protein. Because of poor
protein binding, the focus of the project moved to a new lead compound,
epigallocatechin-3-gallate (EGCG). EGCG showed promise in computational studies and
efforts towards the synthesis of the epigallocatechin core were undertaken.

vii
Using a fluorescent indicator displacement assay (IDA), a sensing system for fatty
acids was developed. The system consisted of bovine, rabbit, and human serum albumins
as host molecules, while the fluorescent indicators were fluorescein, 2-anthracene
carboxylic acid, and 1-anilino-8-naphthalene sulfonic acid. Fatty acids were able to be
differentiated from one another based on their carbon chain length and the degree of
unsaturation. The IDA was then subjected to a complex mixture of fatty acids, in the
form of edible oils. The oils (extra virgin olive, hazelnut, peanut, sunflower and canola)
with different fatty acid profiles were able to be differentiated from each other using
principal component analysis.

viii
Table of Contents
List of Figures.....................................................................................................................ix
List of Schemes....................................................................................................................x
Chapter 1: Small Molecule Library.....................................................................................1
1.1 Introduction........................................................................................................1
1.2 Results and Discussion......................................................................................3
1.3 Conclusions.......................................................................................................8
Chapter 2: Development of Indicator Displacement Assay................................................9
2.1 Introduction.......................................................................................................9
2.2 Results and Discussion....................................................................................11
2.3 Conclusion.......................................................................................................18
Chapter 3: Experimental....................................................................................................19
3.1 Small Molecule Library...................................................................................19
3.2 Development of Indicator Displacement Assay..............................................24
Bibliography......................................................................................................................26
Vita....................................................................................................................................28

ix
List of Figures
Figure 1. Virtual screening hits for NS1A RNA binding domain………………………3
Figure 2. Benzyl alcohols………………………………………………………………..4
Figure 3. Differential sensing of single and multi-analyte systems……………………..9
Figure 4. Differential sensing ensemble for terpenes………………………………….10
Figure 5. Equilibria involved in an indicator displacement assay……………………..11
Figure 6. Indicators screened for binding serum albumins…………………………….12
Figure 7. Binding curves of indicators into serum albumins…………………………..13
Figure 8. Fatty acids differentiated in sensing ensemble………………………………14
Figure 9. Displacement of indicators by fatty acids…………………………………...15
Figure 10. PCA plot 1………………………………………………………………….16
Figure 11. PCA plot 2………………………………………………………………….17

x
List of Schemes
Scheme 1. General conditions for Mitsunobu Reaction……………………..……………4
Scheme 2. General conditions for Williamson Ether Synthesis……………………..……6
Scheme 3. Synthetic route towards 3,5-bis(benzyloxy)phenol…………………………....7
Scheme 4. Synthetic route towards cinnamyl alcohol………………………………….....8

1
Chapter 1: Synthesis of Small Molecule Libraries
1.1 Introduction
Influenza viruses are the cause of highly contagious respiratory disease in
humans. Influenza A is responsible for deadly pandemics in the past century. For
example, the Spanish Flu of 1918 (Influenza A subtype H1N1) killed an estimated 20 to
40 million people worldwide.1 With the ease of global transportation today, the next flu
pandemic could have devastating effects.
The H1N1 subtype is believed to have been transmitted to humans directly from
avian species through adaptive mutations.2 The World Health Organization defines a
pandemic virus as, (1) the emergence of a disease new to the population, (2) the agent
infects humans, causing serious illness, and (3) the agent spreads easily and is sustainable
among humans. H1N1 acquired the necessary mutations to fulfill these conditions and the
result was one of the worst pandemics in human history.
Since the sixteenth century, the human population has endured on average 2-3
pandemics per century. Avian Influenza A viruses of the subtype H5N1 are prime
candidates for the next pandemic. In 1997, the first human cases of H5N1 infection were
reported in Hong Kong and six of the eighteen patients perished. Since 2003, 378 cases
of infection have been reported resulting in 238 deaths.3 Early cases of human infection
occurred in East Asia, but recent reports show the virus has traveled as far south as
Indonesia and as far west as Egypt.
At present, H5N1 satisfies two of the three conditions necessary for a pandemic:
the virus is new to the population (first isolated in 1997) and it infects humans and causes
2
serious illness (>50% mortality rate). Fortunately, it still lacks the ability to efficiently
and sustainably spread to humans.
Two classes of antivirals are used to treat and prevent influenza infections.
Rimantadine and amantadine are adamantane derivatives that inhibit the pH-gate function
of the M2 ion channel which results in an inhibition of viral replication.4 Oseltamivir and
zanamivir act as inhibitors of neuraminidase, an enzyme used to cleave progeny virus
particles from the host. Inhibiting neuraminidase function prevents the release of new
viral particles into the host organism.5
Resistance to the adamantanes has recently been reported for more than 95% of
viruses in Thailand and Vietnam.6 Although much less prevalent, cases of oseltamivir
resistant viruses have been reported.7 With virus resistance mounting, there is a need to
explore and discover new targets for antiviral activity.
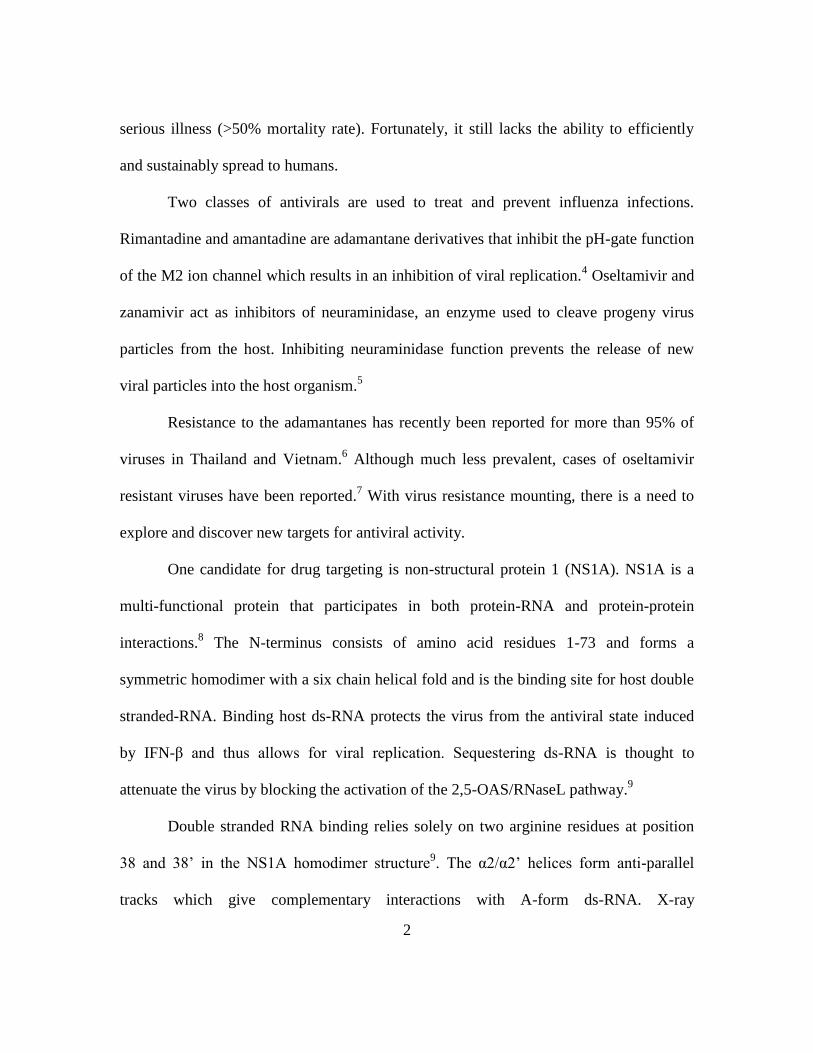
One candidate for drug targeting is non-structural protein 1 (NS1A). NS1A is a
multi-functional protein that participates in both protein-RNA and protein-protein
interactions.8 The N-terminus consists of amino acid residues 1-73 and forms a
symmetric homodimer with a six chain helical fold and is the binding site for host double
stranded-RNA. Binding host ds-RNA protects the virus from the antiviral state induced
by IFN-β and thus allows for viral replication. Sequestering ds-RNA is thought to
attenuate the virus by blocking the activation of the 2,5-OAS/RNaseL pathway.9
Double stranded RNA binding relies solely on two arginine residues at position
38 and 38’ in the NS1A homodimer structure9. The α2/α2’ helices form anti-parallel
tracks which give complementary interactions with A-form ds-RNA. X-ray

3
crystallography and NMR data show that these tracks are highly conserved suggesting
that NS1A-RNA binding is necessary for virus survival. Hence, this site is a good
candidate for antiviral development. The anti-parallel tracks form a channel that contains
a deep hydrophobic pocket at its center which has been explored as a suitable site for
drug development.10
Virtual screening of the NS1A binding domain resulted in the discovery of small
molecule scaffolds based on hydroquinone and 2,7 dihydroxynaphthalene cores (Figure
1) as well as epigallocatechin-3-gallate (EGCG), an extract from green tea. These
compounds showed promise of binding into the hydrophobic pocket of NS1A.
Figure 1. Virtual screening hits for NS1A RNA binding domain.
1.2 Results and Discussion
To create the desired small molecule library (Scheme 1), Mitsunobu chemistry
was chosen to couple commercially available benzylic alcohols to three bis-phenolic

4
cores: hydroquinone, resorcinol, and 2,7 dihydroxynaphthalene. The Mitsunobu reaction
was chosen because of its mild conditions. With the virtual screening hits as inspiration,
the main focus of the synthetic work was to create diethers substituted with amino and
carboxylate groups.
Scheme 1. General conditions for Mitsunobu reaction.
Due to acidity, carboxylic acid functionalities would compete with phenolate
nucleophiles leading to unwanted esters; therefore, esterified benzylic alcohols were used
and then hydrolyzed with methanol and acid to the corresponding acid. Both methyl 4-
(hydroxymethyl) benzoate (Figure 2, A) and diethyl 5-(hydroxymethyl) isophthalate
(Figure 2, B) were used as reactive benzyl alcohols.
Figure 2. a) methyl 4-(hydroxymethyl) benzoate b) diethyl 5-(hydroxymethyl)
isophthalate c) 3,5-dinitrobenzyl alcohol d) 4-nitrobenzyl alcohol
+R
X
HO OH O O
R
R
PPh3, DEAD
THF, 12 h
=HydroquinoneResorcinol2,7-dihydroxynaphthalene
X= OH
HO
O
O
HO
O O
O
O
HO HO
NO2
No2
NO2
A) B) C) D)

5
Previous experience in the Anslyn lab showed that the Mitsunobu reaction failed
to produce the desired product when the benzyl alcohol was functionalized with an
amine. To develop a scaffold resembling the virtual hit ZINC 14481, nitro groups were
substituted for amines: these groups would then be reduced to amines after coupling
(compounds C and D).
Using standard Mistunobu reagents: triphenyl phosphine (PPh3) and
diethylazodicarboxylate (DEAD) the reaction of various benzylic alcohols led to the
desired diethers only in extremely low yields, between 5 and 15%.
Diisopropylazodicarboxylate (DIAD) was used as an alternative reagent to DEAD, but
failed to produce the desired ethers. Other attempts to optimize the reaction conditions
led to no appreciable increase in the yield of the desired product.
To test reaction conditions, phenol was reacted with methyl 4-(hydroxymethyl)
benzoate under the same conditions (DEAD, PPh3). The reaction produced the
corresponding ether in 76% yield after chromatography, verifying that the synthetic
methodology was sound. In addition to low yields, the reaction requires a time-
consuming work-up to remove excess starting reagents and by-products. Thus, a new
synthetic path was chosen based on the Williamson ether synthesis.
Unlike the Mitsunobu reaction, the Williamson synthesis is run under harsher
conditions. A strong base and high temperatures over long reaction times are used to
drive the formation of ethers through an SN2 pathway (Scheme 2). Also in this case,
esters and nitro groups were used as convenient precursors of carboxylic acids and
amines.

6
Scheme 2. General conditions for Williamson Ether Synthesis
Reactions using 4-nitrobenzyl chloride with hydroquinone were unsuccessful; the
desired product was never recovered. The failure of this reaction was unexpected, but a
literature search revealed the cause of the problem. The electron withdrawing effects of
the chloride and para-substituted nitro group increase the acidity of the benzylic position.
The result is deprotonation at the benzylic position instead of the expected nucleophilic.11
The esterified benzyl alcohols used in the Mitsunobu reaction were tosylated and then
reacted under the same Williamson conditions. No significant yield of product was
isolated.
These results were highly unexpected from the Williamson synthesis. To test the
reaction conditions, phenol was reacted with benzyl alcohol to give the corresponding
ether. Benzyloxybenzene was recovered in 80% yield.
More recently, the focus of our synthetic efforts shifted away from the
symmetrical hydroquinone and naphthalene cores to the creation of a library of molecules
based on the epigallocatechin core. EGCG is available commercially, but only in small
quantities and it is expensive. Using the work of Chan et al.12
, efforts towards the
synthesis of the epigallocatechin core were made. With the epigallocatechin core,
+R
X
HO OH O O
R
R
K2CO3, DMF
=HydroquinoneResorcinol2,7-dihydroxynaphthalene
X= Cl, Br

7
reactions at the 3-position with a variety of functional groups will create a diverse library
that will allow for further studies into how EGCG and its analogs bind into the NS1A
protein.
Scheme 3 shows the synthetic route used to create one of the starting materials for
the synthesis of the core. The doubly protected phenol, 2, was synthesized in two steps
from the starting material phloroglucinol triacetate. First, the substrate was protected with
benzyl chloride in the presence of sodium hydride and water in DMF. This product, 1,
was recovered in a 79% yield and was scaled up as high as ten grams. Next, the single
deprotection was attempted with ethanethiol and sodium hydride in DMF, but in only
30% yield. In an attempt to improve the yield, n-butanethiol was used according to a
previous report.13
This reaction was successful and the singly deprotected phenol was
recovered in 82% yield.
Scheme 3. Synthetic route towards 3,5-bis(benzyloxy)phenol
Cinnamyl alcohol was created in four steps starting with 3,4,5-
tris(benzyloxy)methyl benzoate, Scheme 4. Using a 1.0M solution of LiAlH4 in THF, the
methyl ester was successfully reduced to benzyl alcohol, 3, in 83% yield. Oxidation of 3
to aldehyde 4 was performed with pyridinium dichromate in the presence of molecular
sieves and resulted in a 91% yield. Next, 4 was allowed to react with

8
triethylphosphonoacetate and NaH giving the resulting α,β unsaturated ester in
quantitative yield. Finally, reduction of the ester with DIBAL gave the desired cinnamyl
alcohol product, 6, in 69% yield.
Scheme 4. Synthetic route towards cinnamyl alcohol
1.3 Conclusion
A small molecule library based on the virtual screening hits was synthesized using
Mitsunobu chemistry. Ultimately, the project moved away from these compounds as
possible drug targets and towards epigallocatechin derivatives. The major starting
materials of the epigallocatechin core were successfully synthesized and large quantities
of these building blocks were produced laying the foundation for a derivitized
epigallocatechin library.

9
Chapter 2: Development of an Indicator Displacement Assay
2.1 Introduction
Because of their biological importance, fatty acids are interesting targets for
molecular recognition, yet the literature contains few reports on fatty acid detection.14,15
It
is the goal of this project to create a sensing system able to detect the subtle differences in
fatty acid structure and to apply this sensing system to a complex mixture of fatty acids,
more specifically, edible oils.
In recent years, the use of differential sensing has gained popularity in the world
of molecular recognition. Instead of the high specificity and selectivity of receptors in the
classic “lock and key” principle, differential sensing uses an array of receptors with
different binding characteristics. These arrays of receptors can be used in either single
analyte or multi-analyte sensing (Figure 3).16
Figure 3. Differential sensing of single (top) and multi-analyte (bottom) systems

10
In both single and multi-analyte sensing, the analytes of interest interact with each
receptor uniquely resulting in a composite signal that can be interpreted by pattern
recognition software. These cross-reactive arrays were inspired by the mammalian senses
of taste and smell.
Recent work in the Anslyn lab utilized differential sensing with various serum
albumin proteins to target terpenes.17
In this study, bovine, rabbit and human serum
albumin proteins were used in conjunction with the fluorescent probe PRODAN and a
hydrophobic additive to detect the subtle differences in terpene structure (Figure 4).
Figure 4. Differential sensing ensemble for terpenes.
Using a 96-well plate assay, the sensing ensemble successfully differentiated
between five different terpene structures. Complex mixtures of terpenes were also tested
and successfully differentiated from one another. This previous study in differential
sensing is the inspiration for this project.
A common sensing ensemble used in the Anslyn group is an indicator
displacement assay (Figure 5).18
Here, an indicator reversibly binds a host molecule.
Upon introduction of a competing analyte, the indicator is displaced as the analyte binds
the host. The now free indicator in solution has a different optical signal than the bound
indicator and this change can be measured by instrumental methods (i.e. UV-Vis or
fluorescence). Coupled with a pattern recognition approach, we can use the differential

11
binding of various fatty acids to various host/indicator complexes to create a fingerprint
of complex fatty acid solutions.
Figure 5. Equlibria involved in an indicator displacement assay
To increase the chances of successful differentiation, our sensing ensemble was
built around three different serum albumin proteins (bovine, rabbit and human) and three
different indicators. This allowed us to work with nine different host/indicator complexes
and gave us the diversity we desired.
2.2 Results and Discussion
To develop a working IDA, suitable indicators must be chosen for the system. A
suitable fluorophore must show an appreciable change in optical signal from when it is
bound to the serum albumins to when it is free in solution. Another criterion for the
selected fluorophore was its resistance to a change in solvent. Because of the low
solubility of fatty acids in water, stock solutions of fatty acids were dissolved to the
appropriate concentration in solutions of 100% ethanol. Control experiments were
performed where ethanol was added in increasing concentration to the host/indicator
complex. To this end, the fluorophores in Figure 6 were screened for binding into the
serum albumins.
H + I H:I
H + G H:G
H:I + G H:G + I
(1)
(2)
(3)

12
Figure 6. Indicators screened for binding serum albumins
Overall, six fluorophores were screened including fluorescein (7), 2-anthracene
carboxylic acid (8), 1-anilino-8-naphthalene sulfonic acid (9), Evans Blue (10), dansyl
glycine (11), and phenol red (12). Of the six tested, the three best performing
fluorophores were fluorescein, 2-anthracene carboxylic acid (2-AC) and 1-anilino-8-
naphthalene sulfonic acid (1,8-ANS). Figure 7 shows the differential binding of these
fluorophores binding into the serum albumins.

13
Figure 7. Indicators (clockwise from left) 2-AC, 1,8-ANS and fluorescein binding bovine
serum albumin, rabbit serum albumin and human serum albumin.
With three differentially binding fluorophores, the next step was to test if our
system responded to the addition of fatty acids. Stearic, palmitic, and linoleic acids were
chosen as test fatty acids because of their shape and degree of unsaturation. Stearic (C18)
and palmitic (C16) acids are saturated and linear, only differing in carbon chain length
while linoleic is eighteen carbons in length but contains two double bonds (Figure 8).
-500000
-400000
-300000
-200000
-100000
0
0 0.5 1 1.5 2 2.5
Equivalents [H]/[I]
dF
Co
un
ts BSA
HSA
RSA
0
100000
200000
300000
400000
500000
0 0.5 1 1.5 2
Equivalents [H]/[I]
dF
Co
un
ts
BSA
RSA
HSA
-400000
-350000
-300000
-250000
-200000
-150000
-100000
-50000
0
0 1 2 3 4
Equivalents [H]/[I]
dF
Co
un
ts
BSA
RSA
HSA

14
Figure 8. Fatty acids differentiated in sensing ensemble.
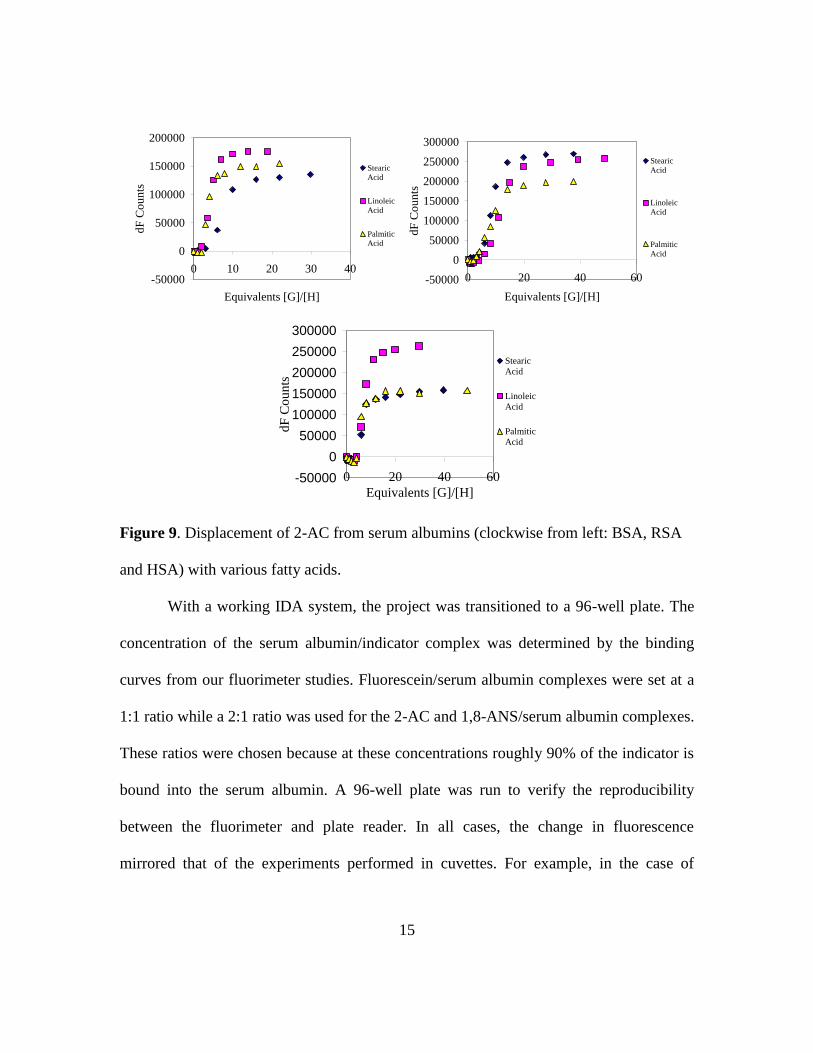
As shown in Figure 9, the fatty acids selected all showed differential binding
when introduced to the serum albumin/indicator complex. For a test system, serum
albumin and 2-AC were used as the host indicator complex for the fatty acid
displacement titrations. The interesting shape of the displacement curves is believed to be
the result of the fatty acid binding into serum albumin binding pockets that do not contain
any indicator. The first equivalents of fatty acid show little effect on the indicators. Only
at higher fatty acid concentrations does the displacement of indicator begin to occur.
15
Figure 9. Displacement of 2-AC from serum albumins (clockwise from left: BSA, RSA
and HSA) with various fatty acids.
With a working IDA system, the project was transitioned to a 96-well plate. The
concentration of the serum albumin/indicator complex was determined by the binding
curves from our fluorimeter studies. Fluorescein/serum albumin complexes were set at a
1:1 ratio while a 2:1 ratio was used for the 2-AC and 1,8-ANS/serum albumin complexes.
These ratios were chosen because at these concentrations roughly 90% of the indicator is
bound into the serum albumin. A 96-well plate was run to verify the reproducibility
between the fluorimeter and plate reader. In all cases, the change in fluorescence
mirrored that of the experiments performed in cuvettes. For example, in the case of
-50000
0
50000
100000
150000
200000
0 10 20 30 40
Equivalents [G]/[H]
dF
Co
un
ts
Stearic
Acid
Linoleic
Acid
Palmitic
Acid
-50000
0
50000
100000
150000
200000
250000
300000
0 20 40 60
Equivalents [G]/[H]
dF
Co
un
ts
Stearic
Acid
Linoleic
Acid
Palmitic
Acid
-50000
0
50000
100000
150000
200000
250000
300000
0 20 40 60
Equivalents [G]/[H]
dF
Co
un
ts
Stearic
Acid
Linoleic
Acid
Palmitic
Acid

16
fluorescein, HSA had the greatest fluorescence change followed by RSA and finally
BSA. This trend was seen in both cuvette titrations and on the plate reader.
Next, we introduced four fatty acids to our ensemble of serum albumins and
indicators. Stearic, palmitic, linoleic and oleic acids were each tested with our system and
the resulting PCA plot is shown in Figure 10. It is clearly seen that our sensing system is
able to differentiate between all four of the fatty acids. The largest separation occurs
between the saturated and unsaturated fatty acids. It is interesting to note the sensitivity
of this system. Through the PCA plot, we are able to differentiate between two fatty acids
that are different by only a two carbon chain length (stearic and palmitic).
Figure 10. PCA plot 1 of sensing system when exposed to various fatty acids
-600000
-400000
-200000
0
200000
400000
-800000 -600000 -400000 -200000 0 200000 400000 600000 800000
F2
(6.5
8 %
)
F1 (92.21 %)
Observations (axes F1 and F2: 98.79 %)
Palmitic Acid
Stearic Acid
Oleic Acid
Linoleic Acid

17
We wanted to extend the scope of our system to more complex mixtures of fatty
acids. An interesting analyte for this system are edible oils. Each oil contains a different
fatty acid or lipid fingerprint and it was our goal to differentiate between various oils. For
our study, hazelnut, extra virgin olive oil, peanut, safflower, and canola oil were chosen.
The PCA plot in Figure 11 shows that our system was able to differentiate between
various types of oils.
Figure 11. PCA plot 2 showing the differentiation of various edible oils using a serum
albumin/indicator sensing system.
-400000
-200000
0
200000
400000
600000
-800000 -600000 -400000 -200000 0 200000 400000 600000 800000
F2
(9.3
2 %
)
F1 (88.36 %)
Observations (axes F1 and F2: 97.68 %)
Peanut OilExtra Virgin Olive Oil
Hazelnut Oil
Canola Oil
Sunflower Oil

18
2.3 Conclusion
An indicator displacement assay sensing ensemble using serum albumin proteins
and fluorescent indicators was developed to sense the subtle structural differences in fatty
acids. Our system was able to differentiate between the various fatty acids based on their
carbon chain length, shape, and degree of unsaturation. Complex mixtures of fatty acids,
in the form of edible oils, were able to be differentiated with minimal sample preparation.

19
Chapter 3 Experimental
3.1 Synthesis of small molecule libraries
General Procedures
All NMR spectra were recorded using a Varian Unity Plus 400 MHz spectrometer
and agreed with previous literature reports. Mass spectrometry samples were analyzed in
CI mode by the University of Texas Mass Spectrometry facility. All solvents used were
obtained from dry stills.
General Procedure for the Mitsunobu Reaction:
To an oven dried 100-mL round-bottom flask containing an oven dried stir bar,
bis-phenolic core (1.82 mmol) was added with triphenylphosphine (5.45 mmol) and
substituted benzylic alcohol (5.45 mmol). The flask was stoppered with a rubber septum,
purged with N2 and 40 mL of dry THf was added by cannula. The solution was cooled to
0°C under N2 atmosphere. After 15 minutes, DEAD (5.45 mmol) was added slowly over
5 minutes with a syringe. The solution was allowed to warm to room temperature in an
ice bath and stirred for 12 hours. TLC was used to monitor the reaction (7:3
Hexanes:Ethyl Acetate).
Upon reaction completion, as determined by TLC, THF was removed in vacuo
and the residue was dissolved in 10 mL methylene chloride. To oxidize excess
triphenylphosphine, 30% aqueous hydrogen peroxide was added and the mixture stirred
for 15 minutes. TLC was used to follow the disappearance of triphenylphosphine to the
more polar triphenylphosphine oxide. The organic layer was separated from aqueous
hydrogen peroxide and dried with MgSO4, then filtered. The solvent was removed using

20
rotovap. The resulting residue was placed directly onto a silica gel column and a gradient
column was run starting at 90:10 Hexane:Ethyl acetate solvent mixture and ending at
65:35 Hexane: Ethyl acetate. Product fractions were collected and the solvent was
removed in vacuo.
General Procedure for Williamson Reaction
To an oven-dried 100 mL round-bottom flask with oven-dried stir-bar, bis-
phenolic core (1.82 mmol) was added and dissolved in 40 mL dry DMF. K2CO3 (42.4
mmol) was added and the flask was stoppered. The solution was allowed to stir for 24
hours under a continuous stream of nitrogen.
After completion, 50 mL of water was added to the reaction flask and the aqueous
layer was extracted with ethyl acetate 3x50 mL. The organic layer was washed with
water and saturated sodium chloride in consecutive additions. The organic layer was
dried with MgSO4, filtered and the solvent removed using a rotovap.
EGCG Core
1,3,5-tris(benzyloxy)benzene (1)
Phloroglucinol triacetate was added to a 100 mL round-bottom flask with 20 mL of
DMF. Sodium hydride (28.3 mmol, 60% solid) was added and the reaction flask was
cooled to 0°C. Next, benzyl chloride (14.3 mmol) was added slowly to the cooled

21
solution. Upon addition of benzyl chloride, water (11.9 mmol) was added by syringe to
solution still at 0°C. The reaction was allowed to warm to room temperature as it stirred
overnight. For work-up, the reaction was diluted with 50 mL ethyl acetate and the organic
layer was washed twice with water and once with saturated sodium chloride. The organic
layer was dried with MgSO4, filtered and the solvent was removed on the rotovap. Crude
solid was washed sequentially with methanol to afford a white solid. 1H NMR (CDCl3)
7.42-7.31 (m, 15H), 6.27 (s, 3H), 5.00 (s, 6H).
3,5-bis(benzyloxy)phenol (2)
In a 100 mL round-bottom flask, n-butanethiol (1.69 mmol) was added to a
solution of NaH (3.21 mmol, 60% solid) in dry DMF at 0°C. This solution was stirred at
0°C for 90 minutes. Then, 1,3,5-tris(benzyloxy)benzene (3.2 mmol) was dissolved in a
portion of dry DMF and added slowly to the reaction vessel via an addition funnel. A
reflux apparatus was assembled and the reaction was stirred at 150°C overnight. Upon
completion, 10 mL of ethyl acetate was added to the reaction flask and the organic layer
was extracted with 1N HCl. Next, the organic layer was washed with water, 4x20 mL.
The organic layer was dried with MgSO4, filtered and solvent removed with rotovap. The
crude product was purified with silica gel column chromatography. An eluting solvent
gradient was used as follows: 100:0 Hexane:Ethyl acetate to 80:20 Hexane:Ethyl acetate

22
to 70:30 Hexane: Ethyl acetate to 60:40 Hexane: Ethyl acetate. An orange solid was
recovered as the product. 1H NMR (CDCl3) 7.36-7.26 (m, 10H), 6.25 (t, 1H), 6.11 (d,
2H), 5.00 (s, 4H), 1.69 (s, 1H).
3,4,5-tris(benzyloxy)benzyl alcohol (3)
To a solution of LiAlH4 (2.64 mmol, 1.0 M in THF) in dry THF, 3,4,5-
tris(benzyloxy)benzoic acid methyl ester was added at room temperature and stirred for
one hour. The reaction was followed on TLC (8:2 Hexane: Ethyl acetate). Upon
disappearance of the top spot (the methyl ester), the solution was cooled to 0°C and a 1:1
mixture of THF and water was added. The reaction was quenched with 10% H2SO4 and
the mixture was extracted 3x with diethyl ether. The organic layer was washed with
saturated sodium bicarbonate and saturated sodium chloride and dried with MgSO4. The
resulting heterogenous mixture was filtered and the organic layer removed by rotovap to
afford a white solid. 1H NMR (CDCl3) δ 7.52-7.25 (m, 15H), 6.67 (s, 2H), 5.11 (s, 4H),
5.06 (s, 2H), 4.56 (s, 2H), 1.91 (s, 1H).
3,4,5-tris(benzyloxy)benzaldehyde (4)

23
3,4,5-tris(benzyloxy)benzyl alcohol (1.1 mmol) was stirred at room temperature
under an argon atmosphere in 10 mL of DCM with 4 Å molecular sieves (0.3 g). PDC
(0.55 mmol) was added to the reaction mixture which was stirred overnight. Diethyl ether
(~30 mL) was added to the reaction mixture and was filtered through a layer of silica gel.
The silica gel was washed with 20 mL portions of diethyl ether and the solvent was
removed in a rotovap. A white solid was recovered. 1H NMR (CDCl3) 9.81 (s, 1H), 7.44-
7.36 (m, 15H), 7.19 (s, 2H), 5.17 (s, 6H).
Ethyl (E)-3,4,5-tris(benzyloxy)cinnamate
3,4,5-tris(benzyloxy)benzaldehyde (0.706 mmol) was dissolved in dry THF and
triethylphosphonoacetate (0.819 mmol) was added. The solution was placed in an ice
bath and cooled to 0°C. Sodium hydride (0.819 mmol, 60% solid) was added slowly to
the cooled solution which was then allowed to warm to room temperature and stirred for
two hours. After two hours, concentrated sodium bicarbonate was added to the reaction
mixture. The organic layer was separated from the aqueous layer which was extracted
once more with ethyl acetate. The organic layers were combined, dried with MgSO4,
filtered and solvent was removed with a rotovap to afford a white solid. 1
H NMR (CDCl3)
δ 7.56 (d, 1H), 7.45-7.25 (m, 15H), 6.83 (s, 2H), 6.29 (d, 1H), 5.13 (s, 4H), 5.11 (s, 2H),
5.26 (q, 2H), 1.35 (t, 1H).

24
(E)-3,4,5-tris(benzyloxy)cinnamyl alcohol
The α,β-unsaturated ester (0.52 mmol) was dissolved in dry THF and placed in a
dry ice/acetone bath (-78°C) under an argon atmosphere. DIBAL (2.6 mmol) was added
dropwise via syringe and the reaction was stirred for one hour at -78°C and then for one
hour at room temperature. The reaction was followed on TLC using an 8:2 Hexane:Ethyl
acetate solvent mixture. Upon disappearance of starting material, the reaction was cooled
to 0°C in an ice bath. 50 mL of hexanes and 5 mL of saturated sodium sulfate were added
and stirred until a solid had formed. The solid was filtered and washed with ethyl acetate.
The organic layer was dried with MgSO4, filtered, and removed with a rotovap. The
resulting crude product was purified on a silica gel column with a 50:50 Hexane:Ethyl
acetate solvent mixture. 1H NMR (CDCl3) δ 7.45-7.25 (m, 15H), 6.68 (s, 2H), 6.48 (d,
1H), 6.18 (dt, 1H), 5.11 (s, 4H), 5.06 (s, 2H) 4.29 (d, 2H), 1.6 (s, 1H).
3.2 Development of an Indicator Displacement Assay
General Procedures
Fluorescence titrations were recorded at room temperature using a PTI
QuantaMaster Fluorimeter. 96-Well plate measurements were performed on a Bio Tek
Synergy 2 Multi-Mode Microplate reader. PCA plots were created using XLSTAT 2009.
Fluorescence Titrations
25
All serum albumins (HSA, RSA and BSA) were purchased in fatty acid free
fractions from Sigma Aldrich. The excitation and emission of the indicators are as
follows: Fluorescein; λex=490 nm, λem=521 nm. 2-anthracene carboxylic acid; λex= 386
nm, λem= 421 nm. 1-anilino-8-naphthalene sulfonic acid; λex= 350 nm, λem=470 nm.
All fatty acids were purchased from Sigma Aldrich. Each fatty acid stock was
dissolved to the appropriate concentration (Stearic and Palmitic acid= 40 mM, Linoleic
acid= 20 mM) in 100% ethanol. This stock solution was added directly to the
host/indicator complex in a quartz cuvette suitable for fluorescence measurements. The
total ethanol concentration added to the aqueous solution was less than 1% of the total
volume.
Edible oils were purchased at a local grocery store. To standardize the
concentration of stock solutions, it was assumed that each oil was pure oleic acid. Oleic
acid was chosen because it is the main free fatty acid in extra virgin olive oil. Each edible
oil stock was brought to a concentration of 10 mM in 100% ethanol. These edible oil
stocks were added directly to the various host/indicator aqueous complexes and the total
ethanol addition was less than 1% of the total volume.

26
Bibliography
1. Gottfredsson, M.; Halldorsson, B.; Jonsson, S.; Kristjansson, M; Kristjansson, K.;
Kristinsson, K.; Love, A.; Blondal, T.; Viboud, C.; Thorvaldsson, S.; Helgason,
A.; Gulcher, J.; Stefansson, K; Jonsdottir, I. Proc. Natl. Acad. Sci., 2008, 105 (4),
1303-1308
2. Taubenberger, J.; Reid, A.; Lourens, R.; Wang, R.; Jin, G.; Fanning, T. Nature
Letters, 2005, 437, 889-893
3. Cumulative Number of Confirmed Human Cases of Avian Influenza A/(H5N1)
Reported to WHO, World Health Organization Available at
http://www.who.int/csr/disease/avian_influenza/country/cases_table_2008_04_08
/en/index.html
4. Schnell, J.; Chou, J. Nature Letters, 2008, 451, 591-595
5. Hurt, A.; Selleck, P.; Komadina, N; Shaw, R.; Brown, L.; Barr, I. Antiviral
Research, 2007, 73, 228-231
6. Cheung, C.; Rayner, J.; Smith, G.; Wang, P.; Naipospos, T.; Zhang, J.; Yuen, K.;
Webster, R.; Peiris, J.; Guan, Y.; Chen, H. J. Infect. Dis., 2006, 193, 1626-1629
7. Le, Q.M.; Kiso, M.; Someya, K.; Sakai, Y.; Nguyen, T.H.; Nguyen, K.H.L.;
Pham, N.D.; Ngyen, H.H.; Yamada, S.; Muramoto, Y.; Horimoto, T.; Takada, A.;
Goto, H.; Suzuki, T.; Suzuki, Y.; Kawaoka, Y. Nature, 2005, 437(7062), 1108
8. Lin, D.; Lan, J.; Zhang, Z. Acta Bioch. Bioph. Sin., 2007, 39(3), 155-162
9. Min, J.; Krug, R. Proc. Natl. Acad. Sci., 2006, 103(18), 7100-7105
10. Yin, C.; Khan, J.; Swapna, G.V.T.; Ertekin, A.; Krug, R.; Tong, L.; Montelione,
G. J. Biol. Chem., 2007, 282(28), 20584-20592
11. Tewfik, R.; Fouad, F.M.; Farrell, P.G. J. Chem. Soc., Perkin Trans., 1974, 2, 31
12. Li, L.; Chan, T.H. Org. Lett., 2001, 3(5), 739-741
13. Wan, S.B.; Landis-Piwowar, K.R.; Kuhn, D.J.; Chen, D.; Dou, Q.P.; Chan, T.K.
Bioorg. & Med. Chem., 2005, 13(6), 2177-2185

27
14. Xu, H.E.; Lambert, M.H.; Montana, V.G.; Parks, D.J.; Blanchard, S.G.; Brown,
P.J.; Sternbach, D.D.; Lehmann, J.M.; Wisely, G.B.; Willson, T.M., Kliewer,
S.A.; Milburn, M.V. Mol. Cell, 1999, 3, 397-403
15. Dutta-Roy, A.; Sener, F. Cellular Proteins and Their Fatty Acids in Health and
Disease, Wiley-VCH, Cambridge, England, 2003
16. Lavigne, J.L.; Anslyn, E.V. Angew. Chem. Int. Ed., 2001, 40, 3118-3130
17. Adams, M.M.; Anslyn, E.V. JACS, 2009, 131(47), 17068-17069
18. Wiskur, S.L; Ait-Haddou, H.; Lavigne, J.J.; Anslyn, E.V. Acc. Chem. Res., 2001,
34, 963-972

28
Vita
Colin John Kubarych, son of Daniel and Sharon Kubarych, was born on August
15, 1983 in Plano, Texas. He graduated from Plano East Senior High School in 2001 and
began attending Collin County Community College. In 2002, he enrolled at the
University of Tulsa where, in 2006, he received his Bachelors of Science in chemistry. In
August, 2006, he entered the Graduate School at The University of Texas.
Permanent Address: 7624 Brownley Place
Plano, TX 75025
This thesis was typed by the author.