Copyright and use of this thesisses.library.usyd.edu.au/bitstream/2123/12274/1/TANG Owen -...
272
COPYRIGHT AND USE OF THIS THESIS This thesis must be used in accordance with the provisions of the Copyright Act 1968. Reproduction of material protected by copyright may be an infringement of copyright and copyright owners may be entitled to take legal action against persons who infringe their copyright. Section 51 (2) of the Copyright Act permits an authorized officer of a university library or archives to provide a copy (by communication or otherwise) of an unpublished thesis kept in the library or archives, to a person who satisfies the authorized officer that he or she requires the reproduction for the purposes of research or study. The Copyright Act grants the creator of a work a number of moral rights, specifically the right of attribution, the right against false attribution and the right of integrity. You may infringe the author’s moral rights if you: - fail to acknowledge the author of this thesis if you quote sections from the work - attribute this thesis to another author - subject this thesis to derogatory treatment which may prejudice the author’s reputation For further information contact the University’s Director of Copyright Services sydney.edu.au/copyright
Transcript of Copyright and use of this thesisses.library.usyd.edu.au/bitstream/2123/12274/1/TANG Owen -...

Copyright and use of this thesis
This thesis must be used in accordance with the provisions of the Copyright Act 1968.
Reproduction of material protected by copyright may be an infringement of copyright and copyright owners may be entitled to take legal action against persons who infringe their copyright.
Section 51 (2) of the Copyright Act permits an authorized officer of a university library or archives to provide a copy (by communication or otherwise) of an unpublished thesis kept in the library or archives, to a person who satisfies the authorized officer that he or she requires the reproduction for the purposes of research or study.
The Copyright Act grants the creator of a work a number of moral rights, specifically the right of attribution, the right against false attribution and the right of integrity.
You may infringe the author’s moral rights if you:
- fail to acknowledge the author of this thesis if you quote sections from the work
- attribute this thesis to another author
- subject this thesis to derogatory treatment which may prejudice the author’s reputation
For further information contact the University’s Director of Copyright Services
sydney.edu.au/copyright

The Role of miR-200b in Renal Fibrosis
and Its in vivo Delivery Systems
Owen Tang
A thesis submitted in fulfilment of the requirements
for the degree of Doctor of Philosophy
Faculty of Medicine
University of Sydney
March 2014

Declaration
This thesis is the result of my full-time study during the years of 2009-2014. The
work is my own and has not been submitted for the award of any other degree at any
other university. Where other workers have made valuable contributions, they have
been acknowledged.
________________
Owen Tang
PUBLICATIONS
1. Tang O, Chen XM, Shen S, Hahn M, Pollock CA, MiRNA-200b represses
transforming growth factor-β1-induced EMT and fibronectin expression in kidney
proximal tubular cells. (2013) Am J Physiol Renal Physiol. 304(10):F1266-73
2. Sumual S, Saad S, Tang O, Yong R, McGinn S, Chen XM, Pollock CA,
Differential regulation of Snail by hypoxia and hyperglycemia in human proximal
tubule cells. (2010) Int J Biochem Cell Biol. 42(10):1689-97
3. Saad S, Stanners SR, Yong R, Tang O, Pollock CA, Notch mediated epithelial to
mesenchymal transformation is associated with increased expression of the Snail
transcription factor. (2010) Int J Biochem Cell Biol. 42(7):1115-22.

PRESENTATIONS ARISING FROM THIS WORK
Oral Presentations:
2013: Kolling Seminar Series:
The role of miR-200b in preventing TGFβ induced fibrosis.
2012: Invited speech at microRNA user meeting, UTS
The role of miRNA-200b in renal fibrosis and its in vivo delivery.
2010: Postgraduate Research Student Society Meeting, Northern Clinical School
Effect of miR-200b in preventing TGFβ induced fibrosis and possible mechanism.
2009: Scientific Research Meeting, Kolling Institute
miR-200b prevents TGFβ induced renal fibrosis
2009: American Society of Nephrology annual meeting, San Diego, CA, USA
miRNA-200b prevents TGF-β1 induced EMT and fibrotic responses in human kidney
proximal tubular cells.

Poster Presentations:
2013:
1. New horizon, Kolling Institute (December)
2012:
1. Scientific Research Meeting, Kolling Institute (December)
2. Australia and New Zealand Society of Nephrology (September)
2011:
1. Scientific Research Meeting, Kolling Institute (December)
2. Australia and New Zealand Society of Nephrology (September)
2010:
1. Scientific Research Meeting, Kolling Institute (December)
2. Australia and New Zealand Society of Nephrology, (September)
2009:
1. Australia and New Zealand Society of Nephrology, (September)

AWARDS
2012: Australia and New Zealand Society of Nephrology Travel Award
2011: Beryl and Jacob International Travel Award
2011: Kolling Institute Domestic Travel Award
2010: Australia and New Zealand Society of Nephrology Travel Award
2010: PRSS Scholarship
2010: Amgen Research Scholarship
2009: Rotary Health Research Scholarship
2009: Amgen Research Scholarship
2009: PRSS Scholarship
List of Abbreviations
3’UTR 3’ untranslated region
AGEs advanced glycation end products
AGRF Australian genome research facility
ALK5 TGFβ type I receptor kinase
AngII angiotensin II
AP1 activator protein 1
BMP bone morphogenic protein
bps base pairs
BSA) bovine serum albumin
COL collagen
CTGF connective tissue growth factor
CuZnSOD cytoplasmic CuZn superoxide dismutase
DAG diacylglycerol
DAPI 4',6-diamidino-2-phenylindole
DDR2 discoidin domain receptor tyrosine kinase 2
DEPC diethylpyrocarbonate
DMEM Dulbecco's Modified Eagle Medium
dsRNA double strand RNA
ECL chemiluminescence
ECM extracellular matrix
EDC 1-ethyl-3-(3-dimethylaminopropyl) carbodiimide
EGF epidermal growth factor
eGFR estimated glomerular filtration rate
EMT epithelial to mesenchymal transition
EndMT endothelial-mesenchymal transition
eNOS endothelial nitric oxide synthase
ERK or p42/44 extracellular regulated kinase
F6-P fructose 6-phosphate
FCS fetal Calf Serum
FN fibronectin
FSP1 fibroblast Specific Protein 1
G3-P glyceraldehyde 3-phosphate
G6-P glucose 6-phosphate
GFAT glutamine:fructose-6-phosphate-aminotrasnferase
GLUT sodium glucose linked transporters
HEK293T human embryonic kidney 293T cell line
HGF hepatocyte growth factor
HK-2 human kidney 2
HNF hepatocyte nuclear factor
HRP horse radish peroxidase
JAK-STAT Janus kinase-signal transducer and activator of transcription
JNK c-Jun N-terminal kinase
KO knockout
KSFM Keratinocyte-Serum Free Medium
LAP latency associated peptide
LB Luria-Bertani
LEF lymphoid enhancer binding factor
MAPK mitogen activated protein kinases
MDCK Madin Darby canine kidney
MEF mouse embryonic fibroblast
MET mesenchymal to epithelial transition
miR/miRNA microRNA
MIS mullerian inhibitory substance
MMCs mouse mesangial cells
MMP matrix metalloproteinase
MnSOD mitochondrial manganese superoxide dismutase
NEDD4 E3 ubiquitin-protein ligase
NFκB nuclear factor κB
NHS N-Hydroxysuccinimide
O2- superoxide anion
PAI-1 plasminogen activator inhibitor
PAS periodic acid-Schiff stain
PBS phosphate buffer saline
PCR polymerase chain reaction
PDGF platelet-derived growth factor
PEG polyethylene glycol
PKC protein kinase C
PMEPAI prostate transmembrane protein, androgen induced
PTEN phosphatase and tensin homolog
RAGE receptors for advanced glycation endproducts
RFP red fluorescent protein
RISC RNA –Induced Silencing Complex
RNAi RNA interference
ROS reactive oxygen species
SAPK stress-activated protein kinase
SARA SMAD anchor for receptor activation
SDS sodium dodecyl sulphate
SEM standard error mean
Ski Sloan-Kettering Institute proto-oncogene
SMAD small mothers against decapentaplegic
Smurf2 SMAD ubiquitination regulatory factor 2
SnoN Ski-related novel gene - non Alu-containing
STZ streptozotocin
TCF Wnt/β-catenin/T Cell Factor
TEC tubular epithelial cells
TEM transmission electron microscopy
TGFβ Transforming growth factor beta
TGIF TG-Interacting Factor
TIMPs tissue inhibitors of MMPs
TNFα tumour necrosis factor α
TTE TCF7L2-binding element
UNx uninephrectomised
UUO unilateral ureteral obstruction
VEGF vascular endothelial growth factor
ZEB1 zinc-finger E-box Binding homeobox 1
ZO-1 tight junction protein 1
αSMA alpha smooth muscle actin

ACKNOWLEDGEMENTS
First and foremost, i would like to thank Professor Carol Pollock for her continuing
support, guidance and encouragements through this journey. I am honored to be her
student. She will be my life long role model.
Secondly, I would like to thank Dr Xin Ming Chen who is always there to provide me
with technical support and ongoing supervision on a daily basis.
Thirdly, a big thank you to the colleagues in the renal lab. It has been a real pleasure
to have worked alongside all of you
I Would like to show my appreciation towards Dr Yi Ping Wang, Dr Michael Hahn
and Dr Martyn Bullock for their expertise and generous assistance.
I would like to specially thank Professor Lan for his unserved teaching. The technique
and knowledge I gained in his lab in Chinese University Hong Kong will always be
invaluable to me.
I would like to thank my family for their unconditional love and encouragements at
the most difficult times.
Finally I would like to thank my future wife Liz for her support. I am grateful to have
her by my side through the ups and downs and from the beginning to the end.
Summary /Abstract
Irreversible renal fibrosis represents the final common pathway of almost all chronic
renal diseases and ultimately leads to end stage renal failure. Excessive accumulation
of extracellular matrix proteins distinctively characterises this fibrotic process, which
epithelial to mesenchymal transition (EMT) is thought to play a major role in.
This thesis explored the role of miR-200b in preventing renal fibrosis with the focus
of its role in EMT. miR-200b was found to be important player in maintaining the
characteristics of epithelial cells by regulating transcription factors Zeb1 and Sip1 in
proximal tubular cells. Furthermore, a direct targeting and degradation mechanism of
fibronectin mRNA by miR-200b was also identified. Thus, miR-200b is shown to be a
master regulator of EMT and over-expression of this miRNA may have therapeutic
implication in patients with chronic renal diseases.
Followed by the discovery of molecular mechanisms underlying the protective effects
of miR-200b in renal fibrosis, the focus of the study was shifted to the various
delivery methods aiming targeted expression of miR-200b in renal proximal tubules
in vivo. The efficacy of gene delivery methods such as lentivirus mediated gene
transfer, hydrodynamic injection, ultrasound microbubble mediated gene transfer and
nanoparticles mediated gene uptake were investigated. Expression of the transgene
was successfully detected in the kidney in lentivirus and ultrasound microbubble
mediated gene transfer. Optimisation of each method is still in process aiming higher
transfer efficiency.

In the last chapter, the role of novel protein target PMEPA1 regulated by both miR-
200b and TGFβ was also investigated using in vitro fibrosis model. However, both
over-expression and loss of function studies demonstrated no significant changes in
the expression level of E-Cadherin, fibronectin and collagen IV suggesting its
involvement in pathways other than EMT.

1 | P a g e
Table of Contents
1 Chapter 1 Introduction ............................................................................................ 8
1.1 Transforming growth factor beta (TGFβ) signalling and renal fibrosis .......... 8
1.1.1 TGFβ signalling and renal fibrosis .......................................................... 8
1.1.2 TGFβ Family ............................................................................................ 8
1.1.3 TGFβ superfamily signalling ................................................................... 9
1.2 Renal fibrosis and Extracellular Matrix Production ...................................... 12
1.2.1 What is Epithelial to Mesenchymal Transition? .................................... 13
1.2.2 Type 1 EMT ........................................................................................... 16
1.2.3 Type 3 EMT ........................................................................................... 18
1.2.4 Type 2 EMT ........................................................................................... 19
1.2.5 Type 2 EMT in Chronic Kidney Disease ............................................... 19
1.2.6 Biomarkers of Type 2 EMT ................................................................... 22
1.2.7 Models used in studying EMT and Renal Interstitial Fibrosis .............. 23
1.3 Controversy of the role of EMT in renal fibrosis .......................................... 25
1.4 TGFβ Signalling and Diabetic Nephropathy ................................................. 26
1.4.1 Glucose Uptake and Its Role in Metabolic Pathways ............................ 29
1.4.2 Advanced Glycation End Products (AGEs) ........................................... 30
1.4.3 Protein Kinase C .................................................................................... 32
1.4.4 Reactive Oxygen Species ....................................................................... 32
1.5 MicroRNA (miRNA) and Renal Fibrosis ..................................................... 33

2 | P a g e
1.5.1 MicroRNA and the Pathogenesis of Diabetic Nephropathy .................. 34
1.5.2 Discovery of microRNA and its Biogenesis .......................................... 34
1.5.3 Biogenesis of microRNA ....................................................................... 35
1.5.4 mRNA repression mediated by miRNA ................................................ 37
1.5.5 miRNA involved in diabetic nephropathy ............................................. 37
1.6 Prostate Transmembrane Protein, Androgen Induced................................... 55
1.6.1 Background ............................................................................................ 55
1.6.2 Discovery ............................................................................................... 55
1.6.3 Role in Prostate Cancer .......................................................................... 56
1.6.4 PMEPA1 and TGFβ signalling .............................................................. 57
1.6.5 Subsequent investigation of PMEPA1 in models of disease ................. 60
1.6.6 PMEPA1 and Diabetic Nephropathy ..................................................... 62
1.7 Summary and Statements of aims ................................................................. 63
2 Chapter 2 Materials and Methods ......................................................................... 65
2.1 Cell Culture ................................................................................................... 65
2.2 Immortalised Human Kidney Proximal Tubular Cell Line (HK-2) .............. 65
2.2.1 Human Embryonic Kidney 293T Cell Line (HEK293T) ...................... 65
2.3 RNA Extraction and Reverse Transcription.................................................. 66
2.3.1 Total RNA Extraction and Reverse Transcription ................................. 66
2.3.2 MicroRNA Extraction and Reverse Transcription ................................ 68
2.4 Polymerase Chain Reaction (PCR) ............................................................... 70
3 | P a g e
2.5 Real-time PCR............................................................................................... 71
2.5.1 mRNA PCR ........................................................................................... 71
2.5.2 microRNA PCR ..................................................................................... 72
2.6 Protein extraction and Quantitation............................................................... 73
2.7 Western Blotting ........................................................................................... 73
2.8 Transient Transfection with microRNA and/or Plasmid ............................... 74
2.9 Plasmid Cloning ............................................................................................ 74
2.10 PCR product clean up .................................................................................... 75
2.11 Nucleotide Removal ...................................................................................... 76
2.12 Plasmid Extraction ........................................................................................ 76
2.12.1 Plasmid Miniprep ................................................................................... 76
2.12.2 Plasmid Maxiprep .................................................................................. 77
2.13 Luciferase Assay ........................................................................................... 78
2.14 Site Directed Mutagenesis ............................................................................. 78
2.15 Animal Handling ........................................................................................... 79
2.16 Live Animal Imaging .................................................................................... 80
2.17 Mouse Organ Harvesting .............................................................................. 80
2.18 RNA extraction from tissue........................................................................... 81
2.19 Stable Cell Line Construction ....................................................................... 81
2.20 Statistical Analysis ........................................................................................ 81
3 Chapter 3 MiRNA-200b represses transforming growth factor beta1-induced
EMT and fibronectin expression in kidney proximal tubular cells.............................. 83
4 | P a g e
3.1 Introduction ................................................................................................... 83
3.2 Specific Materials and Methods .................................................................... 85
3.2.1 Cell culture ............................................................................................. 85
3.2.2 Reverse transcription –polymerase chain reaction & Real-time PCR ... 85
3.2.3 Quantitation of miRNA.......................................................................... 86
3.2.4 Western Blotting .................................................................................... 86
3.2.5 Plasmid construction .............................................................................. 87
3.2.6 Fibronectin promoter reporter assay & Luciferase assay of 3’UTR of
fibronectin ............................................................................................................. 87
3.2.7 Statistical Analysis ................................................................................. 88
3.2.8 Optimisation of various techniques described in this chapter ............... 88
3.3 RESULTS.................................................................................................... 105
3.3.1 miRNA-200b over-expression suppressed TGFβ1 -induced EMT and
fibrotic responses of HK-2 cells ......................................................................... 105
3.3.2 The effect of miRNA-200b over-expression on phosphorylation of
SMAD 2 & 3 in HK-2 cells ................................................................................ 115
3.3.3 The effect of miRNA-200b over-expression on non-SMAD signalling
pathways in HK-2 cells....................................................................................... 117
3.3.4 miRNA-200b binds the 3’UTR of fibronectin (FN) mRNA thereby
suppressing fibronectin expression. .................................................................... 119
3.4 DISCUSSION ............................................................................................. 121
5 | P a g e
4 Chapter 4 In vivo expression of miR-200b and its role in obstructive nephropathy
126
4.1 Specific Background and Aims ................................................................... 126
4.2 Specific Materials and Methods .................................................................. 128
4.2.1 Viral Packaging .................................................................................... 128
4.2.2 Viral Titre Determination .................................................................... 129
4.2.3 Lentivirus Delivery to Mice ................................................................. 130
4.2.4 Unilateral Ureteral Obstruction............................................................ 130
4.2.5 Total RNA Extraction .......................................................................... 131
4.3 Results ......................................................................................................... 133
4.3.1 Packaging efficiency ............................................................................ 133
4.3.2 Lentiviral Transduction ........................................................................ 133
4.3.3 Animal welfare during experiment ...................................................... 134
4.3.4 Viral Integration in vivo-Preliminary Study ........................................ 135
4.3.5 Further study – miR-200b Transduction .............................................. 138
4.3.6 miR-200b reduced ECM and EMT markers ........................................ 139
4.4 Discussion ................................................................................................... 146
5 Chapter 5 Nanoparticle mediated gene delivery: ............................................... 149
5.1 Introduction ................................................................................................. 149
5.1.1 Challenges ............................................................................................ 149
5.2 in vivo Gene Delivery Methods .................................................................. 151
5.2.2 Ultrasound Microbubbles Mediated Gene Transfer ............................ 156

6 | P a g e
5.3 Manufacturing and Testing of Nanoparticle-miRNA Conjugate ................ 157
5.3.1 Structure and Synthesis of Nanoparticles ............................................ 159
5.3.2 Cellular uptake of Nanoparticles ......................................................... 162
5.3.3 Rate of Uptake of the Nanoparticles .................................................... 164
5.3.4 Cellular Distribution of Nanoparticles in HK-2 cells .......................... 165
5.3.5 Bio-distribution of Nanoparticles in Mice. .......................................... 168
5.3.6 MiRNA Conjugation with Nanoparticles. ........................................... 171
5.4 Discussion ................................................................................................... 186
6 Chapter 6 Role of PMEPA1 in Renal Fibrosis ................................................... 189
6.1 Specific background and objectives ............................................................ 189
6.2 Materials and Methods ................................................................................ 191
6.2.1 Cell culture of HK-2 cells and TGFβ1 exposure ................................. 191
6.2.2 Transient knockdown of PMEPA1 ...................................................... 191
6.2.3 Transient over-expression of PMEPA1 ............................................... 192
6.2.4 PMEPA1 siRNA .................................................................................. 198
6.2.5 Establishing human proximal tubular epithelial cell line overexpressing
PMEPA1 ............................................................................................................. 199
6.3 Results ......................................................................................................... 202
6.3.1 Selection of the optimal siRNA for PMEPA1 knockdown ................. 202
6.3.2 Effects of PMEPA1 silencing on E-Cadherin, Fibronectin ................. 204
6.3.3 Effects of PMEPA1 over-expression on HK-2 cells............................ 207
6.4 Discussion ................................................................................................... 220

7 | P a g e
7 Chapter 7 Future Studies and Clinical Applications .......................................... 223
7.1 Future Experiments ..................................................................................... 223
7.2 Nanoparticle Mediated Gene Transfer ........................................................ 223
7.3 Lentiviral Mediated Gene Transfer ............................................................. 225
7.4 Ultrasound Microbubble Mediated Gene Transfer ..................................... 226
7.5 Overview ..................................................................................................... 227
References .................................................................................................................. 228

8 | P a g e
1 Chapter 1 Introduction
1.1 Transforming growth factor beta (TGFβ) signalling and renal fibrosis
1.1.1 TGFβ signalling and renal fibrosis
Transforming growth factor beta1 (TGFβ1) and its downstream signalling pathways
have been recognised as the key factor in the pathogenesis of renal fibrosis in all
forms of nephropathy, including the most common cause of end stage kidney disease,
diabetic nephropathy. It has been implicated in all facets of progressive kidney
disease including glomerulosclerosis, tubulointerstitial fibrosis, infiltration of
inflammatory mediators and activation of alpha smooth muscle actin (αSMA)
positive myofibroblasts (Carew et al., 2012; Han et al., 2000; Hills and Squires,
2011). BB rat and NOD mouse models with spontaneous diabetes mellitus show
increased TGFβ1 mRNA levels within 3-7 days of the onset of hyperglycaemia
(Sharma et al., 1996), while streptozotocin (STZ) induced rat models of diabetes
mellitus demonstrate increased TGFβ1 and its type II receptor mRNA in the kidney
within 3 days of successful induction (Sharma et al., 1996).
1.1.2 TGFβ Family
The TGFβ super family consists of four main subgroups of secreted proteins
including the mullerian inhibitory substance (MIS) family, the inhibin/activin family,
the bone morphogenic protein (BMP) family and the TGFβ family (Wrighton et al.,
2009). The TGFβ family is comprised of five different isoforms all associated with
development of various organs, with three being expressed in mammals. It is a
pluripotential cytokine that modulates many fundamental biological processes from
cell growth and differentiation to tissue repair and cell apoptosis (Bottinger and

9 | P a g e
Bitzer, 2002; Schmierer and Hill, 2007). Several intracellular signalling pathways
and molecules respond to TGFβ1, including the small mothers against
decapentaplegic (SMAD) signalling pathways and SMAD independent pathways
such as mitogen activated protein kinases (MAPK), which encompasses p38,
extracellular regulated kinase (ERK or p42/44), c-Jun N-terminal kinase/stress-
activated protein kinase (JNK/SAPK) and the PI3-K/Akt pathway.
The TGFβ1 gene encodes a 390 amino acid precursor that is comprised of a signal
peptide, the active TGFβ1 molecule and a latency associated peptide (LAP) (Hills
and Squires, 2011). TGFβ1 is secreted as an inactive form and becomes activated
only when it is proteolytically cleaved from the signal peptide and released from
the LAP (Gentry et al., 1988). Environmental pH plays an important role in the
release of the TGFβ1 from LAP, a process that marks the activation of TGFβ1
(Ribeiro et al., 1999).
1.1.3 TGFβ superfamily signalling
1.1.3.1 TGFβ1 Signalling Pathway
Following cleavage by plasmin, matrix metalloproteinase (MMP) -2, MMP9 or
thrombospondin 1 (Kanwar et al., 2011), active TGFβ1 can bind to the TGFβ1
receptor II of the heteromeric TGFβ1 receptor complex, which possesses
serine/threonine kinase activity on the cell surface. Upon binding, the TGFβ1
receptor II is phosphorylated and subsequently activates/phosphorylates the
cytoplasmic domain of the TGFβ1 receptor I. This results in the downstream
phosphorylation of the classic SMAD signalling molecules, SMAD2 and SMAD3,
which are also called the receptor regulated SMADs or R-SMADs (Dennler et al.,

10 | P a g e
1998; Hills and Squires, 2011; Itoh et al., 2003). Activated R-SMADs then form
oligomeric complexes with SMAD 4, which is the common SMAD before
translocation into the nucleus (Dennler et al., 1998). Inside the nucleus, the SMAD
complex can regulate the transcription of target genes by binding directly or
indirectly to the relevant area on DNA with various co-factors including collagen 1
(COL1), plasminogen activator inhibitor (PAI-1), JunB, c-Jun and fibronectin (Leask
and Abraham, 2004; Massague and Wotton, 2000; Padgett and Reiss, 2007; Rahimi
and Leof, 2007; Shi and Massague, 2003; ten Dijke and Hill, 2004). The inhibitory
SMADs, namely, SMAD6 and SMAD7 antagonise the R-SMAD phosphorylation by
blocking their access to the TGFβ1 receptor I and/or promoting the degradation of
the receptor complex (Lan, 2008; Li et al., 2002; Nakao et al., 2002; Park, 2005; Yan
et al., 2009). SMAD7 is also modulated by the transcription factor nuclear factor κB
(NFκB), inflammatory cytokines and their downstream signalling pathways (Marrero
et al., 2006; Rhyu et al., 2005; Schiffer et al., 2000). These subsequently can activate
the transcriptional factor activator protein 1 (AP1), which in turn increases
transcription of effector molecules such as collagen and fibronectin (Hess et al.,
2004).
AP1 can also form a complex with R-SMADs and bind to AP1 consensus
sequences on the promoter of TGFβ1 target genes, suggesting cross talk between
SMAD-dependent and SMAD-independent TGFβ signalling (Mulder, 2000;
Ziyadeh, 2004). TGFβ1 activates another cytokine, connective tissue growth factor
(CTGF), which is considered to play an independent role in the pathogenesis of
diabetic nephropathy (Schmidt-Ott, 2008) by promoting extracellular matrix (ECM)
production, cell adhesion and collagen matrix contraction in mesangial and tubular
cells (Lan, 2011a; Murphy et al., 1999).
11 | P a g e
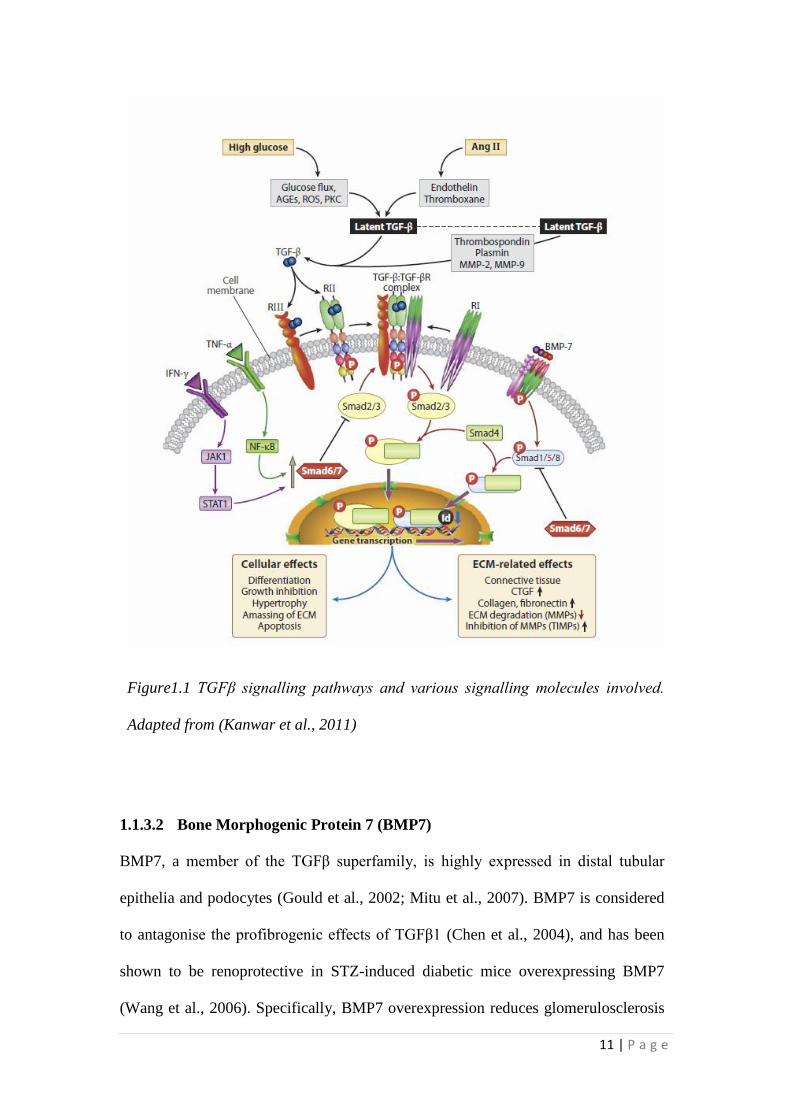
Figure1.1 TGFβ signalling pathways and various signalling molecules involved.
Adapted from (Kanwar et al., 2011)
1.1.3.2 Bone Morphogenic Protein 7 (BMP7)
BMP7, a member of the TGFβ superfamily, is highly expressed in distal tubular
epithelia and podocytes (Gould et al., 2002; Mitu et al., 2007). BMP7 is considered
to antagonise the profibrogenic effects of TGFβ1 (Chen et al., 2004), and has been
shown to be renoprotective in STZ-induced diabetic mice overexpressing BMP7
(Wang et al., 2006). Specifically, BMP7 overexpression reduces glomerulosclerosis
12 | P a g e
and tubulointerstitial fibrosis by down-regulating collagen and fibronectin
expression and increasing podocyte survival. Thus, the balance of BMP7 and TGFβ1
may play an important role in renal disease progression.
1.1.3.3 Regulation of TGFβ Signalling
The TGFβ signalling pathway is further complicated as co-repressor molecules such
as the Sloan-Kettering Institute proto-oncogene (Ski), Ski-related novel gene - non
Alu-containing (SnoN), and TG-Interacting Factor (TGIF) have also been identified
and shown to prevent gene transcription through inhibition of R-SMADs (Luo,
2004). Significant down regulation of these co-repressors have also been observed in
animal models of obstructive nephropathy and diabetes (Hills and Squires, 2011;
Masszi et al., 2004). The SMAD ubiquitination regulatory factor 2 (Smurf2) has also
been implicated in the pathogenesis of diabetic nephropathy by affecting the TGFβ-
SMAD signalling pathway via degradation of SMAD7 and co-repressors (Fukasawa
et al., 2006; Tan et al., 2008; Yang et al., 2003).
1.2 Renal fibrosis and Extracellular Matrix Production
Excessive deposition of ECM is a key pathological process in the development of
renal fibrosis. The production and degradation of ECM is dynamic and highly
regulated under physiological circumstances. Degradation of ECM is largely
determined by MMP activity, which in turn, is under the regulation of tissue
inhibitors of MMPs (TIMPs). Loss of the regulation of MMPs and TIMPs ultimately
tip the balance from repair to excessive accumulation of ECM (Hills and Squires,
2011). Decreased levels of MMP2 and MMP3 along with increased expression of
13 | P a g e
TIMPs has been observed in STZ-induced rat models of diabetic nephropathy
(Catania et al., 2007a), demonstrating a complex interaction between TGFβ1, MMPs
and TIMPs, in addition to multiple additional factors in regulating net ECM
accumulation.
A large proportion of the studies trying to delineate the underlying pathology of
renal fibrosis have focused on the pathophysiology of the glomerulus and its
constituent cells. Increasing evidence suggests renal tubular preservation is key to
limiting functional decline (Kanwar et al., 2011). Renal tubules comprise more than
90% of the renal parenchymal mass and the degree of tubulointerstitial fibrosis
correlates more closely with renal dysfunction than glomerular damage (Nath, 1992).
Central to tubulointerstitial fibrosis is TGFβ1 which can exert a profibrogenic effect
on the tubular cells but also drive an important process called epithelial to
mesenchymal transition (EMT) that converts epithelial cells to ECM producing
myofibroblastic cells.
1.2.1 What is Epithelial to Mesenchymal Transition?
EMT is an important biological process that converts polarised epithelial cells into
migratory and invasive mesenchymal cells, which have significantly increased
production of ECM, resistance to apoptosis and migratory ability. This process has
been long recognised to play a crucial role in embryogenesis (Kalluri and Weinberg,
2009). Most adult organs utilise one or several waves of EMT in organ maturation,
and conversely, mesenchymal to epithelial transition (MET) additionally modifies
organogenesis and tissue repair (Kalluri and Weinberg, 2009; Nieto, 2011).
14 | P a g e
The initial observation of EMT can be dated to as far back as 1890 when the
invasive ability of some morphologically different ductal epithelial cell breast
tumours were described (Cajal, 1890). The term mesenchymal to epithelial
transformation was not coined until 1968 and was later changed to epithelial to
mesenchymal transition to highlight the potential reversibility of this process
(Kalluri and Neilson, 2003b). Later, Elizabeth Hay used a model of chick primitive
streak formation to describe EMT, which states “Epithelial cells exhibit apico-basal
polarity, and during the transformation of epithelium to mesenchyme, the
transforming cells produce filopodia on their basal side followed by a new leading
pseudopodium that is pushed out into the extracellular matrix. A mesenchymal cell
has front end–back end polarity and forms only transient contacts with its neighbors”
(Hay, 1995). Subsequently, the important links between EMT and cancer as well as
organ fibrosis was established, and hence there has been significant scientific
interest and progress in this field (Nieto, 2011).
In this project, type 2 EMT was induced in an in vitro model by exposure to TGFβ1
and in an in vivo model by unilateral ureteral obstruction to study the efficacy of
using miR-200b to prevent renal fibrosis. Thus, type 1 and type 3 EMT will only be
briefly discussed while type 2 EMT will be discussed in more depth.
15 | P a g e
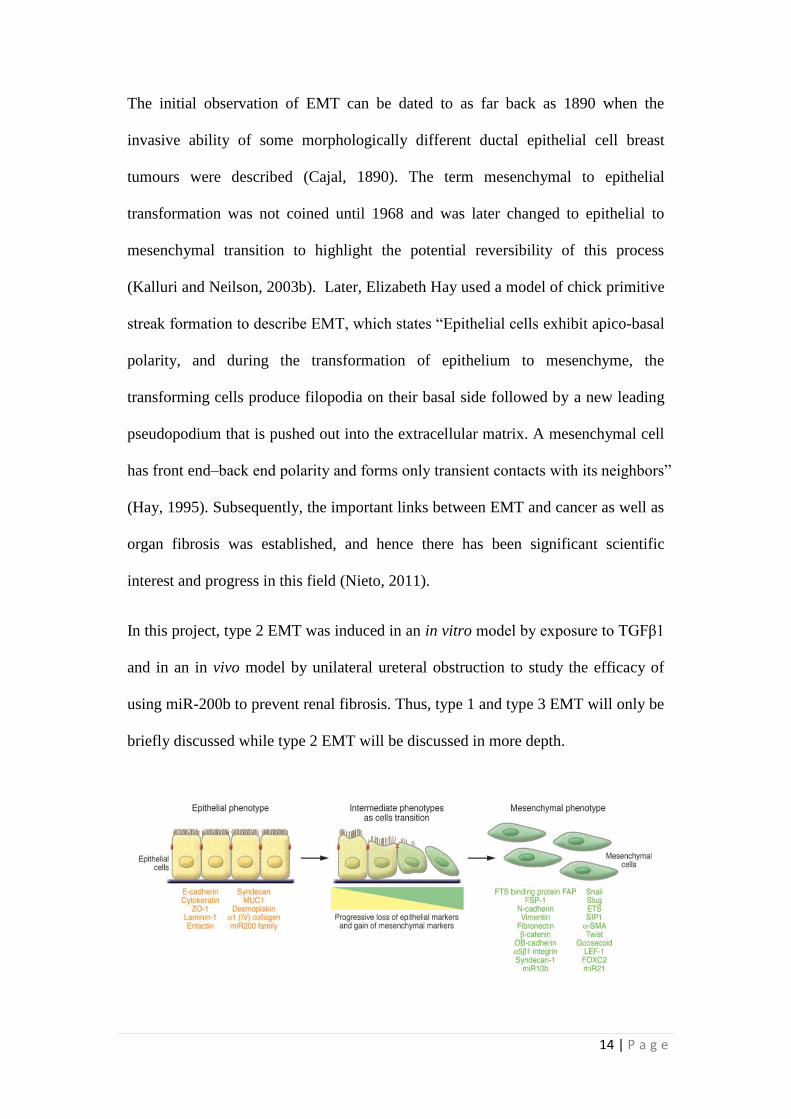
Figure 1.2 Phenotypic and molecular markers during EMT. Adapted from (Kalluri
and Weinberg, 2009)
At the molecular level, multiple processes are involved in the initiation through to
the completion of EMT. These comprise activation of transcription factors,
expression of specific cell surface proteins, expression and reorganisation of
cytoskeletal proteins, production of ECM degrading metalloproteinase as well
alteration in microRNA (miR) expression profiles (Kalluri and Weinberg, 2009).
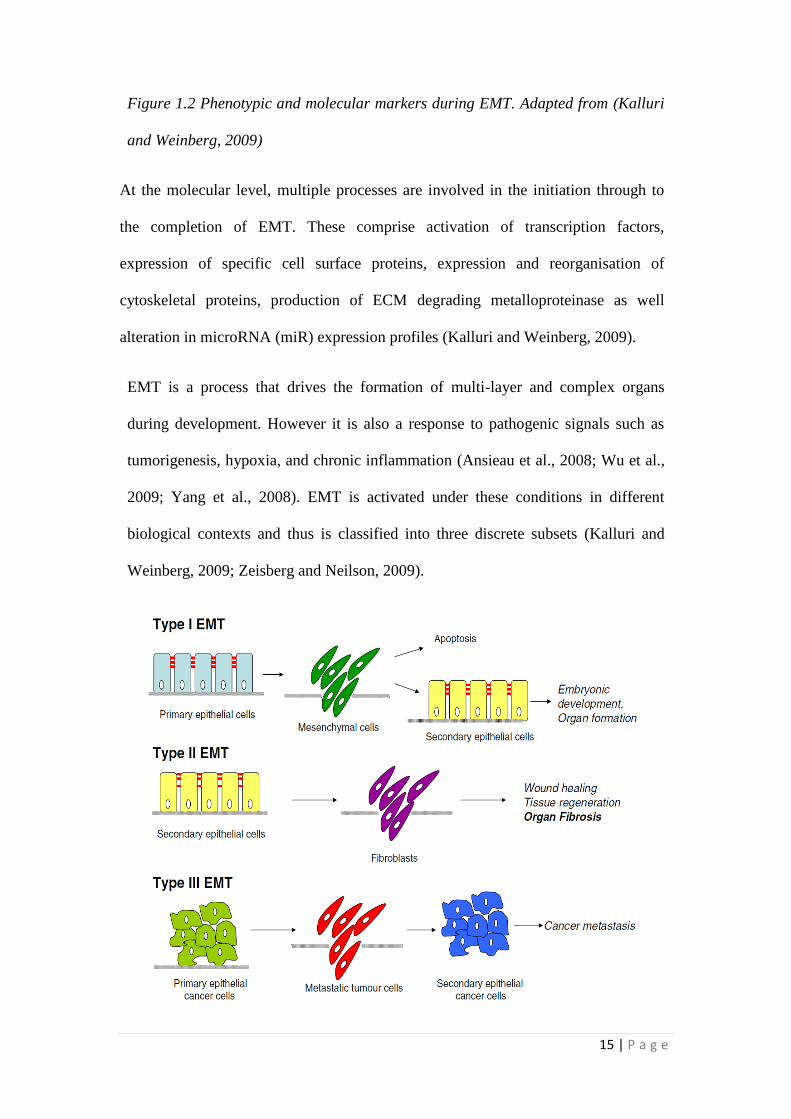
EMT is a process that drives the formation of multi-layer and complex organs
during development. However it is also a response to pathogenic signals such as
tumorigenesis, hypoxia, and chronic inflammation (Ansieau et al., 2008; Wu et al.,
2009; Yang et al., 2008). EMT is activated under these conditions in different
biological contexts and thus is classified into three discrete subsets (Kalluri and
Weinberg, 2009; Zeisberg and Neilson, 2009).
16 | P a g e
Figure 1.3 Diagram illustrated differences between three different kinds of EMT in
different biological contexts. Adapted from (Carew et al., 2012)
1.2.2 Type 1 EMT
Type 1 EMT is associated with implantation, embryo formation and organ
generation. It produces mesenchymal cells at the completion of the process.
EMT is involved from the beginning of embryogenesis and closely associated with
implantation and placenta formation (Vicovac and Aplin, 1996), particularly the
trophoectoderm cells, which later become the cytotrophoblast, undergo EMT in
order to facilitate invasion of the endometrium and thereby secure placentation
(Aplin et al., 1998; Bischof et al., 2006).
The zygote undergoes gastrulation, which develops into three germ layers that
ultimately generate all tissue types of the body. Initially a primitive streak in the
epiblast layer is formed (Hay, 1990). The epithelial cells in the primitive streak
express E-Cadherin and exhibit apical basal polarity. The epithelial-like cells of the
epiblast undergo programmed changes to form the primitive streak from the lower
extremity of the embryo to the head by expressing specific proteins associated with
cell migration and differentiation (Thiery and Sleeman, 2006).
The mesendoderm is formed after the primitive streak is generated, and the
mesendoderm is then separated to form the mesoderm and endoderm via an EMT
process (also known as Epiblast-mesoderm transition) (Hay, 1995). The mesoderm,
which is between the epiblast and the hypoblast, eventually gives rise to primary
mesenchyme (Hay, 2005). Cells of the primary mesenchyme exhibit greater
17 | P a g e
migratory properties when compared with those of the epiblast and the hypoblast
(Hay, 2005).
During embryonic development, EMT drives the formation of migratory neural
crest cells from epithelial cells of the neuroectoderm (Duband and Thiery, 1982).
Initially, the premigratory neural crest cells express genes such as sox, snail, slug
and foxhead box D3, which then undergo EMT (Knecht and Bronner-Fraser, 2002;
Sauka-Spengler and Bronner-Fraser, 2008). Consequently, they move out from the
neural folds, become motile and migrate to different parts of the embryo, where they
undergo further differentiation into different cell types such as the melanocytes.
EMT occurring in the neural crest is triggered by similar signalling pathways to
those involved with EMT associated with gastrulation, ie Wnts, FGFs, BMPs, c-Myb,
and msh homeobox (Karafiat et al., 2007; Liem et al., 2000; Villanueva et al., 2002).
BMP is a key inducer of the migratory property of neural crest cells. An inhibitor of
BMP, Noggin, arrests EMT (Burstyn-Cohen et al., 2004; Sela-Donenfeld and
Kalcheim, 2002). Also, EMT in the neural crest will not occur unless E-cadherin
and N-cadherin, the two cell adhesion molecules, are repressed (Thiery, 2003). EMT
is integrally involved in later stages of embryogenesis, such as the endothelial-
mesenchymal transition (EndMT) that occurs during heart valve formation. These
findings early in the recognition of EMT played a significant role in the subsequent
understanding of type 2 EMT in renal fibrosis where similar molecular changes have
been observed (Kalluri and Weinberg, 2009).

18 | P a g e
1.2.3 Type 3 EMT
Type 3 EMT is involved in the epithelial cells transitioning to metastatic tumour
cells and occurs in the secondary epithelia of cancerous tissues. It occurs in
neoplastic cells that have previously undergone genetic and epigenetic changes,
particularly when they affect oncogenes and tumour suppressor genes. Cancer cells
undergoing Type 3 EMT may invade and metastasise, which clearly is associated
with a poor prognosis (Carew et al., 2012; Kalluri and Weinberg, 2009).
Many studies including in vivo mouse studies and in vitro cell culture experiments
have identified that cancer cells can acquire a mesenchymal phenotype which render
them an invasive capacity. These cells are normally found at the invasive front of the
primary epithelial tumour and express mesenchymal markers such as αSMA,
Fibroblast Specific Protein 1 (FSP1), vimentin and desmin (Yang and Weinberg,
2008). It is thought that these cells are indeed the cells that eventually invade and
metastasise (Brabletz et al., 2001; Fidler and Poste, 2008; Thiery, 2002).
Many cytokines drive the activation of EMT, including, hepatocyte growth factor
(HGF), epidermal growth factor (EGF), platelet-derived growth factor (PDGF) and
TGFβ1. These cytokines drive the upregulation of transcription factors including
Snail, Slug, Zinc-finger E-box Binding homeobox 1 (ZEB1), Twist, Goosecoid, and
FOXC2 (Jechlinger et al., 2002; Kokudo et al., 2008; Medici et al., 2008; Niessen et
al., 2008; Shi and Massague, 2003; Thiery, 2002). Activation of these transcription
factors lead to the downstream activation of signalling molecules and pathways
including MAPK (p38, p42 and JNK) PI3K, Akt, SMADs, RhoB, β-catenin,
Lymphoid Enhancer binding Factor (LEF), Ras, c-Fos and integrin signalling (Gupta
et al., 2005; Hartwell et al., 2006; Mani et al., 2008; Mani et al., 2007; Taki et al.,
2006; Weinberg, 2008; Yang et al., 2006; Yang and Weinberg, 2008).
19 | P a g e
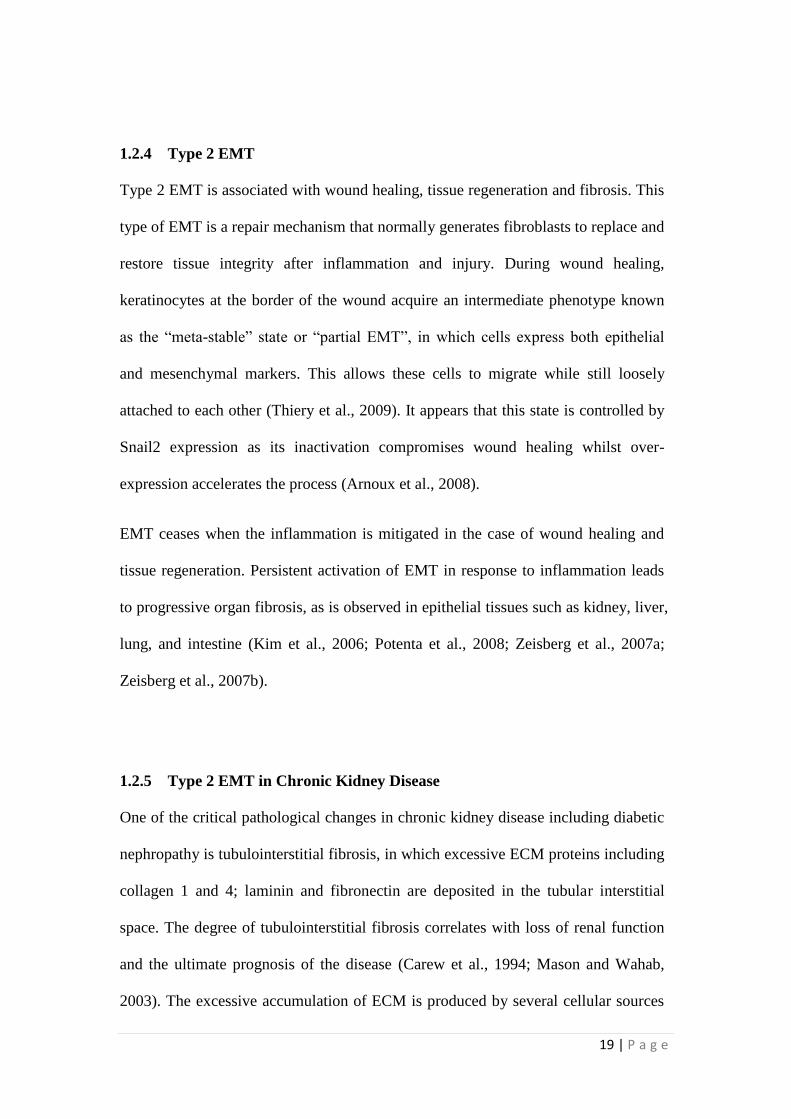
1.2.4 Type 2 EMT
Type 2 EMT is associated with wound healing, tissue regeneration and fibrosis. This
type of EMT is a repair mechanism that normally generates fibroblasts to replace and
restore tissue integrity after inflammation and injury. During wound healing,
keratinocytes at the border of the wound acquire an intermediate phenotype known
as the “meta-stable” state or “partial EMT”, in which cells express both epithelial
and mesenchymal markers. This allows these cells to migrate while still loosely
attached to each other (Thiery et al., 2009). It appears that this state is controlled by
Snail2 expression as its inactivation compromises wound healing whilst over-
expression accelerates the process (Arnoux et al., 2008).
EMT ceases when the inflammation is mitigated in the case of wound healing and
tissue regeneration. Persistent activation of EMT in response to inflammation leads
to progressive organ fibrosis, as is observed in epithelial tissues such as kidney, liver,
lung, and intestine (Kim et al., 2006; Potenta et al., 2008; Zeisberg et al., 2007a;
Zeisberg et al., 2007b).
1.2.5 Type 2 EMT in Chronic Kidney Disease
One of the critical pathological changes in chronic kidney disease including diabetic
nephropathy is tubulointerstitial fibrosis, in which excessive ECM proteins including
collagen 1 and 4; laminin and fibronectin are deposited in the tubular interstitial
space. The degree of tubulointerstitial fibrosis correlates with loss of renal function
and the ultimate prognosis of the disease (Carew et al., 1994; Mason and Wahab,
2003). The excessive accumulation of ECM is produced by several cellular sources

20 | P a g e
including activated myofibroblasts, the origin of which remains controversial (Badid
et al., 2002; Powell et al., 1999; Roberts et al., 1997). Kalluri and Neilson
demonstrated in mouse kidney fibrosis that 30% of fibroblasts are derived via EMT
from tubular epithelial cells and 12% are derived from bone marrow (Kalluri and
Neilson, 2003b). In addition, about 35% of these fibroblasts are derived from
endothelial cells normally residing in kidney via EndMT, while the remaining are
thought to come from resident interstitial fibroblasts or other mesenchymal cells
such as perivascular smooth muscle cells, pericytes and circulating fibrocytes
(Zavadil and Bottinger, 2005). Nevertheless, type 2 EMT of epithelial cells
contributes significantly to the pathogenesis of renal fibrosis.
Type 2 EMT occurs in response to various injurious stimuli in the kidney including
hypoxia, reactive oxygen species (ROS), advanced glycation end products (AGEs),
profibrogenic cytokines and MMP elaboration, many of which are activated under a
hyperglycaemic milieu. TGFβ1 represents the key candidate in the pathogenesis of
renal fibrosis. Studies have demonstrated a critical role of the downstream signalling
cascades of TGFβ1 such as the SMAD and PI3K-Akt pathways in the induction of
EMT in various epithelial cell lines (Bakin et al., 2000; Cano et al., 2000; Cho et al.,
2007; Kattla et al., 2008; Valcourt et al., 2005).
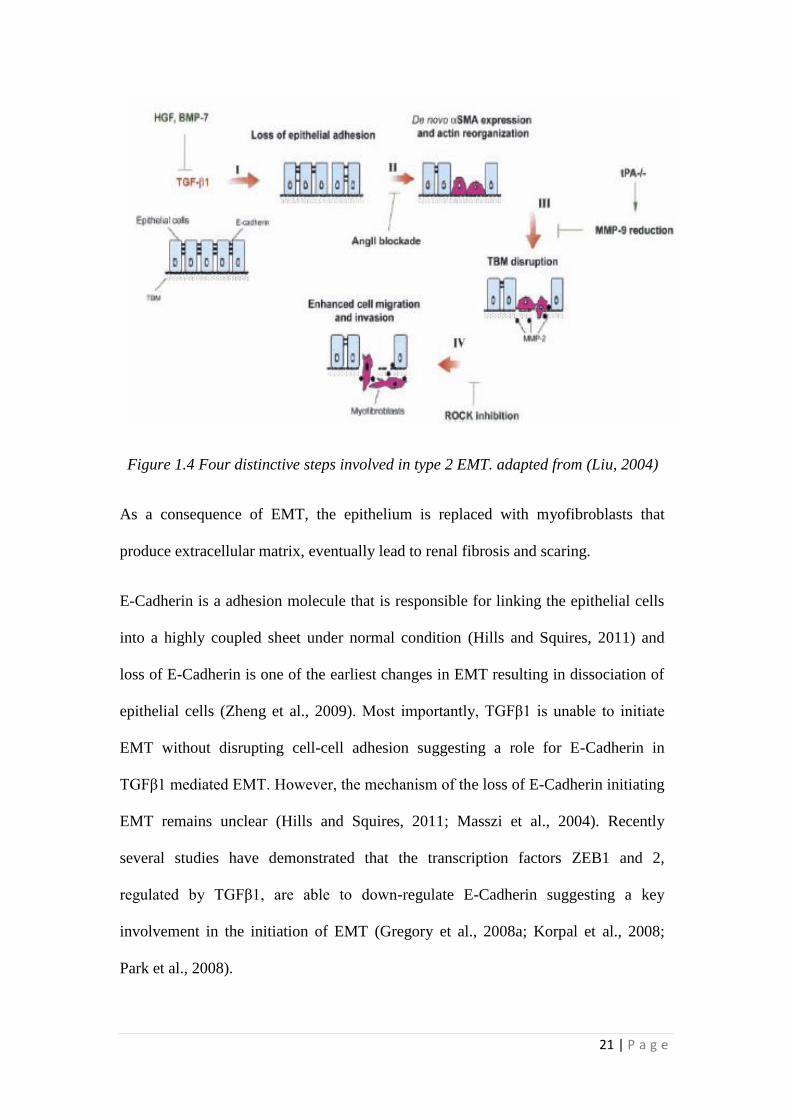
Based on the phenotype and markers expressed, type 2 EMT can be divided into four
stages.
1. Loss of cell-cell adhesion
2. De novo synthesis of αSMA and actin reorganisation
3. Disruption of tubular basement membrane
4. Enhanced cell migration and invasion capacity
21 | P a g e
Figure 1.4 Four distinctive steps involved in type 2 EMT. adapted from (Liu, 2004)
As a consequence of EMT, the epithelium is replaced with myofibroblasts that
produce extracellular matrix, eventually lead to renal fibrosis and scaring.
E-Cadherin is a adhesion molecule that is responsible for linking the epithelial cells
into a highly coupled sheet under normal condition (Hills and Squires, 2011) and
loss of E-Cadherin is one of the earliest changes in EMT resulting in dissociation of
epithelial cells (Zheng et al., 2009). Most importantly, TGFβ1 is unable to initiate
EMT without disrupting cell-cell adhesion suggesting a role for E-Cadherin in
TGFβ1 mediated EMT. However, the mechanism of the loss of E-Cadherin initiating
EMT remains unclear (Hills and Squires, 2011; Masszi et al., 2004). Recently
several studies have demonstrated that the transcription factors ZEB1 and 2,
regulated by TGFβ1, are able to down-regulate E-Cadherin suggesting a key
involvement in the initiation of EMT (Gregory et al., 2008a; Korpal et al., 2008;
Park et al., 2008).

22 | P a g e
1.2.6 Biomarkers of Type 2 EMT
Though a large amount of evidence indicates that EMT plays an important role in
generating myofibroblasts and thereby leading to the excessive deposition of ECM in
chronic kidney disease (Kalluri and Neilson, 2003a; Liu, 2004; Okada et al., 2000;
Zeisberg and Kalluri, 2004), in human renal fibrosis, the lack of robust methods and
biomarkers identifying the transition and migration of epithelial cells under EMT as
well as resulting mesenchymal cells remains the major hurdle defining the
magnitude of EMT in fibrosis. A diverse array of biomarkers have thus been used to
identify EMT and each subgroup has their own unique expression profile of markers,
though some may overlap (Zeisberg and Neilson, 2009).
Under normal conditions, tubular epithelial cells are separated from ECM by a layer
of tubular basement membrane (Fan et al., 1999; Okada et al., 1997). During EMT,
epithelial cell-derived fibroblasts enter the interstitium by breaking down the
basement membrane and then they become active in ECM production. This is
initiated by the down regulation of E-Cadherin and tight junction protein 1 (ZO-1),
which are important adhesion proteins maintaining the structural integrity and
polarity of epithelia (Kalluri and Neilson, 2003a; Yang and Liu, 2001). The
progressive change to OB-Cadherin from E-Cadherin had been observed in Type 2
EMT and this had been used to monitor the development of Type 2 EMT (Strutz et
al., 2002). Type 2 EMT has also been associated with Discoidin Domain Receptor
tyrosine kinase 2 (DDR2) and subsequent up-regulation of MMP1 (Vogel et al.,
1997). β-catenin is part of a complex of proteins that constitute adherens junctions
and links cadherins to the cytoskeleton. It also participates in the transcriptional
activation of EMT genes, in particular Snail1 (Bienz, 2005; Yook et al., 2006). It is
23 | P a g e
is thus used as a marker in all types of EMT (Kalluri and Neilson, 2003b; Kim et al.,
2002).
De-novo synthesis of αSMA and reorganisation of the actin cytoskeleton marks the
next phase of EMT, which is accompanied by the exchange of cytokeratin for
vimentin filaments and activation of FSP1. FSP1 has been used as an early marker
for Type 2 EMT. (Iwano et al., 2002a; Zeisberg et al., 2007a; Zeisberg et al., 2007c).
Fibronectin is one of main constituents of ECM and can also function as a fibroblast
chemo-attractant and promoter of fibroblastic differentiation (Yokoi et al., 2001).
Laminin1, which is the major basement membrane protein, is down-regulated during
EMT and again serves as a marker for Type 1 & 2 EMT (Zeisberg et al., 2002).
However, many of these markers are non-specific. FSP1 is not specific to epithelial
cells undergoing EMT, but is also expressed by endothelial cells, smooth muscle
cells and inflammatory cells (Kalluri and Neilson, 2003b; Liu, 2004; Strutz et al.,
1995). Vimentin is controversial as it is expressed by other cells (Franke et al., 1978)
while fibronectin can be produced from fibroblasts that have not been derived from
EMT (Strutz et al., 2002; Zeisberg et al., 2001). αSMA represents the most
commonly used marker in EMT,. However, heterogeneity of expression of this
marker also exists (Masszi et al., 2004). Hence it is suggested that the combination
of both vimentin and β-catenin be used to detect EMT in renal pathology (Galichon
and Hertig, 2011).
1.2.7 Models used in studying EMT and Renal Interstitial Fibrosis
In terms of the models used to study renal fibrosis, the most convincing evidence
that EMT contributes to human renal disease has come from studies of human renal

24 | P a g e
biopsies in patients with diabetes (Oldfield et al., 2001). However many cells have
been used to study EMT in vitro, including primary cultures and cell lines from
human and animal origin. Removal of ligands that induce type 2 EMT in some
cultures restores epithelial cell phenotype in a process known as reversible scatter
(Carew et al., 2012; Kalluri and Neilson, 2003b), suggesting plasticity and inter-
changeability associated with both the epithelial and myofibroblastic cells. Various
cell lines with conditional knockout (KO) of key molecules involved in EMT, such
as SMAD2, and SMAD3 have, allowed a better understanding of the pathways and
potential therapeutic targets in EMT (Lan, 2011a). Studying EMT in in vivo models
has been problematic due to the lack of specific biomarker(s) as discussed above.
Hence cell-fate mapping, where reporter genes can be tracked in transformed cells,
has been used to study its importance (Carew et al., 2012; Iwano et al., 2002b; Kim
et al., 2006). Diabetic animal models (mouse and rat), either spontaneous (db/db) or
STZ induced, have been used to study hyperglycaemia induced EMT (Carew et al.,
2012). Mechanistically, EMT is consistent across many models of renal disease.
Hence ureteric obstruction and sub-total nephrectomy models are frequently used to
study tubular EMT (Ng et al., 1998; Yokoi et al., 2004) as renal injury occurs
somewhat sooner in these models compared to diabetic nephropathy. In this project,
unilateral ureteral obstruction (UUO) was used as a model of renal interstitial
fibrosis. UUO was originally shown to induce renal interstitial fibroblast
proliferation as well as epithelial transformation into active myofibroblasts (Nagle et
al., 1973), along with increased expression of collagens and fibronectin (Sharma et
al., 1993) in rabbit. This technique is now widely used to induce renal interstitial
fibrosis in murine models (Chevalier et al., 2009a). Complete ligation of the ureter
induces a rapid hemodynamic and metabolic change resulting in reduction in blood
25 | P a g e
flow and glomerular filtration rate in the obstructed kidney (Vaughan et al., 2004). It
is followed by hydronephrosis, interstitial macrophage infiltration and tubular injury
eventually leading to cell death (Docherty et al., 2006). The development of EMT
and proliferation of fibroblasts contribute significantly to the excessive deposition of
ECM and thus renal fibrosis (Chevalier et al., 2009b; Klahr and Morrissey, 2002).
Further investigation into the UUO model has revealed the major pathways
responsible for development of renal interstitial fibrosis. The infiltrating
macrophages produce cytokines such as TGFβ1, which promotes tubular apoptosis
and EMT. Transformed epithelial cells can then migrate out to the interstitium and
actively produce ECM. Under TGFβ1 stimulation, local resident fibroblasts are
activated and synergistically participate in the production of ECM. Tumour necrosis
factor α (TNFα) is also secreted by infiltrating macrophages and is considered
responsible for tubular death and subsequent development of tubular atrophy
(Chevalier et al., 2009b).
1.3 Controversy of the role of EMT in renal fibrosis
Even though the role of EMT in renal fibrosis is generally accepted and EMT is
robustly observed in in vitro models where renal tubular cells were stimulated with
TGFβ1, several studies raised the question whether this is truly what happens in vivo
(Humphreys et al., 2010; Li et al., 2010). In these studies, labelled tubular cells (cell
fate tracing) demonstrated no involvement of tubular cell EMT in contributing to
renal fibrosis in UUO mice model. However, in another study, LacZ labelled tubular
cells expressed both FSP-1 and LacZ at the same time in fibrotic tissue around tubules
in a UUO mice model (Iwano et al., 2002a). Thus, more studies have to be carried out
to end the controversy.

26 | P a g e
1.4 TGFβ Signalling and Diabetic Nephropathy
Diabetic nephropathy is a devastating complication in patients with diabetes mellitus.
Given it has clearly been associated with overexpression of TGFβ it is used as an
illustrative form of nephropathy for the purpose of further discussion. Diabetes
mellitus is a metabolic disorder induced by chronic hyperglycaemia, which causes
dysfunction in multiple cells in the kidney, leading to progressive renal fibrosis and
eventually renal failure. Diabetic nephropathy represents the single most common
cause of entry into renal replacement therapy, ie dialysis and renal transplantation.
Patients with diabetic nephropathy contribute up to 35% of patients with end stage
renal disease (Fioretto and Mauer, 2007; Giunti et al., 2006; Schena and Gesualdo,
2005; Susztak and Bottinger, 2006; Wolf, 2004). Type I and Type II diabetes are
distinct in aetiology. However, the changes evoked by hyperglycaemia in the kidney,
specifically, in the glomerulus, tubulointerstitium and vasculature are remarkably
similar and virtually indistinguishable (Fioretto and Mauer, 2007). Initially,
dysfunction of the glomerular capillaries induces the changes clinically manifesting
as hyperfiltration and microalbuminuria (Wolf, 2004; Wolf and Ziyadeh, 2007).
Subsequent changes include mesangial cell hyperplasia and hypertrophy, increased
mesangial matrix and thickening of the glomerular basement membrane, all of
which together lead to Kimmelstiel-Wilson lesions in glomeruli (Mason and Wahab,
2003; Wolf, 2004); tubular atrophy followed by thickening of the tubular basement
membrane and interstitial fibrosis in the tubulointerstitium (Mauer et al., 1984). As
highlighted above, EMT is likely to play an important role in tubulointerstitial
fibrosis causing excessive accumulation of ECM (Mason and Wahab, 2003;
Nangaku, 2004; Zavadil and Bottinger, 2005). Vascular changes include

27 | P a g e
hyalinisation and thickening of both the afferent arterioles and interlobular arteries
with widespread endothelial effacement (Kanwar et al., 2011).
Even though various types of cells with different functions are present in the kidney,
evidence suggests that they respond to hyperglycaemic insults by activating common
intracellular signalling pathways, with minor variation (Kanwar et al., 2011). These
signalling events include accentuated flux of polyols and hexosamines; generation of
AGEs and ROS; activation of protein kinase C (PKC), TGFβ1, Janus kinase-signal
transducer and activator of transcription (JAK-STAT) pathways and G protein
signalling; abnormal cyclin kinases and their inhibitor levels; altered expression of
ECM proteins and ECM degrading enzymes - metalloproteinases and their inhibitors
(Brownlee, 2001; Catania et al., 2007b; Chung et al., 2003b; Inoguchi et al., 2003;
Marrero et al., 2006; Mason and Wahab, 2003; Sharpe and Hendry, 2003; Tan et al.,
2007; Wolf, 2002; Ziyadeh, 2004). Furthermore, cross talk occurs at different levels
of the signalling pathways, providing either positive or negative feedback that affects
the net outcome in the disease process (Kanwar et al., 2011). The following figure
adopted from Kanwar et al (Kanwar et al., 2011) summarises the cellular pathways
activated under diabetic conditions.

28 | P a g e
Figure 1.5 Simplified diagram of various events involved in the pathogenesis of
diabetic nephropathy. Adapted from (Kanwar et al., 2011).
29 | P a g e
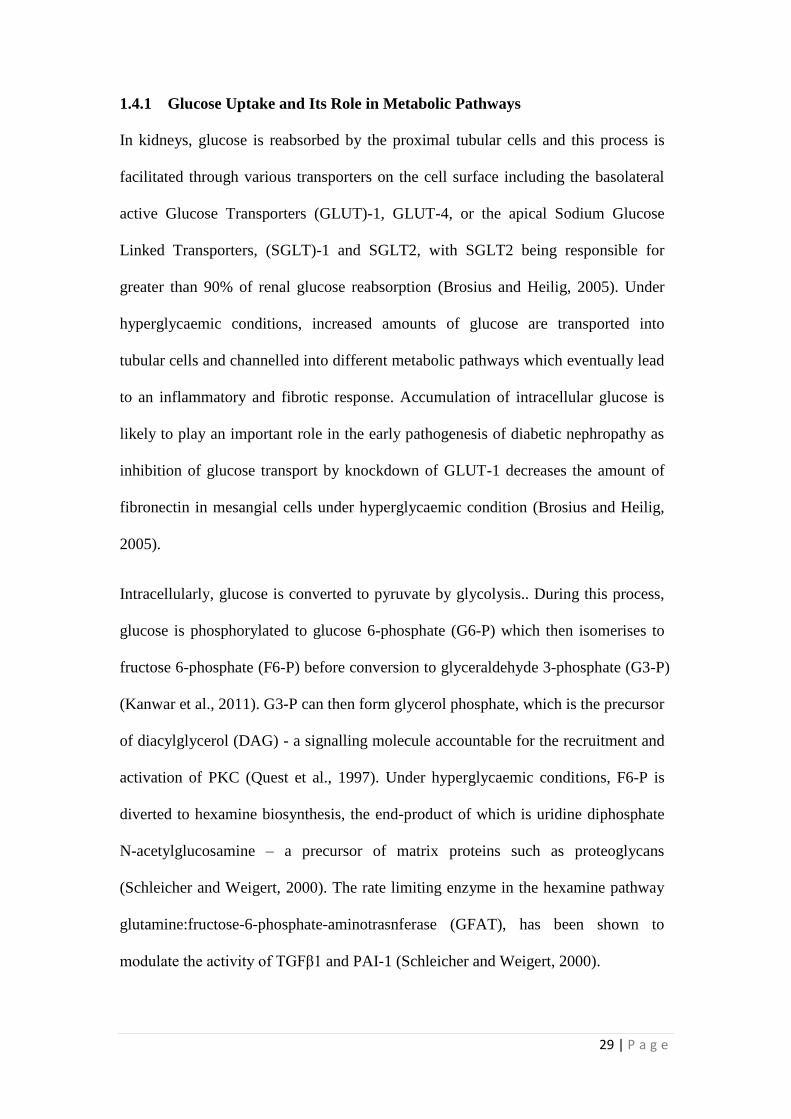
1.4.1 Glucose Uptake and Its Role in Metabolic Pathways
In kidneys, glucose is reabsorbed by the proximal tubular cells and this process is
facilitated through various transporters on the cell surface including the basolateral
active Glucose Transporters (GLUT)-1, GLUT-4, or the apical Sodium Glucose
Linked Transporters, (SGLT)-1 and SGLT2, with SGLT2 being responsible for
greater than 90% of renal glucose reabsorption (Brosius and Heilig, 2005). Under
hyperglycaemic conditions, increased amounts of glucose are transported into
tubular cells and channelled into different metabolic pathways which eventually lead
to an inflammatory and fibrotic response. Accumulation of intracellular glucose is
likely to play an important role in the early pathogenesis of diabetic nephropathy as
inhibition of glucose transport by knockdown of GLUT-1 decreases the amount of
fibronectin in mesangial cells under hyperglycaemic condition (Brosius and Heilig,
2005).
Intracellularly, glucose is converted to pyruvate by glycolysis.. During this process,
glucose is phosphorylated to glucose 6-phosphate (G6-P) which then isomerises to
fructose 6-phosphate (F6-P) before conversion to glyceraldehyde 3-phosphate (G3-P)
(Kanwar et al., 2011). G3-P can then form glycerol phosphate, which is the precursor
of diacylglycerol (DAG) - a signalling molecule accountable for the recruitment and
activation of PKC (Quest et al., 1997). Under hyperglycaemic conditions, F6-P is
diverted to hexamine biosynthesis, the end-product of which is uridine diphosphate
N-acetylglucosamine – a precursor of matrix proteins such as proteoglycans
(Schleicher and Weigert, 2000). The rate limiting enzyme in the hexamine pathway
glutamine:fructose-6-phosphate-aminotrasnferase (GFAT), has been shown to
modulate the activity of TGFβ1 and PAI-1 (Schleicher and Weigert, 2000).
30 | P a g e
Excess glucose can also be channelled into other metabolic pathways such as the
polyol and myo-inositol pathways. The former results in an increase in oxidative and
osmotic stress (Chung et al., 2003a), while the latter may be important in tubular
‘health’, as the addition of myo-inositol to cultured proximal tubular epithelial cells
normalises glucose induced proliferation and collagen synthesis (Ziyadeh et al.,
1991).
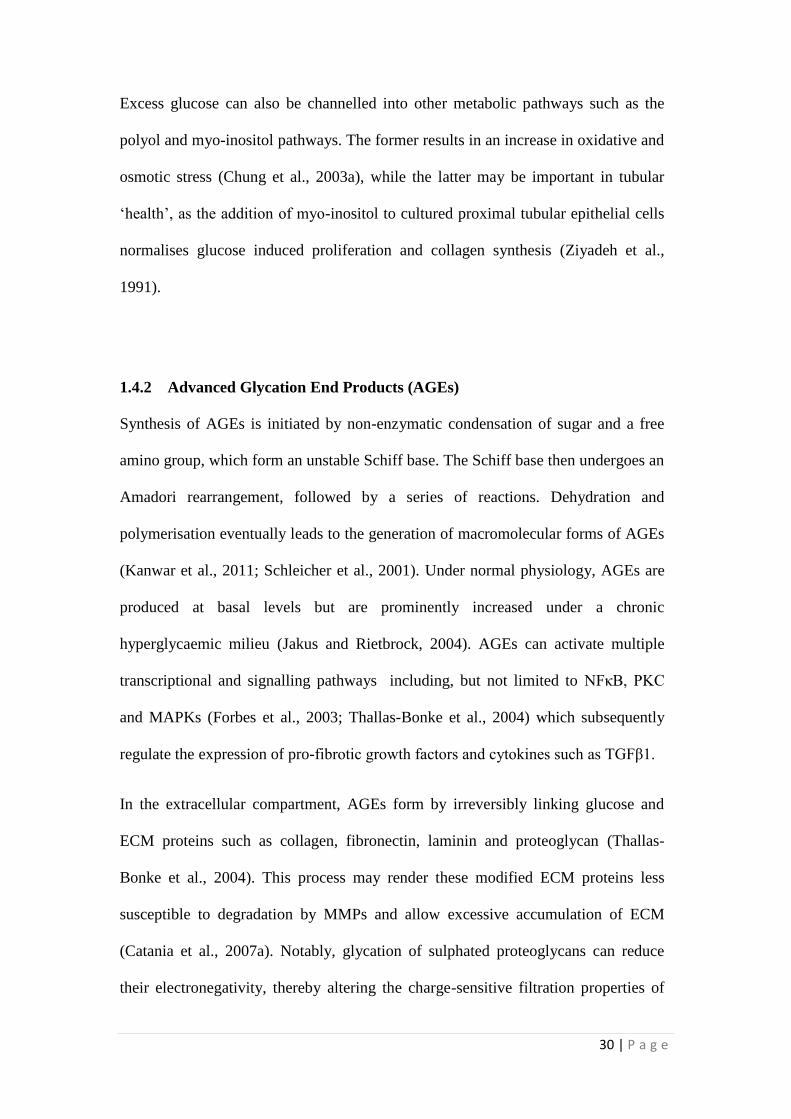
1.4.2 Advanced Glycation End Products (AGEs)
Synthesis of AGEs is initiated by non-enzymatic condensation of sugar and a free
amino group, which form an unstable Schiff base. The Schiff base then undergoes an
Amadori rearrangement, followed by a series of reactions. Dehydration and
polymerisation eventually leads to the generation of macromolecular forms of AGEs
(Kanwar et al., 2011; Schleicher et al., 2001). Under normal physiology, AGEs are
produced at basal levels but are prominently increased under a chronic
hyperglycaemic milieu (Jakus and Rietbrock, 2004). AGEs can activate multiple
transcriptional and signalling pathways including, but not limited to NFκB, PKC
and MAPKs (Forbes et al., 2003; Thallas-Bonke et al., 2004) which subsequently
regulate the expression of pro-fibrotic growth factors and cytokines such as TGFβ1.
In the extracellular compartment, AGEs form by irreversibly linking glucose and
ECM proteins such as collagen, fibronectin, laminin and proteoglycan (Thallas-
Bonke et al., 2004). This process may render these modified ECM proteins less
susceptible to degradation by MMPs and allow excessive accumulation of ECM
(Catania et al., 2007a). Notably, glycation of sulphated proteoglycans can reduce
their electronegativity, thereby altering the charge-sensitive filtration properties of

31 | P a g e
the basement membrane, resulting in albuminuria (Brownlee, 1995; Kanwar et al.,
2011; Wautier and Guillausseau, 2001).
AGEs also bind to receptors for advanced glycation endproducts (RAGE) on the cell
surface and thereby modulate cellular function (Forbes et al., 2003; Jakus and
Rietbrock, 2004). High concentrations of AGEs, either extracellular or intracellular,
can also induce the production of ROS, which are likely to modulate NFκB and AP1
activation and downstream PKC and MAPK signalling (Jakus and Rietbrock, 2004;
Schleicher and Weigert, 2000; Thallas-Bonke et al., 2004). Blocking of either AGE
production or inhibition of its cellular action with soluble RAGE can partially
reverse hyperglycaemia induced vascular complications (Mani et al., 2007). A recent
report also looked at the effects of ingested AGE on renal diseases under diabetic
conditions (Thallas-Bonke et al., 2013). A low AGE diet was given to STZ induced
diabetic C57BL6 mice and RAGE-KO mice for 24 weeks. At the end the study, it
was found that low AGE diet did not protect the diabetic C57BL6 mice from
developing nephropathy, while diabetic RAGE-KO mice had reduced renal fibrosis
measured by glomerulosclerosis, tubulointerstitial expansion, TGFβ1 expression
and glomerular collagen 4 deposition (Thallas-Bonke et al., 2013). These results
indicate that, diabetic patients may be challenged by a significant AGE burden, both
ingested and facilitated by hyperglycaemia. Blockade of RAGE can attenuate AGE
induced renal diseases and suggests the utility of this strategy in ameliorating
diabetic nephropathy.
32 | P a g e
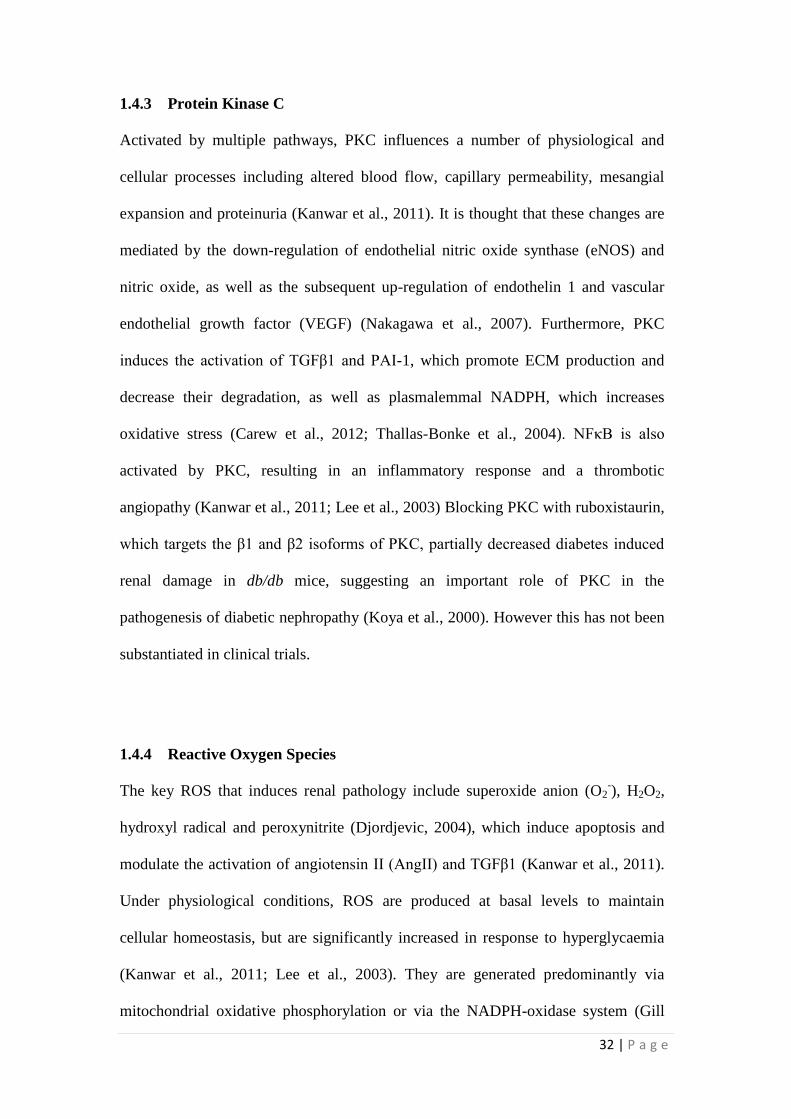
1.4.3 Protein Kinase C
Activated by multiple pathways, PKC influences a number of physiological and
cellular processes including altered blood flow, capillary permeability, mesangial
expansion and proteinuria (Kanwar et al., 2011). It is thought that these changes are
mediated by the down-regulation of endothelial nitric oxide synthase (eNOS) and
nitric oxide, as well as the subsequent up-regulation of endothelin 1 and vascular
endothelial growth factor (VEGF) (Nakagawa et al., 2007). Furthermore, PKC
induces the activation of TGFβ1 and PAI-1, which promote ECM production and
decrease their degradation, as well as plasmalemmal NADPH, which increases
oxidative stress (Carew et al., 2012; Thallas-Bonke et al., 2004). NFκB is also
activated by PKC, resulting in an inflammatory response and a thrombotic
angiopathy (Kanwar et al., 2011; Lee et al., 2003) Blocking PKC with ruboxistaurin,
which targets the β1 and β2 isoforms of PKC, partially decreased diabetes induced
renal damage in db/db mice, suggesting an important role of PKC in the
pathogenesis of diabetic nephropathy (Koya et al., 2000). However this has not been
substantiated in clinical trials.
1.4.4 Reactive Oxygen Species
The key ROS that induces renal pathology include superoxide anion (O2-), H2O2,
hydroxyl radical and peroxynitrite (Djordjevic, 2004), which induce apoptosis and
modulate the activation of angiotensin II (AngII) and TGFβ1 (Kanwar et al., 2011).
Under physiological conditions, ROS are produced at basal levels to maintain
cellular homeostasis, but are significantly increased in response to hyperglycaemia
(Kanwar et al., 2011; Lee et al., 2003). They are generated predominantly via
mitochondrial oxidative phosphorylation or via the NADPH-oxidase system (Gill

33 | P a g e
and Wilcox, 2006; Kang and Hamasaki, 2003; Li and Shah, 2003; Schrauwen and
Hesselink, 2004). As previously discussed, ROS can be activated by several
regulating molecules including AGEs and PKC. However, increasing evidence is
showing a reciprocal relationship where ROS can induce the activity of ROS
inducers, thus amplifying their signalling under hyperglycaemic conditions
(Brownlee, 1995; Inoguchi et al., 2003; Kanwar et al., 2011; Wrighton et al., 2009).
The “hunt and destroy” actions of these ROS are mediated by enzymes including
cytoplasmic CuZn superoxide dismutase (CuZnSOD), mitochondrial manganese
superoxide dismutase (MnSOD) and hemeoxygenase 1 (Catherwood et al., 2002;
Koya et al., 2003). Over-expression of cytoplasmic CuZnSOD has been shown to
reduce glomerular pathology in STZ induced diabetic db/db mice (Craven et al.,
2001; DeRubertis et al., 2004). Additionally, antagonising NADPH-oxidase
decreased the expression of fibronectin in tubular and mesangial cells, demonstrating
the potential of targeting ROS in the prevention or treatment of diabetic nephropathy.
1.5 MicroRNA (miRNA) and Renal Fibrosis
With the discovery of miRNA and their role in gene regulation, there is an explosion
of studies suggesting an important role of miRNA in the pathogenesis of diabetic
nephropathy. These miRNAs can be used as markers identifying EMT and renal
fibrosis, or therapeutic targets in treating the disease. Thus, identification of these
miRNAs and their molecular mechanisms in the initiation and progression of the
disease become particularly important and naturally come to be the focus of this
thesis.
34 | P a g e
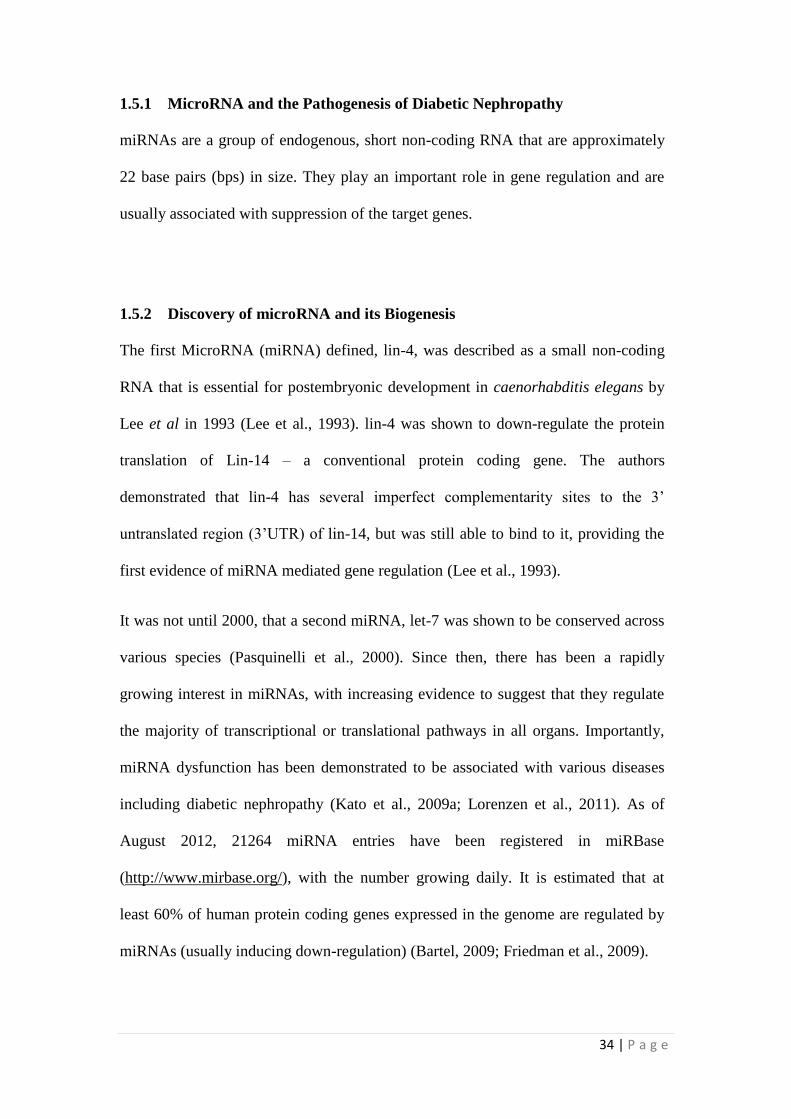
1.5.1 MicroRNA and the Pathogenesis of Diabetic Nephropathy
miRNAs are a group of endogenous, short non-coding RNA that are approximately
22 base pairs (bps) in size. They play an important role in gene regulation and are
usually associated with suppression of the target genes.
1.5.2 Discovery of microRNA and its Biogenesis
The first MicroRNA (miRNA) defined, lin-4, was described as a small non-coding
RNA that is essential for postembryonic development in caenorhabditis elegans by
Lee et al in 1993 (Lee et al., 1993). lin-4 was shown to down-regulate the protein
translation of Lin-14 – a conventional protein coding gene. The authors
demonstrated that lin-4 has several imperfect complementarity sites to the 3’
untranslated region (3’UTR) of lin-14, but was still able to bind to it, providing the
first evidence of miRNA mediated gene regulation (Lee et al., 1993).
It was not until 2000, that a second miRNA, let-7 was shown to be conserved across
various species (Pasquinelli et al., 2000). Since then, there has been a rapidly
growing interest in miRNAs, with increasing evidence to suggest that they regulate
the majority of transcriptional or translational pathways in all organs. Importantly,
miRNA dysfunction has been demonstrated to be associated with various diseases
including diabetic nephropathy (Kato et al., 2009a; Lorenzen et al., 2011). As of
August 2012, 21264 miRNA entries have been registered in miRBase
(http://www.mirbase.org/), with the number growing daily. It is estimated that at
least 60% of human protein coding genes expressed in the genome are regulated by
miRNAs (usually inducing down-regulation) (Bartel, 2009; Friedman et al., 2009).
35 | P a g e
1.5.3 Biogenesis of microRNA
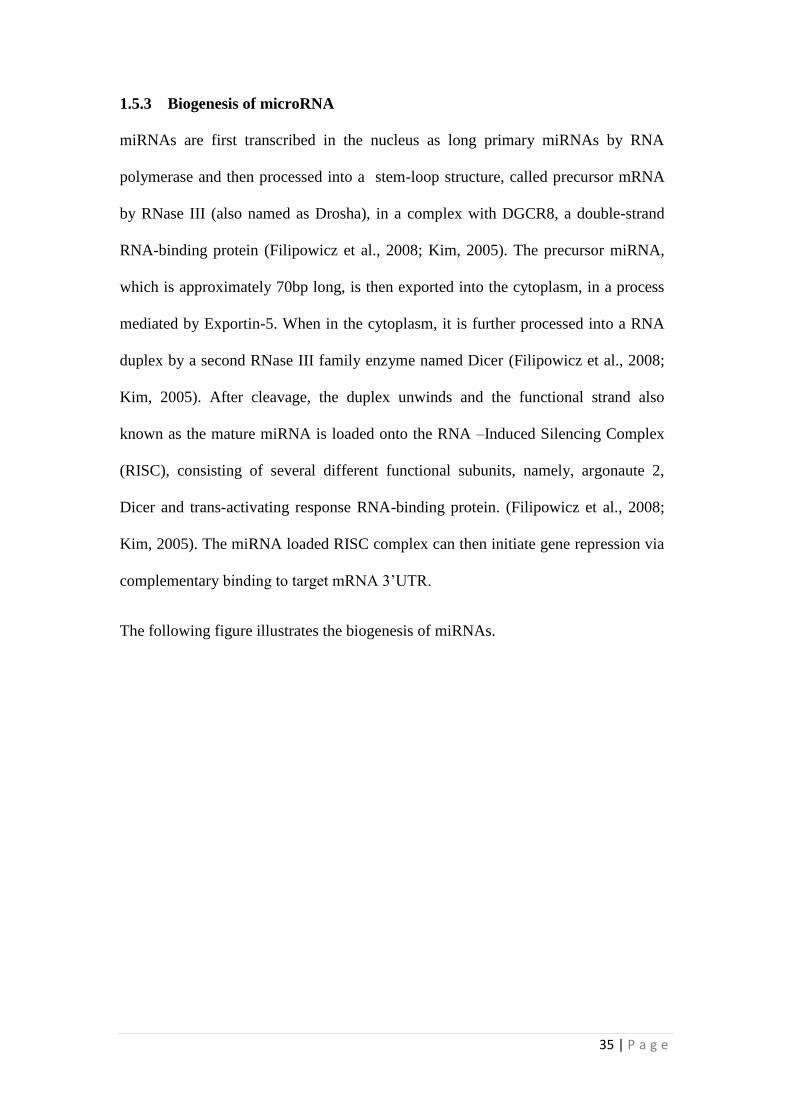
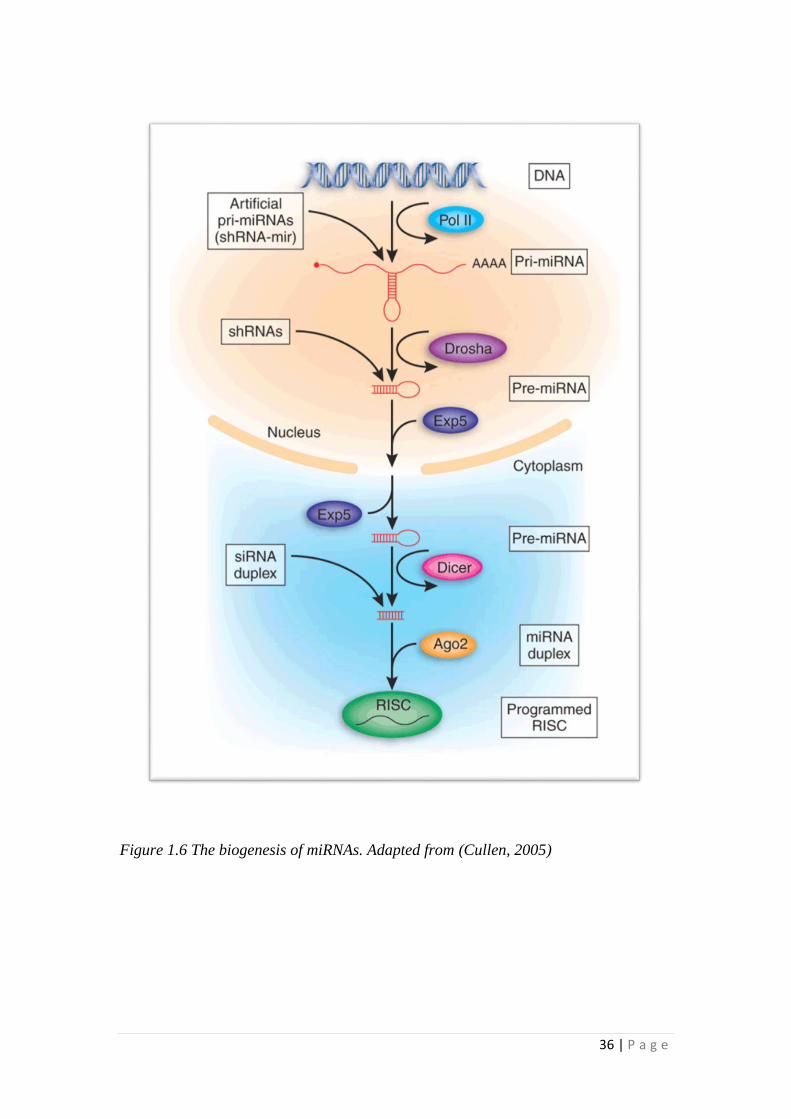
miRNAs are first transcribed in the nucleus as long primary miRNAs by RNA
polymerase and then processed into a stem-loop structure, called precursor mRNA
by RNase III (also named as Drosha), in a complex with DGCR8, a double-strand
RNA-binding protein (Filipowicz et al., 2008; Kim, 2005). The precursor miRNA,
which is approximately 70bp long, is then exported into the cytoplasm, in a process
mediated by Exportin-5. When in the cytoplasm, it is further processed into a RNA
duplex by a second RNase III family enzyme named Dicer (Filipowicz et al., 2008;
Kim, 2005). After cleavage, the duplex unwinds and the functional strand also
known as the mature miRNA is loaded onto the RNA –Induced Silencing Complex
(RISC), consisting of several different functional subunits, namely, argonaute 2,
Dicer and trans-activating response RNA-binding protein. (Filipowicz et al., 2008;
Kim, 2005). The miRNA loaded RISC complex can then initiate gene repression via
complementary binding to target mRNA 3’UTR.
The following figure illustrates the biogenesis of miRNAs.
36 | P a g e
Figure 1.6 The biogenesis of miRNAs. Adapted from (Cullen, 2005)
37 | P a g e
1.5.4 mRNA repression mediated by miRNA
miRNA functions as a guide for the complex to target mRNA. Upon binding with
mRNA and based on the “seed sequence” complementarity, two modes of
suppression of mRNA can then occur. “Seed sequences” are the key nucleotides
normally 7bp in the mature miRNA that is critical for target recognition and
inhibition (Bartel, 2009; Lewis et al., 2005). In the case of perfect complementarity
to target gene 3’UTR, the miRNA-RISC complex can then cleave the target mRNA,
while translational repression is observed in imperfect complementarity (Bartel,
2004; Chang and Mendell, 2007; Filipowicz et al., 2008; Zamore and Haley, 2005).
A key property of miRNA is that due to the short length of seed sequence and ability
to inhibit gene expression under imperfect complementarity, miRNA can target
many mRNA targets, which is in contrast to single gene targeting observed with
siRNA. In addition, miRNA has also been implicated in mediating gene
transcriptional repression by binding to the promoter region of the target (Kim et al.,
2008). Thus, miRNA can induce transcriptional inhibition, translational inhibition
and target gene mRNA degradation to inhibit gene expression.
1.5.5 miRNA involved in diabetic nephropathy
To date, several miRNAs have been identified to play important roles in preventing or
initiating renal fibrosis. They will be reviewed in the next few paragraphs.
1.5.5.1 miR-192
miR-192, along with miR-194, miR-204, miR-215 and miR216 are five of the most
highly expressed microRNAs in the kidney (Sun et al., 2004). miR-192 is expressed at
least 20-fold higher in the renal cortex than in the medulla in rat kidney (Tian et al.,
2008). Thus, miR-192 had been extensively studied in both in vitro and in vivo

38 | P a g e
models of diabetic nephropathy. However miR-192 is differentially regulated in each
cell type at during the progression of real disease in multiple models of renal damage.
1.5.5.1.1 Renal cortex
Renal cortex from STZ-induced diabetic apoE knockout mice (a chronic
hyperglycaemic and dyslipidaemic model which reliably develops physiological and
pathological changes that reflect human disease) demonstrates a significant reduction
in miR-192 levels with an associated decrease in ZEB2 and increased fibrotic markers
such as SMA, collagen 4 (COL4), CTGF, and fibronectin, (Wang et al., 2010a).
However, systemic miR-192 knockdown in renal cortical tissue, using locked nucleic
acid anti-miR-192 (LNA-anti-miR-192), demonstrated renoprotective effects in STZ
induced diabetic c57BL/6 mice at two, twelve and seventeen weeks compared to
control diabetic mice with similar levels of blood glucose. COL1A2, COL4A1, TGFβ,
CTGF as well as fibronectin were decreased in kidney. Periodic acid schiff and
masson trichrome staining confirmed the significant reduction in renal fibrosis in
miR-192 knockdown mice (Putta et al., 2012). Physiological studies indicated a
reduction in urinary albumin and decreased kidney/body weight ratio at 12 weeks, but
not at 17 weeks when compared to control diabetic counterparts (Putta et al., 2012).
Consistent with the above mentioned study, other models of renal fibrosis have shown
an associated significant increase in miR-192. In a model of UUO studied at 5 days,
mi-192 was increased 1.7 fold. (Chung et al., 2010).
In a sub-total nephrectomy model of kidney disease in rat, increased miR-192
expression was also observed as early as 4 weeks and was higher at 8 weeks when
the rats were sacrificed (Sun et al., 2011). Sun et al also confirmed SMAD3 was able
to directly bind to the promoter region of miR-192 and this binding was decreased by
39 | P a g e
low dose paclitaxel – a anti-cancer drug which arrests the cell cycle in the G0-G1 and
G2-M phases and induces apoptosis by stabilising polymerised microtubules and
maintaining microtubular assembly (Sun et al., 2011). Consistent with the above
models miR-192 has also been found to be up-regulated in hypertensive and IgA
nephropathy (Wang et al., 2010b, c).
In contrast to the majority of findings cited above where renal cortical miR-192 is
overexpressed in models of renal fibrosis and strategies to reduce miR-192 are
renoproctive, biopsy samples from patients with established diabetic nephropathy
demonstrated an inverse correlation of miR-192 level and the severity of
tubulointerstitial fibrosis. Furthermore, decreased miR-192 correlates with a
decreased estimated glomerular filtration rate (eGFR) (Krupa et al., 2010). In this
study, patients were divided into three groups according to their rate of reduction in
eGFR in follow-up. Group 1 was defined as “Progressors” ie those in whom loss of
eGFR was greater than 5ml/min per year, Group 2 “Non-progressors” ie those in
whom loss of eGFR was less than 5ml/min per year, and Group 3 “Late presenters” ie
those in whom eGFR was less than 15ml/min at the time of biopsy. miR-192 levels
(in pooled RNA samples) were significantly lower in the “late presenter” group
compared to the other two groups. Expression levels from individual samples of each
group demonstrated loss of miR-192 correlated with the decrease of eGFR, increased
tubulointerstitial fibrosis and thus impairment of the kidney function (Krupa et al.,
2010). Hence it is likely that miR-192 expression varies with the stage of disease
process, potentially being upregulated early in the development of nephropathy but
becoming progressively diminished with progressive loss of functional renal tissue.
Alternatively, production of miR-192 by the various cellular components in the renal
cortex may predominate at different time points in the course of the disease.

40 | P a g e
1.5.5.1.2 Mesangial cells
In both an insulin deficient (STZ induced) model of diabetes mellitus, studied 7
weeks post-induction of diabetes, and in an insulin resistant (db/db) model of
diabetes studied at 10 weeks of age, elevated miR-192 levels were demonstrated in
the glomeruli (Kato et al., 2007). In vitro studies have shown that miR-192 is
activated by TGF
the 3’UTR of ZEB2, which acts as an E-box repressor upstream of COL1A2 (Kato et
al., 2007). MiR-192 also has been shown to down-regulate ZEB1 (Kato et al., 2007).
Consistent with the known interdependent regulation of microRNAs, a LNA-
modified antisense miR-192 decreased the expression of miR-192 itself and other
miRs such as miR-141, miR-200b, miR-200c, which was reflected in the expression
of fibrotic genes such as COL1A2, and COL4A1 in mouse mesangial cells (Kato et al.,
2011). Co-transfection of miR-192 with miR-200b in mouse mesangial cells increased
COL1A2 promoter activity. However, overexpression of either miR alone has not
been shown to influence fibrotic gene expression (Kato et al., 2011).
1.5.5.1.3 Podocytes
There is no current information regarding miR-192 in podocytes in diabetic
concentrations (10ng/ml) show a trend to a decrease in miR-192. (Wang et al., 2010a).
1.5.5.1.4 Tubules
Tubular cells play an important role in maintaining fluid and electrolyte homeostasis.
They also contribute to the production and degradation of extracellular matrix in the

41 | P a g e
tubulointerstitium and dysregulation of this process leads to tubulointerstitial fibrosis
(Mason and Wahab, 2003). Thus understanding of the molecular architecture and
signalling pathways involved in the pathophysiology of tubulointerstitial fibrosis is
critical. MicroRNAs play a role in this process, identification and characterisation of
these microRNAs will provide both targets for treatment and serve as biomarkers for
prognostic purposes.
There are no studies that have specifically studied tubular miRNA expression in in
vivo models of diabetic nephropathy. In vitro studies, however, have simulated
“diabetic” conditions by exposure to high glucose, or alternatively to TGF. Krupa et
al subjected the human proximal tubular cell line, HK-2 cells, to short term (48hr)
exposure to high glucose, but that did not alter the miRNA expression profile (Krupa
et al., 2010). They then exposed the cells to TGF
demonstrated decreased expression of miR-192 (Krupa et al., 2010). This finding was
subsequently confirmed by Jenkins and colleagues (Jenkins et al., 2012).
Similar results were reported in rat epithelial cells. TGFβ (10ng/ml 10 days)
decreased the expression of miR-192 in NRK52E cells. While over-expression of
miR-192 increased E-cadherin expression in NRK52E cells pre-treated with TGFβ for
10 days (Wang et al., 2010a). The decrease of miR-192 was reversed by the presence
of TGFβ type I receptor kinase (ALK5) inhibitor, which blocks TGFβ receptor
signalling, showing a direct regulation of miR-192 by TGFβ. These studies further
demonstrated that hepatocyte nuclear factor (HNF) was able to bind to the promoter
region of miR-192 and this promoter binding activity was down-regulated when
exposed to TGFβ (10ng/mL). Knockdown of HNF with siRNA decreased miR-192
expression (Jenkins et al., 2012).
42 | P a g e
Conversely, us
48 hr) increased miR-192 in NRK52E cells, and over-expression of miR-192
increased COL 1A1, and COL 1A2, whereas transfection of anti-miR-192 decreased
TGFβ induced up-regulation of collagen isoforms (Sun et al., 2011). Chung et al also
showed TGFβ (2ng/ml, 12&24hr) increased miR-192 expression in NRK52E cells
with this process independent of de novo protein synthesis (Chung et al., 2010). In
keeping with the above studies demonstrating the interaction with the SMAD
signalling pathways, over-expression of SMAD7 in NRK52E cells down-regulated
TGFβ induced miR-192 (Chung et al., 2010). Overexpression of miR-192 in NRK52E
for 24 hours increased COL1 with an additive effect on TGFβ induced COL1
expression. As would be expected, knockdown of miR-192 demonstrated decreased
COL1 and reversed TGFβ induced collagen expression(Chung et al., 2010).
These differences suggest a time and concentration dependent response of miRNAs in
epithelial cells to TGFβ. This could also be due to the differences in the first wave
response of genes activated directly by TGFβ and the secondary response subsequent
to activation of multiple signalling pathways.
Hence although the molecular mechanisms involved in regulation of miR expression
may be similar, the expression of a particular miR may be very different in different
cell types under similar conditions. Cell to cell differences may contribute
significantly to the expression of tissue miR which needs to be further explored to
understand the “controversies” in miR-192 expression patterns I disease states.
1.5.5.2 miR-21
miR-21 has been implicated in cardiac fibrosis (Thum et al., 2008) and in the
regulation of expression of phosphatase and tensin homolog (PTEN), which plays an
43 | P a g e
important role in diabetic nephropathy (Meng et al., 2007). The phosphoinositide-3-
kinase/Akt pathway is activated by TGFβ (Ghosh Choudhury and Abboud, 2004;
Kato et al., 2006; Mahimainathan et al., 2006) and in animal models of diabetic
nephropathy (Kato et al., 2006; Mahimainathan et al., 2006; Nagai et al., 2005; Xin et
al., 2007). Activation of this pathway has been associated with fibrotic responses such
as increased expression of collagens and fibronectin (Ghosh Choudhury and Abboud,
2004; Kato et al., 2009a; Runyan et al., 2004), cell hypertrophy (Mahimainathan et al.,
2006), cell survival and oxidative stress in mesangial cells (Kato et al., 2006). PTEN
antagonises the PI3K/Akt pathway, and thus shows protective properties (Salmena et
al., 2008). Hence the relevance of miR-21 to renal fibrosis has been investigated.
1.5.5.2.1 Renal Cortex
Zhang et al demonstrated decreased miR-21 level in the cortex of the insulin resistant
db/db mouse model. Over-expression of miR-21 in vivo, delivered by intraperitoneal
injection of plasmid containing miR-21, decreased albuminuria (Zhang et al., 2009).
Dey et al, however, showed elevated miR-21 expression in the renal cortex of the
OVE26 type I diabetic mouse model at three months of age with reduced PTEN and
increased pAKT and fibronectin expression (Dey et al., 2011). Apart from the
disagreement in the two types of diabetes models, the pro-fibrotic properties of miR-
21 in renal diseases have been recently highlighted. This study utilised miR-21
deficient mice which not only were healthy and fertile without overt adverse effects
but also had similar kidney gene expression profile compared to wild type (Chau et al.,
2012). However under diseased conditions, miR-21 positive mice developed
significantly more interstitial fibrosis and epithelial injury when compared to miR-21-
/- mice in UUO and ischaemic reperfusion injury models. miR-21 was also shown to

44 | P a g e
be up-regulated in response to UUO and ischaemic reperfusion injury in mild type
mouse kidney (Chau et al., 2012). In another study which used ultrasound micro-
bubble induced knockdown of miR-21 similarly suggested reduced miR-21 and
inhibited the progression of renal fibrosis (reduced ECM deposition of α-SMA
positive cells) in the UUO model (Zhong et al., 2011). Recently another study by
Duffield’s lab further confirmed the pro-fibrotic role of miR-21 in kidneys and
demonstrated the link between miR-21 and molecules involved in metabolic pathways
such as Pparα (Chau et al., 2012).
1.5.5.2.2 Tubular cells
In proximal tubular epithelial cells, high glucose increased pre-miR-21 and miR-21 as
well as PTEN. Knockdown of miR-21 in proximal tubular cells, as expected, inhibited
high glucose induced protein synthesis and fibronectin expression (Dey et al., 2011).
Zhong et al showed an increase of miR-
(2ng/ml) for either 12 or 24 hours. Knockdown of SMAD3 prevented
iR-21 expression (Zhong et al., 2011). Over-expression of miR-
and αSMA, while knockdown of miR-21 inhibited the expression of these fibrotic
markers (Zhong et al., 2011). However, cell death was observed in both over-
expression and knockdown of miR-21, potentially due to the role of miR-21 in
regulating cell proliferation and apoptosis (Frankel et al., 2008; Li et al., 2009; Zhou
et al., 2010).

45 | P a g e
1.5.5.2.3 Mesangial cells
Mesangial cells exposed to high glucose (25mM) show elevated miR-21 levels. This
elevation is however reversed by stoping cellular glucose uptake through blockade of
the glucose transporter Glut-1 (Dey et al., 2011; Heilig et al., 2006; Linden et al.,
2006). Knockdown of miR-21, inhibited high glucose induced fibronectin production
(Dey et al., 2011). On the other hand, over-expression of miR-21 significantly
increased protein synthesis in mesangial cells suggesting a role for miR-21 in
mediating mesangial cell hypertrophy (Dey et al., 2011). Consistent with this finding,
miR-21 had also been shown to inhibit mesangial cells proliferation and suppress
PTEN expression under hyperglycemic condition. These studies, in combination,
support the conclusion PTEN is a key target of miR-21 which may play an important
role in maintaining kidney health (Zhang et al., 2009).
1.5.5.2.4 Summary
These early studies suggest that miR-21 as a pro-fibrotic miRNA is uniformly
activated early in the kidney under hyperglycaemic conditions, is able to directly
target PTEN and promotes renal fibrosis by driving the production of ECM proteins.
It also responds to TGFβ signalling, where SMAD3 seems to play an important role in
mediating the activation of miR-21. Thus, miR21 appears to be a good candidate as a
target in preventing diabetic nephropathy, especially considering miR-21 knock-out
cells have relatively normal physiology even though miR-21 induced cell apoptosis
may need further investigation.

46 | P a g e
1.5.5.3 miR-200 family
1.5.5.3.1 Whole kidney/tubular
As discussed above, EMT is likely to play an important role in the pathogenesis of
diabetic nephropathy. It allows epithelial cells to be converted into active
myofibroblasts, which contribute significantly towards the deposition of extracellular
matrix (Hills and Squires, 2011; Zeisberg and Duffield, 2010). Studies investigating
the relevance of the miR-200 family to diabetic nephropathy were initially triggered
by the observation that members of the miR-200 family prevented EMT in cancer
cells by regulating ZEB protein expression. (Bracken et al., 2008; Gregory et al.,
2008a). Prolonged exposure to TGFβ has also been suggested to induce epigenetic
changes in the miR-200 loci, resulting in altered expression of miR-200 (Gregory et
al., 2011) and thus completing the negative feedback loop cycle.
Wang et al reported TGFβ1 (10ng/mL, 72 hrs) decreases the expression of miR-200a,
b, c, while both TGFβ1 and TGFβ2 down-regulate the expression of miR-200a in
NRK52E cells (Wang et al., 2011). Over-expression of miR-200a down-regulated
TGFβ induced SMAD3 activity as well as other markers of EMT such as ZEB1 and
ZEB2 and PAI-1. They also demonstrated that miR-200a and miR-141 were able to
directly bind to the 3’UTR of TGFβ2 and thus down-regulate the expression of
TGFβ2. In vivo experiments confirmed that both miR-141 and miR-200a were
decreased in an adenine-induced renal fibrosis animal model (Wang et al., 2011).
Oba et al used the UUO model to study the role that the miR-200 family plays in renal
fibrosis. Interestingly, all members of the miR-200 family were increased in a time
dependent fashion following UUO, in association with reduced ZEB proteins,
suggesting a positive compensatory response of the kidney to down-regulate fibrotic
47 | P a g e
proteins (Oba et al., 2010). Over-expression of miR-200b by intravenous injection of
miR-200b precursor (0.5nM) before UUO reversed induction of ZEB proteins as well
as COL1, 3 and fibronectin (Oba et al., 2010).
However, Xiong et al showed contradictory data as they found in microarray analyses
that miR-141 and miR-200a were decreased (days 3, 7, 14) along with a reduction in
E-cadherin and increase in α-SMA and fibronectin in a similar UUO rat model. When
exposed to TGFβ (5ng/ml, 12hr) the miR-200 family was however increased in
NRK52E cells. Over-expression of any of the miR-200 family members prevented the
TGFβ induced increase of α –SMA and fibronectin, and restored E-cadherin
expression (Xiong et al., 2012).
1.5.5.3.2 Mesangial cells
miR-200b and miR-200c had also been found to be increased in the glomeruli of both
STZ-induced and db/db diabetic mice. TGFβ, as expected, increased the expression
of miR-200b, 200c, 192 by more than 2 fold in mouse mesangial cells (MMCs) (Kato
et al., 2011). miR-200 family had been demonstrated to directly target ZEB1 ZEB2
3’UTR in various cell types including NRK52E, HK-2 and MMCs (Gregory et al.,
2008a; Kato et al., 2011; Oba et al., 2010). COL4a1 expression induced by miR-192,
200b mimic, as well as TGFβ can be reversed by miR-inhibitors in MMCs. 12 E-Box
transcription factor binding sites which ZEBs can bind and suppress gene expression
were identified on the promoter of COL4a1. Expression of the promoter activity was
decreased by knocking down miR-200b. Co-transfection of miR-192, miR-200b
increased COL1a2 promoter activity but the activity is clearly co-ordinated as no

48 | P a g e
single member is in isolation responsible for the increase in up-regulation of pro-
fibrotic genes (Kato et al., 2011).
1.5.5.4 miR216/217
1.5.5.4.1 Glomerulus/ Mesangial cells
Kato et al identified two microRNAs, miR-216a and miR-217 that were activated in
glomeruli of STZ induced and db/db diabetic mice, as well as by TGFβ in mesangial
cells. Both miRs are located within the second intron of a non-coding RNA sequence,
with several E-boxes being identified on the upstream promoter that are potentially
regulated by ZEB proteins. Since TGFβ activates miR-192 and represses ZEB
proteins, the question as to whether the activation of miR-216a/217 occurred through
the action of miR-192 was addressed. Knockdown of miR-192 in the presence of
TGFβ demonstrated reduced 216a/217, COL1a2 and increased ZEB2 mRNA while
over-expression of miR-192 increased 216a/217. Knockdown of ZEB2 demonstrated
a similar result, confirming that miR-192 plays a role in the regulation of these
miRNAs. These investigators additionally identified PTEN to be a direct target of
both miR216a and miR-217. Down-regulation of PTEN by the two miRs led to the
activation of AKT, which resulted in mesangial cell survival and hypertrophy (Kato et
al., 2009b). Additionally, miR-216 had also been shown to directly target Ybx1, a
RNA-binding protein that may play a role in that activation of COL1a2 by interacting
with transcription factors Tsc-22 and Tfe3 in mesangial cells (Kato et al., 2010).

49 | P a g e
1.5.5.5 miR-29
The miR-29 family has been shown to play an important role in cardio-vascular health
and down-regulation has resulted in cardiac fibrosis (van Rooij and Olson, 2009; van
Rooij et al., 2008). Its role in renal disease is discussed below.
1.5.5.5.1 Renal Cortex
Long et al have shown that miR-29c is increased in db/db mice compared to their
non-diabetic heterozygote control (db/m) littermates, while miR-29c anti-sense
delivered intra-peritoneally in db/db mice resulted in reduced albuminuria and
reduced renal fibronectin expression compared to mice treated with control
oligonucleotides (Long et al., 2011). This result seems to challenge the previous
findings on cardiac fibrosis. However, it was subsequently demonstrated that miR-29c
was able to suppress Spry1 by directly targeting its 3’UTR. Spry1 is an inhibitor of
the Ras/MEK/ERK pathway (Kim and Bar-Sagi, 2004; Mason et al., 2006) and it may
also negatively regulate the activity of RhoA and its downstream Rho Kinase activity
through Wnt signalling pathways (Long et al., 2011; Miyoshi et al., 2004; Wang,
2009; Wang et al., 2008b). Thus, by targeting Spry1, miR-29c positively promotes the
progression of diabetic nephropathy.
However, in a different study where a hyperglycaemic mouse model was also used, a
a reduction of miR-29 was demonstrated. In an STZ-induced diabetic ApoE knockout
mice model, miR-29a and c were decreased following 10 weeks of diabetes, which
was associated with increased renal COL4 expression. In another model of advanced
diabetic renal fibrosis, the uninephrectomised (UNx) STZ-diabetic rat model, 18
weeks post induction of diabetes the renal cortex showed decreased level of miR-29a,

50 | P a g e
c again with increased COL1, COL4, fibronectin and laminin expression (Wang et al.,
2012b).
Consistent with the Wang’s findings, mouse kidney subjected to ureteric obstruction
showed decreased expression of all 3 members of the miR-29 family, when compared
to the non-obstructed kidney. Over-expression of miR-29b in the kidney, as expected,
partially prevented obstruction-induced renal fibrosis by reversing the elevated COL1
and COL3. UUO in SMAD3 knockout mice showed increased miR-29a and miR-29b
along with protection against renal fibrosis compared to wild type controls
demonstrating a reno-protective property of miR-29b (Qin et al., 2011).
1.5.5.5.2 Proximal tubular cells and Fibroblasts
miR-29a and miR-29c are 10 fold and 5 fold more abundant than miR-29b
respectively in normal rat kidney (NRK52E) cells under control conditions. Du et al
demonstrated that miR-29a, which is highly expressed in tubular cells (HK-2), was
significantly down-regulated by high glucose (7days) and TGFβ (10ng/mL at various
time points). miR-29a targets COL4a1 and COL4a2 directly for degradation in human
cells (HK-2). (Du et al., 2010). In an in vitro epithelial cell model (NRK52E cells),
TGFβ and high glucose (10ng/mL TGFβ and 25mM glucose, 3 days) decreased miR-
29a, miR-29b and miR-29c along with decreased E-cadherin and increased COL1 and
COL4. Over-expression of all three members of miR-29 in NRK52E cells reduced
COL1 and COL4 expression. In the same paper, the investigators also demonstrated
that miR-29 (-a; -b; -c) decreased COL1 and COL4 via direct targeting of their 3’UTR
(Burns et al., 2006; Wang et al., 2010a; Wang et al., 2012b).
In NRK52E and MEF cells, miR-29b over-expression can reverse TGFβ (2ng/mL)
induced COL1,COL3 expression while knockdown of miR-29b increased COL1,
51 | P a g e
COL3 and α –SMA independent of the presence of TGFβ. NRK52E and MEF cells,
in which SMAD3 had been silenced, showed similar results, indicating a possible
negative regulation of miR-29 by TGFβ/SMAD. These cells also showed reduced
COL1 and COL3 expression despite TGFβ (2ng/mL) incubation which is surprising
given the multiple signalling pathways activated by TGFβ, again suggesting a central
role of SMAD signalling in TGFβ induced renal fibrosis (Qin et al., 2011). In vitro
experiments using NRK52E and MEF showed that miR-29b over-expression can
reverse TGFβ (2ng/mL) induced COL1,COL3 expression, while knockdown of miR-
29b increased COL1, COL3 and α –SMA independent of the presence of TGFβ (Qin
et al., 2011).
1.5.5.5.3 Mesangial cells
Consistent with findings in other cell types, TGFβ decreased all three members of
miR-29 and increased COL1, COL3, COL4 mRNA expression in primary cultures of
mouse mesangial cells. Over-expression of miR-29 (a,b,c) again as expected,
decreased COL1 both at the mRNA and protein level (Wang et al., 2012b).
1.5.5.5.4 Podocytes
In accordance with Long’s findings in db/db mice where miR-29c was found to be
increased, mouse podocytes exposed to 25mM glucose (24hr) also demonstrated
increased miR-29c expression. Over-expression of miR-29c using lenti-virus
mediated gene expression in mouse podocytes showed increased apoptosis, as
evidenced by increased annexin-V-positive cells and increased caspase activity (Long
et al., 2011). However, TGFβ (5ng/mL, 3 days) decreased miR-29b, and -c in
conditionally immortalised human podocytes. Over-expression of all three members
52 | P a g e
of miR-29 in human podocytes decreased COL1, COL3 and COL4, as well as
vimentin and αSMA mRNA expression (Wang et al., 2012b).
1.5.5.6 miR-377
miR-377 was found to be elevated in two mice models of diabetic nephropathy,
namely, non-obese diabetic (NOD/Lt) mice and STZ induced C57BL/6 mice (Wang
et al., 2008a). Both TGFβ (2ng/mL, 12hr) and high glucose (22.5 mM, 7 days)
increased the expression of miR-377 in cultured human and mouse mesangial cells.
Over-expression of miR-377 in these cells increased fibronectin but had no effect on
COL4. Authors identified p21-activated kinase and superoxide dismutase, which
enhance fibronectin production, as direct targets of miR-377 (Wang et al., 2008a).
1.5.5.7 SMAD Knockout and miRNAs
SMAD signalling pathway is central to TGFβ mediated renal fibrotic changes.
Professor Lan’s group looked at miRNAs expression profiling using several SMAD
knockout animal models and cell lines, providing invaluable data in understanding the
interplay between SMADs and miRNAs.
Knockdown of SMAD3 but not SMAD2 decreased TGF induced miR-192 expression
in NRK52e cells and in mouse embryonic fibroblast (MEF) cells (Chung et al., 2010).
These investigators further demonstrated precipitation of the miR-192 promoter
region containing 2 SMAD binding sites with anti-SMAD3 antibody in both human
tubular epithelial cells (TEC) and MEFs, indicating the involvement of SMAD3 in
regulating the expression of miR-192 (Chung et al., 2010). Again, miR-21 was found
to be reduced in SMAD3 knockout but not SMAD2 knockout mice subjected to

53 | P a g e
UUO (Zhong et al., 2011). Consistently, knockout of SMAD3 prevents TGF induced
miR-21 expression in tubular cells and MEFs (Zhong et al., 2011).
1.5.5.8 Conclusion
miRNAs are now considered to play key roles in regulating orchestrated gene
expression in both health and disease. The differential expression of miRNAs in
specific cell types at the various stages of the development of diabetic nephropathy, or
in the presence of the pro-fibrotic cytokine TGFβ, suggest a time dependent
regulation of miRNAs that is both context and time sensitive. The available studies
suggest multiple biological processes involved in the pathogenesis of diabetic
nephropathy could potentially be sophisticatedly regulated by miRNAs.
However, controversies still exist in the expression profile of miRNAs observed in the
kidney, such as miR-192. These differences may be explained by the different animal
model or treatment conditions. More specific elucidation of miRNA expression in
each type of cell in vivo is required, although this is technically challenging. It is not
surprising that different cells respond differently to the same stimuli and differential
changes observed in renal cortex might just be the average of all miRNAs expressed
by different cells. Thus the absolute as well as the relative expression level of each
miRNA in different cells is important in constructing the molecular basis of diabetic
nephropathy.
In terms of identifying targets of miRNAS, the in silicon prediction model provides a
good starting point. The lack of a high-throughput methodology in identifying and
verifying the miRNA and mRNA interactions remains a technical challenge, which
limits our understanding of the regulatory roles mediated by miRNAs. Furthermore,
the interaction between miRNAs themselves, add another level of complexity. Thus,
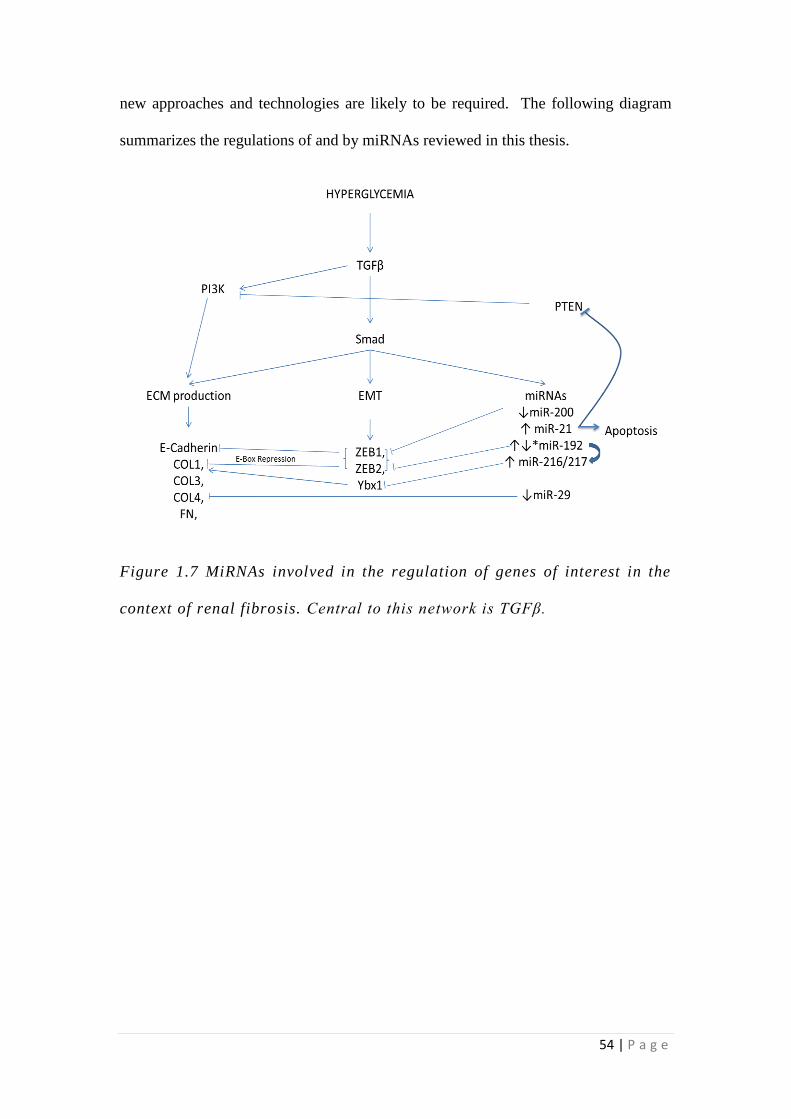
54 | P a g e
new approaches and technologies are likely to be required. The following diagram
summarizes the regulations of and by miRNAs reviewed in this thesis.
Figure 1.7 MiRNAs involved in the regulation of genes of interest in the
context of renal fibrosis. Central to this network is TGFβ.

55 | P a g e
1.6 Prostate Transmembrane Protein, Androgen Induced
1.6.1 Background
Prostate Transmembrane Protein, Androgen Induced (PMEPAI) which is also known
as TMEPA1, STAG1 or ERG1.2 is a transmembrane protein that may play an
important role in antagonising TGFβ1 signalling (Liu et al., 2011; Singha et al.,
2010). There is very little literature on this novel gene and thus more research is
required to delineate the full spectrum of function of this gene.
1.6.2 Discovery
PMEPA1 was first identified as a novel gene that was up-regulated in response to
activation of the nuclear androgen receptor in 2000. By examining multiple tissue
using northern blots, it was found that PMEPA1 was expressed at highest levels in
prostate tissue but also highly expressed in the kidney. Initial characterisation
indicated the 252-amino-acid long protein contains a type Ib transmembrane domain
coded by residues 9-25. (Xu et al., 2000). Later in 2001, Rae et al fully characterised
the gene and found two PMEPA1 transcripts, 2.7 kb and 5 kb long, with identical
coding regions but a variable 3’ UTR. PMEPA1 cDNA encodes a protein 287-
amino-acid long. However, two protein products of 36 and 39 kDa were observed.
The PMEPA1 gene was mapped to chromosome20q13 between microsatellite
markers D20S183 and D20S173 containing 4 exons and three introns (Rae et al.,
2001). In the same study, up-regulation of PMEPA1 was also observed in renal cell
carcinoma using differential display polymerase chain reaction as well as stomach
and rectal adenocarcinomas. Conversely, it was barely detectable in leukemia and
lymphoma samples (Rae et al., 2001). Under normal conditions, it was

56 | P a g e
predominantly expressed in prostate tissue and at low levels in the ovary. (Rae et al.,
2001).
1.6.3 Role in Prostate Cancer
In 2003, the same group who first described PMEPAI demonstrated its interaction
with human E3 ubiquitin-protein ligase (NEDD4), also known as neural precursor
cell expressed developmentally down-regulated protein 4, which is involved in the
ubiquitin-dependent proteasome-mediated protein degradation. PY motifs found in
PMEPA1 are shown to interact with the WW domain in NEDD4 (Xu et al., 2003).
PMEPA1 levels were decreased in advanced cases of prostate cancer, which is
considered to be mediated through PMEPA1 induced cell growth inhibition, via
interaction with NEDD4 and subsequent degradation (Xu et al., 2003). The same lab
later discovered a negative feedback loop between PMEPA1 and the androgen
receptor (Li et al., 2008). PMEPA1 is a direct transcriptional target of androgen
receptor. Transient over-expression of PMEPA1 down-regulates androgen receptor
protein levels, while knockdown of PMEPA1 leads to elevated levels of androgen
receptor, as well as its target genes. The negative feedback on androgen receptor by
PMEPA1 is thought be facilitated by the ubiquitination of androgen receptors and
subsequent proteasome dependent degradation. A mutation in the PY motif impairs
NEDD4 recruitment and thus abolishes androgen receptor ubiquitination (Li et al.,
2008).
57 | P a g e
1.6.4 PMEPA1 and TGFβ signalling
In 2010, the pioneering work of Watanabe et al demonstrated an important role of
PMEPA1 in TGFβ signalling. (Watanabe et al., 2010). This study confirmed the
existence of a negative feedback loop controlling the duration and intensity of TGF-
SMAD Signalling (Watanabe et al., 2010). Given the importance of this finding, and
its potential role in preventing nephropathy, including diabetic nephropathy, details
of this study will be discussed below.
1.6.4.1 Induction of PMEPA1 by TGFβ1
Induction of PMEPA1 expression by TGFβ1 is observed in many different cells.
However it is still unclear whether PMEPA1 is activated directly by TGFβ1 or
through its complex signalling pathways. To address this question cells were with
cycloheximide for 1 hr to halt de-novo protein synthesis, followed by stimulation
with TGFβ1 for 2 hr. PMEPA1 mRNA expression was found to be elevated, with a
delayed increase in protein levels, suggesting PMEPA1 is a direct and early target of
TGFβ1 signalling. BMP7, on the other hand, did not alter the expression of
PMEPA1. Hence differential regulation occurs within the different members of the
TGFβ superfamily.
1.6.4.2 PMEPA1 interrupts TGFβ signalling pathways
SMAD signalling, discussed earlier, is one of the main molecules involved in TGFβ
signalling. Briefly to reiterate, TGFβ1 binds to TGFβ1 receptor II, which
subsequently phosphorylates TGFβ1 receptor I. The activated TGFβ1 receptor I in
turn, phosphorylates and activates SMAD2/3, which then forms the SMAD complex
with SMAD4 and translocates into the nucleus for gene regulation. A luciferase

58 | P a g e
reporter with a SMAD only driven promoter was co-transfected with PMEPA1 with
the presence of TGFβ1. PMEPA1 dose dependently inhibited luciferase activity
implying inhibition of the SMAD signalling pathway. Furthermore, all three variants
of human PMEPA1 registered in gene bank have been shown to block TGFβ1
induced luciferase reporter activity. Co-transfection of constitutively active TGFβ1
receptor I, FLAG tagged SMAD2 and PMEPA1 followed by immunoprecipitation of
SMAD2 was undertaken. PMEPA1 significantly reduced phosphorylation of the
pulled down SMAD2, which again confirms the findings.
A gain of function study by the over-expression of PMEPA1 in NMuMG cells
prevented the expression of TGFβ1 direct target gene PAI-1. In an immortal human
keratinocyte line (HaCaT) cells, TGFβ1 activated genes, such as cyclin-dependent
kinase inhibitors and JunB, were also decreased, while TGFβ1 suppression of c-Myc
was rescued by PMEPA1 over-expression. Loss of function with PMEPA1
knockdown again demonstrated prolonged and intensified SMAD2 and SMAD3
phosphorylation.
1.6.4.3 PMEPA1 and SMAD proteins
Using co-immunoprecipitation of SMAD followed by detection with anti-PMEPA1,
the investigators demonstrated PMEPA1 can physically bind to unphosphorylated
SMAD2 and SMAD3, but not SMAD1, 4 and 7. Incubation with activated SMAD2
and TMEPA1 in vitro suggested PMEPA1 binds equally well to both phosphorylated
and unphosphorylated SMAD2, though no result for SMAD3 result was shown.
Furthermore, PMEPA1 has been shown to disrupt the binding between SMAD2 and
SMAD4 before translocation to the nucleus..

59 | P a g e
It was hypothesised that the PY domain presented in PMEPA1 is responsible for the
inhibition of TGFβ signalling. However, a mutated PMEPA1 lacking the PY motif
preserved its ability to inhibit TGFβ signalling. Interestingly, a PMEPA1 mutant
lacking the transmembrane domain and mislocalised in cytoplasm could also inhibit
TGFβ signalling. Thus a distinct mechanism of inhibition must be present. Deletion
analysis narrowed the functional region responsible for inhibition of TGFβ1 to
Asn171
to Ser204
residues of PMEPA1, while PMEPA1 with residues from 1 to 171
failed to interact with SMAD2. After examining the region, a Pro-Pro-Asn-Arg
(PPNR) peptide sequence was found to be similar to the SMAD interaction motif
originally identified in the Milk and Mixer transcription factors (Randall et al., 2002).
Site specific mutagenesis was again used to modify PPNR to 4 alanine residues in
PMEPA1, where upon interaction with SMAD2 was subsequently lost. A fusion
protein consisting of a 20 amino acid residue, including the putative SMAD binding
region and Green Fluorescence Protein (GFP), was constructed and was shown to
interact with SMAD2, while the 4 alanine mutant had no binding capacity, further
proving the direct interaction between PMEPA1 and SMAD2.
1.6.4.4 PMEPA1 Competes with SARA for SMAD2 Binding
SMAD Anchor for Receptor Activation (SARA) is a protein that aids the recruitment
of SMAD2 to the TGFβ1 receptor complex and mediates the interaction with
SMAD2 via its SMAD binding domain (Tsukazaki et al., 1998). There is a
significant similarity between the sequences of the SMAD binding domain in SARA
and PMEPA1 (Randall et al., 2002). It has been demonstrated that over-expression
of SARA affected PMEPA1 –SMAD2 interaction while the vice versa was also true
as over-expression of PMEPA1 abrogated SARA-SMAD2 interaction. Thus,

60 | P a g e
PMEPA1 competes with SARA for SMAD2 binding and consequently prevents
SMAD2 activation by TGFβ1 receptors.
1.6.5 Subsequent investigation of PMEPA1 in models of disease
Since the link between PMEPA1 and TGFβ1 signalling has been established and its
inhibitory role described, there is a growing interest in PMEPA1 and its role in
various disease models.
The same group who identified the TGFβ1 inhibitory role of PMEPA1 investigated
the regulation of PMEPA1 gene itself (Nakano et al., 2010). It was found that the
PMEPA1 promoter was under the synergistic regulation of both TGFβ1-SMAD and
Wnt/β-catenin/T Cell Factor (TCF) 7L2 signalling. A TGFβ1 – responsive TCF7L2-
binding element (TTE) was found in intron 1 of the PMEPA1 gene. TCF7L2 can
bind to TTE and initiate gene regulation. Mutagenesis of this TTE binding site
abolished TGFβ1 and TCF7L2 responses, indicating the important role of TCF7L2
in the regulation of PMEPA1 (Nakano et al., 2010).
More recently, PMEPA1 has been shown to suppress p21 transcription in androgen
receptor negative prostate cells and promote cell proliferation. This is thought to be
mediated via up-regulation of c-Myc, indicating PMEPA1’s role in cell cycle
regulation (Liu et al., 2011).
Thus, the mode of action of PMEPA1 can be summarised in the following diagram:

61 | P a g e
62 | P a g e
Figure 1.8 Mechanism of PMEPA1 in inhibiting TGFβ1 signalling.
1.6.6 PMEPA1 and Diabetic Nephropathy
TGFβ1 and downstream SMAD signalling play an important part in the pathogenesis
of all forms of progressive kidney disease, including and importantly, diabetic
nephropathy. The discovery of the link between the inhibitory role of PMEPA1 and
TGFβ1 signalling added a new piece of information to the existing body of
knowledge regarding the SMAD signalling pathway and its regulation of
downstream genes. Targeting TGFβ1-SMAD mediated profibrogenic genes by
PMEPA1 provides a potential therapeutic strategy in preventing and delaying
progression of renal disease, including diabetic nephropathy.
63 | P a g e
1.7 Summary and Statements of aims
The aims of the thesis were:
1. To evaluate the role of miR-200b in preventing renal fibrosis, in vitro
and in vivo.
For the in vitro component of the study, TGFβ1 was used to induce cellular
‘fibrotic’ responses and drive epithelial to mesenchymal transition in the human
proximal tubular cell line (HK-2). The role of miR-200b in preventing these
changes was studied by examining the ECM proteins and EMT markers such as
collagen, fibronectin, α-SMA, vimentin and ZEB proteins. Important signalling
pathways and molecules activated to drive these pathological changes were also
examined, for example, the MAPKs and SMADs were studied using western
blotting. It was determined that miR-200b was able to strongly suppress the
production of fibronectin and successfully prevented EMT, whereas the latter
was thought to be due to the suppression of ZEB1 and ZEB2 transcription
factors. Molecular mechanisms behind the miR-200b mediated fibronectin
suppression was also studied and determined to be direct targeting of the
fibronectin 3’UTR by miR-200b.
For the in vivo studies, examining the role of miR-200b in preventing renal
fibrosis, lentivirus, nanoparticle and ultrasound microbubble mediated gene
transfer technology were carried out and applied to mice subjected to UUO.
Given that TGFβ1 is well recognised to play a central role in all models of renal
fibrosis, this model was undertaken prior to the future study of mi-200b in a
long term model of diabetic nephropathy. The efficacy of miR-200b in
modifying UUO induced renal fibrosis was then studied. Immunohistochemistry

64 | P a g e
was used to examine the profibrogenic and EMT markers. Alternative miRNA
delivery systems for in vivo applications and their efficacy will also be
investigated.
2. Role of PMEPA1 in preventing TGFβ1 induced changes.
PMEPA1 has been implicated in a process which antagonises TGFβ signalling
by targeting R-SMADs. In this study, the role of PMEPA1 in preventing TGFβ1
induced fibrosis in the renal context was examined by experimentally inducing
loss and gain of function of PMEPA1 in HK-2 cells. siRNA mediated silencing
and plasmid mediated gene over-expression were used. Markers of EMT induced
by the TGFβ1-SMAD pathway such as E-Cadherin and vimentin, and of cell
cycle regulation ie p21 were studied to evaluate the importance of PMEPA1 in
mediating TGFβ1-SMAD signalling and downstream effects in renal tubules.

65 | P a g e
2 Chapter 2 Materials and Methods
2.1 Cell Culture
2.2 Immortalised Human Kidney Proximal Tubular Cell Line (HK-2)
HK-2 cells from American Type Cell Collection (ATCC) are the main cells used in
this PhD project to model renal tubular cell pathology. They are derived from PTCs
originating from normal adult human renal cortex and immortalised by transduction
with human papillomavirus (HPV16) E6/E7 genes (Ryan et al., 1994). HK-2 cells
have been widely used as a robust substitute of the primary kidney proximal tubular
cells in in vitro experiments studying renal pathology in laboratories around the world
including our own (Qi et al., 2006; Wong et al., 2011)
HK-2 cells were grown in Keratinocyte-Serum Free Medium (KSFM) (Life
Technologies, USA) supplemented with 5ng/mL recombinant EGF and 0.05mg/mL
bovine pituitary extract in various culture vessels including 10cm petri dishes, tissue
culture plate and tissue culture flasks. Cells were incubated at 37oC in 5% CO2 and 95%
air. The medium was refreshed every 48 hrs until confluent.
When cells were confluent, trypsin-EDTA (containing 0.25% (w/v) trypsin) was used
to detach cells from the culturing vessel. Trypsin was then diluted 10 fold with
complete KSFM and cells were spun down at 123G and subsequently washed twice
with complete KSFM. HK-2 cells were then plated at the desired density for
immediate experimental use or frozen for longer term storage in liquid nitrogen.
2.2.1 Human Embryonic Kidney 293T Cell Line (HEK293T)

66 | P a g e
HEK293T cells also known as 293T cells was created by transfecting a sub-line of
adenovirus-immortalized human embryonic kidney cells (HEK) with a gene encoding
the SV40T-antigen and a neomycin resistance gene. The cell line is competent for
replication of vectors carrying the SV40 origin of replication. This allows for greater
amplification of transfected plasmids and extended temporal expression of the desired
gene products
(http://www.hpacultures.org.uk/products/celllines/generalcell/detail.jsp?refId=120220
01&collection=ecacc_gc) (Graham et al., 1977). In addition, the easy ‘transfectabilty’
also made this cell line a popular model for viral packaging and molecular studies.
HEK293T cells were grown in Dulbecco's Modified Eagle Medium (DMEM) with
25mM D-glucose supplemented with 10% Fetal Calf Serum (FCS) in various culture
vessels including tissue culture plates and flasks. Cells were incubated at 37oC in 5%
CO2 and 95% air. The medium was refreshed every 48 hrs until confluent.
When cells were confluent, trypsin-EDTA (containing 0.25% (w/v) trypsin) was used
to detach cells from the culturing vessel. Trypsin was then diluted 10 fold with
DMEM (10% FCS) (Life Technologies, USA) and cells were spun down at 123G and
subsequently washed twice with DMEM (10% FCS). HEK293T cells were then
plated at the desired density for immediate experimental use or frozen for longer term
storage in liquid nitrogen.
2.3 RNA Extraction and Reverse Transcription
2.3.1 Total RNA Extraction and Reverse Transcription
67 | P a g e
Total RNA was extracted using a GenElut Mammalian Total RNA Miniprep Kit
(Sigma, MO, USA). Cells (<7 million cells) subjected to relevant experimental
conditions were lysed by incubation with 350 μL lysis solution containing β-
mercaptoethanol (1%, v/v) in the culture vessel for 2 minutes. The crude lysate was
transferred to a filtration column and spun at 14,000 g for 2 min to remove cellular
debris and shear DNA. 350 μL 70% ethanol was added to the filtrate and mixed
thoroughly. The lysate/ethanol mixture was transferred to a GenElute Binding
Column and centrifuged at 14,000 g for 15 s followed by removal of the filtrate. The
binding column was washed once with 500 μL wash solution 1 and twice with 500 μL
wash solution 2 (included in the kit, ingredient unknown). RNA was eluted with 50
μL elution solution and quantitated using a NanoDrop ND-1000 Spectrophotometer
(Thermo Fisher Scientific, USA). The quality of RNA was confirmed by the
measurement of the A260/280 ratio. Typically, the ratio of an optimal sample falls
between 1.8 and 2.2. RNA was used immediately or stored at -80oC.
The extracted RNA was treated with DNAse to remove traces of DNA contamination
carried over from RNA extraction that may interfere with the downstream real-time
PCR (qPCR) analysis. For each RNA sample, 1 μg RNA, 1 μL 10x DNAse buffer
(Life technologies, USA) and 1 μL DNAseI (Life technologies, USA) were added to
an RNAse free PCR tube and the final volume was made up to 10 μL with RNAse-
free water. The reaction mix was incubated at room temperature (22 o
C) for 15 min
followed by the addition of 1 μL 25mM EDTA (Life technologies, USA) and
incubated at 65 oC for 5 min to inactivate the DNAse enzyme.
2 μL of the DNAsed RNA was used as the template in cDNA synthesis in the
SuperScript VILO cDNA Synthesis Kit (Life technologies, USA). RNA template was
mixed with 2 μL 10X SuperScript enzyme mix, 4 μL 5X VILO reaction mix and 12
68 | P a g e
μL RNAse-free water and then incubated at 25 oC for 10 min, 42
oC for 60 min and 85
oC for 5 min. The resulting cDNA was used immediately or stored at -20
oC.
2.3.2 MicroRNA Extraction and Reverse Transcription
2.3.2.1 Trizol Extraction of total RNA including microRNA
1mL Trizol reagent (Life technologies, USA) was added to the cells (cells cultures in
a 6-well plate) in a fume hood before being transferred to a fresh eppendorf tube. The
homogenized lysate was incubated at room temperature for 5 min before the addition
of 1 μL glycogen and 200 μL chloroform (Sigma, MO, USA). The mixture was
vortexed and incubated at room temperature for an additional 2-3 min before being
centrifuged at 12,000 g for 15 min at 4oC. Three layers were evident: a lower red,
phenol-chloroform phase containing protein, an intermediate phase (genomic DNA),
and an aqueous phase containing RNA. The aqueous phase was transferred to a fresh
ultracentrifuge tube and RNA was precipitated by the addition of 800 μL isopropanol
and incubated at -80oC for 20 min. The mixture was then centrifuged at 12,000 g for
30 min at 4oC followed by the removal of the supernatant. Precipitated RNA was
washed with 1 mL 75% ethanol by inverting 3-4 times followed by centrifugation at
12,000 g for 15 min at 4OC. Ethanol was removed and RNA was allowed to air dry
briefly (5-10 min) followed by re-suspension in 20 μL RNAse-free water. The RNA
concentration was quantified using the NanoDrop ND-1000 Spectrophotometer.
microRNA was DNAse treated in a similar way as total RNA described in above
section.

69 | P a g e
2.2.2.2 MicroRNA Extraction with mirPremier microRNA Isolation Kit
MicroRNA was also extracted using a column based mirPremier microRNA Isolation
Kit (Sigma, MO, USA). Cells (<3 million cells) subjected to relevant experimental
conditions were lysed by incubation with 350 μL lysis solution containing 245 μL
microRNA lysis buffer and 105 μL binding solution supplemented with 3.5 μL β-
mercaptoethanol (1%, v/v) in the culture vessel for 5 minutes. The crude lysate was
transferred to a filtration column and spun at 14,000 g for 2 min to remove cellular
debris and shear DNA. 385 μL 100% ethanol was added to the filtrate and mixed
thoroughly. The lysate/ethanol mixture was added to a GenElute Binding Column and
centrifuged at 14,000 g for 30 s followed by removal of the filtrate. The binding
column was washed once with 700 μL 100% ethanol and twice with 500 μL wash
solution 2. microRNA was dried by centrifugation at 14,000 g for 30 seconds before
being eluted with 30 μL elution solution and quantified using the NanoDrop ND-1000
Spectrophotometer (Thermo Fisher Scientific, USA). The quality of microRNA was
confirmed by the measurement of the A260/280 ratio. microRNA was used immediately
or stored at -80oC.
2.3.2.2 MicroRNA Reverse Transcription
MicroRNA Reverse Transcription was performed using the miScript System (Qiagen,
USA). MicroRNA (50ng-200ng) was mixed with 4 μL 5xmiScript, 1 μL miScript
reverse transcriptase mix and the total volume made up to 20μL with RNAse-free
water. The mixture was then incubated at 37ºC for 60 min followed by 95ºC for 5 min.
The resultant cDNA was used immediately or stored at -20 oC.
70 | P a g e
2.2.2.4 MicroRNA PCR (Sybr Green Based)
The relative expression of microRNA was determined by Sybr Green based PCR that
amplifies reverse transcribed microRNA using one universal primer and one
microRNA specific primer. Reverse transcribed microRNA was diluted 50 folds in
water and used as template in PCR. in details
2.4 Polymerase Chain Reaction (PCR)
Semi-quantitative PCR was performed to assess relative changes in gene expression
in different samples. Gene specific primers were designed using Roche Universal
ProbeLibrary Assay Design (www.roche-applied-
science.com/sis/rtpcr/upl/index.jsp?id=UP030000) and verified using BLAST
(http://blast.ncbi.nlm.nih.gov/Blast.cgi). Internal controls, such as β-Tubulin, actin
and RPL4 were used to ensure equal concentration of cDNA in concurrent PCRs. The
number of amplification cycles in PCR was determined from the linear portion of the
PCR cycle and was performed with increasing numbers of cycles.
The primers were diluted to 10 mM with 10 nM Tris-HCL. The final PCR mix
contained 2 μL cDNA, 1x PCR buffer, 2.5mM MgCl2, 0.5 mM dNTP, 0.1 mM of
each forward and reverse primers, 1.25U Platinum Tad DNA polymerase (Life
Technologies, USA) and RNAse-free water up to 25 μL.
The following conditions were used to amplify genes of interest
Initial denaturation: 94 oC 5 min
3 step cycling
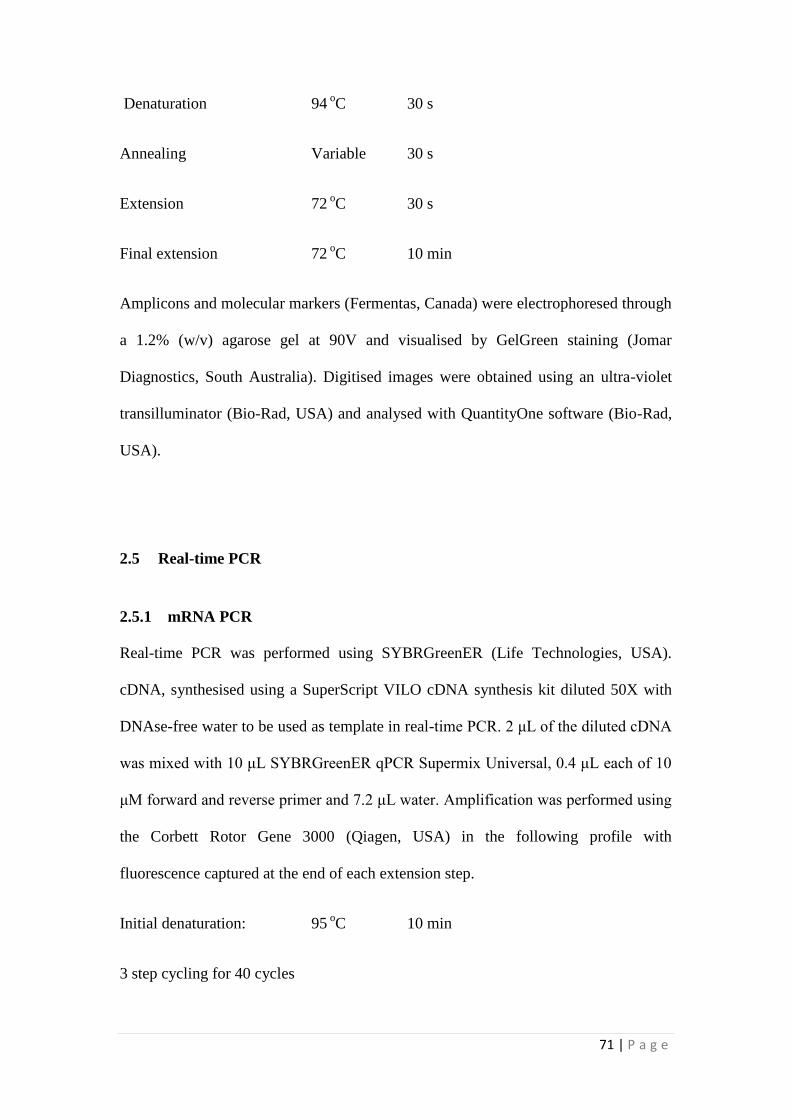
71 | P a g e
Denaturation 94 oC 30 s
Annealing Variable 30 s
Extension 72 oC 30 s
Final extension 72 oC 10 min
Amplicons and molecular markers (Fermentas, Canada) were electrophoresed through
a 1.2% (w/v) agarose gel at 90V and visualised by GelGreen staining (Jomar
Diagnostics, South Australia). Digitised images were obtained using an ultra-violet
transilluminator (Bio-Rad, USA) and analysed with QuantityOne software (Bio-Rad,
USA).
2.5 Real-time PCR
2.5.1 mRNA PCR
Real-time PCR was performed using SYBRGreenER (Life Technologies, USA).
cDNA, synthesised using a SuperScript VILO cDNA synthesis kit diluted 50X with
DNAse-free water to be used as template in real-time PCR. 2 μL of the diluted cDNA
was mixed with 10 μL SYBRGreenER qPCR Supermix Universal, 0.4 μL each of 10
μM forward and reverse primer and 7.2 μL water. Amplification was performed using
the Corbett Rotor Gene 3000 (Qiagen, USA) in the following profile with
fluorescence captured at the end of each extension step.
Initial denaturation: 95 oC 10 min
3 step cycling for 40 cycles
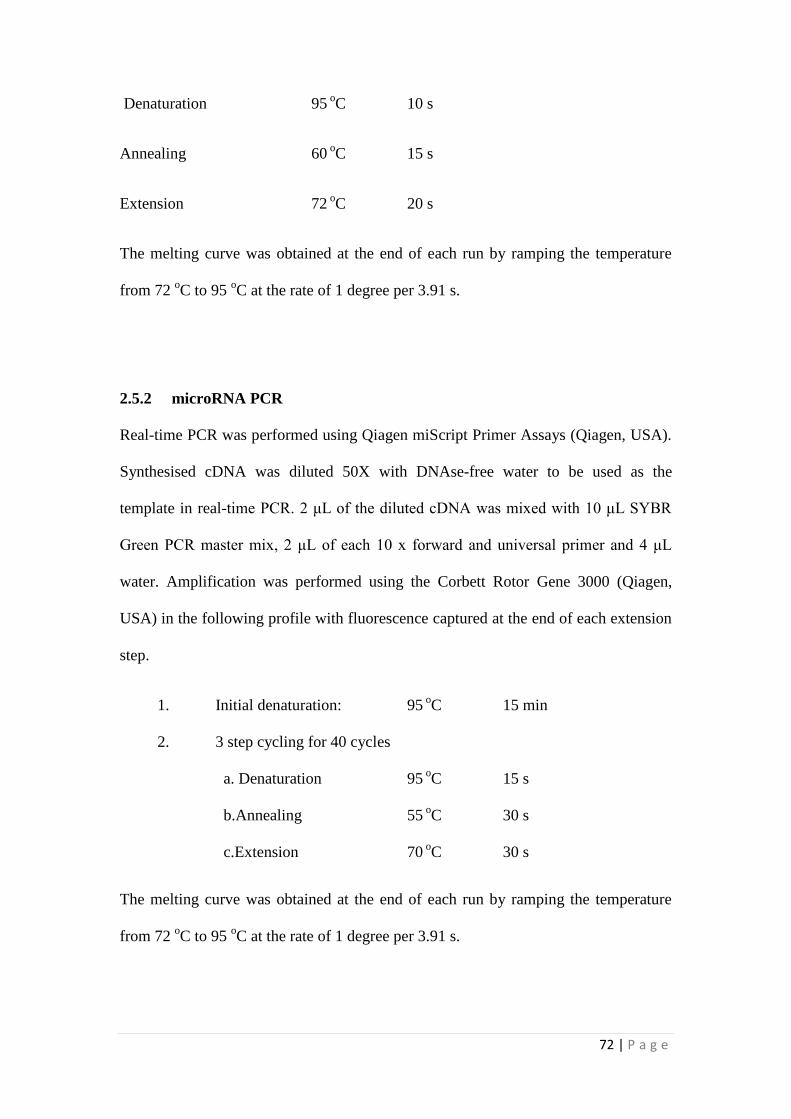
72 | P a g e
Denaturation 95 oC 10 s
Annealing 60 oC 15 s
Extension 72 oC 20 s
The melting curve was obtained at the end of each run by ramping the temperature
from 72 oC to 95
oC at the rate of 1 degree per 3.91 s.
2.5.2 microRNA PCR
Real-time PCR was performed using Qiagen miScript Primer Assays (Qiagen, USA).
Synthesised cDNA was diluted 50X with DNAse-free water to be used as the
template in real-time PCR. 2 μL of the diluted cDNA was mixed with 10 μL SYBR
Green PCR master mix, 2 μL of each 10 x forward and universal primer and 4 μL
water. Amplification was performed using the Corbett Rotor Gene 3000 (Qiagen,
USA) in the following profile with fluorescence captured at the end of each extension
step.
1. Initial denaturation: 95 oC 15 min
2. 3 step cycling for 40 cycles
a. Denaturation 95 oC 15 s
b.Annealing 55 oC 30 s
c.Extension 70 oC 30 s
The melting curve was obtained at the end of each run by ramping the temperature
from 72 oC to 95
oC at the rate of 1 degree per 3.91 s.

73 | P a g e
2.6 Protein extraction and Quantitation
Cells exposed to relevant experimental conditions were washed 3X with ice cold 1X
Phosphate Buffer Saline (PBS) (136 mM NaCl, 2.68 mM KCL, 10.14 mM Na2HPO4,
1.76 mM KH2PO4). Ice cold protein lysis buffer (50 mM Tris HCl, 150 mM NaCl, 5
mM EDTA 9pH7.4), 1% Triton X-100. 0.1% sodium dodecyl sulphate (SDS),
1%NP40, 1X PhosSTOP Phosphatase Inhibitor Cocktail (Roche, USA), 1X cOmplete,
Mini Protease Inhibitor Cocktail (Roche, USA) were then added to the cells and left
to incubate for 30 min at 4 oC. The cells with lysis buffer were scraped off the culture
vessel before being transferred to a chilled microcentrifuge tube and incubated for
another 30 min on ice. Lysate was subjected to a sonication water bath with 5s on, 5 s
off alternate sonication cycles for 5 min with minimum sonication power output
followed by centrifugation at 20,800g for 20 min at 4oC. The supernatant was
collected and used immediately or stored at -20 oC.
2.7 Western Blotting
Cell lysate was mixed with 6X Laemmli sample buffer (0.35 M Tris HCl (pH 6.8), 10%
SDS, 30% glycerol, 0.175 mM Bromophenol Blue, 6% (v/v) β-mercaptoethanol) and
heated at 95oC for 10 min. Samples were then resolved on a SDS-PAGE gel and
transferred to a Hybond nitrocellulose membrane (Amersham Pharmacia Biotech,
Bucks, UK). The blots were blocked for 1 hr with Tris Buffered Saline (15.35 mM
Tris HCl, 0.5 M NaCl) with 0.2% Tween (TTBS) and 5% skim milk or Bovine serum
albumin (BSA) (pH7.4) before being incubated with primary antibody overnight at
4oC. The nitrocellulose membrane was then washed three times with TTBS (1X 15
min, 2X 5 min) and incubated with Horse Radish Peroxidase (HRP) labelled
74 | P a g e
secondary antibody for 1 hr at room temperature. Another three washes with TTBS
(1X 15 min, 2X 5 min) were applied to the membrane, which was then developed
using the ECL chemiluminescence detection method (Amersham Pharmacia Biotech,
Bucks, UK). The image was captured and digitised using Las3000 (Fuji Film Life
Science, Japan) and analysed using Multi Gauge software (Fuji Film Life Science,
Japan).
2.8 Transient Transfection with microRNA and/or Plasmid
Transfection was successfully carried out using the Lipofectamine2000 transfection
reagent (Life Technologies, USA). Cells were seeded onto a 6 well plate 24 hr prior to
the transfection at 50% confluence. On the day of transfection, nucleic acids and
Lipofectamine2000 were diluted with Opti-MEM Reduced-Serum Medium (Life
Technologies, USA) before being mixed together and incubated to create the
transfection complex. The cells were washed with Opti-MEM Reduced-Serum
Medium before the transfection complex was carefully added in a drop wise fashion.
Transfection complex was removed 5 hr post transfection and replaced with complete
medium. Experimental protocols were commenced the following morning.
2.9 Plasmid Cloning
Plasmid cloning involves the enzymatic restriction digestion of both the plasmid
cloning vector and insert before ligation of the two. Unless otherwise stated for
specific experiments, 2 μg of DNA (applies to both plasmid and insert vector) was
digested with the first restriction enzyme and purified with QIAquick PCR

75 | P a g e
Purification Kit (Qiagen, USA). The recovered DNA was digested with the second
restriction enzyme and again purified. The recovered insert DNA fragment was then
quantitated for use in experiments. The recovered plasmid cloning vector was further
treated with shrimp alkaline phosphatase (Promega, USA) to remove the 5 ́phosphate
groups on the DNA backbone to prevent auto-ligation of the linearized DNA. The
purified vector DNA was then mixed with the insert DNA in the ratio of 1:3 in the
presence of 1X ligation buffer and T4 ligase (Life Technologies, USA) and incubated
at 4oC overnight. A negative control tube was included without the addition of the
insert DNA. The ligation mix was diluted 10 fold and 2 μL of the diluted ligation mix
was used to transform competent cells.
50 μL MAX Efficiency DH5α Competent Cells (Life Technologies, USA) were
removed from the -80 o
C freezer and thawed on ice. 2 μL of the diluted ligation mix
was added to the competent cells, followed by gentle tapping on the side of the tube.
The mixture was then incubated on ice for 30 min and heat shock treated at 42 oC for
30 s. The mixture was incubated on ice again for 2 minutes before the addition of 200
μL S.O.C. Medium (Life Technologies, USA) and then incubated on an orbital shaker
for 30 min at 225rpm at 37 oC. 50 μL of the competent cells were spread onto an agar
plate containing 50 μg/mL ampicillin (Sigma, USA) and incubated overnight at 37 oC.
Clones were picked and grown in 1-5 mL Luria-Bertani (LB) broth containing 50
μg/mL ampicillin at 37 oC.
2.10 PCR product clean up
PCR purification to remove salt and protein as well as other contaminants was carried
out using a QIAquick PCR Purification Kit (Qiagen, USA). 5 volumes of Buffer PB
76 | P a g e
were added to 1 volume of the PCR sample and mix, followed by the addition of 10
μL 3M sodium acetate. The mixture was transferred to a QIAquick column and
centrifuged for 60 s. The column was washed twice with 750 μL Buffer PE and dried
by centrifugation for 1 min. The DNA was then eluted in 50 μL Buffer EB or pure
water.
2.11 Nucleotide Removal
The QIAquick Nucleotide Removal Kit (Qiagen, USA) was used to remove
nucleotides enzymatically digested from a DNA sequence as well as other
contaminants. 10 volumes of Buffer PN was added to 1 volume of the reaction sample
and mixed. The mixture was transferred to a QIAquick column and centrifuged for
60s. The column was washed twice with 750 μL Buffer PE and dried by
centrifugation for 1 min. The DNA was then eluted in 50 μL Buffer EB or pure water.
2.12 Plasmid Extraction
2.12.1 Plasmid Miniprep
Plasmid minipreps were carried out using QIAprep Spin Miniprep Kits (Qiagen, USA)
from 1-5 mL culture in LB broth grown overnight. Bacterial cells were harvested by
centrifugation at 4000 g for 15 min at 4°C. The resulting bacterial pellet was
resuspended in 250 μL Buffer P1containing RNAse A. 250 μL Buffer P2 was then
added and mixed thoroughly by vigorously inverting the sealed tube 4–6 times before
the addition of 350 μL Buffer P3. The tube was then mixed immediately and
thoroughly by vigorously inverting 4–6 times followed by centrifugation at 17,900 g
77 | P a g e
for 10 min. The supernatant containing plasmid DNA was collected and transferred to
a QIAprep spin column before centrifugation at 17,900 g for 60. The column was then
washed with 500 μL Buffer PB and 750 μL Buffer PE and eluted with 50 μL Buffer
EB (10 mM Tris HCl, pH8.5). The eluted plasmid was then quantitated using
Nanodrop and used immediately or stored at -20°C.
2.12.2 Plasmid Maxiprep
Plasmid miniprep was carried out using QIAGEN Plasmid Plus Maxi Kits (Qiagen,
USA) for up to 200 mL culture in LB broth grown overnight. Bacterial cells were
harvested by centrifugation at 5,000 g for 30 min at 4°C. The resulting bacterial
pellet was resuspended in 8 mL Buffer P1containing RNAse A. 8 mL Buffer P2 was
then added and mixed thoroughly by vigorously inverting the sealed tube 4–6 times
followed by incubation at room temperature for 3 min. 8 mL Buffer P3 was then
added before the mixture was mixed and transferred to a filtration syringe. The
mixture was then incubated at room temperature for 10 min and filtered. The filtrate
containing plasmid DNA was collected and mixed with 5 mL Buffer BB before being
transferred to a binding column. A vacuum was created to draw the solution through
the binding column, which was then washed with 700 μL Buffer ETR and 700 μL
Buffer PE. Plasmid DNA was eluted with 400 μL Buffer EB. The eluted plasmid was
then quantified using Nanodrop and used immediately or stored at -20°C.

78 | P a g e
2.13 Luciferase Assay
Luciferase assays were carried out using the Dual-Luciferase Reporter Assay System
(Promega, USA). Cells subjected to relevant plasmid transfection and experimental
protocols in 12-well plates were washed with ice-cold PBS twice before 250 μL 1X
passive lysis buffer was added to each well. The culture plate was placed on MixMate
shaker (Eppendorf, USA) and gently shaken at 700 rpm for 15 min at room
temperature. 20 μL lysate was transferred to each well of the 96-well luminometer
compatible plate, which was then transferred to a luminometer for luciferase activity
reading. Each sample was done in three technical triplicates.
While in the luminometer, 50 μL Luciferase Assay Reagent II (prepared by
resuspending Luciferase Assay Substrate in 10 mL Luciferase Assay Buffer II) was
injected into each well and firefly luciferase activity was recorded for the next 10 s.
50 μL 1X Stop & Glo Reagent was then added (prepared by mixing 1 volume of 50X
Stop & Glo Reagent with 50 volumes of Stop & Glo Buffer) and renilla luciferase
activity was recorded.
2.14 Site Directed Mutagenesis
Site directed mutagenesis was used to change 4bp in the 3’UTR of fibronectin mRNA
to verify the binding ability of miR-200b to this region. The detailed methods are
described in Materials and Methods section of Chapter 3.
79 | P a g e
2.15 Animal Handling
C57BL6 mice were used during this PhD project to study the role of miR-200b in
preventing unilateral ureteral obstruction induced renal fibrosis. The Royal North
Shore Hospital Animal Care and Ethics Committee approved ethics with approval
number 1203-008A. Mice were bred in Kearns Facility located at level 3 of the
Kolling Building. 6-8 week old mice were ordered and placed in the assigned holding
shelf for Renal Research Lab. 2 weeks was given for mice to adapt to the new
environment before the commencement of any treatment. Sufficient food and water
was given to the mice throughout the whole experiment. Pseudo-virus or
nanoparticles (according to different treatment group) containing miR-200b gene
were injected through the tail vein when the mice were anaesthetised by 2%
isoflurane gas (mixed with 1 part oxygen, 2 parts nitrogen) inhalation. A second
injection of the same dosage was given 2 days after the first injection to ensure the
expression of miR-200b. Expression of red fluorescent protein (fluorescent protein
was co-expressed with miR-200b on the same vector) was examined using an in vivo
imaging system in mice anaesthetised 2-3 days post injection to confirm positive
transduction.
On the day of performing UUO, mice were anaesthetised by 2% isoflurane gas (mixed
with 1 part oxygen, 2 parts nitrogen) inhalation before immobilised onto a surgical
pad. The region lateral to the abdomen (where kidneys lie beneath) was shaved and
cleaned using Alcowipes (70% isopropanol). A vertical incision (~1-1.5 cm) was
made at shaved area. The left ureter was isolated and ligated twice (proximal and
distal of the ureter) with surgical silk line. Sham-operated control mice had their
ureter manipulated but not ligated. The incision wound was then sutured using a
surgical silk line and mice were given intra-peritoneal buprenorphine (0.03 – 0.05

80 | P a g e
mg/kg) for pain induced by surgery. The mice were returned to cage after the surgery
and kept under a heating lamp for 20 minutes. Infection and signs of stresses
including pilo-erection, arching back, sunken face and weakness of the mice was
observed closely daily. Mice were sacrificed 7 days after UUO and urine (from
bladder), blood (from heart) and organs were harvested for analysis.
2.16 Live Animal Imaging
Anaesthetised mice were immobilised (limb immobilisation using tape) onto the
platform fitted with adaptors for isoflurane gas, provided in the in vivo imaging
device, and the mice were kept anaesthetised. Fluorescence was detected and X-ray
scans of the skeleton were also obtained. The two images were then superimposed to
illustrate the location of fluorescence. Mice were then returned to their respective
cages.
2.17 Mouse Organ Harvesting
Mice were anaesthetised using 2% isoflurane (mixed with 1 part oxygen, 2 parts
nitrogen) and immobilised onto a surgical pad. A vertical incision was made to expose
the internal organs. Bladder urine was collected followed by blood drawn from the
left ventricle. 15 mL PBS was used perfuse the mice by gently pushing it through the
left atrium. Organs were then collected. Samples for RNA/DNA and protein analysis
were snap frozen in liquid nitrogen while samples reserved for immunohistochemistry
were placed in 4% paraformaldehyde overnight before being transferred to 70%
ethanol.

81 | P a g e
2.18 RNA extraction from tissue
Once harvested, tissue samples were snap frozen in liquid nitrogen and stored in a -
800C freezer until extraction. The miRNeasy Micro Kit (Qiagen, USA) was used to
extract both mRNA and miRNA from the tissue samples. On the day of extraction,
700 μL QIAzol Lysis Reagent was added to the sample, which was then homogenised
for 20s using the Qiagen TissueRuptor (Qiagen, USA). The homogenised tissue was
then incubated at room temperature for 5 mins before the addition of 140 μL
chloroform and mixed by vigorous shaking for 15 s. The homogenate was allowed to
settle at room temperature for 2-3 mins and centrifuged at 12,000 g for 15 mins at 40C.
350 μL of the upper clear aqueous phased was transfer to a fresh tube followed by the
addition of 525 μL 100% ethanol. The solution was mixed and transferred to into an
RNeasy MinElute column in a 2 mL collection tube before being centrifuged at
10,000g for 15s. The flow through was discarded and 700 μL Buffer RWT was added
to the tube.
2.19 Stable Cell Line Construction
During this PhD, a stable cell line that constantly over-expresses PMEPA1 was
constructed to study its role in preventing cellular fibrosis. The detailed materials and
methods were outlined in the relevant sections of Chapter 5 of this thesis.
2.20 Statistical Analysis
All relative quantitation was expressed as percentage of the control value (100% or 1).
Experiments were performed at lease in triplicate in a minimum of 3 different culture

82 | P a g e
preparations. Results were expressed as mean ± standard error mean (SEM) with n
reflecting the number of culture preparations. Statistical comparisons between groups
were made by analysis of variance (ANOVA) with pairwise comparison made using
unpaired t-test. Analysis was performed with the software package Graphpad, version
5.0 (Prism, USA). P values < 0.05 were considered significant.
83 | P a g e
3 Chapter 3 MiRNA-200b represses transforming growth factor beta1-
induced EMT and fibronectin expression in kidney proximal tubular cells
3.1 Introduction
miRNAs comprise a large family of small noncoding RNAs that have emerged as key
post-transcriptional regulators of gene expression in mammals, plants, and protozoa.
In mammals, miRNAs are predicted to control the activity of more than 60% of all
protein-coding genes (Friedman et al., 2009) and regulate almost every cellular
process (Bartel, 2009; Fabian et al., 2010). miRNAs regulate protein synthesis by
base-pairing to 3’UTR of target mRNAs. TGF-β1 plays a key role in cell
proliferation, differentiation and apoptosis, predominantly, but not exclusively
through SMAD signalling pathways, which are key signalling pathways downstream
of ligands of the TGF-β superfamily. TGFβ1 is considered to be a key driver of
epithelial to EMT during which, epithelial cells are converted to active myofibroblasts.
Excessive extracellular matrix proteins, including fibronectin, are produced by these
myofibroblasts and hence they contribute significantly to renal tubulo-interstitial
fibrosis. As alluded to above, the SMAD signalling pathway activated by TGFβ1 is a
key pathway responsible for the downstream activation of TGFβ1. Once activated, the
SMAD complex translocates into the nucleus and initiates transcription of genes
relevant to renal fibrosis. In addition, signalling molecules such as phospho-ERK and
phospho-p38 MAPK, activated by angiotensin II and AGEs as well TGFβ1, can also
promote EMT by either interacting with the SMAD proteins or through non-SMAD
dependent pathways. TGFβ1 additionally activates plasminogen activator inhibitor-1
(PAI-1) (Clouthier et al., 1997; Ghosh and Vaughan, 2012; Han et al., 2010; Li et al.,

84 | P a g e
2006). PAI-1 is a potent inhibitor of urokinase/tissue type plasminogen activator
(uPA/tPA), which regulates the activity of MMPs. Since MMPs are involved in
proteolytic degradation of matrix proteins, such as collagen and fibronectin, a
reduction in PAI-1 expression will up-regulate MMPs and thus down-regulate the
expression of fibronectin (Ghosh and Vaughan, 2012; Nagase and Woessner, 1999;
Visse and Nagase, 2003). TGFβ1 is also known to regulate a wide array of cellular
functions through non-SMAD pathways, which are activated directly by ligand
occupied receptors to reinforce, attenuate, or otherwise modulate downstream cellular
responses. These non-SMAD pathways include various branches of the MAP kinase,
Rho-like GTPase, and phosphatidylinositol-3-kinase/AKT signalling pathways (Hills
and Squires, 2011; Lan, 2011b). In 2008, pioneering work performed by Gregory et al
demonstrated miRNA-200b, a member of the microRNA-200 family, to be a key
miRNA in regulating EMT by targeting ZEB1 and ZEB2 transcription factors using
protein tyrosine phosphatase Pez (PTP-Pez) over-expressing Madin Darby canine
kidney (MDCK) epithelial cells, an immortalised model of distal tubular cells
(Gregory et al., 2008a). Subsequently the miRNA-200b pre-cursor/mature form was
shown to prevent renal tubulointerstitial fibrosis in a mouse model of UUO, and to
prevent TGFβ1 induced increases in ECM production in in vitro models of rat tubular
epithelial cells (NRK52E) (Xiong et al., 2012) respectively. It has been well
substantiated that TGFβ1 down-regulates the expression of miRNA-200b (Gregory et
al., 2008a; Korpal and Kang, 2008; Korpal et al., 2008; Park et al., 2008). However,
the role of miRNA-200b in preventing renal pathology by virtue of proximal tubular
cytoprotection and the molecular mechanisms involved remain unclear.
85 | P a g e
3.2 Specific Materials and Methods
3.2.1 Cell culture
The immortalised human kidney proximal tubule cell line (HK-2) purchased from
American Type Culture Collection (ATCC) was used in this study and maintained in
keratinocyte-SFM (Invitrogen). Cells were plated and grown over night to reach
approximately 50% confluence and then transfected with 25nM/L miRNA-200b
(Thermo Scientific) using Lipofectamine 2000 (Invitrogen) transfecting reagent
according to the manufacturer’s instructions. A 25nM/L non-specific miRNA (Qiagen)
served as a negative control of miRNA transfection. Twenty-four hours after
transfection, cells were exposed to 0.5ng/mL TGFβ1 (Sigma-Aldrich) or control
conditions for 48 hours. Total RNA was extracted using Trizol Reagent (Invitrogen)
and total protein was prepared using cell lysis buffer and sonication. Cell morphology
was observed by phase contrast microscopy.
3.2.2 Reverse transcription –polymerase chain reaction & Real-time PCR
Extracted total RNA was DNase I treated, and cDNA was synthesized from 1μg total
RNA using Superscript VILO cDNA synthesis kit (Invitrogen). mRNA level was
determined by real-time PCR using SYBR GreenER qPCR Supermix (Invitrogen) on
Corbett Rotor-Gene 3000 (Qiagen). The results were analysed and Ct values were
determined by comparing the results to a standard curve produced by serial dilutions.
86 | P a g e
3.2.3 Quantitation of miRNA
miRNAs in total RNA were polyadenylated by poly(A) polymerase and converted to
cDNA by reverse transcriptase using miScript Reverse Transcription Kit (Qiagen).
MiRNA level was determined by real time PCR using miScript SYBR Green PCR Kit
(Qiagen). U6 was used as the internal control of miRNAs.
3.2.4 Western Blotting
As described above, HK-2 cells were plated in 10 cm-tissue culture dishes overnight
and transfected with synthetic 25nM miRNA-200b (Thermo Scientific). Twenty-four
hours after transfection, cells were exposed to 0.5ng/mL TGFβ1 or control conditions
for 48 hours. Cells were then lysed in ice-cold lysis buffer, sonicated and the protein
concentration was measured (Bio-Rad). Equal amounts of total protein (45μg) were
prepared in 2x sample buffer and denatured at 95oC for 5 minutes. Samples were
loaded and resolved by SDS-polyacrylamide gel electrophoresis. Protein was
transferred onto a nitrocellulose membrane (GE Health) and non-specific binding was
blocked by incubating with 5% skim milk for 2 hours at room temperature and probed
with anti-E-Cadherin (BD Biosciences), anti-Fibronectin (Millipore), anti-phospho
p38, anti-phospho p42/44, anti-phospho-SMAD2, anti-phospho-SMAD3 (Cell
Signalling) antibody overnight at 4oC. The membrane was washed and probed with
corresponding secondary antibodies for 2h at room temperature. The membrane was
washed after secondary antibody probing and subjected to enhanced
chemiluminescence (ECL) (GE Health) according to the manufacturer’s instructions.
Fluorescence was read and digitised using LAS4000 (Fuji Film) and analysed by
Multi-gage software (Fuji Film).

87 | P a g e
3.2.5 Plasmid construction
The construction of Luciferase reporter vectors for miRNA-200b target and for
3’UTR of fibronectin was performed according to the instructions (pMIRNA-
REPORTER, Ambion). Complementary DNA fragments containing the putative
miRNA-200b target site within the 3’UTR of human fibronectin mRNA were
amplified by PCR (the primers: sense, 5’- ATCGGAGCTC CACAGCTTCT
CCAAGCATCA -3’ and antisense, 5’- ATCGAAGCTT TGGCTGCATA
TGCTTTCCTA -3’) with flanking Hind III and Sac I restriction enzyme digestion
sites. The amplified DNA fragment was cloned into the Hind III and Sac I sites
downstream of firefly luciferase gene in pMIRNA-Reporter system (Applied
Biosystem).
A mutant with fibronectin 3’UTR identical to the wild type sequences, apart from 4bp
in the seed region, was generated as a negative control. Desired mutations were
introduced by amplifying pMIRNA plasmid containing fibronectin 3’UTR using
mutated primer pairs (the primers: sense, 5’-
GTATTCAATACCGCTCAACGGTTTAAATGAAGTGATTC-3’ and antisense, 5’-
GAATCACTTCATTTAAACCGTTGAGCGGTATTGAATAC-3’). The mutated
plasmid was transformed into DH5α competent cells and mutation was confirmed by
sequencing.
3.2.6 Fibronectin promoter reporter assay & Luciferase assay of 3’UTR of
fibronectin
HK-2 cells were seeded in 24-well plates overnight prior to transfection. 200ng of
pMIRNA reporter plasmid containing 3’UTR or mutated 3-UTR of fibronectin or
88 | P a g e
empty pMIRNA reporter plasmid along with renilla luciferase plasmid were co-
transfected with 25nM miRNA-200b (Thermo Scientific) or All-star non-specific
siRNA (Qiagen) using Lipofectamine 2000 (Invitrogen). Cells were collected 48
hours post transfection and luciferase activity was assayed using the Dual-Luciferase
reporter assay system (Promega). Firefly luciferase activity was normalized to renilla
luciferase activity. All experiments were performed in triplicate with data from 5
independent experiments.
3.2.7 Statistical Analysis
Each experiment was repeated at least 4 times and results expressed as mean ± SEM.
ANOVA and unpaired t-tests were used for statistical comparison. Analysis was
performed using Graphpad version 5 (San Diego CA). P values less than 0.05 were
considered significant.
3.2.8 Optimisation of various techniques described in this chapter
Numerous efforts had been put into the optimisation of the technique and construction
of the materials necessary for the experiments describe in the previous chapter. In this
chapter, these will be discussed in detail so mistakes made may be avoided by others
in the future.
89 | P a g e
3.2.8.1 Initial Construction of Fibronectin 3’UTR
The predicted miR-200b binding sites with 5’ and 3’ restriction enzyme overhangs
were ordered as sense and anti-sense single stranded DNA (Sigma Aldrich, USA).
The sequences were:
Fibronectin 3’UTR miR-200b binding site 1 Sense with SpeI at 5’:
CTAGTCGAAGTATTCAATACCGCTCAGTATTTTAA
Fibronectin 3’UTR miR-200b binding site 1 anti-Sense with HindIII at 5’:
AGCTTTAAAATACTGAGCGGTATTGAATACTTCGA
Fibronectin 3’UTR miR-200b binding site 2 Sense with SpeI at 5’:
CTAGTTATTTATCAATTTTTCCCAGTATTTTTATAA
Fibronectin 3’UTR miR-200b binding site 2 anti-Sense HindIII at 5’:
AGCTTTATAAAAATACTGGGAAAAATTGATAAATAA
Reverse sequence of the corresponding sequences were also ordered to serve as a
control sequence. The sequences of reverse sequences were:
Fibronectin 3’UTR miR-200b binding site 1 reverse sequence Sense with SpeI at 5’:
CTAGTCGAAAAATACTGAGCGGTATTGAATACTAA
Fibronectin 3’UTR miR-200b binding site 1 reverse sequence anti-Sense HindIII at 5’:
AGCTTTAGTATTCAATACCGCTCAGTATTTTTCGA
Fibronectin 3’UTR miR-200b binding site 2 reverse sequence Sense with SpeI at 5’:
CTAGTTATTTATCAATTTTTCCCAGTATTTTTATAA
Fibronectin 3’UTR miR-200b binding site 2 reverse sequence anti-Sense HindIII at 5’:

90 | P a g e
AGCTTTATAATTTATCAATTTTTCCCAGTATTTTAA
3.2.8.2 DNA Annealing
The sense and anti-sense sequences (complementary oligonucleotides) were annealed
into double stranded DNA. The complimentary oligonucleotides of equal molar
amount (20 μL of 200 μM of each oligonucleotide) were mixed with 50 μL 10x
annealing buffer (100 mM Tris-HCl, pH 7.5, 1 M NaCl, 10 mM EDTA) and 410 μL
water before being heated to 95oC on a dry bath. The mixture was then allowed to
cool to room temperature on the dry bath for oligonucleotide annealing. The annealed
DNA was resolved on an agarose gel to verify the size.
3.2.8.3 pMIR Lucifrease Reporter plasmid preparation
The annealed sequences of fibronectin 3’UTR were to be inserted into the 3’UTR
position of luciferase gene in the pMIR-REPORT Luciferase plasmid (Life
Technologies, USA) (Figure3.1). The regulation of these sequences is reflected by the
changes in the activity of luciferase gene product.
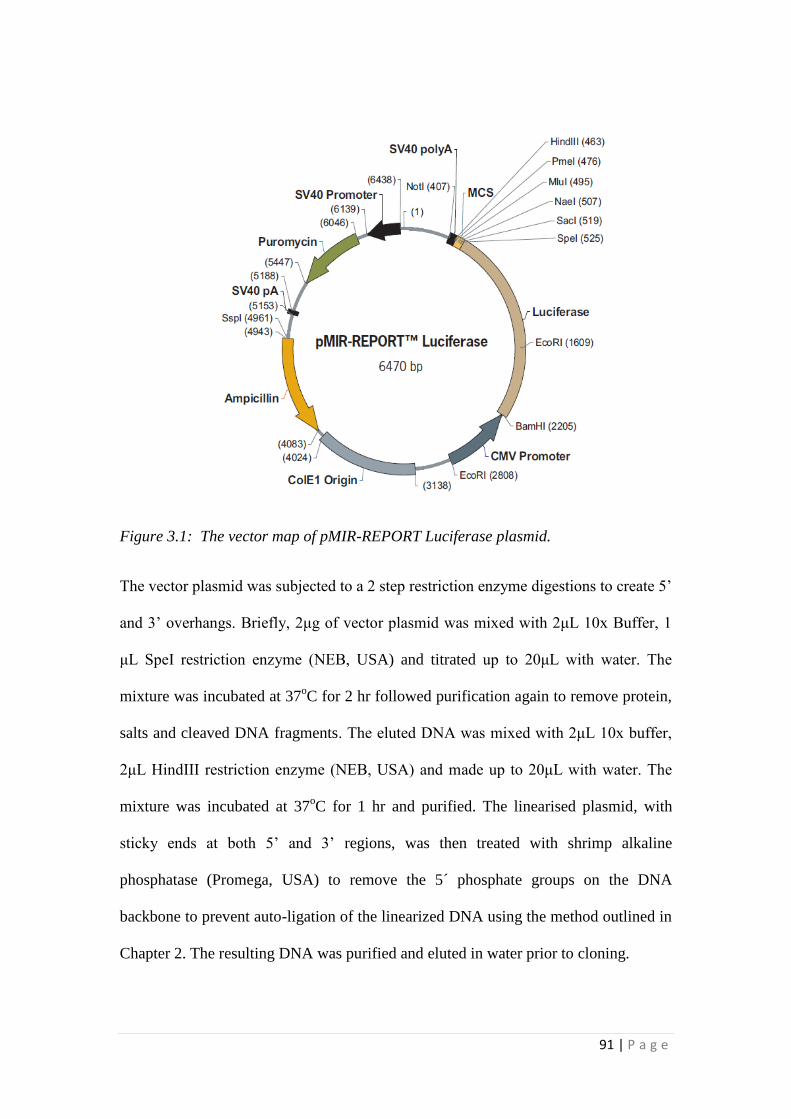
91 | P a g e
Figure 3.1: The vector map of pMIR-REPORT Luciferase plasmid.
The vector plasmid was subjected to a 2 step restriction enzyme digestions to create 5’
and 3’ overhangs. Briefly, 2μg of vector plasmid was mixed with 2μL 10x Buffer, 1
μL SpeI restriction enzyme (NEB, USA) and titrated up to 20μL with water. The
mixture was incubated at 37oC for 2 hr followed purification again to remove protein,
salts and cleaved DNA fragments. The eluted DNA was mixed with 2μL 10x buffer,
2μL HindIII restriction enzyme (NEB, USA) and made up to 20μL with water. The
mixture was incubated at 37oC for 1 hr and purified. The linearised plasmid, with
sticky ends at both 5’ and 3’ regions, was then treated with shrimp alkaline
phosphatase (Promega, USA) to remove the 5 ́ phosphate groups on the DNA
backbone to prevent auto-ligation of the linearized DNA using the method outlined in
Chapter 2. The resulting DNA was purified and eluted in water prior to cloning.
92 | P a g e
3.2.8.4 pMIR Luciferase plasmid construction with annealed fibronectin 3’UTR
The annealed fibronectin 3’UTR sequences and pMIR-REPORT luciferase plasmid
vector, both with sticky ends were then ligated together at a 3:1 molar ratio (insert
DNA to vector DNA). 100 ng pMIR-REPORT luciferase plasmid was mixed with
1.62 ng fibronectin 3’UTR sequences in the presence of 1 μL 10x ligation buffer, 1
μL of T4 DNA ligase (NEB, USA) and water to 10 μL. The mixture was then
incubated at 4oC overnight. A negative control was also setup but without the addition
of the insert DNA. 2 μL of the ligation mix was used to transform 50 μL of DH5α
chemically competent E. coli cells (Life Technologies, USA) using the methods
described in chapter 2. The transformed E.coli from both positive and negative tubes
were plated onto agar plates containing 100 μg/mL ampicillin and incubated at 37 o
C
overnight.
3.2.8.5 Colony Selection
The number of colonies on each plate were counted and compared. It was considered
successful only when positive plates had significantly more colonies than negative
plates. However, there were equal numbers of colonies on both positive and negative
plates (20+ for each plate). 2 colonies from the positive plate were picked and grown
in 5 ml LB broth containing 100 μg/mL ampicillin and incubated 37 oC overnight at
225rpm in a shaking incubator. Plasmid was extracted from each sample using
QIAprep Spin Miniprep Kit (Qiagen, USA) according to manufacturer’s instruction
described in Chapter 2. 2μg of plasmid was double digested with SpeI and HindIII
and it was expected that the positive clone would display a 35bp DNA fragment when
resolved on the agarose gel together with the linearised plasmid vector. However, no
fragment was observed on the gel.

93 | P a g e
Two modifications to the selection procedure were subsequently made. Firstly,
bacterial cells were cracked open to release plasmid DNA instead of miniprep.
Secondly, PCR amplification of the MCS was used to identify positive clones instead
of restriction enzyme double digestion.
Briefly, colonies on the agar plate were picked and resuspended in 10 μL of water
before incubation at 95oC for 10 min. The crude extract was chilled on ice for 2 min
before centrifugation at 12,000 x g for 20 min. The supernatant was removed to a
fresh tube without disturbing the pellet. 2 μL of the supernatant was used as template
in PCR to amplify MCS using the method described in Chapter 2. The primer pair
used to amplify MCS was:
pMIR-MCS-F: 5’-CCAACACACAGATCCAATGAA-3’
pMIR-MCS-R: 5’-CCTCATAAAGGCCAAGAAGG-3’
10 more colonies from each transformed E.Coli plates were screened.However no
positive clone was identified (Figure 3.2).
A

94 | P a g e
B
Figure 3.2 Colony screening for positive clones. Ligated plasmid vector was used to
transform 50 μL chemical competent cells and colonies formed were screened using
PCR. A. Agarose gel separation of amplified MCS for binding site 1. Lane 1: Control
pMIR plasmid. Lanes 2-11 colonies subjected to screening. B. Agarose gel separation
of amplified MCS for binding site 1 reverse sequence. Lane 1: Control pMIR plasmid.
Lanes 2-11 colonies subjected to screening.
Several other combinations of conditions for ligation including various insert DNA to
vector DNA ratio (1:1, 3:1, 6:1, 10:1) at various ligation temperature (4oC, 16
oC and
22oC) were also tested. However, no positive clone was identified.

95 | P a g e
3.2.8.6 Other ligation approaches
It was thought that the insert DNA might be too short for insertion, thus longer DNA
fragments containing the putative miR-200b binding site on fibronectin 3’UTR were
amplified using the method outlined in the previous chapter.
3.2.8.7 First Approach of Site Directed Mutagenesis
The QuikChange II Site-Directed Mutagenesis Kit (Agilent Technologies, USA) was
employed to mutate the core binding site for miR-200b on the fibronectin 3’UTR.
Mutagenic primer pairs that are complementary to each other were designed using
web based software provided by Agilent Technologies. The sequences of the designed
mutagenic primers were:
g107a_t108c_a109g_t110g:
5’-
TGTTCTGCTTCGAAGTATTCAATACCGCTCAACGGTTTAAATGAAGTGATT
CTAAGATTTGGTTTG-3’
g107a_t108c_a109g_t110g_antisense:
5’-
CAAACCAAATCTTAGAATCACTTCATTTAAACCGTTGAGCGGTATTGAAT
ACTTCGAAGCAGAACA-3’
20 ng of plasmid containing the original miR-200b binding site was mixed with 5 μL
10x reaction buffer, 125 ng of each mutagenic primer 1 μL dNTP mix and filled to 50
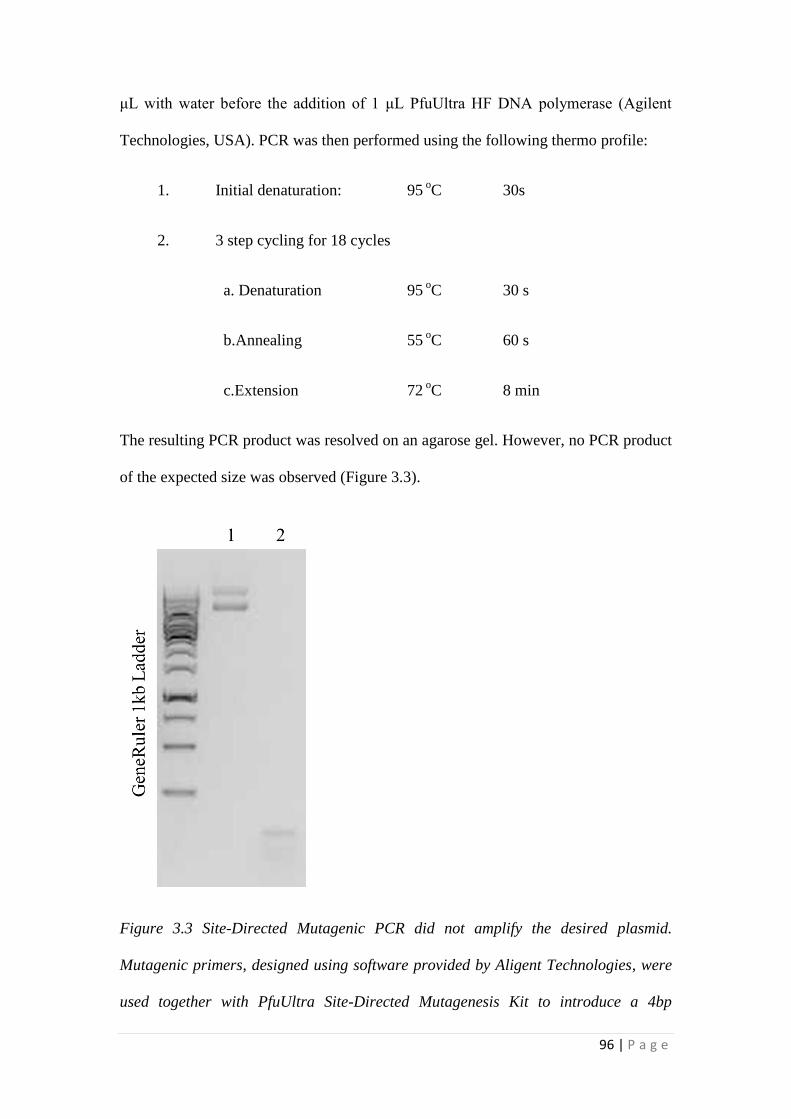
96 | P a g e
μL with water before the addition of 1 μL PfuUltra HF DNA polymerase (Agilent
Technologies, USA). PCR was then performed using the following thermo profile:
1. Initial denaturation: 95 oC 30s
2. 3 step cycling for 18 cycles
a. Denaturation 95 oC 30 s
b.Annealing 55 oC 60 s
c.Extension 72 oC 8 min
The resulting PCR product was resolved on an agarose gel. However, no PCR product
of the expected size was observed (Figure 3.3).
Figure 3.3 Site-Directed Mutagenic PCR did not amplify the desired plasmid.
Mutagenic primers, designed using software provided by Aligent Technologies, were
used together with PfuUltra Site-Directed Mutagenesis Kit to introduce a 4bp
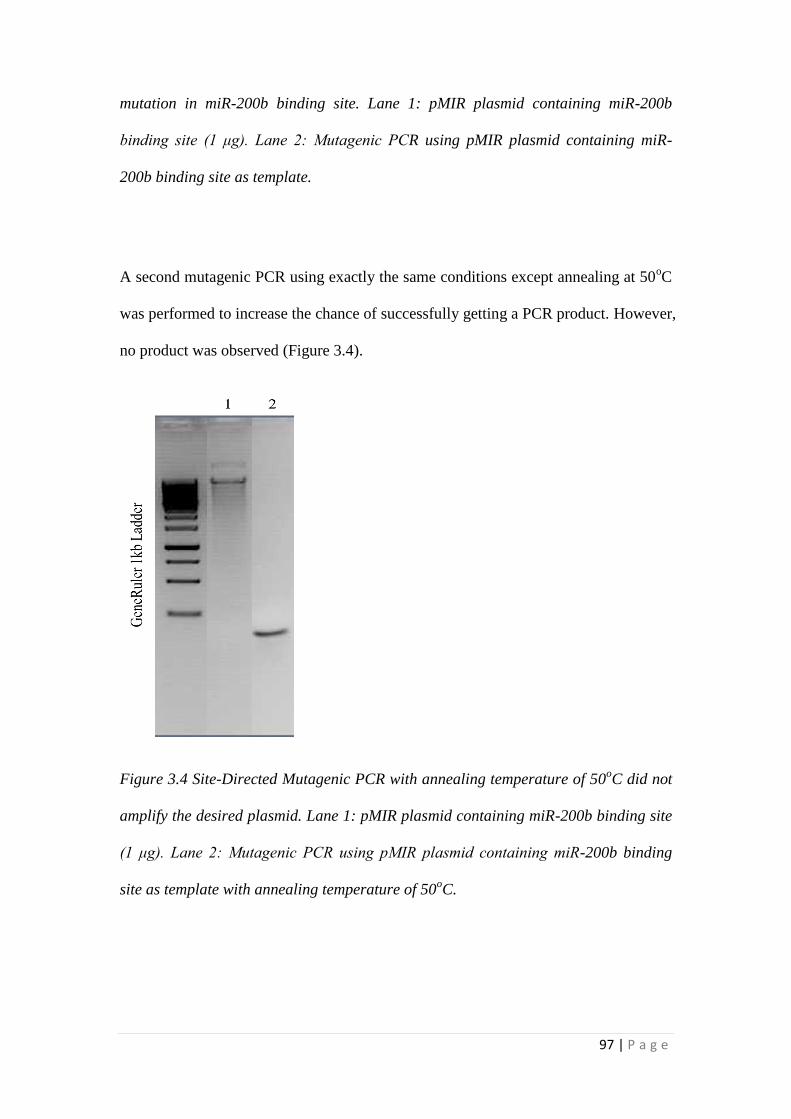
97 | P a g e
mutation in miR-200b binding site. Lane 1: pMIR plasmid containing miR-200b
binding site (1 μg). Lane 2: Mutagenic PCR using pMIR plasmid containing miR-
200b binding site as template.
A second mutagenic PCR using exactly the same conditions except annealing at 50oC
was performed to increase the chance of successfully getting a PCR product. However,
no product was observed (Figure 3.4).
Figure 3.4 Site-Directed Mutagenic PCR with annealing temperature of 50oC did not
amplify the desired plasmid. Lane 1: pMIR plasmid containing miR-200b binding site
(1 μg). Lane 2: Mutagenic PCR using pMIR plasmid containing miR-200b binding
site as template with annealing temperature of 50oC.
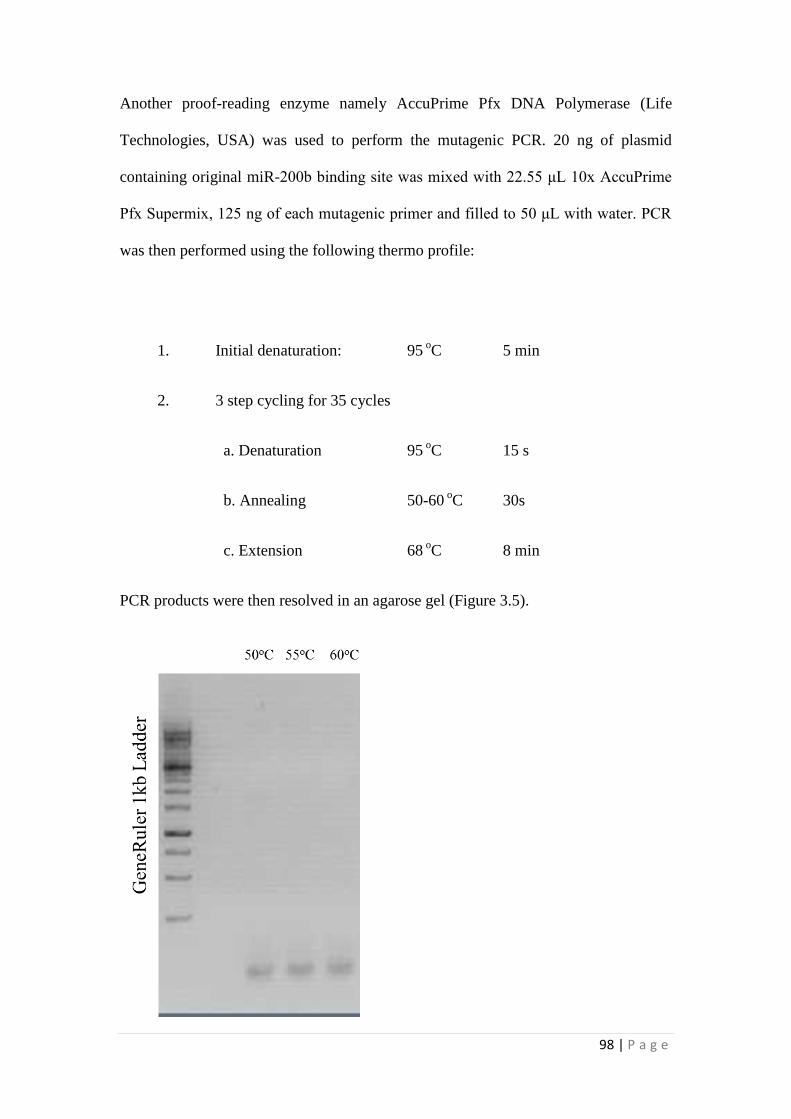
98 | P a g e
Another proof-reading enzyme namely AccuPrime Pfx DNA Polymerase (Life
Technologies, USA) was used to perform the mutagenic PCR. 20 ng of plasmid
containing original miR-200b binding site was mixed with 22.55 μL 10x AccuPrime
Pfx Supermix, 125 ng of each mutagenic primer and filled to 50 μL with water. PCR
was then performed using the following thermo profile:
1. Initial denaturation: 95 oC 5 min
2. 3 step cycling for 35 cycles
a. Denaturation 95 oC 15 s
b. Annealing 50-60 oC 30s
c. Extension 68 oC 8 min
PCR products were then resolved in an agarose gel (Figure 3.5).

99 | P a g e
Figure 3.5 Site-Directed Mutagenic PCR using AccuPrime Pfx DNA Polymerase with
three different annealing temperatures did not amplify the desired plasmid. Annealing
temperature is indicated at the top of each lane.
A shorter version of the mutagenic primers was designed by truncating several
nucleotides on each side (3 at 5’ end and 6 at 3’ end) of the existing mutagenic
primers. The sequences of new mutagenic primers were:
Mutation S sense: 5’-
GTATTCAATACCGCTCAACGGTTTAAATGAAGTGATTC-3’
Mutation S antisense: 5’-
GAATCACTTCATTTAAACCGTTGAGCGGTATTGAATAC-3’
Two PCR were performed using either AccuPrime Pfx DNA Polymerase (Figure
3.6A) or PfuUltra Site-Directed Mutagenesis Kit (Figure 3.6B) at various annealing
temperatures and 35 cycles. The PCR products were resolved on an agarose gel
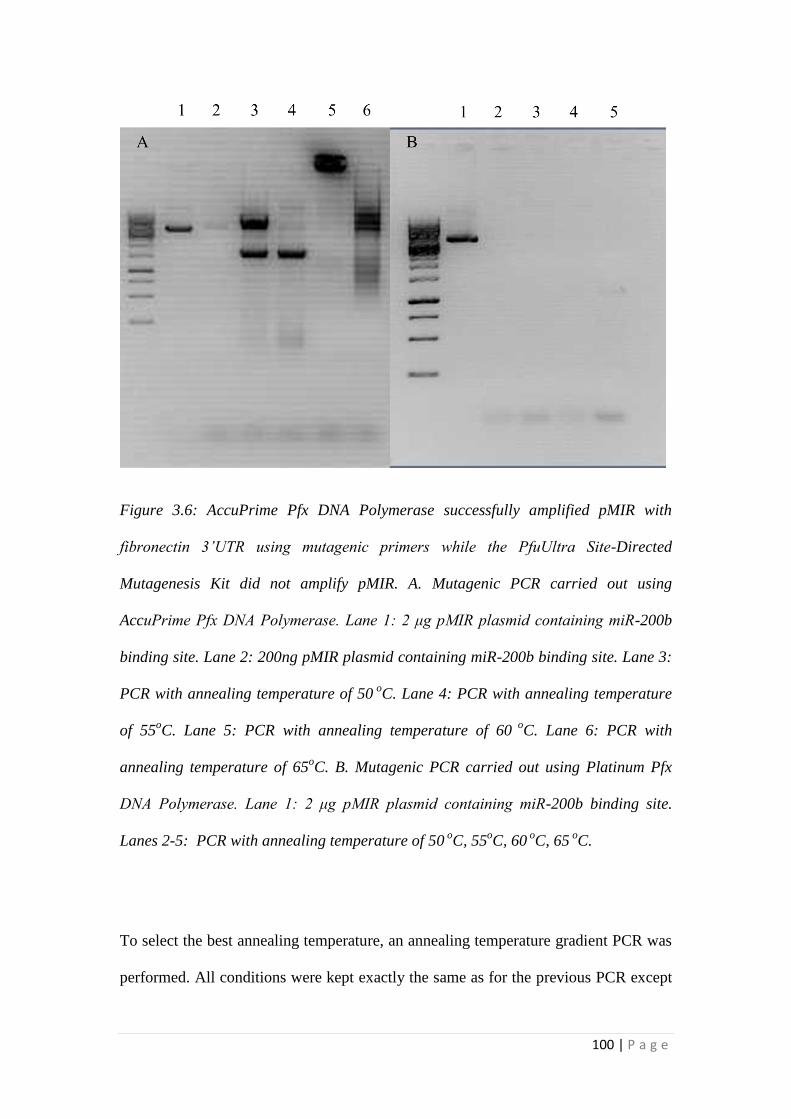
100 | P a g e
Figure 3.6: AccuPrime Pfx DNA Polymerase successfully amplified pMIR with
fibronectin 3’UTR using mutagenic primers while the PfuUltra Site-Directed
Mutagenesis Kit did not amplify pMIR. A. Mutagenic PCR carried out using
AccuPrime Pfx DNA Polymerase. Lane 1: 2 μg pMIR plasmid containing miR-200b
binding site. Lane 2: 200ng pMIR plasmid containing miR-200b binding site. Lane 3:
PCR with annealing temperature of 50 o
C. Lane 4: PCR with annealing temperature
of 55oC. Lane 5: PCR with annealing temperature of 60
oC. Lane 6: PCR with
annealing temperature of 65oC. B. Mutagenic PCR carried out using Platinum Pfx
DNA Polymerase. Lane 1: 2 μg pMIR plasmid containing miR-200b binding site.
Lanes 2-5: PCR with annealing temperature of 50 o
C, 55oC, 60
oC, 65
oC.
To select the best annealing temperature, an annealing temperature gradient PCR was
performed. All conditions were kept exactly the same as for the previous PCR except
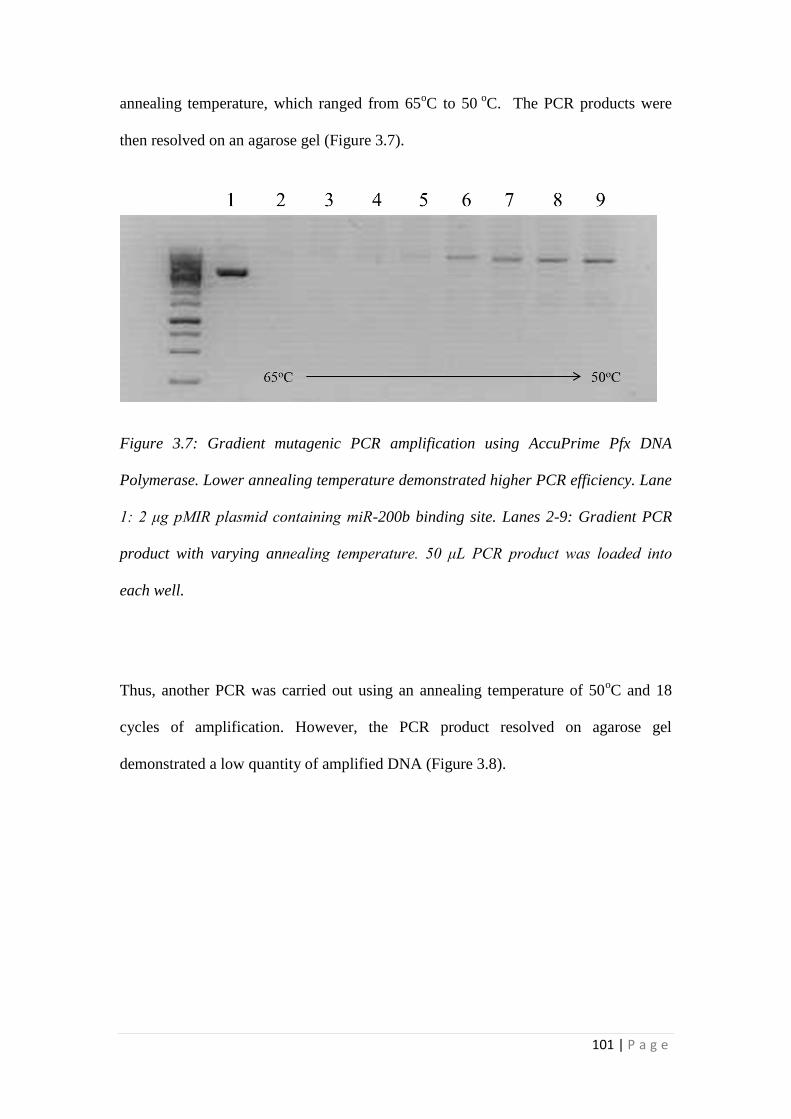
101 | P a g e
annealing temperature, which ranged from 65oC to 50
oC. The PCR products were
then resolved on an agarose gel (Figure 3.7).
Figure 3.7: Gradient mutagenic PCR amplification using AccuPrime Pfx DNA
Polymerase. Lower annealing temperature demonstrated higher PCR efficiency. Lane
1: 2 μg pMIR plasmid containing miR-200b binding site. Lanes 2-9: Gradient PCR
product with varying annealing temperature. 50 μL PCR product was loaded into
each well.
Thus, another PCR was carried out using an annealing temperature of 50oC and 18
cycles of amplification. However, the PCR product resolved on agarose gel
demonstrated a low quantity of amplified DNA (Figure 3.8).

102 | P a g e
Figure 3.8 18 cycles of amplification yielded a low quantity of DNA, which was
insufficient for transformation. Lanes 1 & 2: Product of mutagenic PCR. 50 μL PCR
product was loaded into each well.
PfuUltra II Fusion HS DNA Polymerase (Agilent Technologies, USA) was then used
to carry out the site-directed mutagenesis, as it had high PCR fidelity and robustly
amplified ‘difficult to amplify’ DNA fragments. To carry out the PCR using PfuUltra
II Fusion HS DNA Polymerase, 20 ng of plasmid containing the original miR-200b
binding site was mixed with 5 μL 10x reaction buffer, 1 μL of each mutagenic primer
(10mM), 1.25 μL dNTP mix (10 mM) 1 μL PfuUltraII Fusion HS DNA polymerase
and filled to 50 μL with water. PCR was then performed using the following thermo
profile:
1. Initial denaturation: 95 oC 2 min
2. 3 step cycling for 18 cycles
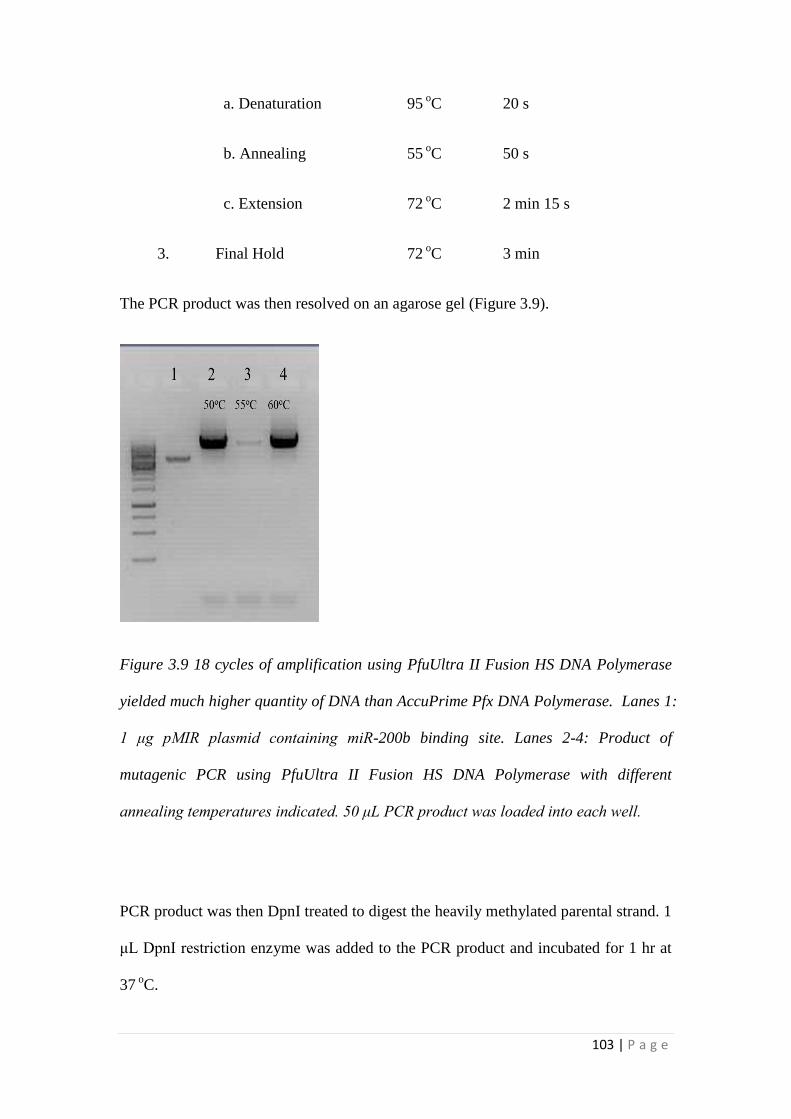
103 | P a g e
a. Denaturation 95 oC 20 s
b. Annealing 55 oC 50 s
c. Extension 72 oC 2 min 15 s
3. Final Hold 72 oC 3 min
The PCR product was then resolved on an agarose gel (Figure 3.9).
Figure 3.9 18 cycles of amplification using PfuUltra II Fusion HS DNA Polymerase
yielded much higher quantity of DNA than AccuPrime Pfx DNA Polymerase. Lanes 1:
1 μg pMIR plasmid containing miR-200b binding site. Lanes 2-4: Product of
mutagenic PCR using PfuUltra II Fusion HS DNA Polymerase with different
annealing temperatures indicated. 50 μL PCR product was loaded into each well.
PCR product was then DpnI treated to digest the heavily methylated parental strand. 1
μL DpnI restriction enzyme was added to the PCR product and incubated for 1 hr at
37 oC.
104 | P a g e
To achieve maximum transformation efficiency due to the low amounts of DNA, the
DpnI treated PCR product was crudely purified and concentrated by mixing with 500
μL 1-butanol before vortexing for 10 s. The mixture was then centrifuged at 12,000
rpm for 10 min to precipitate DNA, which was then resuspended in 10 μL water. 5 μL
of the concentrated DNA was added to 50 μL ElectroCompotent cells in a chilled
electro-cuvette (Bio-Rad, USA) and electrically shocked to transfer the DNA into the
competent cells. 500 μL SOC media was used to resuspend the cells, which were then
incubated for 1 hr at 37 o
C on a shaker rotating at 225 rpm. Cells were then plated
onto an agar plate containing 100 μg/mL ampicillin and incubated at 37 oC overnight.
100+ colonies were observed and 3 colonies were picked, minipreped and sent for
sequencing using either of the following primers depending on the direction of
sequencing desired.
pMIR-MCS-F: 5’-CCAACACACAGATCCAATGAA-3’
pMIR-MCS-R: 5’-CCTCATAAAGGCCAAGAAGG-3’
For sequencing, 800 ng of plasmid DNA was mixed with 1 μL sequencing primer (10
μM) and filled up to 12 μL with water. Samples were then sent to Australian Genome
Research Facility (AGRF) for sequencing. The sequencing results were analysed
using FinchTV (PerkinElmer, USA) and BLAST against the original sequence to
assess if the mutagenesis was successful. 2 of the 3 of the colonies picked contained
the mutation.

105 | P a g e
3.3 RESULTS
3.3.1 miRNA-200b over-expression suppressed TGFβ1 -induced EMT and
fibrotic responses of HK-2 cells
To examine the role of miRNA-200b on TGFβ1-induced EMT of kidney proximal
tubular cells, HK-2 cells were transfected with miRNA-200b or nonspecific miRNA,
and 16hrs later were incubated with or without TGFβ1 for 48 hours. As shown in
Figure 3.10, transfection of mature miRNA-200b increased miRNA-200b level 150
fold in HK-2 cells measured by quantitative real-time PCR. HK-2 cells under control
conditions (Panel A) showed a typical epithelial cuboidal shape with a cobble stone
morphology, whereas HK-2 cells transfected with non-specific miRNA in the
presence of TGFβ1 (Panel B) appeared elongated and spindle shaped, indicating a
typical morphological change of EMT. However HK-2 cells transfected with
miRNA-200b (Panel C) retained epithelial cell morphology (Figure 3.11).
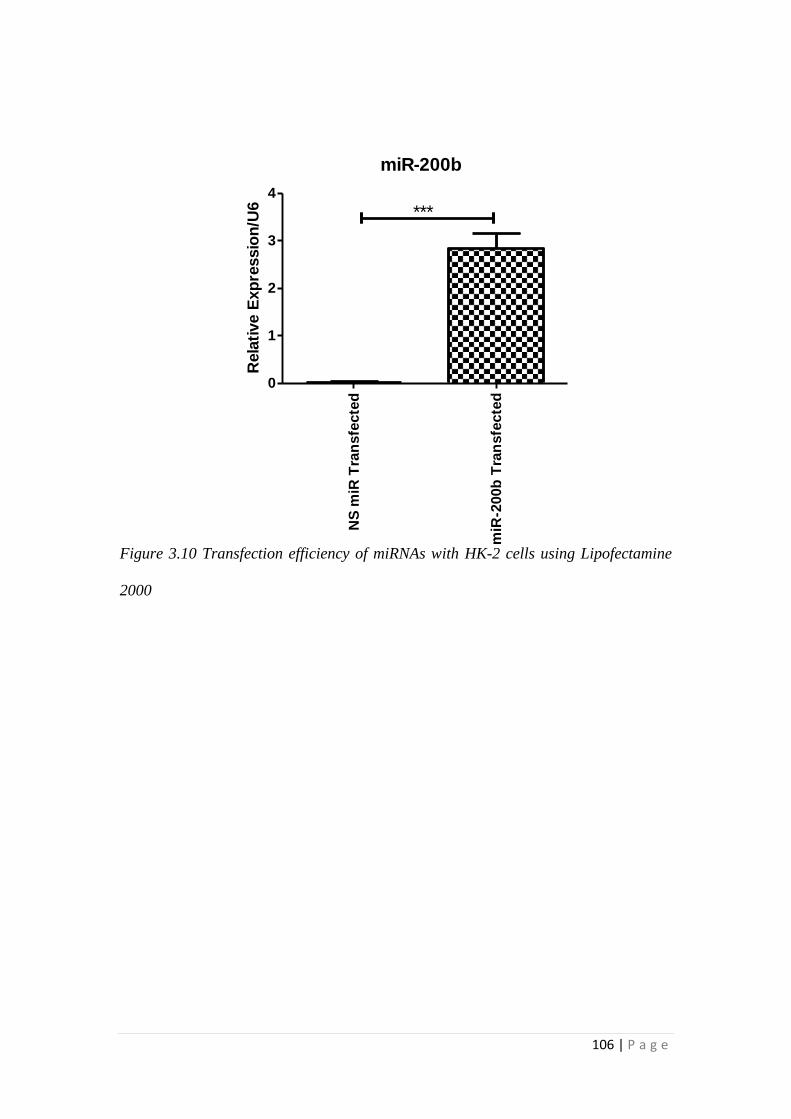
106 | P a g e
Figure 3.10 Transfection efficiency of miRNAs with HK-2 cells using Lipofectamine
2000
miR-200b
NS
miR
Tra
nsfe
cte
d
miR
-200b
Tra
nsfe
cte
d
0
1
2
3
4
***
Rela
tive E
xp
ressio
n/U
6

107 | P a g e
Figure 3.11 HK-2 cells maintained epithelial cell characteristics when transfected
with miR-200b and treated with TGFβ1.
To further confirm the effect of miRNA-200b on TGFβ1-induced EMT, E-Cadherin
expression was examined. MiRNA-200b increased E-Cadherin mRNA by 17 fold
compared to cells transfected with non-specific miRNA in the presence of 0.5ng/mL
TGFβ1 (Figure 3.12A) (P<0.01). The protein level of E-Cadherin was also increased
5 fold (P<0.05) in miRNA-200b transfected cells compared to non-specific miRNA,
showing a similar pattern of change induced by TGFβ1 and miRNA-200b (Figure
3.12B).
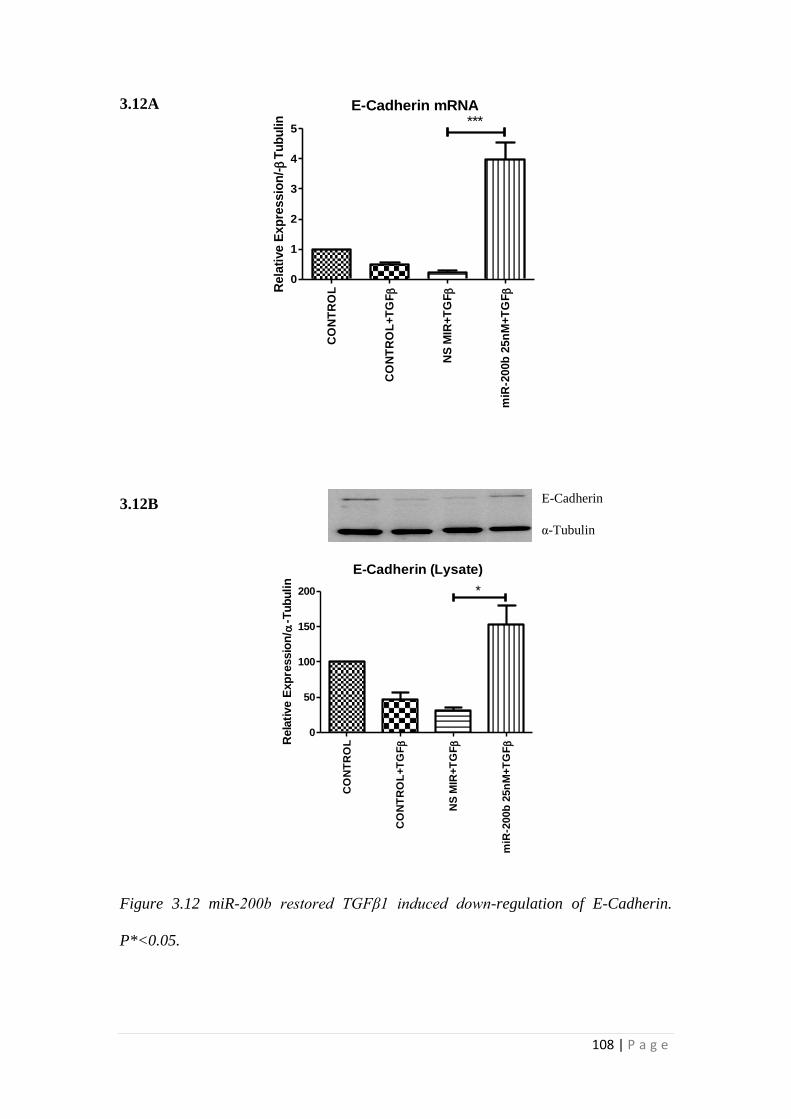
108 | P a g e
3.12A
3.12B
Figure 3.12 miR-200b restored TGFβ1 induced down-regulation of E-Cadherin.
P*<0.05.
E-Cadherin
α-Tubulin
E-Cadherin mRNA
CO
NT
RO
L C
ON
TR
OL
+T
GF
N
S M
IR+T
GF
m
iR-2
00b
25n
M+T
GF
0
1
2
3
4
5 ***
Rela
tive E
xp
ressio
n/-
Tu
bu
lin
E-Cadherin (Lysate)
CO
NT
RO
L C
ON
TR
OL
+T
GF
N
S M
IR+T
GF
m
iR-2
00b
25n
M+T
GF
0
50
100
150
200 *
Rela
tive E
xp
ressio
n/
-Tu
bu
lin

109 | P a g e
The expression of transcription factors ZEB1 and ZEB2 were then measured.
MiRNA-200b reduced ZEB1 by 1.7 fold (P<0.05) and ZEB2 by 1.4 fold (P<0.05)
(Figure 3.13A & 3.13B) in the presence of TGFβ1 confirming the protective role of
miRNA-200b against EMT.
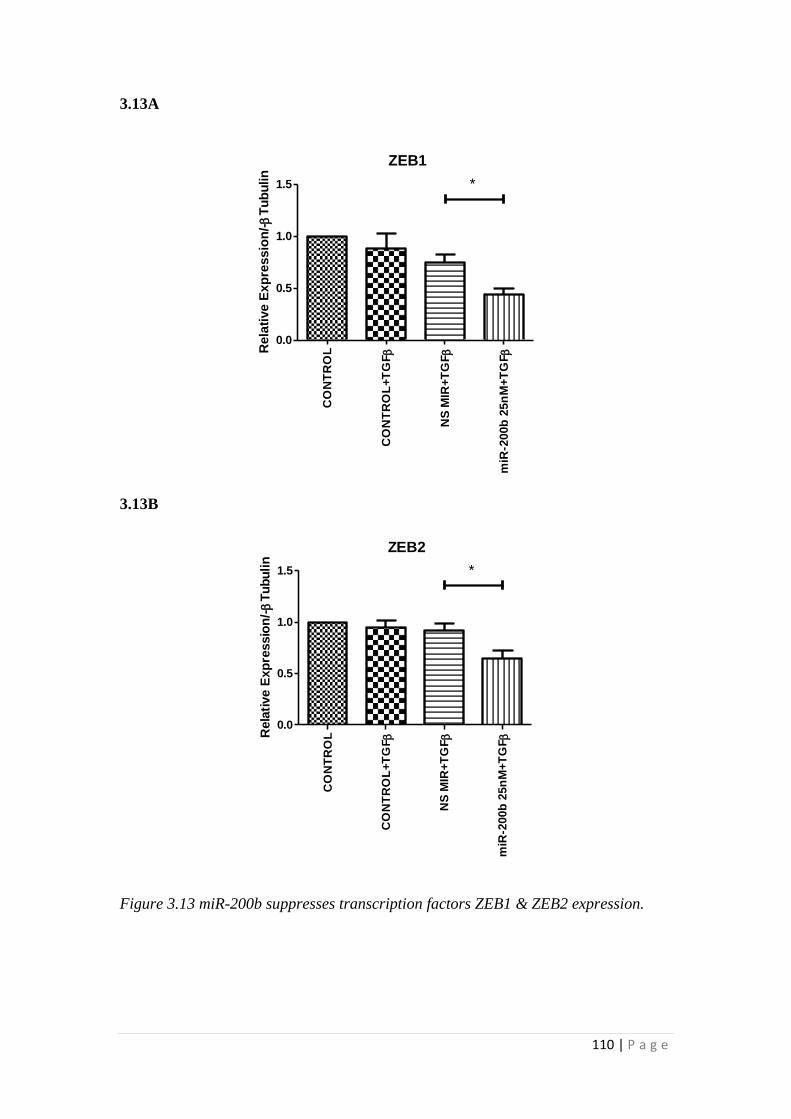
110 | P a g e
3.13A
3.13B
Figure 3.13 miR-200b suppresses transcription factors ZEB1 & ZEB2 expression.
ZEB1
CO
NT
RO
L C
ON
TR
OL
+T
GF
N
S M
IR+T
GF
m
iR-2
00b
25n
M+T
GF
0.0
0.5
1.0
1.5 *
Rela
tive E
xp
ressio
n/-
Tu
bu
lin
ZEB2
CO
NT
RO
L C
ON
TR
OL
+T
GF
N
S M
IR+T
GF
m
iR-2
00b
25n
M+T
GF
0.0
0.5
1.0
1.5 *
Rela
tive E
xp
ressio
n/-
Tu
bu
lin
111 | P a g e
As fibronectin is a key extracellular matrix protein and cells induced to EMT by
TGFβ1 are major producers of fibronectin, the effect of miRNA-200b on TGFβ1-
induced fibronectin was examined. TGFβ1 significantly increased both mRNA (2
fold, P<0.05) (Figure 3.14A) and protein (2.5 fold, P<0.05) (Figure 3.14A B) levels
of fibronectin in HK-2 cells compared to control (P<0.01) but the stimulatory action
of TGFβ1 on fibronectin was reversed in cells transfected with miRNA-200b
compared to cells exposed to non-specific miRNA (2.5 fold reduction in mRNA
(P<0.001) and 5 fold reduction in protein level (P<0.05)). Secreted fibronectin was
also found to be reduced 9 fold (P<0.0001) by miRNA-200b in the presence of
TGFβ1 when compared to non-specific miRNA (Figure 3.14AC). Other extracellular
matrix proteins such as COL1A1 (p<0.001), COL3A1 (p<0.001) and COL4A1
(p<0.001) were also reduced at least 2 fold by miR-200b in the presence of TGFβ1.
Unexpectedly, PAI-I mRNA was found to be increased 2.5 fold by miRNA-200b
compared to non-specific miRNA when exposed to TGFβ1 (Figure 3.15).

112 | P a g e
3.14A
3.14B 3.14C
Figure 3.14 miR-200b reduced fibronectin level in the presence of TGFβ1.
Fibronectin
α-Tubulin Fibronectin
FN mRNA
Co
ntr
ol
Co
ntr
ol+
TG
F
N
S m
iR+
TG
F
m
iR-2
00
b+
TG
F
0
1
2
3
4
5 **
**
Rela
tive E
xp
ressio
n/-
Tu
bu
lin
FN (cell lysate)
Co
ntr
ol
Co
ntr
ol+
TG
F
N
S m
iR+T
GF
m
iR-2
00b
+T
GF
0
100
200
300
400 *
**
Rela
tive E
xp
ressio
n/
-Tu
bu
lin
FN (supernatant)
Co
ntr
ol
Co
ntr
ol+
TG
F
N
S+T
GF
m
iR-2
00b
+T
GF
0
50
100
150
200
250***
Rela
tive E
xp
ressio
n/C
oo
massie
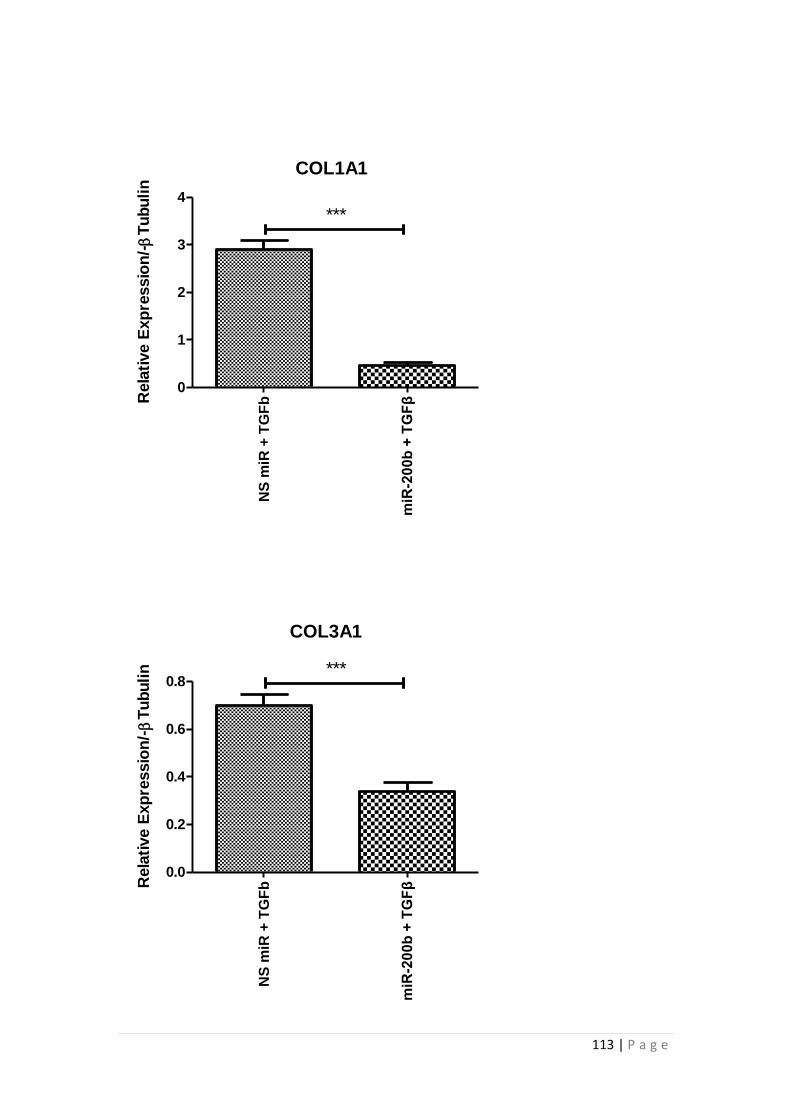
113 | P a g e
COL1A1
NS
miR
+ T
GF
b
miR
-20
0b
+ T
GF
β
0
1
2
3
4
***
Rela
tive E
xp
ressio
n/-
Tu
bu
lin
COL3A1
NS
miR
+ T
GF
b
miR
-20
0b
+ T
GF
β
0.0
0.2
0.4
0.6
0.8***
Rela
tive E
xp
ressio
n/-
Tu
bu
lin
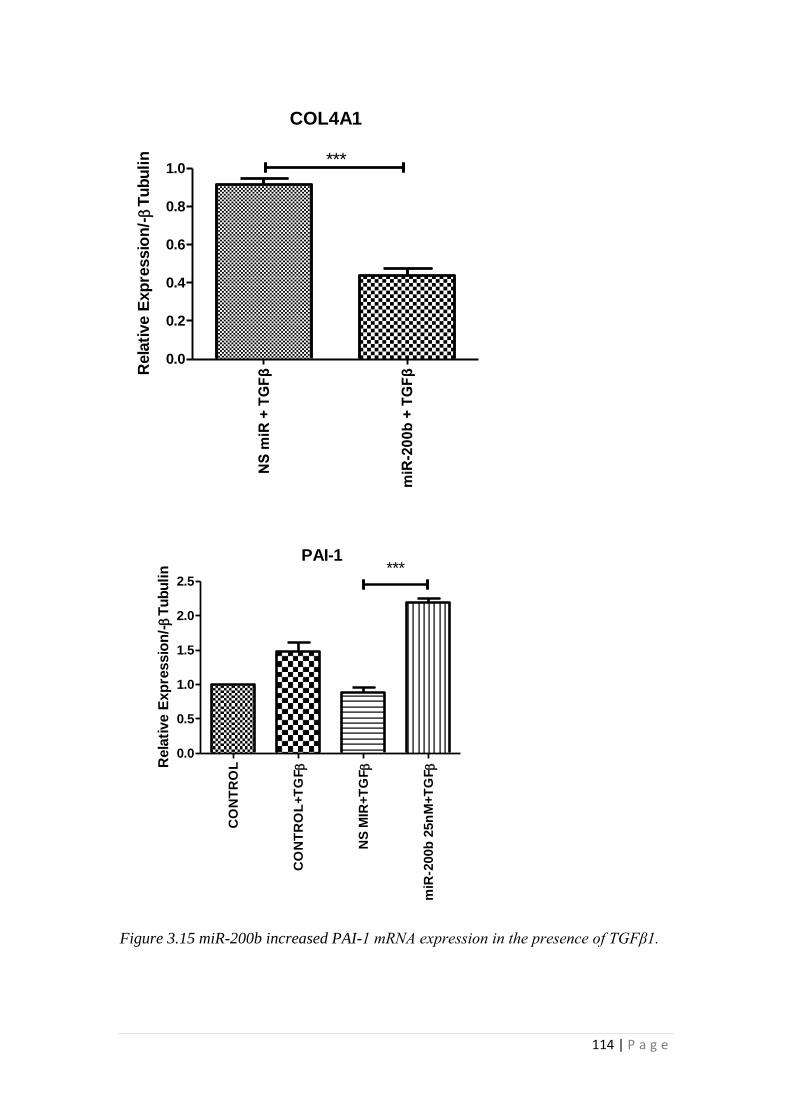
114 | P a g e
COL4A1
NS
miR
+ T
GF
β
miR
-20
0b
+ T
GF
β
0.0
0.2
0.4
0.6
0.8
1.0***
Rela
tive E
xp
ressio
n/-
Tu
bu
lin
Figure 3.15 miR-200b increased PAI-1 mRNA expression in the presence of TGFβ1.
PAI-1
CO
NT
RO
L C
ON
TR
OL
+T
GF
N
S M
IR+T
GF
m
iR-2
00b
25n
M+T
GF
0.0
0.5
1.0
1.5
2.0
2.5***
Rela
tive E
xp
ressio
n/-
Tu
bu
lin

115 | P a g e
The changes induced by miR-200b were correspondingly tested in the absence of
TGFβ1 to further confirm the results. Again, miR-200b significantly elevated the
expression of E-Cadherin and reduced the expression of fibronectin, COL4A1,
ZEB1 and ZEB2 in HK-2 cells compared to non-specific microRNA. COL1A1 and
COL3A1 mRNA appeared to be reduced after miR-200b transfection. However, this
did not reach statistical significance.
3.3.2 The effect of miRNA-200b over-expression on phosphorylation of SMAD
2 & 3 in HK-2 cells
To examine whether miRNA-200b modifies TGFβ1 induced fibronectin expression
through inhibition of SMAD signalling, phosphorylation of SMAD2 and SMAD3
were measured by Western blotting. As shown in Figure 3.16, over-expression of
miRNA-200b did not reduce the phosphorylation of SMAD 2 (Figure 3.16A) and
SMAD 3 (Figure 3.16B) compared to nonspecific miRNA transfection in the presence
of TGFβ1. Paradoxically miRNA-200b further increased the phosphorylation of
SMAD 2 by 1.9 fold (P>0.05).
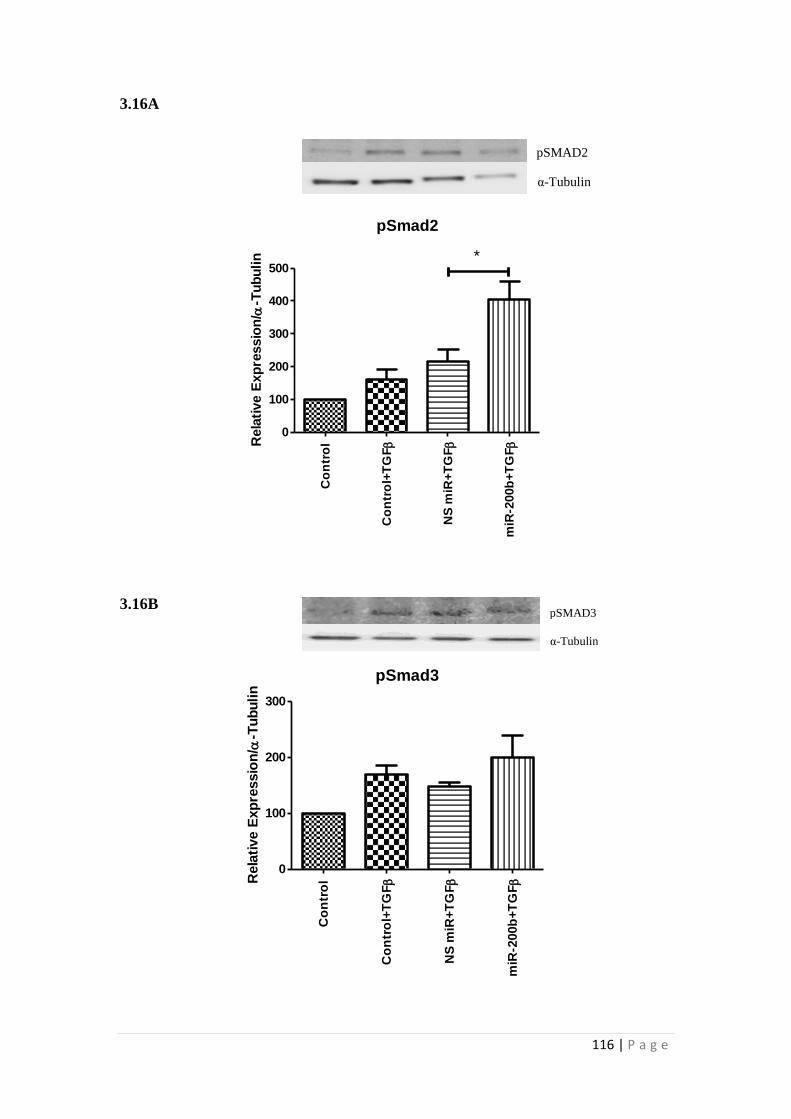
116 | P a g e
3.16A
3.16B
pSMAD2
α-Tubulin
pSMAD3
α-Tubulin
pSmad2
Co
ntr
ol
Co
ntr
ol+
TG
F
N
S m
iR+T
GF
m
iR-2
00b
+T
GF
0
100
200
300
400
500*
Rela
tive E
xp
ressio
n/
-Tu
bu
lin
pSmad3
Co
ntr
ol
Co
ntr
ol+
TG
F
N
S m
iR+
TG
F
m
iR-2
00b
+T
GF
0
100
200
300
Rela
tive E
xp
ressio
n/
-Tu
bu
lin
117 | P a g e
Figure 3.16 miR-200b did not suppress the SMAD signaling pathway activated by
TGFβ1.
3.3.3 The effect of miRNA-200b over-expression on non-SMAD signalling
pathways in HK-2 cells
To examine whether miRNA-200b reduces fibronectin through inhibition of non-
SMAD pathways, the phosphorylation of p38 and ERK1/2 were measured by Western
blotting. As shown in Fig.8, over-expression of miRNA-200b did not reduce the
phosphorylation of p38 (Figure 3.17A) and p42/44 (Figure 3.17B) compared to
nonspecific miRNA transfection in the presence of TGFβ1. In keeping with the
observed increase in phosphorylated SMAD expression, miRNA-200b unexpectedly
increased the phosphorylation of p38 and p42/44 MAPK.

118 | P a g e
3.17A
3.17B
Phospho-p38
α-Tubulin
Phospho-P42/44
α-Tubulin
pp38/Tubulin
Co
ntr
ol
Co
ntr
ol+
TG
F
N
S m
iR+T
GF
m
iR-2
00b
+T
GF
0
200
400
600
800 *
Rela
tive E
xp
ressio
n/
-Tu
bu
lin
pp42/Tubulin
Co
ntr
ol
Co
ntr
ol+
TG
F
N
S m
iR+
TG
F
m
iR-2
00b
+T
GF
0
200
400
600
800*
Rela
tive E
xp
ressio
n/
-Tu
bu
lin

119 | P a g e
Figure 3.17: miR-200b increased the phosphorylation of p38 and p42/44 MAPK.
3.3.4 miRNA-200b binds the 3’UTR of fibronectin (FN) mRNA thereby
suppressing fibronectin expression.
The data clearly demonstrate that miRNA-200b reduced TGFβ1-induced fibronectin
(Figure3.14) independent of TGFβ1 signalling pathways (Figure3.15-3.17). To
examine whether miRNA-200b suppresses the fibronectin gene promoter activity,
promoter reporter assays were conducted. As shown in Figure 3.18, nonspecific
miRNA or miRNA-200b was co-transfected with basal pGL3 or pGL3-FN luciferase
reporter plasmid and luciferase activity was measured 48hrs later. Overexpression of
miRNA-200b did not significantly reduce the promoter activity compared to
nonspecific miRNA transfection.

120 | P a g e
Figure 3.18 miR-200b did not significantly alter the promoter activity of fibronectin
gene.
We next explored the possibility of a direct targeting mechanism of miRNA-200b to
FN 3’UTR. In silicon searching predicted a possible binding site for miRNA-200b
on the 3’UTR of FN which had a 7-mer overlap. A 163bp fragment on FN 3’UTR
containing the putative miRNA-200b binding site was amplified and then cloned
into the 3’UTR position of the luciferase gene in pMIRNA reporter plasmid. A
control reporter plasmid, differing by only 4bp in the core miRNA-200b binding
region was also constructed using site directed mutagenesis. The reporter plasmids
were then co-transfected separately with 25nM miRNA-200b. Luciferase activity
FN promoter
Co
ntr
ol N
S
Co
nto
l m
iR-2
00b
FN
pro
mo
ter
NS
FN
pro
mo
ter
miR
-200b
0
1000
2000
3000
4000
5000
Fir
efl
y/R
en
illa
Lu
cif
era
se a
cti
vit
y
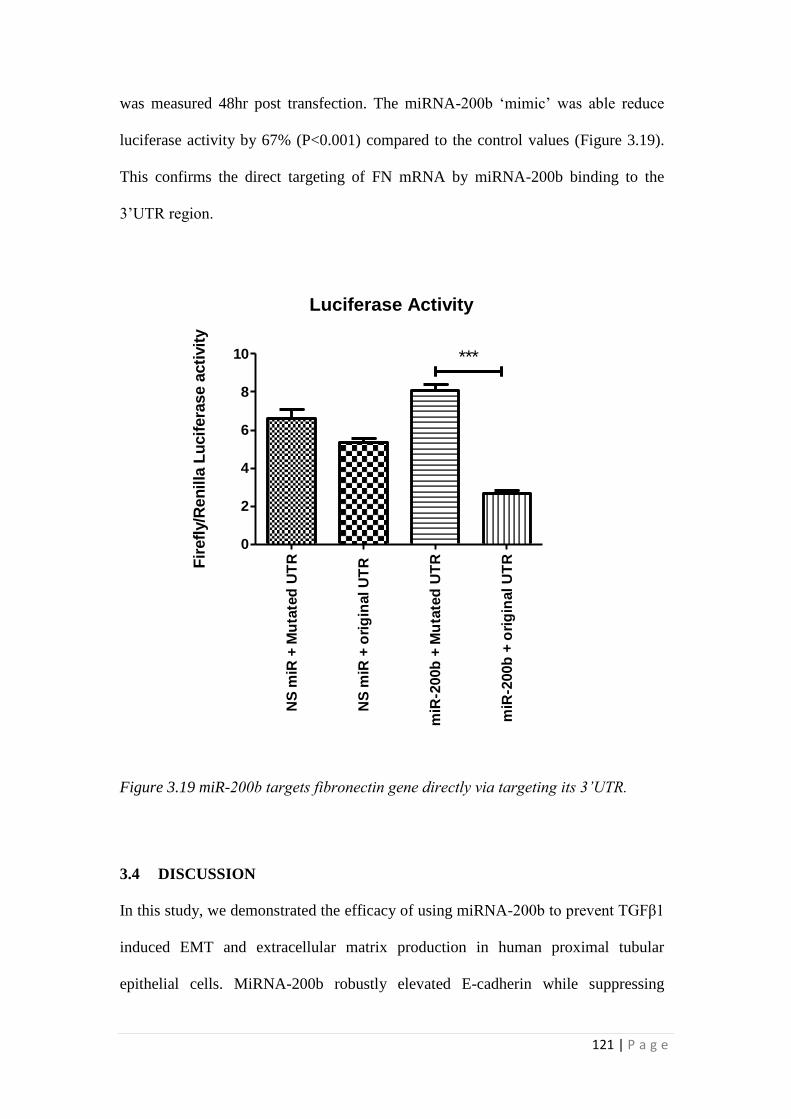
121 | P a g e
was measured 48hr post transfection. The miRNA-200b ‘mimic’ was able reduce
luciferase activity by 67% (P<0.001) compared to the control values (Figure 3.19).
This confirms the direct targeting of FN mRNA by miRNA-200b binding to the
3’UTR region.
Figure 3.19 miR-200b targets fibronectin gene directly via targeting its 3’UTR.
3.4 DISCUSSION
In this study, we demonstrated the efficacy of using miRNA-200b to prevent TGFβ1
induced EMT and extracellular matrix production in human proximal tubular
epithelial cells. MiRNA-200b robustly elevated E-cadherin while suppressing
Luciferase ActivityN
S m
iR +
Mu
tate
d U
TR
NS
miR
+ o
rig
inal U
TR
miR
-200b
+ M
uta
ted
UT
R
miR
-200b
+ o
rig
inal U
TR
0
2
4
6
8
10 ***
Fir
efl
y/R
en
illa
Lu
cif
era
se a
cti
vit
y
122 | P a g e
fibronectin and collagen expression. These studies further defined that mature
miRNA-200b was able to directly target the fibronectin mRNA 3’UTR region. Since
a significant reduction was observed in both mRNA and protein levels, it is more
likely miRNA-200b initiated mRNA degradation rather than translational repression
upon binding. These findings suggest miRNA-200b may modify the development of
tubular fibrosis and may provide therapeutic benefits in preventing progressive
kidney disease, independent of modification of classical TGFβ1 signalling pathways.
Interestingly and importantly, miRNA-200b did not reduce, and paradoxically
enhanced SMAD and MAPK signalling pathways downstream of TGFβ1 receptor
activation. It is well known that TGFβ1 modifies cellular function via downstream
signalling through SMAD (Qi et al., 2007) or non- SMAD pathways (Moustakas and
Heldin, 2005, 2009). It has been reported that SMAD 3 mediates TGFβ1 -induced
fibronectin expression in mesangial cells (Isono et al., 2002). Conversely a blocker
of ERK signalling, PD98059, blocks TGFβ1 -induced fibronectin expression in rat
glomerular mesangial cells (Inoki et al., 2000). It has also been reported that
selective inhibition of both SMAD 3 phosphorylation (SB-431542) and p38 MAPK
kinase phosphorylation (SB-203580 and SB-202190) inhibits TGFβ1-induced
fibronectin expression (Laping et al., 2002). Our findings of miRNA-200b
paradoxically stimulating downstream TGFβ1 signalling pathways are consistent
with the observed elevation in PAI-1 expression. PAI-1 has been shown robustly to
be linked to kidney fibrosis and activated by TGFβ1 and downstream SMAD
signalling pathways (Ghosh and Vaughan, 2012). Activation of PAI-1 blocks the
degradation of extracellular matrix proteins and thus the excessive deposition. These
data are consistent with miRNA-200b operating through a mechanism independent
of TGFβ1 signalling and yet regulating EMT and renal fibrosis.
123 | P a g e
EMT has recently been categorized into three subtypes (Wang et al., 2010a; Zeisberg
and Neilson, 2009): Type 1 in embryogenesis, Type 2 in epithelial or endothelial
cells transitioning to resident tissue fibroblasts and Type 3 in epithelial carcinoma
cells transitioning to metastatic tumour cells. Although the role of miRNA-200b in
cancer cell related Type 3 EMT has been well documented (Gregory et al., 2008a;
Gregory et al., 2008b; Park et al., 2008; Paterson et al., 2008), its role in renal
fibrosis related to Type 2 EMT has not been previously reported. Our findings
suggest that EMT is likely to be similarly regulated by miRNA-200b in Type 2 EMT,
as has been reported in Type 3 EMT. E-Cadherin is under the control of several
transcriptional repressors including ZEB1, ZEB2, which bind to E-boxes in the
promoter regions of E-Cadherin (Perez-Moreno et al., 2001; Thiery and Sleeman,
2006). E-Cadherin is an important determinant for the maintenance of the epithelial
phenotype, with its loss being an important early initiator of EMT. Two reports,
using luciferase gene assays where 3’UTR sequences of ZEB1 or ZEB2 gene were
cloned into the 3’UTR position of a luciferase gene (Gregory et al., 2008a; Park et
al., 2008) have identified ZEB1 and ZEB2 as direct targets of miRNA-200b. In PTP-
Pez over-expressing MDCK and 4TO7 Mammary Carcinoma Cell Line, miRNA-
200b inhibits the expression of the E-box-interacting transcription factors ZEB1 and
ZEB2 allowing enhanced E-Cad transcription (Bracken et al., 2008; Gregory et al.,
2008b; Korpal and Kang, 2008; Korpal et al., 2008). The miRNA-200 families have
also been shown to prevent EMT in response to TGFβ1 in PTP-Pez stably
transfected MDCK (Gregory et al., 2008a). Hence our findings of increased E-
cadherin and reversal of morphological changes of EMT in association with
reduction in ZEB1 and ZEB2 expression in the presence of miRNA-200b are
consistent with these findings.

124 | P a g e
As the gene promoter activity generally determines the transcription efficiency, we
examined whether miRNA-200b reduces fibronectin expression through inhibition
of its promoter activity, using promoter reporter assays. However, miRNA-200b did
not reduce the promoter activity of fibronectin in kidney proximal tubular cells
compared to non-specific miRNAs. MiRNAs target mRNA transcripts and suppress
their expression by either translational repression or mRNA degradation. Several
articles have demonstrated direct mRNA targeting and suppression by miRNAs in
kidney cells (Bartel, 2009; Carthew and Sontheimer, 2009; Kim et al., 2009). For
example, miRNA-192 and miRNA-200b were shown to directly target ZEB2 and
ZEB1 respectively in mesangial cells (Kato et al., 2011; Kato et al., 2007). MiRNA
target scanning indicated that 3’UTR of fibronectin is a potential target of miRNA-
200b. We confirmed that miRNA-200b directly targets the 3’UTR of fibronectin
leading to instability of the mRNA and/or inhibition of protein translation, which are
well documented consequences of miRNA (Bartel, 2009; Carthew and Sontheimer,
2009).
Recently, it was reported that the miR-29 family is able to target collagen expression
via direct targeting of their 3’UTR (Wang et al., 2012b). Once more, reduction in
collagens and increases in TGFβ signalling suggested a miRNA network where miR-
200b may promote the expression of miR-29 family and subsequent inhibition of
collagen expression.
The regulation of fibronectin protein expression in kidney disease is important, not
only because of the direct effect of ECM protein accumulation on renal interstitial
fibrosis, but also because fibronectin, in particular, is actively involved in both

125 | P a g e
cellular and extracellular signalling pathways, acting as a ligand for signalling
pathways that lead to fibrosis (Wight and Potter-Perigo, 2011). Hence, targeting
components of the extracellular matrix to limit fibrosis and direct the wound-healing
process toward reestablishment of a healthy equilibrium (Frantz et al., 2010) is likely
to be critically important.
126 | P a g e
4 Chapter 4 In vivo expression of miR-200b and its role in obstructive
nephropathy
4.1 Specific Background and Aims
In Chapter3, the role of miR-200b in in vitro models of renal fibrogenesis was
described. It was found that miR-200b was able to prevent TGFβ induced proximal
tubular cell epithelial to mesenchymal transition, as well as elevation of extracellular
matrix proteins. However, the roles of miR-200b in preventing tubule-interstitial
fibrosis in “in vivo” models still need to be elucidated. Thus, this project was
designed to study the effects of systemic over-expression of miR-200b in kidney
fibrosis, developed as a consequence of obstructive nephropathy.
In order to achieve over-expression of miR-200b in the kidney of mice, lentivirus
mediated gene transfer was used. Plasmid containing pre-miR-200b was packaged
into lentivirus before being transferred via tail vein injection into mice to induce
systemic infection. Upon infection, lentivirus inserts the copy of pre-miR-200b driven
by the CMV promoter into the genome of the infected cell, leading to persistent
expression of miR-200b.
UUO is one of the most commonly used animal models to study the pathophysiology
of renal fibrosis (Dendooven et al., 2011). Hydrostatic pressure induced by this
technique results in marked renal hemodynamic and metabolic changes that promote
tubular injury, cell apoptosis and necrosis and interstitial macrophage infiltration.
Interstitial fibroblast proliferation and myofibroblast transformation leads to the
excessive deposition of ECM and causes progressive loss of the functional renal
parenchyma (Cachat et al., 2003; Chevalier et al., 2009a; Dendooven et al., 2011;
Schreiner et al., 1988; Sharma et al., 1993; Vaughan et al., 2004). This technique was
127 | P a g e
used in this study to induce progressive renal fibrosis in experimental animals, which
has common features in all models of nephropathy, including diabetic nephropathy
(Chevalier et al., 2009a; Dendooven et al., 2011; Kanwar et al., 2011).
The specific aims were
1. To evaluate the effectiveness of miR-200b in preventing molecular and
histological evidence of fibrosis in C57BL/6 mice with ureteric obstruction.
2. To evaluate the role of miR-200b in preventing EMT in C57BL/6 mice with
ureteric obstruction.
3. To evaluate the efficacy of different systems in delivering miRNA to the
kidney.

128 | P a g e
4.2 Specific Materials and Methods
4.2.1 Viral Packaging
Plasmid containing pre-miR-200b (pCDH-CMV-miR-200b-EF1-RFP) was co-
transfected with packaging plasmids into HEK293T cells. The packaging plasmids
consist of three individual plasmids that encode all the necessary proteins to produce
lentivirus. The supernatant containing lentivirus was then harvested, purified and
concentrated before tail vein injection into mice.
Specifically, 4.5 million HEK293T cells were seeded into a T75 tissue culture flask
(Nunc, USA) 18 hr before transfection in the presence of 13.5 mL DMEM with high
glucose (4.5 g/mL) supplemented with 10% foetal calf serum (FCS) (The complete
formulation can be found at
http://www.invitrogen.com/site/us/en/home/support/Product-Technical-
Resources/media_formulation.45.html). Prior to transfection, 11.25 μg pPACKH1
HIV lentivector packaging plasmid (SBI, USA) and 2.25 μg pCDH-CMV-miR-200b-
EF1-RFP were diluted in 1.35 mL Opti-MEM reduced serum medium (Life
Technologies, USA) before the addition of 27 μL X-tremeGENE HP DNA
Transfection Reagent. The mixture was incubated at room temperature for 15-20 min
to form the transfection complex. 1.35 mL transfection complex was then added in a
drop wise manner to HEK293T cells in the T75 tissue culture flask. 48 hr post
transfection, supernatant containing packaged lentivirus was removed and 10 mL
fresh DMEM (4.5 g/mL D-glucose, 10% FCS) was added. The removed supernatant
was centrifuged at 2500 rpm for 5 min to remove cell debris before the addition of ¼
volumes of the 5x PEG-it virus precipitation solution (SBI, USA). The mixture was
then incubated overnight at 4oC and then centrifuged at 1500 g for 30 min to
precipitate the lentivirus. The precipitated virus was resuspended in 1/40 original
129 | P a g e
volume (of supernatant) in sterile PBS. A second collection of supernatant was
performed 24 hr after the addition of medium. The collected supernatant was purified,
concentrated, resuspended in PBS and combined with the first collection.
4.2.2 Viral Titre Determination
4.2.2.1 Transduction of Cells
HK-2 cells were seeded at 2.5x10⁵ per well in a 6-well plate 24 hr before lentiviral
transduction. On the day of transduction, 2 mL 10-fold serial dilution over a range of
1x10⁻²
to 1x10⁻⁶
was prepared and 1 mL of each lentiviral dilution was added to each
well of the 6-well plates. The cells were incubated at 37oC for 48 hr with 5% CO2
before being subjected to flow cytometry.
The viral titre was calculated using the formula:
Titre = ((F × Cn) /V) × DF
F: The frequency of RFP-positive cells determined by flow cytometry;
Cn: The total number of target cells infected.
V: The volume of the inoculum.
DF: The virus dilution factor.
130 | P a g e
4.2.2.2 Flow Cytometry Analysis
Cells were exposed to 1 mL TrypLE Express (Life Technologies, USA) to detach
from culturing vessel and neutralised with 2 mL DMEM supplemented with 10% FCS.
The cells were then pelleted and washed twice with 2 mL ice-cold PBS before being
analysed by flow cytometry for red fluorescent protein (RFP) expression.
4.2.3 Lentivirus Delivery to Mice
All animal work was carried out with the approval of the Royal North Shore Hospital
Animal Care and Ethics Committee (ACEC application number: 1203-008A).
C57BL/6J mice were obtained from the Kearns Animal Facility and were allowed to
acclimatise before being subjected to experimentation. 5x10⁶
pseudo-lentivirus,
containing either non-specific control sequences or miR-200b, were injected into each
mouse via the tail vein under anaesthesia using 2% isoflurane gas (mixed with 1 part
oxygen, 2 parts nitrogen). The RFP co-expressed was detected by In-Vivo FX PRO in
vivo imaging machine (Carestream, NY, USA) to visualise the distribution and
relative intensity of lentiviral transduction. A second injection with equal amount of
lentiviral particles as the first injection was carried out 48 hrs after the first injection
to boost the transduction.
4.2.4 Unilateral Ureteral Obstruction
48 hr post lentivirus injection, mice (n=7) were anaesthetised with 2% isoflurane gas
(mixed with 1 part oxygen, 2 parts nitrogen) inhalation and immobilised onto a
surgical pad. The left or right lateral flank (renal angle) was shaved and cleaned using
isopropyl alcohol wipes.
131 | P a g e
An incision (1-2 cm) was made by a scalpel to expose the kidney. The left ureter was
then ligated at two points with surgical silk line. The incision point was subsequently
sutured using a surgical silk line and cleaned using isopropyl alcohol wipe. The mice
were given analgesia (Buprenorphine 0.03 – 0.05 mg/kg IP) for pain induced by
surgery.
5 days post operation, mice were sacrificed by pericardiectomy under 2% isoflurane
anaesthetic and organs including the obstructed and unobstructed kidneys, lungs, heart
and liver from both non-specific miR and miR-200b lentivirus transduced mice were
harvested. Blood was also collected.
4.2.5 Total RNA Extraction
Both mRNA and miRNA were extracted from mouse kidney, lung, heart and liver
tissue using Qiagen miRNeasyMini Kit (Qiagen, USA). About 25 mg tissue was cut
from frozen kidney cortex on dry ice and placed in a 2 mL eppendorf tube with 2
tungsten carbide beads (3 mm diameter) (Qiagen, USA) and 700 µL QIAzol Lysis
Reagent. The mixture was then homogenised on a Retsch MM301mixer (Retsch,
Germany) at 1000 oscillations per minute for 3 min. Tungsten carbide beads were
removed and homogenised solution was incubated at room temperature for 5 min
before the addition of 140 μL chloroform. Mixture was thoroughly mixed for 15 s and
incubated at room temperature for a further 3 min before centrifugation at 12,000 g
for 15 min at 4oC. 350 μL of the upper aqueous phase was transfer to a fresh tube and
mixed with 525 μL 100% ethanol. 700 μL of the mixed sample was loaded onto an
RNeasyMini spin column and centrifuged at 10,000g for 15s. Flow through was
discarded and the column was washed once with buffer RWT, and twice with buffer

132 | P a g e
RPE. Columns were dried by centrifugation at 10,000 g for 2 mins and total RNA was
eluted with 50 μL RNAse free water.
133 | P a g e
4.3 Results
4.3.1 Packaging efficiency
The vector used for miR-200b delivery also contained RFP gene and thus transfection
efficiency could be conveniently checked by the fluorescence emitted by RFP. Cells
were examined under fluorescent microscope for RFP expression (Excitation at 560
nm and emission at 593 nm).
4.3.2 Lentiviral Transduction
5 μL concentrated lentivirus (1:40) was used to transduce HEK293T cells in a T75
tissue culture flask to confirm the infectivity of lentivirus packaged before titering.
Lentivirus successfully transduced HEK293T cells (Figure. 4.1) and thus were
subjected to titering.

134 | P a g e
Figure 4.1 HEK293T cells express RFP 48 hr after lentivirus transduction. HEK293T
cells were seeded at approximately 2x10⁶
cells per T75 tissue culture flask 24 hr
before transduction. 5μL concentrated lentivirus (1:40) were used to transduce
HEK293T cells in one tissue culture flask. The cells were observed under florescent
microscope 48 hr post lentiviral transduction for RFP expression.
4.3.3 Animal welfare during experiment
The animals subjected to this experiment were closely monitored for any signs of
stress. Specific monitoring items include signs of dehydration, sunken face, diarrhoea,
pilo erection, arching back, weakness and surgical wound inspection. No signs of
adverse effects were observed during and after the 2 lentiviral injections. Signs of
135 | P a g e
fatigue and weakness were observed immediately after the surgery to induce UUO.
However, they resolved within 3 post-operative days.
4.3.4 Viral Integration in vivo-Preliminary Study
In a preliminary experiment, one of the two mice was injected with approximately 10
million lentiviral particles, while the other served as control. Both mice were
sacrificed and imaged 5 days post-injection. Total body imaging showed no
noticeable fluorescence (Figure 4.2). However, when removed from body and imaged
ex vivo, the liver demonstrated the most significant amount of fluorescence (Figure
4.3). RNA was extracted from liver and kidney sample for detection of RFP mRNA.
The lack of detection of fluorescence using whole body imaging was considered to be
due to the level of RFP expressed and the autofluorescence observed from the fur.
The result showed strong expression of RFP in both liver and kidney in the mouse
injected with lentivirus (Figure 4.4). Hence proof of concept was confirmed.

136 | P a g e
Figure 4.2 Total body imaging of mice for RFP detection. The mouse injected with
control lentivirus was on the left hand side while the one injected with miR-200b
lentivirus was on the right hand side. Stripes showed high fluorescence in the middle
are tapes used to immobilise the mice.
Control Mouse
Lentivirus
Injected Mouse
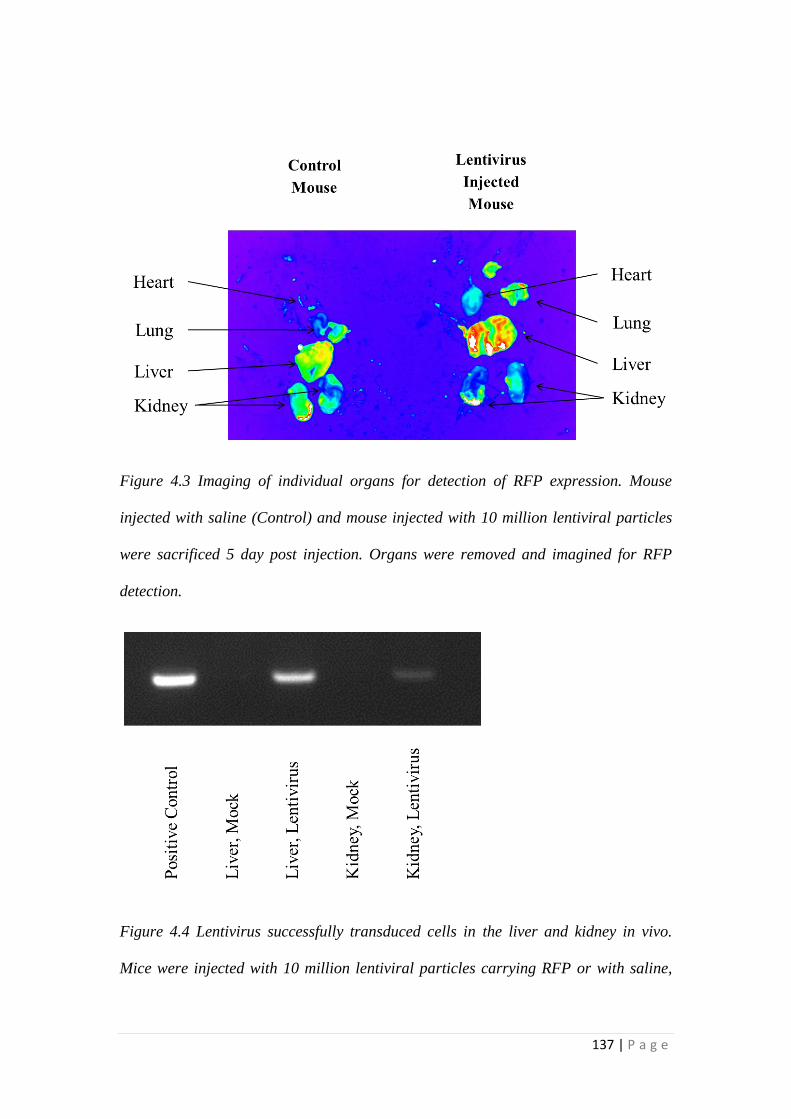
137 | P a g e
Figure 4.3 Imaging of individual organs for detection of RFP expression. Mouse
injected with saline (Control) and mouse injected with 10 million lentiviral particles
were sacrificed 5 day post injection. Organs were removed and imagined for RFP
detection.
Figure 4.4 Lentivirus successfully transduced cells in the liver and kidney in vivo.
Mice were injected with 10 million lentiviral particles carrying RFP or with saline,

138 | P a g e
which served as a mock control. Liver and renal cortex were harvested and analysed
for RFP expression (PCR).
4.3.5 Further study – miR-200b Transduction
After optimisation of the lentivirus injection, a further study aiming to evaluate the
role of miR-200b in preventing renal fibrosis in vivo was carried out. 7 mice were
divided into two groups, namely, non-specific miRNA control group (4 mice) and
miR-200b transduction group (3 mice) and subjected to lentivirus injection. All mice
demonstrated RFP mRNA expression and thus viral integration into genome (Figure
4.5). However, 2 of the 3 mice injected with miR-200b containing lentivirus had very
low expression of RFP.
Figure 4.5 RFP expression in renal cortex of mice injected with lentivirus. Each
mouse was injected with 2 x 5 million lentiviral particles. UUO was performed 24 hr
after the second injection. RFP was amplified using conventional semi-quantitative
PCR and resolved on 1% agarose gel. All mice demonstrated RFP expression in the

139 | P a g e
kidney. Positive control: PCR amplified from RFP containing plasmid. Negative
control: water, Control mouse: mice injected with lentiviral vectors carrying non-
specific sequence, miR-200 O/E mouse: mice injected with lentiviral vectors carrying
mir-200b sequence.
4.3.6 miR-200b reduced ECM and EMT markers
4.3.6.1 PCR Analysis
Several fibrotic markers were tested using real-time PCR to evaluate the reno-
protective effects of miR-200b in vivo. UUO itself induced significant changes in all
genes tested when compared to the control kidney (Figure 4.5). No apparent changes
were detected when comparing non-specific miR transduced group and miR-200b
transduced group in the ligated kidney (Figure 4.6A). However, the low level of
expression of RFP in two of the experimental animals transduced with miR-200b may
have masked the effects of miR-200b. Thus, result was analysed again by comparing
the control mice samples to the high RFP expressing mouse sample transduced with
miR-200b (Figure 4.6B). Data indicated that miR-200b may lower COL1, COL3 and
fibronectin as observed in the in vitro model, while αSMA and vimentin were also
slightly decreased. However, more biological repeats are required to validate the
changes.

140 | P a g e
A
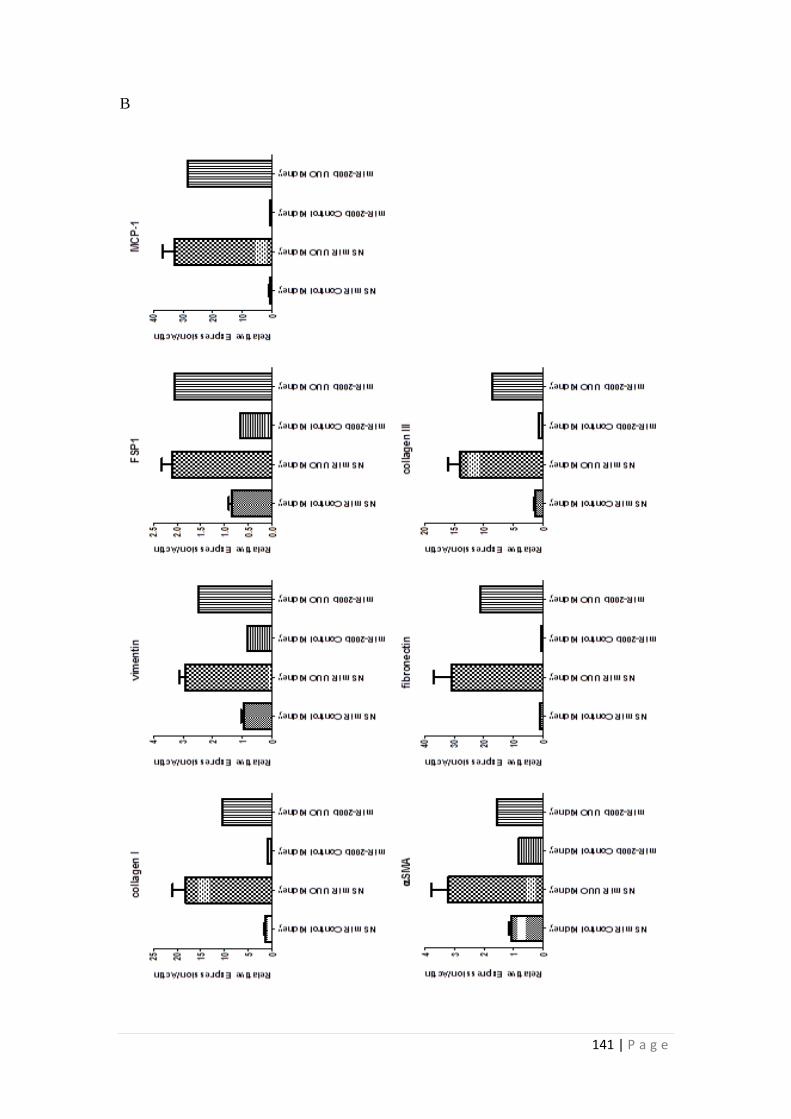
141 | P a g e
B
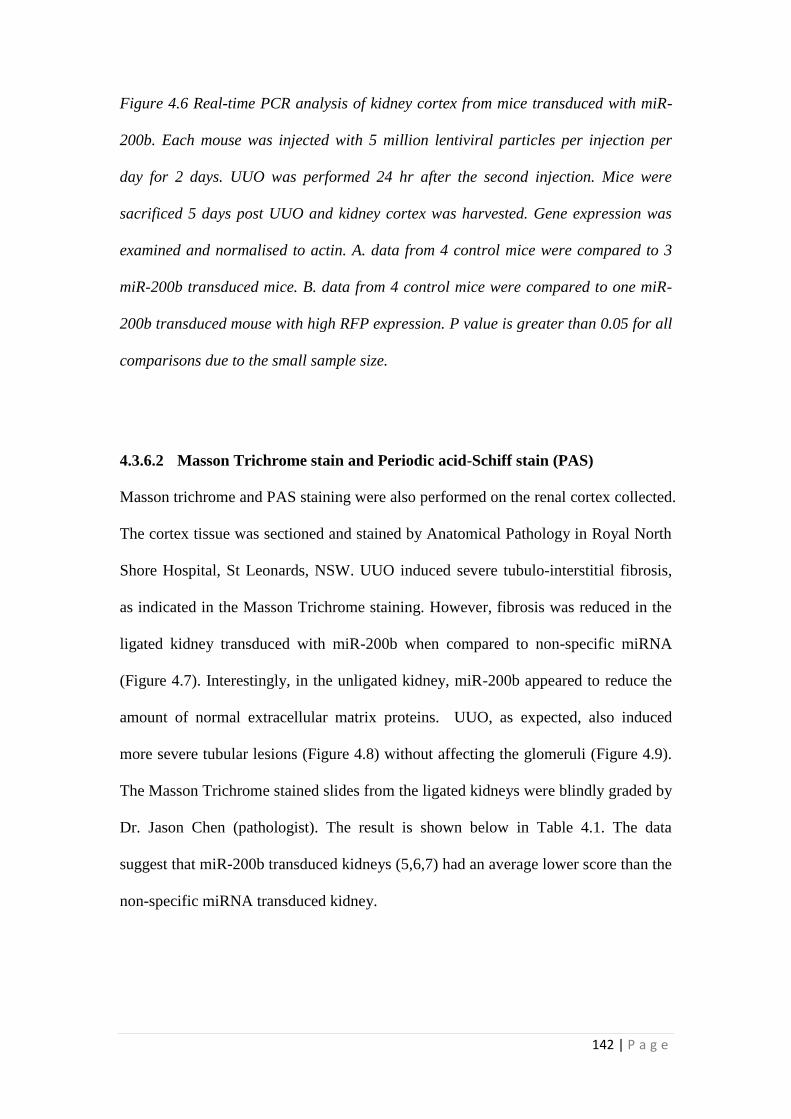
142 | P a g e
Figure 4.6 Real-time PCR analysis of kidney cortex from mice transduced with miR-
200b. Each mouse was injected with 5 million lentiviral particles per injection per
day for 2 days. UUO was performed 24 hr after the second injection. Mice were
sacrificed 5 days post UUO and kidney cortex was harvested. Gene expression was
examined and normalised to actin. A. data from 4 control mice were compared to 3
miR-200b transduced mice. B. data from 4 control mice were compared to one miR-
200b transduced mouse with high RFP expression. P value is greater than 0.05 for all
comparisons due to the small sample size.
4.3.6.2 Masson Trichrome stain and Periodic acid-Schiff stain (PAS)
Masson trichrome and PAS staining were also performed on the renal cortex collected.
The cortex tissue was sectioned and stained by Anatomical Pathology in Royal North
Shore Hospital, St Leonards, NSW. UUO induced severe tubulo-interstitial fibrosis,
as indicated in the Masson Trichrome staining. However, fibrosis was reduced in the
ligated kidney transduced with miR-200b when compared to non-specific miRNA
(Figure 4.7). Interestingly, in the unligated kidney, miR-200b appeared to reduce the
amount of normal extracellular matrix proteins. UUO, as expected, also induced
more severe tubular lesions (Figure 4.8) without affecting the glomeruli (Figure 4.9).
The Masson Trichrome stained slides from the ligated kidneys were blindly graded by
Dr. Jason Chen (pathologist). The result is shown below in Table 4.1. The data
suggest that miR-200b transduced kidneys (5,6,7) had an average lower score than the
non-specific miRNA transduced kidney.
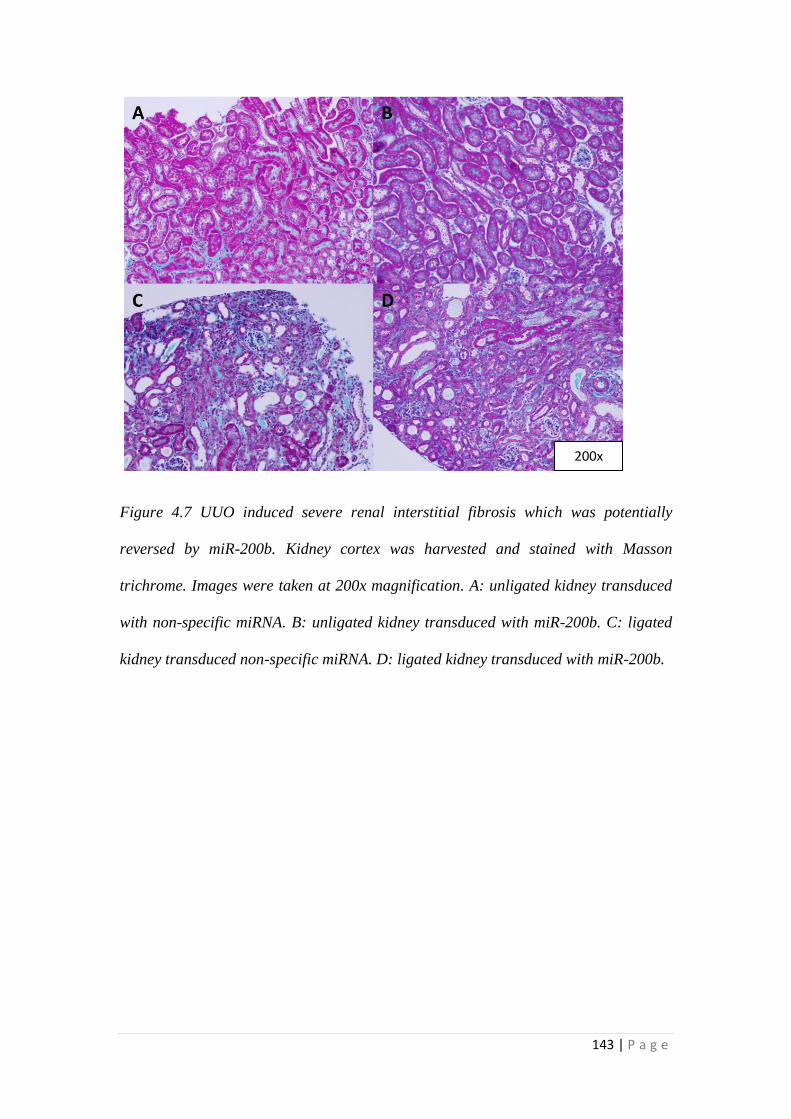
143 | P a g e
Figure 4.7 UUO induced severe renal interstitial fibrosis which was potentially
reversed by miR-200b. Kidney cortex was harvested and stained with Masson
trichrome. Images were taken at 200x magnification. A: unligated kidney transduced
with non-specific miRNA. B: unligated kidney transduced with miR-200b. C: ligated
kidney transduced non-specific miRNA. D: ligated kidney transduced with miR-200b.
200x
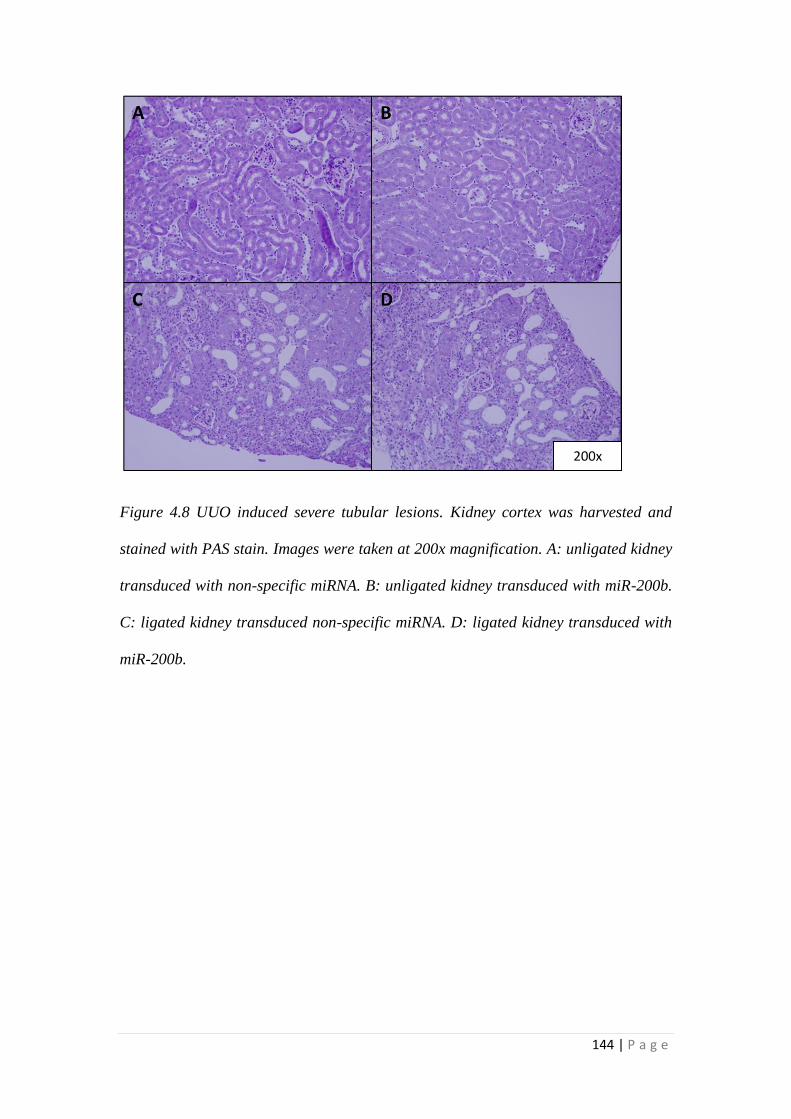
144 | P a g e
Figure 4.8 UUO induced severe tubular lesions. Kidney cortex was harvested and
stained with PAS stain. Images were taken at 200x magnification. A: unligated kidney
transduced with non-specific miRNA. B: unligated kidney transduced with miR-200b.
C: ligated kidney transduced non-specific miRNA. D: ligated kidney transduced with
miR-200b.
200x

145 | P a g e
Figure 4.9 UUO induced little pathology in the glomerulus. Kidney cortex was
stained with PAS stain. Images were taken at 400x magnification. A: unligated kidney
transduced with non-specific miRNA. B: unligated kidney transduced with miR-200b.
C: ligated kidney transduced non-specific miRNA. D: ligated kidney transduced with
miR-200b.
400x
146 | P a g e
Mouse
Number
miRNA
Transduced
Masson Trichrome
Score
1 non-specific severe
2 non-specific Moderate
3 non-specific Severe
4 non-specific Moderate
5 miR-200b Mild to Negative
6 miR-200b Mild to Negative
7 miR-200b Moderate
Table 4.1: Masson Trichrome score of ligated kidneys transduced with either non-
specific miRNA or miR-200b, determined by pathologist Jason Chen in Royal North
Shore Hospital in a single blinded fashion. Despite little RFP expression observed,
there was a significant reduction in tissue pathology.
4.4 Discussion
In this study, we examined the role of miR-200b in preventing tubulo-interstitial
fibrosis. We successfully induced progressive renal fibrosis using the UUO model.
The pathology induced by UUO was mainly limited to tubules and the interstitial
areas, while glomeruli were unaffected. This provided us a good model for studying

147 | P a g e
the interventions impacting on the development of progressive tubulo-interstitial
fibrosis.
In the preliminary test with lentiviral carrying non-specific miRNA, we successfully
demonstrated the over-expressed RFP in mouse kidney after systemic delivery. RFP is
used as a qualitative marker for successful transduction due to the lack of RFP gene in
c57bl/6 mice genome. However, in the following study, a significant reduction in
transduction efficiency was observed in miR-200b carrying lentivirus when compared
to the ones carrying non-specific miRNA. Thus, the number of mice with high RFP
expression in the miR-200b transduced group was limited to one. This may be due to
intra-muscular leakage of lentivirus during injection or mouse to mouse variation in
integrating the cargo gene. This discrepancy could be further explained by the
secondary structure formed by miR-200b. As it is delivered in the pre-miR-200b
format, it forms a short hairpin loop structure which may hinder the integration of the
gene. This phenomenon was also observed by another colleague when she was trying
to transduce a human breast cancer cell line using miR-200b carrying lentivirus. This
significantly restricted the interpretation of results. Though the real-time PCR result
showed a trend of reduction in the expression of matrix proteins in the successfully
transduced mouse, more mice numbers will be required to achieve statistical
significance to verify the finding. Interestingly, there was an improvement in
histological severity of tubulointerstitial pathology in all 3 miR-200b transduced mice
independently of transfection efficiency. Recent studies suggest that miRNA can
indeed travel from one organ to another in by packaging them into small vesicles with
lipid-bilayer (Katsuda et al., 2014). Due to the high transduction rate in liver, miR-
200b could be produced there and transported to the kidney and thus have an effect.
Improvements including using more lentivirus with higher titer could be carried out to
148 | P a g e
improve the expression of miR-200b in kidneys. Furthermore, more localised
lentiviral delivery such as retrograde infusion through the ureter, intrarenal artery/vein
infusion and intraparenchymal injection could also be tried in order to improve the
gene transfer efficiency in kidney. Indeed, other studies using these methods have
shown significant increase of delivered gene products (Gusella et al., 2002a)
(Gusella et al., 2002b). The localised delivery concentrates lentivirus in kidney and
reduced the level of unwanted transduction in other organ and thus reduced the off-
target effects. However, these methods are much more technical challenging and may
cause damage to kidney itself during the procedure. They are highly unlikely to have
future clinical applicability.
149 | P a g e
5 Chapter 5 Nanoparticle mediated gene delivery:
5.1 Introduction
Since the discovery of RNA interference (RNAi) in Caenorhabditis elegans (Fire et al.,
1998), plants and mammalian cells (Hamilton and Baulcombe, 1999) in the late 1990s,
there has been an exponential increase in the study of these short RNA species aiming
to develop not only new strategies for disease treatment, but also new methods for
researchers to switch off genes of interest. Indeed, RNAi has become a powerful tool
and is now an integral part of modern molecular biology lab methodology. Meanwhile
the first RNAi based drug Kynamro, which targets apolipoprotein B mRNA, the gene
responsible for homozygous familial hypercholesterolemia (Merki et al., 2008), was
approved by the FDA in 2013
(http://www.fda.gov/newsevents/newsroom/pressannouncements/ucm337195.htm).
5.1.1 Challenges
RNAi mechanism can be initiated by the double strand RNA (dsRNA) such as siRNA,
miRNA and shRNA (Wang et al., 2011). They are all processed and loaded onto
mRNA in a similar fashion as described. Despite the initial bright prospects, the
application of RNAi relies on efficient and specific delivery of these dsRNA to the
desired target cells or tissues. Hurdles still need to be overcome to ensure these
requirements are met.

150 | P a g e
5.1.1.1 Stability and Bioavailability
Unmodified dsRNA, even though relatively stable (Hickerson et al., 2008), are prone
to serum nuclease degradation after systematic delivery. Degradation could further
trigger the innate immune response, hence rendering the therapy ineffective (Layzer et
al., 2004). (Jackson and Linsley, 2010; Nguyen et al., 2012). In addition to
degradation, systemically delivered dsRNA has been shown to preferentially
accumulate in the kidney, where it is excreted rapidly due to its small size (~14kda for
a 23bp dsRNA) (Alexis et al., 2008; Guo et al., 2010). However, this trait may be
appealing for delivery of dsRNA into kidney proximal tubular cells if functional
integrity remains, dsRNA is too large and hydrophilic to diffuse through the
phospholipid bilayer of cell membranes (Whitehead et al., 2009).
5.1.1.2 Off-target Effects
Non-specific off-target effects induced by RNAi had been observed when siRNA
affected gene expression via 3’UTR regulation with imperfect complementarity
(Birmingham et al., 2006; Jackson et al., 2006). Conversely, saturation of miRNA
machinery may be caused by unintentional accumulation, which may also trigger non-
specific off-target effects (Wang et al., 2011).
5.1.1.3 Immune Response
In addition to the activation triggered by degraded dsRNA, intact dsRNA can also
induce immune responses. It is thought that the dsRNA can interact with RNA-
binding proteins, such as toll-like receptors and protein kinase receptors, which in turn
initiate type I interferon mediated immune responses (Deng et al., 2014).
151 | P a g e
Furthermore, the immune response can be activated in a sequence specific manner
(Hornung et al., 2005) and the severity is also believed to positively correlate with the
length of delivery dsRNA (Deng et al., 2014).
Though viral vectors such as lentivirus and adenovirus had been extensively used to
deliver the genes both systemically and locally (Kootstra and Verma, 2003; Verma
and Weitzman, 2005), they still pose a high risk of severe immunological responses as
well as increased susceptibility to certain types of cancer (Check, 2005; Hacein-Bey-
Abina et al., 2003; Raper et al., 2003; Raper et al., 2002). Thus, much attention has
been diverted to the development and characterisation of safer, non-viral delivery
systems including naked dsRNA, conjugate delivery systems, lipid nanoparticles,
polymeric nanoparticles, ultrasound microbubble mediated gene transfer and more.
Ideally, these delivery systems should (a) increase the stability of cargo dsRNA, (b)
evade the immune system, (c) be physiologically inert, (d) avoid/intended renal
clearance depend on the application, (e) reach target tissue and facilitate cell entry,
and (f) efficiently incorporate the dsRNA onto RNAi machinery (Kanasty et al., 2013).
Some of these innovative methods will be briefly described.
5.2 in vivo Gene Delivery Methods
The clinical application of knowledge of miRNA involves the transfer and over-
expression of exogenous genetic material to the host somatic cells, a procedure also
called gene therapy. Gene therapy requires the right amount foreign gene(s) to be
delivered precisely to the desired cell type(s) without causing any adverse effects.
Gene therapy in the kidney, particularly targeting the proximal tubular cells, is
challenging, because the kidney is a well differentiated organ with different
152 | P a g e
compartments that work together to maintain homeostasis in the body. In this chapter,
non-viral mediated gene deliveries such as nanoparticles mediated gene transfer and
ultrasound microbubble mediated gene transfer were explored.
5.2.1.1 Chemical Modification of the Base
One of the strategies that are adopted by virtually all dsRNA delivery methods is the
chemical modification of the dsRNA backbone (Kanasty et al., 2013). This can either
be the replacement of phosphodiester bonds with phosphothioate bonds or the
boranophosphate bond shown as 5.1a or chemical modification of the 2’-sugar,
commonly 2’-O-methyl, 2’-O-methoxyethyl, 2-fluoro and locked nucleic acid shown
in 5.1b (Kanasty et al., 2013). These modifications augment dsRNA’s resistance to
nuclease degradation and thus increase their serum stability while maintaining their
silencing effects (Amarzguioui et al., 2003; Braasch et al., 2003). However, extensive
modification may also lead to increased cytotoxicity and loss of silencing activity
(Amarzguioui et al., 2003; Czauderna et al., 2003). Thus careful modification of
dsRNA is required to achieve the optimal balance between silencing and nuclease
resistance.
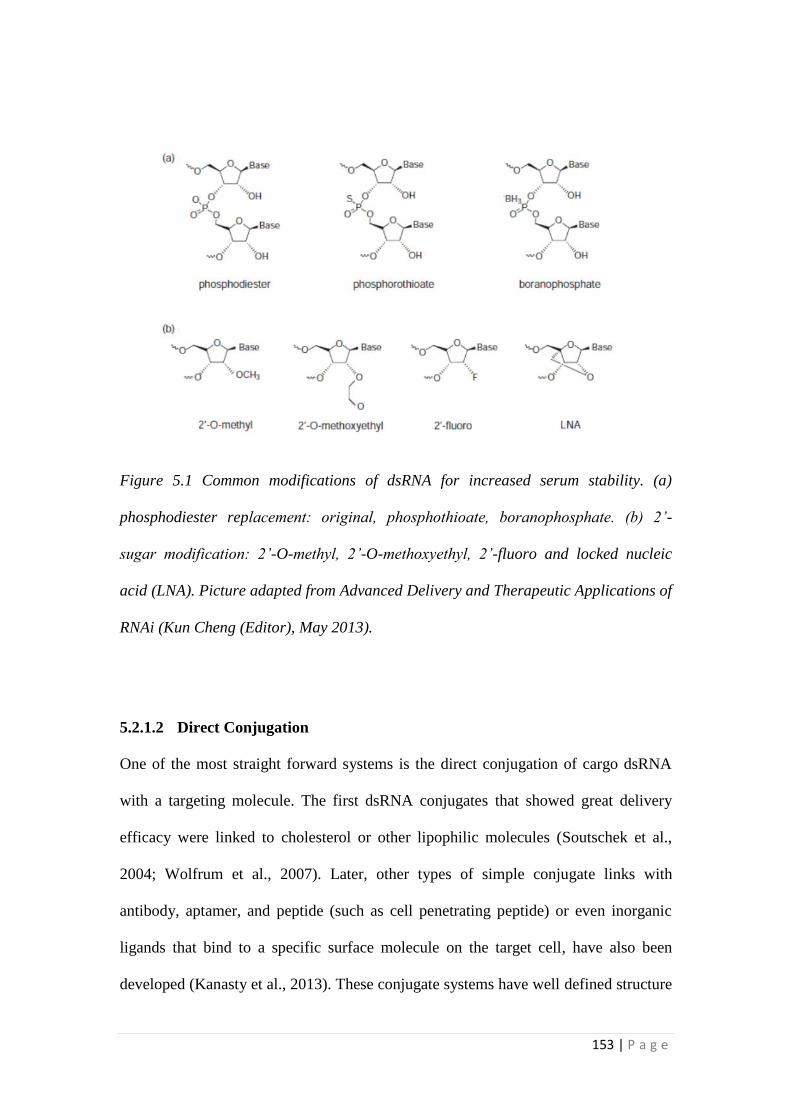
153 | P a g e
Figure 5.1 Common modifications of dsRNA for increased serum stability. (a)
phosphodiester replacement: original, phosphothioate, boranophosphate. (b) 2’-
sugar modification: 2’-O-methyl, 2’-O-methoxyethyl, 2’-fluoro and locked nucleic
acid (LNA). Picture adapted from Advanced Delivery and Therapeutic Applications of
RNAi (Kun Cheng (Editor), May 2013).
5.2.1.2 Direct Conjugation
One of the most straight forward systems is the direct conjugation of cargo dsRNA
with a targeting molecule. The first dsRNA conjugates that showed great delivery
efficacy were linked to cholesterol or other lipophilic molecules (Soutschek et al.,
2004; Wolfrum et al., 2007). Later, other types of simple conjugate links with
antibody, aptamer, and peptide (such as cell penetrating peptide) or even inorganic
ligands that bind to a specific surface molecule on the target cell, have also been
developed (Kanasty et al., 2013). These conjugate systems have well defined structure
154 | P a g e
and properties, which may be advantageous when compared to other more complex
systems (Kanasty et al., 2013). The size of these systems is relatively small and thus
may benefit dsRNA delivery to the PTCs as the pore size of glomerular filtration
barrier is approximately 8nm (He and Carter, 1992; Wartiovaara et al., 2004).
However, the pore size can be as large as 40 nm under diseased state allowing bigger
particles to be filtered. This is crucial in the design of complex multifunctional
delivery systems targeting the luminal membrane of PTCs, as the difficulty in
functionalisation and characterisation of these systems increase exponentially as they
become smaller and smaller in size (Haraldsson and Jeansson, 2009).
5.2.1.3 Nanoparticles Mediated Gene Delivery
Complex multi-functional nanoparticle delivery systems have also been designed and
developed for dsRNA in vivo delivery. Compared to simple conjugates, these
nanoparticles can be coated with different ligands for different purposes. Typically,
these nanoparticles are positively charged, which can interact electrostatically with
the negatively charged dsRNA without the requirement of a chemical bond to hold
them together (Jeong et al., 2009). However, delivery systems can have unwanted
aggregation with erythrocytes if a significant net positive charges are presented at the
surface (Malek et al., 2009). Notably, the negative charge of the glomerulus basement
can interact with the nanoparticles and cause some of the delivery systems that
electrostatically bond to their cargo to disintegrate while being filtered (Naeye et al.,
2013; Zuckerman et al., 2012). This consequently leads to the loss of dsRNA in urine.
However, this could advantageous if the target is proximal tubular cell, providing the
dsRNA can be reabsorbed through endocytic mechanisms.

155 | P a g e
Encapsulating the cargo dsRNA to prevent nuclease degradation or activation of the
immune system is a common design shared by many delivery systems, in addition to
chemical modification (Wang et al., 2012a). An additional common strategy to
minimise the interaction with serum proteins is to shield the nanoparticles with short
chains of stabilisers such as polyethylene glycol (PEG)(Alexis et al., 2008).
Target searching motifs can also be conjugated on to the delivery systems. Aptamer,
antibody, peptides and organic/inorganic ligands are all good conjugate partners,
providing they bind specifically and efficiently with their targets.
The exact pathways which NP-dsRNA is delivered remain largely undetermined.
However it is generally accepted that the nanoparticles will bind to the cell membrane
surface receptor, which triggers an internalisation mechanism. During endocytosis,
the NP-sirna complex will be largely confined to the endosomes. However, some of
the complex may escape the endocytic pathway and localise to the cytoplasm. The
majority of the complex will proceed to the lysosome and be degraded. Thus in
designing the NP-miR complex, maximising the surface functional groups is
beneficial, providing the stability of the nanoparticle is not affected. This is due to two
reasons. Firstly, this reduces the number of nanoparticles required for the desired gene
regulation. This directly minimise the impact exerted by NP on cellular health.
Simultaneously the number of shRNA cargo can be maximised (Yu et al., 2009).
After endosome escape, the delivered dsRNA must be loaded onto the RISC protein
complex to initiate the RNAi pathway (Chiu and Rana, 2002; Ma et al., 2005;
Nykanen et al., 2001). At this stage, the cargo needs to dissociate from the delivery
system to be successfully loaded on the RISC complex. A degradable linker is likely
be superior to an unstable one. One example of such a linker is a disulphide bridge,
156 | P a g e
which can be cleaved to asulfhydryl moiety under reducing conditions. This has
biological applicability as the cell cytoplasm is always in a reduced state due to a
substantially high ratio (greater than 100) of reduced glutathione to oxidised
glutathione disulfide (Holmgren and Bjornstedt, 1995; Saito et al., 2003). Other
degradable linkers include acid-labile and enzymatically cleavable linkers, which can
useful depending on the target tissue.
5.2.2 Ultrasound Microbubbles Mediated Gene Transfer
Another method of non-viral gene delivery is ultrasound microbubble mediated gene
transfer. This method utilises the acoustic power of ultrasound and microbubbles to
transiently alter the permeability of cell membranes and thus facilitate gene delivery.
Though ultrasound itself has been shown to change cell membrane permeability
(Brayman et al., 1999; Fechheimer et al., 1987), the co-administration of
microbubbles has been shown to reduce the acoustic pressure required to achieve
comparable levels of gene transfer (Miller, 2000). Additionally, the membrane
permeating ability can be greatly improved using microbubble preparations.(Nomikou
and McHale, 2012). Microbubbles were originally designed and used clinically as
agents to increase the contrast in ultrasound imaging, but soon their potential as
energy deposition foci to enhance nucleic acid were exploited and studied (Blomley,
2003).
Microbubbles have been shown to oscillate in an ultrasound field resulting in acoustic
pressure at any given frequency (Nomikou and McHale, 2012). Depending on the
intensity of ultrasound, microbubbles can form either stable cavitation, where
microbubbles vibrate continuously (at low intensity) or inertial cavitation, where
157 | P a g e
microbubbles rapidly compress, expand and collapse (at high intensity) (Husseini et
al., 2005; Suslick, 1990). When this occurs in the micro-environment in close
proximity to target cells, the integrity of the cell membrane can be compromised.
Pores can form transiently, allowing free passage of material (such as nucleic acid)
and thus sonoporation. However, high intensity can cause irreversible damage to the
cell membrane which leads to cell death (Nomikou and McHale, 2012). Nucleic acid
is thought to enter cells by diffusion after pore formation, but other mechanisms like
caveolin- and clathrin- mediated endocytosis have also been suggested (Escoffre et al.,
2013).
To induce ultrasound microbubble mediated gene transfer, nucleic acid is mixed with
the microbubble preparation and co-administered into the circulation. Ultrasound
waves in the MHz range are applied on the target organ for a short period of time,
usually 2-5 minutes. Due to its easy operability and non-invasive nature, ultrasound
microbubble mediated gene delivery is becoming more popular for gene delivery. I
was lucky enough to learn and harness this technique from Professor Lan’s lab in Li
Ka Shing Institute of Health Science, where he used hexafluoride based microbubbles
(SonoVue) together with ultrasound to deliver plasmid DNA containing various
miRNA to the kidneys (Li et al., 2013; Zhong et al., 2013; Zhong et al., 2011).
However, due to the unavailability of SonoVue in Australia, delivery of miR-200b to
mouse kidneys using this approach has not yet been attempted.
5.3 Manufacturing and Testing of Nanoparticle-miRNA Conjugate
In parallel with lentivirus induced gene delivery, a novel type of nanoparticles
designed for targeted gene/drug delivery was also established in collaboration with

158 | P a g e
Department of Chemistry, University of Sydney. The desired properties of these
nanoparticles were as follows:
Fully functional at a size smaller than 40nm (cut-off size for renal filtration)
High cellular penetration
Low cellular toxicity and low likelihood of inducing oxidative stress
Biologically naïve
High stability
Neutral charge
Ability to stabilise the “cargo” (RNA/DNA/Drug)
Options to add additional functional groups (chemical or physical)
The following diagram demonstrates a schematic overview of the design of the
nanoparticle. Aptamers are DNAs with tertiary structures that are able to recognise
specific protein molecules such as antibodies. Fluorescent dye can also be attached to
trace and study the bio-distribution of these nanoparticles.
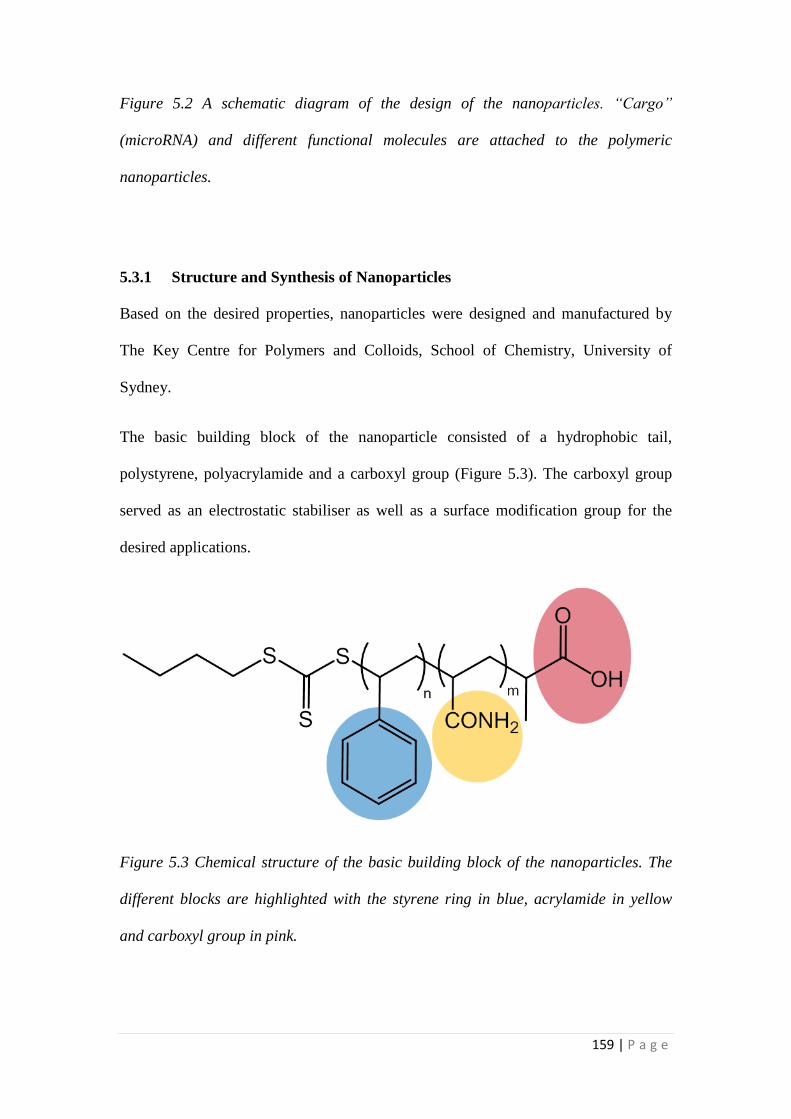
159 | P a g e
Figure 5.2 A schematic diagram of the design of the nanoparticles. “Cargo”
(microRNA) and different functional molecules are attached to the polymeric
nanoparticles.
5.3.1 Structure and Synthesis of Nanoparticles
Based on the desired properties, nanoparticles were designed and manufactured by
The Key Centre for Polymers and Colloids, School of Chemistry, University of
Sydney.
The basic building block of the nanoparticle consisted of a hydrophobic tail,
polystyrene, polyacrylamide and a carboxyl group (Figure 5.3). The carboxyl group
served as an electrostatic stabiliser as well as a surface modification group for the
desired applications.
Figure 5.3 Chemical structure of the basic building block of the nanoparticles. The
different blocks are highlighted with the styrene ring in blue, acrylamide in yellow
and carboxyl group in pink.

160 | P a g e
The polystyrene-polyacrylamide building blocks of the nanoparticles were allowed to
self-assemble in water to form micelles. Due to the difference in polarity, the
hydrophobic tail and polystyrene will form the inner core, while the hydrophilic
polyacrylamide and carboxylic acid will form the outer layer of the micelle. Sodium
hydroxide was added to deprotonate the carboxylic acid of the micelle, which was
then converted to nanoparticles by emulsion polymerisation. The resulting
nanoparticle was observed using Transmission Electron Microscopy (TEM) to verify
the size and shape (Figure 5.4). These nanoparticles were spherical in shape and had a
typical size of 25-30 nm in diameter.

161 | P a g e
Figure 5.4 Transmission Electron Microscopy (TEM) images of the nanoparticles.
Synthesised nanoparticles were verified for size and shape using TEM. The
nanoparticles were spherical in shape and typical size was between 25-30 nm in
diameter.
162 | P a g e
5.3.2 Cellular uptake of Nanoparticles
To determine the cellular uptake of the nanoparticles, 1x10¹²
rhodamine fused
nanoparticles (1 mL) were added to HK-2 cells in a 6-well plate. The HK-2 cells were
then incubated at 37oC for 48hr before trypsinisation and washed twice with ice cold
PBS. Flow cytometry was then used to determine the uptake of nanoparticles. 99.75%
cells were positive for rhodamine after 48hr when compared to negative control
(Figure 5.5), demonstrating robust cell membrane penetration ability of the
nanoparticles. Furthermore, the similar pattern between the control and treated cells in
the forward and side scatter plot (Figure 5.5 top panel) also indicated minimal
biological impact on the cells. This result was also supported by the direct observation
of normal cellular morphology indicating the non-toxic nature of these nanoparticles.
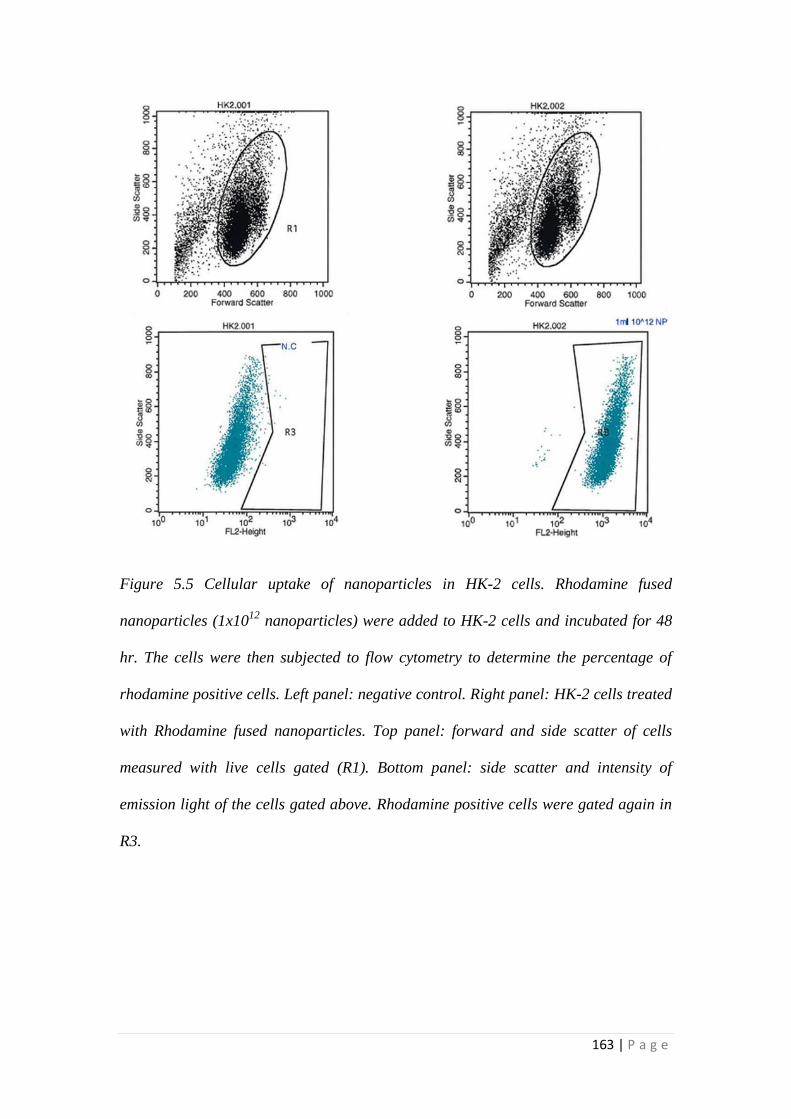
163 | P a g e
Figure 5.5 Cellular uptake of nanoparticles in HK-2 cells. Rhodamine fused
nanoparticles (1x10¹²
nanoparticles) were added to HK-2 cells and incubated for 48
hr. The cells were then subjected to flow cytometry to determine the percentage of
rhodamine positive cells. Left panel: negative control. Right panel: HK-2 cells treated
with Rhodamine fused nanoparticles. Top panel: forward and side scatter of cells
measured with live cells gated (R1). Bottom panel: side scatter and intensity of
emission light of the cells gated above. Rhodamine positive cells were gated again in
R3.
164 | P a g e
5.3.3 Rate of Uptake of the Nanoparticles
We next determined the rate of uptake of the nanoparticles by HK-2 cells as the
kinetics may play an important role in “cargo” delivery in vivo. Again, HK-2 cells
were treated with rhodamine fused nanoparticles for various amount of time ranging
from 0 min to 24 hr before subjected to flow cytometry. HK-2 cells began to uptake
the nanoparticles as early as 30 mins. Almost half of the cells were rhodamine
positive after 6 hr and most cells uptake the nanoparticles by 24 hrs (Figure 5.6).
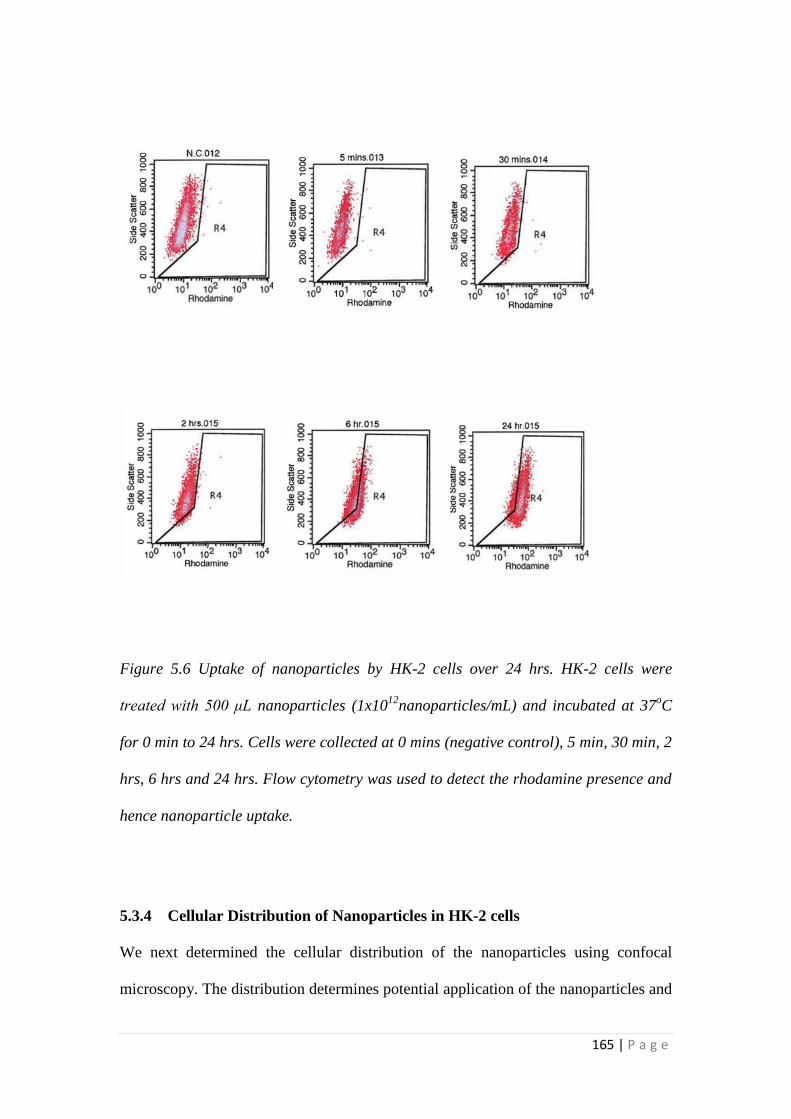
165 | P a g e
Figure 5.6 Uptake of nanoparticles by HK-2 cells over 24 hrs. HK-2 cells were
treated with 500 μL nanoparticles (1x10¹²
nanoparticles/mL) and incubated at 37oC
for 0 min to 24 hrs. Cells were collected at 0 mins (negative control), 5 min, 30 min, 2
hrs, 6 hrs and 24 hrs. Flow cytometry was used to detect the rhodamine presence and
hence nanoparticle uptake.
5.3.4 Cellular Distribution of Nanoparticles in HK-2 cells
We next determined the cellular distribution of the nanoparticles using confocal
microscopy. The distribution determines potential application of the nanoparticles and
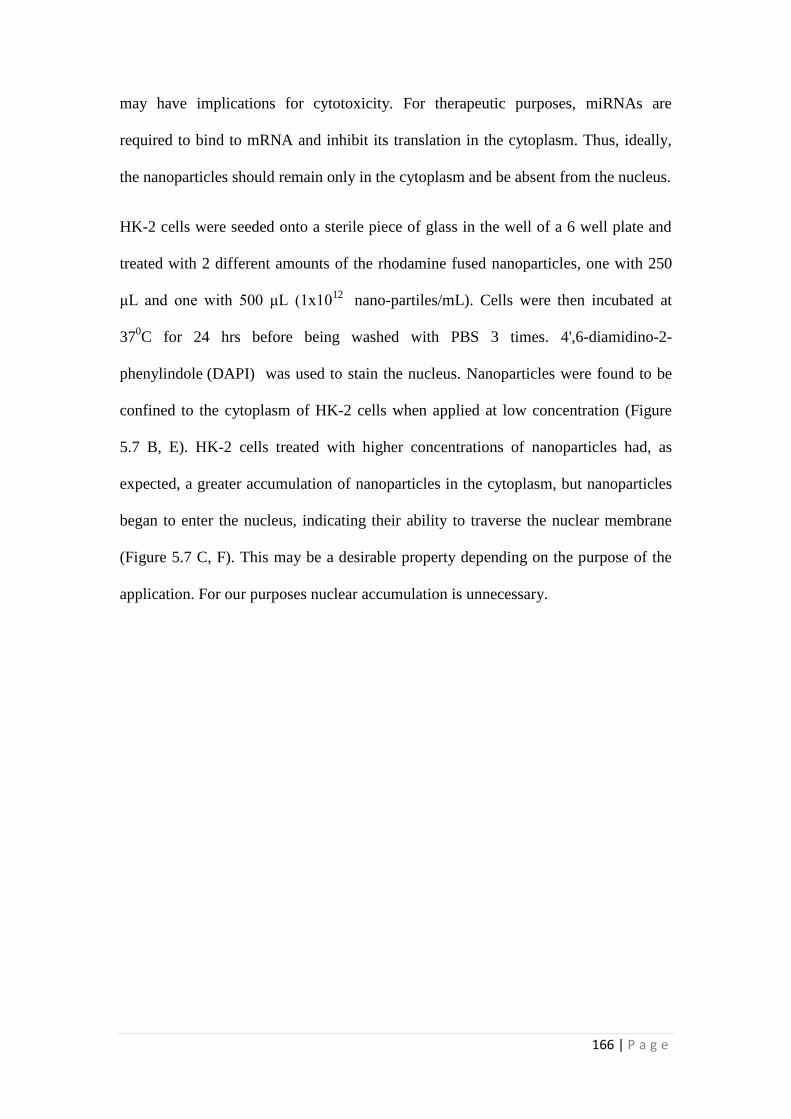
166 | P a g e
may have implications for cytotoxicity. For therapeutic purposes, miRNAs are
required to bind to mRNA and inhibit its translation in the cytoplasm. Thus, ideally,
the nanoparticles should remain only in the cytoplasm and be absent from the nucleus.
HK-2 cells were seeded onto a sterile piece of glass in the well of a 6 well plate and
treated with 2 different amounts of the rhodamine fused nanoparticles, one with 250
μL and one with 500 μL (1x10¹²
nano-partiles/mL). Cells were then incubated at
370C for 24 hrs before being washed with PBS 3 times. 4',6-diamidino-2-
phenylindole (DAPI) was used to stain the nucleus. Nanoparticles were found to be
confined to the cytoplasm of HK-2 cells when applied at low concentration (Figure
5.7 B, E). HK-2 cells treated with higher concentrations of nanoparticles had, as
expected, a greater accumulation of nanoparticles in the cytoplasm, but nanoparticles
began to enter the nucleus, indicating their ability to traverse the nuclear membrane
(Figure 5.7 C, F). This may be a desirable property depending on the purpose of the
application. For our purposes nuclear accumulation is unnecessary.
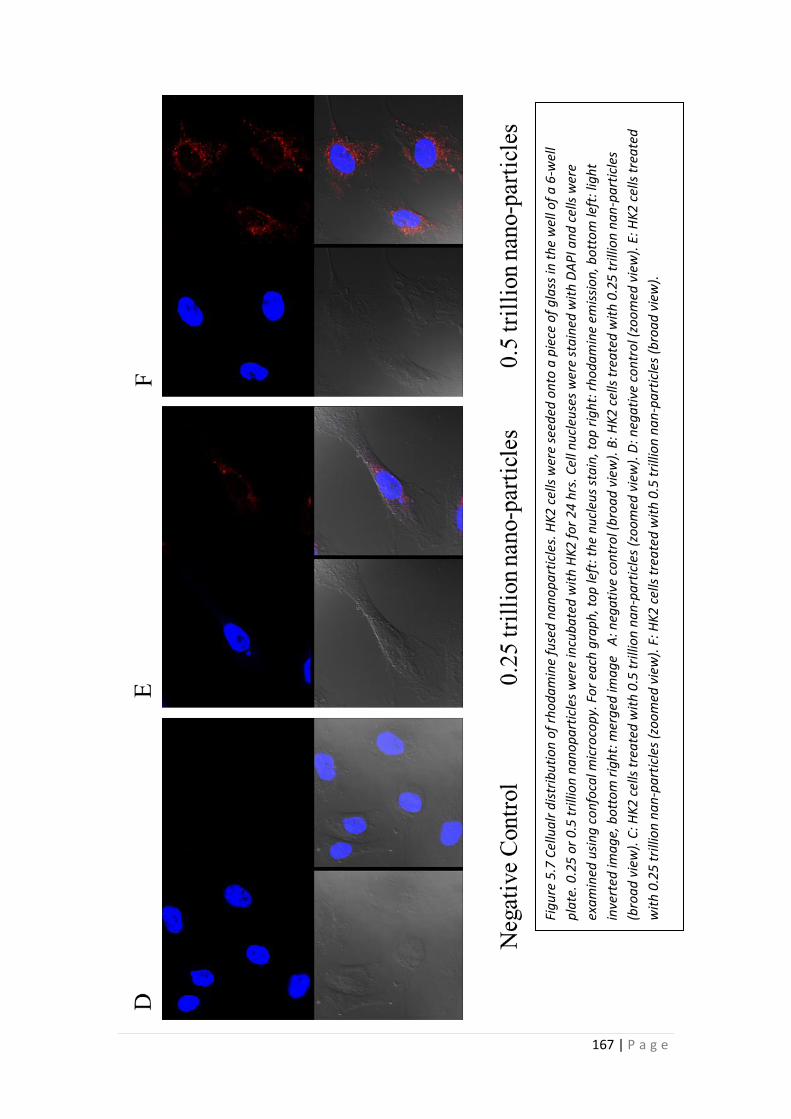
167 | P a g e
Fig
ure
5.7
Cel
lua
lr d
istr
ibu
tio
n o
f rh
od
am
ine
fuse
d n
an
op
art
icle
s. H
K2
cel
ls w
ere
seed
ed o
nto
a p
iece
of
gla
ss in
th
e w
ell o
f a
6-w
ell
pla
te. 0
.25
or
0.5
tri
llio
n n
ano
pa
rtic
les
wer
e in
cub
ate
d w
ith
HK
2 f
or
24
hrs
. Cel
l nu
cleu
ses
wer
e st
ain
ed w
ith
DA
PI a
nd
cel
ls w
ere
exa
min
ed u
sin
g c
on
foca
l mic
roco
py.
Fo
r ea
ch g
rap
h, t
op
left
: th
e n
ucl
eus
sta
in, t
op
rig
ht:
rh
od
am
ine
emis
sio
n, b
ott
om
left
: lig
ht
inve
rted
ima
ge,
bo
tto
m r
igh
t: m
erg
ed im
ag
e A
: neg
ativ
e co
ntr
ol (
bro
ad
vie
w).
B: H
K2
cel
ls t
rea
ted
wit
h 0
.25
tri
llio
n n
an
-pa
rtic
les
(bro
ad
vie
w).
C: H
K2
cel
ls t
rea
ted
wit
h 0
.5 t
rilli
on
na
n-p
art
icle
s (z
oom
ed v
iew
). D
: neg
ati
ve c
on
tro
l (zo
om
ed v
iew
). E
: HK
2 c
ells
tre
ate
d
wit
h 0
.25
trill
ion
na
n-p
art
icle
s (z
oo
med
vie
w).
F: H
K2
cel
ls t
rea
ted
wit
h 0
.5 t
rilli
on
na
n-p
art
icle
s (b
roa
d v
iew
).

168 | P a g e
5.3.5 Bio-distribution of Nanoparticles in Mice.
The nanoparticles were then tested for in vivo use in c57bl6 mice to study the bio-
distribution and adverse effects after intravenous administration. 400 μL nanoparticles
fused with rhodamine (1x10¹⁴
nanoparticles/mL) were administered intravenously
through the tail vein. The mouse was allowed to rest for 40 mins before being imaged
using an In-Vivo FX PRO in vivo imaging machine (Carestream, NY, USA).
Rhodamine was excited and the emission was detected and plotted. X-ray images of
the mouse were also obtained and superimposed onto the rhodamine emission image
to visualise the bio-distribution of these nanoparticles. Nanoparticles were found to be
distributed throughout the body of the mouse with more intense emission in lungs and
liver. No fluorescence was detected in the brain. Kidneys, did not demonstrate enough
emission to be visualised in the whole body scan (Figure 5.8). The mouse was then
culled and organs were harvested. The ex vivo organs including heart, lung, liver and
kidney were immediately imaged using the in vivo imaging system. Among these
organs, lung and liver demonstrated the strongest fluorescence, whilst the kidney and
heart had reduced but significant amount of emission compared to the control mouse
organs (Figure 5.9).

169 | P a g e
Fig
ure
5.8
Bio
-dis
trib
uti
on
of
Rh
od
am
ine
fuse
d n
an
opa
rtic
les
in C
57
BL6
mo
use
. M
ou
se w
as
inje
cted
wit
h 4
0 t
rilli
on
rho
da
min
e fu
sed
na
no
pa
rtic
les
an
d im
ag
ed 4
0 m
ins
po
st-i
nje
ctio
n. L
eft
pa
nel
: X-r
ay
ima
ge
of
the
skel
eto
n o
f th
e
mo
use
. Mid
dle
pa
nel
: rh
oda
min
e d
etec
tio
n. R
igh
t p
an
el: m
erg
ed im
ag
e.
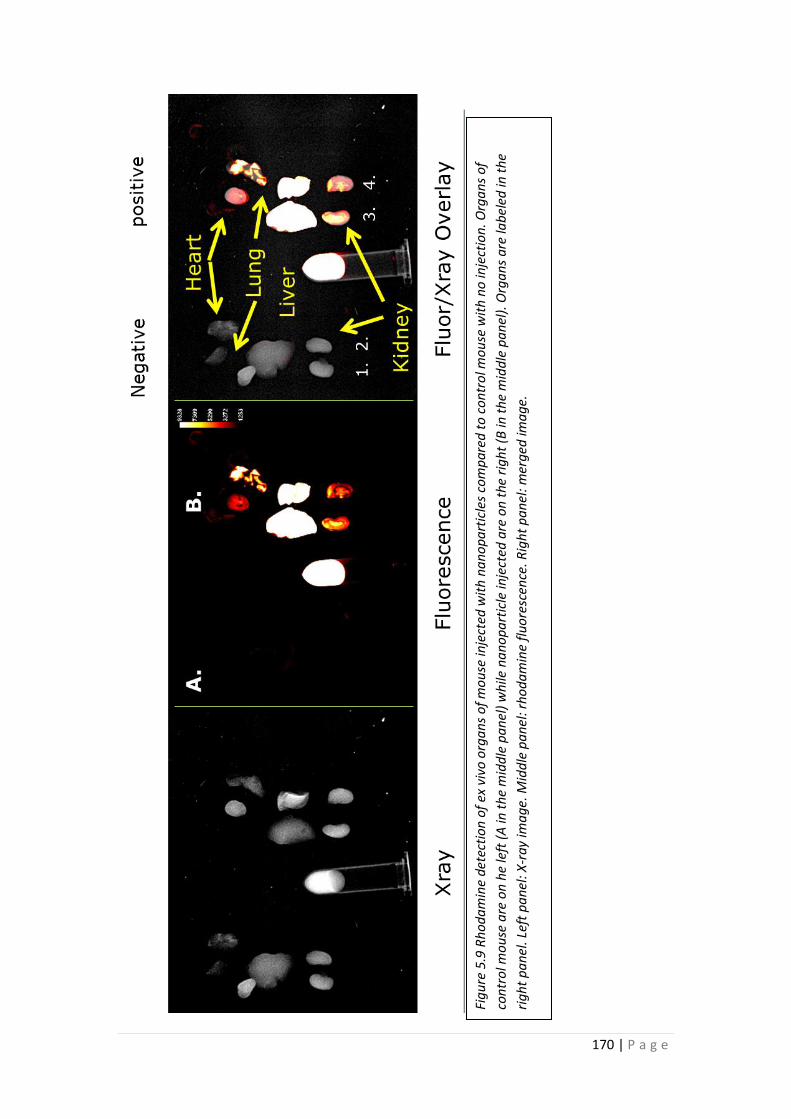
170 | P a g e
Fig
ure
5.9
Rh
od
am
ine
dete
ctio
n o
f ex
viv
o o
rga
ns
of
mo
use
inje
cted
wit
h n
an
op
art
icle
s co
mp
ared
to
co
ntr
ol m
ou
se w
ith
no
inje
ctio
n. O
rga
ns
of
con
tro
l mo
use
are
on
he
left
(A
in t
he
mid
dle
pa
nel
) w
hile
na
no
pa
rtic
le in
ject
ed a
re o
n t
he
rig
ht
(B in
th
e m
idd
le p
an
el).
Org
an
s a
re la
bel
ed in
th
e
rig
ht
pa
nel
. Lef
t p
an
el: X
-ray
ima
ge.
Mid
dle
pa
nel
: rh
od
am
ine
flu
ore
scen
ce. R
igh
t p
an
el: m
erg
ed im
ag
e.
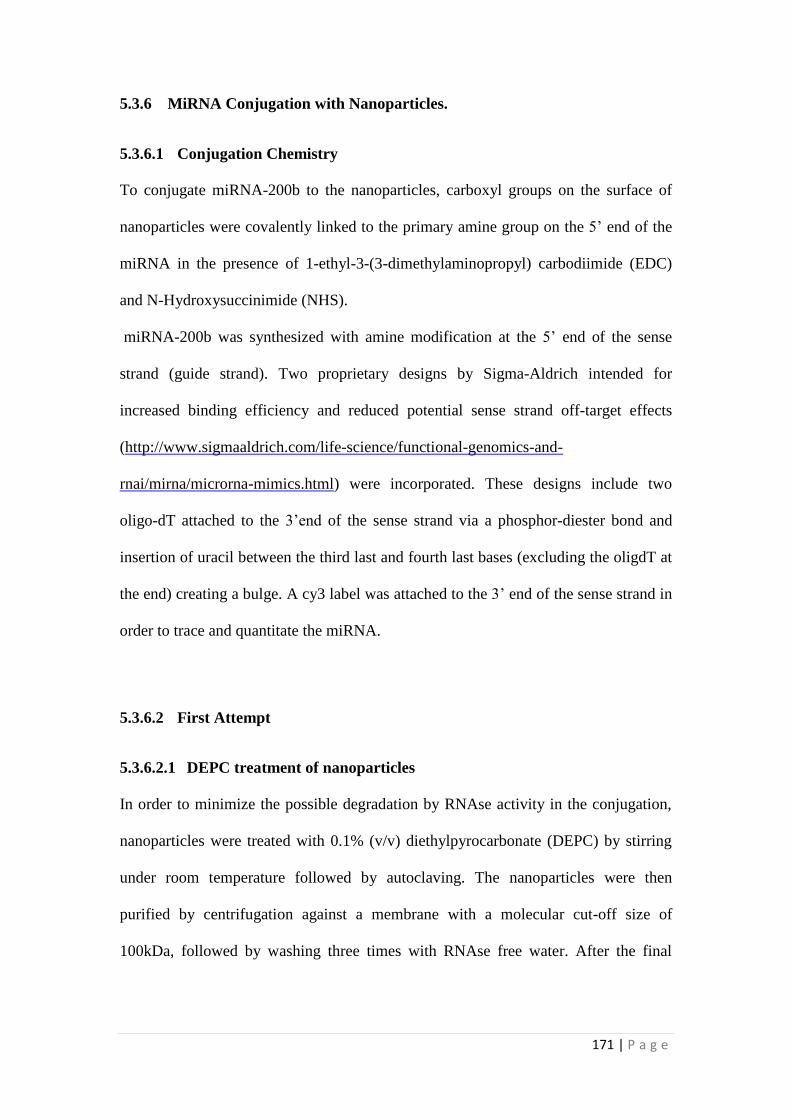
171 | P a g e
5.3.6 MiRNA Conjugation with Nanoparticles.
5.3.6.1 Conjugation Chemistry
To conjugate miRNA-200b to the nanoparticles, carboxyl groups on the surface of
nanoparticles were covalently linked to the primary amine group on the 5’ end of the
miRNA in the presence of 1-ethyl-3-(3-dimethylaminopropyl) carbodiimide (EDC)
and N-Hydroxysuccinimide (NHS).
miRNA-200b was synthesized with amine modification at the 5’ end of the sense
strand (guide strand). Two proprietary designs by Sigma-Aldrich intended for
increased binding efficiency and reduced potential sense strand off-target effects
(http://www.sigmaaldrich.com/life-science/functional-genomics-and-
rnai/mirna/microrna-mimics.html) were incorporated. These designs include two
oligo-dT attached to the 3’end of the sense strand via a phosphor-diester bond and
insertion of uracil between the third last and fourth last bases (excluding the oligdT at
the end) creating a bulge. A cy3 label was attached to the 3’ end of the sense strand in
order to trace and quantitate the miRNA.
5.3.6.2 First Attempt
5.3.6.2.1 DEPC treatment of nanoparticles
In order to minimize the possible degradation by RNAse activity in the conjugation,
nanoparticles were treated with 0.1% (v/v) diethylpyrocarbonate (DEPC) by stirring
under room temperature followed by autoclaving. The nanoparticles were then
purified by centrifugation against a membrane with a molecular cut-off size of
100kDa, followed by washing three times with RNAse free water. After the final

172 | P a g e
centrifugation, the nanoparticles that were retained on the membrane were
resuspended in RNAse free water in its original volume.
5.3.6.2.2 Conjugation
5ml nanoparticles with 0.05% soluble content were used to conjugate to miR-200b. 5%
of the surface carboxyl groups (theoretical calculation) were activated by the addition
of 4.81x10⁻⁷
EDC and 2.89x10⁻⁷
g NHS followed by stirring at room temperature for 1
hr. 2.5 nmole of miR-200b was then added to the activated nanoparticles. The pH of
the mixture was adjusted to 10 and stirred constantly at slow speed overnight at 4oC.
After conjugation, the mixture was purified by ultracentrifugation against a membrane
with a molecular size cut-0ff of 30 kDa to remove unbound miRNA-200b and
coupling reagents. The retained NP-miR-200b conjugate was further purified by
washing with RNAse free water.
5.3.6.2.3 Result
The volume ofNP-miR-200b conjugate was brought up to 5 mL with RNAse free
water. The intensity of the fluorescence of the filtrate (free unbound miRNA-200b in
around 5mL water) was compared to the one of the retained NP-miR-200b conjugate.
It was apparent that the intensity of the free miRNA-200b was much higher than the
conjugate. The conjugate was then used to transduce HK-2 cells to determine the
percentage of cy3 positive cells. Various amounts of NP-miR-200b conjugate ranging
from 50 µL to 1000 µL were used incubate with HK-2 cells, which were then
subjected to flow-cytometry analysis. However, a maximum of 17% cy3 positive HK-
2 was achieved by 1mL NP-miR-200b conjugate (Figure 5.10). At this concentration,
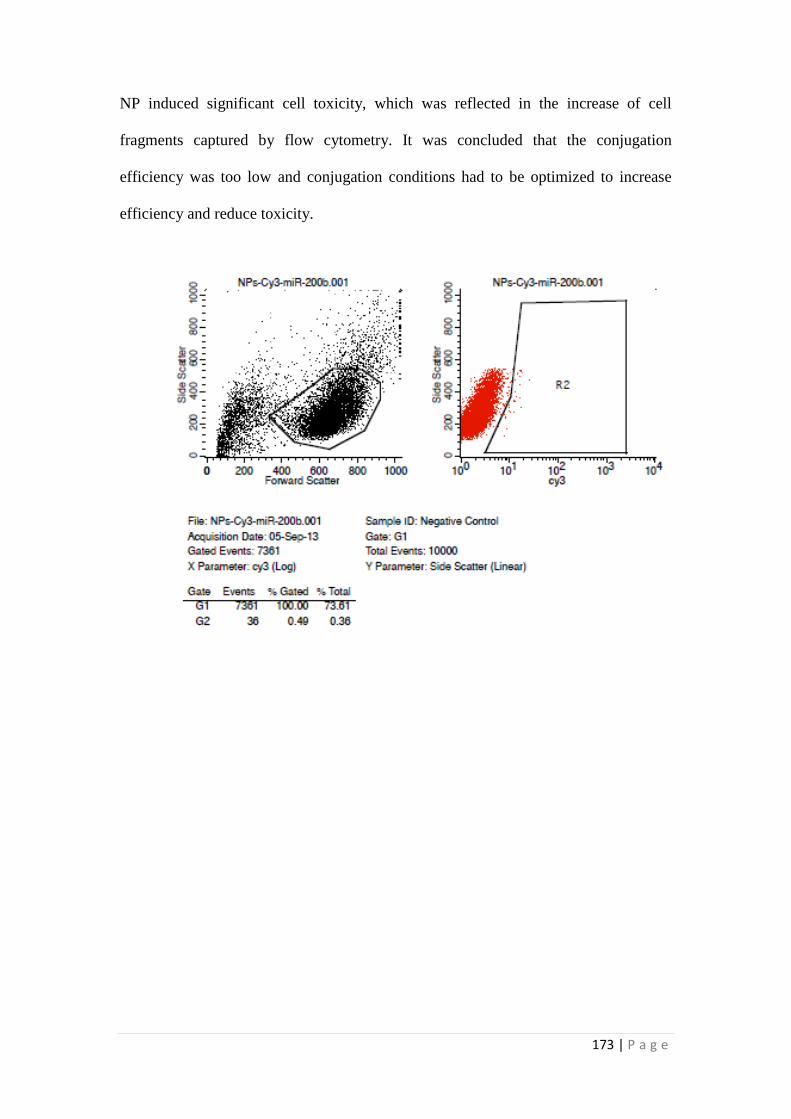
173 | P a g e
NP induced significant cell toxicity, which was reflected in the increase of cell
fragments captured by flow cytometry. It was concluded that the conjugation
efficiency was too low and conjugation conditions had to be optimized to increase
efficiency and reduce toxicity.
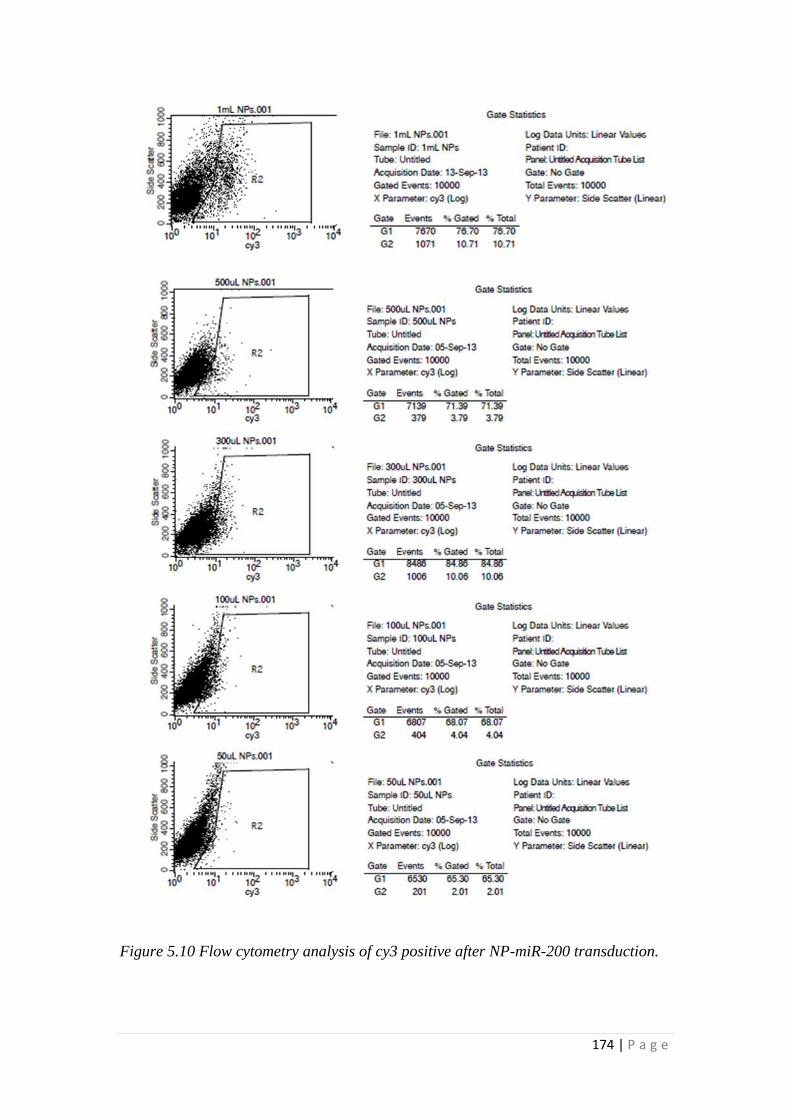
174 | P a g e
Figure 5.10 Flow cytometry analysis of cy3 positive after NP-miR-200 transduction.
175 | P a g e
HK-2 cells were transduced with various amount of NP-miR-200b conjugate and
incubated for 48 hr before being subjected to flow cytometry analysis. G1= live cells.
G2=cy3 positive cells. G2=R2.
5.3.6.3 Further Attempts
Various conditions were tried to optimize the conjugation efficiency, which are
summarized in Table 5.1 below.
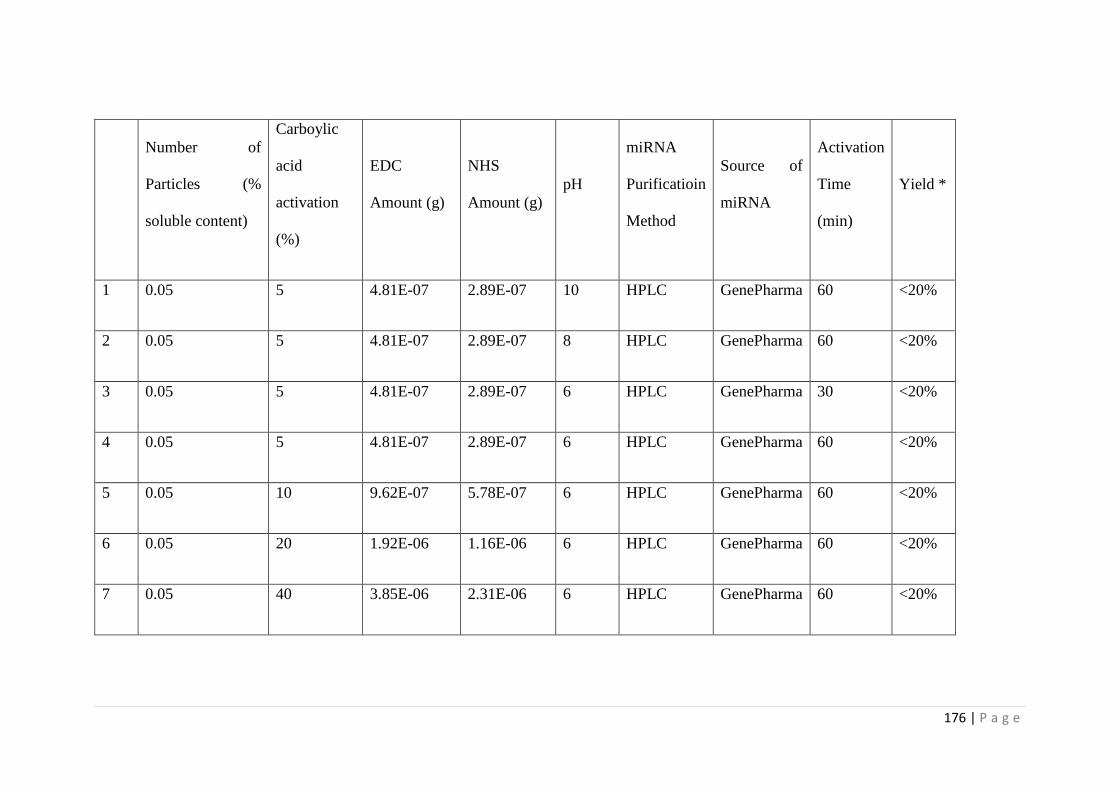
176 | P a g e
Number of
Particles (%
soluble content)
Carboylic
acid
activation
(%)
EDC
Amount (g)
NHS
Amount (g)
pH
miRNA
Purificatioin
Method
Source of
miRNA
Activation
Time
(min)
Yield *
1 0.05 5 4.81E-07 2.89E-07 10 HPLC GenePharma 60 <20%
2 0.05 5 4.81E-07 2.89E-07 8 HPLC GenePharma 60 <20%
3 0.05 5 4.81E-07 2.89E-07 6 HPLC GenePharma 30 <20%
4 0.05 5 4.81E-07 2.89E-07 6 HPLC GenePharma 60 <20%
5 0.05 10 9.62E-07 5.78E-07 6 HPLC GenePharma 60 <20%
6 0.05 20 1.92E-06 1.16E-06 6 HPLC GenePharma 60 <20%
7 0.05 40 3.85E-06 2.31E-06 6 HPLC GenePharma 60 <20%
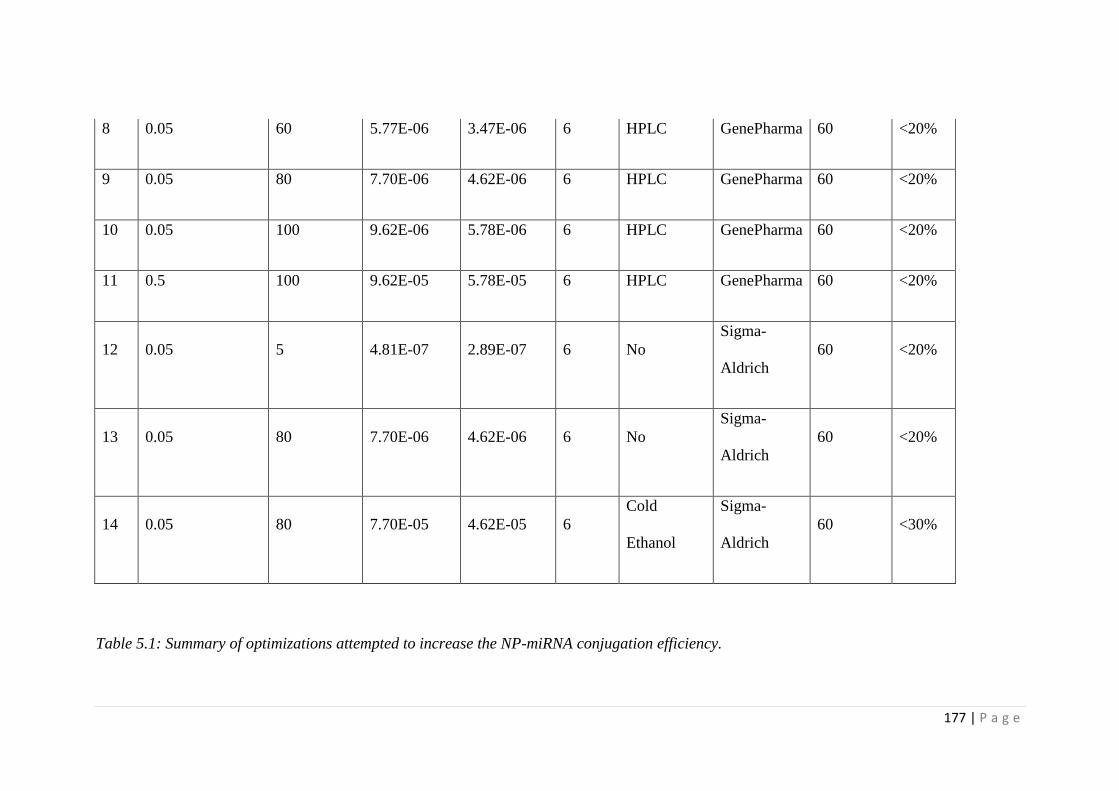
177 | P a g e
8 0.05 60 5.77E-06 3.47E-06 6 HPLC GenePharma 60 <20%
9 0.05 80 7.70E-06 4.62E-06 6 HPLC GenePharma 60 <20%
10 0.05 100 9.62E-06 5.78E-06 6 HPLC GenePharma 60 <20%
11 0.5 100 9.62E-05 5.78E-05 6 HPLC GenePharma 60 <20%
12 0.05 5 4.81E-07 2.89E-07 6 No
Sigma-
Aldrich
60 <20%
13 0.05 80 7.70E-06 4.62E-06 6 No
Sigma-
Aldrich
60 <20%
14 0.05 80 7.70E-05 4.62E-05 6
Cold
Ethanol
Sigma-
Aldrich
60 <30%
Table 5.1: Summary of optimizations attempted to increase the NP-miRNA conjugation efficiency.
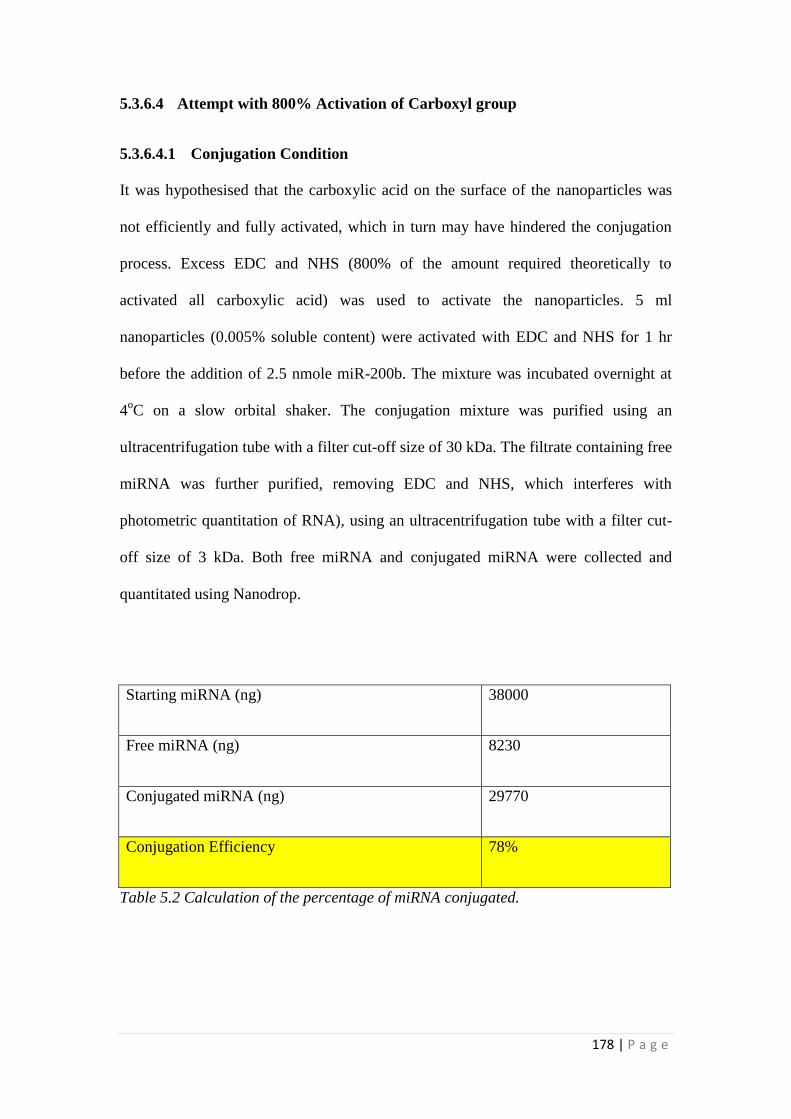
178 | P a g e
5.3.6.4 Attempt with 800% Activation of Carboxyl group
5.3.6.4.1 Conjugation Condition
It was hypothesised that the carboxylic acid on the surface of the nanoparticles was
not efficiently and fully activated, which in turn may have hindered the conjugation
process. Excess EDC and NHS (800% of the amount required theoretically to
activated all carboxylic acid) was used to activate the nanoparticles. 5 ml
nanoparticles (0.005% soluble content) were activated with EDC and NHS for 1 hr
before the addition of 2.5 nmole miR-200b. The mixture was incubated overnight at
4oC on a slow orbital shaker. The conjugation mixture was purified using an
ultracentrifugation tube with a filter cut-off size of 30 kDa. The filtrate containing free
miRNA was further purified, removing EDC and NHS, which interferes with
photometric quantitation of RNA), using an ultracentrifugation tube with a filter cut-
off size of 3 kDa. Both free miRNA and conjugated miRNA were collected and
quantitated using Nanodrop.
Starting miRNA (ng) 38000
Free miRNA (ng) 8230
Conjugated miRNA (ng) 29770
Conjugation Efficiency 78%
Table 5.2 Calculation of the percentage of miRNA conjugated.
179 | P a g e
However, precipitation was noticed at the bottom of the tube. The likely cause of the
precipitation was the destabilisation of nanoparticles due to excessive EDC and the
NHS coupling reagent.
5.3.6.4.2 In vitro transduction of NP-miR-200b of HK-2 Cells
The conjugated NP-miRNA complex was used to transduce HK-2 cells regardless of
the precipitation. 50 µL NP-miRNA conjugate was added to each well of HK-2 cells
on a 6-well plate. The plate was then incubated for 72 hr before total RNA was
extracted and analysed.
miR-200b levels in the HK-2 cells transduced with NP-miR-200b were increased by
58% (n=1) when compared to cells transduced with NP-NS-miR (Figure 5.11A). This
level was considerably lower than the expected amount of miR-200b after
transduction with NP-miR-200b. The obvious reason being, that although miR-200b
was conjugated to nanoparticles, destabilisation of the nanoparticle structure affected
their ability to enter the cell. Thus the miR-200b could not be effectively delivered
into the cells. The lack of detection of overexpression of miR-200b could also be
explained by the failure of amplification of miR-200b due to steric hindrance exerted
by the nanoparticles during the reverse transcription step.
The lack of changes in expression in E-cadherin (Figure 5.11B) and fibronectin
(Figure 5.11C) also reflected that NP-miR-200b was not functional. Further
optimisation was required.
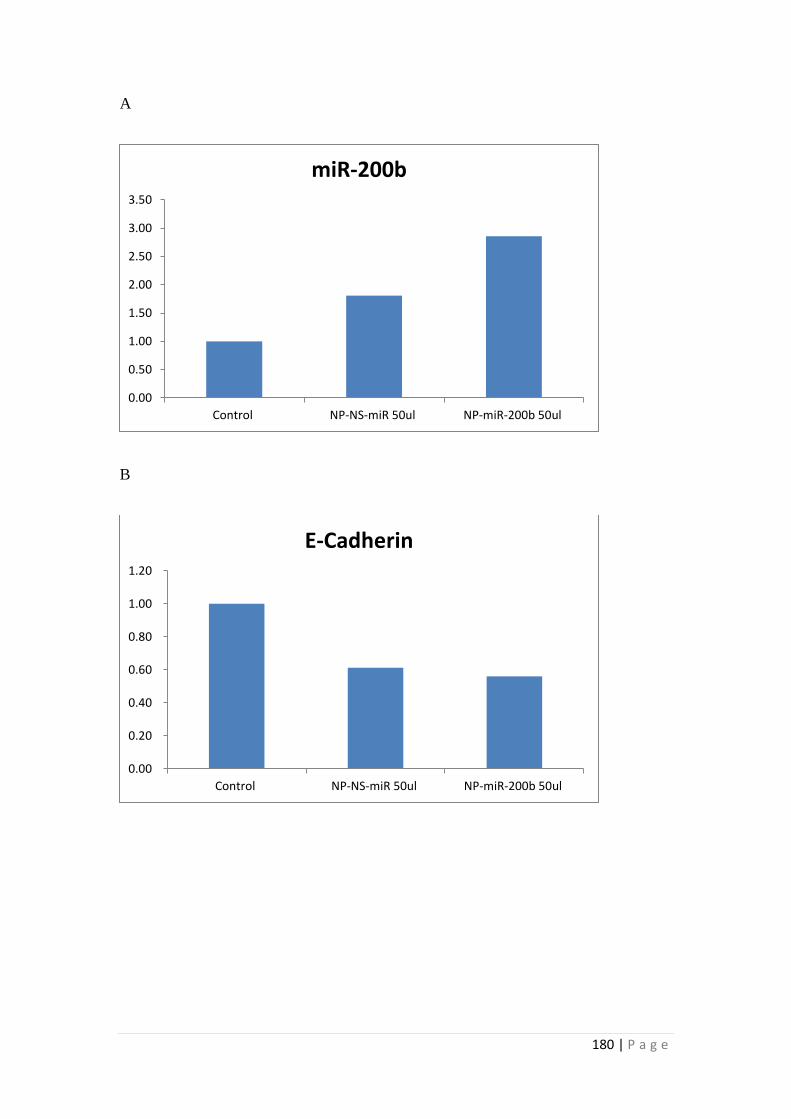
180 | P a g e
A
B
0.00
0.50
1.00
1.50
2.00
2.50
3.00
3.50
Control NP-NS-miR 50ul NP-miR-200b 50ul
miR-200b
0.00
0.20
0.40
0.60
0.80
1.00
1.20
Control NP-NS-miR 50ul NP-miR-200b 50ul
E-Cadherin
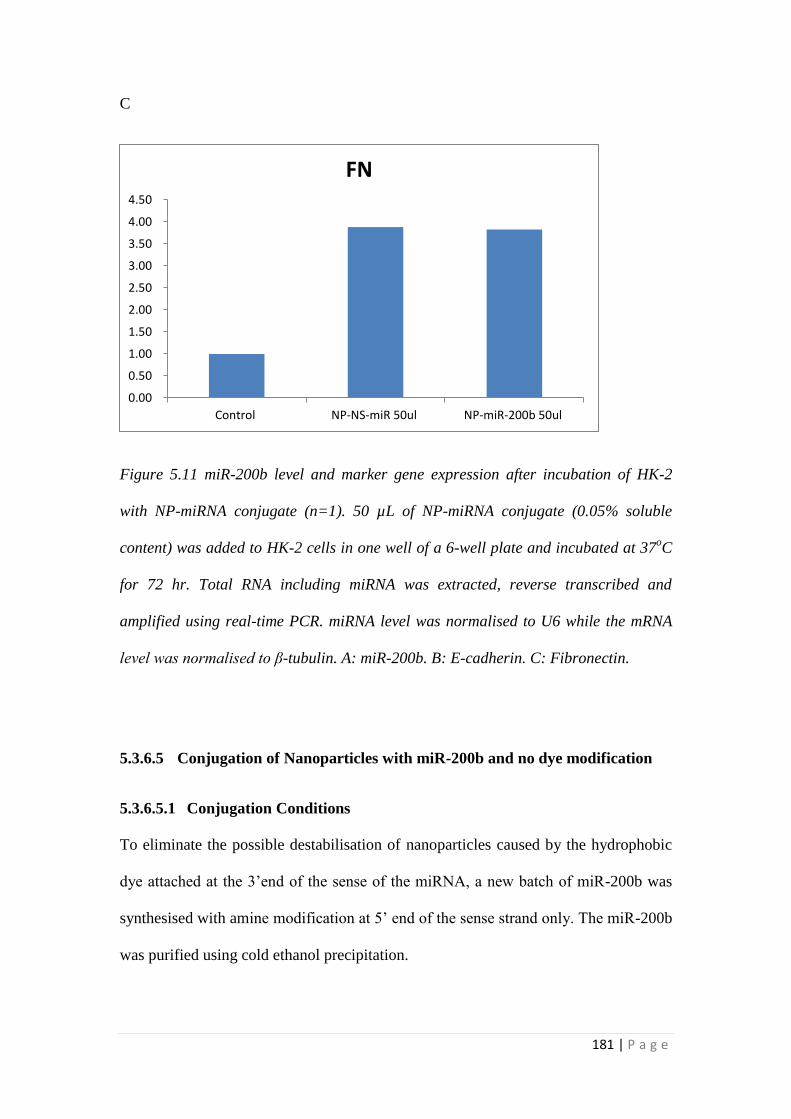
181 | P a g e
C
Figure 5.11 miR-200b level and marker gene expression after incubation of HK-2
with NP-miRNA conjugate (n=1). 50 µL of NP-miRNA conjugate (0.05% soluble
content) was added to HK-2 cells in one well of a 6-well plate and incubated at 37oC
for 72 hr. Total RNA including miRNA was extracted, reverse transcribed and
amplified using real-time PCR. miRNA level was normalised to U6 while the mRNA
level was normalised to β-tubulin. A: miR-200b. B: E-cadherin. C: Fibronectin.
5.3.6.5 Conjugation of Nanoparticles with miR-200b and no dye modification
5.3.6.5.1 Conjugation Conditions
To eliminate the possible destabilisation of nanoparticles caused by the hydrophobic
dye attached at the 3’end of the sense of the miRNA, a new batch of miR-200b was
synthesised with amine modification at 5’ end of the sense strand only. The miR-200b
was purified using cold ethanol precipitation.
0.00
0.50
1.00
1.50
2.00
2.50
3.00
3.50
4.00
4.50
Control NP-NS-miR 50ul NP-miR-200b 50ul
FN

182 | P a g e
To conjugate, 500 µL (0.5% soluble content) freshly manufactured nanoparticles were
activated by the addition of 4.81x10⁻⁷
g EDC and 2.89x10⁻⁷
g NHS (100% carboxylic
acid activation), followed by stirring at room temperature for 1 hr. 10 nmole of miR-
200b was added to the activated nanoparticles, which were then incubated overnight
at 4oC on a shaker. The conjugate mixture was then purified and washed using an
ultracentrifugation tube with a molecular cut-off size of 100 kDa. The retained NP-
miR-200b conjugate (150 µL) was quantitated using Nanodrop. The concentration of
miRNA in the NP-miR-200b conjugate was determined to be 241.57 ng/µL. This was
equivalent to 5% of all surface carboxyl groups (about 260 on each nanoparticle)
being conjugated to miR-200b. Noticeably, no precipitation was formed even after
high speed centrifugation (20,800 G for 5 mins).
5.3.6.5.2 In vitro transduction of HK-2 cells with NP-miR-200b
With confidence in the stability of the NP-miR-200b conjugate, HK-2 cells were
transduced with these newly conjugated nanoparticles. 50 µL and 20 µL of the NP-
miR-200b conjugate were added to each well of HK-2 cells on a 6-well plate
separately. Cells were incubated for 72 hrs before total RNA was extracted and
analysed. miR-200b level increased by 169% and 58% (n=1) in HK-2 cells incubated
with 50 µL and 20 µL NP-miR-200b conjugate respectively, when compared to
control (Figure 5.12A). However, the NP-miR-200b conjugate did not exert the
expected effects on the expression of E-cadherin and fibronectin (Figure 5.12B, C).
Hence it was concluded that the steric hindrance exerted by the nanoparticles
significantly reduced the accessibility of miRNA to the miRNA processing protein
complex, such as dicer, which is essential for functional miRNA gene regulation.
Conversely, the same hindrance may also inhibit the reverse transcription of miRNA

183 | P a g e
by repelling the reverse transcription protein machinery. Thus, a cleavable bond
between the nanoparticle and the miRNA, such as disulphide bond instead of an
unbreakable bond, such as the amide bond used, may significantly increase the
functional gene regulation by miR-200b once it is inside the cell.

184 | P a g e
A
B
0.00
0.50
1.00
1.50
2.00
2.50
3.00
CONTROL NP-miR-200b 50µL NP-miR-200b 20µL
miR-200b
0.00
0.20
0.40
0.60
0.80
1.00
1.20
CONTROL NP-miR-200b 50µL NP-miR-200b 20µL
E-Cadherin
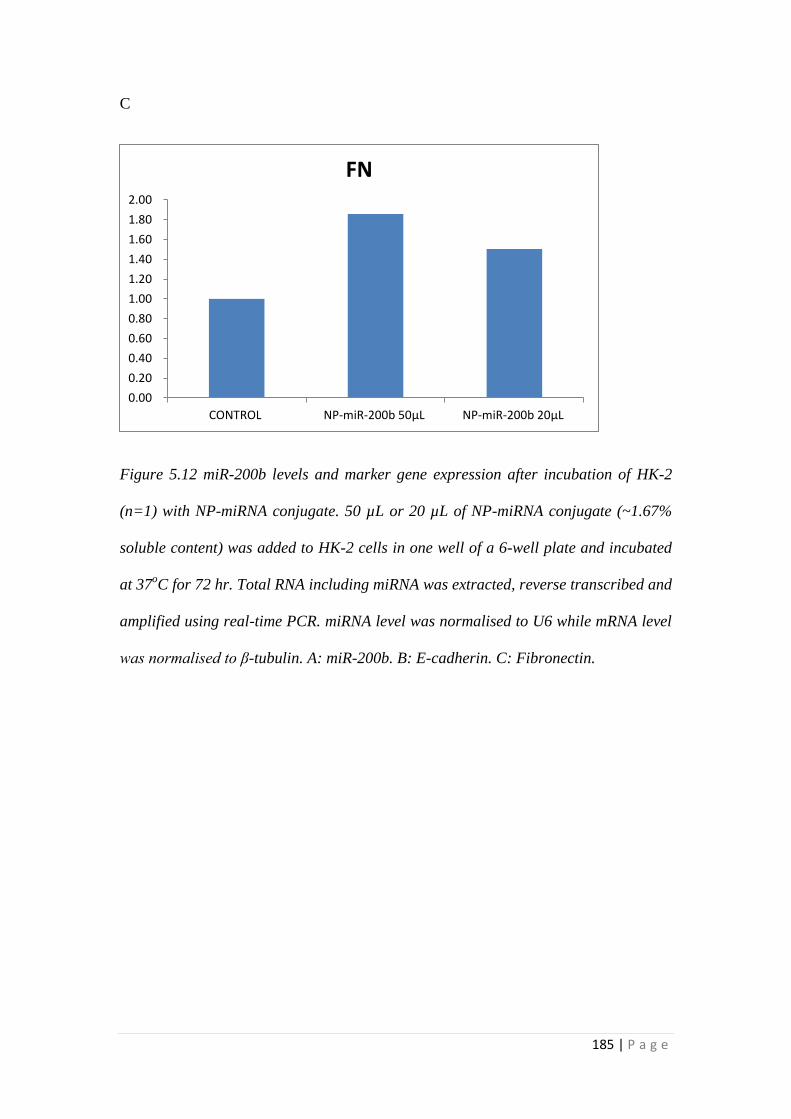
185 | P a g e
C
Figure 5.12 miR-200b levels and marker gene expression after incubation of HK-2
(n=1) with NP-miRNA conjugate. 50 µL or 20 µL of NP-miRNA conjugate (~1.67%
soluble content) was added to HK-2 cells in one well of a 6-well plate and incubated
at 37oC for 72 hr. Total RNA including miRNA was extracted, reverse transcribed and
amplified using real-time PCR. miRNA level was normalised to U6 while mRNA level
was normalised to β-tubulin. A: miR-200b. B: E-cadherin. C: Fibronectin.
0.00
0.20
0.40
0.60
0.80
1.00
1.20
1.40
1.60
1.80
2.00
CONTROL NP-miR-200b 50µL NP-miR-200b 20µL
FN

186 | P a g e
5.4 Discussion
In this chapter, the possibility of using a novel type of nanoparticles to deliver
miRNA to the kidneys was examined. These nanoparticles were intentionally
designed and manufactured to be approximately 25nm, so that, after functionalization,
the final size would be less than 40nm. At this size, nanoparticles should be freely
filtered by the kidney glomerulus. However, other factors such as charge and shape
could also play key roles on the glomerular filtration of nanoparticles. In one study, a
single-walled carbon nanotube with sizes ranging from 100nm to 500nm passed freely
through the gl;omerular fenestration (Ruggiero et al., 2010). We have clearly
demonstrated the efficient and rapid cellular incoporporation of these nanoparticles.
This is of key importance for systemic in vivo applications to avoid degradation and
clearance.
The nanoparticles were designed to be negatively charged to reduce cell toxicity
(Kanasty et al., 2013). Thus, the negatively charged miRNA cannot be
electrostatically bound to the nanoparticles. A stronger bond has to be created to not
only overcome the repulsion but also hold the cargo miRNA to the nanoparticles.
Initially, a covalent amide bond was established by conjugating the carboxyl groups at
end the surface of nanoparticles to the amine functional groups at the 5’ end of the
passenger strand (sense strand) of modified miRNA. However, no silencing was
observed even after high conjugation and delivery efficiency was achieved in HK-2
cells treated with these nanoparticles. It has been reported that chemical modification
can abolish the silencing effects of siRNA. This was mainly due to the fact that, in
order to be recognised by the RISC protein complex, the 5’ terminus of the antisense
strand has to be phosphorylated (Chiu and Rana, 2002; Ma et al., 2005; Nykanen et al.,
2001). Blocking all four sites of the dsRNA significantly diminished the RNAi effect

187 | P a g e
while blocking both 5’ and 3’ of the sense strand or the 3’ of the antisense strand
retained the silencing effects (Czauderna et al., 2003). Thus, the chemical
modification in this study should not be the reason for the lack of change in
expression level of target genes. The size of nanoparticles was then considered. The
double stranded miRNA has to be processed by Dicer and loaded onto RISC protein
complex in order to function. The estimated size of the miRNA is 15kDa while the
size of nanoparticles is ~700kDa. Furthermore, the amide bond is stable and cannot be
broken inside the cell to release miRNA. Thus steric hindrance exerted by
nanoparticles may prevent the miRNA from being processed. Unbreakable bonds
such as amide bonds have been used in conjugation of dsRNA with functional motifs
while maintaining silencing effects. However, they are usually small molecules that
have comparable size to the delivered dsRNA (Jeong et al., 2009). It was then
decided to incorporate a degradable linker into the delivery system so that the miRNA
cargo can be release inside the cytoplasm under reduced condition. It is proposed that
a pyridyl disulfide cystreamine linker will be conjugated to the nanoparticles before
linking the thiol modified miRNA to the linker. This project is in progress.
The bio-distribution demonstrated that liver retained the highest level of nanoparticles
while kidney had less but significant amount of nanoparticles. However, these
nanoparticles have not been functionalised to bind specifically to kidneys yet. Since
the sodium glucose co-transporter 2 (SGLT2) is expressed only in the proximal
tubular cells (Komala et al., 2013), it naturally becomes a good target for nanoparticle
binding. Antibodies against SGLT2 are be a good candidate to conjugate to
nanoparticles for proximal tubular cell targeted delivery. However, antibody is
expensive and it is generally difficult to conjugate peptides to other molecules.
Aptamers are single stranded DNA or RNA sequences that are usually 60-80 bases in

188 | P a g e
length and possess certain 3D structures which allow them to have high affinities to
other molecules including proteins (Cox et al., 2002). Many aptamer have been
developed and the first aptamer based drug Macugen was approved in 2006 for
treating age-related macular degeneration (http://en.wikipedia.org/wiki/Pegaptanib).
By attaching an aptamer which has high affinity with SGLT2, it is believed that the
internalisation of nanoparticles by proximal tubular cells will greatly increase. The
same chemical reaction used to conjugate miRNA to the nanoparticles can be applied
to attach the aptamer. Furthermore the direct link between miRNA and aptamer, thus
a DNA-RNA chimera, could also be developed for targeted delivery of miR-200b to
proximal tubular cells. A DNA based aptamer against SGLT2 is currently being
developed by selecting the aptamer pool against the proximal tubular cells (Sefah et
al., 2010). Once developed and conjugated, these nanoparticles will be tested for the
targeted delivery of miRNA and later be used for delivery any cargos to proximal
tubular cells.
189 | P a g e
6 Chapter 6 Role of PMEPA1 in Renal Fibrosis
6.1 Specific background and objectives
As described in Chapter 1, TGFβ1 plays a key role in the pathogenesis and
progression of nephropathy. Central to TGFβ1 mediated cellular modification is the
SMAD signalling pathway, whose importance has been extensively established.
Subsequent targeting of SMAD signalling in various models of renal fibrosis to
achieve reno-protective effects has demonstrated positive results, which confirmed the
SMAD pathway as a promising therapeutic target. Recently, a natural biological
molecule called Prostate Transmembrane Protein, Androgen Induced (PMEPA1) has
been shown to be able to antagonise the TGFβ-SMAD signalling pathway by
preventing SMAD phosphorylation and translocation into the nucleus (Watanabe et
al., 2010). Interestingly, PMEPA1 itself is induced by TGFβ1 and hence forms a
negative feedback loop to TGFβ signalling. As outlined in the previous chapter, miR-
200b can further elevate PMEPA1 levels in addition to the auto induction of TGFβ,
indicating a further mechanism whereby miR-200b mediates its anti-fibrosic
properties. Furthermore, PMEPA1 can selectively target R-SMAD (SMAD2, 3),
providing a highly specific target for inhibiting the profibrotic SMAD signalling
pathway, whilst leaving the antifibrotic ‘reno-protective’ SMAD7 signalling intact
(Liu et al., 2011). Thus the efficacy of using PMEPA1 as a therapeutic agent in
preventing renal fibrosis was examined in this study. Additionally, the roles of
PMEPA1 in several signalling pathways, independent of SMAD signalling were
studied in the context of renal fibrosis.
Immortalised human proximal tubular epithelial cells (HK-2) were used in this study
and TGFβ1 was used to induce cellular fibrotic responses and EMT. Gain and loss of
190 | P a g e
function methodology were used to study the role of PMEPA1 in preventing TGFβ1
induced cellular fibrotic responses and EMT.
The specific aims of this study were to determine the effect of PMEPA1:
1. on the expression of renal tubular cell E-Cadherin
2. in preventing TGFβ1 induced renal tubular cell profibrogenic responses
3. in preventing EMT
4. in TGFβ signalling, both SMAD dependent and SMAD pathways independent
in the context of renal fibrosis.
191 | P a g e
6.2 Materials and Methods
6.2.1 Cell culture of HK-2 cells and TGFβ1 exposure
Immortalised human proximal tubular epithelial cells (HK-2) from American Type
Cell Collection (ATCC, USA) were used in this study. HK-2 cells were grown in
KSFM (Life Technologies, USA) supplemented with 5ng/mL recombinant EGF and
0.05mg/mL bovine pituitary extract in 6-well plates (Thermo Fisher Scientific, USA)
and incubated in 5% CO2 and 95% air at 37oC. Cells were passaged constantly at a
sub-confluent stage to maintain a healthy epithelial cell phenotype.
6.2.2 Transient knockdown of PMEPA1
PMEPA1 specific siRNAs were designed using siRNAWizard
(http://www.sirnawizard.com/) and obtained from GenePharma (Shanghai, China).
siRNAs were synthesized as a double stranded RNA duplex and delivered in powder
form for increased stability. siRNAs were then reconstituted into 25μM stock
solution with RNAse-free water (Life Technologies, USA) and aliquoted before being
stored at -80oC.
HK-2 cells were seeded at 50% confluence in 6-well plates 16 hr prior to transfection.
On the day of transfection, the cells were washed with 500μL Opti-MEM medium
(Life Technologies, USA) and incubated with a further 500μL Opi-MEM until the
addition of the transfection complex. 5μL of Lipofectamine2000 (Life Technologies,
USA) was diluted in 250μL Opi-MEM, while PMEPA1 siRNA was mixed with
250μL Opi-MEM. Diluted Lipofectamine2000 and siRNA was incubated for 5 min at
room temperature before being mixed and incubated for a further 15 min for complex
formation. 500μL fresh medium was applied followed by the addition of the PMEPA1
siRNA transfection complex.

192 | P a g e
The transfected cells were incubated for 6 hrs at 37 oC, in 5% CO2 and 95% air before
2mL of complete KSFM medium was added and incubated overnight. On the next day,
the experimental conditions were applied for 48 hrs at which time mRNA and protein
lysate were collected for further studies.
6.2.3 Transient over-expression of PMEPA1
6.2.3.1 Generating the PMEPA1 gene insert
The PMEPA1 coding sequence with 5’ and 3’ overhang was produced for insertion
into the plasmid construct. This was achieved by the following 3 steps:
1. Amplification of the PMEPA1 coding region from either genomic DNA or
the cDNA library
2. Adding restriction enzyme recognition sites at both ends of the PMEPA1 gene
3. Restriction enzyme endonuclease digestion to ensure annealing
6.2.3.1.1 Amplification of the PMEPA1 coding region from either genomic DNA
or the cDNA library
Primers that amplify the coding region of the PMEPA1 gene with/without restriction
enzyme recognition sites were designed. The sequences designed are shown below
with restriction enzyme recognition sites in bold (Table 6.1). A NheI recognition site
was added to the forward primer while a BamHI recognition site was added to the
reverse primer. 4bp random nucleotides were added to the 5’ of the sequence for
improved restriction digestion efficiency.
PMEPA1 F ATGCACCGCT TGATGGGGGT
PMEPA1 R CTAGAGAGGG TGTCCTTTCTGTTTATCCTT CTCT

193 | P a g e
PMEPA1 F -
NheI
TATGGCTAGCATGCACCGCT TGATGGGGGT
PMEPA1 R-
BamHI
CAGTGGATCCCTAGAGAGGGTGTCCTTTCTGTTTATCCTT
CTCT
Table 6.1: Table summarising the sequences of primers used to amplify PMEPA1
cDNA.
1μL of genomic DNA (100 ng/μL) or cDNA (reverse transcribed from 1 μg HK-2
mRNA) was used as the template to amplify the coding sequence of PMEPA1 gene
using PfuUltra II Fusion HS DNA Polymerase (Agilent, USA). The template DNA
was mixed with 1 μL of each of the forward and reverse primers, 1.2 5μL of 10mM
dNTP mix, 5 μL of 10x reaction buffer, 1μL of PfuUltra II Fusion HS DNA
Polymerase and made up to 50 μL with RNAse free water.
The PMEPA1 gene was PCR amplified using the following protocol:
3. Initial denaturation: 95 oC 2 min for genomic DNA
1 min for cDNA
4. 3 step cycling for 30 cycles
a. Denaturation 95 oC 20 s
b.Annealing 55 oC 20 s
c.Extension 72 oC 45 s
5. Final extension 72 oC 3 min
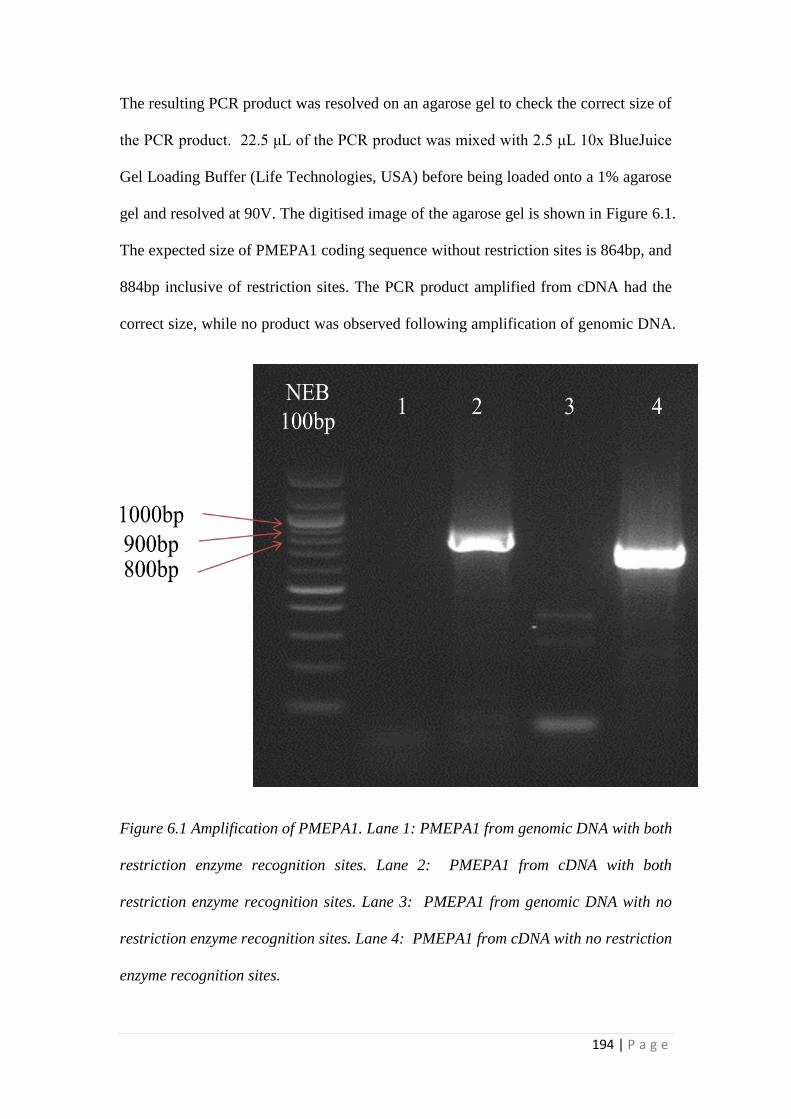
194 | P a g e
The resulting PCR product was resolved on an agarose gel to check the correct size of
the PCR product. 22.5 μL of the PCR product was mixed with 2.5 μL 10x BlueJuice
Gel Loading Buffer (Life Technologies, USA) before being loaded onto a 1% agarose
gel and resolved at 90V. The digitised image of the agarose gel is shown in Figure 6.1.
The expected size of PMEPA1 coding sequence without restriction sites is 864bp, and
884bp inclusive of restriction sites. The PCR product amplified from cDNA had the
correct size, while no product was observed following amplification of genomic DNA.
Figure 6.1 Amplification of PMEPA1. Lane 1: PMEPA1 from genomic DNA with both
restriction enzyme recognition sites. Lane 2: PMEPA1 from cDNA with both
restriction enzyme recognition sites. Lane 3: PMEPA1 from genomic DNA with no
restriction enzyme recognition sites. Lane 4: PMEPA1 from cDNA with no restriction
enzyme recognition sites.

195 | P a g e
6.2.3.1.2 Adding restriction enzyme recognition sites at either end of the
PMEPA1 gene
Since the PMEPA1 coding region with restriction recognition sites was successfully
directly amplified from cDNA, a secondary PCR round to add restriction recognition
sites was deemed unnecessary.
6.2.3.1.3 Restriction enzyme endonuclease digestion of amplified cDNA
The amplified PCR product was purified to remove proteins and salts that may
interfere with the restriction enzyme digestion using the MinElute PCR cleanup Kit
(Qiagen, USA) according to manufacturer’s instruction outlined in Chapter 2. NheI
and BamHI restriction endonucleases digestion were used to create “sticky ends” of
the PMEPAI1 gene insert. The digestion was performed in a sequential order. 2μg of
purified PCR product was mixed with 2μL 10x Buffer, 1 μL NheI restriction enzyme
(NEB, USA) and made up to 20μL with water. The mixture was incubated at 37oC for
2 hr followed by purification again to remove protein, salts and cleaved DNA
fragments. The eluted DNA was mixed with 2μL 10x buffer, 2μL BamHI restriction
enzyme (NEB, USA) and made up to 20μL with water. The mixture was incubated at
37oC for 1 hr and purified.
6.2.3.2 Plasmid vector preparation for cloning
The plasmid vector used in this experiment was pCDNA3.1 (Life Technologies,
USA). PMEPA1 was cloned into the multiple cloning site downstream of the CMV
promoter. Preparation included the following steps:
1. Transformation of competent cells
2. Selection and growing of bacterial cells containing the desired plasmid
196 | P a g e
3. Linearization of the plasmid vector using restriction enzymes.
6.2.3.2.1 Transformation of competent cells
The original pCDNA3.1 plasmid was diluted to 2ng/μL and 1μL of the diluted
plasmids was used to transform 50μL One ShotStbl3 chemically competent E. coli
cells (Life Technologies, USA). Briefly, 1μL diluted plasmid was added to one tube
of competent cells and mixed gently followed by incubation on ice for 30 min. The
competent cells were heat-shocked at 42oC for 45 s followed by another 2 min
incubation on ice. 250 μL S.O.C medium was added into the cells, which were then
incubated at 37 oC for 1 hr at 225rpm in a shaking incubator. After incubation, 100 μL
of the mixture was plated onto an agar plate containing 100 μg/mL ampicillin (Sigma-
Aldrich, USA). The plate was incubated at 37 oC overnight for colony formation.
6.2.3.2.2 Selection and growing bacterial cells containing desired plasmid
Colonies incorporating the plasmid were picked and grown in 5mL LB medium at 37
oC for 12-16 hr. A Plasmid miniprep was then performed using Qiagen Miniprep Kit
(Qiagen, USA). Extracted plasmid was then resolved on a 1% agarose gel to ensure
the correct size.
6.2.3.2.3 Linearization of plasmid vector using restriction enzyme
2μg of vector plasmid was mixed with 2μL 10x Buffer, 1 μL NheI restriction enzyme
(NEB, USA) and made up to 20μL with water. The mixture was incubated at 37oC for
2 hr followed purification again to remove protein, salts and cleaved DNA fragments.

197 | P a g e
The eluted DNA was mixed with 2μL 10x buffer, 2μL BamHI restriction enzyme
(NEB, USA) and made up to 20μL with water. The mixture was incubated at 37oC for
1 hr and purified. The linearised plasmid with both 5’ and 3’ sticky ends was then
exposed to shrimp alkaline phosphatase (Promega, USA) to remove the 5 ́phosphate
groups on the DNA backbone to prevent auto-ligation of the linearized DNA, using
the method outlined in Chapter 2. The resulting DNA was purified and eluted in water
and was then ready for cloning.
6.2.3.3 Molecular cloning and selection
The PMEPA1 cDNA and pCDNA3.1 plasmid vector, both with sticky ends were then
ligated. 1:3 molar ratio of vector to insert DNA was used. 100 ng linearised
pCDNA3.1 plasmid was mixed with 35 ng PMEPA1 cDNA in the presence of 1 μL
10x ligation buffer, 1 μL of T4 DNA ligase (NEB, USA) and water to 10 μL. The
mixture was then incubated at 4oC overnight. A negative control was also examined
using identical experimental conditions but without the addition of the insert DNA.
2 μL of the ligation mix was the used to transform 50 μL One ShotStbl3 chemically
competent E. coli cells (Life Technologies, USA) using the method described in
section 5.2.3.2.1. The transformed E.coli from both positive and negative tubes were
plated onto agar plates containing 100μg/mL ampicillin and incubated at 37oC
overnight. The number of colonies on each plate were counted. Transformation was
considered successful (more than 50% colonies contain the inserted gene) only when
positive plates had significantly more (at least ≥2 times more) colonies than negative
plates. 5 colonies from positive plates were inoculated into 5 mL LB medium and
incubated at 37 o
C for overnight at 225rpm in a shaking incubator. Plasmid was
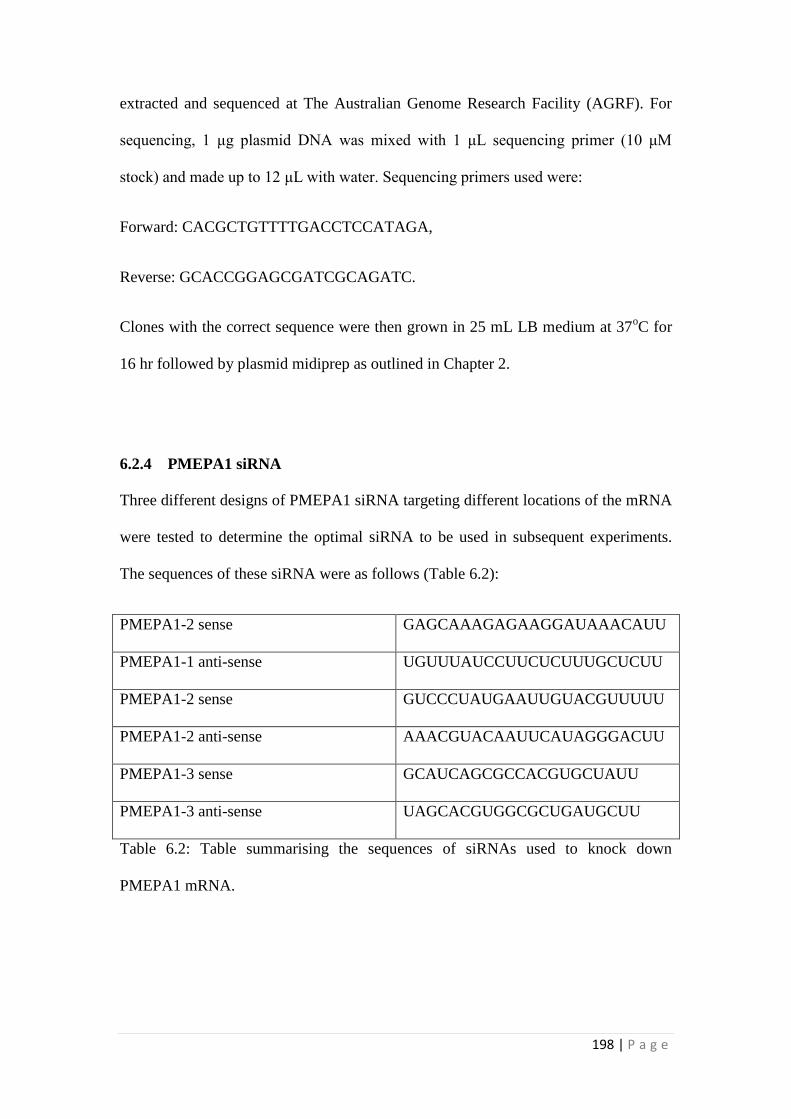
198 | P a g e
extracted and sequenced at The Australian Genome Research Facility (AGRF). For
sequencing, 1 μg plasmid DNA was mixed with 1 μL sequencing primer (10 μM
stock) and made up to 12 μL with water. Sequencing primers used were:
Forward: CACGCTGTTTTGACCTCCATAGA,
Reverse: GCACCGGAGCGATCGCAGATC.
Clones with the correct sequence were then grown in 25 mL LB medium at 37oC for
16 hr followed by plasmid midiprep as outlined in Chapter 2.
6.2.4 PMEPA1 siRNA
Three different designs of PMEPA1 siRNA targeting different locations of the mRNA
were tested to determine the optimal siRNA to be used in subsequent experiments.
The sequences of these siRNA were as follows (Table 6.2):
PMEPA1-2 sense GAGCAAAGAGAAGGAUAAACAUU
PMEPA1-1 anti-sense UGUUUAUCCUUCUCUUUGCUCUU
PMEPA1-2 sense GUCCCUAUGAAUUGUACGUUUUU
PMEPA1-2 anti-sense AAACGUACAAUUCAUAGGGACUU
PMEPA1-3 sense GCAUCAGCGCCACGUGCUAUU
PMEPA1-3 anti-sense UAGCACGUGGCGCUGAUGCUU
Table 6.2: Table summarising the sequences of siRNAs used to knock down
PMEPA1 mRNA.
199 | P a g e
6.2.5 Establishing human proximal tubular epithelial cell line overexpressing
PMEPA1
In order to study the effects of PMEPA1 over-expression without the adverse effects
of transfection, lentivirus was used to transduce HK-2 cells to produce a human
kidney proximal tubular cell line that consistently over-expresses PMEPA1. Upon
infection, the replication inactivated lentivirus will insert the “cargos” which are
PMEPA1 driven by CMV promoter and GFP driven by EF1 promoter into the
genome of the host cell. The co-transduction of GFP gene with PMEPA1 provided a
simple but useful selection marker for identifying the positively transduced cells. The
stably transduced cells could then be used for experiment or stored in liquid nitrogen
until needed.
6.2.5.1 Cloning
PMEPA1 coding region was amplified using the methods outlined in section 5.2.3.
However, instead of pCDNA3.1, the insert was cloned into pCDH-CMV-MCS-EF1-
GFP plasmid (SBI, USA). The full sequence of this plasmid can be found at
http://www.systembio.com/support/resources/lentiviral-tech/vector-sequences.
6.2.5.2 Lentivirus packaging
HKE293T cells were seeded on to T75 tissue culture flask with 20mL complete
medium (DMEM, high glucose, GlutaMax, Pyruvate supplemented with 10% FBS) at
the density of 5 million cells per flask 24hr before the transfection. Mixtures of 4
plasmids carrying the “cargo” gene (pCDH-CMV-PMEPA1-EF1-GFP) as well as all
the necessary proteins (REV, GAG-POL, VSV-G) to assemble the lentivirus were co-

200 | P a g e
transfected into HEK293T cells. In details, 2.25μg pCDH-CMV-PMEPA1-EF1-GFP
and 22.5μL (11.25μg) pPack packaging plasmid mix (SBI, USA) were diluted in
1.35mL Opti-MEM medium before the addition of 13.5μL of X-tremeGENE HP
(Roche, USA) transfection reagent. The solution was gently mixed and incubated at
room temperature for 20mins before added to the HEK293T cells in a drop wise
manner. The flask was then gently swirled to evenly spread the transfection complex
and then incubated at 370C for 48hr.
6.2.5.3 Lentivirus collection, purification and concentrating
48hr post transfection, cell supernatant containing mature lentivirus (replication
inactivated) was collected and filtered using a 0.45μm low protein binding filter
(Millipore, USA). The volume of filtered supernatant was measured and then mixed
with ¼ volume of 5x PEG-IT Virus Precipitation Solution (SBI, USA). The
supernatant/PEG-IT solution was stored at 40C for 24hr to allow lentivirus to
precipitate to the bottom of the tube followed by centrifugation at 1500g for 30min.
The supernatant was then removed and the lentivirus pellet was resuspended in 1/50
original volume in PBS solution. The resuspended lentivirus was either used straight
away or stored at -800C for future use.
6.2.5.4 Lentiviral Transduction of HK-2 cells
HK-2 cells were seeded onto 6-well plate in 2mL complete medium at the density of
0.2 million cells per well 24hr before the addition of lentivirus. Various amounts of
lentivirus were added toeach well of HK-2 cells in order to find the optimal
transduction concentration and the plate was then incubated at 370C. To verify
201 | P a g e
successful transduction, cells were observed under a fluorescent microscope 48hr post
addition of the lentivirus for GFP expression. Wells demonstrating about 80-90%
positive cells indicate ideal transduction efficiency and were used for colony selection.
6.2.5.5 Positive Colony Selection
HK-2 cells demonstrating the ideal transduction efficiency were passaged every 2
days for 10 passages and GFP expression was closely monitored to ensure stable
integration of the inserted gene. In order to get a colony originating from a single cell,
transduced HK-2 cells were trypsinised from the plate, washed, diluted and seeded
onto 96-well plates in 100μL complete medium at the density of 1 cell per well. The
96-well plate was then incubated at 370C for 7 days allowing the colonies to grow.
Positive colonies with a majority of cells expressing GFP were picked and sub-
cultured.

202 | P a g e
6.3 Results
6.3.1 Selection of the optimal siRNA for PMEPA1 knockdown
Three PMEPA1 siRNA constructs were designed to target different locations of the
PMEPA1 mRNA and tested to determine the optimal siRNA for use in subsequent
experiments. siRNA was transfected into HK-2 cells, with or without TGFβ1
exposure 24 hr post transfection. PMEPA1 mRNA level was measured using real-
time PCR. PMEPA1 siRNA-1 reduced PMEPA1 mRNA by 61% in the absence of
TGFβ1 and 64% in the presence of TGFβ, compared to non-specific siRNA (Figure
6.2). Thus PMEPA1 siRNA -1 was used in the subsequent experiments to determine
the effects of silencing PMEPA1 gene expression.
PMEPA1 Knockdown (Absence of TGF-beta)
NS
SiR
NA
PM
EP
A1
KD
siR
NA
1
PM
EP
A1
KD
siR
NA
2
PM
EP
A1
KD
siR
NA
3
0.0
0.5
1.0
1.5
2.0
*
Rela
tive E
xp
ressio
n/
Tu
bu
lin
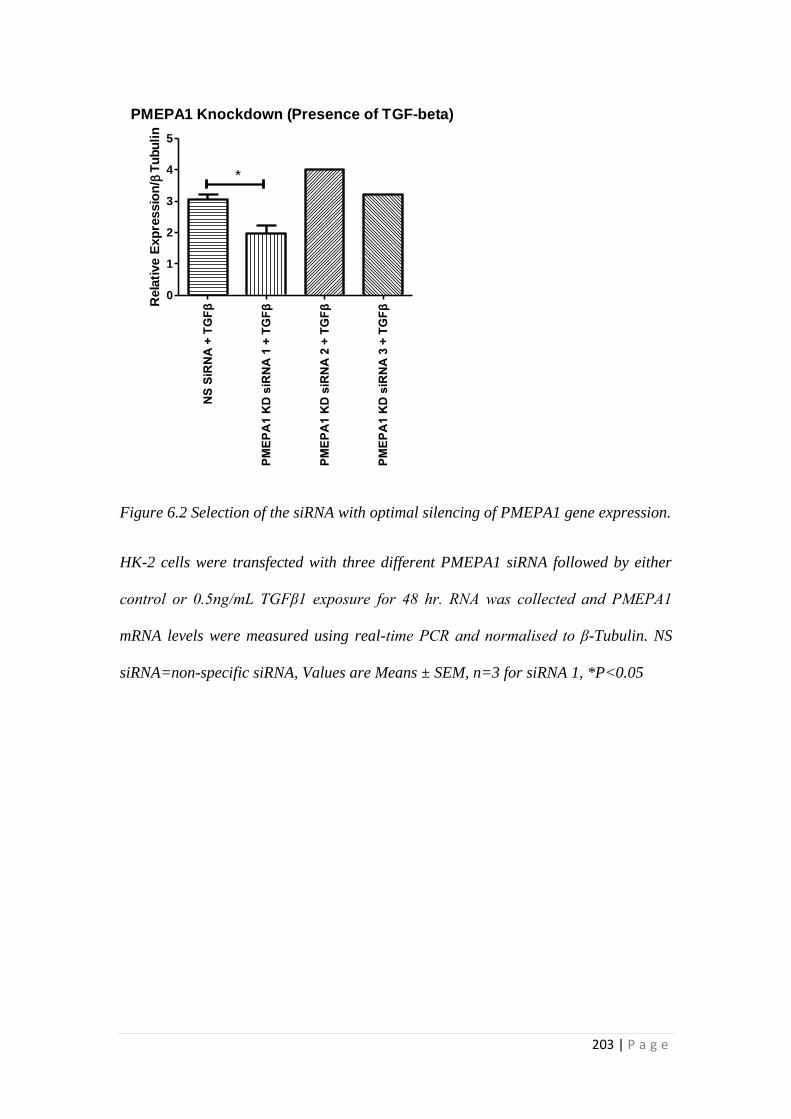
203 | P a g e
PMEPA1 Knockdown (Presence of TGF-beta)
NS
SiR
NA
+ T
GF
β
PM
EP
A1
KD
siR
NA
1 +
TG
Fβ
PM
EP
A1
KD
siR
NA
2 +
TG
Fβ
PM
EP
A1
KD
siR
NA
3 +
TG
Fβ
0
1
2
3
4
5
*
Rela
tive E
xp
ressio
n/
Tu
bu
lin
Figure 6.2 Selection of the siRNA with optimal silencing of PMEPA1 gene expression.
HK-2 cells were transfected with three different PMEPA1 siRNA followed by either
control or 0.5ng/mL TGFβ1 exposure for 48 hr. RNA was collected and PMEPA1
mRNA levels were measured using real-time PCR and normalised to β-Tubulin. NS
siRNA=non-specific siRNA, Values are Means ± SEM, n=3 for siRNA 1, *P<0.05
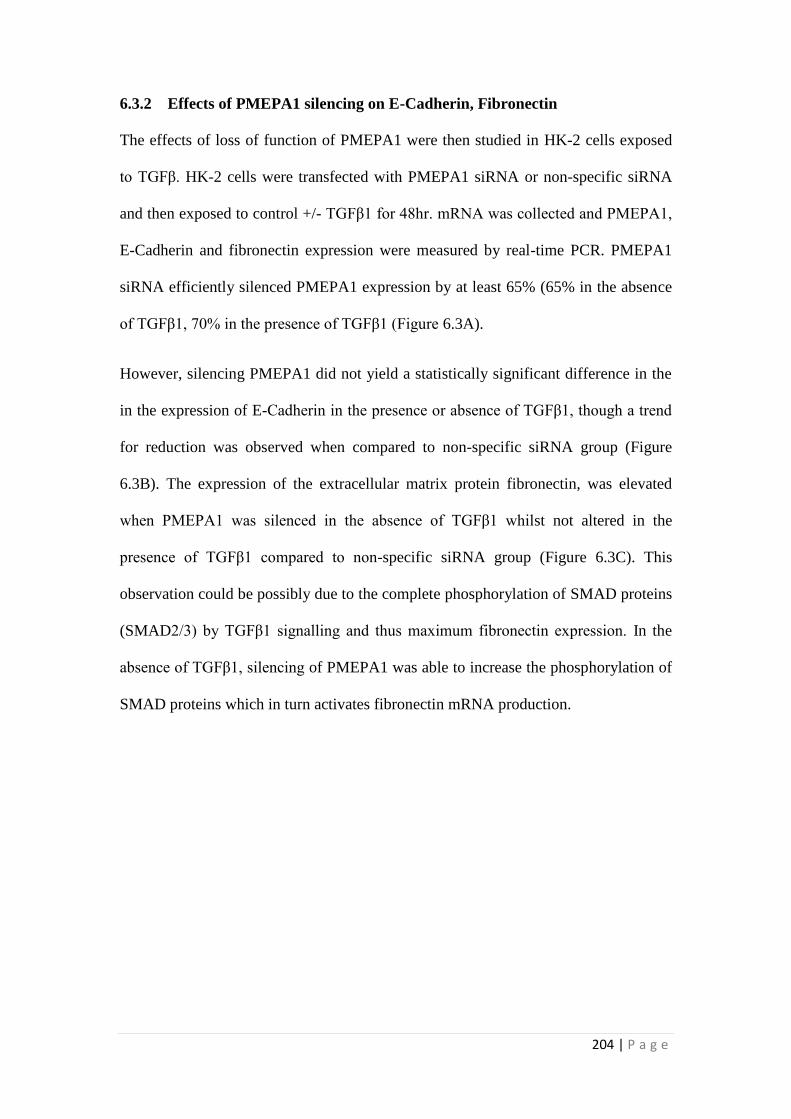
204 | P a g e
6.3.2 Effects of PMEPA1 silencing on E-Cadherin, Fibronectin
The effects of loss of function of PMEPA1 were then studied in HK-2 cells exposed
to TGFβ. HK-2 cells were transfected with PMEPA1 siRNA or non-specific siRNA
and then exposed to control +/- TGFβ1 for 48hr. mRNA was collected and PMEPA1,
E-Cadherin and fibronectin expression were measured by real-time PCR. PMEPA1
siRNA efficiently silenced PMEPA1 expression by at least 65% (65% in the absence
of TGFβ1, 70% in the presence of TGFβ1 (Figure 6.3A).
However, silencing PMEPA1 did not yield a statistically significant difference in the
in the expression of E-Cadherin in the presence or absence of TGFβ1, though a trend
for reduction was observed when compared to non-specific siRNA group (Figure
6.3B). The expression of the extracellular matrix protein fibronectin, was elevated
when PMEPA1 was silenced in the absence of TGFβ1 whilst not altered in the
presence of TGFβ1 compared to non-specific siRNA group (Figure 6.3C). This
observation could be possibly due to the complete phosphorylation of SMAD proteins
(SMAD2/3) by TGFβ1 signalling and thus maximum fibronectin expression. In the
absence of TGFβ1, silencing of PMEPA1 was able to increase the phosphorylation of
SMAD proteins which in turn activates fibronectin mRNA production.
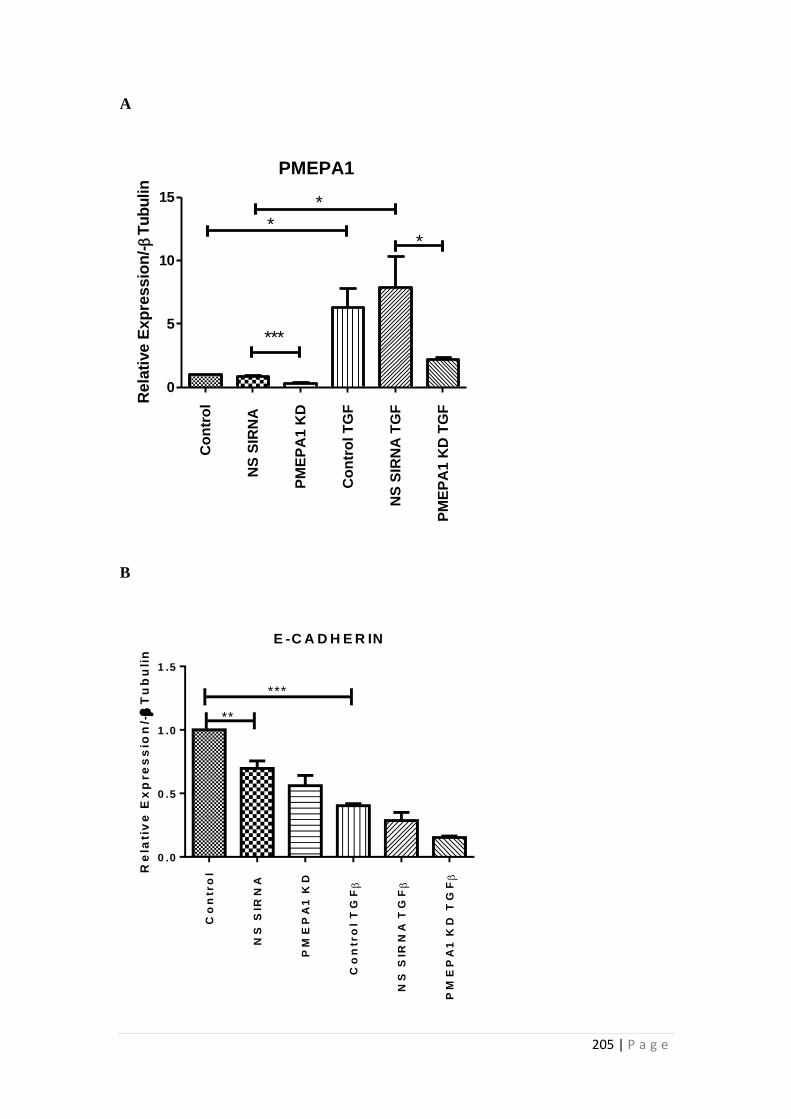
205 | P a g e
A
PMEPA1
Co
ntr
ol
NS
SIR
NA
PM
EP
A1
KD
Co
ntr
ol T
GF
NS
SIR
NA
TG
F
PM
EP
A1
KD
TG
F
0
5
10
15
***
*
*
*
Rela
tive E
xp
ressio
n/-
Tu
bu
lin
B
E -C A D H E R IN
Co
ntr
ol
NS
SIR
NA
PM
EP
A1
KD
Co
ntr
ol
TG
F
NS
SIR
NA
TG
F
PM
EP
A1
KD
TG
F
0 .0
0 .5
1 .0
1 .5
***
**
Re
lati
ve
Ex
pre
ss
ion
/-
Tu
bu
lin

206 | P a g e
C
F ib r o n e c t in
Co
ntr
ol
NS
SIR
NA
PM
EP
A1
KD
Co
ntr
ol
TG
F
NS
SIR
NA
TG
F
PM
EP
A1
KD
TG
F
0
1
2
3
4
5
*
Re
lati
ve
Ex
pre
ss
ion
/-
Tu
bu
lin
***
Figure 6.3 Effects of PMEPA1 gene silencing.
HK-2 cells were transfected with 100nM PMEPA1 siRNA followed by either control
medium or 0.5ng/mL TGFβ1 for 48 hr. RNA was collected and PMEPA1, E-
cadherin and fibronectin mRNA level were measured using real-time PCR and
normalised to β-Tubulin. PMEPA1 silencing was expected to further reduce the
expression of E-Cadherin from that observed with TGFβ1. Although a trend for
reduction was observed, results did not reach statistical significance. Fibronectin
mRNA appeared to be increased by PMEPA1 silencing in the absence of TGFβ.
However, the result is not statistically significant. Values are Means ± SEM, n=3,
*P<0.05, **P<0.01, ***P<0.001

207 | P a g e
6.3.3 Effects of PMEPA1 over-expression on HK-2 cells
The effects of overexpression of PMEPA1 in human proximal tubular cells were then
determined. pCDNA3.1-PMEPA1 was transfected into HK-2 cells and cultured for 48
hrs in the presence or absence of 0.5ng/ml TGFβ1. mRNA was collected and
profibrogenic and EMT markers were examined.
6.3.3.1 Over-expression of PMEPA1
PMEPA1 mRNA expression was determined first to confirm successful transfection
and positive over-expression of PMEPA1 gene in HK-2 cells. The PMEPA1 mRNA
level that was increased by TGFβ1 (a 3.7 fold increase compared to control), was
further elevated 7.9 fold by transfection of pCDNA3.1-PMEPA1 plasmid when
compared to empty vector (Figure 6.4).
P M E P A 1
CO
NT
RO
L
TG
F
V.C
ON
TR
OL
+ T
GF
EV
+ T
GF
PM
EP
A1
+ T
GF
0
2 0
4 0
6 0
8 0
Re
lati
ve
Ex
pre
ss
ion
/RP
L1
1
***
***
Figure 6.4 Confirmation of PMEPA1 over-expression in HK-2 cells of. pCDNA3.1
was transfected into HK-2 cells which were then exposed to 0.5ng/mL TGFβ1 for 48
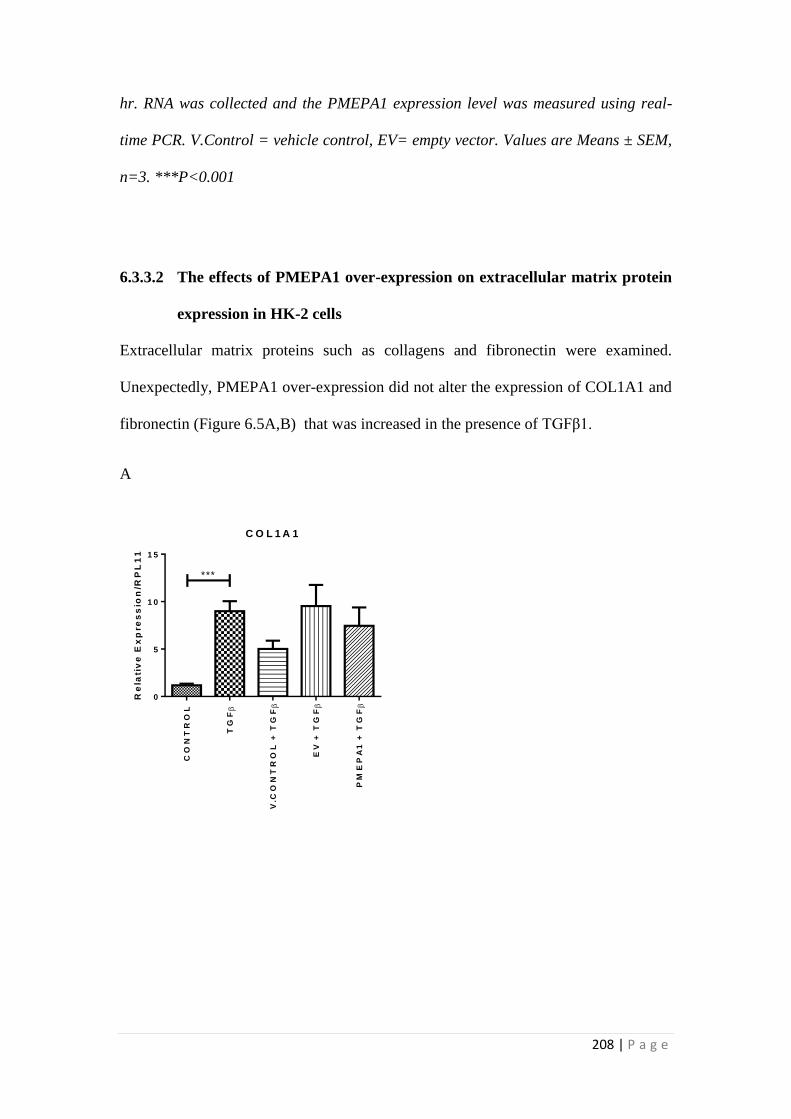
208 | P a g e
hr. RNA was collected and the PMEPA1 expression level was measured using real-
time PCR. V.Control = vehicle control, EV= empty vector. Values are Means ± SEM,
n=3. ***P<0.001
6.3.3.2 The effects of PMEPA1 over-expression on extracellular matrix protein
expression in HK-2 cells
Extracellular matrix proteins such as collagens and fibronectin were examined.
Unexpectedly, PMEPA1 over-expression did not alter the expression of COL1A1 and
fibronectin (Figure 6.5A,B) that was increased in the presence of TGFβ1.
A
C O L 1 A 1
CO
NT
RO
L
TG
F
V.C
ON
TR
OL
+ T
GF
EV
+ T
GF
PM
EP
A1
+ T
GF
0
5
1 0
1 5
Re
lati
ve
Ex
pre
ss
ion
/RP
L1
1
***

209 | P a g e
B
F IB R O N E C T IN
CO
NT
RO
L
TG
F
V.C
ON
TR
OL
+ T
GF
EV
+ T
GF
PM
EP
A1
+ T
GF
0
1
2
3
Re
lati
ve
Ex
pre
ss
ion
/RP
L1
1
***
Figure 6.5 Effects of PMEPA1 over-expression on extracellular matrix proteins in
HK-2 cells. pCDNA3.1-PMEPA1 was transfected into HK-2 cells before treatment
with 0.5ng/mL TGFβ1 for 48 hr. RNA was collected and expression levels of genes of
interest were measured using real-time PCR. V. Control = vehicle control, EV=
empty vector. Values are Means ± SEM, n=3. ***P<0.001
6.3.3.3 Impact of PMEPA1 over-expression on other genes of interest in HK-2
cells
Other genes of interest including EMT makers such as ZEB proteins, matrix
metalloproteinase and profibrogenic maker PAI-1 were also examined. Again MMP
expression demonstrated limited regulation by the significantly increased level of
PMEPA1, with the exception of MMP13, which was reduced 2 fold compared to
empty vector (Figure 6.6 A, B, C, D). These results cannot be explained by the known
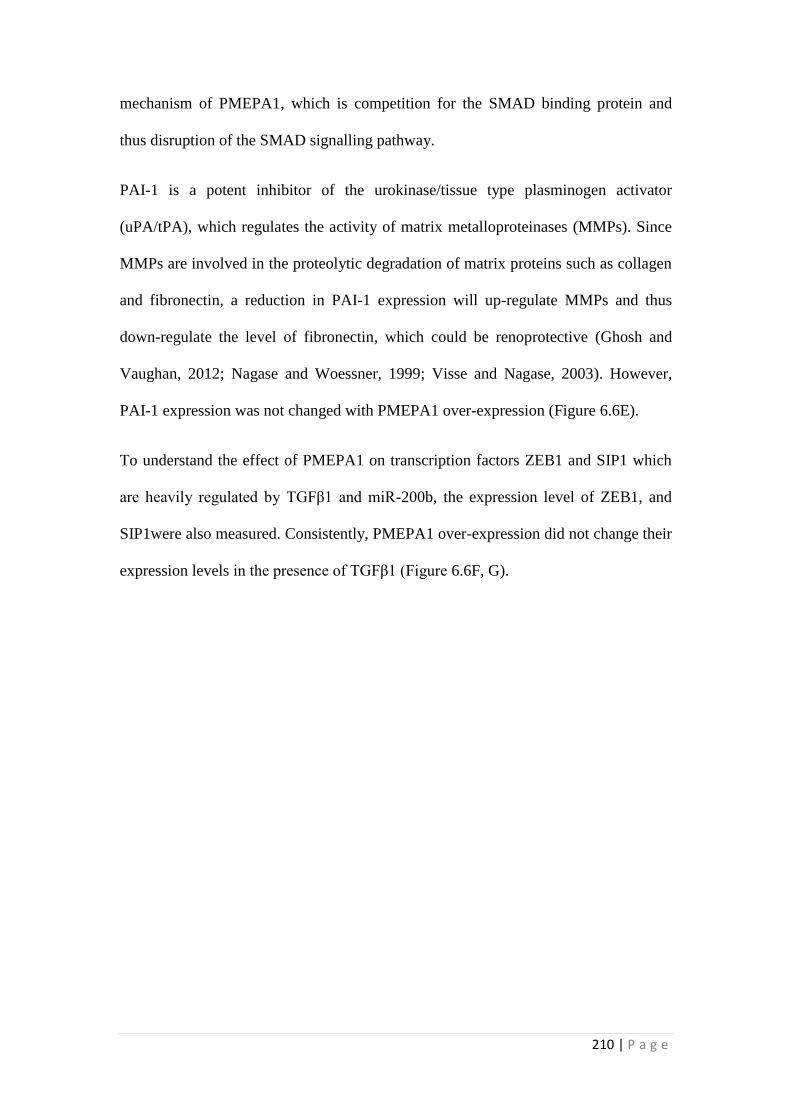
210 | P a g e
mechanism of PMEPA1, which is competition for the SMAD binding protein and
thus disruption of the SMAD signalling pathway.
PAI-1 is a potent inhibitor of the urokinase/tissue type plasminogen activator
(uPA/tPA), which regulates the activity of matrix metalloproteinases (MMPs). Since
MMPs are involved in the proteolytic degradation of matrix proteins such as collagen
and fibronectin, a reduction in PAI-1 expression will up-regulate MMPs and thus
down-regulate the level of fibronectin, which could be renoprotective (Ghosh and
Vaughan, 2012; Nagase and Woessner, 1999; Visse and Nagase, 2003). However,
PAI-1 expression was not changed with PMEPA1 over-expression (Figure 6.6E).
To understand the effect of PMEPA1 on transcription factors ZEB1 and SIP1 which
are heavily regulated by TGFβ1 and miR-200b, the expression level of ZEB1, and
SIP1were also measured. Consistently, PMEPA1 over-expression did not change their
expression levels in the presence of TGFβ1 (Figure 6.6F, G).

211 | P a g e
A
M M P 1
CO
NT
RO
L
TG
F
V.C
ON
TR
OL
+ T
GF
EV
+ T
GF
PM
EP
A1
+ T
GF
0
1 0
2 0
3 0
4 0
Re
lati
ve
Ex
pre
ss
ion
/RP
L1
1
**
B
M M P 2
CO
NT
RO
L
TG
F
V.C
ON
TR
OL
+ T
GF
EV
+ T
GF
PM
EP
A1
+ T
GF
0
5
1 0
1 5
Re
lati
ve
Ex
pre
ss
ion
/RP
L1
1
***
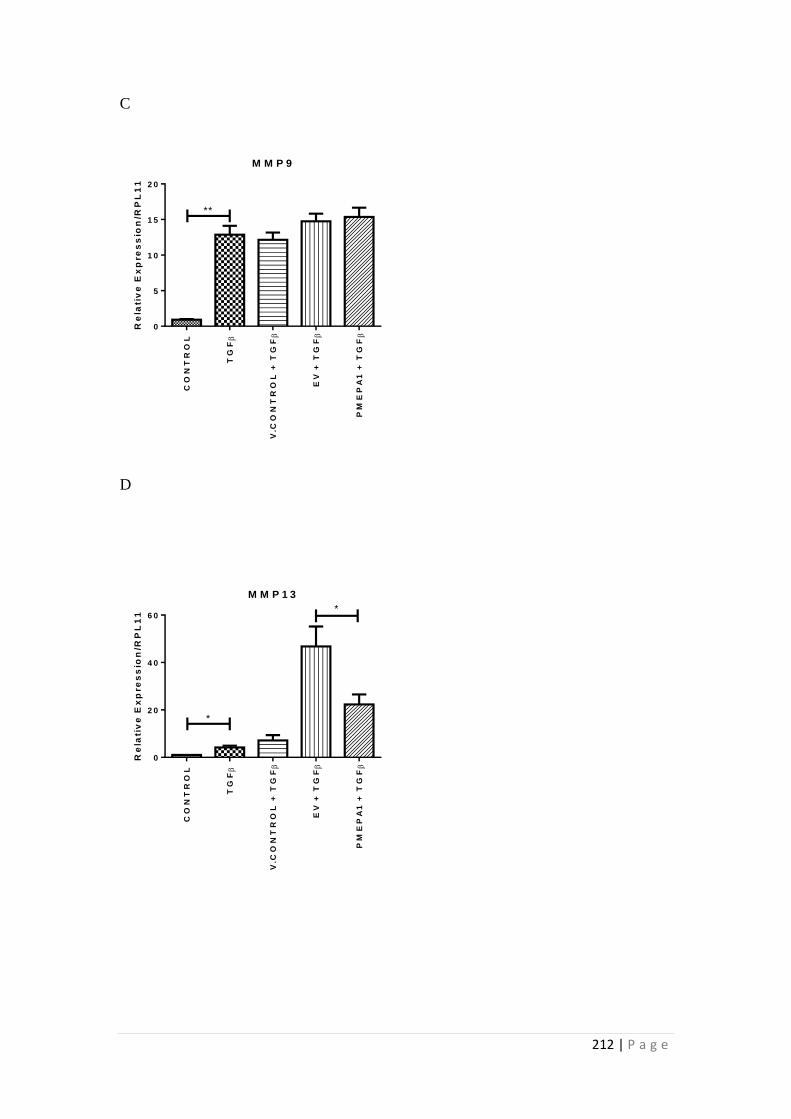
212 | P a g e
C
M M P 9
CO
NT
RO
L
TG
F
V.C
ON
TR
OL
+ T
GF
EV
+ T
GF
PM
EP
A1
+ T
GF
0
5
1 0
1 5
2 0
Re
lati
ve
Ex
pre
ss
ion
/RP
L1
1
**
D
M M P 1 3
CO
NT
RO
L
TG
F
V.C
ON
TR
OL
+ T
GF
EV
+ T
GF
PM
EP
A1
+ T
GF
0
2 0
4 0
6 0
Re
lati
ve
Ex
pre
ss
ion
/RP
L1
1
*
*
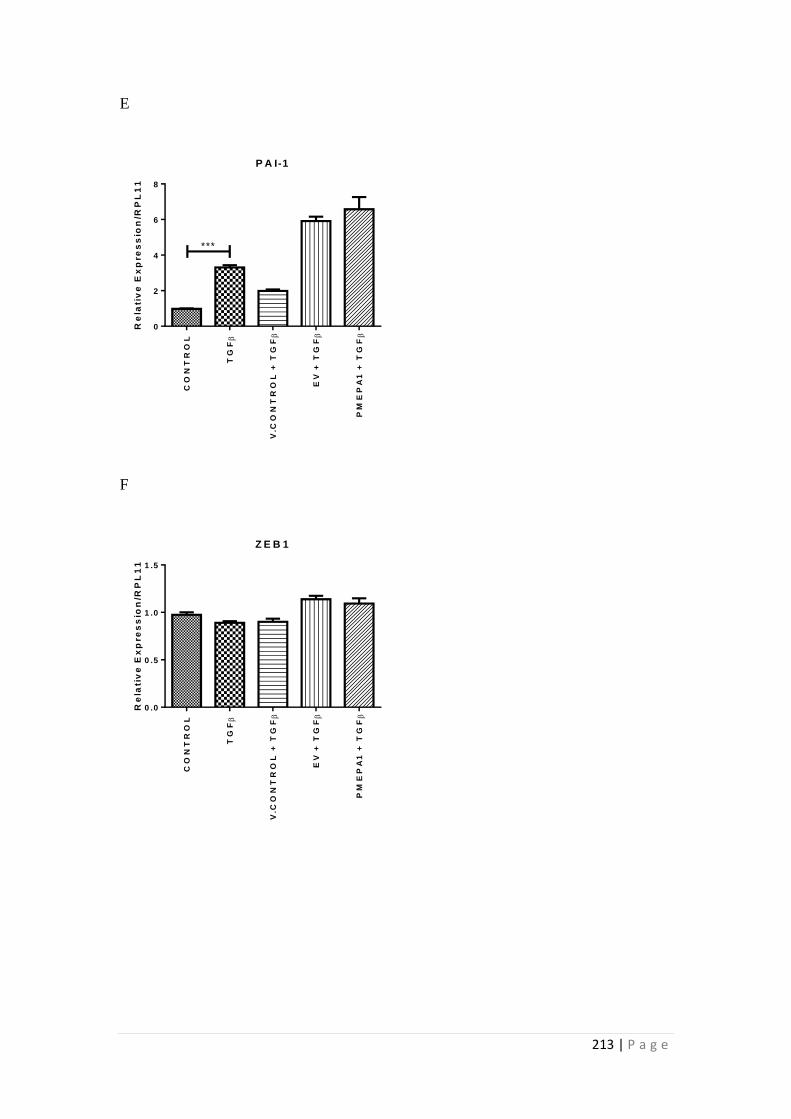
213 | P a g e
E
P A I-1
CO
NT
RO
L
TG
F
V.C
ON
TR
OL
+ T
GF
EV
+ T
GF
PM
EP
A1
+ T
GF
0
2
4
6
8
Re
lati
ve
Ex
pre
ss
ion
/RP
L1
1
***
F
Z E B 1
CO
NT
RO
L
TG
F
V.C
ON
TR
OL
+ T
GF
EV
+ T
GF
PM
EP
A1
+ T
GF
0 .0
0 .5
1 .0
1 .5
Re
lati
ve
Ex
pre
ss
ion
/RP
L1
1
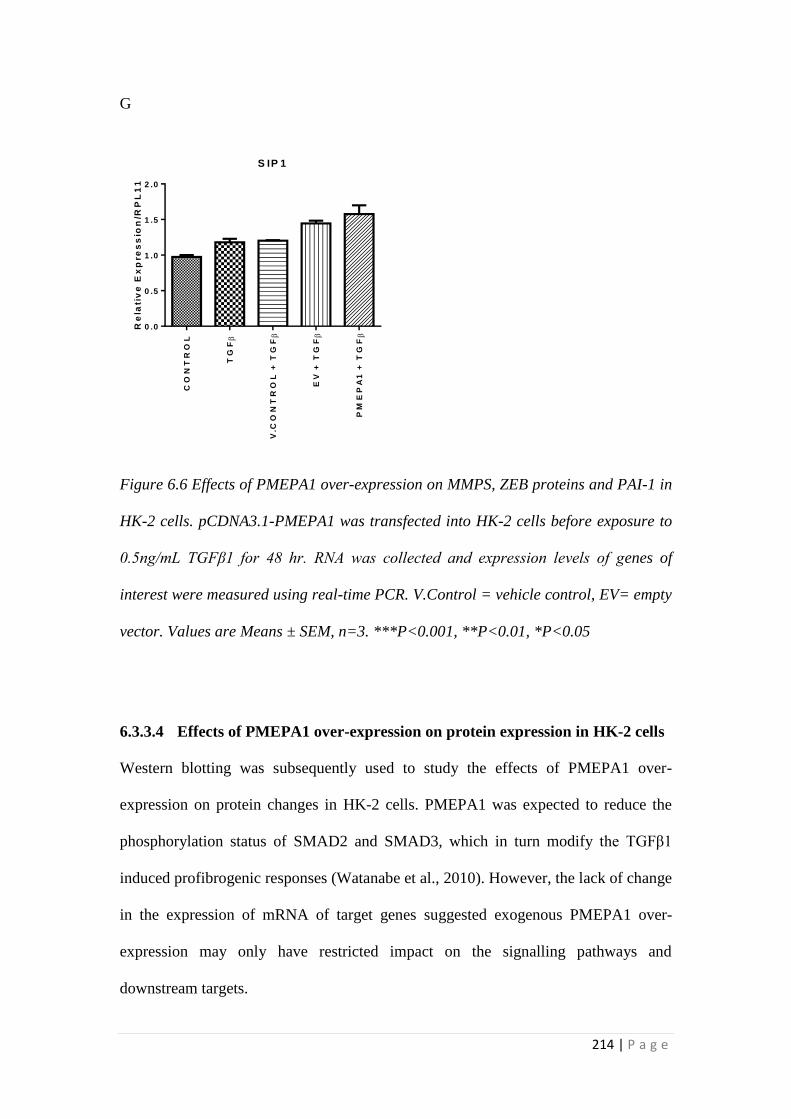
214 | P a g e
G
S IP 1
CO
NT
RO
L
TG
F
V.C
ON
TR
OL
+ T
GF
EV
+ T
GF
PM
EP
A1
+ T
GF
0 .0
0 .5
1 .0
1 .5
2 .0
Re
lati
ve
Ex
pre
ss
ion
/RP
L1
1
Figure 6.6 Effects of PMEPA1 over-expression on MMPS, ZEB proteins and PAI-1 in
HK-2 cells. pCDNA3.1-PMEPA1 was transfected into HK-2 cells before exposure to
0.5ng/mL TGFβ1 for 48 hr. RNA was collected and expression levels of genes of
interest were measured using real-time PCR. V.Control = vehicle control, EV= empty
vector. Values are Means ± SEM, n=3. ***P<0.001, **P<0.01, *P<0.05
6.3.3.4 Effects of PMEPA1 over-expression on protein expression in HK-2 cells
Western blotting was subsequently used to study the effects of PMEPA1 over-
expression on protein changes in HK-2 cells. PMEPA1 was expected to reduce the
phosphorylation status of SMAD2 and SMAD3, which in turn modify the TGFβ1
induced profibrogenic responses (Watanabe et al., 2010). However, the lack of change
in the expression of mRNA of target genes suggested exogenous PMEPA1 over-
expression may only have restricted impact on the signalling pathways and
downstream targets.
215 | P a g e
In order to minimise the variability between experiments and to reduce the impact of
variable transfection in cells, a stable cell line that consistently over-expresses
PMEPA1 was produced using lentiviral induced gene transfer from HK-2 cells. Two
HK-2 cell lines were constructed; one consistently over-expressing GFP, while the
other one over-expressing both GFP and PMEPA1. The detailed methods used to
construct these cell lines were outlined in the material and methods section of this
chapter.
The successfully transformed HK-2 cells were then exposed to 0.5ng/mL TGFβ1 to
study the differential phosphorylation status of signalling molecules as well as the
production of extracellular matrix protein. SMAD2 (Figure 6.7A) and SMAD3
(Figure 6.7B) were activated by TGFβ1 as expected (5.9 fold and 2.1 fold
respectively). However, over-expression of PMEPA1 did not substantially decrease
the phosphorylation of these signalling molecules. On the contrary, exogenous
PMEPA1 trended to further increase the phosphorylation of SMAD2 (Figure 6.7A)
and SMAD3 (Figure 6.7B), though no statistical significance was reached. p38 and
p42 phosphorylation were also measured. PMEPA1 over-expression increased p38
phosphorylation by 65% compared to empty vector (Figure 6.7C), but p42
phosphorylation remained unchanged (Figure 6.7D). These results were consistent
with the mRNA findings suggesting insufficient blockade of SMAD protein
phosphorylation induced by TGFβ1 in HK-2 cells.
E-Cadherin (Figure 6.7E) and fibronectin (Figure 6.7F) expression levels were
subsequently examined. PMEPA1 over-expression did not demonstrate any protective
effects when cells were exposed to TGFβ1. These result further demonstrated that, in
HK-2 cells, PMEPA1 over-expression alone could not effectively alleviate the
profibrogenic effects induced by TGFβ1.
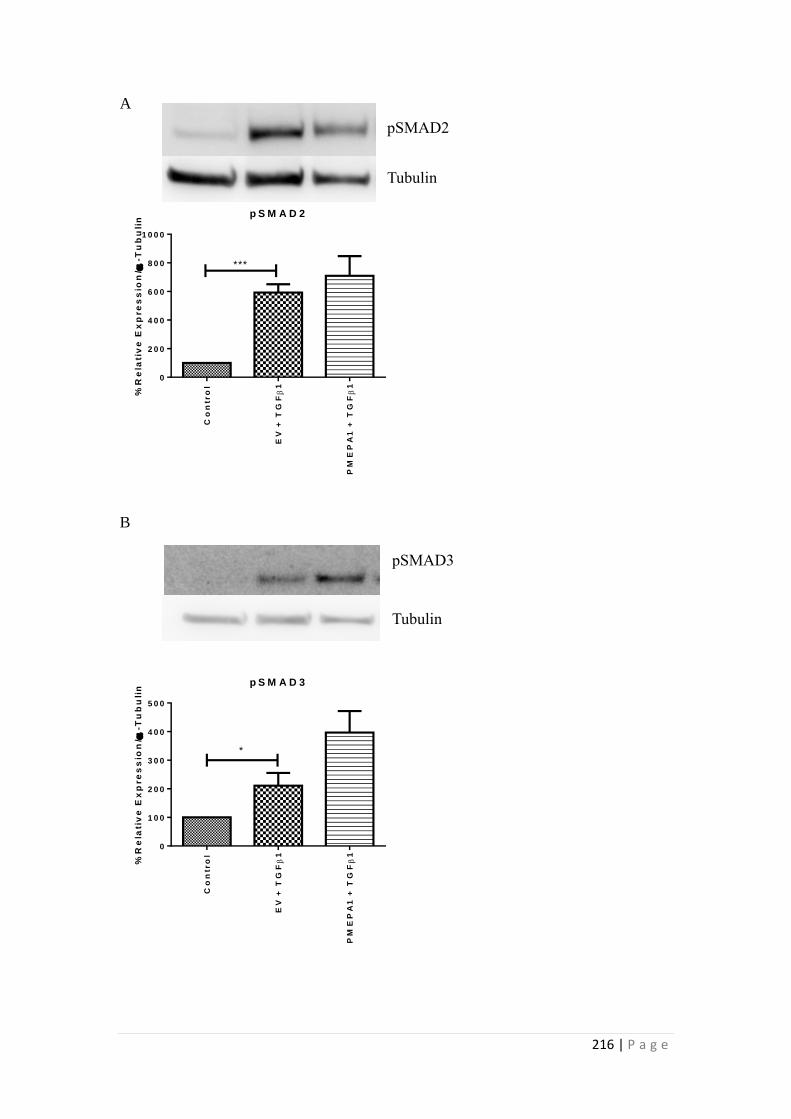
216 | P a g e
A
p S M A D 2C
on
tro
l
EV
+ T
GF
1
PM
EP
A1
+ T
GF
1
0
2 0 0
4 0 0
6 0 0
8 0 0
1 0 0 0
%R
ela
tiv
e E
xp
re
ss
ion
/ -T
ub
uli
n
***
B
p S M A D 3
Co
ntr
ol
EV
+ T
GF
1
PM
EP
A1
+ T
GF
1
0
1 0 0
2 0 0
3 0 0
4 0 0
5 0 0
%R
ela
tiv
e E
xp
re
ss
ion
/ -T
ub
uli
n
*
pSMAD2
Tubulin
pSMAD3
Tubulin
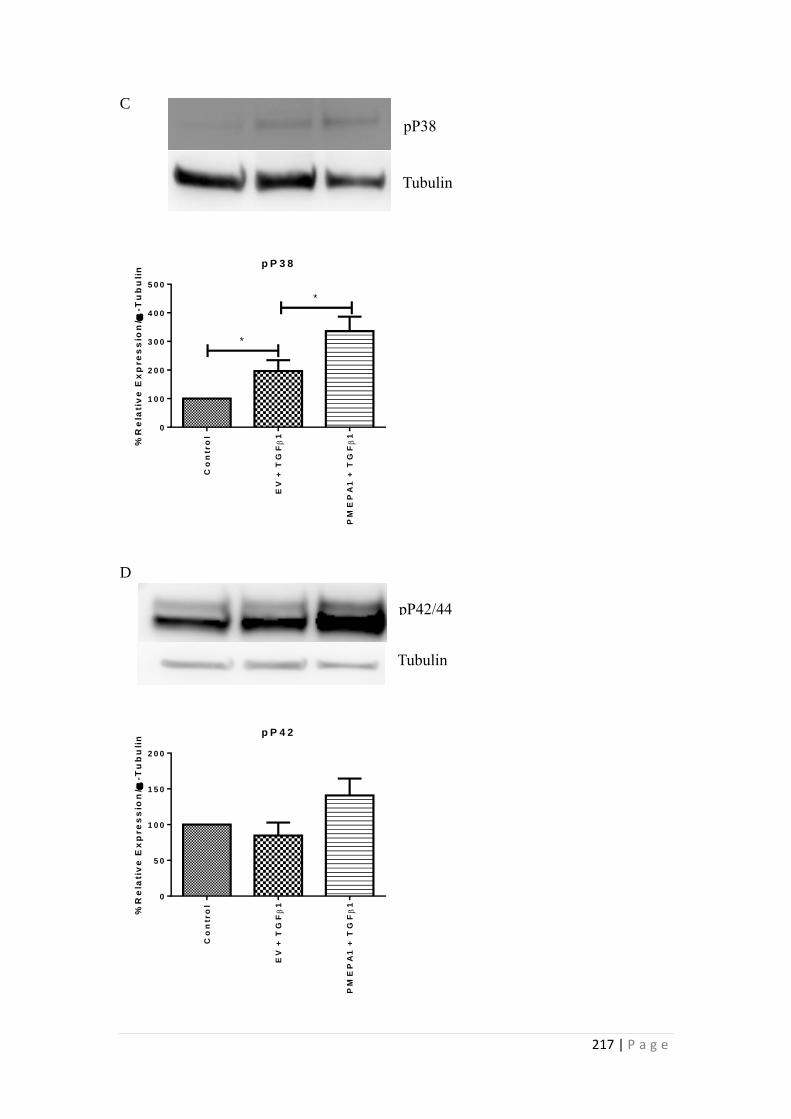
217 | P a g e
C
p P 3 8
Co
ntr
ol
EV
+ T
GF
1
PM
EP
A1
+ T
GF
1
0
1 0 0
2 0 0
3 0 0
4 0 0
5 0 0
%R
ela
tiv
e E
xp
re
ss
ion
/ -T
ub
uli
n
*
*
D
p P 4 2
Co
ntr
ol
EV
+ T
GF
1
PM
EP
A1
+ T
GF
1
0
5 0
1 0 0
1 5 0
2 0 0
%R
ela
tiv
e E
xp
re
ss
ion
/ -T
ub
uli
n
pP38
Tubulin
pP42/44
Tubulin
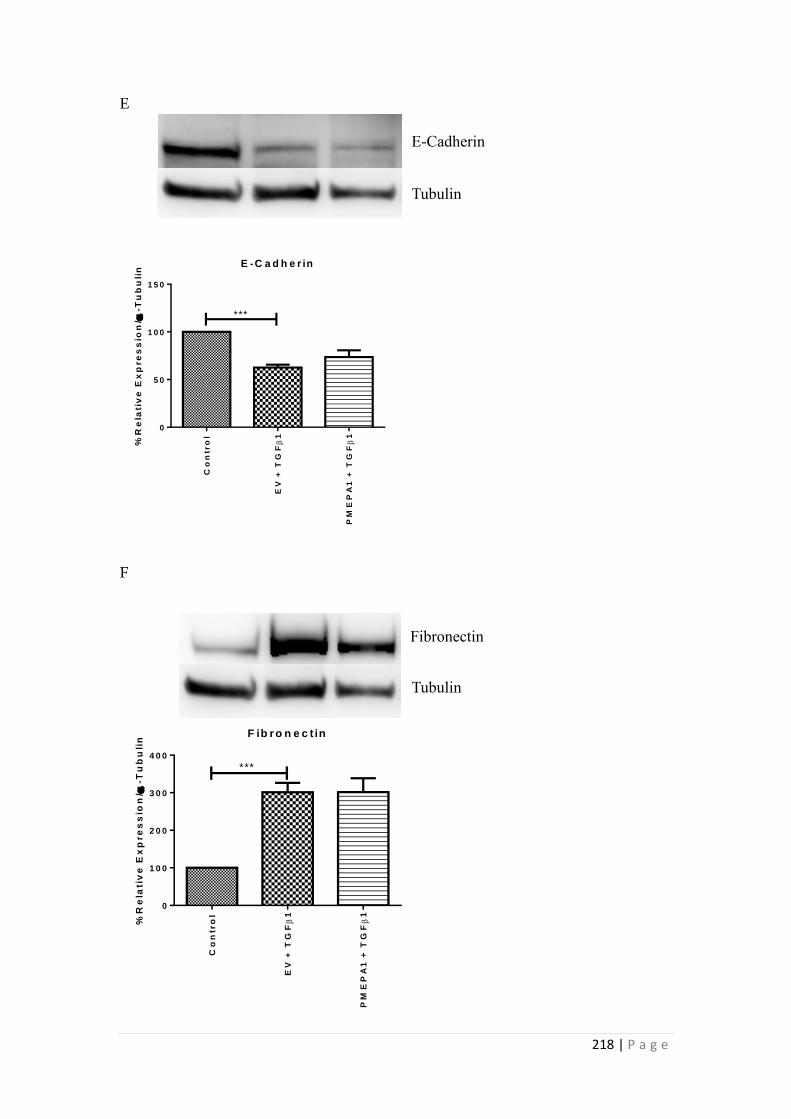
218 | P a g e
E
E -C a d h e r in
Co
ntr
ol
EV
+ T
GF
1
PM
EP
A1
+ T
GF
1
0
5 0
1 0 0
1 5 0
%R
ela
tiv
e E
xp
re
ss
ion
/ -T
ub
uli
n
***
F
F ib r o n e c t in
Co
ntr
ol
EV
+ T
GF
1
PM
EP
A1
+ T
GF
1
0
1 0 0
2 0 0
3 0 0
4 0 0
%R
ela
tiv
e E
xp
re
ss
ion
/ -T
ub
uli
n
***
Tubulin
E-Cadherin
Fibronectin
Tubulin
219 | P a g e
Figure 6.7 Effects of PMEPA1 over-expression on phosphorylation status of SMAD3,
SMAD2, p38, p42 and production of E-Cadherin and fibronectin. HK-2 cells
constantly over-expressing PMEPA1 were exposed to 0.5ng/mL TGFβ1 for 48 hr.
Lysate was collected and western blotting was used to study the changes in
phosphorylation status and production level. EV= empty vector. Values are Mean ±
SEM, n=3. ***P<0.001,*P<0.05
220 | P a g e
6.4 Discussion
PMEPA1 was first characterised in 2000 as a novel androgen regulated gene in
LNCaP cells (Xu et al., 2000) and later it was found to be up-regulated in renal cell
carcinoma and other solid tumours (Giannini et al., 2003; Rae et al., 2001). The
positive regulation of PMEPA1 by TGFβ signalling was also established (Brunschwig
et al., 2003). However it was not until 2010 when Watanabe et al. successfully
demonstrated that PMEPA1 could sequester SMAD activity and thus attenuating
TGFβ signalling (Watanabe et al., 2010), PMEPA1 became a popular target,
anticipated to rectify TGFβ induced adverse effects. In this chapter, both PMEPA1
knockdown and over-expression were examined in HK-2 cells that were treated with
or without TGFβ1. This is the first time that the potential therapeutic effects of
PMEPA1 were studied in the renal context with a focus on proximal tubular cells.
TGFβ and its downstream signalling pathways had been long recognised as a main
driving factor for the pathogenesis of progressive kidney fibrosis. Central to this, the
R-SMAD proteins (SMAD2 and SMAD3) and their activation by phosphorylation
play a key role in the transduction and amplification of the signalling process (Lan
and Chung, 2012). Thus, targeting SMAD became popular as therapeutics to halt
renal fibrosis, whilst avoiding the unwanted side effects of direct TGFβ targeting. We
firstly knocked down the expression of PMEPA1 using siRNA mediated gene
silencing to identify any exacerbation of renal fibrosis. PMEPA1 siRNA successfully
silenced PMEPA1 mRNA expression in HK-2 cells, both in the absence and the
presence of exogenous TGFβ1. As expected, fibronectin mRNA was significantly up-
regulated in PMEPA1 silenced HK-2 cells in the absence of TGFβ1 while E-Cadherin
demonstrated a trend for reduction. Interestingly, the corresponding result was not
observed when silenced cells were exposed to TGFβ1, possibly due to the complete
221 | P a g e
phosphorylation of SMAD2/3 by potent TGFβ1 activation. These result suggest a
limited role for PMEPA1 in TGFβ/SMAD signalling in kidney proximal tubular cells.
To study the potential protective effects of PMEPA1 gene over-expression on HK-2
cells mRNA expression profile, transfection of PMEPA1 carrying plasmid was used
and over-expression was confirmed with real-time PCR. PMEPA1 over-expression
did not alter the expression of TGFβ signaling target molecules in HK-2 cells exposed
to TGFβ1. It is now well established that interruption of SMAD activity can abolish
TGFβ signaling and thus the downstream target effects. The lack of change suggested
a minimal interruption of SMAD signaling activated by exogenous TGFβ1 in
PMEPA1 over-expressing HK-2 cells. This was confirmed by the western blot data.
TGFβ1 activated SMAD2 and -3 phosphorylation were further increased when
PMEPA1 was over-expressed. The lack of renoprotection when PMEPA1 expression
was modified was unexpected This is thought to be due to several reasons. Firstly, this
is the first study that has investigated the effects of PMEPA1 in renal proximal tubular
cells. The studies that identified the SMAD signaling blockade used either prostate
cancer cells or colon cancer cells. The difference between the cell types may account
for the differential impact of PMEPA1 over-expression. The different expression
profile of genes including cell surface receptors, signaling molecules and even cellular
matrix proteins may also contribute to the results observed. Secondly, PMEPA1
competes for the SMAD binding proteins with SMAD 2/3 and thus interrupts SMAD
signaling. The possible differential expression of SMAD binding protein with lower
levels in HK-2 cells may render PMEPA1 targeting non-ideal. Comparison between
the SMAD binding protein levels could be compared with the cancer cells in the
future.. Furthermore, other kidney cell lines including podocytes, mesangial cells and

222 | P a g e
endothelial cells could be investigated to study the potential protective effects of
PMEPA1 in the kidney.
Nonetheless, this study demonstrated that PMEPA1 over-expression does not
effectively reverse TGFβ induced fibrosis in proximal tubular cells, despite the
positive results shown in cancer cells. Furthermore, the creation of HK-2 cells
consistently over-expressing PMEPA1 provides an excellent tool for future studies
relevant to PMEPA1 in HK-2 cells.

223 | P a g e
7 Chapter 7 Future Studies and Clinical Applications
7.1 Future Experiments
In this thesis, several dsRNA delivery methods were exploited for their abilities to
transfer genes of interest in in vivo and in vitro systems. However, due to method
development involved, two projects were not fully completed. A table was created to
summarise the two methods tried.
Method Mode of Delivery Genome Incorporation Kidney Accumulation Mode of Action
Lentivirus Mediated Systemic Yes Medium to Low Biological
Nanoparticle Mediated Systemic No Medium Physical
Table 7.1 Table summarises the two in vivo delivery systems carried out during the
study.
In the rest of this chapter, the future work and their clinical applications will be
discussed.
7.2 Nanoparticle Mediated Gene Transfer
In this thesis, we have successfully demonstrated in in vitro experiments that the
novel nanoparticles, manufactured as part of this thesis, can effectively penetrate
tubular cell membranes and concentrate in the cytoplasm. The in vivo delivery of
nanoparticles through intravenous injection showed clear uptake in organs such as
liver, kidney and heart. However, in the initial gene transfer experiment, the potential
steric hindrance that prevented the processing of miRNA by DICER may well be
caused by nanoparticles themselves due to an unbreakable amide bond. A breakable

224 | P a g e
disulphide bridge that will cleave under the reduced cytoplasmic environment is
proposed and will be carried out. Aptamers that will bind specifically to SGLT2 in the
apical membrane of the proximal tubule once the nanoparticle is filtered are also
being developed and will be subjected to testing once selected. A new type of
selection method called CELL-SELEX that selects aptamer against a particular cell
type rather than a single protein will also be utilised for aptamers that bind to
proximal tubular cells at high affinity. Meanwhile the positively selected aptamers
will be negatively selected against liver cells to reduce non-specific uptake by liver. In
effect, this will result in an increased proportion of aptamer tagged nanoparticles that
will be taken by the kidney proximal tubular cells. As part of this selection, the
aptamer does not necessarily recognise a particular surface protein, but could be two
or multiple proteins in close proximity- a pattern specific to the cell type. This
selection also ensures that the aptamer selected will be against the extracellular
portion of the surface receptors and avoids the candidates that bind only to the
intracellular amino acid sequences that could happen if the traditional SELEX
methodology is used. Once selected, the aptamer will be attached to the nanoparticles
via the formation of amide bond using already established protocols. However, this
conjugation may be challenging due to the length of the aptamer as it is approximately
80 bases (comparing to 23bps for dsRNA) and the intended tertiary structure could
have a negative impact on the conjugation. Nevertheless, the final nanoparticles,
stabilised, conjugated with miRNA and proximal tubular cells recognising aptamer
will be delivered intravenously and over-expression of miRNA levels in different
organs including kidneys will be examined to confirm positive transduction in mice.
At the same time, toxicology testing will be performed and the number of copies of
miRNA per nanoparticle e determined to achieve maximum delivery with minimal
225 | P a g e
impact on cellular health. The ability to cross the blood brain barrier will also be
examined to prevent undesired nanoparticle accumulation and over-expression of
miRNA in the brain. A full evaluation of adverse effects of systemic injection of
nanoparticles will be obtained before initiation of any large animal trials.
If optimised, this method provides a mean of silencing target gene(s) specifically in
the kidney proximal tubular cells with high efficiency and low toxicity. However, the
intravenous administration of these nanoparticles could be one of the potential issues
in their use as therapeutic agents, particularly in outpatient settings. Chemical
modification or shielding of miRNA may be applied to protect the conjugate so that
they can be orally administered. Ultrasound and microbubble technologies can be
used in conjunction with nanoparticles to enhance cellular uptake and achieve added
specificity with localised sonoporation. Different molecules including drugs can be
attached to the nanoparticles and be delivered to the cytoplasm of the target cells.
Thus the potential of these novel nanoparticles are broad.
7.3 Lentiviral Mediated Gene Transfer
Although the transduction of miR-200b using lentivirus in mice failed to show
satisfactory efficiency in this PhD project, the lentivirus carrying empty plasmid
successfully integrated the cargo genes into the genome of kidney cells at a detectable
level. This could be due to the tertiary structure of delivered miR-200b gene
preventing efficient integration. Future work to improve the efficiency of lentiviral
transduction may include the optimisation of packaging system to produce more
lentiviral particles, optimisatioin of miR-200b containing plasmid, alternative delivery

226 | P a g e
methods, such as localised injection to renal parenchyma rather than systemic delivery
and an increased number of injections with more lentiviral particles.
One of the advantages of using lentiviral mediated gene transfer is that a stable
insertion of transgene into the genome of the target cells is able to be carried out.
Thus the expression of desired gene can be sustained for a long period of time.
Meanwhile the disadvantage of this method is stable integration, because the insertion
site is random. The transgene can be integrated within another functional gene which
will be disrupted and rendered non-functional. It can also land in the promoter or
enhancer sequences of other important genes, causing significant adverse effects to
the normal cell metabolism. Despite these drawbacks, successful pre-clinical and
clinical trials have demonstrated positive outcome of lentivirus based gene therapy.
7.4 Ultrasound Microbubble Mediated Gene Transfer
Ultrasound microbubble mediated gene transfers have been demonstrated to be a
promising new gene delivery strategy. It has minimal invasiveness with relatively
high gene transfer efficacy. These microbubbles have already been approved for use
in clinical settings as contrast enhancers. Furthermore, the first clinical trial using
ultrasound microbubble mediated gemcitabine delivery in patients with inoperable
pancreatic cancer showed reduced tumour size/growth rate when compared to control
patients who were treated with the drug alone. The utilisation of ultrasound
microbubble is rapidly entering clinical trial phase and more studies are expected to
be reported in the near future.
Due to lack of availability of SonoVue in Australia, a sulphur hexafluoride based
substitute was obtained from Bracco Imaging. Plasmid containing miR-200b will be

227 | P a g e
delivered to the kidneys of c57bl6 mice followed by UUO. Furthermore, ultrasound
microbubble can be combined with nanoparticles and lentivirus to achieve higher
gene transfer efficiency compared to using those methods alone. Once optimised, the
same technique can be applied to gene/drug delivery to other organs by simply
redirecting the ultrasound waves. Local administration of microbubble and gene/drug
preparation may increase the transfer efficiency by several orders of magnitudes. Thus,
ultrasound microbubble mediated gene transfer will be further investigated in the
context of combating renal fibrosis.
7.5 Overview
All the gene delivery methods discussed have a sound scientific basis as well as future
applicability in gene therapies. Each method has its pros and cons. The choice of the
delivery method depends on the target of the cell and the size of the cargo delivered.
However, with rapidly expanding knowledge pertaining to the different methods,
more sophisticated optimisation can be tailored to suit the purpose of individual
applications. All these delivery systems discussed will be tested and optimised in the
future as part of the future studies that arise from this PhD.

228 | P a g e
References
Alexis, F., Pridgen, E., Molnar, L., and Farokhzad, O. (2008). Factors affecting the clearance
and biodistribution of polymeric nanoparticles. Molecular pharmaceutics 5, 505-515.
Ansieau, S., Bastid, J., Doreau, A., Morel, A.P., Bouchet, B.P., Thomas, C., Fauvet, F.,
Puisieux, I., Doglioni, C., Piccinin, S., et al. (2008). Induction of EMT by twist proteins as a
collateral effect of tumor-promoting inactivation of premature senescence. Cancer Cell 14,
79-89.
Aplin, J.D., Haigh, T., Vicovac, L., Church, H.J., and Jones, C.J. (1998). Anchorage in the
developing placenta: an overlooked determinant of pregnancy outcome? Hum Fertil (Camb) 1,
75-79.
Arnoux, V., Nassour, M., L'Helgoualc'h, A., Hipskind, R.A., and Savagner, P. (2008). Erk5
controls Slug expression and keratinocyte activation during wound healing. Mol Biol Cell 19,
4738-4749.
Badid, C., Desmouliere, A., Babici, D., Hadj-Aissa, A., McGregor, B., Lefrancois, N.,
Touraine, J.L., and Laville, M. (2002). Interstitial expression of alpha-SMA: an early marker
of chronic renal allograft dysfunction. Nephrology, dialysis, transplantation : official
publication of the European Dialysis and Transplant Association - European Renal
Association 17, 1993-1998.
Bakin, A.V., Tomlinson, A.K., Bhowmick, N.A., Moses, H.L., and Arteaga, C.L. (2000).
Phosphatidylinositol 3-kinase function is required for transforming growth factor beta-
mediated epithelial to mesenchymal transition and cell migration. The Journal of biological
chemistry 275, 36803-36810.
Bartel, D.P. (2004). MicroRNAs: genomics, biogenesis, mechanism, and function. Cell 116,
281-297.
Bartel, D.P. (2009). MicroRNAs: target recognition and regulatory functions. Cell 136, 215-
233.

229 | P a g e
Bienz, M. (2005). beta-Catenin: a pivot between cell adhesion and Wnt signalling. Curr Biol
15, R64-67.
Bischof, P., Aplin, J.D., Bentin-Ley, U., Brannstrom, M., Casslen, B., Castrillo, J.L., Classen-
Linke, I., Critchley, H.O., Devoto, L., D'Hooghe, T., et al. (2006). Implantation of the human
embryo: research lines and models. From the implantation research network 'Fruitful'.
Gynecol Obstet Invest 62, 206-216.
Blomley, M. (2003). Which US microbubble contrast agent is best for gene therapy?
Radiology 229, 297-298.
Bottinger, E.P., and Bitzer, M. (2002). TGF-beta signaling in renal disease. J Am Soc
Nephrol 13, 2600-2610.
Brabletz, T., Jung, A., Reu, S., Porzner, M., Hlubek, F., Kunz-Schughart, L.A., Knuechel, R.,
and Kirchner, T. (2001). Variable beta-catenin expression in colorectal cancers indicates
tumor progression driven by the tumor environment. Proc Natl Acad Sci U S A 98, 10356-
10361.
Bracken, C.P., Gregory, P.A., Kolesnikoff, N., Bert, A.G., Wang, J., Shannon, M.F., and
Goodall, G.J. (2008). A double-negative feedback loop between ZEB1-SIP1 and the
microRNA-200 family regulates epithelial-mesenchymal transition. Cancer Res 68, 7846-
7854.
Brayman, A.A., Coppage, M.L., Vaidya, S., and Miller, M.W. (1999). Transient poration and
cell surface receptor removal from human lymphocytes in vitro by 1 MHz ultrasound.
Ultrasound Med Biol 25, 999-1008.
Brosius, F.C., and Heilig, C.W. (2005). Glucose transporters in diabetic nephropathy. Pediatr
Nephrol 20, 447-451.
Brownlee, M. (1995). Advanced protein glycosylation in diabetes and aging. Annu Rev Med
46, 223-234.
Brownlee, M. (2001). Biochemistry and molecular cell biology of diabetic complications.
Nature 414, 813-820.
230 | P a g e
Brunschwig, E.B., Wilson, K., Mack, D., Dawson, D., Lawrence, E., Willson, J.K., Lu, S.,
Nosrati, A., Rerko, R.M., Swinler, S., et al. (2003). PMEPA1, a transforming growth factor-
beta-induced marker of terminal colonocyte differentiation whose expression is maintained in
primary and metastatic colon cancer. Cancer Res 63, 1568-1575.
Burns, W.C., Twigg, S.M., Forbes, J.M., Pete, J., Tikellis, C., Thallas-Bonke, V., Thomas,
M.C., Cooper, M.E., and Kantharidis, P. (2006). Connective tissue growth factor plays an
important role in advanced glycation end product-induced tubular epithelial-to-mesenchymal
transition: implications for diabetic renal disease. Journal of the American Society of
Nephrology : JASN 17, 2484-2494.
Burstyn-Cohen, T., Stanleigh, J., Sela-Donenfeld, D., and Kalcheim, C. (2004). Canonical
Wnt activity regulates trunk neural crest delamination linking BMP/noggin signaling with
G1/S transition. Development 131, 5327-5339.
Cachat, F., Lange-Sperandio, B., Chang, A.Y., Kiley, S.C., Thornhill, B.A., Forbes, M.S., and
Chevalier, R.L. (2003). Ureteral obstruction in neonatal mice elicits segment-specific tubular
cell responses leading to nephron loss. Kidney international 63, 564-575.
Cajal, R.y. (1890). Barcelona: Casa Provincial Caridad. Manual de Anatomia Patologica
General
Cano, A., Perez-Moreno, M.A., Rodrigo, I., Locascio, A., Blanco, M.J., del Barrio, M.G.,
Portillo, F., and Nieto, M.A. (2000). The transcription factor snail controls epithelial-
mesenchymal transitions by repressing E-cadherin expression. Nat Cell Biol 2, 76-83.
Carew, M.A., Wu, M.L., Law, G.J., Tseng, Y.Z., and Mason, W.T. (1994). Extracellular ATP
activates calcium entry and mobilization via P2U-purinoceptors in rat lactotrophs. Cell
Calcium 16, 227-235.
Carew, R.M., Wang, B., and Kantharidis, P. (2012). The role of EMT in renal fibrosis. Cell
Tissue Res 347, 103-116.
Carthew, R.W., and Sontheimer, E.J. (2009). Origins and Mechanisms of miRNAs and
siRNAs. Cell 136, 642-655.
231 | P a g e
Catania, J.M., Chen, G., and Parrish, A.R. (2007a). Role of matrix metalloproteinases in renal
pathophysiologies. American journal of physiology Renal physiology 292, F905-911.
Catania, J.M., Chen, G., and Parrish, A.R. (2007b). Role of matrix metalloproteinases in renal
pathophysiologies. Am J Physiol Renal Physiol 292, F905-911.
Catherwood, M.A., Powell, L.A., Anderson, P., McMaster, D., Sharpe, P.C., and Trimble,
E.R. (2002). Glucose-induced oxidative stress in mesangial cells. Kidney international 61,
599-608.
Chang, T.C., and Mendell, J.T. (2007). microRNAs in vertebrate physiology and human
disease. Annu Rev Genomics Hum Genet 8, 215-239.
Chau, B.N., Xin, C., Hartner, J., Ren, S., Castano, A.P., Linn, G., Li, J., Tran, P.T., Kaimal,
V., Huang, X., et al. (2012). MicroRNA-21 Promotes Fibrosis of the Kidney by Silencing
Metabolic Pathways. Science translational medicine 4, 121ra118.
Chen, D., Zhao, M., and Mundy, G.R. (2004). Bone morphogenetic proteins. Growth Factors
22, 233-241.
Chevalier, R.L., Forbes, M.S., and Thornhill, B.A. (2009a). Ureteral obstruction as a model of
renal interstitial fibrosis and obstructive nephropathy. Kidney international 75, 1145-1152.
Chevalier, R.L., Forbes, M.S., and Thornhill, B.A. (2009b). Ureteral obstruction as a model of
renal interstitial fibrosis and obstructive nephropathy. Kidney Int 75, 1145-1152.
Chiu, Y.L., and Rana, T.M. (2002). RNAi in human cells: basic structural and functional
features of small interfering RNA. Mol Cell 10, 549-561.
Cho, H.J., Baek, K.E., Saika, S., Jeong, M.J., and Yoo, J. (2007). Snail is required for
transforming growth factor-beta-induced epithelial-mesenchymal transition by activating PI3
kinase/Akt signal pathway. Biochemical and biophysical research communications 353, 337-
343.
Chung, A.C., Huang, X.R., Meng, X., and Lan, H.Y. (2010). miR-192 mediates TGF-
beta/Smad3-driven renal fibrosis. J Am Soc Nephrol 21, 1317-1325.
232 | P a g e
Chung, S.S., Ho, E.C., Lam, K.S., and Chung, S.K. (2003a). Contribution of polyol pathway
to diabetes-induced oxidative stress. Journal of the American Society of Nephrology : JASN
14, S233-236.
Chung, S.S., Ho, E.C., Lam, K.S., and Chung, S.K. (2003b). Contribution of polyol pathway
to diabetes-induced oxidative stress. J Am Soc Nephrol 14, S233-236.
Clouthier, D.E., Comerford, S.A., and Hammer, R.E. (1997). Hepatic fibrosis,
glomerulosclerosis, and a lipodystrophy-like syndrome in PEPCK-TGF-beta1 transgenic mice.
J Clin Invest 100, 2697-2713.
Cox, J.C., Hayhurst, A., Hesselberth, J., Bayer, T.S., Georgiou, G., and Ellington, A.D.
(2002). Automated selection of aptamers against protein targets translated in vitro: from gene
to aptamer. Nucleic acids research 30, e108.
Craven, P.A., Melhem, M.F., Phillips, S.L., and DeRubertis, F.R. (2001). Overexpression of
Cu2+/Zn2+ superoxide dismutase protects against early diabetic glomerular injury in
transgenic mice. Diabetes 50, 2114-2125.
Cullen, B.R. (2005). RNAi the natural way. Nature genetics 37, 1163-1165.
Czauderna, F., Fechtner, M., Dames, S., Aygun, H., Klippel, A., Pronk, G.J., Giese, K., and
Kaufmann, J. (2003). Structural variations and stabilising modifications of synthetic siRNAs
in mammalian cells. Nucleic acids research 31, 2705-2716.
Dendooven, A., Ishola, D.A., Jr., Nguyen, T.Q., Van der Giezen, D.M., Kok, R.J.,
Goldschmeding, R., and Joles, J.A. (2011). Oxidative stress in obstructive nephropathy. Int J
Exp Pathol 92, 202-210.
Dennler, S., Itoh, S., Vivien, D., ten Dijke, P., Huet, S., and Gauthier, J.M. (1998). Direct
binding of Smad3 and Smad4 to critical TGF beta-inducible elements in the promoter of
human plasminogen activator inhibitor-type 1 gene. Embo J 17, 3091-3100.
DeRubertis, F.R., Craven, P.A., Melhem, M.F., and Salah, E.M. (2004). Attenuation of renal
injury in db/db mice overexpressing superoxide dismutase: evidence for reduced superoxide-
nitric oxide interaction. Diabetes 53, 762-768.
233 | P a g e
Dey, N., Das, F., Mariappan, M.M., Mandal, C.C., Ghosh-Choudhury, N., Kasinath, B.S., and
Choudhury, G.G. (2011). MicroRNA-21 orchestrates high glucose-induced signals to TOR
complex 1, resulting in renal cell pathology in diabetes. J Biol Chem 286, 25586-25603.
Djordjevic, V.B. (2004). Free radicals in cell biology. Int Rev Cytol 237, 57-89.
Docherty, N.G., O'Sullivan, O.E., Healy, D.A., Fitzpatrick, J.M., and Watson, R.W. (2006).
Evidence that inhibition of tubular cell apoptosis protects against renal damage and
development of fibrosis following ureteric obstruction. American journal of physiology Renal
physiology 290, F4-13.
Du, B., Ma, L.M., Huang, M.B., Zhou, H., Huang, H.L., Shao, P., Chen, Y.Q., and Qu, L.H.
(2010). High glucose down-regulates miR-29a to increase collagen IV production in HK-2
cells. FEBS Lett 584, 811-816.
Duband, J.L., and Thiery, J.P. (1982). Appearance and distribution of fibronectin during chick
embryo gastrulation and neurulation. Dev Biol 94, 337-350.
Escoffre, J.M., Novell, A., Piron, J., Zeghimi, A., Doinikov, A., and Bouakaz, A. (2013).
Microbubble attenuation and destruction: are they involved in sonoporation efficiency? IEEE
transactions on ultrasonics, ferroelectrics, and frequency control 60, 46-52.
Fabian, M.R., Sonenberg, N., and Filipowicz, W. (2010). Regulation of mRNA translation
and stability by microRNAs. Annual review of biochemistry 79, 351-379.
Fan, J.M., Ng, Y.Y., Hill, P.A., Nikolic-Paterson, D.J., Mu, W., Atkins, R.C., and Lan, H.Y.
(1999). Transforming growth factor-beta regulates tubular epithelial-myofibroblast
transdifferentiation in vitro. Kidney Int 56, 1455-1467.
Fechheimer, M., Boylan, J.F., Parker, S., Sisken, J.E., Patel, G.L., and Zimmer, S.G. (1987).
Transfection of mammalian cells with plasmid DNA by scrape loading and sonication loading.
Proc Natl Acad Sci U S A 84, 8463-8467.
Fidler, I.J., and Poste, G. (2008). The "seed and soil" hypothesis revisited. Lancet Oncol 9,
808.
Filipowicz, W., Bhattacharyya, S.N., and Sonenberg, N. (2008). Mechanisms of post-
transcriptional regulation by microRNAs: are the answers in sight? Nat Rev Genet 9, 102-114.

234 | P a g e
Fioretto, P., and Mauer, M. (2007). Histopathology of diabetic nephropathy. Semin Nephrol
27, 195-207.
Forbes, J.M., Cooper, M.E., Oldfield, M.D., and Thomas, M.C. (2003). Role of advanced
glycation end products in diabetic nephropathy. Journal of the American Society of
Nephrology : JASN 14, S254-258.
Franke, W.W., Schmid, E., Osborn, M., and Weber, K. (1978). Different intermediate-sized
filaments distinguished by immunofluorescence microscopy. Proc Natl Acad Sci U S A 75,
5034-5038.
Frankel, L.B., Christoffersen, N.R., Jacobsen, A., Lindow, M., Krogh, A., and Lund, A.H.
(2008). Programmed cell death 4 (PDCD4) is an important functional target of the microRNA
miR-21 in breast cancer cells. J Biol Chem 283, 1026-1033.
Frantz, C., Stewart, K.M., and Weaver, V.M. (2010). The extracellular matrix at a glance. J
Cell Sci 123, 4195-4200.
Friedman, R.C., Farh, K.K., Burge, C.B., and Bartel, D.P. (2009). Most mammalian mRNAs
are conserved targets of microRNAs. Genome Res 19, 92-105.
Fukasawa, H., Yamamoto, T., Togawa, A., Ohashi, N., Fujigaki, Y., Oda, T., Uchida, C.,
Kitagawa, K., Hattori, T., Suzuki, S., et al. (2006). Ubiquitin-dependent degradation of SnoN
and Ski is increased in renal fibrosis induced by obstructive injury. Kidney international 69,
1733-1740.
Galichon, P., and Hertig, A. (2011). Epithelial to mesenchymal transition as a biomarker in
renal fibrosis: are we ready for the bedside? Fibrogenesis Tissue Repair 4, 11.
Gentry, L.E., Lioubin, M.N., Purchio, A.F., and Marquardt, H. (1988). Molecular events in
the processing of recombinant type 1 pre-pro-transforming growth factor beta to the mature
polypeptide. Mol Cell Biol 8, 4162-4168.
Ghosh, A.K., and Vaughan, D.E. (2012). PAI-1 in tissue fibrosis. J Cell Physiol 227, 493-507.
Ghosh Choudhury, G., and Abboud, H.E. (2004). Tyrosine phosphorylation-dependent PI 3
kinase/Akt signal transduction regulates TGFbeta-induced fibronectin expression in
mesangial cells. Cell Signal 16, 31-41.
235 | P a g e
Giannini, G., Ambrosini, M.I., Di Marcotullio, L., Cerignoli, F., Zani, M., MacKay, A.R.,
Screpanti, I., Frati, L., and Gulino, A. (2003). EGF- and cell-cycle-regulated
STAG1/PMEPA1/ERG1.2 belongs to a conserved gene family and is overexpressed and
amplified in breast and ovarian cancer. Mol Carcinog 38, 188-200.
Gill, P.S., and Wilcox, C.S. (2006). NADPH oxidases in the kidney. Antioxid Redox Signal 8,
1597-1607.
Giunti, S., Barit, D., and Cooper, M.E. (2006). Diabetic nephropathy: from mechanisms to
rational therapies. Minerva Med 97, 241-262.
Gould, S.E., Day, M., Jones, S.S., and Dorai, H. (2002). BMP-7 regulates chemokine,
cytokine, and hemodynamic gene expression in proximal tubule cells. Kidney international 61,
51-60.
Graham, F.L., Smiley, J., Russell, W.C., and Nairn, R. (1977). Characteristics of a human cell
line transformed by DNA from human adenovirus type 5. J Gen Virol 36, 59-74.
Gregory, P.A., Bert, A.G., Paterson, E.L., Barry, S.C., Tsykin, A., Farshid, G., Vadas, M.A.,
Khew-Goodall, Y., and Goodall, G.J. (2008a). The miR-200 family and miR-205 regulate
epithelial to mesenchymal transition by targeting ZEB1 and SIP1. Nat Cell Biol 10, 593-601.
Gregory, P.A., Bracken, C.P., Bert, A.G., and Goodall, G.J. (2008b). MicroRNAs as
regulators of epithelial-mesenchymal transition. Cell Cycle 7, 3112-3118.
Gregory, P.A., Bracken, C.P., Smith, E., Bert, A.G., Wright, J.A., Roslan, S., Morris, M.,
Wyatt, L., Farshid, G., Lim, Y.Y., et al. (2011). An autocrine TGF-beta/ZEB/miR-200
signaling network regulates establishment and maintenance of epithelial-mesenchymal
transition. Mol Biol Cell 22, 1686-1698.
Gupta, P.B., Mani, S., Yang, J., Hartwell, K., and Weinberg, R.A. (2005). The evolving
portrait of cancer metastasis. Cold Spring Harb Symp Quant Biol 70, 291-297.
Gusella, G.L., Fedorova, E., Hanss, B., Marras, D., Klotman, M.E., and Klotman, P.E.
(2002a). Lentiviral gene transduction of kidney. Human gene therapy 13, 407-414.
Gusella, G.L., Fedorova, E., Marras, D., Klotman, P.E., and Klotman, M.E. (2002b). In vivo
gene transfer to kidney by lentiviral vector. Kidney Int 61, S32-36.
236 | P a g e
Han, D.C., Hoffman, B.B., Hong, S.W., Guo, J., and Ziyadeh, F.N. (2000). Therapy with
antisense TGF-beta1 oligodeoxynucleotides reduces kidney weight and matrix mRNAs in
diabetic mice. Am J Physiol Renal Physiol 278, F628-634.
Han, J.Y., Kim, Y.J., Kim, L., Choi, S.J., Park, I.S., Kim, J.M., Chu, Y.C., and Cha, D.R.
(2010). PPARgamma agonist and angiotensin II receptor antagonist ameliorate renal
tubulointerstitial fibrosis. J Korean Med Sci 25, 35-41.
Hartwell, K.A., Muir, B., Reinhardt, F., Carpenter, A.E., Sgroi, D.C., and Weinberg, R.A.
(2006). The Spemann organizer gene, Goosecoid, promotes tumor metastasis. Proc Natl Acad
Sci U S A 103, 18969-18974.
Hay, E.D. (1990). Role of cell-matrix contacts in cell migration and epithelial-mesenchymal
transformation. Cell Differ Dev 32, 367-375.
Hay, E.D. (1995). An overview of epithelio-mesenchymal transformation. Acta Anat (Basel)
154, 8-20.
Hay, E.D. (2005). The mesenchymal cell, its role in the embryo, and the remarkable signaling
mechanisms that create it. Dev Dyn 233, 706-720.
Heilig, C.W., Brosius, F.C., 3rd, and Cunningham, C. (2006). Role for GLUT1 in diabetic
glomerulosclerosis. Expert Rev Mol Med 8, 1-18.
Hess, J., Angel, P., and Schorpp-Kistner, M. (2004). AP-1 subunits: quarrel and harmony
among siblings. Journal of cell science 117, 5965-5973.
Hills, C.E., and Squires, P.E. (2011). The role of TGF-beta and epithelial-to mesenchymal
transition in diabetic nephropathy. Cytokine Growth Factor Rev 22, 131-139.
Holmgren, A., and Bjornstedt, M. (1995). Thioredoxin and thioredoxin reductase. Methods in
enzymology 252, 199-208.
Humphreys, B.D., Lin, S.L., Kobayashi, A., Hudson, T.E., Nowlin, B.T., Bonventre, J.V.,
Valerius, M.T., McMahon, A.P., and Duffield, J.S. (2010). Fate tracing reveals the pericyte
and not epithelial origin of myofibroblasts in kidney fibrosis. Am J Pathol 176, 85-97.
237 | P a g e
Husseini, G.A., Diaz de la Rosa, M.A., Richardson, E.S., Christensen, D.A., and Pitt, W.G.
(2005). The role of cavitation in acoustically activated drug delivery. J Control Release 107,
253-261.
Inoguchi, T., Sonta, T., Tsubouchi, H., Etoh, T., Kakimoto, M., Sonoda, N., Sato, N.,
Sekiguchi, N., Kobayashi, K., Sumimoto, H., et al. (2003). Protein kinase C-dependent
increase in reactive oxygen species (ROS) production in vascular tissues of diabetes: role of
vascular NAD(P)H oxidase. J Am Soc Nephrol 14, S227-232.
Inoki, K., Haneda, M., Ishida, T., Mori, H., Maeda, S., Koya, D., Sugimoto, T., and Kikkawa,
R. (2000). Role of mitogen-activated protein kinases as downstream effectors of transforming
growth factor-beta in mesangial cells. Kidney Int Suppl 77, S76-80.
Isono, M., Chen, S., Hong, S.W., Iglesias-de la Cruz, M.C., and Ziyadeh, F.N. (2002). Smad
pathway is activated in the diabetic mouse kidney and Smad3 mediates TGF-beta-induced
fibronectin in mesangial cells. Biochem Biophys Res Commun 296, 1356-1365.
Itoh, S., Thorikay, M., Kowanetz, M., Moustakas, A., Itoh, F., Heldin, C.H., and ten Dijke, P.
(2003). Elucidation of Smad requirement in transforming growth factor-beta type I receptor-
induced responses. The Journal of biological chemistry 278, 3751-3761.
Iwano, M., Plieth, D., Danoff, T.M., Xue, C., Okada, H., and Neilson, E.G. (2002a). Evidence
that fibroblasts derive from epithelium during tissue fibrosis. J Clin Invest 110, 341-350.
Iwano, M., Plieth, D., Danoff, T.M., Xue, C., Okada, H., and Neilson, E.G. (2002b). Evidence
that fibroblasts derive from epithelium during tissue fibrosis. The Journal of clinical
investigation 110, 341-350.
Jakus, V., and Rietbrock, N. (2004). Advanced glycation end-products and the progress of
diabetic vascular complications. Physiol Res 53, 131-142.
Jechlinger, M., Grunert, S., and Beug, H. (2002). Mechanisms in epithelial plasticity and
metastasis: insights from 3D cultures and expression profiling. J Mammary Gland Biol
Neoplasia 7, 415-432.

238 | P a g e
Jenkins, R.H., Martin, J., Phillips, A.O., Bowen, T., and Fraser, D.J. (2012). Transforming
Growth Factor Beta-1 represses proximal tubular cell microRNA-192 expression via
decreased Hepatocyte Nuclear Factor DNA binding. Biochem J.
Jeong, J., Mok, H., Oh, Y.-K., and Park, T. (2009). siRNA conjugate delivery systems.
Bioconjugate chemistry 20, 5-14.
Kalluri, R., and Neilson, E.G. (2003a). Epithelial-mesenchymal transition and its implications
for fibrosis. J Clin Invest 112, 1776-1784.
Kalluri, R., and Neilson, E.G. (2003b). Epithelial-mesenchymal transition and its implications
for fibrosis. The Journal of clinical investigation 112, 1776-1784.
Kalluri, R., and Weinberg, R.A. (2009). The basics of epithelial-mesenchymal transition. The
Journal of clinical investigation 119, 1420-1428.
Kanasty, R., Dorkin, J.R., Vegas, A., and Anderson, D. (2013). Delivery materials for siRNA
therapeutics. Nature materials 12, 967-977.
Kang, D., and Hamasaki, N. (2003). Mitochondrial oxidative stress and mitochondrial DNA.
Clin Chem Lab Med 41, 1281-1288.
Kanwar, Y.S., Sun, L., Xie, P., Liu, F.Y., and Chen, S. (2011). A glimpse of various
pathogenetic mechanisms of diabetic nephropathy. Annu Rev Pathol 6, 395-423.
Karafiat, V., Dvorakova, M., Pajer, P., Cermak, V., and Dvorak, M. (2007). Melanocyte fate
in neural crest is triggered by Myb proteins through activation of c-kit. Cell Mol Life Sci 64,
2975-2984.
Kato, M., Arce, L., and Natarajan, R. (2009a). MicroRNAs and their role in progressive
kidney diseases. Clin J Am Soc Nephrol 4, 1255-1266.
Kato, M., Arce, L., Wang, M., Putta, S., Lanting, L., and Natarajan, R. (2011). A microRNA
circuit mediates transforming growth factor-beta1 autoregulation in renal glomerular
mesangial cells. Kidney Int 80, 358-368.
Kato, M., Putta, S., Wang, M., Yuan, H., Lanting, L., Nair, I., Gunn, A., Nakagawa, Y.,
Shimano, H., Todorov, I., et al. (2009b). TGF-beta activates Akt kinase through a microRNA-
dependent amplifying circuit targeting PTEN. Nat Cell Biol 11, 881-889.

239 | P a g e
Kato, M., Wang, L., Putta, S., Wang, M., Yuan, H., Sun, G., Lanting, L., Todorov, I., Rossi,
J.J., and Natarajan, R. (2010). Post-transcriptional up-regulation of Tsc-22 by Ybx1, a target
of miR-216a, mediates TGF-{beta}-induced collagen expression in kidney cells. J Biol Chem
285, 34004-34015.
Kato, M., Yuan, H., Xu, Z.G., Lanting, L., Li, S.L., Wang, M., Hu, M.C., Reddy, M.A., and
Natarajan, R. (2006). Role of the Akt/FoxO3a pathway in TGF-beta1-mediated mesangial cell
dysfunction: a novel mechanism related to diabetic kidney disease. Journal of the American
Society of Nephrology : JASN 17, 3325-3335.
Kato, M., Zhang, J., Wang, M., Lanting, L., Yuan, H., Rossi, J.J., and Natarajan, R. (2007).
MicroRNA-192 in diabetic kidney glomeruli and its function in TGF-beta-induced collagen
expression via inhibition of E-box repressors. Proc Natl Acad Sci U S A 104, 3432-3437.
Katsuda, T., Ikeda, S., Yoshioka, Y., Kosaka, N., Kawamata, M., and Ochiya, T. (2014).
Physiological and pathological relevance of secretory microRNAs and a perspective on their
clinical application. Biological chemistry 395, 365-373.
Kattla, J.J., Carew, R.M., Heljic, M., Godson, C., and Brazil, D.P. (2008). Protein kinase
B/Akt activity is involved in renal TGF-beta1-driven epithelial-mesenchymal transition in
vitro and in vivo. American journal of physiology Renal physiology 295, F215-225.
Kim, D.H., Saetrom, P., Snove, O., Jr., and Rossi, J.J. (2008). MicroRNA-directed
transcriptional gene silencing in mammalian cells. Proc Natl Acad Sci U S A 105, 16230-
16235.
Kim, H.J., and Bar-Sagi, D. (2004). Modulation of signalling by Sprouty: a developing story.
Nat Rev Mol Cell Biol 5, 441-450.
Kim, K., Lu, Z., and Hay, E.D. (2002). Direct evidence for a role of beta-catenin/LEF-1
signaling pathway in induction of EMT. Cell Biol Int 26, 463-476.
Kim, K.K., Kugler, M.C., Wolters, P.J., Robillard, L., Galvez, M.G., Brumwell, A.N.,
Sheppard, D., and Chapman, H.A. (2006). Alveolar epithelial cell mesenchymal transition
develops in vivo during pulmonary fibrosis and is regulated by the extracellular matrix. Proc
Natl Acad Sci U S A 103, 13180-13185.
240 | P a g e
Kim, V.N. (2005). MicroRNA biogenesis: coordinated cropping and dicing. Nature reviews
Molecular cell biology 6, 376-385.
Kim, V.N., Han, J., and Siomi, M.C. (2009). Biogenesis of small RNAs in animals. Nat Rev
Mol Cell Biol 10, 126-139.
Klahr, S., and Morrissey, J. (2002). Obstructive nephropathy and renal fibrosis. American
journal of physiology Renal physiology 283, F861-875.
Knecht, A.K., and Bronner-Fraser, M. (2002). Induction of the neural crest: a multigene
process. Nat Rev Genet 3, 453-461.
Kokudo, T., Suzuki, Y., Yoshimatsu, Y., Yamazaki, T., Watabe, T., and Miyazono, K. (2008).
Snail is required for TGFbeta-induced endothelial-mesenchymal transition of embryonic stem
cell-derived endothelial cells. J Cell Sci 121, 3317-3324.
Komala, M.G., Panchapakesan, U., Pollock, C., and Mather, A. (2013). Sodium glucose
cotransporter 2 and the diabetic kidney. Curr Opin Nephrol Hypertens 22, 113-119.
Korpal, M., and Kang, Y. (2008). The emerging role of miR-200 family of microRNAs in
epithelial-mesenchymal transition and cancer metastasis. RNA Biol 5, 115-119.
Korpal, M., Lee, E.S., Hu, G., and Kang, Y. (2008). The miR-200 family inhibits epithelial-
mesenchymal transition and cancer cell migration by direct targeting of E-cadherin
transcriptional repressors ZEB1 and ZEB2. The Journal of biological chemistry 283, 14910-
14914.
Koya, D., Haneda, M., Nakagawa, H., Isshiki, K., Sato, H., Maeda, S., Sugimoto, T., Yasuda,
H., Kashiwagi, A., Ways, D.K., et al. (2000). Amelioration of accelerated diabetic mesangial
expansion by treatment with a PKC beta inhibitor in diabetic db/db mice, a rodent model for
type 2 diabetes. Faseb J 14, 439-447.
Koya, D., Hayashi, K., Kitada, M., Kashiwagi, A., Kikkawa, R., and Haneda, M. (2003).
Effects of antioxidants in diabetes-induced oxidative stress in the glomeruli of diabetic rats.
Journal of the American Society of Nephrology : JASN 14, S250-253.
241 | P a g e
Krupa, A., Jenkins, R., Luo, D.D., Lewis, A., Phillips, A., and Fraser, D. (2010). Loss of
MicroRNA-192 promotes fibrogenesis in diabetic nephropathy. J Am Soc Nephrol 21, 438-
447.
Lan, H.Y. (2008). Smad7 as a therapeutic agent for chronic kidney diseases. Front Biosci 13,
4984-4992.
Lan, H.Y. (2011a). Diverse roles of TGF-beta/Smads in renal fibrosis and inflammation. Int J
Biol Sci 7, 1056-1067.
Lan, H.Y. (2011b). TGF-beta/Smad signaling in diabetic nephropathy. Clin Exp Pharmacol
Physiol.
Lan, H.Y., and Chung, A.C. (2012). TGF-beta/Smad signaling in kidney disease. Semin
Nephrol 32, 236-243.
Laping, N.J., Grygielko, E., Mathur, A., Butter, S., Bomberger, J., Tweed, C., Martin, W.,
Fornwald, J., Lehr, R., Harling, J., et al. (2002). Inhibition of transforming growth factor
(TGF)-beta1-induced extracellular matrix with a novel inhibitor of the TGF-beta type I
receptor kinase activity: SB-431542. Molecular pharmacology 62, 58-64.
Leask, A., and Abraham, D.J. (2004). TGF-beta signaling and the fibrotic response. Faseb J
18, 816-827.
Lee, H.B., Yu, M.R., Yang, Y., Jiang, Z., and Ha, H. (2003). Reactive oxygen species-
regulated signaling pathways in diabetic nephropathy. Journal of the American Society of
Nephrology : JASN 14, S241-245.
Lee, R.C., Feinbaum, R.L., and Ambros, V. (1993). The C. elegans heterochronic gene lin-4
encodes small RNAs with antisense complementarity to lin-14. Cell 75, 843-854.
Lewis, B.P., Burge, C.B., and Bartel, D.P. (2005). Conserved seed pairing, often flanked by
adenosines, indicates that thousands of human genes are microRNA targets. Cell 120, 15-20.
Li, H., Xu, L.L., Masuda, K., Raymundo, E., McLeod, D.G., Dobi, A., and Srivastava, S.
(2008). A feedback loop between the androgen receptor and a NEDD4-binding protein,
PMEPA1, in prostate cancer cells. The Journal of biological chemistry 283, 28988-28995.
242 | P a g e
Li, J.H., Zhu, H.J., Huang, X.R., Lai, K.N., Johnson, R.J., and Lan, H.Y. (2002). Smad7
inhibits fibrotic effect of TGF-Beta on renal tubular epithelial cells by blocking Smad2
activation. Journal of the American Society of Nephrology : JASN 13, 1464-1472.
Li, J.M., and Shah, A.M. (2003). ROS generation by nonphagocytic NADPH oxidase:
potential relevance in diabetic nephropathy. Journal of the American Society of Nephrology :
JASN 14, S221-226.
Li, L., Zepeda-Orozco, D., Black, R., and Lin, F. (2010). Autophagy is a component of
epithelial cell fate in obstructive uropathy. Am J Pathol 176, 1767-1778.
Li, R., Chung, A.C., Dong, Y., Yang, W., Zhong, X., and Lan, H.Y. (2013). The microRNA
miR-433 promotes renal fibrosis by amplifying the TGF-beta/Smad3-Azin1 pathway. Kidney
Int 84, 1129-1144.
Li, T., Li, D., Sha, J., Sun, P., and Huang, Y. (2009). MicroRNA-21 directly targets
MARCKS and promotes apoptosis resistance and invasion in prostate cancer cells. Biochem
Biophys Res Commun 383, 280-285.
Li, Y., Wen, X., Spataro, B.C., Hu, K., Dai, C., and Liu, Y. (2006). hepatocyte growth factor
is a downstream effector that mediates the antifibrotic action of peroxisome proliferator-
activated receptor-gamma agonists. J Am Soc Nephrol 17, 54-65.
Liem, K.F., Jr., Jessell, T.M., and Briscoe, J. (2000). Regulation of the neural patterning
activity of sonic hedgehog by secreted BMP inhibitors expressed by notochord and somites.
Development 127, 4855-4866.
Linden, K.C., DeHaan, C.L., Zhang, Y., Glowacka, S., Cox, A.J., Kelly, D.J., and Rogers, S.
(2006). Renal expression and localization of the facilitative glucose transporters GLUT1 and
GLUT12 in animal models of hypertension and diabetic nephropathy. Am J Physiol Renal
Physiol 290, F205-213.
Liu, R., Zhou, Z., Huang, J., and Chen, C. (2011). PMEPA1 promotes androgen receptor-
negative prostate cell proliferation through suppressing the Smad3/4-c-Myc-p21 Cip1
signaling pathway. J Pathol 223, 683-694.

243 | P a g e
Liu, Y. (2004). Epithelial to mesenchymal transition in renal fibrogenesis: pathologic
significance, molecular mechanism, and therapeutic intervention. J Am Soc Nephrol 15, 1-12.
Long, J., Wang, Y., Wang, W., Chang, B.H., and Danesh, F.R. (2011). MicroRNA-29c is a
signature microRNA under high glucose conditions that targets Sprouty homolog 1, and its in
vivo knockdown prevents progression of diabetic nephropathy. J Biol Chem 286, 11837-
11848.
Lorenzen, J.M., Haller, H., and Thum, T. (2011). MicroRNAs as mediators and therapeutic
targets in chronic kidney disease. Nat Rev Nephrol 7, 286-294.
Luo, K. (2004). Ski and SnoN: negative regulators of TGF-beta signaling. Curr Opin Genet
Dev 14, 65-70.
Ma, J.B., Yuan, Y.R., Meister, G., Pei, Y., Tuschl, T., and Patel, D.J. (2005). Structural basis
for 5'-end-specific recognition of guide RNA by the A. fulgidus Piwi protein. Nature 434,
666-670.
Mahimainathan, L., Das, F., Venkatesan, B., and Choudhury, G.G. (2006). Mesangial cell
hypertrophy by high glucose is mediated by downregulation of the tumor suppressor PTEN.
Diabetes 55, 2115-2125.
Malek, A., Merkel, O., Fink, L., Czubayko, F., Kissel, T., and Aigner, A. (2009). In vivo
pharmacokinetics, tissue distribution and underlying mechanisms of various PEI(-
PEG)/siRNA complexes. Toxicology and applied pharmacology 236, 97-108.
Mani, S.A., Guo, W., Liao, M.J., Eaton, E.N., Ayyanan, A., Zhou, A.Y., Brooks, M.,
Reinhard, F., Zhang, C.C., Shipitsin, M., et al. (2008). The epithelial-mesenchymal transition
generates cells with properties of stem cells. Cell 133, 704-715.
Mani, S.A., Yang, J., Brooks, M., Schwaninger, G., Zhou, A., Miura, N., Kutok, J.L.,
Hartwell, K., Richardson, A.L., and Weinberg, R.A. (2007). Mesenchyme Forkhead 1
(FOXC2) plays a key role in metastasis and is associated with aggressive basal-like breast
cancers. Proc Natl Acad Sci U S A 104, 10069-10074.
244 | P a g e
Marrero, M.B., Banes-Berceli, A.K., Stern, D.M., and Eaton, D.C. (2006). Role of the
JAK/STAT signaling pathway in diabetic nephropathy. Am J Physiol Renal Physiol 290,
F762-768.
Mason, J.M., Morrison, D.J., Basson, M.A., and Licht, J.D. (2006). Sprouty proteins:
multifaceted negative-feedback regulators of receptor tyrosine kinase signaling. Trends Cell
Biol 16, 45-54.
Mason, R.M., and Wahab, N.A. (2003). Extracellular matrix metabolism in diabetic
nephropathy. J Am Soc Nephrol 14, 1358-1373.
Massague, J., and Wotton, D. (2000). Transcriptional control by the TGF-beta/Smad signaling
system. Embo J 19, 1745-1754.
Masszi, A., Fan, L., Rosivall, L., McCulloch, C.A., Rotstein, O.D., Mucsi, I., and Kapus, A.
(2004). Integrity of cell-cell contacts is a critical regulator of TGF-beta 1-induced epithelial-
to-myofibroblast transition: role for beta-catenin. The American journal of pathology 165,
1955-1967.
Mauer, S.M., Steffes, M.W., Ellis, E.N., Sutherland, D.E., Brown, D.M., and Goetz, F.C.
(1984). Structural-functional relationships in diabetic nephropathy. J Clin Invest 74, 1143-
1155.
Medici, D., Hay, E.D., and Olsen, B.R. (2008). Snail and Slug promote epithelial-
mesenchymal transition through beta-catenin-T-cell factor-4-dependent expression of
transforming growth factor-beta3. Mol Biol Cell 19, 4875-4887.
Meng, F., Henson, R., Wehbe-Janek, H., Ghoshal, K., Jacob, S.T., and Patel, T. (2007).
MicroRNA-21 regulates expression of the PTEN tumor suppressor gene in human
hepatocellular cancer. Gastroenterology 133, 647-658.
Miller, M.W. (2000). Gene transfection and drug delivery. Ultrasound Med Biol 26 Suppl 1,
S59-62.
Mitu, G.M., Wang, S., and Hirschberg, R. (2007). BMP7 is a podocyte survival factor and
rescues podocytes from diabetic injury. American journal of physiology Renal physiology
293, F1641-1648.
245 | P a g e
Miyoshi, K., Wakioka, T., Nishinakamura, H., Kamio, M., Yang, L., Inoue, M., Hasegawa,
M., Yonemitsu, Y., Komiya, S., and Yoshimura, A. (2004). The Sprouty-related protein,
Spred, inhibits cell motility, metastasis, and Rho-mediated actin reorganization. Oncogene 23,
5567-5576.
Moustakas, A., and Heldin, C.H. (2005). Non-Smad TGF-beta signals. J Cell Sci 118, 3573-
3584.
Moustakas, A., and Heldin, C.H. (2009). The regulation of TGFbeta signal transduction.
Development 136, 3699-3714.
Mulder, K.M. (2000). Role of Ras and Mapks in TGFbeta signaling. Cytokine & growth
factor reviews 11, 23-35.
Murphy, M., Godson, C., Cannon, S., Kato, S., Mackenzie, H.S., Martin, F., and Brady, H.R.
(1999). Suppression subtractive hybridization identifies high glucose levels as a stimulus for
expression of connective tissue growth factor and other genes in human mesangial cells. The
Journal of biological chemistry 274, 5830-5834.
Naeye, B., Deschout, H., Caveliers, V., Descamps, B., Braeckmans, K., Vanhove, C.,
Demeester, J., Lahoutte, T., De Smedt, S., and Raemdonck, K. (2013). In vivo disassembly of
IV administered siRNA matrix nanoparticles at the renal filtration barrier. Biomaterials 34,
2350-2358.
Nagai, K., Matsubara, T., Mima, A., Sumi, E., Kanamori, H., Iehara, N., Fukatsu, A.,
Yanagita, M., Nakano, T., Ishimoto, Y., et al. (2005). Gas6 induces Akt/mTOR-mediated
mesangial hypertrophy in diabetic nephropathy. Kidney international 68, 552-561.
Nagase, H., and Woessner, J.F., Jr. (1999). Matrix metalloproteinases. J Biol Chem 274,
21491-21494.
Nagle, R.B., Bulger, R.E., Cutler, R.E., Jervis, H.R., and Benditt, E.P. (1973). Unilateral
obstructive nephropathy in the rabbit. I. Early morphologic, physiologic, and histochemical
changes. Lab Invest 28, 456-467.
Nakagawa, T., Segal, M., Croker, B., and Johnson, R.J. (2007). A breakthrough in diabetic
nephropathy: the role of endothelial dysfunction. Nephrology, dialysis, transplantation :
246 | P a g e
official publication of the European Dialysis and Transplant Association - European Renal
Association 22, 2775-2777.
Nakano, N., Itoh, S., Watanabe, Y., Maeyama, K., Itoh, F., and Kato, M. (2010). Requirement
of TCF7L2 for TGF-beta-dependent transcriptional activation of the TMEPAI gene. The
Journal of biological chemistry 285, 38023-38033.
Nakao, A., Okumura, K., and Ogawa, H. (2002). Smad7: a new key player in TGF-beta-
associated disease. Trends Mol Med 8, 361-363.
Nangaku, M. (2004). Mechanisms of tubulointerstitial injury in the kidney: final common
pathways to end-stage renal failure. Intern Med 43, 9-17.
Nath, K.A. (1992). Tubulointerstitial changes as a major determinant in the progression of
renal damage. American journal of kidney diseases : the official journal of the National
Kidney Foundation 20, 1-17.
Ng, Y.Y., Huang, T.P., Yang, W.C., Chen, Z.P., Yang, A.H., Mu, W., Nikolic-Paterson, D.J.,
Atkins, R.C., and Lan, H.Y. (1998). Tubular epithelial-myofibroblast transdifferentiation in
progressive tubulointerstitial fibrosis in 5/6 nephrectomized rats. Kidney international 54,
864-876.
Niessen, K., Fu, Y., Chang, L., Hoodless, P.A., McFadden, D., and Karsan, A. (2008). Slug is
a direct Notch target required for initiation of cardiac cushion cellularization. J Cell Biol 182,
315-325.
Nieto, M.A. (2011). The ins and outs of the epithelial to mesenchymal transition in health and
disease. Annu Rev Cell Dev Biol 27, 347-376.
Nomikou, N., and McHale, A.P. (2012). Microbubble-enhanced ultrasound-mediated gene
transfer--towards the development of targeted gene therapy for cancer. International journal
of hyperthermia : the official journal of European Society for Hyperthermic Oncology, North
American Hyperthermia Group 28, 300-310.
Nykanen, A., Haley, B., and Zamore, P.D. (2001). ATP requirements and small interfering
RNA structure in the RNA interference pathway. Cell 107, 309-321.
247 | P a g e
Oba, S., Kumano, S., Suzuki, E., Nishimatsu, H., Takahashi, M., Takamori, H., Kasuya, M.,
Ogawa, Y., Sato, K., Kimura, K., et al. (2010). miR-200b precursor can ameliorate renal
tubulointerstitial fibrosis. PLoS One 5, e13614.
Okada, H., Danoff, T.M., Kalluri, R., and Neilson, E.G. (1997). Early role of Fsp1 in
epithelial-mesenchymal transformation. Am J Physiol 273, F563-574.
Okada, H., Inoue, T., Suzuki, H., Strutz, F., and Neilson, E.G. (2000). Epithelial-
mesenchymal transformation of renal tubular epithelial cells in vitro and in vivo. Nephrol
Dial Transplant 15 Suppl 6, 44-46.
Oldfield, M.D., Bach, L.A., Forbes, J.M., Nikolic-Paterson, D., McRobert, A., Thallas, V.,
Atkins, R.C., Osicka, T., Jerums, G., and Cooper, M.E. (2001). Advanced glycation end
products cause epithelial-myofibroblast transdifferentiation via the receptor for advanced
glycation end products (RAGE). The Journal of clinical investigation 108, 1853-1863.
Padgett, R.W., and Reiss, M. (2007). TGFbeta superfamily signaling: notes from the desert.
Development 134, 3565-3569.
Park, S.H. (2005). Fine tuning and cross-talking of TGF-beta signal by inhibitory Smads. J
Biochem Mol Biol 38, 9-16.
Park, S.M., Gaur, A.B., Lengyel, E., and Peter, M.E. (2008). The miR-200 family determines
the epithelial phenotype of cancer cells by targeting the E-cadherin repressors ZEB1 and
ZEB2. Genes Dev 22, 894-907.
Pasquinelli, A.E., Reinhart, B.J., Slack, F., Martindale, M.Q., Kuroda, M.I., Maller, B.,
Hayward, D.C., Ball, E.E., Degnan, B., Muller, P., et al. (2000). Conservation of the sequence
and temporal expression of let-7 heterochronic regulatory RNA. Nature 408, 86-89.
Paterson, E.L., Kolesnikoff, N., Gregory, P.A., Bert, A.G., Khew-Goodall, Y., and Goodall,
G.J. (2008). The microRNA-200 family regulates epithelial to mesenchymal transition.
ScientificWorldJournal 8, 901-904.
Perez-Moreno, M.A., Locascio, A., Rodrigo, I., Dhondt, G., Portillo, F., Nieto, M.A., and
Cano, A. (2001). A new role for E12/E47 in the repression of E-cadherin expression and
epithelial-mesenchymal transitions. J Biol Chem 276, 27424-27431.

248 | P a g e
Potenta, S., Zeisberg, E., and Kalluri, R. (2008). The role of endothelial-to-mesenchymal
transition in cancer progression. Br J Cancer 99, 1375-1379.
Powell, D.W., Mifflin, R.C., Valentich, J.D., Crowe, S.E., Saada, J.I., and West, A.B. (1999).
Myofibroblasts. I. Paracrine cells important in health and disease. The American journal of
physiology 277, C1-9.
Putta, S., Lanting, L., Sun, G., Lawson, G., Kato, M., and Natarajan, R. (2012). Inhibiting
MicroRNA-192 Ameliorates Renal Fibrosis in Diabetic Nephropathy. J Am Soc Nephrol.
Qi, W., Chen, X., Gilbert, R.E., Zhang, Y., Waltham, M., Schache, M., Kelly, D.J., and
Pollock, C.A. (2007). High glucose-induced thioredoxin-interacting protein in renal proximal
tubule cells is independent of transforming growth factor-beta1. Am J Pathol 171, 744-754.
Qi, W., Chen, X., Polhill, T.S., Sumual, S., Twigg, S., Gilbert, R.E., and Pollock, C.A. (2006).
TGF-beta1 induces IL-8 and MCP-1 through a connective tissue growth factor-independent
pathway. Am J Physiol Renal Physiol 290, F703-709.
Qin, W., Chung, A.C., Huang, X.R., Meng, X.M., Hui, D.S., Yu, C.M., Sung, J.J., and Lan,
H.Y. (2011). TGF-beta/Smad3 signaling promotes renal fibrosis by inhibiting miR-29. J Am
Soc Nephrol 22, 1462-1474.
Quest, A.F., Ghosh, S., Xie, W.Q., and Bell, R.M. (1997). DAG second messengers:
molecular switches and growth control. Adv Exp Med Biol 400A, 297-303.
Rae, F.K., Hooper, J.D., Nicol, D.L., and Clements, J.A. (2001). Characterization of a novel
gene, STAG1/PMEPA1, upregulated in renal cell carcinoma and other solid tumors. Mol
Carcinog 32, 44-53.
Rahimi, R.A., and Leof, E.B. (2007). TGF-beta signaling: a tale of two responses. Journal of
cellular biochemistry 102, 593-608.
Randall, R.A., Germain, S., Inman, G.J., Bates, P.A., and Hill, C.S. (2002). Different Smad2
partners bind a common hydrophobic pocket in Smad2 via a defined proline-rich motif. Embo
J 21, 145-156.
Rhyu, D.Y., Yang, Y., Ha, H., Lee, G.T., Song, J.S., Uh, S.T., and Lee, H.B. (2005). Role of
reactive oxygen species in TGF-beta1-induced mitogen-activated protein kinase activation

249 | P a g e
and epithelial-mesenchymal transition in renal tubular epithelial cells. Journal of the
American Society of Nephrology : JASN 16, 667-675.
Ribeiro, S.M., Poczatek, M., Schultz-Cherry, S., Villain, M., and Murphy-Ullrich, J.E. (1999).
The activation sequence of thrombospondin-1 interacts with the latency-associated peptide to
regulate activation of latent transforming growth factor-beta. The Journal of biological
chemistry 274, 13586-13593.
Roberts, I.S., Burrows, C., Shanks, J.H., Venning, M., and McWilliam, L.J. (1997).
Interstitial myofibroblasts: predictors of progression in membranous nephropathy. J Clin
Pathol 50, 123-127.
Ruggiero, A., Villa, C.H., Bander, E., Rey, D.A., Bergkvist, M., Batt, C.A., Manova-
Todorova, K., Deen, W.M., Scheinberg, D.A., and McDevitt, M.R. (2010). Paradoxical
glomerular filtration of carbon nanotubes. Proc Natl Acad Sci U S A 107, 12369-12374.
Runyan, C.E., Schnaper, H.W., and Poncelet, A.C. (2004). The phosphatidylinositol 3-
kinase/Akt pathway enhances Smad3-stimulated mesangial cell collagen I expression in
response to transforming growth factor-beta1. The Journal of biological chemistry 279, 2632-
2639.
Ryan, M.J., Johnson, G., Kirk, J., Fuerstenberg, S.M., Zager, R.A., and Torok-Storb, B.
(1994). HK-2: an immortalized proximal tubule epithelial cell line from normal adult human
kidney. Kidney international 45, 48-57.
Saito, G., Swanson, J.A., and Lee, K.D. (2003). Drug delivery strategy utilizing conjugation
via reversible disulfide linkages: role and site of cellular reducing activities. Adv Drug Deliv
Rev 55, 199-215.
Salmena, L., Carracedo, A., and Pandolfi, P.P. (2008). Tenets of PTEN tumor suppression.
Cell 133, 403-414.
Sauka-Spengler, T., and Bronner-Fraser, M. (2008). A gene regulatory network orchestrates
neural crest formation. Nat Rev Mol Cell Biol 9, 557-568.
Schena, F.P., and Gesualdo, L. (2005). Pathogenetic mechanisms of diabetic nephropathy.
Journal of the American Society of Nephrology : JASN 16 Suppl 1, S30-33.

250 | P a g e
Schiffer, M., von Gersdorff, G., Bitzer, M., Susztak, K., and Bottinger, E.P. (2000). Smad
proteins and transforming growth factor-beta signaling. Kidney Int Suppl 77, S45-52.
Schleicher, E.D., Bierhaus, A., Haring, H.U., Nawroth, P.P., and Lehmann, R. (2001).
Chemistry and pathobiology of advanced glycation end products. Contrib Nephrol, 1-9.
Schleicher, E.D., and Weigert, C. (2000). Role of the hexosamine biosynthetic pathway in
diabetic nephropathy. Kidney Int Suppl 77, S13-18.
Schmidt-Ott, K.M. (2008). Unraveling the role of connective tissue growth factor in diabetic
nephropathy. Kidney international 73, 375-376.
Schmierer, B., and Hill, C.S. (2007). TGFbeta-SMAD signal transduction: molecular
specificity and functional flexibility. Nat Rev Mol Cell Biol 8, 970-982.
Schrauwen, P., and Hesselink, M.K. (2004). Oxidative capacity, lipotoxicity, and
mitochondrial damage in type 2 diabetes. Diabetes 53, 1412-1417.
Schreiner, G.F., Harris, K.P., Purkerson, M.L., and Klahr, S. (1988). Immunological aspects
of acute ureteral obstruction: immune cell infiltrate in the kidney. Kidney international 34,
487-493.
Sefah, K., Shangguan, D., Xiong, X., O'Donoghue, M.B., and Tan, W. (2010). Development
of DNA aptamers using Cell-SELEX. Nature protocols 5, 1169-1185.
Sela-Donenfeld, D., and Kalcheim, C. (2002). Localized BMP4-noggin interactions generate
the dynamic patterning of noggin expression in somites. Dev Biol 246, 311-328.
Sharma, A.K., Mauer, S.M., Kim, Y., and Michael, A.F. (1993). Interstitial fibrosis in
obstructive nephropathy. Kidney international 44, 774-788.
Sharma, K., Jin, Y., Guo, J., and Ziyadeh, F.N. (1996). Neutralization of TGF-beta by anti-
TGF-beta antibody attenuates kidney hypertrophy and the enhanced extracellular matrix gene
expression in STZ-induced diabetic mice. Diabetes 45, 522-530.
Sharpe, C.C., and Hendry, B.M. (2003). Signaling: focus on Rho in renal disease. J Am Soc
Nephrol 14, 261-264.
Shi, Y., and Massague, J. (2003). Mechanisms of TGF-beta signaling from cell membrane to
the nucleus. Cell 113, 685-700.
251 | P a g e
Singha, P.K., Yeh, I.T., Venkatachalam, M.A., and Saikumar, P. (2010). Transforming
growth factor-beta (TGF-beta)-inducible gene TMEPAI converts TGF-beta from a tumor
suppressor to a tumor promoter in breast cancer. Cancer Res 70, 6377-6383.
Strutz, F., Okada, H., Lo, C.W., Danoff, T., Carone, R.L., Tomaszewski, J.E., and Neilson,
E.G. (1995). Identification and characterization of a fibroblast marker: FSP1. J Cell Biol 130,
393-405.
Strutz, F., Zeisberg, M., Ziyadeh, F.N., Yang, C.Q., Kalluri, R., Muller, G.A., and Neilson,
E.G. (2002). Role of basic fibroblast growth factor-2 in epithelial-mesenchymal
transformation. Kidney Int 61, 1714-1728.
Sun, L., Zhang, D., Liu, F., Xiang, X., Ling, G., Xiao, L., Liu, Y., Zhu, X., Zhan, M., Yang,
Y., et al. (2011). Low-dose paclitaxel ameliorates fibrosis in the remnant kidney model by
down-regulating miR-192. J Pathol 225, 364-377.
Sun, Y., Koo, S., White, N., Peralta, E., Esau, C., Dean, N.M., and Perera, R.J. (2004).
Development of a micro-array to detect human and mouse microRNAs and characterization
of expression in human organs. Nucleic acids research 32, e188.
Suslick, K.S. (1990). Sonochemistry. Science 247, 1439-1445.
Susztak, K., and Bottinger, E.P. (2006). Diabetic nephropathy: a frontier for personalized
medicine. Journal of the American Society of Nephrology : JASN 17, 361-367.
Taki, M., Verschueren, K., Yokoyama, K., Nagayama, M., and Kamata, N. (2006).
Involvement of Ets-1 transcription factor in inducing matrix metalloproteinase-2 expression
by epithelial-mesenchymal transition in human squamous carcinoma cells. Int J Oncol 28,
487-496.
Tan, A.L., Forbes, J.M., and Cooper, M.E. (2007). AGE, RAGE, and ROS in diabetic
nephropathy. Semin Nephrol 27, 130-143.
Tan, R., He, W., Lin, X., Kiss, L.P., and Liu, Y. (2008). Smad ubiquitination regulatory
factor-2 in the fibrotic kidney: regulation, target specificity, and functional implication.
American journal of physiology Renal physiology 294, F1076-1083.
252 | P a g e
ten Dijke, P., and Hill, C.S. (2004). New insights into TGF-beta-Smad signalling. Trends
Biochem Sci 29, 265-273.
Thallas-Bonke, V., Coughlan, M.T., Tan, A.L., Harcourt, B.E., Morgan, P.E., Davies, M.J.,
Bach, L.A., Cooper, M.E., and Forbes, J.M. (2013). Targeting the AGE-RAGE axis improves
renal function in the context of a healthy diet low in advanced glycation end-product content.
Nephrology (Carlton) 18, 47-56.
Thallas-Bonke, V., Lindschau, C., Rizkalla, B., Bach, L.A., Boner, G., Meier, M., Haller, H.,
Cooper, M.E., and Forbes, J.M. (2004). Attenuation of extracellular matrix accumulation in
diabetic nephropathy by the advanced glycation end product cross-link breaker ALT-711 via
a protein kinase C-alpha-dependent pathway. Diabetes 53, 2921-2930.
Thiery, J.P. (2002). Epithelial-mesenchymal transitions in tumour progression. Nat Rev
Cancer 2, 442-454.
Thiery, J.P. (2003). Epithelial-mesenchymal transitions in development and pathologies. Curr
Opin Cell Biol 15, 740-746.
Thiery, J.P., Acloque, H., Huang, R.Y., and Nieto, M.A. (2009). Epithelial-mesenchymal
transitions in development and disease. Cell 139, 871-890.
Thiery, J.P., and Sleeman, J.P. (2006). Complex networks orchestrate epithelial-mesenchymal
transitions. Nat Rev Mol Cell Biol 7, 131-142.
Thum, T., Gross, C., Fiedler, J., Fischer, T., Kissler, S., Bussen, M., Galuppo, P., Just, S.,
Rottbauer, W., Frantz, S., et al. (2008). MicroRNA-21 contributes to myocardial disease by
stimulating MAP kinase signalling in fibroblasts. Nature 456, 980-984.
Tian, Z., Greene, A.S., Pietrusz, J.L., Matus, I.R., and Liang, M. (2008). MicroRNA-target
pairs in the rat kidney identified by microRNA microarray, proteomic, and bioinformatic
analysis. Genome Res 18, 404-411.
Tsukazaki, T., Chiang, T.A., Davison, A.F., Attisano, L., and Wrana, J.L. (1998). SARA, a
FYVE domain protein that recruits Smad2 to the TGFbeta receptor. Cell 95, 779-791.
253 | P a g e
Valcourt, U., Kowanetz, M., Niimi, H., Heldin, C.H., and Moustakas, A. (2005). TGF-beta
and the Smad signaling pathway support transcriptomic reprogramming during epithelial-
mesenchymal cell transition. Mol Biol Cell 16, 1987-2002.
van Rooij, E., and Olson, E.N. (2009). Searching for miR-acles in cardiac fibrosis. Circ Res
104, 138-140.
van Rooij, E., Sutherland, L.B., Thatcher, J.E., DiMaio, J.M., Naseem, R.H., Marshall, W.S.,
Hill, J.A., and Olson, E.N. (2008). Dysregulation of microRNAs after myocardial infarction
reveals a role of miR-29 in cardiac fibrosis. Proc Natl Acad Sci U S A 105, 13027-13032.
Vaughan, E.D., Jr., Marion, D., Poppas, D.P., and Felsen, D. (2004). Pathophysiology of
unilateral ureteral obstruction: studies from Charlottesville to New York. J Urol 172, 2563-
2569.
Vicovac, L., and Aplin, J.D. (1996). Epithelial-mesenchymal transition during trophoblast
differentiation. Acta Anat (Basel) 156, 202-216.
Villanueva, S., Glavic, A., Ruiz, P., and Mayor, R. (2002). Posteriorization by FGF, Wnt, and
retinoic acid is required for neural crest induction. Dev Biol 241, 289-301.
Visse, R., and Nagase, H. (2003). Matrix metalloproteinases and tissue inhibitors of
metalloproteinases: structure, function, and biochemistry. Circ Res 92, 827-839.
Vogel, W., Gish, G.D., Alves, F., and Pawson, T. (1997). The discoidin domain receptor
tyrosine kinases are activated by collagen. Mol Cell 1, 13-23.
Wang, A., Langer, R., and Farokhzad, O. (2012a). Nanoparticle delivery of cancer drugs.
Annu Rev Med 63, 185-198.
Wang, B., Herman-Edelstein, M., Koh, P., Burns, W., Jandeleit-Dahm, K., Watson, A.,
Saleem, M., Goodall, G.J., Twigg, S.M., Cooper, M.E., et al. (2010a). E-cadherin expression
is regulated by miR-192/215 by a mechanism that is independent of the profibrotic effects of
transforming growth factor-beta. Diabetes 59, 1794-1802.
Wang, B., Koh, P., Winbanks, C., Coughlan, M.T., McClelland, A., Watson, A., Jandeleit-
Dahm, K., Burns, W.C., Thomas, M.C., Cooper, M.E., et al. (2011). miR-200a Prevents renal
fibrogenesis through repression of TGF-beta2 expression. Diabetes 60, 280-287.
254 | P a g e
Wang, B., Komers, R., Carew, R., Winbanks, C.E., Xu, B., Herman-Edelstein, M., Koh, P.,
Thomas, M., Jandeleit-Dahm, K., Gregorevic, P., et al. (2012b). Suppression of microRNA-
29 expression by TGF-beta1 promotes collagen expression and renal fibrosis. Journal of the
American Society of Nephrology : JASN 23, 252-265.
Wang, G., Kwan, B.C., Lai, F.M., Choi, P.C., Chow, K.M., Li, P.K., and Szeto, C.C. (2010b).
Intrarenal expression of microRNAs in patients with IgA nephropathy. Lab Invest 90, 98-103.
Wang, G., Kwan, B.C., Lai, F.M., Choi, P.C., Chow, K.M., Li, P.K., and Szeto, C.C. (2010c).
Intrarenal expression of miRNAs in patients with hypertensive nephrosclerosis. Am J
Hypertens 23, 78-84.
Wang, Q., Wang, Y., Minto, A.W., Wang, J., Shi, Q., Li, X., and Quigg, R.J. (2008a).
MicroRNA-377 is up-regulated and can lead to increased fibronectin production in diabetic
nephropathy. Faseb J 22, 4126-4135.
Wang, S., de Caestecker, M., Kopp, J., Mitu, G., Lapage, J., and Hirschberg, R. (2006). Renal
bone morphogenetic protein-7 protects against diabetic nephropathy. Journal of the American
Society of Nephrology : JASN 17, 2504-2512.
Wang, Y. (2009). Wnt/Planar cell polarity signaling: a new paradigm for cancer therapy. Mol
Cancer Ther 8, 2103-2109.
Wang, Y., Janicki, P., Koster, I., Berger, C.D., Wenzl, C., Grosshans, J., and Steinbeisser, H.
(2008b). Xenopus Paraxial Protocadherin regulates morphogenesis by antagonizing Sprouty.
Genes Dev 22, 878-883.
Watanabe, Y., Itoh, S., Goto, T., Ohnishi, E., Inamitsu, M., Itoh, F., Satoh, K., Wiercinska, E.,
Yang, W., Shi, L., et al. (2010). TMEPAI, a transmembrane TGF-beta-inducible protein,
sequesters Smad proteins from active participation in TGF-beta signaling. Molecular cell 37,
123-134.
Wautier, J.L., and Guillausseau, P.J. (2001). Advanced glycation end products, their receptors
and diabetic angiopathy. Diabetes Metab 27, 535-542.
Weinberg, R.A. (2008). Twisted epithelial-mesenchymal transition blocks senescence. Nat
Cell Biol 10, 1021-1023.

255 | P a g e
Wight, T.N., and Potter-Perigo, S. (2011). The extracellular matrix: an active or passive
player in fibrosis? American journal of physiology Gastrointestinal and liver physiology 301,
G950-955.
Wolf, G. (2002). Molecular mechanisms of diabetic mesangial cell hypertrophy: a
proliferation of novel factors. J Am Soc Nephrol 13, 2611-2613.
Wolf, G. (2004). New insights into the pathophysiology of diabetic nephropathy: from
haemodynamics to molecular pathology. Eur J Clin Invest 34, 785-796.
Wolf, G., and Ziyadeh, F.N. (2007). Cellular and molecular mechanisms of proteinuria in
diabetic nephropathy. Nephron Physiol 106, p26-31.
Wong, M.G., Panchapakesan, U., Qi, W., Silva, D.G., Chen, X.M., and Pollock, C.A. (2011).
Cation-independent mannose 6-phosphate receptor inhibitor (PXS25) inhibits fibrosis in
human proximal tubular cells by inhibiting conversion of latent to active TGF-beta1. Am J
Physiol Renal Physiol 301, F84-93.
Wrighton, K.H., Lin, X., and Feng, X.H. (2009). Phospho-control of TGF-beta superfamily
signaling. Cell Res 19, 8-20.
Wu, Y., Deng, J., Rychahou, P.G., Qiu, S., Evers, B.M., and Zhou, B.P. (2009). Stabilization
of snail by NF-kappaB is required for inflammation-induced cell migration and invasion.
Cancer Cell 15, 416-428.
Xin, X., Chen, S., Khan, Z.A., and Chakrabarti, S. (2007). Akt activation and augmented
fibronectin production in hyperhexosemia. Am J Physiol Endocrinol Metab 293, E1036-1044.
Xiong, M., Jiang, L., Zhou, Y., Qiu, W., Fang, L., Tan, R., Wen, P., and Yang, J. (2012). The
miR-200 family regulates TGF-beta1-induced renal tubular epithelial to mesenchymal
transition through Smad pathway by targeting ZEB1 and ZEB2 expression. Am J Physiol
Renal Physiol 302, F369-379.
Xu, L.L., Shanmugam, N., Segawa, T., Sesterhenn, I.A., McLeod, D.G., Moul, J.W., and
Srivastava, S. (2000). A novel androgen-regulated gene, PMEPA1, located on chromosome
20q13 exhibits high level expression in prostate. Genomics 66, 257-263.
256 | P a g e
Xu, L.L., Shi, Y., Petrovics, G., Sun, C., Makarem, M., Zhang, W., Sesterhenn, I.A., McLeod,
D.G., Sun, L., Moul, J.W., et al. (2003). PMEPA1, an androgen-regulated NEDD4-binding
protein, exhibits cell growth inhibitory function and decreased expression during prostate
cancer progression. Cancer Res 63, 4299-4304.
Yan, X., Liu, Z., and Chen, Y. (2009). Regulation of TGF-beta signaling by Smad7. Acta
Biochim Biophys Sin (Shanghai) 41, 263-272.
Yang, J., and Liu, Y. (2001). Dissection of key events in tubular epithelial to myofibroblast
transition and its implications in renal interstitial fibrosis. Am J Pathol 159, 1465-1475.
Yang, J., Mani, S.A., and Weinberg, R.A. (2006). Exploring a new twist on tumor metastasis.
Cancer Res 66, 4549-4552.
Yang, J., and Weinberg, R.A. (2008). Epithelial-mesenchymal transition: at the crossroads of
development and tumor metastasis. Dev Cell 14, 818-829.
Yang, J., Zhang, X., Li, Y., and Liu, Y. (2003). Downregulation of Smad transcriptional
corepressors SnoN and Ski in the fibrotic kidney: an amplification mechanism for TGF-beta1
signaling. Journal of the American Society of Nephrology : JASN 14, 3167-3177.
Yang, M.H., Wu, M.Z., Chiou, S.H., Chen, P.M., Chang, S.Y., Liu, C.J., Teng, S.C., and Wu,
K.J. (2008). Direct regulation of TWIST by HIF-1alpha promotes metastasis. Nat Cell Biol 10,
295-305.
Yokoi, H., Mukoyama, M., Nagae, T., Mori, K., Suganami, T., Sawai, K., Yoshioka, T.,
Koshikawa, M., Nishida, T., Takigawa, M., et al. (2004). Reduction in connective tissue
growth factor by antisense treatment ameliorates renal tubulointerstitial fibrosis. Journal of
the American Society of Nephrology : JASN 15, 1430-1440.
Yokoi, H., Sugawara, A., Mukoyama, M., Mori, K., Makino, H., Suganami, T., Nagae, T.,
Yahata, K., Fujinaga, Y., Tanaka, I., et al. (2001). Role of connective tissue growth factor in
profibrotic action of transforming growth factor-beta: a potential target for preventing renal
fibrosis. Am J Kidney Dis 38, S134-138.
257 | P a g e
Yook, J.I., Li, X.Y., Ota, I., Hu, C., Kim, H.S., Kim, N.H., Cha, S.Y., Ryu, J.K., Choi, Y.J.,
Kim, J., et al. (2006). A Wnt-Axin2-GSK3beta cascade regulates Snail1 activity in breast
cancer cells. Nat Cell Biol 8, 1398-1406.
Yu, B., Zhao, X., Lee, L., and Lee, R. (2009). Targeted delivery systems for oligonucleotide
therapeutics. The AAPS journal 11, 195-203.
Zamore, P.D., and Haley, B. (2005). Ribo-gnome: the big world of small RNAs. Science 309,
1519-1524.
Zavadil, J., and Bottinger, E.P. (2005). TGF-beta and epithelial-to-mesenchymal transitions.
Oncogene 24, 5764-5774.
Zeisberg, E.M., Tarnavski, O., Zeisberg, M., Dorfman, A.L., McMullen, J.R., Gustafsson, E.,
Chandraker, A., Yuan, X., Pu, W.T., Roberts, A.B., et al. (2007a). Endothelial-to-
mesenchymal transition contributes to cardiac fibrosis. Nat Med 13, 952-961.
Zeisberg, M., and Duffield, J.S. (2010). Resolved: EMT produces fibroblasts in the kidney. J
Am Soc Nephrol 21, 1247-1253.
Zeisberg, M., and Kalluri, R. (2004). The role of epithelial-to-mesenchymal transition in renal
fibrosis. J Mol Med 82, 175-181.
Zeisberg, M., Maeshima, Y., Mosterman, B., and Kalluri, R. (2002). Renal fibrosis.
Extracellular matrix microenvironment regulates migratory behavior of activated tubular
epithelial cells. Am J Pathol 160, 2001-2008.
Zeisberg, M., and Neilson, E.G. (2009). Biomarkers for epithelial-mesenchymal transitions.
The Journal of clinical investigation 119, 1429-1437.
Zeisberg, M., Strutz, F., and Muller, G.A. (2001). Renal fibrosis: an update. Curr Opin
Nephrol Hypertens 10, 315-320.
Zeisberg, M., Yang, C., Martino, M., Duncan, M.B., Rieder, F., Tanjore, H., and Kalluri, R.
(2007b). Fibroblasts derive from hepatocytes in liver fibrosis via epithelial to mesenchymal
transition. The Journal of biological chemistry 282, 23337-23347.

258 | P a g e
Zeisberg, M., Yang, C., Martino, M., Duncan, M.B., Rieder, F., Tanjore, H., and Kalluri, R.
(2007c). Fibroblasts derive from hepatocytes in liver fibrosis via epithelial to mesenchymal
transition. J Biol Chem 282, 23337-23347.
Zhang, Z., Peng, H., Chen, J., Chen, X., Han, F., Xu, X., He, X., and Yan, N. (2009).
MicroRNA-21 protects from mesangial cell proliferation induced by diabetic nephropathy in
db/db mice. FEBS Lett 583, 2009-2014.
Zheng, G., Lyons, J.G., Tan, T.K., Wang, Y., Hsu, T.T., Min, D., Succar, L., Rangan, G.K.,
Hu, M., Henderson, B.R., et al. (2009). Disruption of E-cadherin by matrix metalloproteinase
directly mediates epithelial-mesenchymal transition downstream of transforming growth
factor-beta1 in renal tubular epithelial cells. The American journal of pathology 175, 580-591.
Zhong, X., Chung, A.C., Chen, H.Y., Dong, Y., Meng, X.M., Li, R., Yang, W., Hou, F.F.,
and Lan, H.Y. (2013). miR-21 is a key therapeutic target for renal injury in a mouse model of
type 2 diabetes. Diabetologia 56, 663-674.
Zhong, X., Chung, A.C., Chen, H.Y., Meng, X.M., and Lan, H.Y. (2011). Smad3-mediated
upregulation of miR-21 promotes renal fibrosis. J Am Soc Nephrol 22, 1668-1681.
Zhou, X., Zhang, J., Jia, Q., Ren, Y., Wang, Y., Shi, L., Liu, N., Wang, G., Pu, P., You, Y., et
al. (2010). Reduction of miR-21 induces glioma cell apoptosis via activating caspase 9 and 3.
Oncol Rep 24, 195-201.
Ziyadeh, F.N. (2004). Mediators of diabetic renal disease: the case for tgf-Beta as the major
mediator. J Am Soc Nephrol 15 Suppl 1, S55-57.
Ziyadeh, F.N., Simmons, D.A., Snipes, E.R., and Goldfarb, S. (1991). Effect of myo-inositol
on cell proliferation and collagen transcription and secretion in proximal tubule cells cultured
in elevated glucose. Journal of the American Society of Nephrology : JASN 1, 1220-1229.
Zuckerman, J., Choi, C., Han, H., and Davis, M. (2012). Polycation-siRNA nanoparticles can
disassemble at the kidney glomerular basement membrane. Proc Natl Acad Sci U S A 109,
3137-3142.

259 | P a g e