Copyright anbirts1 Treasury Management Policy Process and Performance.
Upload
carter-mcallisterCategory
view
225download
3
copyright anbirts 1
Capital Structure
The Big
Debate
Well can you or can’t you?
copyright anbirts 2
Capital Structure
• What do we mean?
• Basically, can we maximise shareholders wealth by varying the proportions of debt and equity in a company’s capital make up?
copyright anbirts 3
Capital Structure
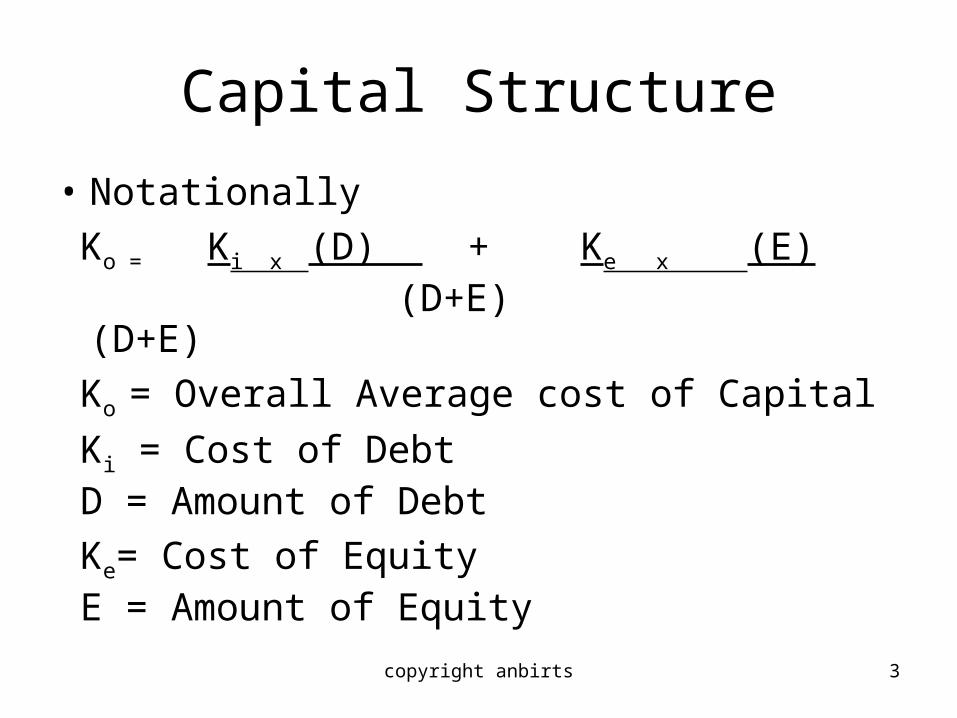
• Notationally
Ko = Ki x (D) + Ke x (E) (D+E) (D+E)
Ko = Overall Average cost of Capital
Ki = Cost of Debt D = Amount of Debt
Ke= Cost of Equity E = Amount of Equity

copyright anbirts 4
Capital Structure
• As Debt is usually cheaper than equity, why is it not an open and shut case?
• Consider Return on a project = 15% Needs £200-00 of capital Cash Return = £30 If all financing is equity then obviously ROE (return on equity) = 30 = 15% 200

copyright anbirts 5
Capital Structure
• Suppose instead it is financed 50/50 debt/ equity and cost of debt = 10%
• Then: Total Return = 30 Interest cost = 10 (100 x .10) Net Return 20
ROE = 20 = 20% 100So far so good, some very happy shareholders

copyright anbirts 6
Capital Structure
• But disaster strikes and the return falls to £15• Now the returns are
Total returns = 15
Interest cost = 10
Net return = 5
ROE = 5 = 5%
100

copyright anbirts 7
Capital Structure
• Whereas if the shareholders had not been so bold and had financed all Equity
ROE = 15 = 7.5% 200
What effect has leverage had?
copyright anbirts 8
Capital Structure
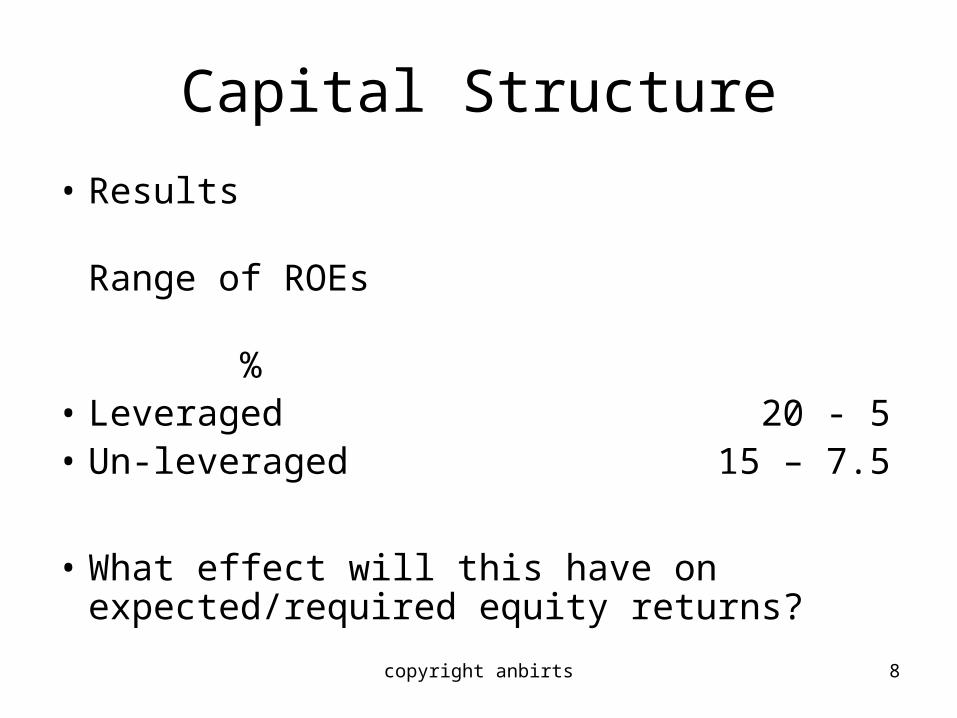
• Results Range of ROEs %• Leveraged 20 - 5• Un-leveraged 15 – 7.5
• What effect will this have on expected/required equity returns?
copyright anbirts 9
Capital Structure
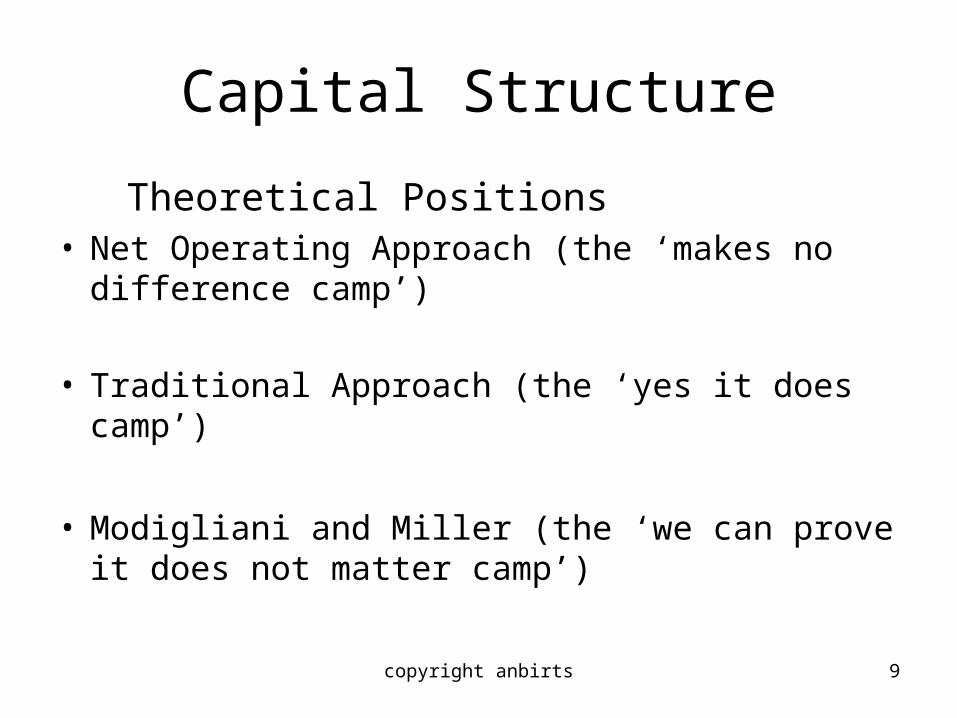
Theoretical Positions• Net Operating Approach (the ‘makes no
difference camp’)
• Traditional Approach (the ‘yes it does camp’)
• Modigliani and Miller (the ‘we can prove it does not matter camp’)

copyright anbirts 10
Capital Structure
• Net Operating Approach Net operating income 1,000 Capitalisation rate (cost of Capital) .15 Total value of firm 6,667 Market value of debt (cost 10%) 1,000 Market value of equity 5,667 Earnings for equity 1,000 – 100 = 900 ROE = 900 = 15.88% 5,667
copyright anbirts 11
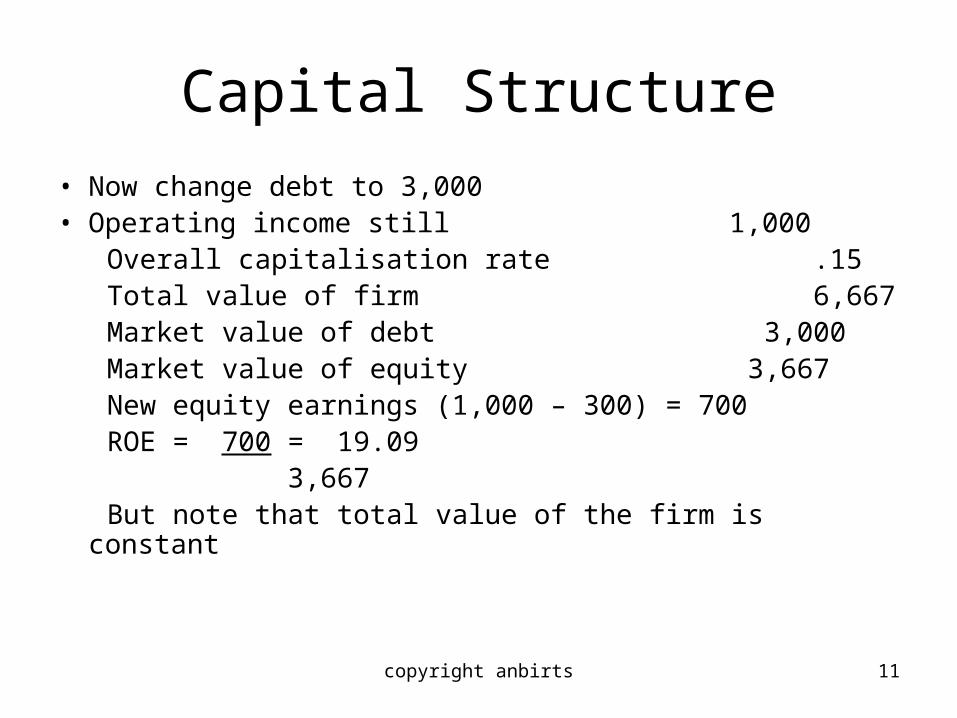
Capital Structure
• Now change debt to 3,000• Operating income still 1,000 Overall capitalisation rate .15 Total value of firm 6,667 Market value of debt 3,000 Market value of equity 3,667 New equity earnings (1,000 – 300) = 700 ROE = 700 = 19.09 3,667 But note that total value of the firm is constant

copyright anbirts 12
Capital StructureTraditional approach – assumes there is an optimal structure therefore
judicious use of leverage will increase value of firm
20
10
15
0
Ke
Ko
Ki
Leverage
%

copyright anbirts 13
Capital Structure
Arbitrage Support
• Basically the argument is i) that the company can do nothing that the shareholders cannot do for themselves and ii) that value comes from the cash flows into the company not from fiddling about within the company.

copyright anbirts 14
Capital Structure
• Arbitrage Support Co A Co BNet Op Income 10,000 10,000Interest on debt (12% pa) nil 3,600Net earnings 10,000 6,400Equity req return .15 .16Market Value of equity 66,667 40,000Market value of debt nil 30,000Total value of the firm 66,667 70,000

copyright anbirts 15
Capital Structure
• M&M would argue that it would not be possible for one company to remain ‘more valuable ‘ than the other, since the over valued company would be sold and the under valued company bought, until the prices equalise’.
• A shareholder in B would do this, replicating Bs actions

copyright anbirts 16
Capital Structure
• Investor in B (IB) owns 1% of B i.e. 400• IB sell their shares for 400 Return would have been 64 (1% of 6,400)• IB borrows 300 (1% of B’s debt) @ 12%• IB buys 1% of A for 666.7 Net position• Return on A 100.0• Less interest 36.0• Net return 64.0 same as in B but for 33.3 less personal outlay (700 – 666.7)
so could spend on more A
copyright anbirts 17
Capital Structure
• QED• But the proof relies on a few assumptions• Capital markets are perfect (information is costless, no taxes, no
transaction costs and so on)• And they are not• So we need to consider the imperfections

copyright anbirts 18
Capital Structure
Effects of imperfections
• Taxes
• Financial distress
• Bankruptcy
• Corporate/private leverage
• Non debt tax shields

copyright anbirts 19
Capital Structure• Taxes Co A Co B EBIT 2,000 2,000 Interest* - 600 Profit before tax 2,000 1,400 Taxes @ 40% 800 560 Shareholders income 1,200 840
Total income to debt andShareholders 1,200 1,440
*(5,000 of debt @ 12% in B)

copyright anbirts 20
Capital Structure
• But has this increased shareholder value?• Yes Suppose companies A and B have £8,000
of Capital. Co A would have 8,000 shares of £1-00 each• Company A’s RoE is 1,200 = 15% 8,000EPS = 15 pence, suppose PE = 6.66 Share value = 1.00

copyright anbirts 21
Capital Structure
• Company B’s Capital is:
• 5,000 debt
• 3,000 equity
• Therefore B’s RoE is 840 = 28%
3,000
EPS = 28 pence, PE is 6.66
Share value = 1.87

copyright anbirts 22
Capital Structure
A gift from the Government?• Suppose debt interest was deducted after tax. • Then• EBIT 2,000• Tax at 40% 800• Net after tax 1,200• Deduct debt interest 600• Income for shareholders 600
copyright anbirts 23
Capital Structure
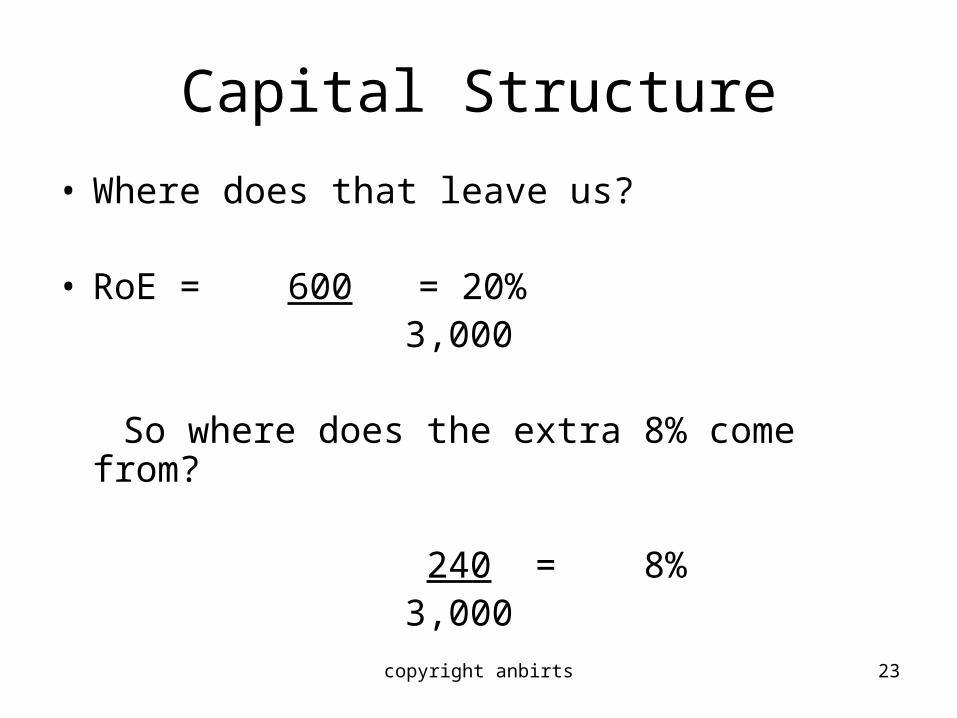
• Where does that leave us?
• RoE = 600 = 20% 3,000
So where does the extra 8% come from?
240 = 8% 3,000

copyright anbirts 24
Capital Structure
Leverage
Sh
are
pri
ce
0% 100%
e+d+c+b
d+c+b
c + b
b
Optimal Range
a
b effect of increasing price of debtc effect of adjustment for risk (including NPV of bankruptcy costs)d loss of tax shield Trade off theorye cost of financial distress
Effect of Costs of Bankruptcy & Financial Distress on the Value of the Firm company value
utilising debt shield to maximum

copyright anbirts 25
Capital Structure
Debt Equity TotPrp’tion Cost aftTax Wghtd cost % wghtd
0 7 12 100
20 7 12.5 80
30 7.5 13 70
50 8 14 50
70 9.5 18 30
80 11.5 21 20
Tax Rate 30%

copyright anbirts 26

copyright anbirts 27
Capital Structure
Debt Equity TotPrp’tion Cost aftTax Wghtd cost % wghtd 0 7 4.9 0 12 100 12 1220 7 4.9 .98 12.5 80 10 10.9830 7.5 5.25 1.575 13 70 9.1 10.68
50 8 5.6 2.8 14 50 7 9.8 70 9.5 6.65 4.65 18 30 5.4 10.05 80 11.5 8.05 6.44 21 20 4.2 10.64
Tax Rate 30%

copyright anbirts 28
Capital Structure
Cost of 13Capital 12
11
10 0 50 100 Gearing/Leverage

copyright anbirts 29
Capital Structure
So how will we decide on leverage level?
• Industry norms
• Coverage ratios
* interest
* interest plus principal
copyright anbirts 30
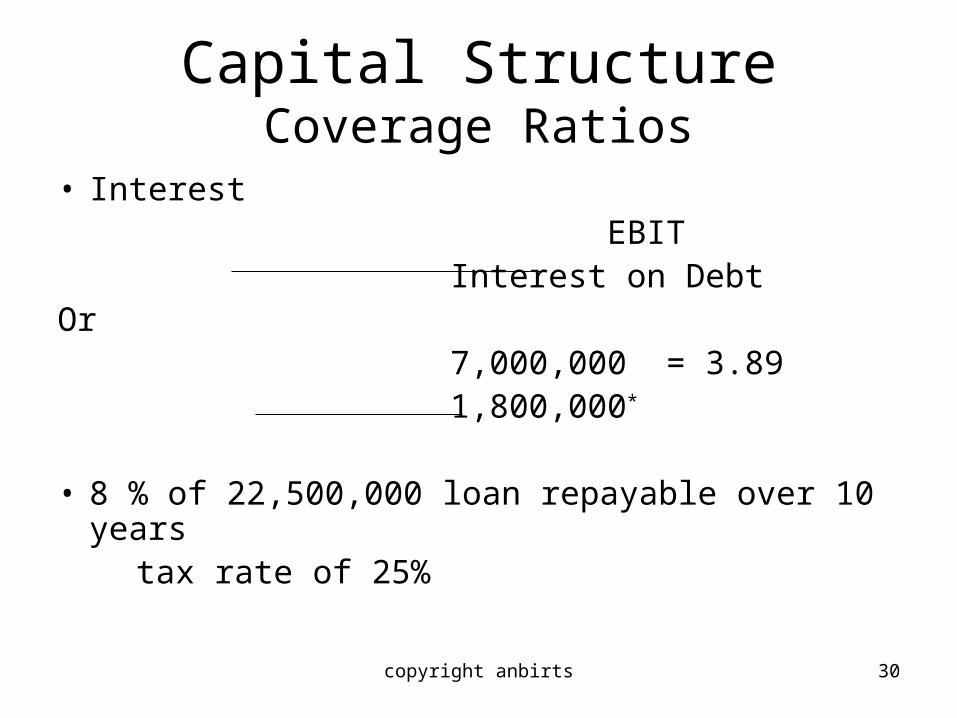
Capital StructureCoverage Ratios
• Interest EBIT Interest on DebtOr 7,000,000 = 3.89 1,800,000*
• 8 % of 22,500,000 loan repayable over 10 years tax rate of 25%

copyright anbirts 31
Capital structureCoverage Ratios
• Interest plus Principal• EBIT Interest + Principal 1 – Tax Rate
7,000,000 1,800,000 + 2,250,000 = 1.46 1-.25

copyright anbirts 32
Capital StructureCoverage Ratios
But what is a suitable coverage ratio?• Variability
• Trend Analysis
• Industry Norms
• All Commitments

copyright anbirts 33
Capital Structure
• Profitability * pecking order• Size * portfolio effect * pecking order• Asset type• Volatility of earnings• International / cultural norms
copyright anbirts 34
Capital Structure
• EBIT/EPS Analysis• Question, what form of financing will result
in the largest EPS?• Situation (Example from Van Horne)- Co issued 200,000 shares worth 50 each- Co needs to borrow a further 5,000,000- Co may borrow at 12%- Tax Rate 40%
copyright anbirts 35
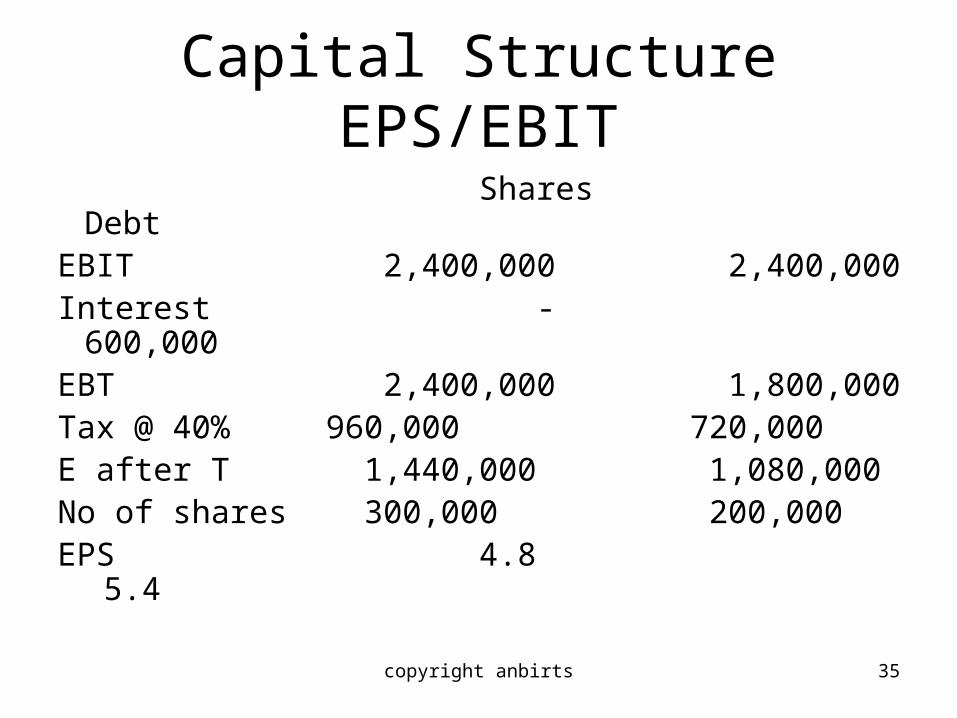
Capital StructureEPS/EBIT
Shares DebtEBIT 2,400,000 2,400,000Interest - 600,000EBT 2,400,000 1,800,000Tax @ 40% 960,000 720,000E after T 1,440,000 1,080,000No of shares 300,000 200,000EPS 4.8 5.4

copyright anbirts 36
Capital StructureEPS/EBIT
• Break Even Point
E 6P 5S 4 3 * 2 1 0 EBIT 1 2 3 4 5 6 Millions
copyright anbirts 37
Capital StructureEPS/EBIT
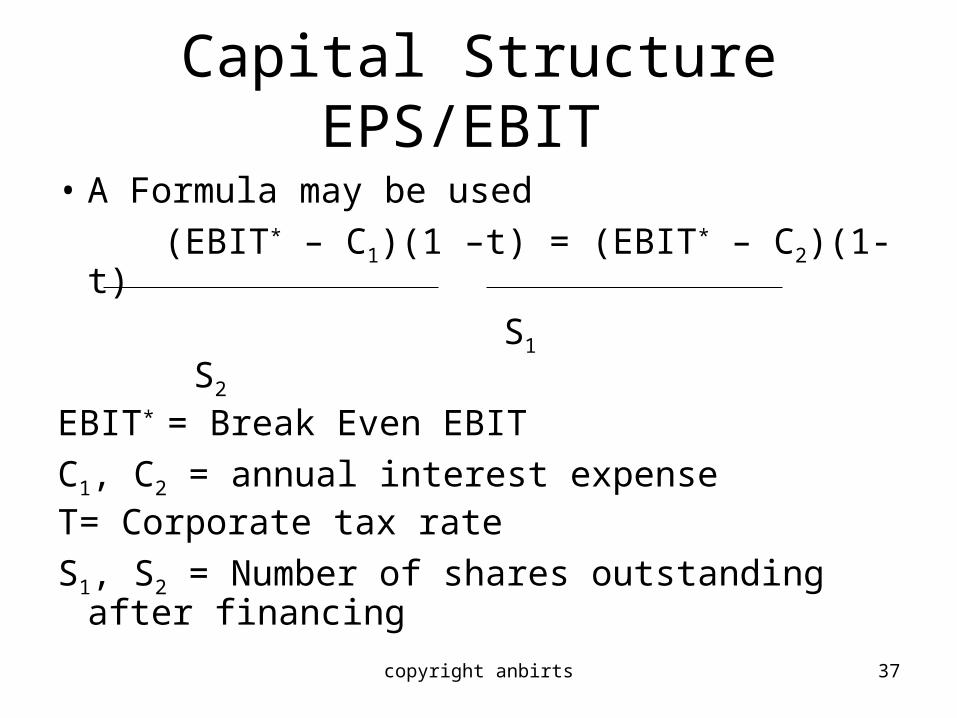
• A Formula may be used
(EBIT* – C1)(1 –t) = (EBIT* – C2)(1-t)
S1 S2
EBIT* = Break Even EBIT
C1, C2 = annual interest expenseT= Corporate tax rate
S1, S2 = Number of shares outstanding after financing

copyright anbirts 38
Capital StructureEPS/EBIT
• (EBIT* - 0)(.6) = (EBIT* - 600,000)(.6) 300,000 200,000 .6(EBIT*)(200,000) = .6(EBIT*)(300,000) – .6(600,000)(300,000)60,000EBIT* = 108,000,000,000EBIT* = 1,800,000

copyright anbirts 39
Cost of CapitalObjective is to minimise cost of capital
Risk Free Rate
Types Debt Sources
Cost of Capital
Equity
Risk ReturnDividend
Capital growth
-Market - Environment
-Business - Portfolio
-Political
Capital Structure