Copyright © Allyn & Bacon (2007) Manual Statistical Computation Procedures Graziano and Raulin...
45
Copyright © Allyn & Bacon (2007) Copyright © Allyn & Bacon (2007) Manual Statistical Manual Statistical Computation Procedures Computation Procedures Graziano and Raulin Graziano and Raulin Research Methods Research Methods This multimedia product and its contents are protected under copyright law. The This multimedia product and its contents are protected under copyright law. The following are prohibited by law: (1) Any public performance or display, including following are prohibited by law: (1) Any public performance or display, including transmission of any image over a network; (2) Preparation of any derivative work, transmission of any image over a network; (2) Preparation of any derivative work, including the extraction, in whole or in part, of any images; (3) Any rental, including the extraction, in whole or in part, of any images; (3) Any rental, lease, or lending of the program. lease, or lending of the program.
-
Upload
ella-parker -
Category
Documents
-
view
214 -
download
0
Transcript of Copyright © Allyn & Bacon (2007) Manual Statistical Computation Procedures Graziano and Raulin...

Copyright © Allyn & Bacon (2007)Copyright © Allyn & Bacon (2007)
Manual Statistical Manual Statistical Computation Computation ProceduresProcedures
Graziano and RaulinGraziano and RaulinResearch MethodsResearch MethodsThis multimedia product and its contents are protected under copyright law. The following are This multimedia product and its contents are protected under copyright law. The following are prohibited by law: (1) Any public performance or display, including transmission of any image prohibited by law: (1) Any public performance or display, including transmission of any image over a network; (2) Preparation of any derivative work, including the extraction, in whole or in over a network; (2) Preparation of any derivative work, including the extraction, in whole or in part, of any images; (3) Any rental, lease, or lending of the program.part, of any images; (3) Any rental, lease, or lending of the program.
Copyright © Allyn & Bacon (2007)Copyright © Allyn & Bacon (2007)
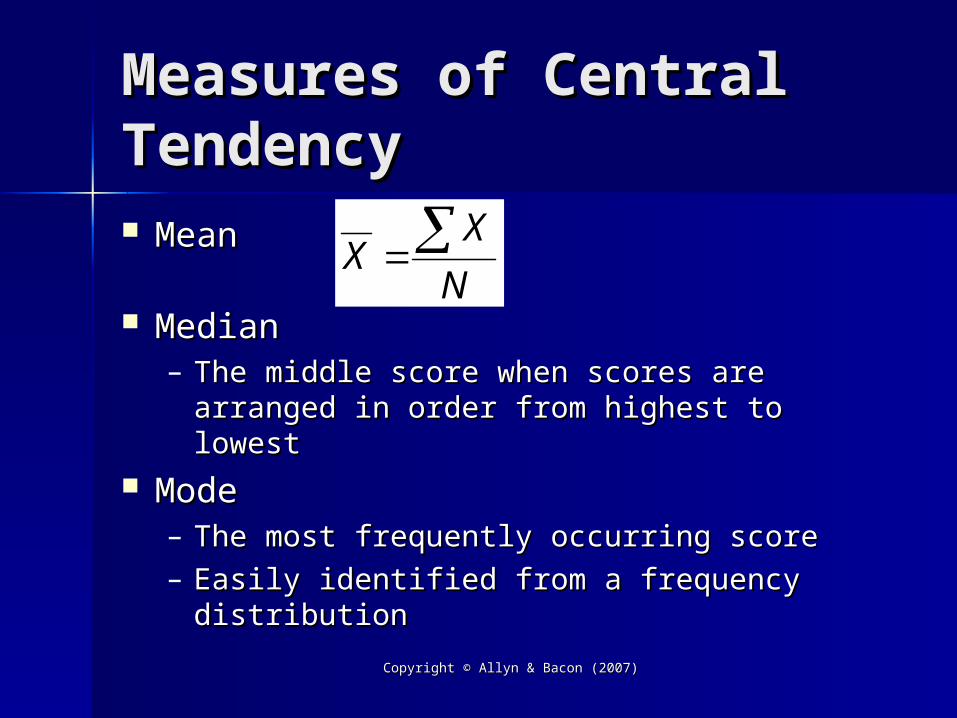
Measures of Central Measures of Central TendencyTendency MeanMean
MedianMedian– The middle score when scores are The middle score when scores are
arranged in order from highest to lowestarranged in order from highest to lowest ModeMode
– The most frequently occurring score The most frequently occurring score – Easily identified from a frequency Easily identified from a frequency
distributiondistribution
N
XX

Copyright © Allyn & Bacon (2007)Copyright © Allyn & Bacon (2007)
Measures of VariabilityMeasures of Variability
VarianceVariance
ComputationalComputationalFormulaFormula
Standard DeviationStandard Deviation
sSS
df
X X
N2
2
1
( )
SS X
X
N 2
2
s s 2
Copyright © Allyn & Bacon (2007)Copyright © Allyn & Bacon (2007)
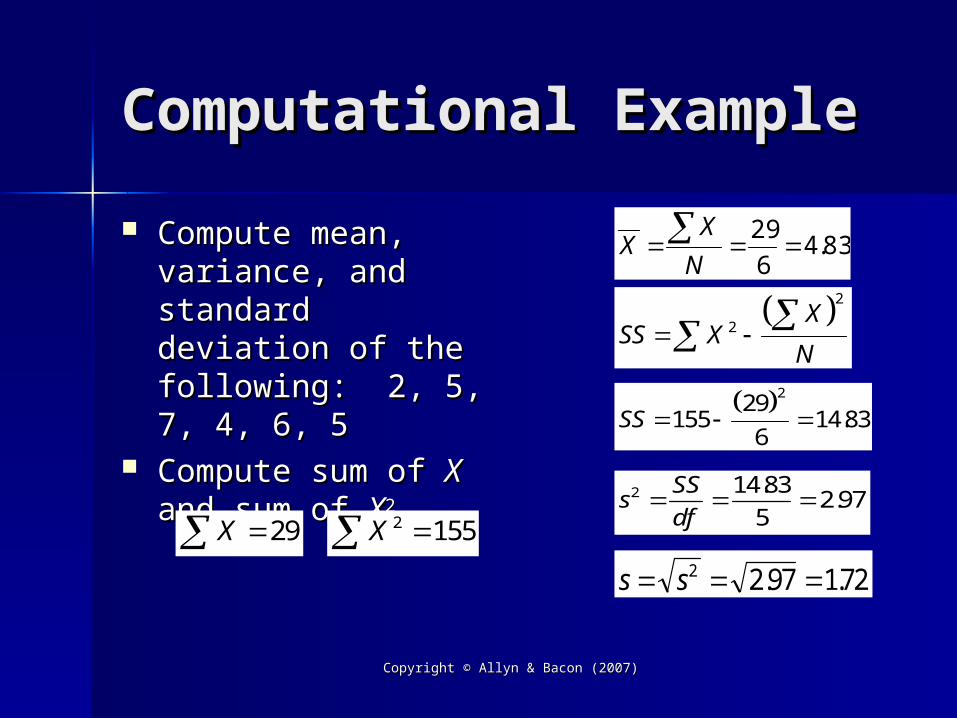
Computational Computational ExampleExample Compute mean, Compute mean,
variance, and variance, and standard deviation standard deviation of the following: 2, of the following: 2, 5, 7, 4, 6, 5 5, 7, 4, 6, 5
Compute sum of Compute sum of XX and sum of and sum of XX22
83.46
29
N
XX
X 29 X 2 155
SS X
X
N 2
2
sSS
df2 14 83
52 97
..
s s 2 2 97 172. .
SS 155
29
614 83
2
.
Copyright © Allyn & Bacon (2007)Copyright © Allyn & Bacon (2007)
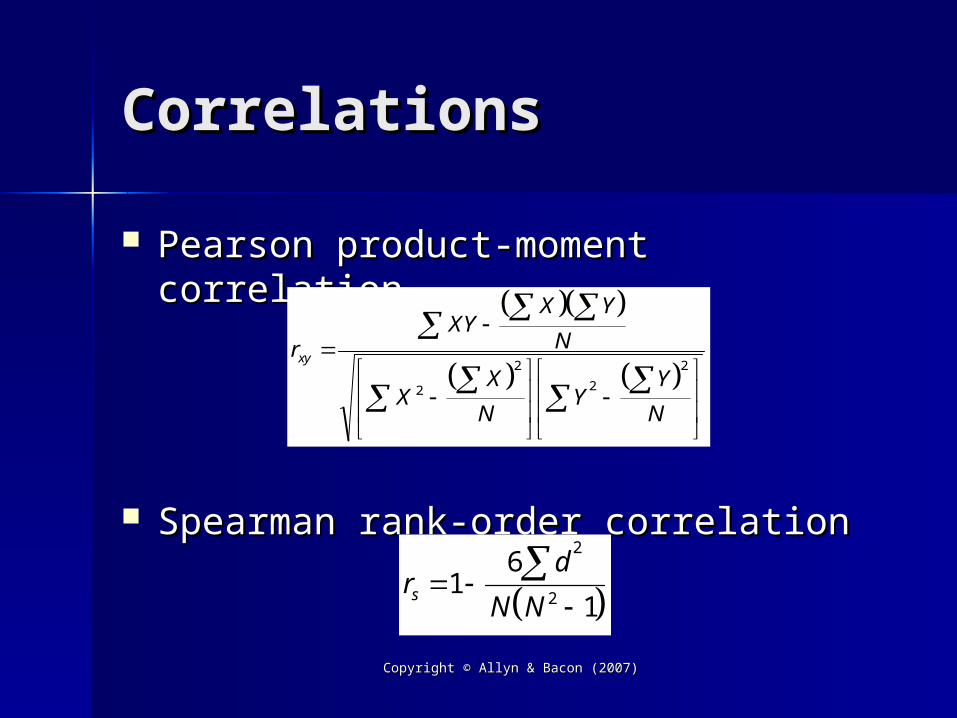
CorrelationsCorrelations
Pearson product-moment correlationPearson product-moment correlation
Spearman rank-order correlationSpearman rank-order correlation
r
XYX Y
N
XX
NY
Y
N
xy
2
2
2
2
rd
N Ns
1
6
1
2
2

Copyright © Allyn & Bacon (2007)Copyright © Allyn & Bacon (2007)
Computational Computational ExampleExample Compute the Compute the
product-moment product-moment correlation for the correlation for the data at the rightdata at the right
Compute the sums, Compute the sums, sums of squares, sums of squares, and cross products and cross products as shownas shown
Computations on Computations on next slidenext slide
X Y XX Y X22 Y Y22 XY XY
4 5 16 25 204 5 16 25 20
3 5 9 25 153 5 9 25 15
5 6 25 36 305 6 25 36 30
2 4 4 16 82 4 4 16 8
6 7 36 49 426 7 36 49 42
5 7 25 49 355 7 25 49 35
25 34 115 200 25 34 115 200 150150
Copyright © Allyn & Bacon (2007)Copyright © Allyn & Bacon (2007)
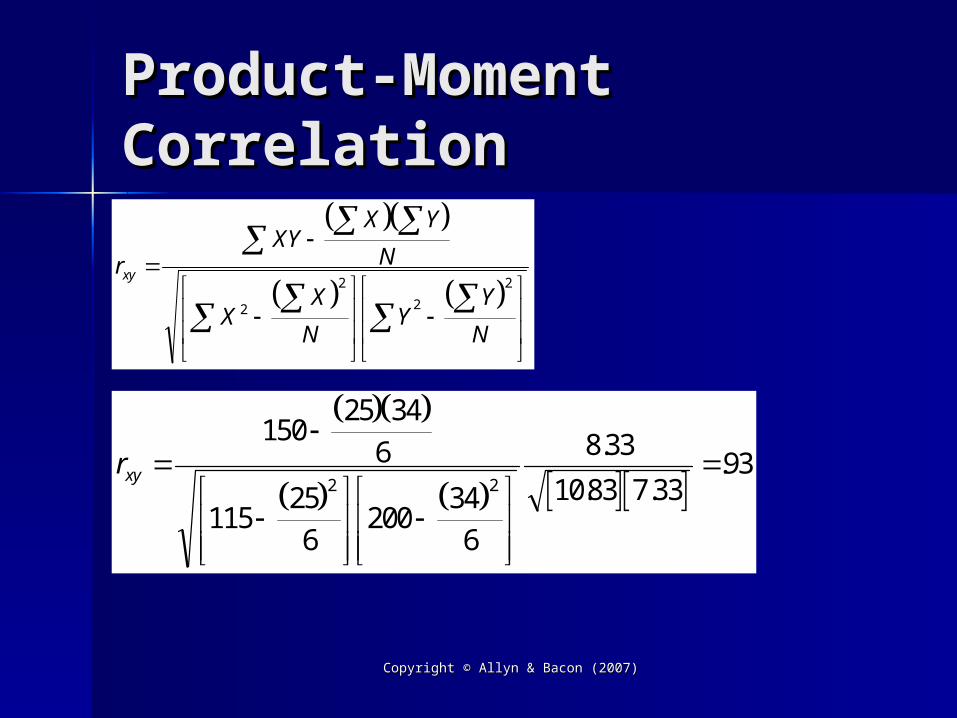
Product-Moment Product-Moment CorrelationCorrelation
r
XYX Y
N
XX
NY
Y
N
xy
2
2
2
2
rxy
150
25 34
6
11525
6200
34
6
8 33
1083 7 3393
2 2
.
. ..
Copyright © Allyn & Bacon (2007)Copyright © Allyn & Bacon (2007)
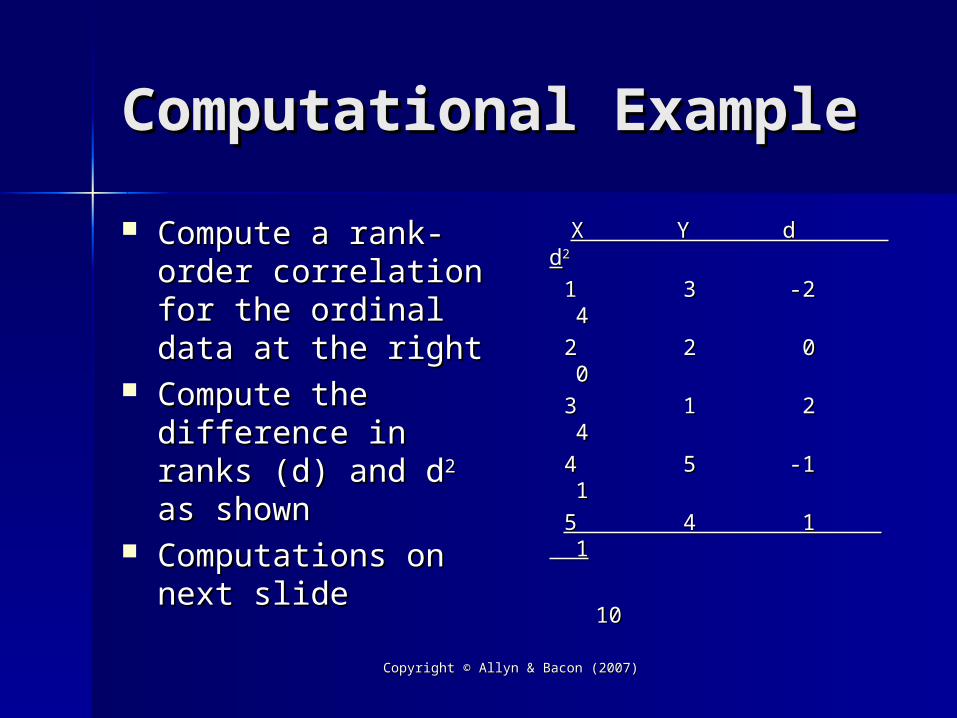
Computational Computational ExampleExample Compute a rank-Compute a rank-
order correlation for order correlation for the ordinal data at the ordinal data at the rightthe right
Compute the Compute the difference in ranks difference in ranks (d) and d(d) and d22 as shown as shown
Computations on Computations on next slidenext slide
X Y d dX Y d d22
1 3 -2 41 3 -2 4
2 2 0 02 2 0 0
3 1 2 43 1 2 4
4 5 -1 14 5 -1 1
5 4 1 15 4 1 1
1010

Copyright © Allyn & Bacon (2007)Copyright © Allyn & Bacon (2007)
Rank-Order CorrelationRank-Order Correlation
rd
N Ns
1
6
1
2
2
rs
16 10
5 5 11
60
1201 50 50
2
( ). .

Copyright © Allyn & Bacon (2007)Copyright © Allyn & Bacon (2007)
The The tt-test-test
For independent samplesFor independent samples
For correlated samplesFor correlated samples
t
X X
SS SSN N N N
1 2
1 2
1 2 1 221 1
t
X X
sN
sN
rs
N
s
N
1 2
12
1
22
2
1
1
2
2
2
Copyright © Allyn & Bacon (2007)Copyright © Allyn & Bacon (2007)
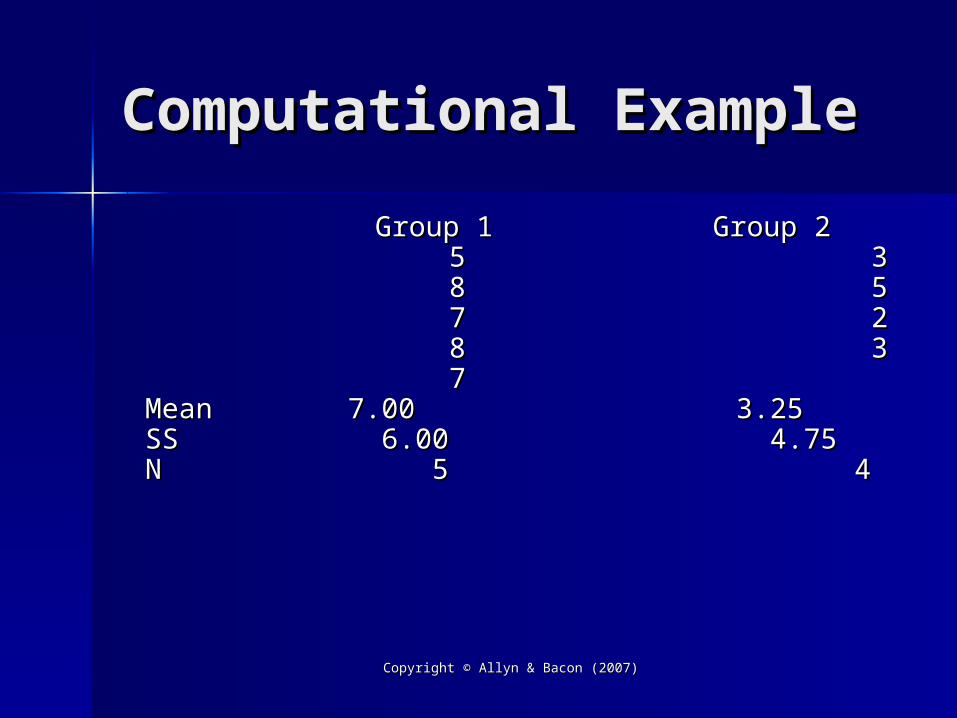
Computational Computational ExampleExample Group 1 Group 2Group 1 Group 2
5 3 5 3 8 5 8 5 7 2 7 2 8 3 8 3 7 7Mean 7.00 3.25Mean 7.00 3.25SS 6.00 4.75SS 6.00 4.75N 5 4 N 5 4

Copyright © Allyn & Bacon (2007)Copyright © Allyn & Bacon (2007)
Independent Samples Independent Samples tt-test-test
t
X X
SS SSN N N N
1 2
1 2
1 2 1 221 1
t
7 00 3 25
6 00 4 755 4 2
15
14
3 75
834 52
. .
. .
.
..
tcrit 2 365. Reject Null Hypothesis

Copyright © Allyn & Bacon (2007)Copyright © Allyn & Bacon (2007)
Computational Computational ExampleExample
Copyright © Allyn & Bacon (2007)Copyright © Allyn & Bacon (2007)
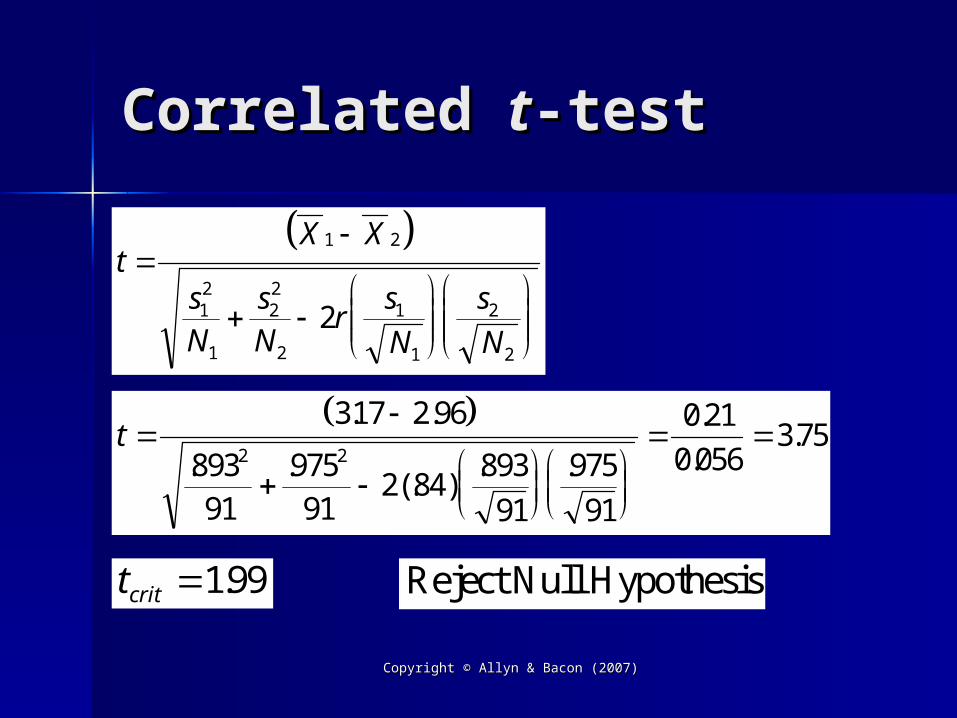
Correlated Correlated tt-test-test
t
X X
sN
sN
rs
N
s
N
1 2
12
1
22
2
1
1
2
2
2
t
317 2 96
89391
97591
2 84893
91
975
91
0 21
0 0563 75
2 2
. .
. .(. )
. .
.
..
tcrit 199. Reject Null Hypothesis
Copyright © Allyn & Bacon (2007)Copyright © Allyn & Bacon (2007)
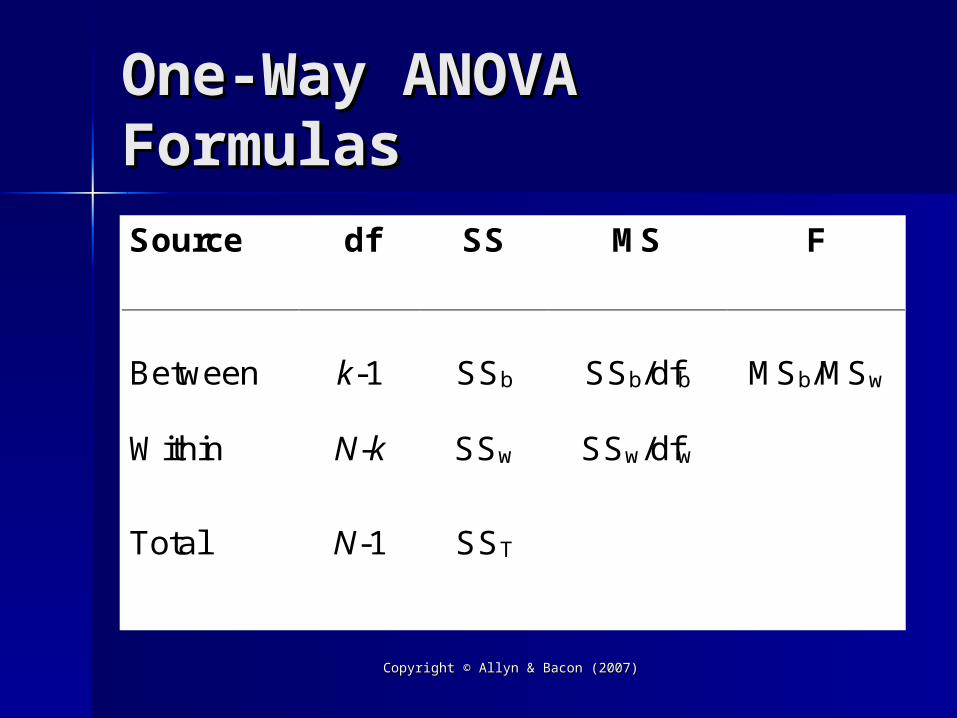
One-Way ANOVA One-Way ANOVA FormulasFormulasSource df SS MS F
Between k-1 SSb SSb/dfb MSb/MSw
Within N-k SSw SSw/dfw
Total N-1 SST
Copyright © Allyn & Bacon (2007)Copyright © Allyn & Bacon (2007)
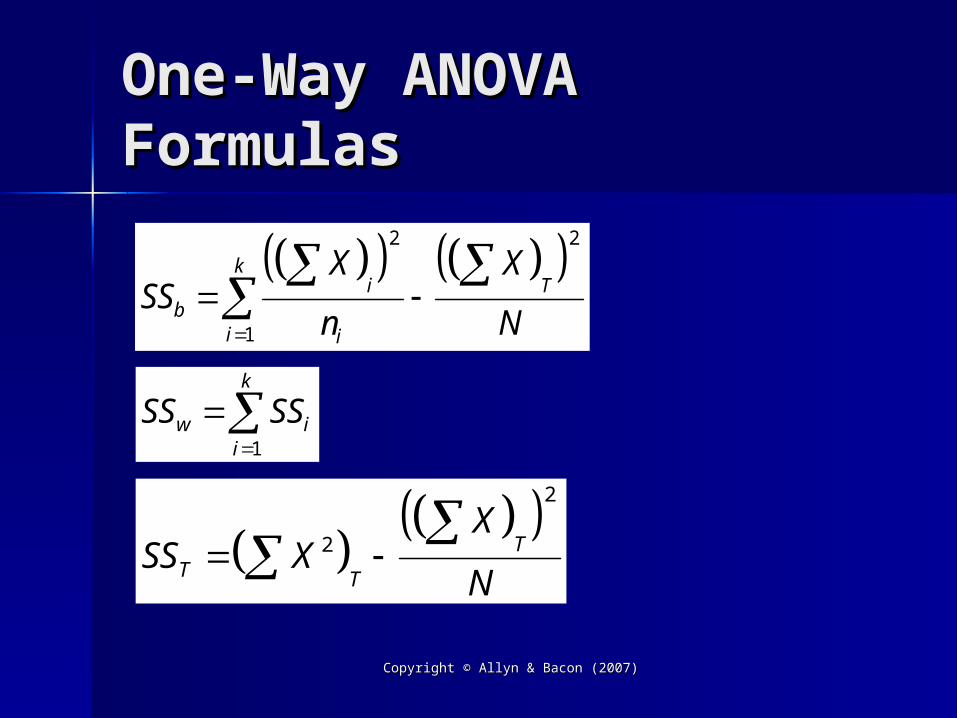
One-Way ANOVA One-Way ANOVA FormulasFormulas
SS
X
n
X
Nbi
ii
kT
2
1
2
SS SSw ii
k
1
SS X
X
NT T
T 2
2
Copyright © Allyn & Bacon (2007)Copyright © Allyn & Bacon (2007)
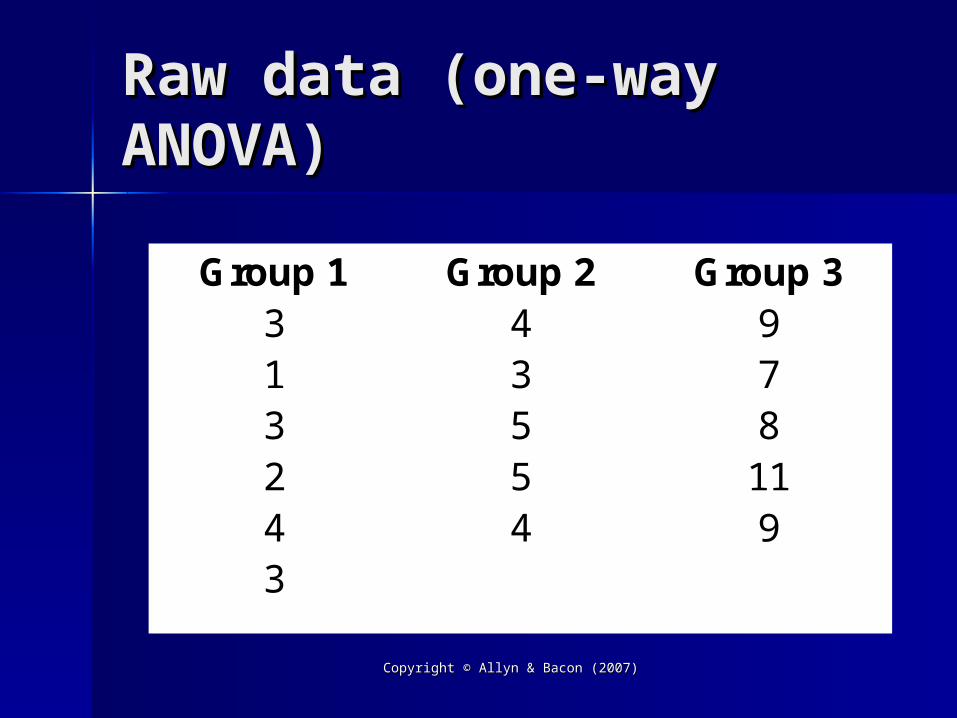
Raw data (one-way Raw data (one-way ANOVA)ANOVA)
Group 1 Group 2 Group 33 4 91 3 73 5 82 5 114 4 93
Copyright © Allyn & Bacon (2007)Copyright © Allyn & Bacon (2007)
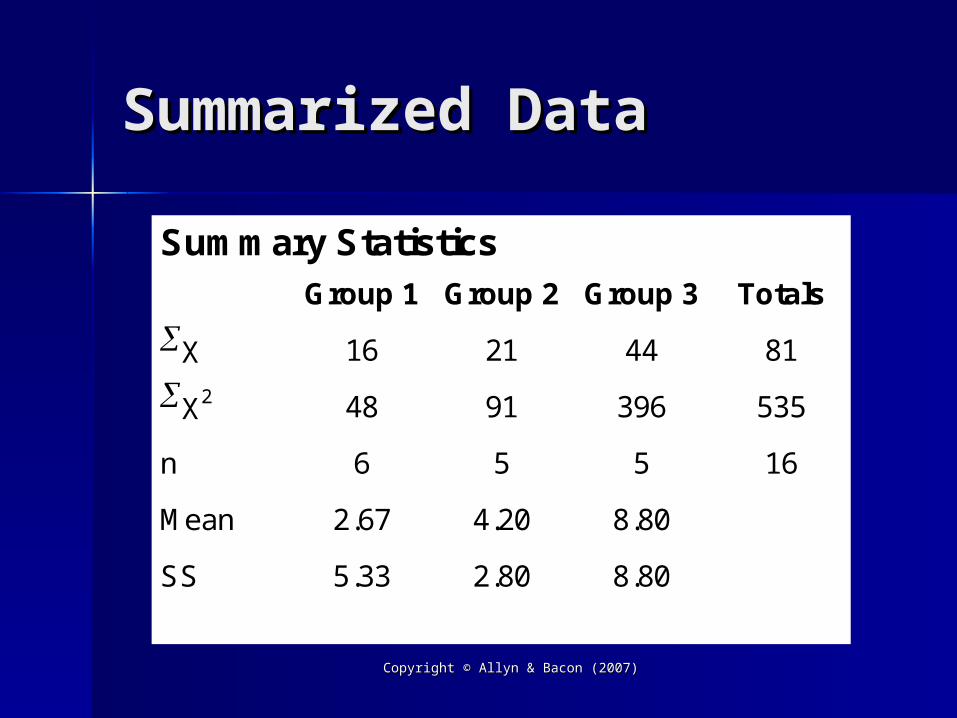
Summarized DataSummarized Data
Summary StatisticsGroup 1 Group 2 Group 3 Totals
X 16 21 44 81
X2 48 91 396 535
n 6 5 5 16
Mean 2.67 4.20 8.80
SS 5.33 2.80 8.80
Copyright © Allyn & Bacon (2007)Copyright © Allyn & Bacon (2007)
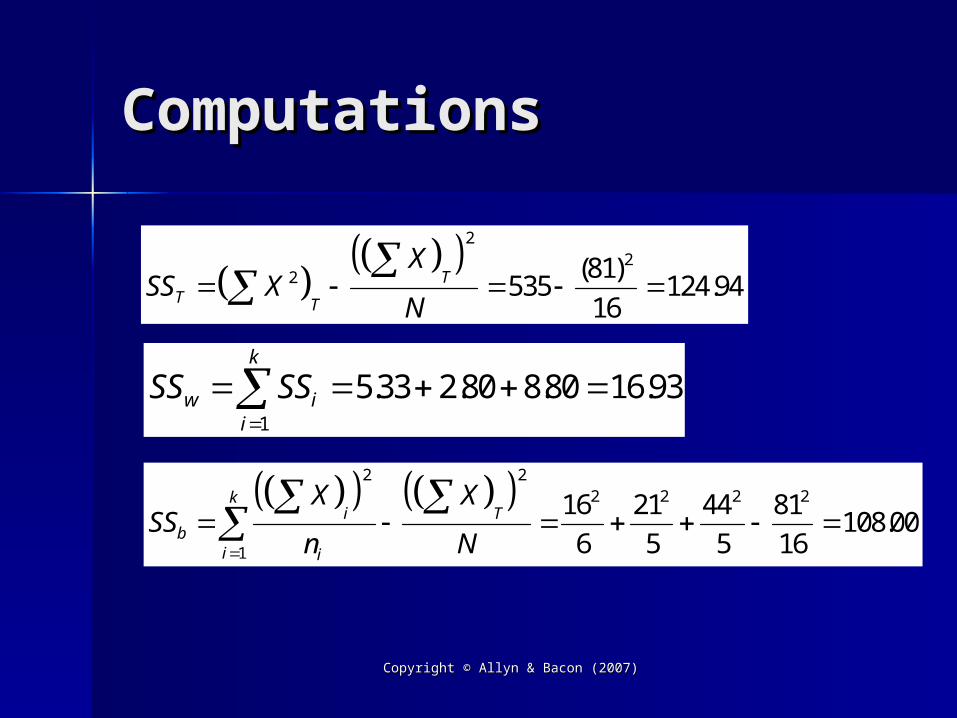
ComputationsComputations
SS X
X
NT T
T 2
22
53516
124 94(81)
.
SS SSw ii
k
1
5 33 2 80 8 80 16 93. . . .
SS
X
n
X
Nbi
ii
kT
2
1
22 2 2 216
6
21
5
44
5
81
16108 00.
Copyright © Allyn & Bacon (2007)Copyright © Allyn & Bacon (2007)
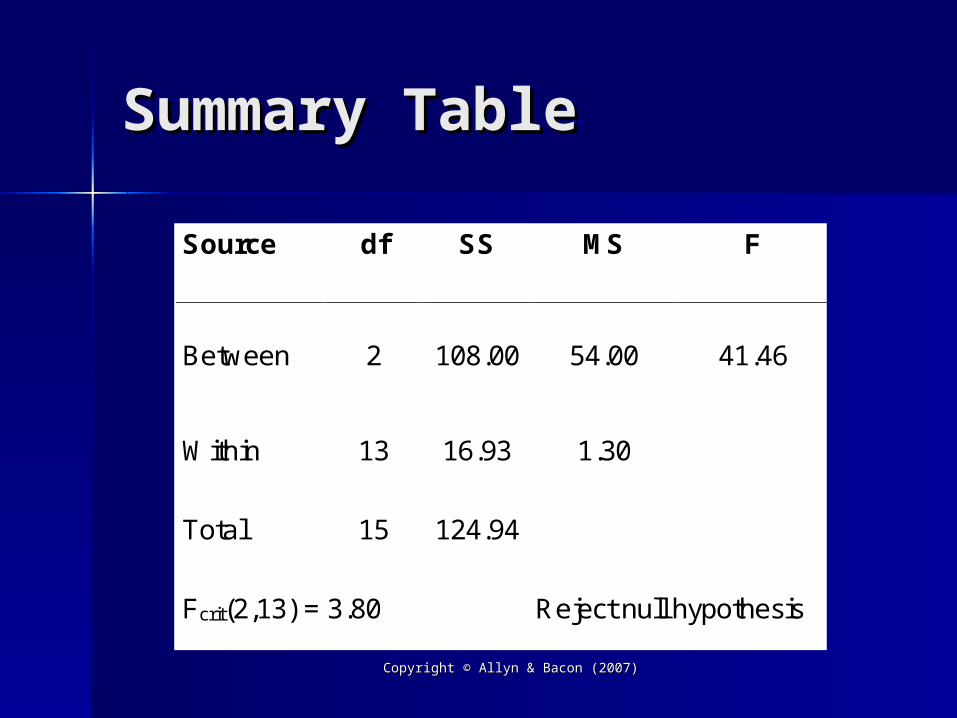
Summary TableSummary Table
Source df SS MS F
Between 2 108.00 54.00 41.46
Within 13 16.93 1.30
Total 15 124.94
Fcrit(2,13) = 3.80 Reject null hypothesis
Copyright © Allyn & Bacon (2007)Copyright © Allyn & Bacon (2007)
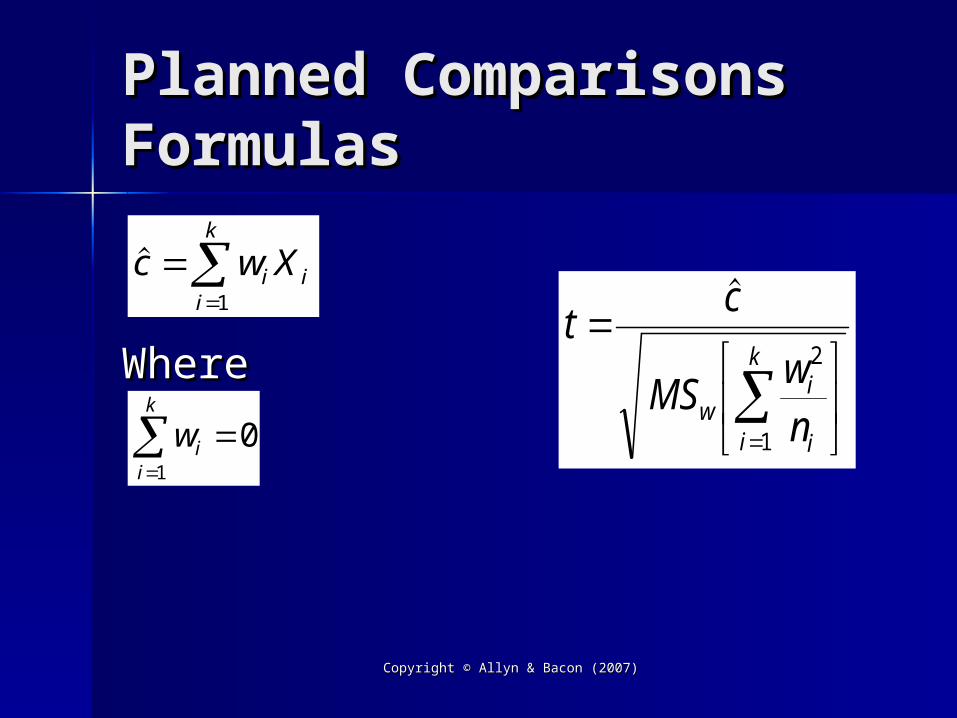
Planned Comparisons Planned Comparisons FormulasFormulas
WhereWhere
c w Xi ii
k
1
wii
k
0
1
tc
MSwnwi
ii
k
2
1

Copyright © Allyn & Bacon (2007)Copyright © Allyn & Bacon (2007)
ComputationsComputations
Compare Group 3 against the average Compare Group 3 against the average of Groups 1 and 2 from the previous of Groups 1 and 2 from the previous ANOVAANOVA
( )( . ) ( )( . ) ( )(8. ) .c w Xi ii
k
1
1 2 67 1 4 20 2 80 10 73
tc
MSwnwi
ii
k
.
.( ) ( ) ( )
.2
1
2 2 2
10 73
13016
15
25
7 07
tcrit 2 160. Reject null hypothesis

Copyright © Allyn & Bacon (2007)Copyright © Allyn & Bacon (2007)
Repeated-Measures Repeated-Measures FormulasFormulas
Source df SS MS F
Subjects n-1 SSs SSs/dfs
Between k-1 SSb SSb/dfb MSb/MSE
Error (n-1)(k-1) SSE SSE/dfE

Copyright © Allyn & Bacon (2007)Copyright © Allyn & Bacon (2007)
Repeated-Measures Repeated-Measures FormulasFormulas
SS
X
k
X
n kS
ijj
k
i
n
ijj
k
i
n
1
2
1 11
2
SS
X
n
X
n kb
iji
n
j
k
ijj
k
i
n
1
2
1 11
2
SS X
X
n kSS SSE ij
j
k
i
n ijj
k
i
n
S b
2
11
11
2
Copyright © Allyn & Bacon (2007)Copyright © Allyn & Bacon (2007)
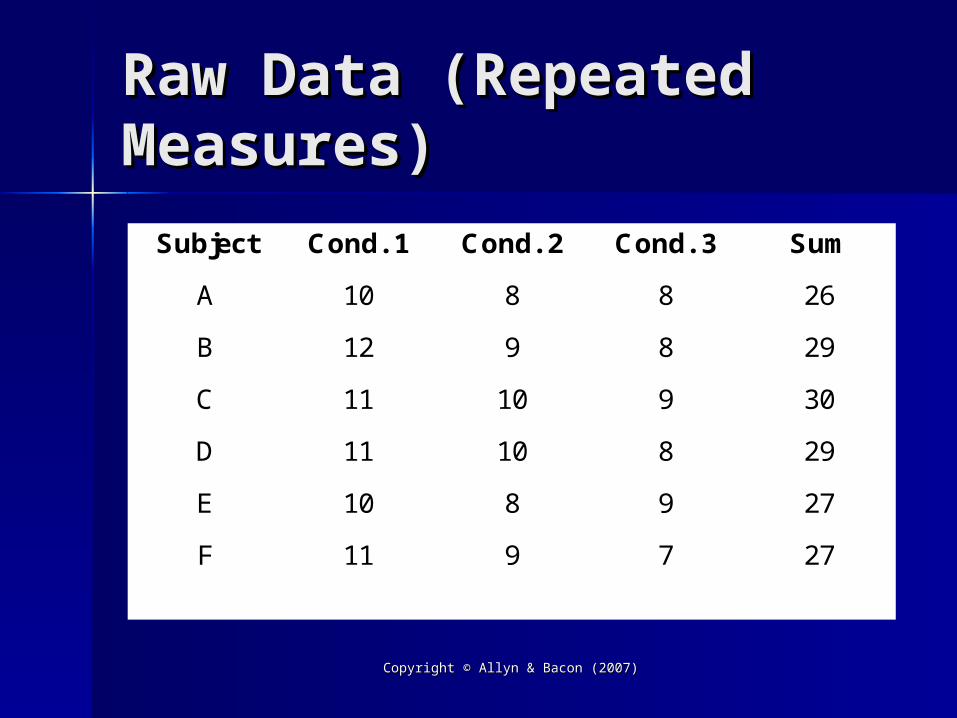
Raw Data (Repeated Raw Data (Repeated Measures)Measures)
Subject Cond. 1 Cond. 2 Cond. 3 Sum
A 10 8 8 26
B 12 9 8 29
C 11 10 9 30
D 11 10 8 29
E 10 8 9 27
F 11 9 7 27
Copyright © Allyn & Bacon (2007)Copyright © Allyn & Bacon (2007)
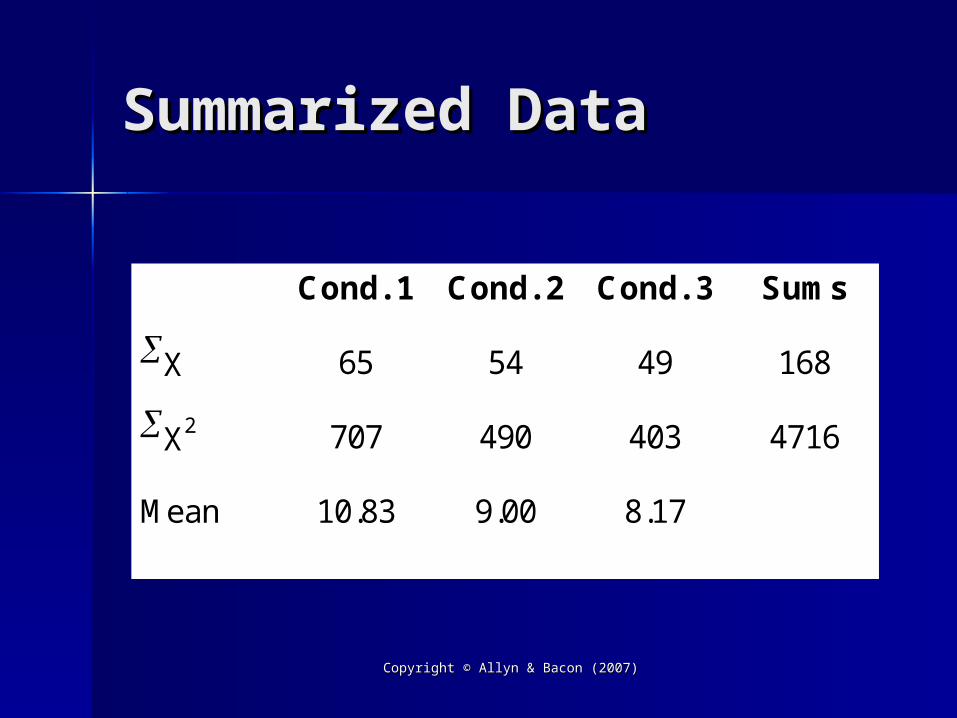
Summarized DataSummarized Data
Cond. 1 Cond. 2 Cond. 3 Sums
X 65 54 49 168
X2 707 490 403 4716
Mean 10.83 9.00 8.17

Copyright © Allyn & Bacon (2007)Copyright © Allyn & Bacon (2007)
ComputationsComputations
SSS
26 29 30 29 27 27
3
168
6 34 00
2 2 2 2 2 2 2
.
SSb
65 54 30
6
168
6 322 33
2 2 2 2
.
SSE ( ) . . .707 490 403
168
6 34 00 22 33 5 67
2
Copyright © Allyn & Bacon (2007)Copyright © Allyn & Bacon (2007)
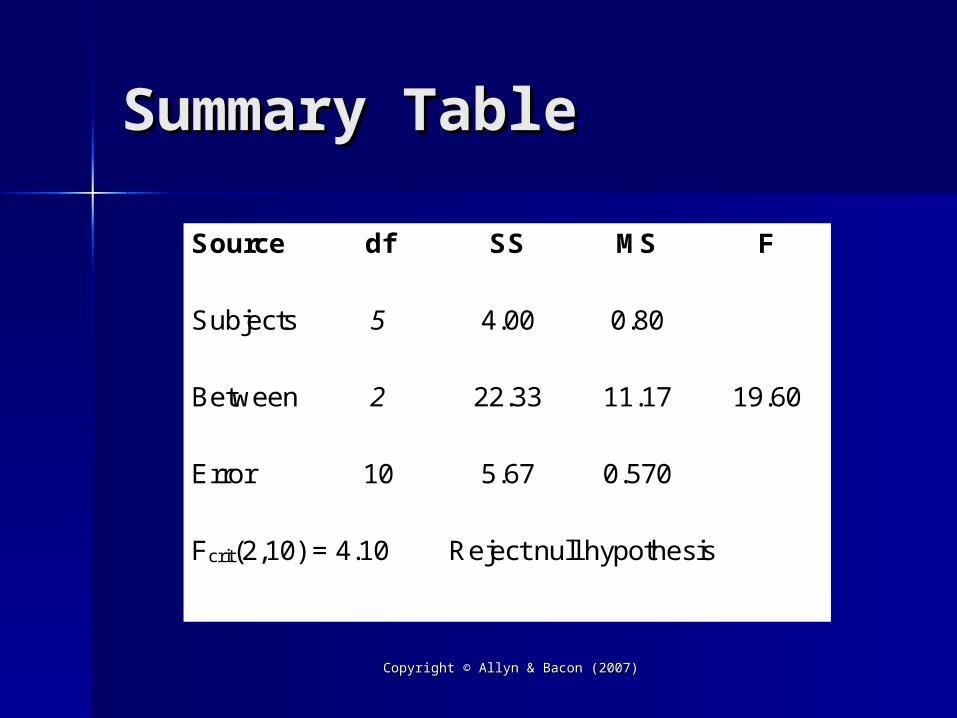
Summary TableSummary Table
Source df SS MS F
Subjects 5 4.00 0.80
Between 2 22.33 11.17 19.60
Error 10 5.67 0.570
Fcrit(2,10) = 4.10 Reject null hypothesis

Copyright © Allyn & Bacon (2007)Copyright © Allyn & Bacon (2007)
Two-Way ANOVA Two-Way ANOVA FormulasFormulas
SS
X
n
X
NA
ijj
b
ijj
bi
aT
1
2
1
1
2 SS
X
n
X
NB
iji
a
iji
aj
bT
1
2
1
1
2
SS
X
n
X
n
X
n
X
NAB
ij
ijj
b
i
a ijj
b
ijj
bi
a iji
a
iji
aj
bT
2
11
1
2
1
1
1
2
1
1
2
SS SSw ijj
b
i
a
11

Copyright © Allyn & Bacon (2007)Copyright © Allyn & Bacon (2007)
Two-Way ANOVA Two-Way ANOVA FormulasFormulasSource df SS MS F
A a-1 SSA SSA/dfA MSA/MSw
B b-1 SSB SSB/dfB MSB/MSw
AB (a-1)(b-1) SSAB SSAB/dfAB MSAB/MSw
Within N-ab SSw SSw/dfw
Total N-1 SST

Copyright © Allyn & Bacon (2007)Copyright © Allyn & Bacon (2007)
Raw DataRaw Data
B1 B2 B3
A1 A2 A3 A1 A2 A3 A1 A2 A3
10 7 11 1 6 4 3 2 58 4 9 2 7 3 2 1 67 3 10 1 6 6 3 2 49 2 9 4 5 4 3 3 56 1 2 3 4 5

Copyright © Allyn & Bacon (2007)Copyright © Allyn & Bacon (2007)
Summarized Data Summarized Data (1/4)(1/4)
A Level Terms B1 B2 B3 Totals
X 40 16 50 106
A1X2 330 78 504 912
n 5 4 5 14
SS 10 14 4
(X)2/n 320 64 500 802.57
Mean 8 4 10 7.57

Copyright © Allyn & Bacon (2007)Copyright © Allyn & Bacon (2007)
Summarized Data Summarized Data (2/4)(2/4)
A Level Terms B1 B2 B3 Totals
X 10 24 20 54
A2X2 26 146 86 258
n 5 4 5 14
SS 6 2 6
(X)2/n 20 144 80 208.29
Mean 2 6 4 3.86
Copyright © Allyn & Bacon (2007)Copyright © Allyn & Bacon (2007)
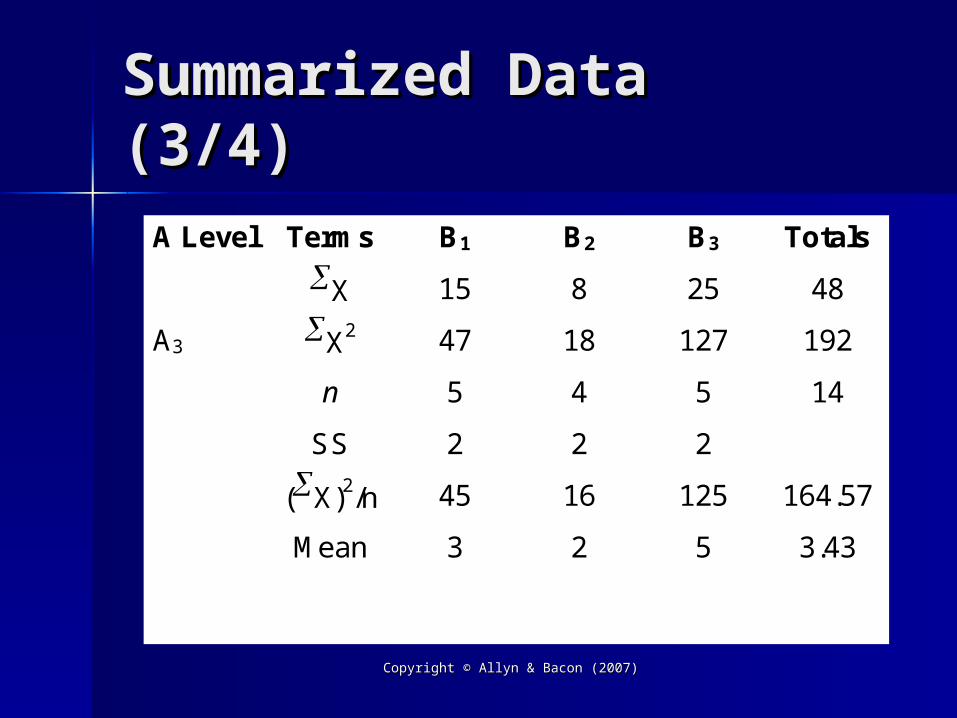
Summarized Data Summarized Data (3/4)(3/4)
A Level Terms B1 B2 B3 Totals
X 15 8 25 48
A3X2 47 18 127 192
n 5 4 5 14
SS 2 2 2
(X)2/n 45 16 125 164.57
Mean 3 2 5 3.43

Copyright © Allyn & Bacon (2007)Copyright © Allyn & Bacon (2007)
Summarized Data Summarized Data (4/4)(4/4)
A Level Terms B1 B2 B3 Totals
X 65 48 95 208
Totals X2 403 242 717 1362
n 15 12 15 42
SS
(X)2/n 281.67 192.00 601.67 1030.10
Mean 4.33 4.00 6.33 4.95

Copyright © Allyn & Bacon (2007)Copyright © Allyn & Bacon (2007)
Computations (two-Computations (two-way) 1/3way) 1/3
SS
X
n
X
NA
ijj
b
ijj
bi
aT
1
2
1
1
2
802 57 208 29 164 57 103010 45 24[ . . . ] . .
SS
X
n
X
NB
iji
a
iji
aj
bT
1
2
1
1
2
28167 192 00 60167 103010 14533[ . . . ] . .

Copyright © Allyn & Bacon (2007)Copyright © Allyn & Bacon (2007)
Computations (two-Computations (two-way) 2/3way) 2/3
SS
X
n
X
n
X
n
X
NAB
ij
ijj
b
i
a ijj
b
ijj
bi
a iji
a
iji
aj
bT
2
11
1
2
1
1
1
2
1
1
2
SSAB [ ]320 64 500 20 144 80 45 16 125
[ . . . ] [ . . . ] [ . ]28167 192 00 60167 802 57 208 29 164 57 103010
SSAB 9333.

Copyright © Allyn & Bacon (2007)Copyright © Allyn & Bacon (2007)
Computations (two-Computations (two-way) 3/3way) 3/3
SS SSw ijj
b
i
a
11
10 14 4 6 2 6 2 2 2 48 00.
SS X
X
NT TT
2
22
1362208
4233190.

Copyright © Allyn & Bacon (2007)Copyright © Allyn & Bacon (2007)
Summary TableSummary Table
Source df SS MS F
A 2 145.33 72.67 49.96
B 2 45.24 22.62 15.55
AB 4 93.33 23.33 16.04
Within 33 48.00 1.45
Total 41 331.90
Fcrit(2, 33) = 3.29 Fcrit(4, 33) = 2.66

Copyright © Allyn & Bacon (2007)Copyright © Allyn & Bacon (2007)
Chi-Square FormulasChi-Square Formulas
Use same formula for bothUse same formula for both– Chi-square goodness-of-fit testChi-square goodness-of-fit test– Chi-square test-for-independenceChi-square test-for-independence
Only difference is how expected cell Only difference is how expected cell frequencies are computedfrequencies are computed
2
2
1
O E
Ei i
ii
k
Copyright © Allyn & Bacon (2007)Copyright © Allyn & Bacon (2007)
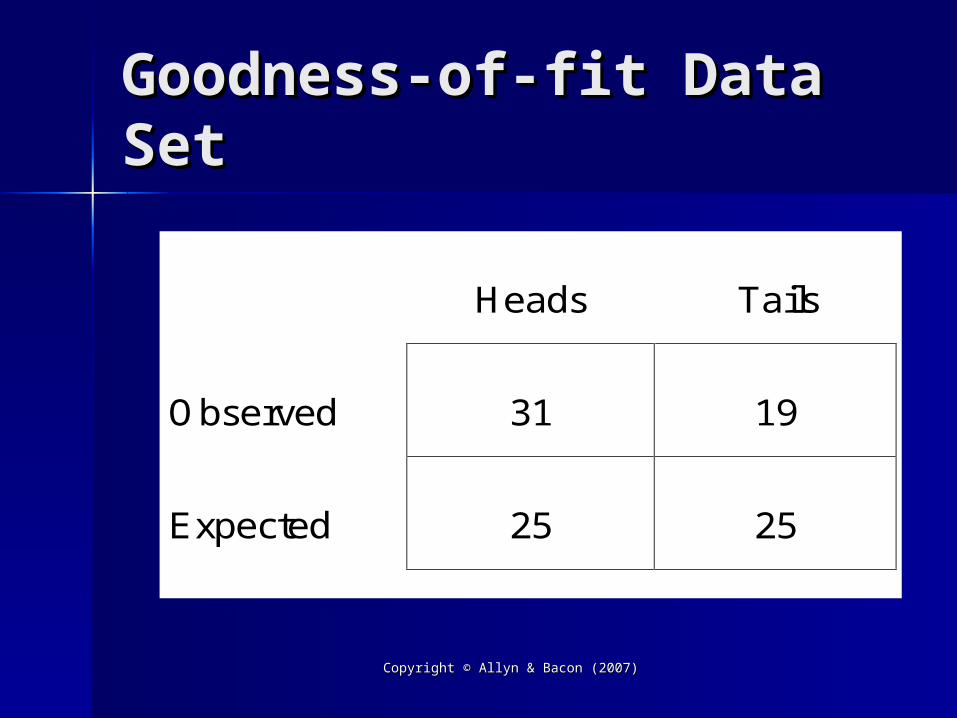
Goodness-of-fit Data Goodness-of-fit Data SetSet
Heads Tails
Observed 31 19
Expected 25 25
Copyright © Allyn & Bacon (2007)Copyright © Allyn & Bacon (2007)
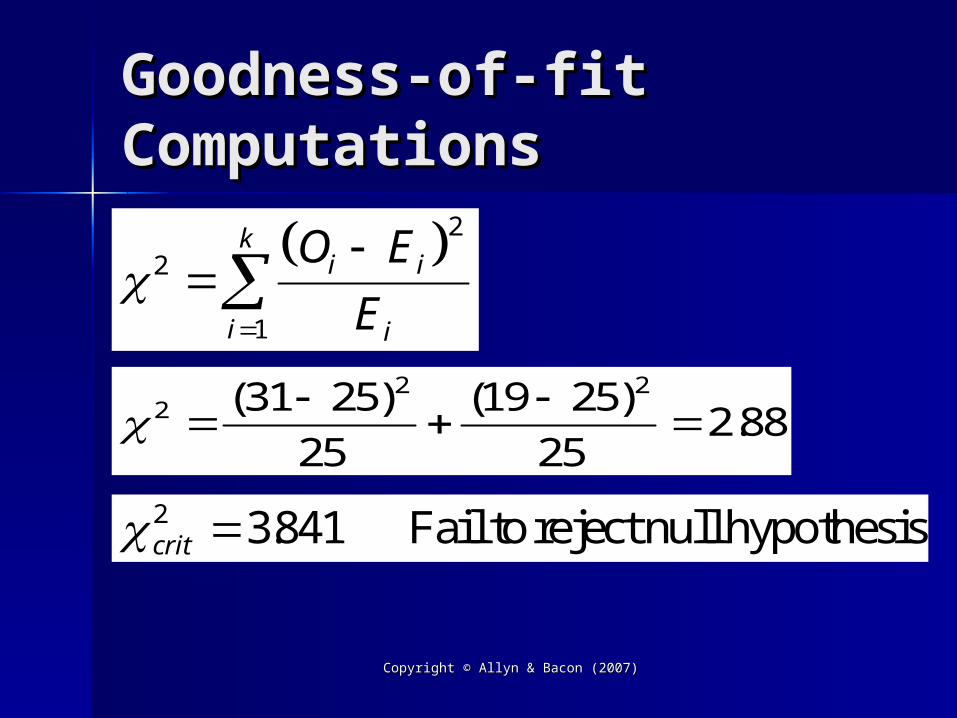
Goodness-of-fit Goodness-of-fit ComputationsComputations
2
2
1
O E
Ei i
ii
k
22 231 25
25
19 25
252 88
( ) ( ).
crit2 3841 . Fail to reject null hypothesis
Copyright © Allyn & Bacon (2007)Copyright © Allyn & Bacon (2007)
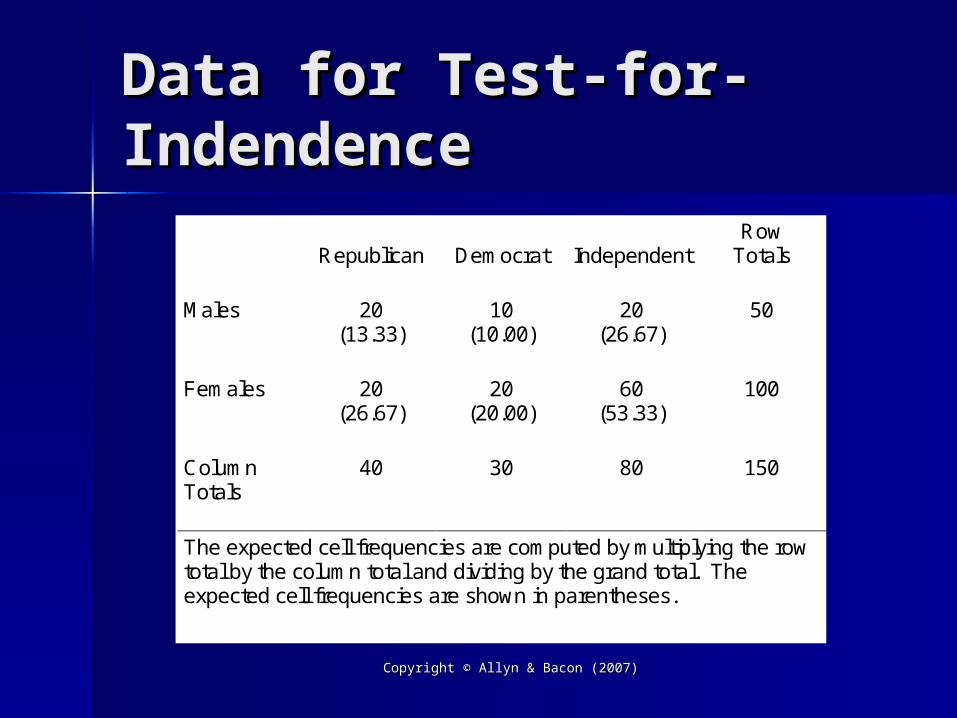
Data for Test-for-Data for Test-for-IndendenceIndendence
Republican Democrat IndependentRow
Totals
Males 20(13.33)
10(10.00)
20(26.67)
50
Females 20(26.67)
20(20.00)
60(53.33)
100
ColumnTotals
40 30 80 150
The expected cell frequencies are computed by multiplying the rowtotal by the column total and dividing by the grand total. Theexpected cell frequencies are shown in parentheses.
Copyright © Allyn & Bacon (2007)Copyright © Allyn & Bacon (2007)
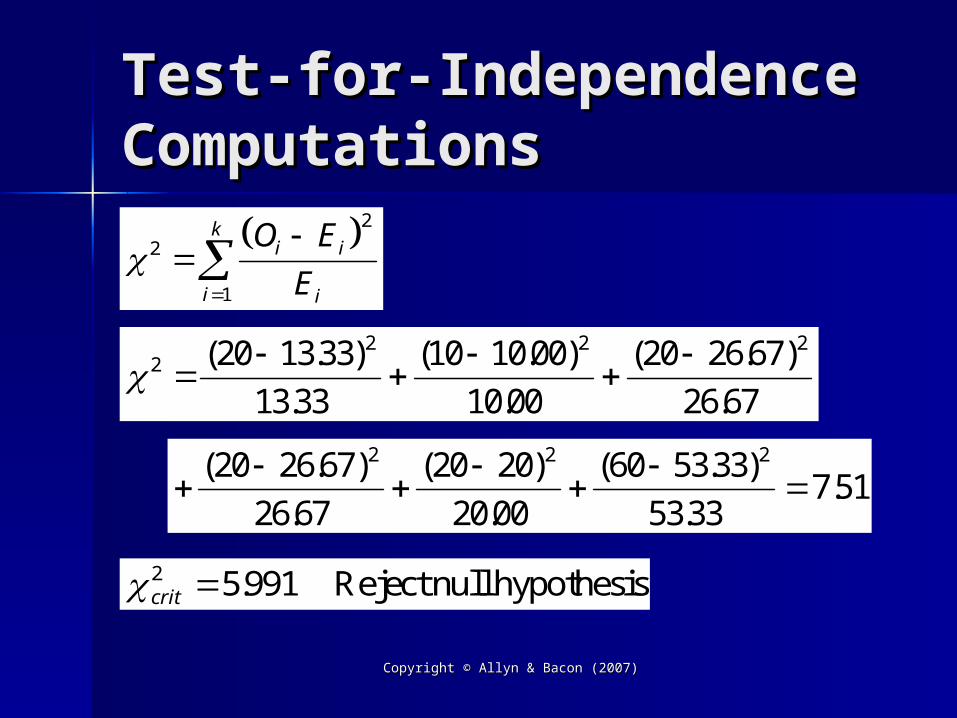
Test-for-Independence Test-for-Independence ComputationsComputations
2
2
1
O E
Ei i
ii
k
22 2 220 13 33
13 33
10 10 00
10 00
20 26 67
26 67
( . )
.
( . )
.
( . )
.
( . )
.
( )
.
( . )
..
20 26 67
26 67
20 20
20 00
60 53 33
53 337 51
2 2 2
crit2 5991 . Reject null hypothesis

Copyright © Allyn & Bacon (2007)Copyright © Allyn & Bacon (2007)
SummarySummary
The Student Resource Website The Student Resource Website illustrates how to compute each of illustrates how to compute each of these statistical procedures and these statistical procedures and also includes the statistical tables also includes the statistical tables needed to interpret the resultsneeded to interpret the results
The website also shows how to do The website also shows how to do the same computations using the same computations using SPSS for WindowsSPSS for Windows