Copyright © 2017. All Rights Reserved | · 2019-06-26 · Traders like Jesse Livermore, Nicholas...
20
Copyright © 2017. All Rights Reserved | www.LearnCFDs.com
Transcript of Copyright © 2017. All Rights Reserved | · 2019-06-26 · Traders like Jesse Livermore, Nicholas...
Copyright © 2017. All Rights Reserved | www.LearnCFDs.com
2017 © www.LearnCFDs.com
All Rights Reserved.
Feel free to share this concept with your friends, family or
trading buddies, but please do not alter any of the contents.
Thanks and enjoy.
LearnCFDs.com
Connect with us Here…
Blog: www.learncfds.com/news
YouTube: http://www.youtube.com/user/learncfds
Twitter: https://twitter.com/learncfds
Facebook: http://www.facebook.com/LearnCFDs
Please note:
There are affiliate links in this document. All the material provided on the LearnCFDs website is free
of charge. A lot of time and effort has gone in to creating the content, the videos, the eBooks, the
webinars and guides.
One way for us to continue to be able to provide this material free of charge is to run affiliate links
via our guides and on the website.
So, to show your support, feel free to click on the links and if the product fits in with what you are
looking to use, then we’d be grateful if you used our affiliate link.
We will only recommend products that we have personally tested or we know the people behind the
products personally.

Copyright © 2017. All Rights Reserved | www.LearnCFDs.com
Welcome and thanks for taking the time to download this free report. Let’s get right into it.
Why are entry techniques important? Nothing feels better than getting a trade started in the right direction. You follow your rules, you
take action and commit to the trade, and then it moves directly in your favour.
You feel confident at this point but you don’t get ahead of yourself.
Your goal with entries is to get to a point where you execute your trade into the market without
procrastinating. You just take the next trade.
No sweating bullets.
No fear.
No stomach turning.
You just execute the trade into the market.
Have you ever procrastinated on your entry? One of the limiting factors of most break-even traders is procrastinating on entering a trade.
One of the reasons for this is the fear of losing on the trade.
Your goal initially is to make sure you build the confidence in your entry technique to make sure
you're not procrastinating on the trade and you're taking every available trade that comes your way.
The only way to get a result in trading is to take a trade.
The safe position is to not take the trade as you cannot lose. But how can you win? Impossible,
right?
You must take a trade to have the potential for profit. It is that simple.
That is why entry techniques are so important as they get you off in the right foot. They build your
confidence and allow you to get into the market swiftly and efficiently.
Your goal as a trader is to locate dozens of low-risk, high-probability trading ideas.
You should be constantly looking at different ways to enter the market across the different market
types that we're going to be talking about in this short guide.
Clearly, nothing feels better than getting an entry right and watching it move past break-even
immediately.
Effortless trading Some of the best say trading should be effortless.
What does it mean when they say ‘trading should be effortless?’

Copyright © 2017. All Rights Reserved | www.LearnCFDs.com
Have a look at some of your best trades over the last 12 months.
Did you find:
The trade just seemed to ‘flow’?
You never had to ‘fight’ the trade?
Your stomach wasn’t flipping around as you entered the position?
You never had to aggressively manage the trade through the full move?
The trade just felt right from the get-go?
The beauty of getting your entry techniques right is it allows you to build confidence and get the
trade right and get things in line with how the market is currently trading.
Another great part of entry techniques and finding an entry technique that's working well is the
ability to move your stop to breakeven.
Being able to move your stop loss to break-even is one of the most satisfying aspects of a rock-solid
entry technique.
Identifying the top entry strategies for each market type Our goal in this guide is to identify the top entry strategies that you need to consider for the various
market types.
The biggest challenge for break-even traders One of the biggest challenges with break-even traders is they only have one system of trading the
markets.
Markets don't just follow one set of rules.
Instead, markets are:
Sporadic
Erratic
Driven by fear and greed
Unpredictable
Unfortunately, most break-even traders have one trading system they apply across all market types.
3 main market types in Stocks, Indices, Forex & Commodities The whole goal of this guide is to get you focused on the fact there are three main market types to
be aware of.
Unfortunately, break-even traders build one trading strategy and try to fit it across all market types.
Let's look at the three main market types that are available.
1. Trending markets
2. Range bound markets
3. Volatile Breakout markets

Copyright © 2017. All Rights Reserved | www.LearnCFDs.com
As you can appreciate, one trading system cannot possible make money across all market types. It
just is not realistic and does not happen.
Ignore those system developers who believe they have one system that works in all market
conditions.
Have you ever traded a system that hit a purple patch (a period of successful trades) and then just
went out of favour?
I remember in one of the biggest trading competitions in Australia, the winner made 6 figures over
just 9 weeks. What most people didn’t hear is he went on to give back significant chunks of profit
over the next few weeks.
Trading systems go in and out of favour because they are usually focused on one of the three market
types mentioned above.
Let’s break down each of the market types in more detail now.
Trending markets A trending market can be recognised by higher highs and higher lows.
Markets tend to trend 20% to 30% of the time, so trending markets are few and far between. But
once markets get on a trend they tend to stay in a trend until they are knocked out of the trend.
Trending markets often take quite some time to turn around.
A great analogy that has been used time and time again by many traders is thinking of the big oil
tanker that weighs hundreds of thousands of tonnes.
If it's going in the ocean and it's trending in one direction, it can't just do a U-turn like you might be
able to on a pushbike.

Copyright © 2017. All Rights Reserved | www.LearnCFDs.com
It will take kilometres and a lot of time to turn it around, maybe to the tune of 30 minutes just to
slow it down enough to start turning around.
Meanwhile, it's travelled many, many kilometres in the one trend and is still going in that direction.
The great thing about trending markets is it requires a least amount of work.
Even though markets only trend 20% to 30% of the time, once you're on a trend, you don't have to
do much.
The whole idea is you sit there and wait for the trend to unfold whilst your capital is on that trade.
Traders like Jesse Livermore, Nicholas Darvas and The Turtle Traders (Curtis Faith and others) loved
holding on to strong trending moves.
The turtles are renowned for trading trending markets, suggesting they made the most amount of
money by sitting and waiting on a tray.
Not by actively trading, but by sitting and waiting on an open trending trade.
A trending market enables you to sit and wait for the profits to unravel.
The beauty with trending markets (and all these three market types discussed here) is all three can
be applied over any timeframe.
If you're an intra-day trader, you can find a five-minute chart which is trending.
Likewise, if you're an end-of-day trader, there are plenty of daily charts that are trending as well.
Also, if you trade commodities, indices, or foreign exchange (Forex), there are plenty of trends to be
had across those markets.
Many of the market wizards (those interviewed in the Market Wizards series of books by Jack
Schwager) do suggest that the commodity markets are the fairest markets.

Copyright © 2017. All Rights Reserved | www.LearnCFDs.com
Here is a picture of me and Jack Schwager when he was in Australia.
I even had the opportunity to introduce him to the stage.
When they start trending, they tend to trend for a long, long time. This is one of the reasons why the
turtles made such consistent profits over such a long period.
Range bound markets A range-bound market is quite easy to identify because it seems to be stuck in a range.
It bounces around between support and resistance.
A good way to think of it is just putting a bouncy ball in a room and it bounces off the floor and hits
the ceiling. Bounces off the floor, hits the ceiling and it can't seem to break out.
Copyright © 2017. All Rights Reserved | www.LearnCFDs.com
Markets tend to range about 60% to 70% of the time.
When people first start trading the markets, they love the idea of trending markets.
One of the challenges with a trend-based trading systems is that you're often correct only 30% of the
time.
However, your wins are much larger than your losses.
What tends to happen is people get very disheartened, and psychologically, a trend-based system is
very difficult to trade.
If you've created a trend following system, then you'll be well advised to build a range-bound system
as well to take advantage of the 60% to 70% of the time that your markets are actually ranging.
Excellent risk-reward opportunities One of the great things about a range-bound market is the excellent risk reward opportunities that
each trade presents. Normally, you go long when your trade hits support, which means if the trade is
not going to work out, you will know quickly.
In range bound entry setups, your stop losses are a lot tighter than they are with a trending market.
Therefore, you have a good chance of high risk-reward trade.
In a trending market, you might look for trades that are three times the size of the average loss that
you take.
Whereas in a range-bound market, you might consistently look for trades at a one to two times the
risk that you take on and trade them accordingly.
Another great benefit of range-bound markets is your win percentage will be higher than trend
following.
Psychologically, range-bound systems are a lot easier to trade than trend following systems because
you have a higher win percentage.
You don't feel like you're getting beat up as much as you do with a trend following system.
Volatile breakout market Let's look at the third type of market and that is a volatile breakout style market.
These types of markets occur the least frequently, but they do result in short, sharp moves
providing a great chance for profit.
Often, a volatile market will be a breakout and the way the breakouts work is they may have broken
a support or a resistance and then move very quickly in your favour.
The duration of a breakout trade is often very short. If you trade daily charts, the move can be over
in 2-5 days. No matter your time frame, the move generally exhausts itself after 2-5 periods.
Copyright © 2017. All Rights Reserved | www.LearnCFDs.com
Blue-sky territory A great characteristic of a volatile market is a term known as blue-sky territory.
This is one of the greatest trades for people who are trading volatile markets to trade.
Often, you get markets that have been consolidating for some time and they're about to hit a new
200-period high. That is known as blue-sky territory.
So for an end-of-day trader, a new 12-month high would be an example of blue-sky territory.
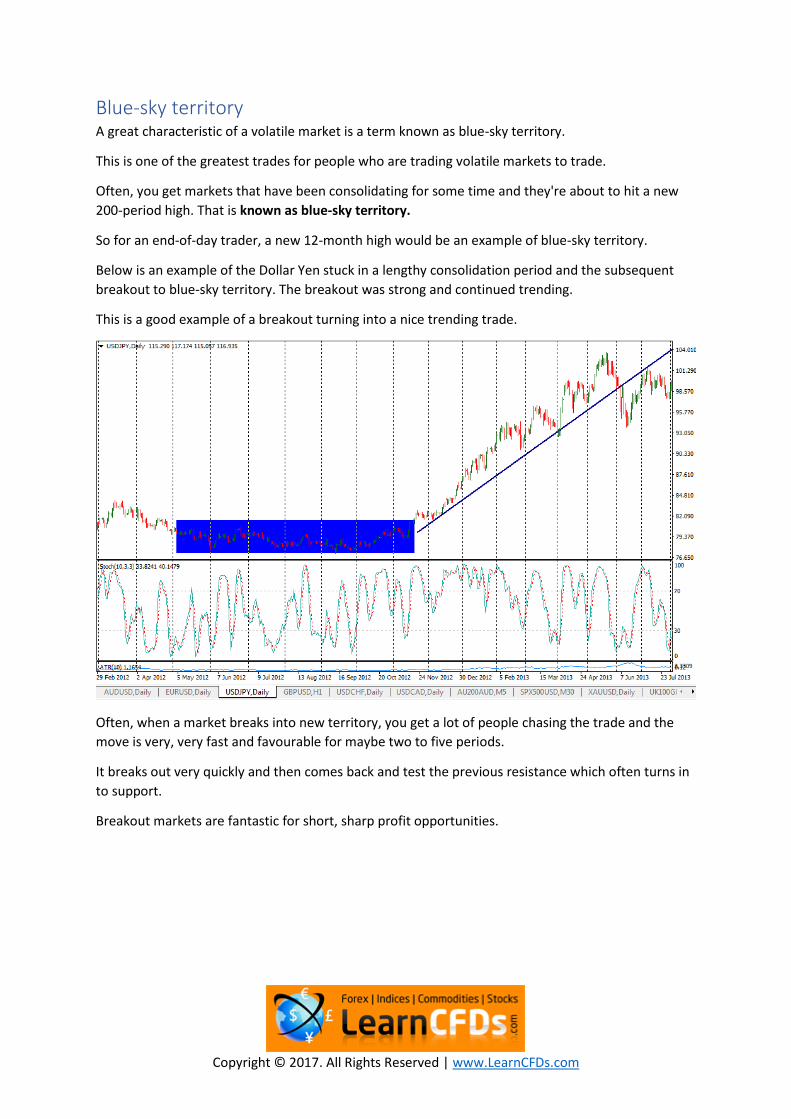
Below is an example of the Dollar Yen stuck in a lengthy consolidation period and the subsequent
breakout to blue-sky territory. The breakout was strong and continued trending.
This is a good example of a breakout turning into a nice trending trade.
Often, when a market breaks into new territory, you get a lot of people chasing the trade and the
move is very, very fast and favourable for maybe two to five periods.
It breaks out very quickly and then comes back and test the previous resistance which often turns in
to support.
Breakout markets are fantastic for short, sharp profit opportunities.

Copyright © 2017. All Rights Reserved | www.LearnCFDs.com
What indicators are best for each market type? Now we’ve uncovered the three main market types, let’s take a closer look at what indicators work
best for each market type.
Ideal indicators to use in a trending market In a trending market, the type of indicators that work best are your simple moving averages.
Trending markets are constantly hitting new highs, so you want a strategy that's very slow moving
and isn't getting you in and out all the time.
Moving averages are lagging indicators and so give you the opportunity to trade a trend in a simple
and efficient fashion.
A moving average strategy for a trending market might be as simple moving average crossover such
as a five-period moving average crossing over 20 period moving average.
Here is an example of an end-of-day chart of Fortescue Metals (ASX:FMG) with a 5 and 20 period
simple moving average crossover.
Chart courtesy of Metastock.
Here is an example of an 4-hour chart of the Aussie 200 Index with a 5 and 20 period simple moving
average crossover.

Copyright © 2017. All Rights Reserved | www.LearnCFDs.com
Or if you are in a shorter timeframe, it might be a three-period moving average crossing over the
eight period moving average. These are styles of moving average crossovers which are ideal for
trending markets.
Below you can see an hourly chart of the Euro Dollar in a downtrend using a 3 and 8 period simple
moving average crossover.
Copyright © 2017. All Rights Reserved | www.LearnCFDs.com
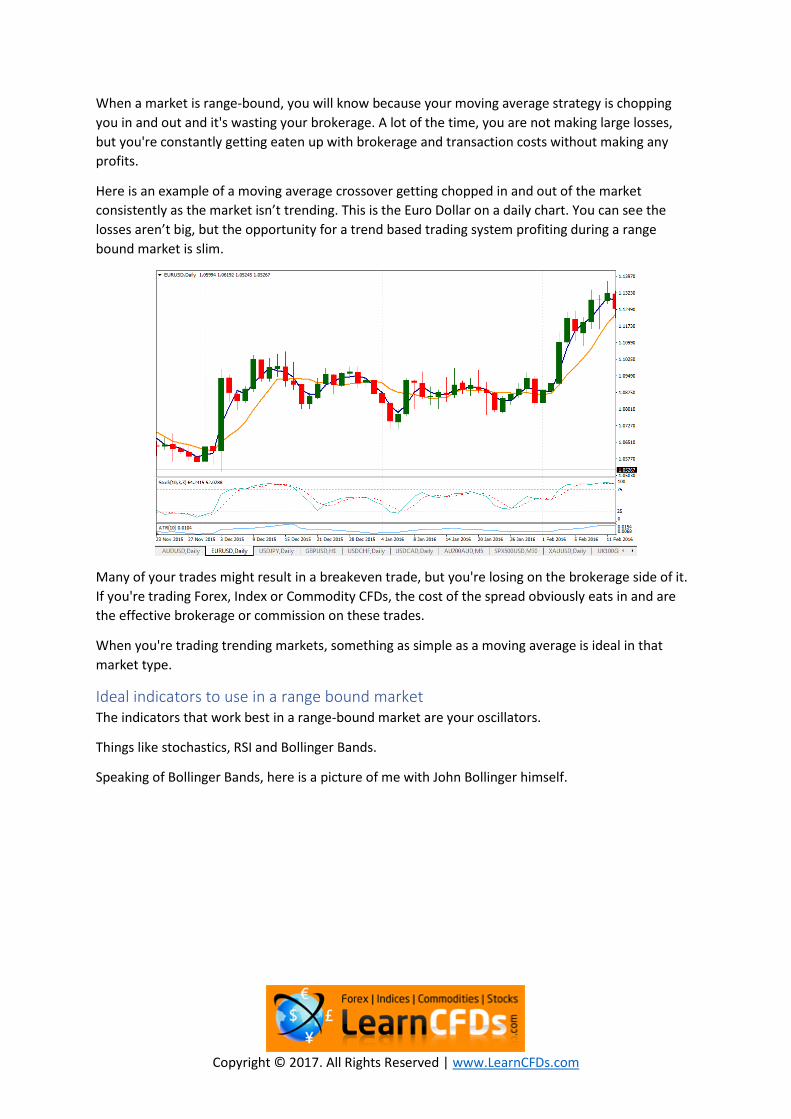
When a market is range-bound, you will know because your moving average strategy is chopping
you in and out and it's wasting your brokerage. A lot of the time, you are not making large losses,
but you're constantly getting eaten up with brokerage and transaction costs without making any
profits.
Here is an example of a moving average crossover getting chopped in and out of the market
consistently as the market isn’t trending. This is the Euro Dollar on a daily chart. You can see the
losses aren’t big, but the opportunity for a trend based trading system profiting during a range
bound market is slim.
Many of your trades might result in a breakeven trade, but you're losing on the brokerage side of it.
If you're trading Forex, Index or Commodity CFDs, the cost of the spread obviously eats in and are
the effective brokerage or commission on these trades.
When you're trading trending markets, something as simple as a moving average is ideal in that
market type.
Ideal indicators to use in a range bound market The indicators that work best in a range-bound market are your oscillators.
Things like stochastics, RSI and Bollinger Bands.
Speaking of Bollinger Bands, here is a picture of me with John Bollinger himself.

Copyright © 2017. All Rights Reserved | www.LearnCFDs.com
If you are starting to think I must get around hassling the big celebrities for photos, then you could
be on the right track ;-) haha.
Oscillators oscillate between overbought and oversold.
The stochastics and the RSI are by far the most popular indicators used for range-bound trading
systems.
Something like a stochastic is looking at where is today's close in relation to the high and the low
over the last X number of periods such as 10 periods, with most standard stochastic formulas.
My preference is the stochastic indicator.
When you're looking at overbought and oversold, it's very straightforward.
When the market is getting sold off and heading towards support, it will have a reading of oversold
on the stochastic indicator. This would provide the opportunity for a buy signal, and you will get an
indication because the stochastic is showing a reading under 20.
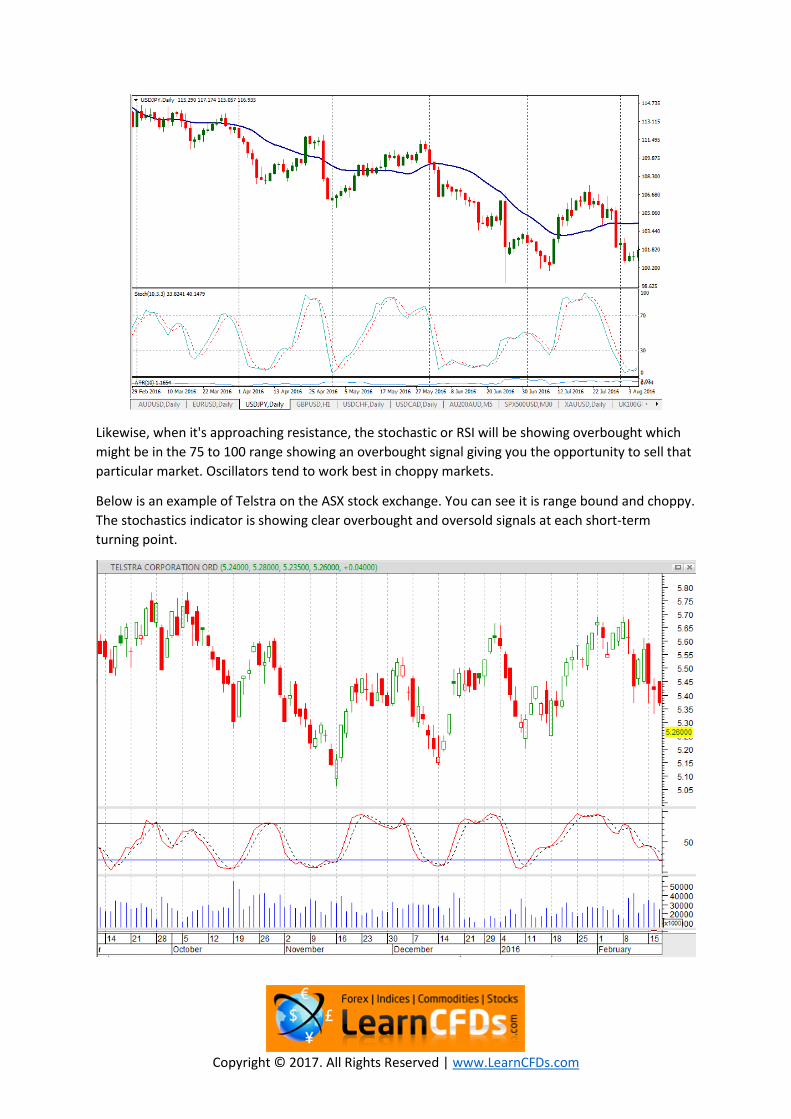
The chart below shows the Dollar Yen (USDJPY) with several overbought and oversold signals. The
chart is in a steady downtrend but is quite range bound throughout.
Copyright © 2017. All Rights Reserved | www.LearnCFDs.com
Likewise, when it's approaching resistance, the stochastic or RSI will be showing overbought which
might be in the 75 to 100 range showing an overbought signal giving you the opportunity to sell that
particular market. Oscillators tend to work best in choppy markets.
Below is an example of Telstra on the ASX stock exchange. You can see it is range bound and choppy.
The stochastics indicator is showing clear overbought and oversold signals at each short-term
turning point.
Copyright © 2017. All Rights Reserved | www.LearnCFDs.com
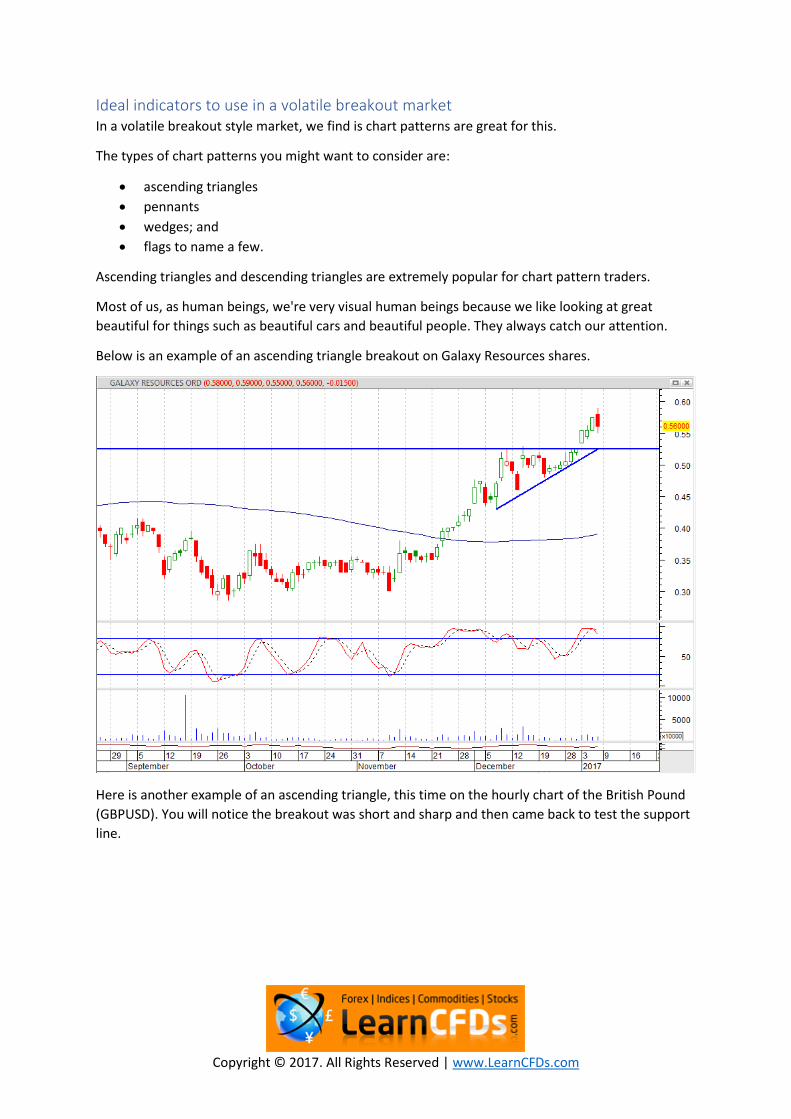
Ideal indicators to use in a volatile breakout market In a volatile breakout style market, we find is chart patterns are great for this.
The types of chart patterns you might want to consider are:
ascending triangles
pennants
wedges; and
flags to name a few.
Ascending triangles and descending triangles are extremely popular for chart pattern traders.
Most of us, as human beings, we're very visual human beings because we like looking at great
beautiful for things such as beautiful cars and beautiful people. They always catch our attention.
Below is an example of an ascending triangle breakout on Galaxy Resources shares.
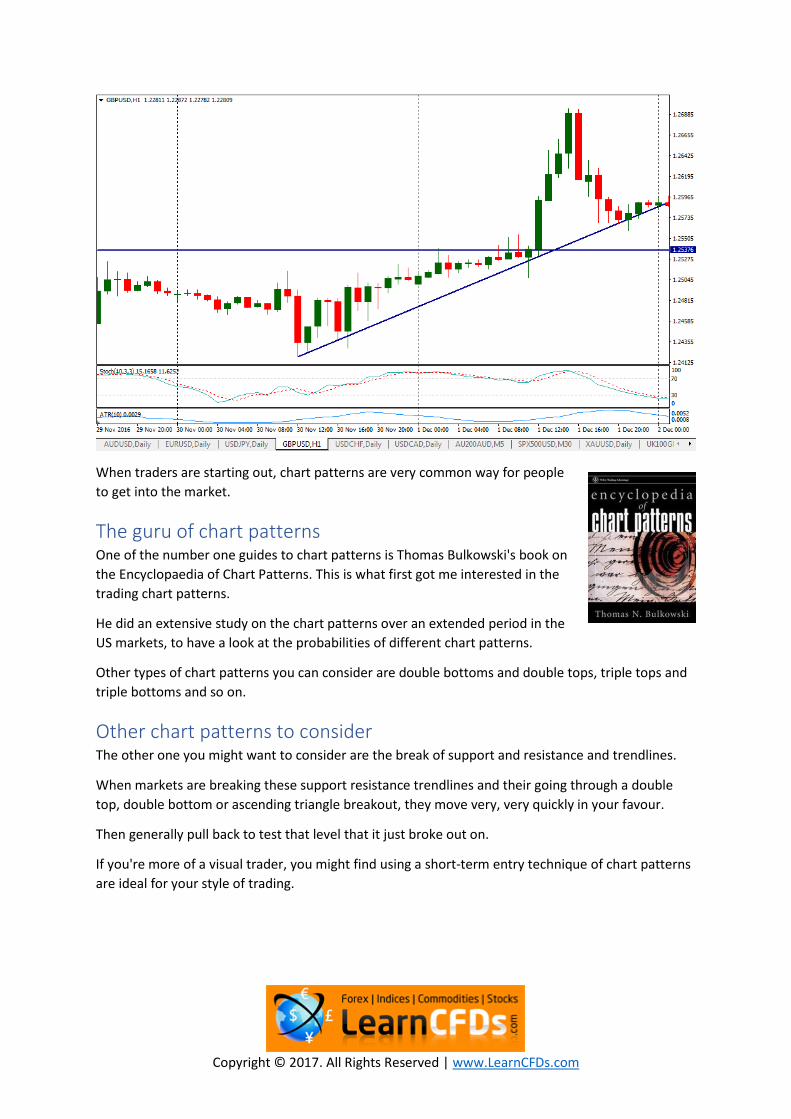
Here is another example of an ascending triangle, this time on the hourly chart of the British Pound
(GBPUSD). You will notice the breakout was short and sharp and then came back to test the support
line.
Copyright © 2017. All Rights Reserved | www.LearnCFDs.com
When traders are starting out, chart patterns are very common way for people
to get into the market.
The guru of chart patterns One of the number one guides to chart patterns is Thomas Bulkowski's book on
the Encyclopaedia of Chart Patterns. This is what first got me interested in the
trading chart patterns.
He did an extensive study on the chart patterns over an extended period in the
US markets, to have a look at the probabilities of different chart patterns.
Other types of chart patterns you can consider are double bottoms and double tops, triple tops and
triple bottoms and so on.
Other chart patterns to consider The other one you might want to consider are the break of support and resistance and trendlines.
When markets are breaking these support resistance trendlines and their going through a double
top, double bottom or ascending triangle breakout, they move very, very quickly in your favour.
Then generally pull back to test that level that it just broke out on.
If you're more of a visual trader, you might find using a short-term entry technique of chart patterns
are ideal for your style of trading.
Copyright © 2017. All Rights Reserved | www.LearnCFDs.com
So what is the best strategy of all time – the Hole Grail? The reality is there is no one best strategy that works all the time and that's the key to this particular
guide.
You see, the reality is, there are three major market types.
Ideally, what you will do is you'll find a strategy for each of these market types.
As we said at the beginning, one of the challenges with break-even traders is the fact they try and
push one of their strategies across all the market types. They inevitably go through a winning patch
and then a consistent losing patch.
This is very common with trend-based trading systems when markets only trend 20% to 30% of the
time.
Maybe 60% to 70% of the time, you're on the wrong side of the trade.
Now you may begin to see why it is so important to have at least a second style of entry technique. If
you were using a range bound entry strategy in combination with your trend based system, you
would likely be on the right side when markets are choppy.
Therefore, a combination of these entry techniques is more powerful than trying to fit one entry
technique across multiple market types.
How do professional traders use this knowledge of multiple market
types? The ultimate for a trader when trading these three market types is to have each of the three trading
strategies at work at any one time.
A trend following system would be always in. When the markets are trending up, you're long and
when it turns over and that moving average crossover turns south, you're reversing now you are
short. Therefore, your trend following entry strategy would ‘always be in’. Unless you put additional
filters over the top, which often works out favourably.
The Turtle Traders had no idea when the best trends were about to
hit One of the things with the turtle traders is they never knew when the biggest trend was going to
unfold.
Thus, they had to have their trending strategies always in the market long or short, but always in.
That's why trend-based trading systems have such a low win percentage of between 20% and 30%
which makes it psychologically very difficult to trade.
You can go through drawdowns that last quite some time before a trend unfolds.
Copyright © 2017. All Rights Reserved | www.LearnCFDs.com
Ok, what next?
What about 3 trading systems… Your goal is to have at least three trading systems.
1. A trend-based trading system
2. A range-bound trading system; and
3. A volatile breakout style trading system.
Dr Van Tharp is a big proponent of trading multiple styles of trading systems.
In fact, Van Tharp was the second authority figure who introduced me to this style of trading. The
name of the original trader escapes me.
Van Tharp would suggest having three strategies over three different timeframes. A short
timeframe, medium timeframe and a long-term timeframe.
The Ultimate Trader That means the ultimate trader would have nine individual trading systems in the market at any
one time.
That doesn't mean that each of your trading systems are trading all the time.
It might mean that some of them are firing more frequently than others.
Markets could be tanking and your short trend following system is firing and your long bull system is
getting no signals.
The ultimate trader would have of a number of strategies across the three different market types
and looking to introduce multiple timeframes into their system development.
Hopefully, this guide has helped you with the big picture of what it takes to be a trader and what it
takes to win on a consistent basis.
Stop the emotional roller coaster today Instead of having a purple patch and then going off for several months and not making any money,
hopefully you can start to see by having multiple entry techniques on the 3 main market types, you
can get past the break-even rut.
Ideally you will have backtested each of the systems to highlight a positive expectancy, allowing you
to make a positive return for each dollar risked.
Now you can enjoy your time in the markets and have less time in drawdown and have a much
smoother equity curve.
Number one goal of using the 3 entry techniques The number one goal of having these multiple strategies is to smooth out your equity curve and
have less of an emotional rollercoaster in your trading.

Copyright © 2017. All Rights Reserved | www.LearnCFDs.com
Good luck with your trading and let us know your thoughts.
Please leave some comments and feedback.
I would love to hear your feedback and whether this has helped you as a trader to become a better
trader, a more consistent trader and a trader with a smoother equity curve.
Copyright © 2017. All Rights Reserved | www.LearnCFDs.com
Disclaimer:
LearnCFDs risk warning. It is important to note that CFDs are geared trading products and can result
is losses far greater than your initial investment.
As a result, CFDs may not be suitable for everyone so you need to seek professional financial advice
to determine if this product is for you.
This eBook is produced by LearnCFDs Pty Ltd (ABN: 14 143 177 048). In order to legally and
responsibly provide general advice, LearnCFDs Pty Ltd is an authorised representative of Mirabile
Vincere Pty Ltd (AFSL) 321187.
LearnCFDs.com provides general advice only and the information contained on this eBook has not
taken into account your personal financial situation or needs.
Before investing in CFDs please read the Product Disclosure Statements (PDS) provided by your CFD
provider and/or consult your financial adviser.
All examples given on LearnCFDs.com and this eBook are for illustration purposes only.
They are not a solicitation to buy or sell any security, CFD, Index, Commodity or Forex pair.
For further information please view our disclaimer and privacy policy and click here to view our
Financial Services Guide (FSG).