Copyright © 2015 Lippincott Williams & Wilkins. Unauthorized commercial reproduction of this slide...
5
Copyright © 2015 Lippincott Williams & Wilkins. Unauthorized commercial reproduction of this slide is prohibited Supplemental PowerPoint Slides Reoperation Rates for Symptomatic Nonunions in Anterior Cervical Fusions from a National Spine Registry Kern H. Guppy, MD, PhD,1,2; Jessica Harris, MS, RD,3 Liz W. Paxton, MA,3; Julie L. Alvarez, MPH,3 Johannes A. Bernbeck, MD4 1 Department of Neurosurgery, Kaiser Permanente Medical Group, 2025 Morse Ave., Sacramento, CA 95825, USA 2 Department of Neurological Surgery, University of California, San Francisco 505 Parnassus Ave., San Francisco, CA 94143, USA. 3 Surgical Outcomes & Analysis Unit of Clinical Analysis, Kaiser Permanente, 8954 Rio San Diego Drive, San Diego, CA 92108 4 Department of Spinal Surgery, Kaiser Permanente Southern California, 9353 East Imperial Highway, Downey, CA 90242, USA.
-
Upload
wendy-wilkins -
Category
Documents
-
view
215 -
download
1
Transcript of Copyright © 2015 Lippincott Williams & Wilkins. Unauthorized commercial reproduction of this slide...

Copyright © 2015 Lippincott Williams & Wilkins. Unauthorized commercial reproduction of this slide is prohibited
Supplemental PowerPoint SlidesReoperation Rates for Symptomatic Nonunions in Anterior
Cervical Fusions from a National Spine Registry
Kern H. Guppy, MD, PhD,1,2; Jessica Harris, MS, RD,3 Liz W. Paxton, MA,3; Julie L. Alvarez, MPH,3 Johannes A. Bernbeck, MD4
1 Department of Neurosurgery, Kaiser Permanente Medical Group, 2025 Morse Ave., Sacramento, CA 95825, USA2 Department of Neurological Surgery, University of California, San Francisco 505 Parnassus Ave., San Francisco, CA 94143, USA. 3 Surgical Outcomes & Analysis Unit of Clinical Analysis, Kaiser Permanente, 8954 Rio San Diego Drive, San Diego, CA 921084 Department of Spinal Surgery, Kaiser Permanente Southern California, 9353 East Imperial Highway, Downey, CA 90242, USA.
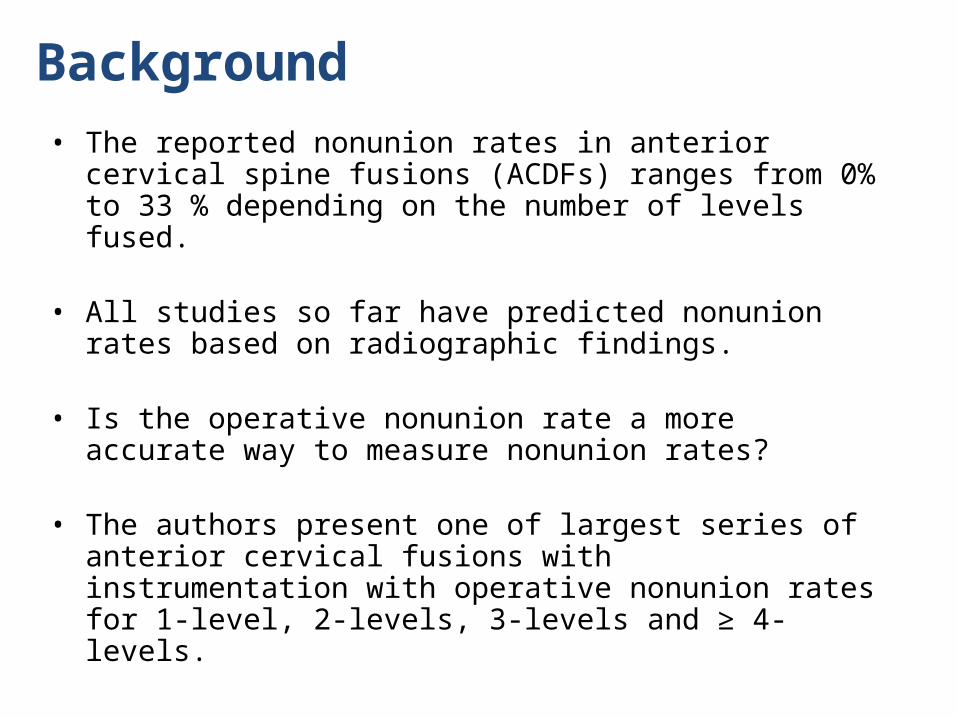
Background• The reported nonunion rates in anterior cervical spine fusions
(ACDFs) ranges from 0% to 33 % depending on the number of levels fused.
• All studies so far have predicted nonunion rates based on radiographic findings.
• Is the operative nonunion rate a more accurate way to measure nonunion rates?
• The authors present one of largest series of anterior cervical fusions with instrumentation with operative nonunion rates for 1-level, 2-levels, 3-levels and ≥ 4-levels.

MethodsStudy Design: Retrospective Cohort
Study Sample: 1054 instrumented anterior cervical fusions between 2009 and 2012 were identified by The Kaiser Permanente Spine Implant Registry with > 2 years follow-up.
Data Collection: Electronic screening algorithms utilizing implant data & ICD-9 codes, extract inpatient data, operative procedures, surgical characteristics and complications and are further validated by manual chart review
Data Elements of Interest: Patient demographics, diagnosis, operative time, LOS, spine fusion levels & approach, re-operations, diabetes, smoking status
Outcomes: Re-operations for symptomatic nonunion.
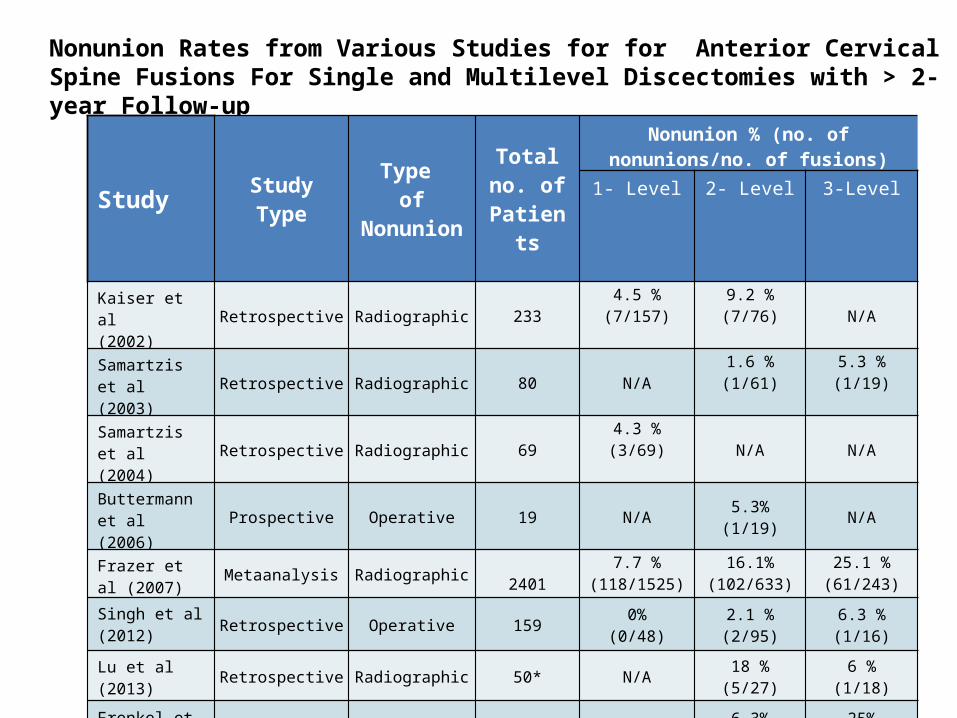
Nonunion Rates from Various Studies for for Anterior Cervical Spine Fusions For Single and Multilevel Discectomies with > 2-year Follow-up
Study Study Type
Type of
Nonunion
Total no. of Patien
ts
Nonunion % (no. of nonunions/no. of fusions)
1- Level 2- Level 3-Level
Kaiser et al(2002) Retrospective Radiographic 233
4.5 %(7/157)
9.2 %(7/76) N/A
Samartzis et al (2003) Retrospective Radiographic 80 N/A
1.6 %(1/61)
5.3 %(1/19)
Samartzis et al (2004) Retrospective Radiographic 69
4.3 %(3/69) N/A N/A
Buttermann et al (2006) Prospective Operative 19 N/A
5.3%(1/19)
N/A
Frazer et al (2007) Metaanalysis Radiographic 2401
7.7 %(118/1525)
16.1%(102/633)
25.1 %(61/243)
Singh et al (2012) Retrospective Operative 159
0%(0/48)
2.1 %(2/95)
6.3 %(1/16)
Lu et al (2013) Retrospective Radiographic 50* N/A
18 %(5/27)
6 %(1/18)
Frenkel et al (2013) Retrospective Radiographic 23* N/A
6.3%(1/16)
25%(1/4)
Our Study(>2 year f/u) Retrospective Operative 1054*
0.2 %(1/537)
2.9 %(11/382)
6.5 %(7/108)

Results• The Spine Implant Registry identified 1054 patients (Table 1) with ACDFs
between 1/1/2009 and 12/31/2012 with > 2 years follow-up (average 2.9 years). The operative non-union rate for >2-years follow-up were:
• 1-level, 0.2 %• 2-levels, 2.9 %• 3-levels, 6.5 %• ≥ 4-Level was too small sample size to give an accurate estimate.
ConclusionsIn a large cohort of instrumented anterior cervical fusions for 1-level, 2-levels, and 3-levels fusions, the operative nonunion rates were significantly lower than reported in the literature based on radiographic studies to define nonunion rates. We believe, however, our data adds to the literature an important parameter (reoperation rates for symptomatic nonunions) and provides useful information for patients, spine surgeons and healthcare payers. .