Copyright © 2015 Actelion Pharmaceuticals Ltd CONFIDENCE INTERVALS FOR FUNCTIONS Anne Kümmel,...
11
Copyright © 2015 Actelion Pharmaceuticals Ltd CONFIDENCE INTERVALS FOR FUNCTIONS Anne Kümmel, Actelion Pharmaceuticals Ltd. 2015 – 07 – 16 BaselR
-
Upload
eileen-daniel -
Category
Documents
-
view
228 -
download
8
Transcript of Copyright © 2015 Actelion Pharmaceuticals Ltd CONFIDENCE INTERVALS FOR FUNCTIONS Anne Kümmel,...

Copyright © 2015 Actelion Pharmaceuticals Ltd
CONFIDENCE INTERVALS FOR FUNCTIONS
Anne Kümmel, Actelion Pharmaceuticals Ltd.
2015 – 07 – 16 BaselR

© 2015 Actelion Pharmaceuticals Ltd2
Scenario:
– Dose response is sigmoidal
– All parameters have a variability of 0.2 s.d. (log-normal)
At which dose range will I observe a response of 50% of the maximal?
OFTEN, THE RESULT OF A SIMULATION, NOT THE PARAMETER VALUE ITSELF IS THE KEY INTEREST
MOTIVATION
14 Jul 2015

© 2015 Actelion Pharmaceuticals Ltd3
Parameter estimation is a key tool for pharmacometric analysis of clinical data
Estimation software usually provides estimation error for the parameter estimates
How uncertain are the model predictions?
Implementation of a R framework to calculate confidence intervals for model functions
– Different CI calculation methods
– Single function for parameter estimation and confidence interval calculation
– Any user-specified, closed-form models
SUMMARY
14 Jul 2015
© 2015 Actelion Pharmaceuticals Ltd4
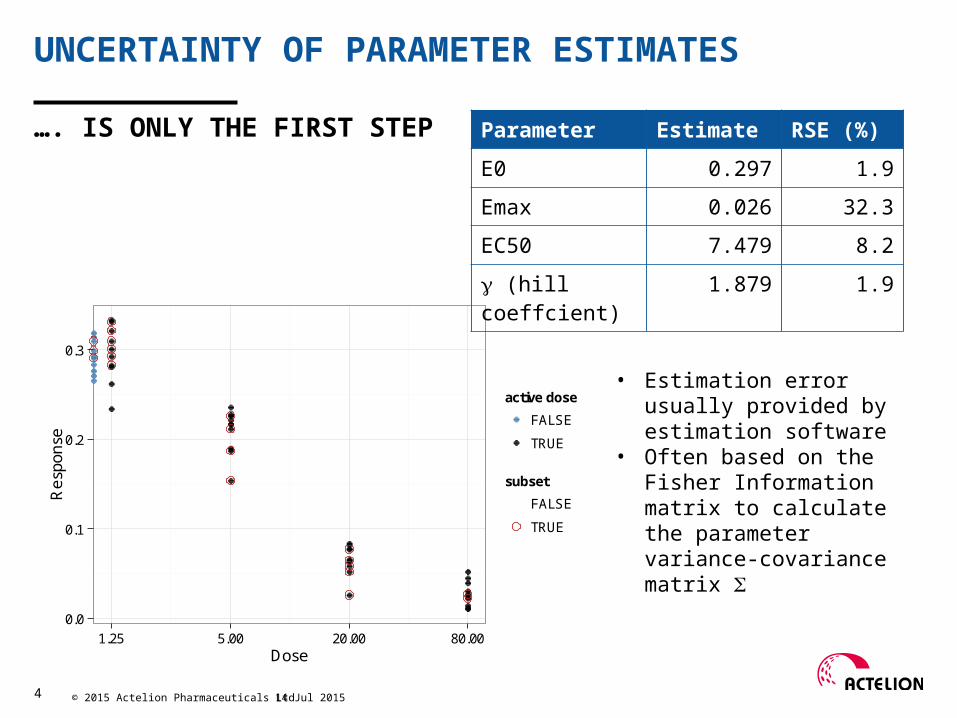
…. IS ONLY THE FIRST STEP
UNCERTAINTY OF PARAMETER ESTIMATES
14 Jul 2015
0.0
0.1
0.2
0.3
1.25 5.00 20.00 80.00Dose
Res
pons
e
active dose
FALSE
TRUE
subset
FALSE
TRUE
Parameter Estimate RSE (%)
E0 0.297 1.9
Emax 0.026 32.3
EC50 7.479 8.2
g (hill coeffcient) 1.879 1.9
• Estimation error usually provided by estimation software
• Often based on the Fisher Information matrix to calculate the parameter variance-covariance matrix S

© 2015 Actelion Pharmaceuticals Ltd5
DIFFERENT METHODS FOR CI CALCULATION
14 Jul 2015

© 2015 Actelion Pharmaceuticals Ltd6
IMPLEMENTATION IN A SINGLE R FRAMEWORK
14 Jul 2015
Input parameters for parameter estimation and confidence calculation:
Error model (errmod)
Estimation method (estmethod)
Initial parameter estimates (init)
Confidence interval (CI) calculation method (CImethod)
Vector of independent variable values for which to calculate CI (xsupport)

© 2015 Actelion Pharmaceuticals Ltd7
parameter.estimation()
1) Parameter estimation 2) Confidence calculation 3) Visualization
R FRAMEWORK SETUP
14 Jul 2015
parameter.estimation.nls()
parameter.estimation.nlm()
CI.boot()
CI.delta()
CI.sim()
CI.MC()
plot.data.CI()
calc.jacobian()
calc.VarFun()
est.nls()
est.nlm()

© 2015 Actelion Pharmaceuticals Ltd8
EXAMPLE: ESTIMATION OF CI FOR DOSE RESPONSE CURVE
14 Jul 2015
Estimation with MLEConfidences by simulationError model: additive + proportional (a + b)
Estimates (90%-CI)E0: 0.2973 (0.2858 - 0.3088)Emax: 0.02439 (0.01469 - 0.03408)EC50: 7.582 (6.628 - 8.536)Hill: 1.828 (1.527 - 2.129)a: 0.01282 (0.007756 - 0.01788)b: 0.04474 (0.01267 - 0.07681)
x
y
0.1
0.2
0.3
0.01 0.1 1 10 100
samplesprediction90%-CI90%-PI

© 2015 Actelion Pharmaceuticals Ltd9
COMPARISON OF DIFFERENT METHODS
14 Jul 2015
full reduced
0.03
0.06
0.09
0.1 10.0 0.1 10.0Dose
Confid
ence
inte
rval w
idth
method Bootstrap Delta method MC Simulation-estimation Simulation
Method Calculation time (s)
Delta method 0.32
Simulation (k=1000) 0.92
MC simulation-estimation (k=1000) 212.60
Bootstrap (k=1000) 224.53
0.0
0.1
0.2
0.3
1.25 5.00 20.00 80.00Dose
Res
pons
e
active dose
FALSE
TRUE
subset
FALSE
TRUE

© 2015 Actelion Pharmaceuticals Ltd10
SINGLE-INTERFACE FRAMEWORK FOR DATA FITTING, CONFIDENCE AND PREDICTION INTERVAL CALCULATION
SUMMARY
14 Jul 2015
Estimation with MLEConfidences by bootstrapError model: additive + proportional (a + b)
Estimates (90%-CI)E0: 0.2973 (0.2874 - 0.307)Emax: 0.02439 (0.01487 - 0.03329)EC50: 7.582 (6.667 - 8.599)Hill: 1.828 (1.591 - 2.2)a: 0.01282 (0.007732 - 0.01708)b: 0.04474 (0.01258 - 0.07259)
x
y
0.1
0.2
0.3
0.01 0.1 1 10 100
samplesprediction90%-CI90%-PI
Possible extensions:ODE model, function for prospective analysis, link to PFIMmodel library
Alternatives which you are using?

© 2015 Actelion Pharmaceuticals Ltd11
THANK YOU.
14 Jul 2015
![Niemann-Pick type C disease: Journey to diagnosis Slide set for [INSERT SPECIALITY] [INSERT DATE] This survey was sponsored by Actelion Pharmaceuticals.](https://static.fdocuments.in/doc/165x107/56649ea45503460f94ba886c/niemann-pick-type-c-disease-journey-to-diagnosis-slide-set-for-insert-speciality.jpg)