©2008 Pearson Prentice Hall Project Management Systems Analysis and Design, 7e Kendall & Kendall 3.
Upload
garey-chapmanCategory
view
224download
2
Copyright © 2011 Pearson Education
Project Management
Systems Analysis and Design, 8e
Kendall & KendallGlobal Edition
3

Kendall & Kendall Copyright © 2011 Pearson Education 3-2
Learning Objectives
• Understand how projects are initiated and selected, define a business problem, and determine the feasibility of a proposed project.
• Inventory and appraise current and proposed hardware and software and the way it supports human interactions with technology.
• Evaluate software by addressing the tradeoffs among creating custom software, purchasing COTS software, and outsourcing to an application service provider.
• Forecast and analyze tangible and intangible costs and benefits.• Plan a project by identifying activities and scheduling them.• Manage team members and analysis and design activities so that the
project objectives are met while the project remains on schedule.• Professionally write and present an effective systems proposal,
concentrating on both content and design.

Kendall & Kendall Copyright © 2011 Pearson Education 3-3
Project Management Fundamentals
• Project initiation• Determining project feasibility• Activity planning and control• Project scheduling• Managing systems analysis team
members

Kendall & Kendall Copyright © 2011 Pearson Education 3-4
Major Topics
• Project initiation• Determining feasibility• Determining resources• Activity planning and control
• Gantt charts• PERT diagrams
• Managing analysis and design activities• The agile approach

Kendall & Kendall Copyright © 2011 Pearson Education 3-5
Project Initiation
• Problems in the organization• Problems that lend themselves to
systems solutions
• Opportunities for improvement• Caused through upgrading, altering,
or installing new systems

Kendall & Kendall Copyright © 2011 Pearson Education 3-6
Checking Output, Observing Employee Behavior, and Listening to Feedback Are all Ways to Help the Analyst Pinpoint Systems Problems and Opportunities (Figure 3.1)
Kendall & Kendall Copyright © 2011 Pearson Education 3-7
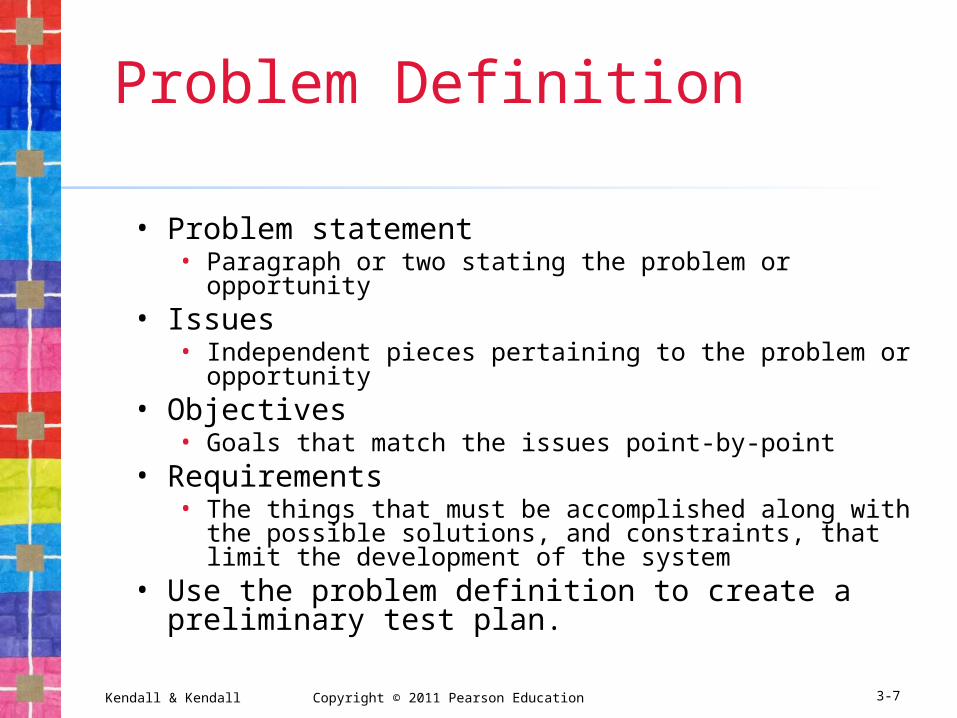
Problem Definition
• Problem statement• Paragraph or two stating the problem or opportunity
• Issues• Independent pieces pertaining to the problem or
opportunity• Objectives
• Goals that match the issues point-by-point• Requirements
• The things that must be accomplished along with the possible solutions, and constraints, that limit the development of the system
• Use the problem definition to create a preliminary test plan.

Kendall & Kendall Copyright © 2011 Pearson Education 3-8
Problem Definition Steps
• Find a number of points that may be included in one issue.
• State the objective.• Determine the relative importance
of the issues or objectives.• Identify which objectives are most
critical.

Kendall & Kendall Copyright © 2011 Pearson Education 3-9
Selection Of Projects
• Backing from management• Appropriate timing of project commitment• Possibility of improving attainment of
organizational goals• Practical in terms of resources for the
system analyst and organization• Worthwhile project compared with other
ways the organization could invest resources

Kendall & Kendall Copyright © 2011 Pearson Education 3-10
Selection of Projects: Improving Attainment of Organizational Goals• Improving corporate profits• Supporting the competitive strategy of
the organization• Improving cooperation with vendors and
partners• Improving internal operations support • Improving internal decision support so
that decisions are more effective• Improving customer service• Increasing employee morale
Kendall & Kendall Copyright © 2011 Pearson Education 3-11
Defining Objectives
Many possible objectives exist including:• Speeding up a process• Streamlining a process• Combining processes• Reducing errors in input• Reducing redundant storage• Reducing redundant output• Improving system and subsystem integration

Kendall & Kendall Copyright © 2011 Pearson Education 3-12
Determining Feasibility
• Defining objectives• Determining resources
• Operationally• Technically• Economically
Kendall & Kendall Copyright © 2011 Pearson Education 3-13
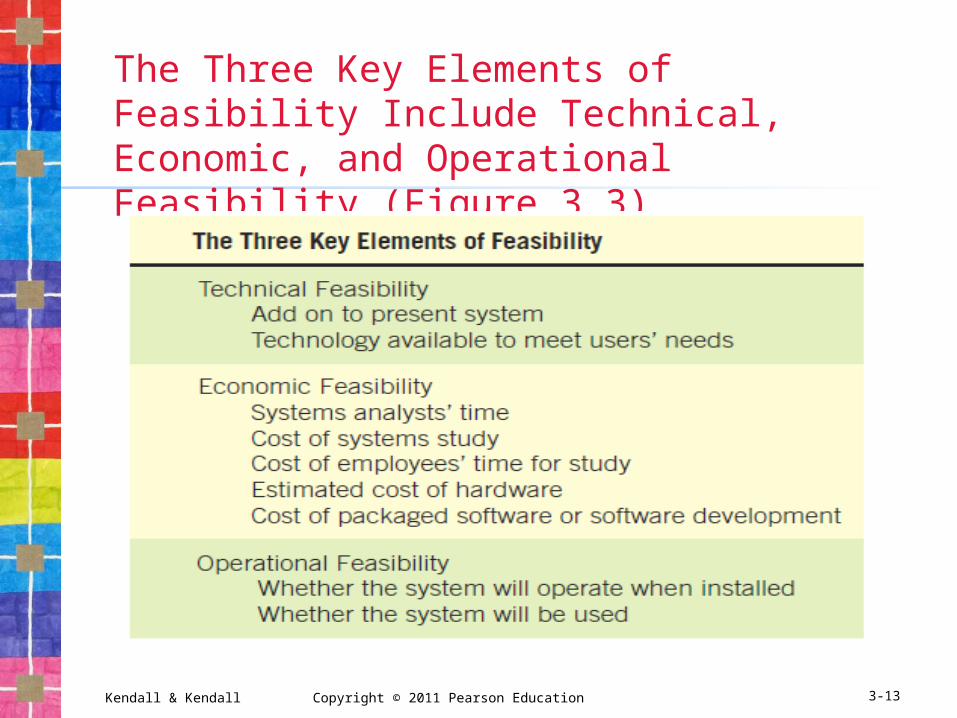
The Three Key Elements of Feasibility Include Technical, Economic, and Operational Feasibility (Figure 3.3)

Kendall & Kendall Copyright © 2011 Pearson Education 3-14
Technical Feasibility
• Can current technical resources be upgraded or added to in a manner that fulfills the request under consideration?
• If not, is there technology in existence that meets the specifications?

Kendall & Kendall Copyright © 2011 Pearson Education 3-15
Economic Feasibility
• Economic feasibility determines whether value of the investment exceeds the time and cost.
• Includes: • Analyst and analyst team time• Business employee time• Hardware• Software• Software development

Kendall & Kendall Copyright © 2011 Pearson Education 3-16
Operational Feasibility
• Operational feasibility determines if the human resources are available to operate the system once it has been installed.
• Users that do not want a new system may prevent it from becoming operationally feasible.

Kendall & Kendall Copyright © 2011 Pearson Education 3-17
Ascertaining Hardware and Software Needs• Steps used to determine hardware
and software needs:• Inventory computer hardware currently
available• Estimate current and future system
workloads• Evaluate available hardware and
software • Choose the vendor• Acquire the computer equipment

Kendall & Kendall Copyright © 2011 Pearson Education 3-18
Steps in Choosing Hardware and Software (Figure 3.4)

Kendall & Kendall Copyright © 2011 Pearson Education 3-19
Inventorying Computer Hardware
• Type of equipment• Operation status of the equipment• Estimated age of equipment• Projected life of equipment• Physical location of equipment• Department or person responsible for
equipment• Financial arrangement for equipment

Kendall & Kendall Copyright © 2011 Pearson Education 3-20
Estimating Workloads
• Systems analysts formulate numbers that represent both current and projected workloads for the system so that any hardware obtained will possess the capability to handle current and future workloads.

Kendall & Kendall Copyright © 2011 Pearson Education 3-21
Comparisons of Workloads between Existing and Proposed Systems (Figure 3.5 )

Kendall & Kendall Copyright © 2011 Pearson Education 3-22
Evaluating Hardware
• Time required for average transactions
• Total volume capacity of the system
• Idle time of the CPU or network• Size of memory provided
Kendall & Kendall Copyright © 2011 Pearson Education 3-23
People that Evaluate Hardware• Management• Users• Systems analysts

Kendall & Kendall Copyright © 2011 Pearson Education 3-24
Acquisition of Computer Equipment• Purchasing• Leasing• Rental

Kendall & Kendall Copyright © 2011 Pearson Education 3-25
Purchasing, Leasing, and Renting Advantages and Disadvantages (Figure 3.6)
Kendall & Kendall Copyright © 2011 Pearson Education 3-26
Evaluating Vendor Support
• Hardware support• Software support• Installation and training support• Maintenance support

Kendall & Kendall Copyright © 2011 Pearson Education 3-27
Evaluating Vendor Support (Figure 3.8)
Kendall & Kendall Copyright © 2011 Pearson Education 3-28
Other Considerations
• Possibility of adding on to the system
• Interfacing with equipment from other vendors
• Adding more memory• Corporate stability of the vendor
Kendall & Kendall Copyright © 2011 Pearson Education 3-29
Software Alternatives
• Created custom software• Purchased as COTS (commercial
off-the-shelf) software• Provided by an application service
provider (ASP)

Kendall & Kendall Copyright © 2011 Pearson Education 3-30
Software Alternatives (Figure 3.9)

Kendall & Kendall Copyright © 2011 Pearson Education 3-31
Software Evaluation
• Performance effectiveness• Performance efficiency• Ease of use• Flexibility• Quality of documentation• Manufacturer support

Kendall & Kendall Copyright © 2011 Pearson Education 3-32
Guidelines for Evaluating Software(Figure 3.10)
Kendall & Kendall Copyright © 2011 Pearson Education 3-33
Activity Planning and Control• Planning includes:
• Selecting a systems analysis team• Estimating time required to complete each
task• Scheduling the project
• Control includes:• Comparing the plan for the project with its
actual evolution• Taking appropriate action to expedite or
reschedule activities
Kendall & Kendall Copyright © 2011 Pearson Education 3-34
Identifying and Forecasting Costs and Benefits• Judgment methods
• Estimates from the sales force• Surveys to estimate customer
demand• Delphi studies• Creating scenarios• Drawing historical analogies

Kendall & Kendall Copyright © 2011 Pearson Education 3-35
Identifying and Forecasting Costs and Benefits (Continued)• If historical data are available
• Conditional:• There is an association among variables
in the model.
• Unconditional:• Do not need to find or identify any
relationships.

Kendall & Kendall Copyright © 2011 Pearson Education 3-36
Estimation of Trends
• Graphical judgment• Moving averages

Kendall & Kendall Copyright © 2011 Pearson Education 3-37
Identifying Benefits and Costs• Tangible benefits are advantages
measurable in dollars through the use of the information system.
• Intangible benefits are difficult to measure.
• Tangible costs are accurately projected by the systems analyst and accounting personnel.
• Intangible costs are difficult to estimate and may not be known.
Kendall & Kendall Copyright © 2011 Pearson Education 3-38
Tangible Benefits
• Advantages measurable in dollars that accrue to the organization through the use of the information system
• Examples:• Increase in the speed of processing• Access to otherwise inaccessible information• Access to information on a more timely
basis• The advantage of the computer’s superior
calculating power• Decreases in the amount of employee time
needed to complete specific tasks
Kendall & Kendall Copyright © 2011 Pearson Education 3-39
Intangible Benefits
• Intangible benefits are benefits from use of the information system that are difficult to measure.
• Examples:• Improving the decision-making process• Enhancing accuracy• Becoming more competitive in customer
service• Maintaining a good business image• Increasing job satisfaction
Kendall & Kendall Copyright © 2011 Pearson Education 3-40
Tangible Costs
• Those that can be accurately projected by systems analysts and the business’ accounting personnel
• Examples:• Cost of equipment• Cost of resources• Cost of systems analysts’ time• Cost of programmers’ time• Employees’ salaries

Kendall & Kendall Copyright © 2011 Pearson Education 3-41
Intangible Costs
• Those that are difficult to estimate and may not be known
• Examples:• Losing a competitive edge• Losing the reputation of being first• Declining company image• Ineffective decision making
Kendall & Kendall Copyright © 2011 Pearson Education 3-42
Comparing Costs and Benefits• Break-even analysis• Payback• Cash-flow analysis• Present value analysis

Kendall & Kendall Copyright © 2011 Pearson Education 3-43
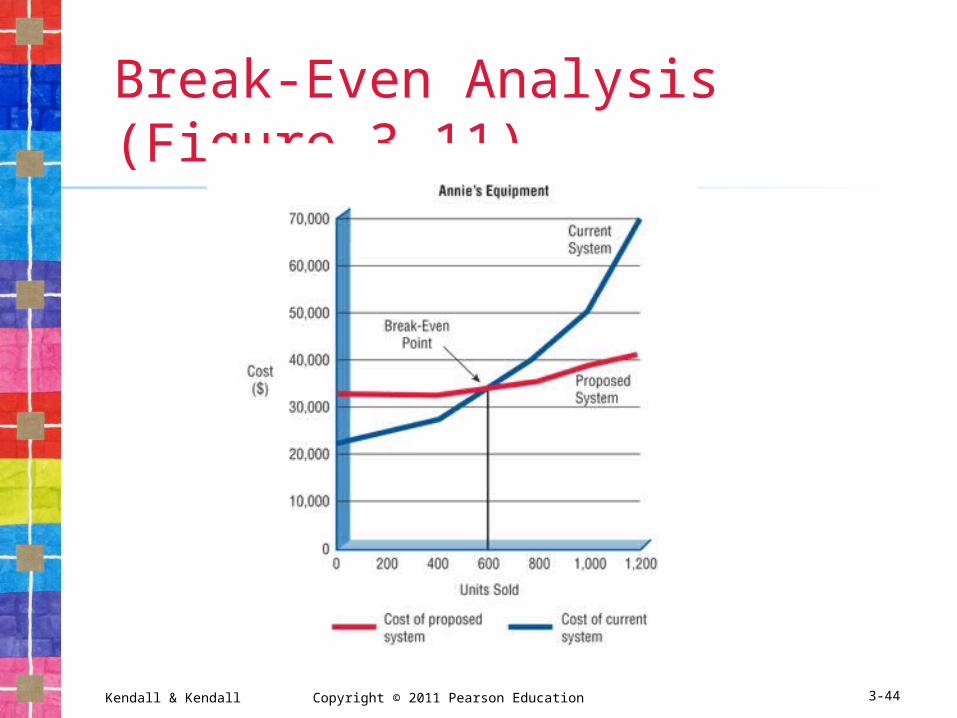
Break-Even Analysis
• The point at which the total cost of the current system and the proposed system intersect
• Useful when a business is growing and volume is a key variable in costs
• Disadvantage:• Benefits are assumed to remain the same
• Advantage:• Can determine how long it will take for the
benefits of the system to pay back the costs of developing it
Kendall & Kendall Copyright © 2011 Pearson Education 3-44
Break-Even Analysis (Figure 3.11)
Kendall & Kendall Copyright © 2011 Pearson Education 3-45
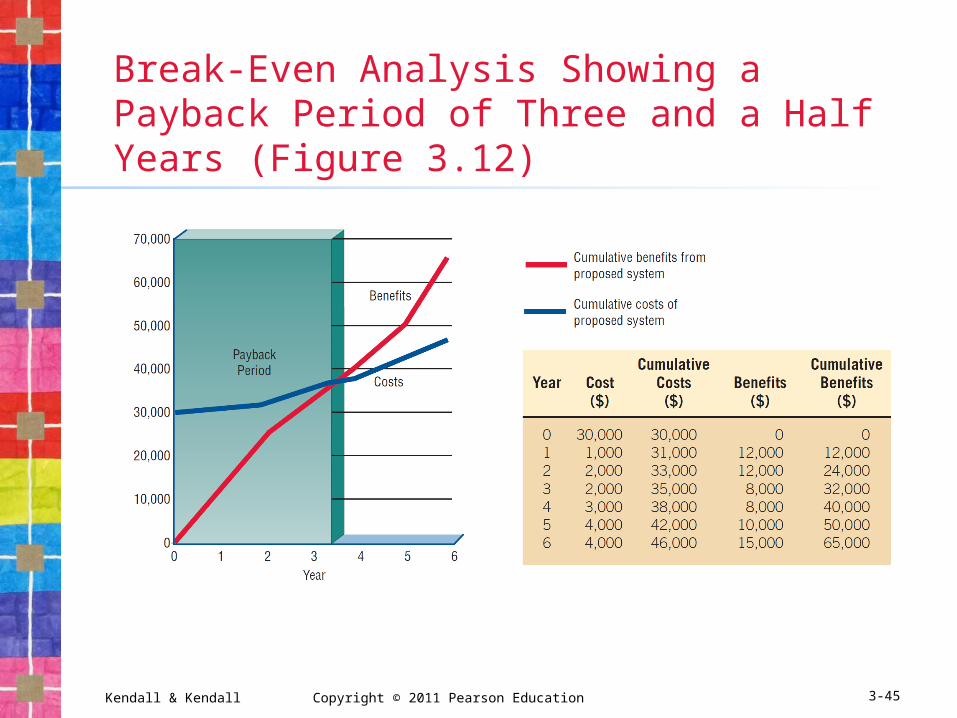
Break-Even Analysis Showing a Payback Period of Three and a Half Years (Figure 3.12)
Kendall & Kendall Copyright © 2011 Pearson Education 3-46
Cash-Flow Analysis
• Examines the direction, size, and pattern of cash flow that is associated with the proposed information system
• Determines when cash outlays and revenues will occur for both; not only for the initial purchase, but over the life of the information system

Kendall & Kendall Copyright © 2011 Pearson Education 3-47
Cash-Flow Analysis for the Computerized Mail-Addressing System (Figure 3.13)

Kendall & Kendall Copyright © 2011 Pearson Education 3-48
Present Value Analysis
• Way to assess all the economic outlays and revenues of the information system over its economic life, and to compare costs today with future costs and today’s benefits with future benefits
• Presents the time value of the investment in the information system as well as the cash flow

Kendall & Kendall Copyright © 2011 Pearson Education 3-49
Present Value Analysis (Figure 3.15)
• Taking into account present value, the conclusion is that the costs are greater than the benefits.
• The discount rate, i, is assumed to be .12 in calculating the multipliers in this table.

Kendall & Kendall Copyright © 2011 Pearson Education 3-50
Guidelines for Analysis
• Use break-even analysis if the project needs to be justified in terms of cost, not benefits.
• Use payback when the improved tangible benefits form a convincing argument for the proposed system.
• Use cash-flow analysis when the project is expensive, relative to the size of the company.
• Use present value when the payback period is long or when the cost of borrowing money is high.

Kendall & Kendall Copyright © 2011 Pearson Education 3-51
Estimating Time
• Project is broken down into phases.• Further project is broken down into tasks
or activities.• Finally project is broken down into steps
or even smaller units.• Time is estimated for each task or
activity.• Most likely, pessimistic and optimistic
estimates for time may be used.

Kendall & Kendall Copyright © 2011 Pearson Education 3-52
Beginning to Plan a Project by Breaking it into Three Major Activities (Figure 3.16)

Kendall & Kendall Copyright © 2011 Pearson Education 3-53
Refining the Planning and Scheduling of Analysis Activities by Adding Detailed Tasks and Establishing the Time Required to Complete the Tasks (Figure 3.17)

Kendall & Kendall Copyright © 2011 Pearson Education 3-54
Project Scheduling
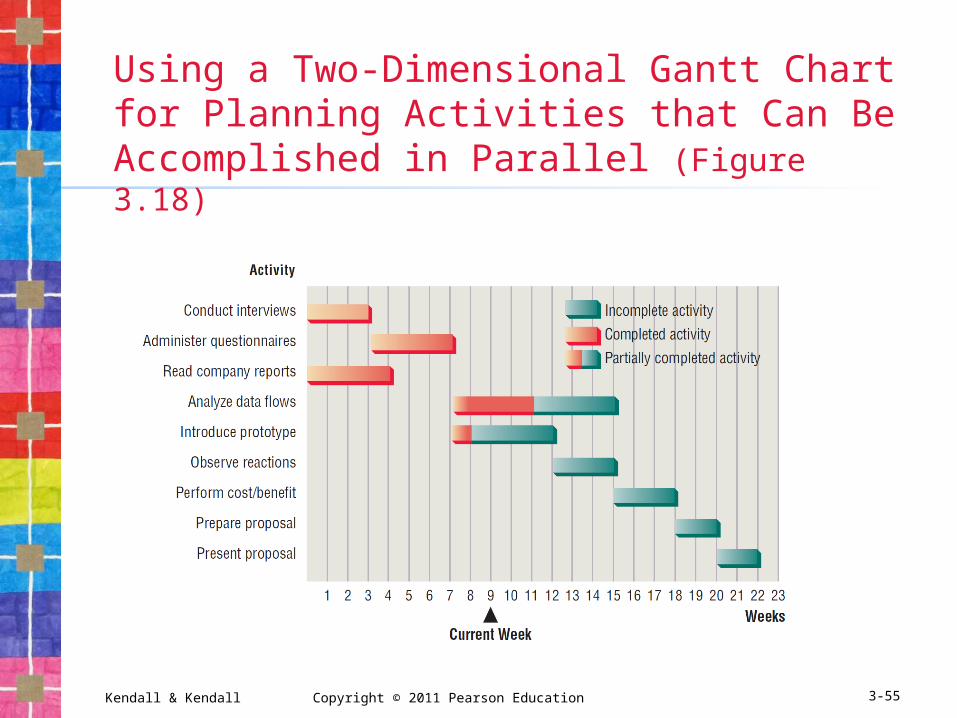
• Gantt Charts• Simple• Lends itself to end user
communication• Drawn to scale
• PERT diagrams• Useful when activities can be done in
parallel
Kendall & Kendall Copyright © 2011 Pearson Education 3-55
Using a Two-Dimensional Gantt Chart for Planning Activities that Can Be Accomplished in Parallel (Figure 3.18)

Kendall & Kendall Copyright © 2011 Pearson Education 3-56
A Completed PERT Diagram for the Analysis Phase of a Systems Project (Figure 3.22)

Kendall & Kendall Copyright © 2011 Pearson Education 3-57
PERT Diagram Advantages
• Easy identification of the order of precedence
• Easy identification of the critical path and thus critical activities
• Easy determination of slack time

Kendall & Kendall Copyright © 2011 Pearson Education 3-58
Project Due Dates
• Estimating models• Costar• Construx
• Function point analysis• Helps the analyst quantitatively
estimate the overall length of software development efforts

Kendall & Kendall Copyright © 2011 Pearson Education 3-59
Managing Analysis and Design Activities
• Team management• Assembling a team• Team communication strategies• Project productivity goals• Team member motivation

Kendall & Kendall Copyright © 2011 Pearson Education 3-60
Assembling a Team
• Shared value of team work• Good work ethic• Honesty• Competency• Readiness to take on leadership based
on expertise• Motivation• Enthusiasm for the project• Trust of teammates

Kendall & Kendall Copyright © 2011 Pearson Education 3-61
Communication Strategies
• Teams often have two leaders:• Task leader: leads members to accomplish
tasks• Socioemotional leader: concerned with
social relationships
• The systems analyst must manage:• Team members• Their activities• Their time and resources

Kendall & Kendall Copyright © 2011 Pearson Education 3-62
Project Productivity Goals and Motivation
• Successful projects require that reasonable productivity goals for tangible outputs and process activities be set.
• Goal-setting helps to motivate team members.

Kendall & Kendall Copyright © 2011 Pearson Education 3-63
Ecommerce Project Management Ecommerce and traditional software
project management differences:• The data used by ecommerce systems
is scattered across the organization.• Ecommerce systems need a staff with a
wide variety of skills.• Partnerships must be built externally
and internally well ahead of implementation.
• Security is of utmost importance.
Kendall & Kendall Copyright © 2011 Pearson Education 3-64
Project Charter
• Describes in a written document what the expected results of the systems project are and the time frame for delivery

Kendall & Kendall Copyright © 2011 Pearson Education 3-65
Project Charter Clarifies these Questions
• What does the user expect of the project?• What is the scope of the project? • What analysis methods will the analyst use to
interact with users?• Who are the key participants?• What are the project deliverables?• Who will evaluate the system and how will they
evaluate it?• What is the estimated project timeline?• Who will train the users?• Who will maintain the system?

Kendall & Kendall Copyright © 2011 Pearson Education 3-66
Project Failures
• Project failures may be prevented by:• Training• Experience• Learning why other projects have failed
• Fishbone diagram systematically lists all of the possible problems that can occur

Kendall & Kendall Copyright © 2011 Pearson Education 3-67
Fishbone Diagram (Figure 3.23)

Kendall & Kendall Copyright © 2011 Pearson Education 3-68
The Systems Proposal
• Cover letter• Title page of project• Table of contents• Executive summary • Outline of systems study with appropriate
documentation• Detailed results of the systems study• Systems alternatives • Systems analysts recommendations• Summary• Appendices

Kendall & Kendall Copyright © 2011 Pearson Education 3-69
Using Figures for Effective Communication
• Effective use of tables• Effective use of graphs

Kendall & Kendall Copyright © 2011 Pearson Education 3-70
Effective Use of Tables
• Integrate into the body of the proposal• Try to fit the entire table vertically on a
single page.• Number and title the table at the top of
the page.• Label each row and column.• Use a boxed table if room permits.• Use footnotes if necessary to explain
detailed information contained in the table.
Kendall & Kendall Copyright © 2011 Pearson Education 3-71
Effective Use of Graphs
• Choose a style of graph that communicates your intended meaning well.
• Integrate the graph into the body of the proposal.
• Give the graph a sequential figure number and a meaningful title.
• Label each axis, and any lines, columns, bars, or pieces of the pie on the graph.
• Include a key to indicate differently colored lines, shaded bars, or crosshatched areas.

Kendall & Kendall Copyright © 2011 Pearson Education 3-72
Summary
• Project management fundamentals• Project initiation• Determining project feasibility• Activity planning and control• Project scheduling• Managing systems analysis team members
• Problem definition• Issues of the present system• The objective for each issue• The requirements that must be included in
all proposed systems
Kendall & Kendall Copyright © 2011 Pearson Education 3-73
Summary (Continued)
• Project selection• Backed by management• Commitment of resources• Attains goals• Practical• Important
• Feasibility• Operational• Technical• Economic

Kendall & Kendall Copyright © 2011 Pearson Education 3-74
Summary (Continued)
• Acquiring hardware and software• Project planning
• Gantt charts• PERT• Function point analysis
• Team management• Ecommerce projects• Preparing a system proposal

Copyright © 2011 Pearson Education 3-75
All rights reserved. No part of this publication may be reproduced, stored in a retrieval system, or transmitted, in any form or by any means, electronic,
mechanical, photocopying, recording, or otherwise, without the prior written permission of the publisher. Printed in the United States of America.
Copyright © 2011 Pearson EducationCopyright © 2011 Pearson Education