Department of Labor: USDOL OALJ LHWCA BENCHBOOK TOPIC 21 (2002)
date post
21-Dec-2015Category
view
215download
0
Copyright © 2009 Pearson Education, Inc. 2- 1
Topic 1. Chapter 2
Overview of Labor Market

Copyright © 2009 Pearson Education, Inc. 2- 2
Figure 2.1: Labor Force Status of the U.S. Adult Civilian Population, April 2007

Copyright © 2009 Pearson Education, Inc. 2- 3
Table 2.1: Labor Force Participation Rates by Gender, 1950-2007

Copyright © 2009 Pearson Education, Inc. 2- 4
Figure 2.2: Unemployment Rates for the Civilian Labor Force, 1946-2006

Copyright © 2009 Pearson Education, Inc. 2- 5
Figure 2.3: Employment Distribution by Major Nonfarm Sector, 1954-2007
(detailed data in table on next slide)

Copyright © 2009 Pearson Education, Inc. 2- 6
Figure 2.4: Relationship between Wages, Earnings, Compensation and Income

Copyright © 2009 Pearson Education, Inc. 2- 7
Table 2.2: Nominal and Real Hourly Earnings, U.S. Nonsupervisory Workers
in the Private Sector, 1980-2006

Copyright © 2009 Pearson Education, Inc. 2- 8
Figure 2.5: The Markets in which Firms Must Operate
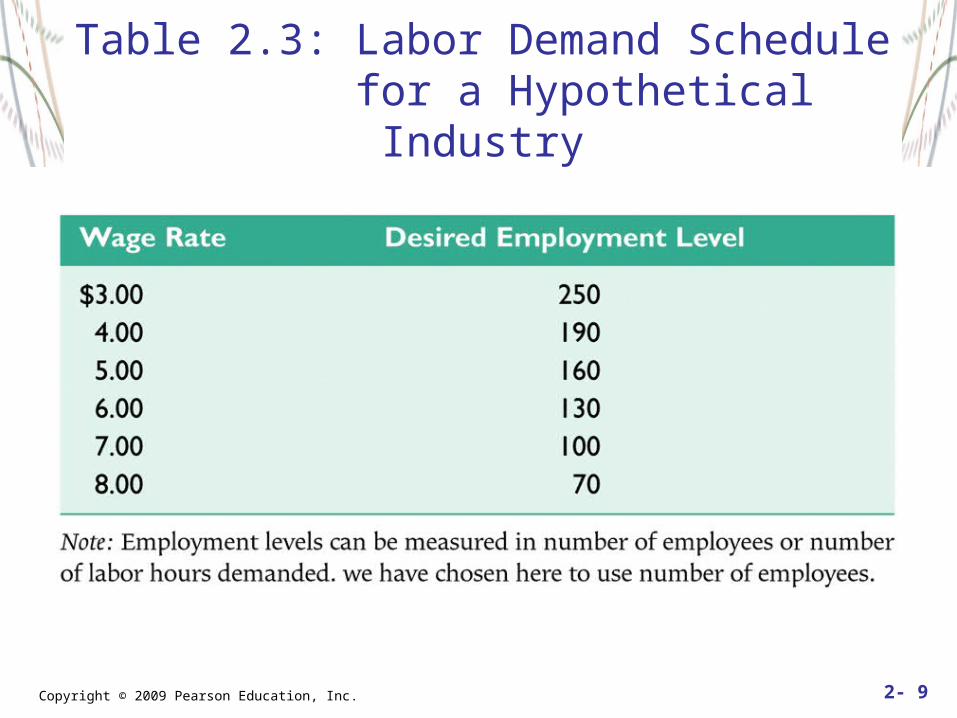
Copyright © 2009 Pearson Education, Inc. 2- 9
Table 2.3: Labor Demand Schedule for a Hypothetical Industry

Copyright © 2009 Pearson Education, Inc. 2- 10
Figure 2.6: Labor Demand Curve (based on Table 2.3)

Copyright © 2009 Pearson Education, Inc. 2- 11
Figure 2.7: Shift in Demand for Labor Due to Increase in Product Demand
Copyright © 2009 Pearson Education, Inc. 2- 12
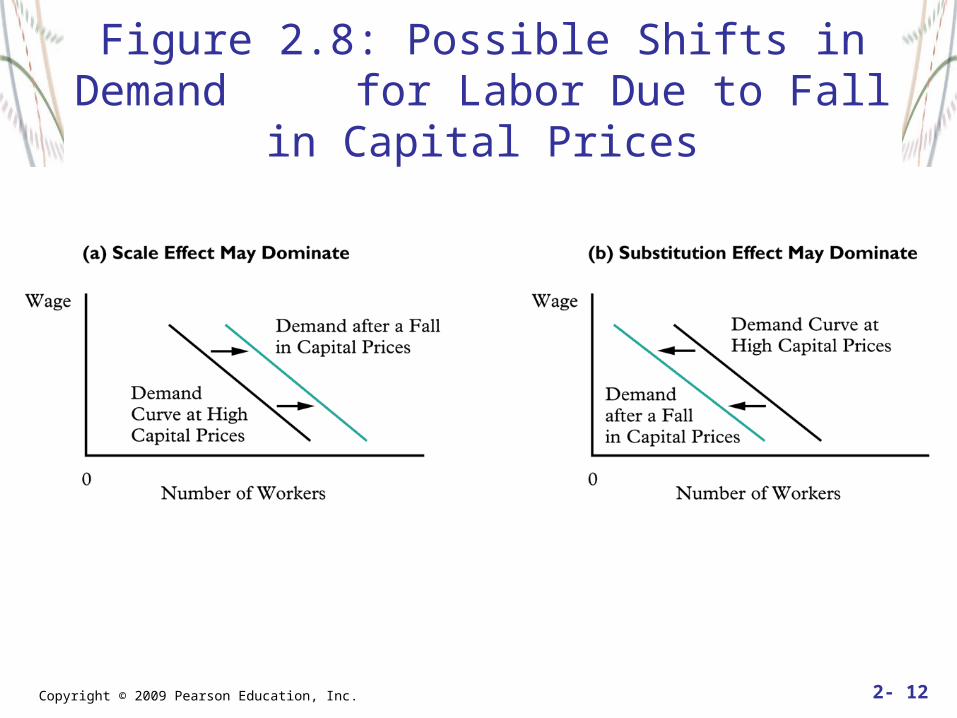
Figure 2.8: Possible Shifts in Demand for Labor Due to Fall in Capital Prices
Copyright © 2009 Pearson Education, Inc. 2- 13
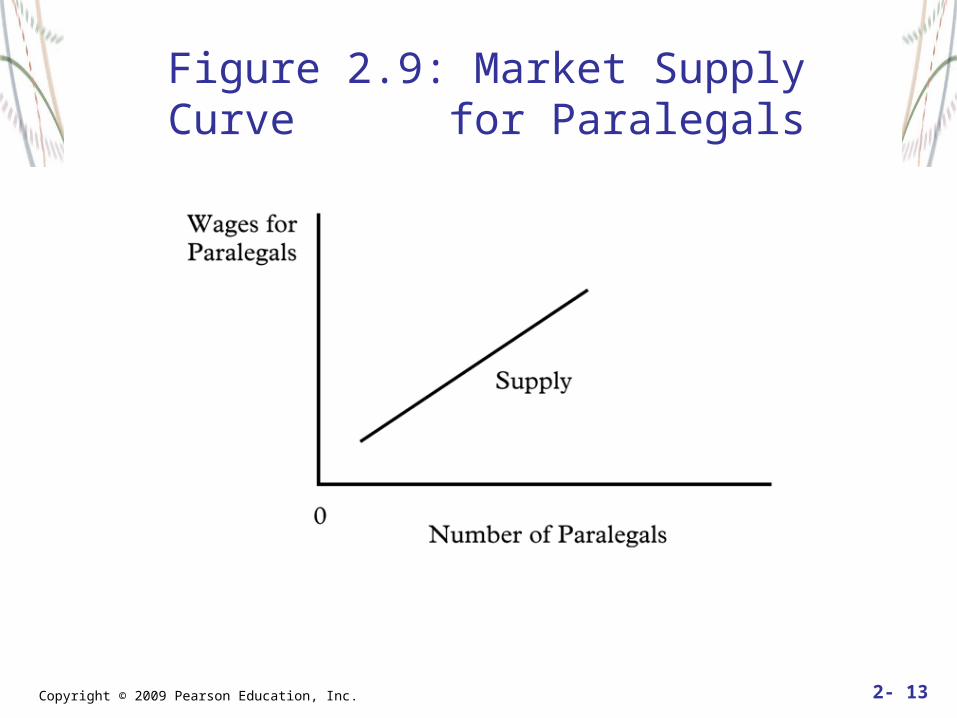
Figure 2.9: Market Supply Curve for Paralegals
Copyright © 2009 Pearson Education, Inc. 2- 14
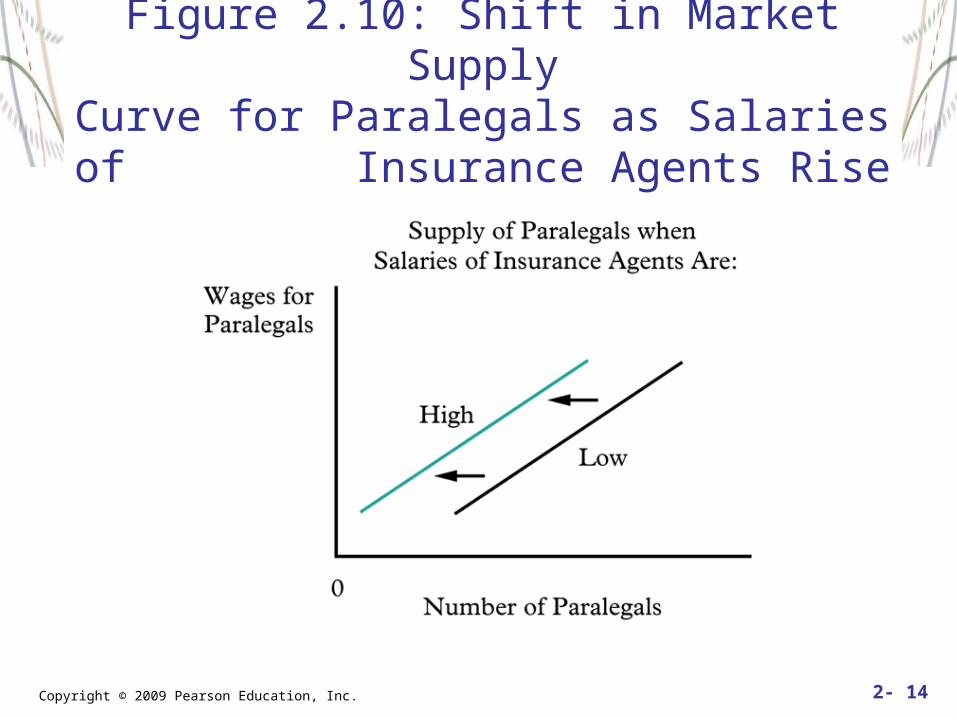
Figure 2.10: Shift in Market SupplyCurve for Paralegals as Salaries of
Insurance Agents Rise

Copyright © 2009 Pearson Education, Inc. 2- 15
Figure 2.11: Supply of Paralegals to a Firm at Alternative Market Wages

Copyright © 2009 Pearson Education, Inc. 2- 16
Figure 2.13: Demand and Supply at the “Market” and “Firm” Levels

Copyright © 2009 Pearson Education, Inc. 2- 17
Figure 2.12: Market Demand and Supply
Copyright © 2009 Pearson Education, Inc. 2- 18
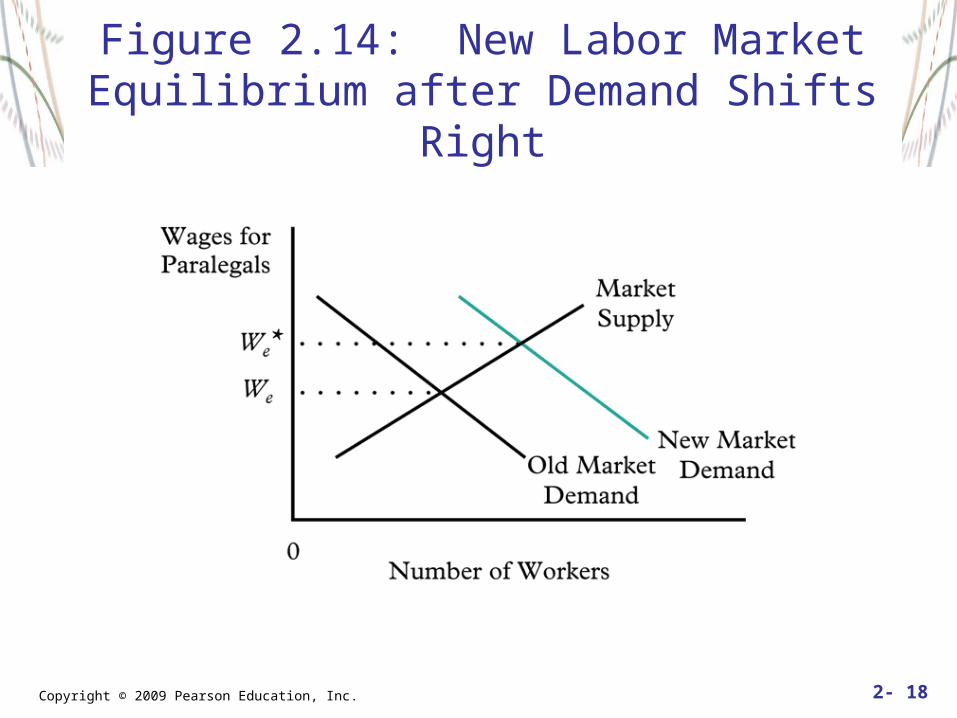
Figure 2.14: New Labor Market Equilibrium after Demand Shifts Right
Copyright © 2009 Pearson Education, Inc. 2- 19
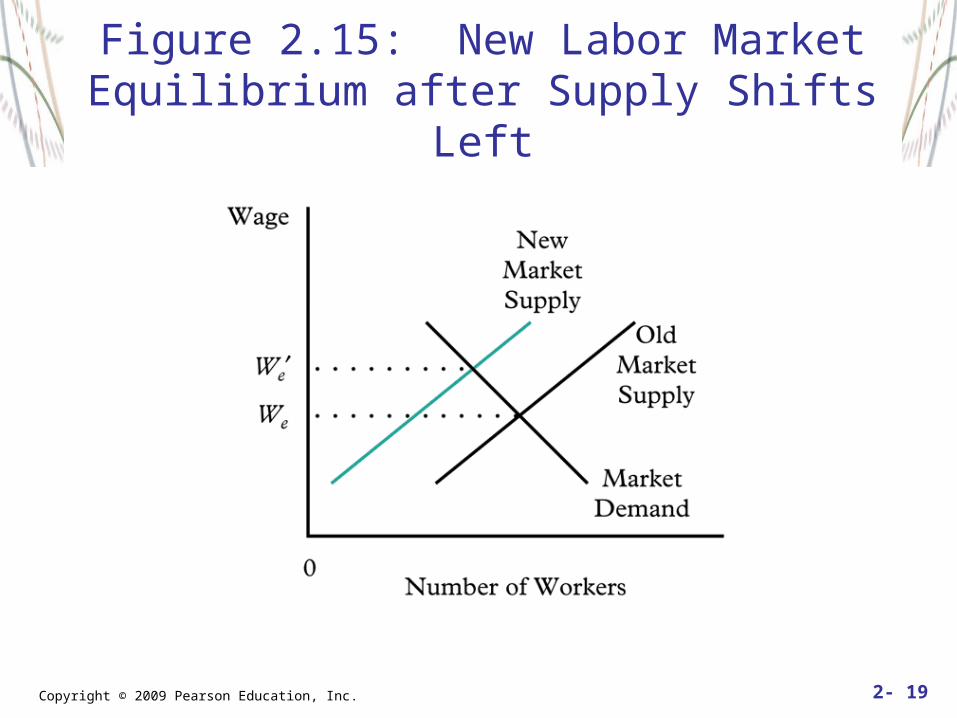
Figure 2.15: New Labor Market Equilibrium after Supply Shifts Left

Copyright © 2009 Pearson Education, Inc. 2- 20
Figure 2.16: New Labor Market Equilibrium after Supply Shifts Right
Copyright © 2009 Pearson Education, Inc. 2- 21
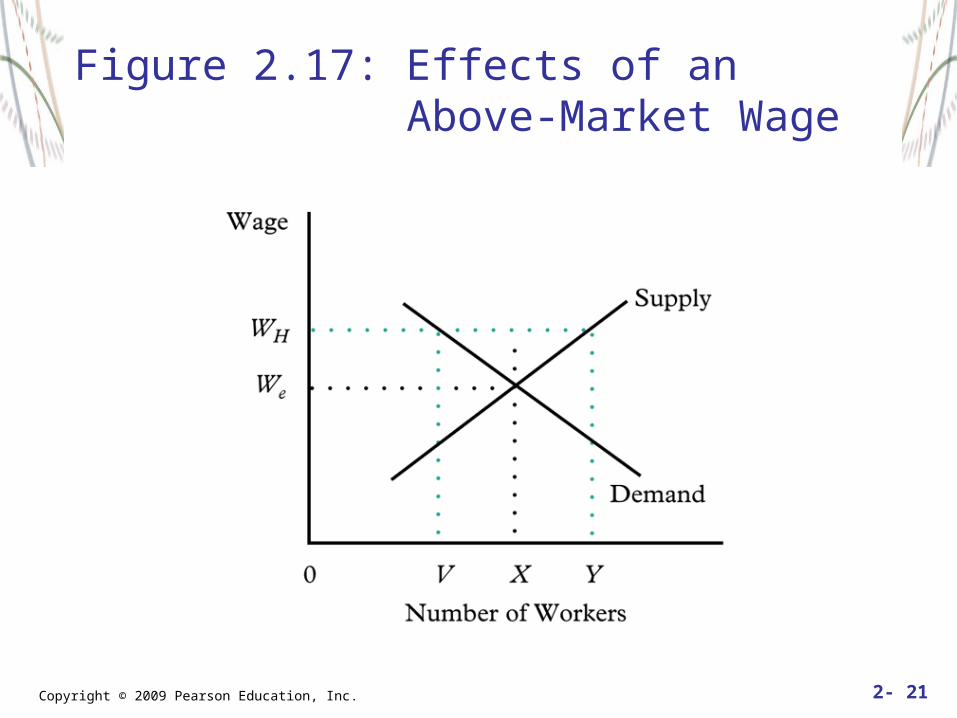
Figure 2.17: Effects of an Above-Market Wage
Copyright © 2009 Pearson Education, Inc. 2- 22
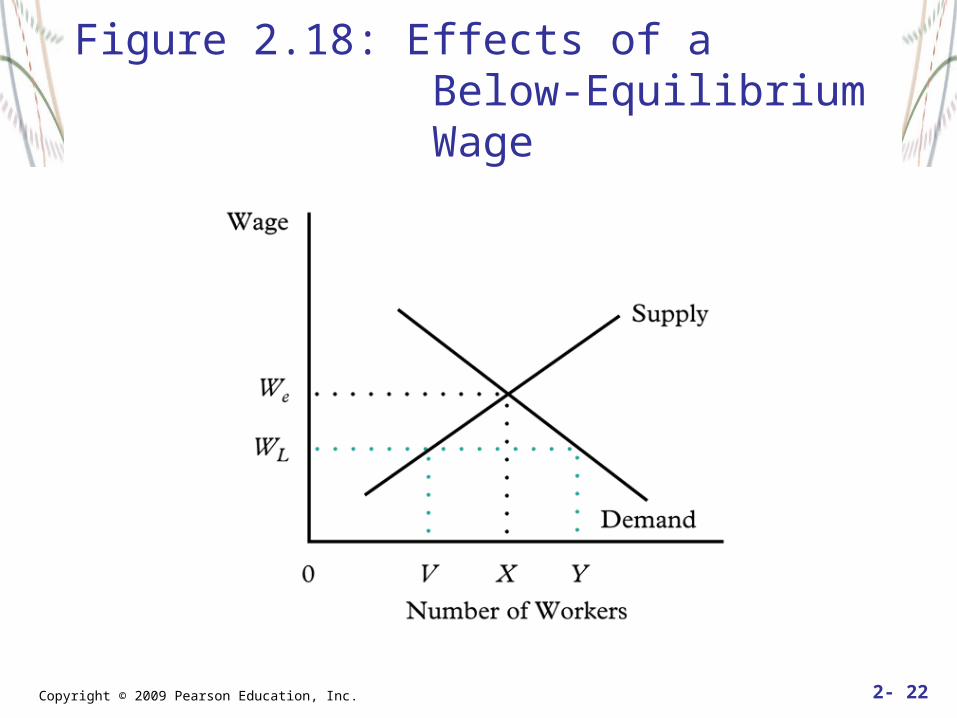
Figure 2.18: Effects of a Below-Equilibrium Wage

Copyright © 2009 Pearson Education, Inc. 2- 23
Figure 2.19: Labor Supply to the Military: Different Preferences Imply
Different “Rents”