Copyright © 2008, SAS Institute Inc. All rights reserved. RMS Titanic: Using SAS Enterprise Guide...
12
Copyright © 2008, SAS Institute Inc. All rights reserved. RMS Titanic: Using SAS Enterprise Guide To Report On A Tragedy Matt Malczewski, SAS Canada
-
Upload
eustace-lee -
Category
Documents
-
view
213 -
download
0
Transcript of Copyright © 2008, SAS Institute Inc. All rights reserved. RMS Titanic: Using SAS Enterprise Guide...

Copyright © 2008, SAS Institute Inc. All rights reserved.
RMS Titanic: Using SAS Enterprise Guide To Report On A TragedyMatt Malczewski, SAS Canada

Copyright © 2008, SAS Institute Inc. All rights reserved.
Agenda
How to move data into the Enterprise Guide environment
How to generate reports in EG (List Data and Summary Tables)
How to format the reports
All of this will be accomplished through demonstration

Copyright © 2008, SAS Institute Inc. All rights reserved.
More Britons than Americans died on Titanic 'because they queued‘
Source: http://www.independent.co.uk/news/world/australasia/more-britons-than-americans-died-on-titanic-because-they-queued-1452299.html
Did social propriety contribute to loss of life?
Proposed in article: Americans 8.5% more likely to survive, women had a 51.7% better chance of survival, women with children had a 74% better chance

Copyright © 2008, SAS Institute Inc. All rights reserved.
Can We Explore The Data?
Titanic passenger list data is publicly available
Key variables: pclass, survived, countryorigin, sex
Violation of assumptions (chi-square)• Missing values in data set
• Doesn’t account for Titanic staff

Copyright © 2008, SAS Institute Inc. All rights reserved.
Using Enterprise Guide

Copyright © 2008, SAS Institute Inc. All rights reserved.
Importing the Data: Demo
Overview of the Enterprise Guide environment
Moving An Excel file into the environment
Formatting columns and setting parameters

Copyright © 2008, SAS Institute Inc. All rights reserved.
List Data (PROC PRINT): Demo
Produces a simple list report of all data
Running the list
Formatting the list

Copyright © 2008, SAS Institute Inc. All rights reserved.
Table Analysis (PROC FREQ): Demo
Performing crosstabulations
Discovering levels of significance (Chi-square)
Country vs. Sex
Country vs. Survived

Copyright © 2008, SAS Institute Inc. All rights reserved.
Summary Tables (PROC TABULATE): Demo
Most powerful of the EG reporting tasks
Using the Wizard
Setting the variables

Copyright © 2008, SAS Institute Inc. All rights reserved.
Analyzing & Formatting the Summary Table: Demo
Statistics
Heading Properties
Box Area Properties
Table Properties
Class Level Properties
Data Value Properties
Copyright © 2008, SAS Institute Inc. All rights reserved.
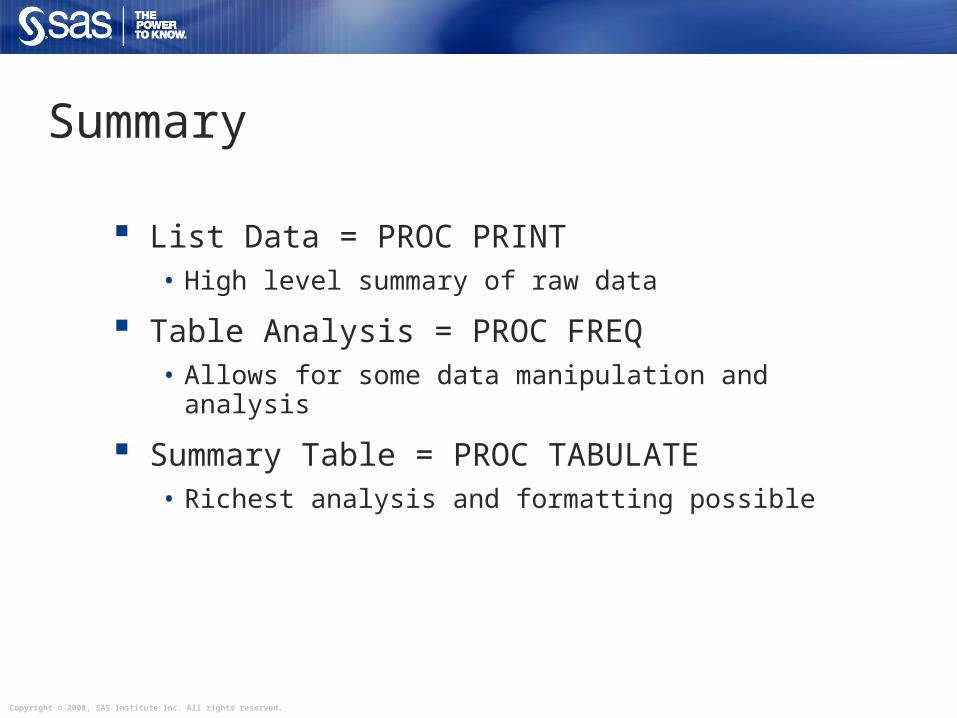
Summary
List Data = PROC PRINT• High level summary of raw data
Table Analysis = PROC FREQ• Allows for some data manipulation and analysis
Summary Table = PROC TABULATE• Richest analysis and formatting possible

Copyright © 2008, SAS Institute Inc. All rights reserved.Copyright © 2008, SAS Institute Inc. All rights reserved.
THANK YOU
Matt Malczewski
User Group Program Manager
Email: [email protected]
(416)307-5000