Copyright © 2006 by The McGraw-Hill Companies, Inc. All rights reserved. 5-1 Economic Growth:...
83
Copyright © 2006 by The McGraw-Hill Companies, Inc. All rights reserved. 5-1 Economic Growth: History, Empirics and Theory Reading: DeLong/Olney: Macroeconomics; McGraw-Hill; 2006; Chapter 5 Next week: Chapter 4
-
date post
18-Dec-2015 -
Category
Documents
-
view
214 -
download
0
Transcript of Copyright © 2006 by The McGraw-Hill Companies, Inc. All rights reserved. 5-1 Economic Growth:...

Copyright © 2006 by The McGraw-Hill Companies, Inc. All rights reserved.5-1
Economic Growth: History, Empirics and Theory
Reading: DeLong/Olney: Macroeconomics; McGraw-Hill; 2006;
Chapter 5Next week: Chapter 4

Copyright © 2006 by The McGraw-Hill Companies, Inc. All rights reserved.5-2
Questions
Modelling economic growth:
• What are the causes of long-run economic growth?
• What is the “efficiency of labor”?• What is an economy’s “capital intensity”?• What is an economy’s “balanced-growth
path”?• What is “transitory dynamics”?

Copyright © 2006 by The McGraw-Hill Companies, Inc. All rights reserved.5-3
Questions
• How important is fast population-growth as a drag on economic (real income) growth?
• How important is a high saving rate as a cause of economic growth?
• How important is technological and organizational progress for economic growth?
Copyright © 2006 by The McGraw-Hill Companies, Inc. All rights reserved.5-4
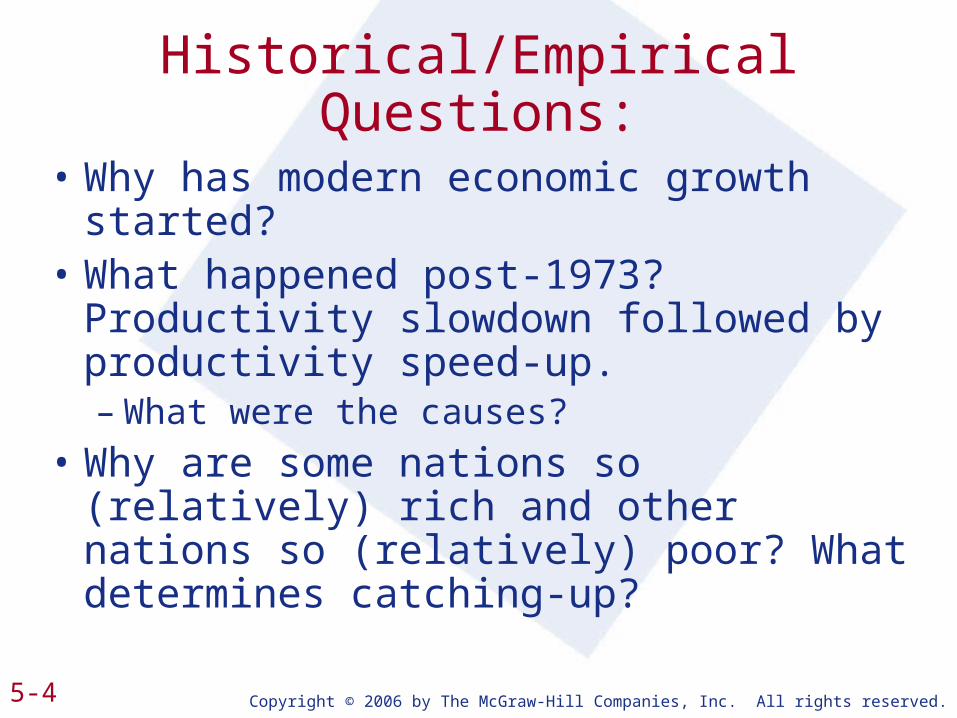
Historical/Empirical Questions:
• Why has modern economic growth started?
• What happened post-1973? Productivity slowdown followed by productivity speed-up.– What were the causes?
• Why are some nations so (relatively) rich and other nations so (relatively) poor? What determines catching-up?

Copyright © 2006 by The McGraw-Hill Companies, Inc. All rights reserved.5-5
Policy Questions
• What policies can speed up economic growth?
• What policy mistakes can slow down economic growth?

Copyright © 2006 by The McGraw-Hill Companies, Inc. All rights reserved.5-6
Modelling Long-Run Economic Growth
• We classify the factors that generate differences in productive potentials into two broad groups– differences in the efficiency of labor
• how technology is deployed and organization is used
– differences in capital intensity• how much current production has been set
aside to produce useful machines, buildings, and infrastructure

Copyright © 2006 by The McGraw-Hill Companies, Inc. All rights reserved.5-7
Long-run Economic Growth
• Y/L depends on two factors– the economy’s capital intensity (K/Y)– the efficiency of labor (E)
• The level of Y/L is therefore
t
1
t
t
t
t EY
K
L
Y

Copyright © 2006 by The McGraw-Hill Companies, Inc. All rights reserved.5-8
Before the Industrial Revolution
• Up until 1500, there had been almost zero growth of output per worker
• After 1800, we see large sustained increases in worldwide standards of living– population growth accelerated– output per capita grew

Copyright © 2006 by The McGraw-Hill Companies, Inc. All rights reserved.5-9
Table 5.1 - Economic Growth through Deep Time
Year Population (millions) Real GDP per Capita
5000 BC 5 $ 130
1000 BC 50 160
1 AD 170 135
1000 265 165
1500 425 175
1800 900 250
1900 1,625 850
1950 2,515 2,030
1975 4,080 4,640
2000 6,120 8,175

Copyright © 2006 by The McGraw-Hill Companies, Inc. All rights reserved.5-10
Figure 5.1 - World Population Growth since 1000
Copyright © 2006 by The McGraw-Hill Companies, Inc. All rights reserved.5-11
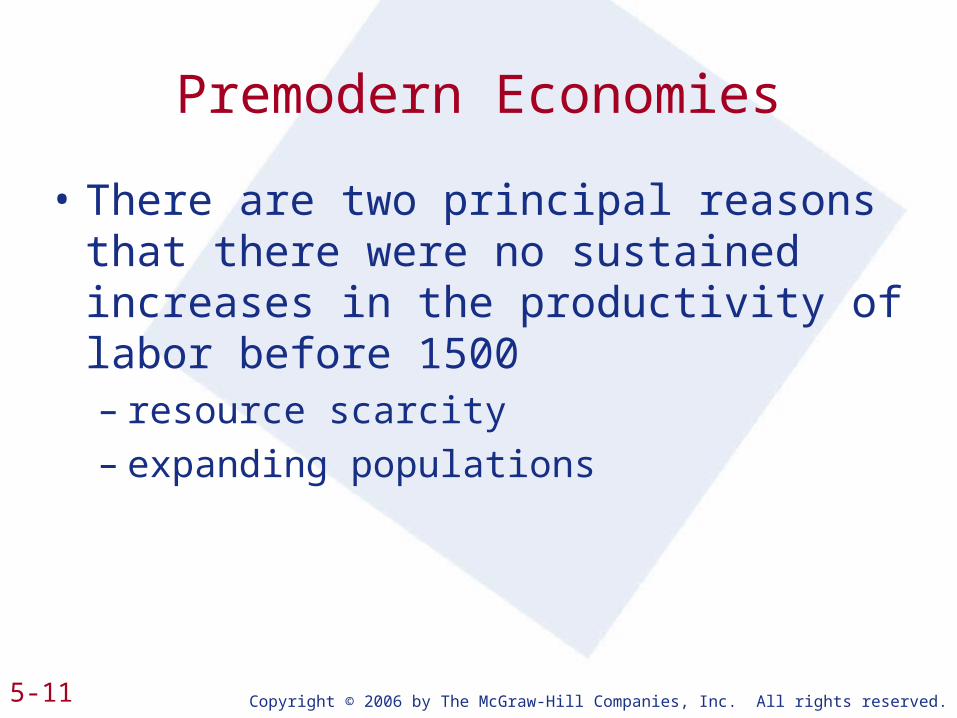
Premodern Economies
• There are two principal reasons that there were no sustained increases in the productivity of labor before 1500– resource scarcity– expanding populations

Copyright © 2006 by The McGraw-Hill Companies, Inc. All rights reserved.5-12
Premodern Economies
• Natural resources played an important role– as populations grew, the stocks of natural
resources had to be divided among more and more people
– increases in technological capability induce increases in (human) fertility – population growth - that inevitably run into natural-resource scarcity

Copyright © 2006 by The McGraw-Hill Companies, Inc. All rights reserved.5-13
Premodern Economies
• Thomas R. Malthus (late 18th/early 19th century)
– introduced the idea that increases in technology inevitably run into natural resource scarcity• implies that increases in technology lead to
an increase in the size of the population but not to an increase in the standard of living
Copyright © 2006 by The McGraw-Hill Companies, Inc. All rights reserved.5-14
The End of theMalthusian Age
• We no longer live in a Malthusian age– for at least 200 years, new technologies
and better organizations have made improvements in the efficiency of labor possible
– these improvements have not been neutralized by natural-resource scarcity

Copyright © 2006 by The McGraw-Hill Companies, Inc. All rights reserved.5-15
The End of theMalthusian Age
• Could a Malthusian age return?– suppose that the population in the 21st
and 22nd centuries grows at the same rate it did in the 20th century (1.33%)• the population will double in 72/1.33 = 54
years
• In 200 years, there would be nearly 90 billion people on earth

Copyright © 2006 by The McGraw-Hill Companies, Inc. All rights reserved.5-16
The End of theMalthusian Age
• However, it is likely that the population explosion is almost over– the United Nations predicts that the world
population will grow from over 6 billion today to around 10 billion by 2050
– after that, the population increase may stop as birth rates have been on the decline around the world
Copyright © 2006 by The McGraw-Hill Companies, Inc. All rights reserved.5-17
The End of theMalthusian Age
• What caused the end of the Malthusian age?– the pace at which inventions occurred
increased steadily
– by about 1500, technological progress passed the point at which it could offset increased scarcity of natural resources due to population growth
Copyright © 2006 by The McGraw-Hill Companies, Inc. All rights reserved.5-18
The Demographic Transition
• As material standards of living rise far above subsistence, countries undergo a demographic transition– birth rates rise– death rates fall– birth rates fall

Copyright © 2006 by The McGraw-Hill Companies, Inc. All rights reserved.5-19
Figure 5.2 - Stylized Picture of the Demographic Transition

Copyright © 2006 by The McGraw-Hill Companies, Inc. All rights reserved.5-20
The Demographic Transition
• In the world today, not all countries have gone through their demographic transitions– Nigeria, Iraq, Pakistan, and the Congo are
projected to have population growth rates greater than 2% per year over the next generation

Copyright © 2006 by The McGraw-Hill Companies, Inc. All rights reserved.5-21
Figure 5.3 - Expected Population Growth Rates, Present-2020
Copyright © 2006 by The McGraw-Hill Companies, Inc. All rights reserved.5-23
The Industrial Revolution
• The industrial revolution began the era of modern economic growth– new technological leaps revolutionized
industries and generated major improvements in living standards
• Great Britain was the center of the industrial revolution
• Other countries followed

Copyright © 2006 by The McGraw-Hill Companies, Inc. All rights reserved.5-24
The Industrial Revolution
• The new technologies were not confined to Great Britain– they spread rapidly to western Europe
and the United States– they spread less rapidly to southern and
eastern Europe and Japan

Copyright © 2006 by The McGraw-Hill Companies, Inc. All rights reserved.5-25
Figure 5.4 - Industrialized Areas of the World, 1870

Copyright © 2006 by The McGraw-Hill Companies, Inc. All rights reserved.5-26
The Industrial Revolution
• Why did the Industrial Revolution take place in Great Britain and why did it occur around 1800?– the establishment of limited government,
security of property, and freedom of contract in Great Britain after the Glorious Revolution of 1688
– the creation of modern science and the technological tradition of sustained inquiry into how the world worked

Copyright © 2006 by The McGraw-Hill Companies, Inc. All rights reserved.5-27
Shift to American Long-Run Growth, 1800-1973
• During the late 19th century, the capital-output ratio increased greatly– the creation of railroads generated the
possibility of supplying an entire continental market from a single factory
– this encouraged investment by entrepreneurs

Copyright © 2006 by The McGraw-Hill Companies, Inc. All rights reserved.5-28
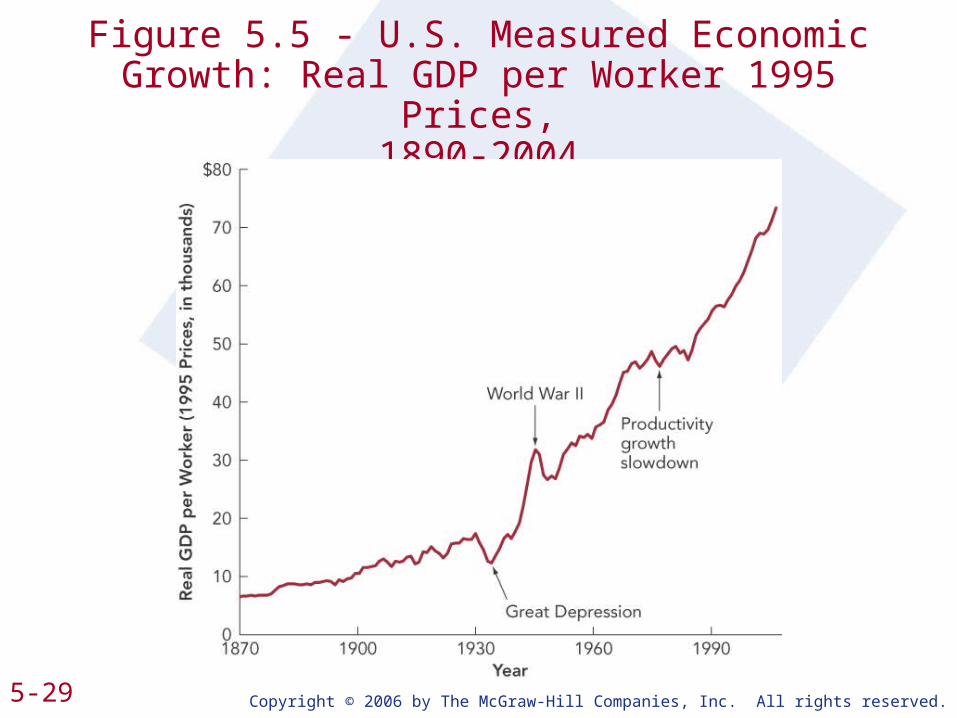
• Growth slowed slightly during the Great Depression and World War II– 1.4 percent per year from 1929 to 1950
• Growth accelerated from 1950 to 1973 (2.1 percent) – all US figures
Copyright © 2006 by The McGraw-Hill Companies, Inc. All rights reserved.5-29
Figure 5.5 - U.S. Measured Economic Growth: Real GDP per Worker 1995 Prices,
1890-2004
Copyright © 2006 by The McGraw-Hill Companies, Inc. All rights reserved.5-30
Measurement problems
• Many economists believe that official estimates of output per worker overstate inflation and understate real economic growth by 1 percent per year– national income accountants have
difficulty to value the boost to productivity and standards of living generated by new inventions (especially product innovations)

Copyright © 2006 by The McGraw-Hill Companies, Inc. All rights reserved.5-32
Factors behind Long-Run Growth, 1800-1973
• Structural changes:– a large drop in the proportion of the labor
force working as farmers occurred– new methods of travel and
communication were developed– a large number of innovative
technologies and business practices were adopted

Copyright © 2006 by The McGraw-Hill Companies, Inc. All rights reserved.5-33
US economic leadership in the 20th century
• The U.S. became the world’s leader (in terms of technology) during the 20th century because– the U.S. had an exceptional commitment
to broad-based education– the U.S. was the largest (integrated)
market in the world– the U.S. was extraordinarily rich in natural
resources– the U.S. avoided (too many) wars
Copyright © 2006 by The McGraw-Hill Companies, Inc. All rights reserved.5-34
Productivity Slowdown after 1973
• Between 1973 and 1995 measured output per worker grew in the US at only 0.6 percent per year– between 1950 and 1973, labor
productivity growth had been 2.1 percent per year
• The other major industrial economies in western Europe, Japan and Canada also experienced a slowdown in productivity

Copyright © 2006 by The McGraw-Hill Companies, Inc. All rights reserved.5-35
Table 5.3 - The Magnitude of the Post-1973 Productivity Growth Slowdown in the G-7
Economies
Output-per-Worker Annual Growth (%)
Country 1950-1973 1973-1995
United States 2.1 0.6
Canada 2.7 1.6
Japan 7.4 2.6
Britain 2.4 1.8
Germany (West) 5.7 2.0
France 4.4 1.5
Italy 4.9 2.3
Copyright © 2006 by The McGraw-Hill Companies, Inc. All rights reserved.5-36
• Suggested causes of the productivity slowdown include– the baby boom generation– the tripling of world oil prices in 1973– environmental protection measures– increased problems of economic
measurement
• The actual causes of the productivity slowdown (the weight of these factors) are still disputed

Copyright © 2006 by The McGraw-Hill Companies, Inc. All rights reserved.5-37
Figure 5.6 - Measured Real Mean Household Income in the US, by Quintile

Copyright © 2006 by The McGraw-Hill Companies, Inc. All rights reserved.5-38
Productivity Growth Speedup: The New Economy
• Since 1995, productivity growth in the U.S. has accelerated – during the second half of the 1990s it was
2.1 percent per year– in the first half of the 2000s, it is 3.8
percent per year

Copyright © 2006 by The McGraw-Hill Companies, Inc. All rights reserved.5-39
Figure 5.7 – Two-Year Growth Rates in Labor Productivity
Copyright © 2006 by The McGraw-Hill Companies, Inc. All rights reserved.5-40
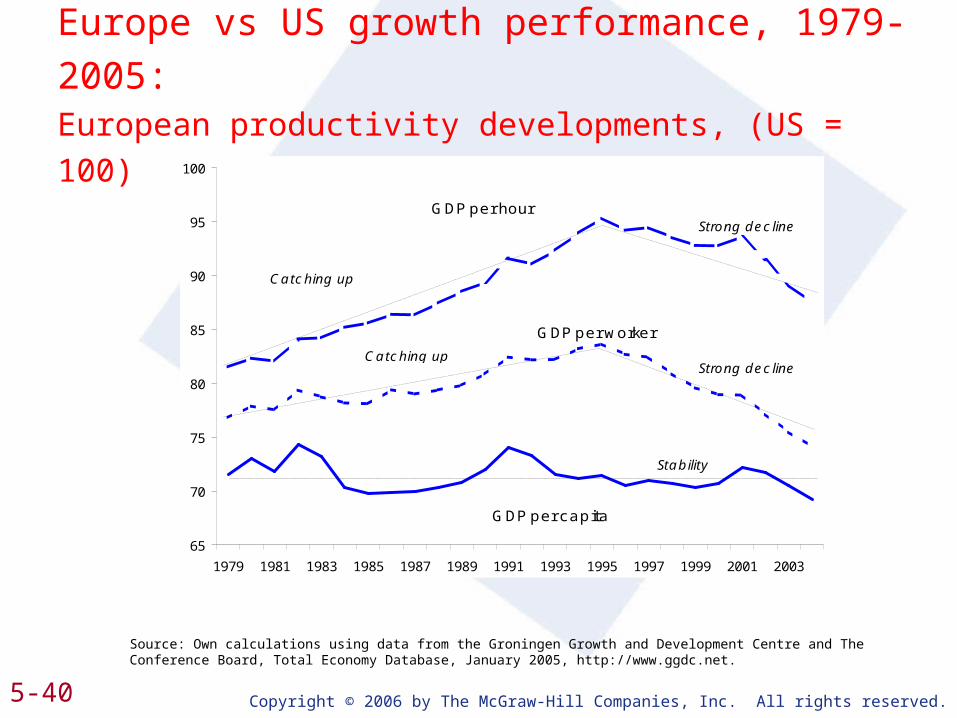
Europe vs US growth performance, 1979-2005:European productivity developments, (US = 100)
Source: Own calculations using data from the Groningen Growth and Development Centre and The Conference Board, Total Economy Database, January 2005, http://www.ggdc.net.
65
70
75
80
85
90
95
100
1979 1981 1983 1985 1987 1989 1991 1993 1995 1997 1999 2001 2003
GDP per hour
GDP per capita
GDP per worker
Catching up
Catching up fast
Strong decline
Strong decline
Stability
Copyright © 2006 by The McGraw-Hill Companies, Inc. All rights reserved.5-41
Productivity Growth Speedup: The New Economy
• Investment began rising in 1992– business fixed investment grew at almost
three times the rate of GDP• much of the additional investment has gone
to purchase computers and related equipment
• The recent acceleration in productivity growth was due to this boom in real investment

Copyright © 2006 by The McGraw-Hill Companies, Inc. All rights reserved.5-42
Productivity Growth Speedup: The New Economy
• Productivity growth continued to be quite rapid during the short recession of 2001, the uneven recovery of 2002, and the faster recovery periods of 2003 and 2004– generally productivity growth slows during a
recession– but business used investment in high-tech
equipment to continue to boost worker productivity during 2001

Copyright © 2006 by The McGraw-Hill Companies, Inc. All rights reserved.5-43
What has happened next?
• Financial turbulence• Will fast growth track be resumed?• What is the impact of globalisation?

Copyright © 2006 by The McGraw-Hill Companies, Inc. All rights reserved.5-44
Modern Economic Growth around the World
• The industrial core of the world economy experienced a large increase in its level of material productivity and living standards during the 19th and 20th centuries
• Elsewhere the growth of productivity levels and living standards was slower
• The world has become a more and more unequal place

Copyright © 2006 by The McGraw-Hill Companies, Inc. All rights reserved.5-45
Figure 5.8 - World Distribution of Income Today, Selected Countries

Copyright © 2006 by The McGraw-Hill Companies, Inc. All rights reserved.5-46
Figure 5.8 - World Distribution of Income Today, Selected Countries

Copyright © 2006 by The McGraw-Hill Companies, Inc. All rights reserved.5-47
Modern Economic Growth around the World
• Convergence processes after WWII:– a number of other countries at different
levels of industrialization, development, and material productivity a century ago have now converged
– their current levels of productivity, economic structures, and standards of living are very close to those of the U.S.

Copyright © 2006 by The McGraw-Hill Companies, Inc. All rights reserved.5-48
Figure 5.9 - Convergence among the G-7 Economies: Output per Capita as a Share
of U.S. Level

Copyright © 2006 by The McGraw-Hill Companies, Inc. All rights reserved.5-49
Modern Economic Growth around the World
• By and large, the economies that have converged belong to the Organization for Economic Cooperation and Development (OECD)– group of countries that gave or received
aid under the Marshall Plan to help rebuild or reconstruct after World War II

Copyright © 2006 by The McGraw-Hill Companies, Inc. All rights reserved.5-52
Modern Economic Growth around the World
• As the OECD countries became richer, they completed their demographic transitions
• Equilibrium capital-output ratios rose• Diffusion of technology (and
consumption patterns) from the U.S. occurred

Copyright © 2006 by The McGraw-Hill Companies, Inc. All rights reserved.5-53
Modern Economic Growth around the World
• Economic growth has not been limited to OECD countries– since World War II, several countries in
east Asia have experienced stronger growth than has ever been seen anywhere in world history
– these successful east Asian countries are somewhat similar to the OECD economies in terms of economic policy and structure

Copyright © 2006 by The McGraw-Hill Companies, Inc. All rights reserved.5-54
European Income Disparities:
GDP and GDP per capita (PPP), 2005
GDP
0
10
20
30
40
50
60
70
80
90
100
0 10 20 30 40 50 60 70 80 90 100
Ukraine BelarusRussia Albania SerbiaMacedonia Bosnia and Herzegovina TurkeyBulgaria Romania Croatia Latvia Poland Lithuania Estonia Slovak Republic HungaryCzech Republic MaltaSlovenia CyprusPortugalGreeceSpainItalyGermanyFranceFinlandSw edenBelgiumUnited KingdomIcelandNetherlandsAustriaDenmarkSw itzerlandIrelandNorw ay
EU-15 and other West European countries
CIS
NMS
ACS
GD
P p
er
ca
pi t
a
SEE
GDP

Copyright © 2006 by The McGraw-Hill Companies, Inc. All rights reserved.5-55
GDP per head, real growth annual averages 1993-2000 and 2000-2006, in percent
EU-25 countries, incl. Bulgaria and Romania
0
1
2
3
4
5
6
7
8
9
EU
-15
EU
-25
Aus
tria
Bel
gium
Ger
man
yD
enm
ark
Fin
land
Fra
nce
Uni
ted
Irel
and
Luxe
mbo
urN
ethe
rland
sS
wed
en
Spa
inG
reec
eIt
aly
Por
tuga
l
Bul
garia
Cze
chE
ston
iaH
unga
ryLi
thua
nia
Latv
iaP
olan
dR
oman
iaS
lova
kia
Slo
veni
a
EU
-15
EU
-25
Aus
tria
Bel
gium
Ger
man
yD
enm
ark
Fin
land
Fra
nce
Uni
ted
Irel
and
Luxe
mbo
urN
ethe
rland
sS
wed
en
Spa
inG
reec
eIt
aly
Por
tuga
l
Bul
garia
Cze
chE
ston
iaH
unga
ryLi
thua
nia
Latv
iaP
olan
dR
oman
iaS
lova
kia
Slo
veni
a
1993-2000 2000-2006
Source: AMECO Database

Copyright © 2006 by The McGraw-Hill Companies, Inc. All rights reserved.5-56
Growth of gross domestic product: Wider Europe
% annual change, 2006 and 2006-2020 forecasts
1.1
2.31.5
2.8
4.1
5.24.8
5.2
7.36.8
6.05.8
8.9
7.4
6.1
3.2
6.86
9.6
12.1
7.1 7
2.3
4.9
6.14.6
6.5
5.6 5.2
2.6
0
2
4
6
8
10
12
14
2003 2004 2005 2006 2006-2015
EU-15 NMS-10 Bu,Ro,Cr Turkey SEE-5 Ukraine
wiiw

Copyright © 2006 by The McGraw-Hill Companies, Inc. All rights reserved.5-57
below 10000
10000 - 15000
15000 - 20000
20000 - 25000
25000 - 30000
above 30000
Regional GDP per head at
PPS, 2005
Copyright © 2006 by The McGraw-Hill Companies, Inc. All rights reserved.5-58
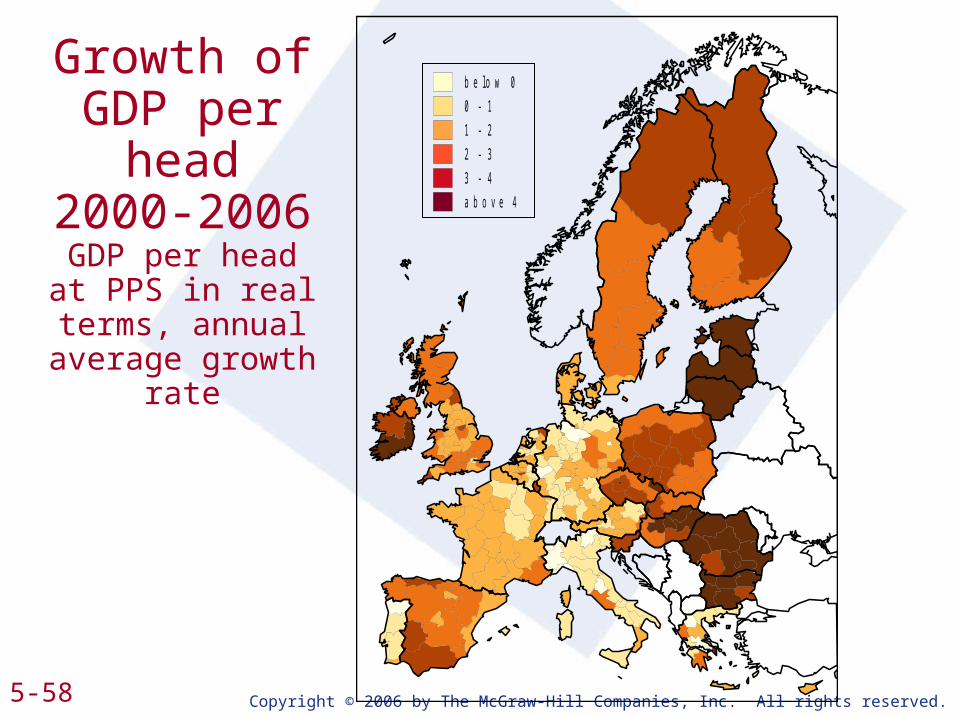
below 0
0 - 1
1 - 2
2 - 3
3 - 4
above 4
Growth of GDP per
head2000-2006GDP per head at PPS in real terms, annual average
growth rate

Copyright © 2006 by The McGraw-Hill Companies, Inc. All rights reserved.5-59

Copyright © 2006 by The McGraw-Hill Companies, Inc. All rights reserved.5-60
Modern Economic Growth around the World
• Many countries have not been so fortunate
• There has still been enormous divergence in relative output-per-worker levels over the past 100 years
Copyright © 2006 by The McGraw-Hill Companies, Inc. All rights reserved.5-61
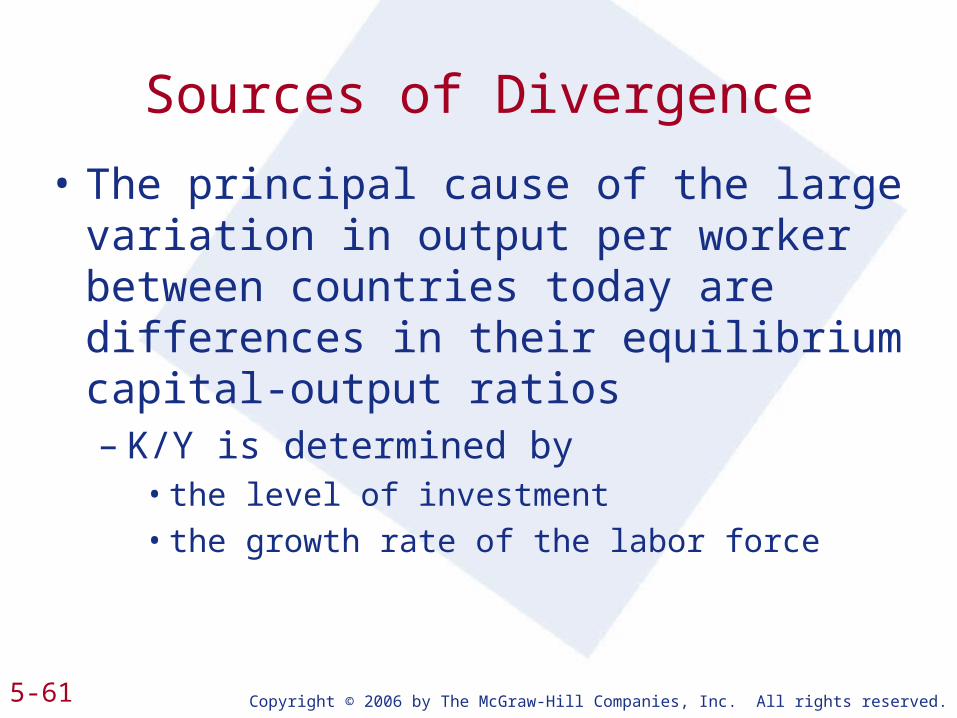
Sources of Divergence
• The principal cause of the large variation in output per worker between countries today are differences in their equilibrium capital-output ratios– K/Y is determined by
• the level of investment• the growth rate of the labor force

Copyright © 2006 by The McGraw-Hill Companies, Inc. All rights reserved.5-62
Sources of Divergence
• Two secondary causes of the large variation in output per worker between countries today are – openness to creating and adapting the
technologies that enhance the efficiency of labor
– the level of education today

Copyright © 2006 by The McGraw-Hill Companies, Inc. All rights reserved.5-63
Figure 5.10 - GDP-per-Worker Levels and Average Years of Schooling

Copyright © 2006 by The McGraw-Hill Companies, Inc. All rights reserved.5-64
Cause and Effect,Effect and Cause
• High population growth and low output per worker go together– rapid population growth reduces the
equilibrium capital-output ratio– poor countries have not undergone their
demographic transitions

Copyright © 2006 by The McGraw-Hill Companies, Inc. All rights reserved.5-65
Figure 4.12 – The Labor Force GrowthRate Matters
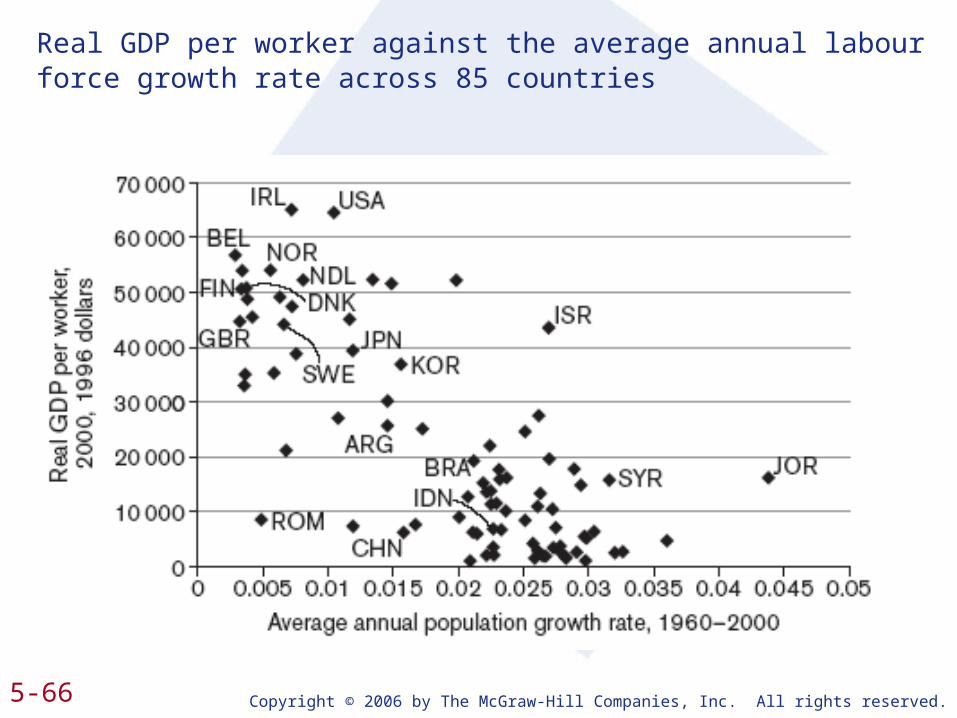
Copyright © 2006 by The McGraw-Hill Companies, Inc. All rights reserved.5-66
Real GDP per worker against the average annual labour force growth rate across 85 countries

Copyright © 2006 by The McGraw-Hill Companies, Inc. All rights reserved.5-67
Figure 4.13 - Investment Shares of Output and Relative Prosperity

Copyright © 2006 by The McGraw-Hill Companies, Inc. All rights reserved.5-68
Real GDP per worker against the average investment share across 85 countries

Copyright © 2006 by The McGraw-Hill Companies, Inc. All rights reserved.5-69
Cause and Effect,Effect and Cause
• Other vicious circles can occur– poor countries will have a high relative
price for capital equipment• this implies that poor countries get less
investment out of any given effort at saving
– good education is harder to provide in poor countries
• Setting the demographic transition in motion will offset these problems

Copyright © 2006 by The McGraw-Hill Companies, Inc. All rights reserved.5-71
Hopes for Convergence
• Differences in productivity and living standards between national economies should be eroded over time due to– world trade– migration– flows of capital– developing countries entering the
demographic transition

Copyright © 2006 by The McGraw-Hill Companies, Inc. All rights reserved.5-72
Policies for Saving, Investment, and Education
• Policies to boost saving include– ensuring that savers get a reasonable
rate of return on their savings– reducing restrictions on entrepreneurship– macroeconomic stabiltiy (inflation, gov’t
debt)

Copyright © 2006 by The McGraw-Hill Companies, Inc. All rights reserved.5-73
Policies for Saving, Investment, and Education
• Policies to boost investment for a given level of savings include– foreign investment– allowing businesses to earn and spend
foreign exchange• reducing tariffs and quotas• subsidizing investment and expansion by
businesses that successfully compete in world markets

Copyright © 2006 by The McGraw-Hill Companies, Inc. All rights reserved.5-74
Policies for Saving, Investment, and Education
• Promoting universal access to education can provide two important benefits– a better-educated workforce is likely to be
more productive– educated women will likely pursue
opportunities outside the home• the birth rate will likely fall• the demographic transition will occur more
quickly

Copyright © 2006 by The McGraw-Hill Companies, Inc. All rights reserved.5-75
Policies for Technological Advance
• Technological progress has two components– science– research and development
• amounts to about 3 percent of GDP in the U.S., Scandinavian countries and is Lisbon target

Copyright © 2006 by The McGraw-Hill Companies, Inc. All rights reserved.5-76
Policies for Technological Advance
• Businesses conduct investments in research and development to increase profit
• Research and development is a public good– other firms can copy it– patents limit the ability of other firms to
do so
Copyright © 2006 by The McGraw-Hill Companies, Inc. All rights reserved.5-77
Policies for Technological Advance
• Governments seeking to establish patent laws face a dilemma– if the patent laws are strong, much of the
modern technology in the economy will be restricted in use
– if the patent laws are weak, profits that innovators and inventors can earn will be low• pace of technological improvement will slow

Copyright © 2006 by The McGraw-Hill Companies, Inc. All rights reserved.5-79
Government Failure• Typical systems of regulation in
developing countries have retarded development by– inducing firms and entrepreneurs to
devote their energies to seeking rents– creating systems of regulation and project
approval that have become extortion machines for manufacturing bribes for the bureaucrats

Copyright © 2006 by The McGraw-Hill Companies, Inc. All rights reserved.5-80
Government Failure• Recent thinking about the proper role
of government in economic growth:– the government has a sphere of core
competencies at which it is effective• administration of justice, maintenance of
macroeconomic stability, provision of social insurance, infrastructure development, education
– governments should limit role to their core competencies

Copyright © 2006 by The McGraw-Hill Companies, Inc. All rights reserved.5-81
Summary
• Back before the commercial revolution (before 1500 or so), economic growth was very slow– populations grew at a very slow pace– there were no significant increases in
standards of living for millennia before 1500
– humanity was caught in a Malthusian trap

Copyright © 2006 by The McGraw-Hill Companies, Inc. All rights reserved.5-82
Summary
• The way out of the Malthusian trap opened about 1500– populations grew– standards of living grew– levels of material productivity grew
Copyright © 2006 by The McGraw-Hill Companies, Inc. All rights reserved.5-83
Summary
• The Industrial Revolution was the start of the current epoch: the epoch of modern growth– starting in the mid-18th century, the pace
of invention and innovation increased• key inventions replaced human with machine
power• productivity levels boomed

Copyright © 2006 by The McGraw-Hill Companies, Inc. All rights reserved.5-84
Summary
• Economic growth as described by the standard growth model– output per worker and capital per worker
increase at a pace measured in percent per year• the pace has been extraordinarily rapid in
long-term historical perspective

Copyright © 2006 by The McGraw-Hill Companies, Inc. All rights reserved.5-85
Summary
• Productivity growth rates slowed down worldwide after 1973, causing living standards to rise more slowly in the 1970s and 1980s– several explanations have been offered
for this productivity growth slowdown, but economists generally agree the causes remain a mystery

Copyright © 2006 by The McGraw-Hill Companies, Inc. All rights reserved.5-86
Summary
• Productivity growth rates sped up after 1995 and continue at this higher pace– the acceleration was due to a boom in
real investment in computers and related equipment

Copyright © 2006 by The McGraw-Hill Companies, Inc. All rights reserved.5-87
Summary
• Looking across nations, the world is an astonishingly unequal place in relative terms– the relative gap between rich and poor
nations in material productivity is much greater than it has ever been before

Copyright © 2006 by The McGraw-Hill Companies, Inc. All rights reserved.5-88
Summary
• Combining the determinants of the balanced-growth capital-output ratio with the proximate determinants (the level of technological knowledge and average educational attainment in a country after World War II) accounts for most of the variation in the relative wealth and poverty of nations today

Copyright © 2006 by The McGraw-Hill Companies, Inc. All rights reserved.5-89
Summary
• Macro policies to increase economic growth are policies to– accelerate the demographic transition
(through education)– increase savings rates– boost the amount of real investment a
country gets for a given saving rate– increase the rate of invention or
technology transfer