
COPYRHT - Productivity Commission
178
Commonwealth of Australia 1997 ISBN This work is copyright. Apart from any use as permitted under the Copyright Act 1968, this work may be reproduced in whole or in part for study or training purposes, subject to the inclusion of an acknowledgment of the source. Reproduction for commercial usage or sale requires prior written permission from the Australian Government Publishing Service. Requests and inquiries concerning reproduction and rights should be addressed to the Manager, Commonwealth Information Services, Australian Government Publishing Service, GPO Box 84, Canberra ACT 2601. Inquiries: Publications Officer Industry Commission Locked Bag 2 Collins Street East Post Office Melbourne Vic 8003 Tel: (03) 9653 2244 An appropriate citation for this paper is: Industry Commission 1997, Industry Commission Submission to the Review of Higher Education Financing and Policy, Industry Commission, Canberra, July. Forming the Productivity Commission The Industry Commission, the former Bureau of Industry Economics and the Economic Planning Advisory Commission have amalgamated on an administrative basis to prepare for the formation of the Productivity Commission. Legislation formally establishing the new Commission is before Parliament.
Transcript of COPYRHT - Productivity Commission
Commonwealth of Australia 1997
ISBN
This work is copyright. Apart from any use as permitted under the CopyrightAct 1968, this work may be reproduced in whole or in part for study or trainingpurposes, subject to the inclusion of an acknowledgment of the source.Reproduction for commercial usage or sale requires prior written permissionfrom the Australian Government Publishing Service. Requests and inquiriesconcerning reproduction and rights should be addressed to the Manager,Commonwealth Information Services, Australian Government PublishingService, GPO Box 84, Canberra ACT 2601.
Inquiries:
Publications OfficerIndustry CommissionLocked Bag 2Collins Street East Post OfficeMelbourne Vic 8003
Tel: (03) 9653 2244
An appropriate citation for this paper is:
Industry Commission 1997, Industry Commission Submission to the Review ofHigher Education Financing and Policy, Industry Commission, Canberra,July.
Forming the Productivity Commission
The Industry Commission, the former Bureau of Industry Economics and theEconomic Planning Advisory Commission have amalgamated on an administrativebasis to prepare for the formation of the Productivity Commission. Legislationformally establishing the new Commission is before Parliament.

iii
FOREWORD
The Review of Higher Education Financing and Policy offers a valuableopportunity to develop policies that will enhance the higher educationsector’s contribution to the economic and social goals of this nation.
This submission does not seek to address the many issues raised by theReview’s broad terms of reference. Rather, the Commission has elected tofocus on two fundamental issues on which it considers it can make a usefulcontribution — the appropriate role of government and the efficacy ofdifferent reform options for funding higher education.
The submission comprises three distinct sections. The Commission’s mainfindings are outlined in the first section. A detailed overview of the mainissues covered by the submission is presented in the key messages section.The appendices provide background information together with detailedassessments of different reform options and related policy issues.
The Commission is grateful for the assistance of the following members ofstaff in preparing this submission: Ian Monday, Brett Janissen, RuthThomson, Timothy Geer, Paulene McCalman and David Richardson.
The views in this submission are not necessarily shared by Gary Banks,Executive Commissioner, who is also a member of the Review Committee onHigher Education Financing and Policy. He was not directly involved in thepreparation of this submission.
W Scales AOChairman
July 1997

v
CONTENTS
Foreword iii
Abbreviations ix
Glossary xi
Main findings xv
Key messages 11 The higher education sector — a snapshot 22 What role for governments? 63 Recent reform initiatives 114 The need for further reform 135 The level and form of the public contribution for teaching 156 Administratively-based reforms 177 Market-based reforms 218 Concluding comments 28
Appendix 1 An overview of the higher education sector 31A1.1 The broad structure of the sector 31A1.2 Funding of the sector 33A1.3 Participation in higher education 37A1.4 International comparisons 42
Appendix 2 Current funding and charging arrangements 47A2.1 The Unified National System: a framework for reform 47A2.2 User charges for higher education — HECS 51A2.3 Higher education fees 53A2.4 Other higher education programs 58A2.5 Student assistance schemes 61
Appendix 3 Rationales for government involvement 63A3.1 Efficiency rationales 63A3.2 Equity rationales 80A3.3 Performance monitoring and accountability 84

SUBMISSION TO THE REVIEW OF HIGHER EDUCATION FINANCING AND POLICY
vi
Appendix 4 Private rates of return to higher education 87A4.1 A framework for examining the costs and benefits of
higher education 87A4.2 Data sources 92A4.3 The impact of different fee structures on the private rate
of return to higher education 94A4.4 Summary 104
Appendix 5 Improving the existing charge regime 107A5.1 Improving the HECS charge regime 107A5.2 Improving other aspects of the design of HECS 112A5.3 Improving institutional fee regulations 119
Appendix 6 Performance-based funding — some key issues 123A6.1 Benefits from performance-based funding 123A6.2 Performance measurement and monitoring 124A6.3 Some additional design issues 127A6.4 Principles and observations 131
Appendix 7 Competitive tendering — some key issues 133A7.1 Developing a tender process 134A7.2 Managing service providers 137A7.3 Barriers to the application of competitive tendering 138A7.4 Some broad principles 140
Appendix 8 Demand-based funding — some key issues 143A8.1 Key elements of a demand-based funding model 144A8.2 Potential implications of a demand-based approach 147A8.3 Promoting competitive outcomes in higher education 154A8.4 Approaches to equity and research funding 160
References 163
Boxes1 Key themes identified by the Review Committee 22 Some distinctive features of Australia’s higher education sector 33 Profile of higher education students: 1986 and 1996 54 What is a spillover benefit? 75 Key fee-based reforms 116 Key reforms to institutional funding arrangements 12A2.1 Educational profiles 49A2.2 Tuition fees for a Bachelor of Arts degree at selected
institutions, 1997 54

CONTENTS
vii
A3.1 Positive spillovers commonly attributed to higher education 66A4.1 Summary of the framework for estimating the IRR 91A6.1 Principles to follow in developing performance measures 127A6.2 Examples of performance-based funding from overseas 129A6.3 Principles for linking funding directly to performance 132A7.1 Competitive tendering — the UK experience 139A7.2 Some key principles to follow when applying
competitive tendering 140A8.1 The Karmel higher education scholarship proposal 146
FiguresA1.1 Commonwealth funding of higher education,
1984–85 to 1994–95 34A1.2 Commonwealth funding of higher education per student,
1983 to 1999 37A1.3 New commencements in higher education, 1983 to 1996 38A1.4 Characteristics of higher education students, 1986 and 1996 39A1.5 Share of total higher education students by broad field of study,
1986 and 1996 39A1.6 Higher education student numbers, 1983 to 1996 40A1.7 The number of foreign students enrolled in UNS institutions,
1983 to 1996 42A1.8 Expenditure on tertiary education as a share of GDP for
selected countries, by source of funds, 1993 43A2.1 Operating grant components and level of funding, 1997 48A3.1 Deviation of the background characteristics of commencing
university students from the population cohort, 1989 82A3.2 Share of taxes and government benefits by household
income quintiles, 1993–94 84A4.1 A stylised age-earnings profile 90
TablesA1.1 Sources of revenue for publicly funded institutions, 1983 to 1995 33A1.2 Commonwealth funding for higher education, 1996 and 1999 35A1.3 Expenditure on tertiary education in selected countries, 1993 44A1.4 Net enrolments in university and other tertiary education,
selected age groups, 1994 45A1.5 Foreign students enrolled in tertiary education by country,
1980 and 1993 46A2.1 Differential HECS, 1997 52A2.2 Changes to HECS repayment rates 52A4.1 Course lengths for specific degrees 93A4.2 Internal rate of return to higher education: no fees 96
SUBMISSION TO THE REVIEW OF HIGHER EDUCATION FINANCING AND POLICY
viii
A4.3 Internal rate of return to higher education: uniform HECS charge 97A4.4 Internal rate of return to higher education: differential
HECS charge 98A4.5 Indicative fee structure for over-quota domestic students 100A4.6 Internal rate of return to higher education — over-quota
‘full’ fee regime 101A4.7 Internal rate of return to higher education — cost recovery
based HECS 103A5.1 Cost recovery under differential HECS per student, 1997 110A5.2 Illustrative HECS charges at varying levels of cost recovery 112A5.3 Illustrative annual HECS repayment schedules 118A6.1 An illustrative selection of performance measures for universities 126
ix
ABBREVIATIONS
ABS Australian Bureau of Statistics
APESMA Association of Professional Engineers, Scientists andManagers, Australia
ATO Australian Taxation Office
AVCC Australian Vice-Chancellors’ Committee
CIT Canberra Institute of Technology
CSHE Centre for the Study of Higher Education
DEET Department of Employment, Education and Training
DEETYA Department of Employment, Education, Training and YouthAffairs
EFTSU Equivalent full-time student unit
GDP Gross domestic product
HEC Higher Education Council
HECS Higher Education Contribution Scheme
HEEP Higher Education Equity Program
IC Industry Commission
IRR Internal rate of return
NBEET National Board of Employment, Education and Training
NCA National Commission of Audit
NCC National Competition Council
NPV Net present value
OECD Organisation for Economic Co-operation and Development
OLA Open Learning Australia
OLDPS Open Learning Deferred Payment Scheme
PPP Purchasing power parity

SUBMISSION TO THE REVIEW OF HIGHER EDUCATION FINANCING AND POLICY
x
SCRCSSP Steering Committee for the Review of Commonwealth/StateService Provision
TAFE Technical and Further Education
UNS Unified National System
UNESCO United Nations Educational, Scientific and CulturalOrganization
VET Vocational education and training

xi
GLOSSARY
ABSTUDY Similar to AUSTUDY, but provides assistance toAboriginal and Torres Strait Islander students who are14 years of age and over. In addition to a means-tested living allowance, ABSTUDY provides a rangeof non–means tested supplementary allowances toassist with education costs.
AUSTUDY Provides means-tested income support to studentswho are 16 years of age and over for approved studyin secondary schools, TAFE colleges, approvedTAFE equivalent courses offered by private providersand higher education institutions.
Block operating grant A general grant provided to support the teaching,research and capital development activities of theunified national system institutions. The grantcomprises three main components — a teachingrelated component, a research related component (theresearch quantum) and a capital component (thecapital roll-in).
Capital roll-in A component of the block operating grant provided tosupport infrastructure development for all publiclyfunded higher education institutions under the unifiednational system. Funding allocated to individualinstitutions reflects their agreed student target loads.
Educational profile An agreement between the Commonwealth andindividual unified national system institutions,defining the institution’s broad mission andresponsibilities, and establishing its particular areas ofteaching and research activity and specified goals inareas such as capital management and equityprograms.
EFTSU (EquivalentFull-time Student Unit)
One EFTSU represents a standard annual full-timestudy workload. This represents one way of reportingthe size of an institution (ie its student load). Studentload is a standard unit against which resource inputscan be measured and is the basis of Commonwealthfunding.

SUBMISSION TO THE REVIEW OF HIGHER EDUCATION FINANCING AND POLICY
xii
Higher education In Australia, the term refers to all institutions offeringeducation and/or professional training to at least firstdegree level.
HECS (HigherEducation ContributionScheme)
The HECS was introduced by the Commonwealth in1989 as a mechanism for collecting contributionsfrom higher education students towards the cost oftheir tuition. Charges under the scheme can be paidupfront or deferred and repaid via the tax system onan income-contingent basis.
Research quantum A component of the block operating grant provided tosupport basic research activities that are separate fromthose directly linked to teaching and research training.Funds are allocated to institutions on a performancebasis having regard to an institution’s success inattracting research funding, number of publicationsand the number of higher degree researchcompletions.
Teaching component The largest component of the block operating grantprovided for teaching and research training-relatedactivities across disciplines and levels of study. Itcovers basic operating costs, including academic andgeneral salaries, minor capital works and non-salaryitems associated with teaching, such as libraries.
TAFE (Technical andFurther Education)
The public system of technical and further education,mainly offering certificates in various grades andother awards below the level of degree.
Tertiary education A term used to cover all post-secondary leveleducation. It includes both vocational education andtraining (eg TAFE) and higher education.
Unified National System(UNS)
Consists of public institutions beyond a minimum sizeof 2000 EFTSU with specific missions agreed with,and funded by, the Commonwealth Government.Institutions that are members of the unified nationalsystem receive the block operating grant for a targetstudent load based on an agreed educational profile.

xv
Main findingsw The higher education sector plays a prominent role in the intellectual, social,
cultural and economic life of the nation. In 1996, public higher educationinstitutions were involved in teaching some 634 000 students (53 000 fromoverseas). The sector spent about $2 billion on research and generated directexport revenue of about $600 million.
w Governments have an important role to play in enhancing the contribution ofthe higher education sector to the nation. The main justifications forgovernment involvement include:� supporting the generation of ‘external’ or ‘spillover’ benefits arising from
the activities of the sector;� addressing weaknesses in the capital market, which impair the capacity of
some students to finance their higher education; and� improving access and equality of opportunity, particularly for disadvantaged
students.w Given the substantial injection of public funds into higher education institutions
— some $5.4 billion in 1996 — governments also have a role and responsibilityto develop mechanisms to promote accountability and monitor theirperformance.
w Major reforms have been made to the higher education sector over the pastdecade or so. These reforms have centred around the introduction offees/charges and modifications to institutional funding arrangements. Butfundamental problems with the current policy framework remain.� The existing structure of fees: generates inequities in the treatment of
students and institutions; artificially distorts student demand; significantlyconstrains the capacity of institutions to offer students different coursepackages; and impairs the capacity of institutions to retain quality staff,maintain/improve standards and introduce innovations to teaching/researchprograms.
� The current public funding mechanism for teaching: discriminates in favourof public providers; emphasises growth in student numbers over otheraspects of service delivery (eg quality); and constrains the scope for directcompetition between educational institutions.
w Incremental reforms to the existing structure of fees and institutional fundingarrangements could alleviate some of the present shortcomings. However, theywould leave many fundamental problems unaddressed. The task of building abetter policy framework for Australia’s higher education sector requires a moreambitious reform agenda.

SUBMISSION TO THE REVIEW OF HIGHER EDUCATION FINANCING AND POLICY
xvi
Main findings (Cont’d)w To improve the performance of Australia’s higher education sector, the policy
framework must increase the exposure of institutions to competitive pressures.This will provide greater incentives for institutions to contain costs, adaptcourses to meet student needs better and to innovate. While recognising theongoing need for both public and private involvement in the higher educationsector, in essence, the reform choice is between two broad approaches —administratively-based reform or market-based reform.
w In the Commission’s assessment, the market-based approach has greater merit.Accordingly, the Commission favours the adoption of a policy framework withthe following key attributes:� a cost sharing arrangement involving public and private contributions to
meet the costs of financing higher education teaching and research training.� the split of public and private contributions should be 50:50 until more
evidence is available on the ‘spillover’ benefits of higher education.� a portable scholarship system for delivering the public contribution to the
teaching and research training functions of higher education with thefollowing features:– undergraduate scholarships allocated on a national basis to students who
satisfy the necessary eligibility criteria;– these scholarships to cover 50 per cent of course fees at accredited
institutions (perhaps with a funding cap);– a fixed number of full fee remission scholarships for postgraduate
students of exceptional ability (also allocated on a national basis); and– the scholarships to be available for accredited courses provided by
public and private higher education institutions, including equivalentTAFE courses.
� a charging system giving institutions full autonomy in setting course feeswithin a framework incorporating the following features:– all students would be able to pay fees for which they are liable upfront
or on a deferred basis;– a HECS-style income-contingent loan would be available to all students
opting to defer the payment of course fees at both public and privateinstitutions; and
– loans would attract a real rate of interest and have a repayment regimedesigned to minimise adverse effects on student’s incentives to seekemployment and income progression.

MAIN FINDINGS
xvii
Main findings (Cont’d)� the merits and feasibility of extending the scholarship and charging system
applying to higher education institutions to other TAFE courses should beaddressed.
� provision for the continued delivery of targeted equity programs, includingthe higher education equity program, the merit-based equity scholarshipscheme and AUSTUDY assistance.
� continued funding of specific (non-teaching) research through the researchquantum (but under the oversight of the Australian Research Council) andvarious selective and contestable funding mechanisms.
w In view of the significant changes associated with the adoption of a market-based approach, a transition period would be necessary to address design,operational and implementation issues. The transition will need to be carefullymanaged to avoid unnecessary costs and unwarranted delays. While a numberof alternative transitional strategies need to be explored, two possibilities wouldinvolve:� a detailed planning phase culminating in the introduction of all necessary
changes on a pre-determined date; or� progressive adoption of the main elements of a market-based approach.
w If the market-based approach is not considered appropriate, a package ofadministratively-based reforms could be introduced. It would encompasssignificant modifications to the current charging system and a progressive shiftin the orientation of the institutionally-based public subsidy towards aperformance-based funding mechanism. These reforms would yield someworthwhile gains although, in the Commission’s assessment, they are a second-best option. Equity and specific research funding arrangements wouldcorrespond to those outlined for the market-based approach.

1
KEY MESSAGES
Higher education institutions play a prominent role in the intellectual, social,cultural and economic life of nations. Their main functions include teaching,professional training and research.
Over the last decade or so there has been active debate within Australia andoverseas about the potential contribution of these institutions to economic andsocial objectives and the appropriate policy framework to apply to them.
The last major review of Australia’s higher education sector was in 1987–88. Itled to a number of significant policy changes including:
• the abolition of the binary system;• rapid growth in a progressively more diverse student intake;• the re-introduction of undergraduate fees;• greater flexibility in institutional funding arrangements; and• increased reliance on competition to fund research.
Despite these changes, there has been continuing debate about the performance ofAustralia’s higher education sector. A diverse range of issues has been canvassedincluding: the appropriate scale of the sector; the quality of entrants andgraduates; the resourcing of teaching compared with research; the appropriatelevel of public and private funding; and the merits of different fundingmechanisms. More intense competition for public funds, advances in informationand communication technologies and the growing internationalisation of thesector have produced additional challenges for service providers and policy-makers alike.
These issues and challenges are not peculiar to Australia — they are beingdebated in many countries. In response, several governments have initiated policyreviews.
Against this background, the current West Review of Australia’s highereducation sector is timely. The terms of reference for the review are wide rangingand its public nature provides scope for extensive public consultation and debate.It offers a valuable opportunity to create a policy framework that promotes amore dynamic and effective higher education sector which is better equipped tomeet future challenges.
This submission does not seek to address the many issues associated with all ofthe five key themes identified by the Review Committee (box 1). Instead, the

SUBMISSION TO THE REVIEW OF HIGHER EDUCATION FINANCING AND POLICY
2
Commission has elected to focus on two fundamental issues to which it believesit can make a useful contribution:
• the appropriate role of government and related policy issues; and• the efficacy of different reform options for the financing of higher
education.
Box 1: Key themes identified by the Review Committee
The five key themes encompass:
• the role of higher education in Australia’s society and economy, including the rolegovernments should play;
• factors affecting the demand for, and provision of, higher education over the next 10 to20 years;
• the regulatory and administrative framework for higher education — including theimplications of national competition policy principles for the sector;
• financing higher education teaching and research training — including thedetermination of the balance between private and public contributions and theassessment of the costs and benefits of different approaches to the financing of highereducation; and
• funding of higher education research.
As a backdrop to an examination of these issues, some key characteristics ofAustralia’s higher education sector are set out below.
1 The higher education sector — a snapshot
The higher education sector is a large and important sector within the Australianeconomy (box 2).
The sector comprises over 80 service providers — 36 public universities, 4 publiccolleges, 3 other public providers, 2 private universities and over 40 other privateproviders. In terms of students, funding and research, the 36 public universitiesdominate the sector. There is also a significant vocational education sector whichoffers education and training courses to a large number of post-secondarystudents.

KEY MESSAGES
3
Box 2: Some distinctive features of Australia’s higher education sector
• In 1994–95, higher education accounted for about one-quarter of the $22.6 billion spentby Australian Governments on all levels of education.
• The Commonwealth Government provided the bulk of public higher education fundingin that year — some $5.0 billion.
• Direct expenditures from non-government sources exceeded $4 billion in 1994–95.
• The main ‘outputs’ comprise teaching and research:
– in 1996, the sector had 634 000 students — 53 000 from overseas;
– in 1995, the sector spent about $2.0 billion on research — around one-quarter ofAustralia’s total research and development effort; and
– the five major fields of research on an expenditure basis in 1995 were medicaland health sciences, biological sciences, humanities, general engineering andagricultural sciences.
These service providers offer different course combinations and various levels ofqualifications and there is competition within the main sub-markets (eg betweenuniversities) and between them (eg between universities, private providers andthe vocational sector). There is also a degree of co-operation and collaboration.Examples include the development of course articulation, credit transfer andmore flexible admission arrangements, as well as the sharing of teaching andresearch infrastructure.
Sources of funds
In common with most countries, Australia has a mixed funding system involvinga combination of public and private contributions. Funding arrangements varyconsiderably across the different types of higher education institutions.
The 36 public universities are guaranteed Commonwealth funding on a rollingtriennial basis. In contrast, the teaching activities of the four public colleges arefunded on an annual contract basis. The three other public providers are partlygovernment funded. The private universities receive no direct public funding forteaching, although they compete with other institutions for government researchfunding.
Over the last 15 years or so, the main sources of revenue for Australia’s publicly-based higher education institutions have changed considerably:

SUBMISSION TO THE REVIEW OF HIGHER EDUCATION FINANCING AND POLICY
4
• the share contributed by governments has fallen from 91 per cent in 1983 to58 per cent in 1995;
• the share from student fees and charges has risen from 3 to 24 per cent; and• other income sources (eg investment income and donations) have increased
from 7 to 18 per cent of total revenue.
The Commonwealth remains the major source of funds. In 1996, it provided $5.4billion in direct funding to institutions and $0.8 billion to students via incomesupport programs.
Nearly 90 per cent ($4.7 billion) of institutional funding takes the form of a blockoperating grant. This grant includes three main components — teaching, researchand capital roll-in. The teaching and capital components are based on aninstitution’s agreed student load, while the research component is performance-based. The balance of institutional funding covers various specific areas,including equity-based programs and research programs. Institutional funding isexpected to remain largely unchanged over the period between 1996 and 1999.
The significant increase in the share of revenue accounted for by student fees andcharges reflects a number of policy initiatives:
• the application of full fees to a growing number of overseas students since1986;
• the imposition of fees on an increasing proportion of postgraduate coursessince the late 1980s; and
• the reintroduction of fees for undergraduates in 1987.
The Higher Education Contribution Scheme (HECS) used for collecting fees was,at the time of its introduction, the first income-contingent student fee mechanismin the world. From 1998, publicly-funded higher education institutions will beable to charge ‘full’ fees for up to 25 per cent of Australian undergraduatestudents, once agreed HECS funded places have been filled.
Participation in higher education
Participation in higher education in Australia has increased significantly. From1970 to 1996, the proportion of the population studying within the highereducation system more than trebled — rising from 13 to 46 persons per 1 000.
A broad profile of movements in enrolment levels and selected characteristics ofthe higher education student population for 1986 and 1996 is presented in box 3.

KEY MESSAGES
5
Box 3: Profile of higher education students: 1986 and 1996
• In the decade to 1996, total enrolments in publicly funded higher education increasedfrom around 390 000 to 634 000 (an increase of 63 per cent).
• Females accounted for 60 per cent of this increase. As a result, their share of totalstudents rose from 49 to 54 per cent over the period.
• The proportion of students studying full-time increased from 55 to 59 per cent.
• The age profile of students has changed:
– the share of the 19 and under age cohort declined from 29 to 27 per cent of thetotal;
– the share of the 20 to 24 age cohort increased from 29 to 32 per cent;
– the share of the 25 to 29 age cohort declined from 14 to 13 per cent; and
– the share of the 30 years and over cohort remained unchanged at 28 per cent.
• The proportion of students undertaking bachelor and postgraduate studies increased,while the proportion taking other award courses declined.
• The courses with the highest enrolment levels in 1996 were arts and social sciences,business, administration and economics, and science.
• Over the decade to 1996, the courses exhibiting the most rapid increases in enrolmentswere health, law and legal studies, and business, administration and economics. Theshares held by education, veterinary science and arts and social sciences fell.
• Growth in overseas student numbers — from about 16 800 in 1986 to 53 000 in 1996— exceeded that of domestic students over the period.
• About 80 per cent of all overseas students were from Asia. Around 65 per cent of thesestudents came from three countries — Malaysia, Singapore and Hong Kong.
Some international comparisons
Because of differences in higher education systems (eg structure, organisationand funding arrangements) and in government policy objectives and priorities,caution needs to be exercised in drawing inferences from internationalcomparisons. However, the latest available OECD data, for 1993, reveal:
• large variations between countries in total direct expenditure (ie public andprivate) on tertiary education as a share of GDP.– Canada and the US spent a relatively large share of their resources on
tertiary education (2.4 per cent or more of GDP).
– Japan and the UK spent less than 1 per cent of their respective GDP.
SUBMISSION TO THE REVIEW OF HIGHER EDUCATION FINANCING AND POLICY
6
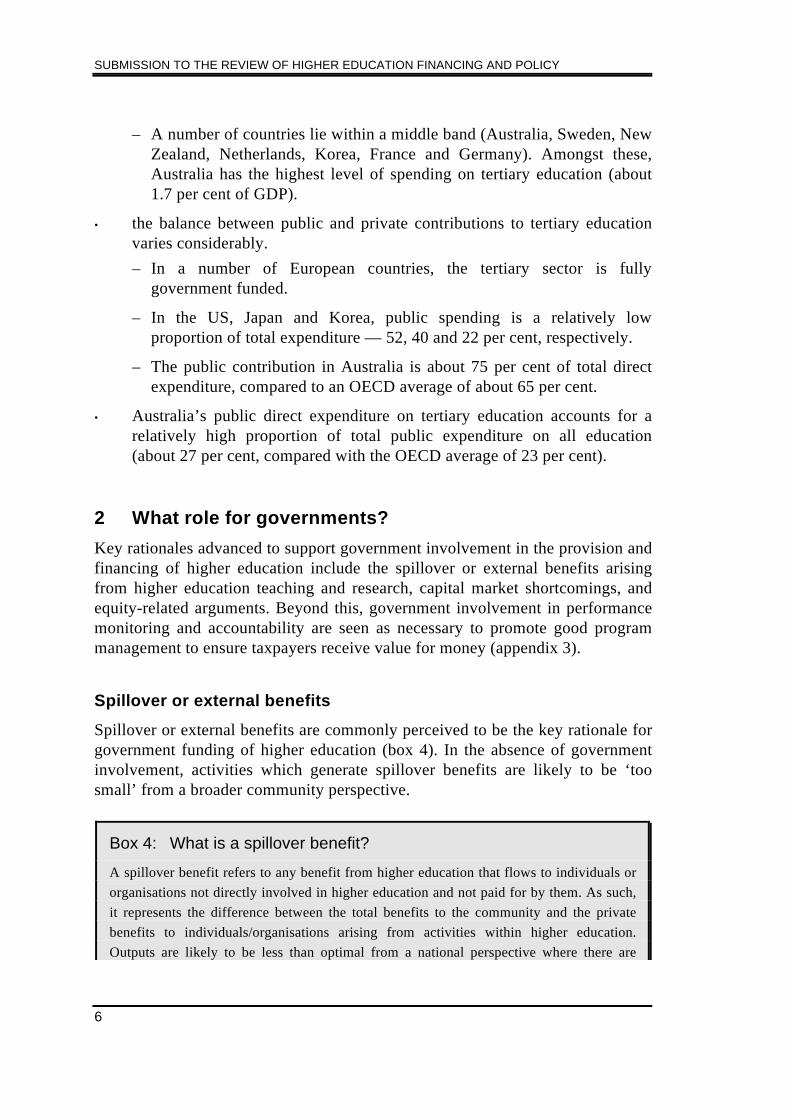
– A number of countries lie within a middle band (Australia, Sweden, NewZealand, Netherlands, Korea, France and Germany). Amongst these,Australia has the highest level of spending on tertiary education (about1.7 per cent of GDP).
• the balance between public and private contributions to tertiary educationvaries considerably.– In a number of European countries, the tertiary sector is fully
government funded.
– In the US, Japan and Korea, public spending is a relatively lowproportion of total expenditure — 52, 40 and 22 per cent, respectively.
– The public contribution in Australia is about 75 per cent of total directexpenditure, compared to an OECD average of about 65 per cent.
• Australia’s public direct expenditure on tertiary education accounts for arelatively high proportion of total public expenditure on all education(about 27 per cent, compared with the OECD average of 23 per cent).
2 What role for governments?
Key rationales advanced to support government involvement in the provision andfinancing of higher education include the spillover or external benefits arisingfrom higher education teaching and research, capital market shortcomings, andequity-related arguments. Beyond this, government involvement in performancemonitoring and accountability are seen as necessary to promote good programmanagement to ensure taxpayers receive value for money (appendix 3).
Spillover or external benefits
Spillover or external benefits are commonly perceived to be the key rationale forgovernment funding of higher education (box 4). In the absence of governmentinvolvement, activities which generate spillover benefits are likely to be ‘toosmall’ from a broader community perspective.
Box 4: What is a spillover benefit?
A spillover benefit refers to any benefit from higher education that flows to individuals ororganisations not directly involved in higher education and not paid for by them. As such,it represents the difference between the total benefits to the community and the privatebenefits to individuals/organisations arising from activities within higher education.Outputs are likely to be less than optimal from a national perspective where there are
KEY MESSAGES
7
spillover benefits because, in assessing expected returns from higher education, thedecisions of students and organisations typically only reflect the private benefits and costswhich they will enjoy or bear.
It is widely accepted that the teaching function of higher education produces anumber of benefits. Examples include: the productivity enhancing effect ofeducation on graduates and employees working with — and therefore learningfrom — graduates; improved adaptability to changes in technology and theorganisation of work; wider improvements in the quality and character of society;and favourable inter-generational effects. While many of these benefits arecaptured by graduates in the form of higher wages and career advancement, someare not. From a policy perspective, the relevant benefits are those which are notcaptured by the education decisions of students.
While subject to debate, the main categories of such spillover benefits appear tobe: more favourable attitudes to growth and adaptation to change; knowledgetransmission effects; and broad improvements to the quality and character ofsociety. Because expected private returns from higher education are relativelyhigh (appendix 4), a significant proportion of students would elect to undertakehigher education even if the public subsidy was low, or even zero. Hence, manyof these spillover benefits will be captured by the community irrespective of thelevel of public subsidy.
The research function also generates spillovers. It supports the teaching functionbut, more fundamentally, it extends the stock of knowledge that can be readilydrawn on by others involved in the process of innovation. This reflects the‘public good’ attributes of much knowledge creation — its lack of appropriabilityand wide applicability.
In undertaking these teaching and research functions, higher educationinstitutions also perform an important role in establishing links to the globalteaching and research communities. These links help to reinforce the intellectualand cultural vibrancy of teachers and researchers alike, and act to communicateto the community at large ideas which have the potential to enhance communitywelfare.
These external benefits provide a strong in-principle case for governmentsubsidies to the teaching and research ‘outputs’ of the higher education sector.
Ideally, the level of government support should relate to the magnitude of thespillover benefits. However, a review of the literature covering spillover benefitsarising from the teaching and research functions of higher education institutions(appendix 3 and IC 1995), not surprisingly, indicates that there is considerableuncertainty about their overall size. The issues of how big the public subsidy to

SUBMISSION TO THE REVIEW OF HIGHER EDUCATION FINANCING AND POLICY
8
higher education should be and the appropriate form(s) of the subsidy are takenup later.
Capital market shortcomings
Another argument for government involvement in higher education rests on theview that there are significant shortcomings in the capacity of the capital marketto finance the education of individuals relative to other investments. Theseshortcomings relate to difficulties facing lenders in obtaining adequate loancollateral and risks attaching to such lending.
Human capital provides only limited collateral value for lending purposes. Whileassets such as vehicles, buildings and land can be repossessed by financiers ifrepayments are not met, the skills and knowledge acquired though educationcannot be removed from the holders of these assets. Beyond this, the largevariations in returns to education between individuals increase risk premiums.
Uncertainties concerning the repayment capacity of borrowers attach to virtuallyall loan applications — they are hardly peculiar to education. However, theinability of the lender to repossess the asset (ie the skills acquired) raises anadditional difficulty. The difficulties may be relatively minor for students withlow risk profiles (eg those in current employment, with employer support, arecord of previous academic success, wealthy parents and/or someone prepared toact as a guarantor). But financiers are likely to be reluctant to lend to others —particularly those from disadvantaged backgrounds.
A government supported student loan mechanism offers a means of responding tothis problem. In Australia, the HECS fulfils this role. The Commission considersthat the current HECS, while fundamentally sound, could be improved in anumber of ways. These are discussed later.
Equity-related arguments
Equity-related arguments for government involvement in financing highereducation centre on two main issues:
• promoting a more even distribution of income — with education being seenas a useful tool to achieve this end; and
• promoting equality of access/opportunity — students possessing thenecessary intellectual capacity should not be precluded from participatingdue to other entry barriers (eg income constraints).
It is widely agreed that there is a strong link between educational attainment andincome. In general, education significantly enhances the financial prospects of

KEY MESSAGES
9
recipients. Beyond this, education values (along with other attributes) aretransmitted via family members to future generations. Thus, parents who haveparticipated in higher education are more likely to have children who participatein higher education.
In view of this link, encouraging low income groups to undertake highereducation is seen as a means of promoting opportunities to achieve higherincome.
A number of government programs have been introduced in Australia andelsewhere to encourage increased participation by targeted equity groups inhigher education. Analyses of the impacts of these programs show only relativelysmall effects. Reviews of the relevant literature strongly suggest a need to re-assess existing policy measures and, in particular, to focus on:
• the potential for more effective outcomes from rechannelling equity/accessassistance to other parts of the education sector, such as lifting theparticipation rates of students from poorer backgrounds in the later years ofsecondary school; and
• ensuring that the design features of different income support measures,together with the fee structures and payment options for studentsparticipating in different parts of the tertiary education market, do notdistort incentives to undertake further education or create barriers toparticipation.
Analysis of the profiles of higher education students reveals that many comefrom relatively advantaged backgrounds. For example, results from the 1991population census show that over 60 per cent of higher education students camefrom households with family incomes greater than $40 000. The majority of thesestudents (56 per cent) came from households with family incomes above $60000. In the same year, the median income of Australian households was about$32 500. In 1991, families with dependent offspring aged 15 to 24 yearsattending a university had a median income of about $50 700, while those withdependent offspring in the same age group but who were not attending universityhad a median income of around $34 700.
Generally available subsidies do not effectively target equality of opportunity andaccess goals — they assist students from wealthy backgrounds, as well associally disadvantaged groups. Means-tested allowances for higher education(such as AUSTUDY) represent better equity measures. Merit-based scholarships forstudents from low socio-economic groups provide another way of addressingequity goals.
SUBMISSION TO THE REVIEW OF HIGHER EDUCATION FINANCING AND POLICY
10
Performance monitoring and accountability
Higher education institutions in many countries attract substantial public fundsfor teaching and research activities and a range of other programs — includingequity-based programs. Government investment in capital for tertiary education— buildings, equipment and land — is also substantial.
To protect taxpayer interests in these investments, governments have a role andresponsibility to monitor the performance of institutions and to hold themaccountable for their performances and the effective use of public funds.
The nature of performance monitoring and accountability mechanisms variesbetween countries. The variations reflect, amongst other things, differences in thedegree of autonomy extended to institutions, the nature of the relevant fundingmechanisms and the wider policy framework applying to higher educationinstitutions.
In Australia, the Government has acknowledged inefficiencies and weaknesses inexisting monitoring and accountability processes. A review of the existingreporting requirements is due to report to the Government this month.
The Commission considers that monitoring and accountability mechanisms forthe higher education sector should be designed having regard to several basicprinciples. They should:
• explicitly monitor outcomes against relevant policy objectives;• avoid duplication in reporting requirements across jurisdictions;• comprise reporting systems which are simple, well-focussed and cost-
effective, thereby avoiding requests for unnecessary data;• minimise impediments to institutional flexibility and autonomy; and• require that annual reports provide information which satisfies the reporting
requirements of stakeholders.
3 Recent reform initiatives
Major reforms followed the 1987–88 review of Australia’s higher educationsector, including the introduction of fees for some students and modifications tofunding arrangements.
Fee-based reforms — including some initiated prior to the 1987–88 review —broadened the range of revenue sources available to higher education institutions.They also enabled institutions to develop new markets and provided some limitedprice signals to users (box 5).

KEY MESSAGES
11
Box 5: Key fee-based reforms
• Since 1986, universities and other educational institutions have been permitted to offerplaces to overseas students at full cost. Specified minimum fees apply.
• In 1987, the prohibition on charging fees for postgraduate courses covering theupgrading of vocational skills of employed people was removed.
• Fees for domestic students studying at publicly funded higher education institutionshave been re-introduced:
– In 1987, a flat rate higher education administration charge of $250 per student peryear was introduced.
– In 1989, an annual contribution of $1 800 for each full-time student wasapplied via HECS. In announcing this initiative, the Minister forEmployment, Education and Training (Dawkins 1988a) observed:
The current arrangements for the funding of higher education are inequitable becausethe system is predominantly financed by Australian taxpayers, the vast majority ofwhom do not directly benefit from higher education.
Box 5: (Cont’d)
– In 1996, a substantial restructuring of the HECS was announced. The mainchange involved the introduction of a three band system with contribution levelsrelated to course costs and likely future benefits to students.
– From 1 January 1998, higher education institutions will be able to offer ‘full’ feepaying places to domestic undergraduates. However, they will be requiredto fill their target number of HECS places and the number of fee-paying studentswill be capped at 25 per cent of the total number of HECS-liable places in anycourse.
Reforms to institutional funding arrangements have sought to provide institutionswith greater flexibility in using public funds, enhance their capacity to plan theiractivities, make key policy objectives and priorities more explicit and — forsome programs — link funding to program performance (box 6).
Box 6: Key reforms to institutional funding arrangements
• The progressive development of a single block operating grant with funding forteaching, research and capital activities linked to the delivery of an agreed student load.This form of funding permits institutions to determine their internal use of funds.

SUBMISSION TO THE REVIEW OF HIGHER EDUCATION FINANCING AND POLICY
12
• The re-introduction of rolling triennial funding under which UNS institutions areguaranteed base-level funding for a three year period.
• The use of an ‘educational profile’ to provide a framework for specifying a fundingagreement between the Commonwealth and institutions. It sets out the institutions’broad mission and specific goals as a basis for providing funds and gaugingperformance at a broad level.
• The introduction of a performance-based system of funding for core research activities,together with the allocation of a growing proportion of research funding on acompetitive basis outside the operating grant process.
• The application of ‘performance incentives’ to a limited number of centrallyadministered programs — quality assurance, equity and research infrastructure blockgrants.
A number of reforms have also been pursued to encourage institutions to developmore flexible course offerings and to reduce barriers between the highereducation and TAFE sectors.
4 The need for further reform
While the last decade or so has witnessed some major reforms, there isconsiderable scope for further reform. This assessment reflects significant on-going problems with the current policy framework.
The structure of fees/charges
The three band HECS represents an improvement over the single rate HECS.However, significant shortcomings persist with the existing structure of fees andcharges.
• Charges as a proportion of course costs vary considerably across disciplines— from 26 per cent, on average, for agriculture to over 80 per cent for law.It is not plausible that the resultant disparate levels of subsidy match thepattern of spillover benefits from these courses. Hence, the present HECSstructure artificially distorts price relativities and may distort the pattern ofstudent demand.
• The fees faced by students for some disciplines (eg business, economics andlaw), are likely to exceed the actual cost of course delivery at somerelatively low cost institutions.
• System-wide price setting processes preclude institutions from offeringdifferent course packages to students at a range of prices. (This contrasts

KEY MESSAGES
13
with the fee autonomy extended to public institutions in relation to certainpostgraduate and overseas students.)
• The constraints placed on publicly funded higher education institutions bythe existing centrally determined HECS, coupled with announced realreductions in operating grants over the next three years, run the risk ofimpairing the capacity of institutions to retain quality staff and maintainstandards.
• The differences in fee regulations across different student groups provideincentives for institutions to develop courses and display greater innovationin the areas more lucrative for them under the constraints (ie courses foroverseas students and fee-paying postgraduate students).
• Subsidised loans available under the HECS are overly generous. In general,the subsidy is higher for high cost courses, longer courses and graduateswho take the longest period to repay the loan.
• Loan repayments applying under HECS are determined by total incomeonce thresholds are crossed, not just increases in income above thethreshold levels. As a result, they generate perverse incentives to work andpay income tax for graduates at some income levels.
• Students studying at private higher education institutions and within theTAFE system are not able to obtain access to an income-contingent loanmechanism like HECS. This is inequitable and biases student demand infavour of public higher education institutions.
• The absence, from next year, of a HECS-equivalent lending mechanism forfull-fee paying domestic undergraduates at public universities is bothinefficient and inequitable.
The central funding arrangement
There are a number of problems/weaknesses with the existing centrallydetermined subsidy delivery mechanism.
• The lack of a direct funding link between student preferences andinstitutional funding mutes competitive pressures and reduces the incentivesfor institutions to fashion courses to meet changing student demands,despite students bearing a significant share of the total costs of highereducation.
• By allocating funds on the basis of movements in student load, block grantfunding rewards growth in student numbers. Hence, institutions have littleincentive to improve quality continually because funding is assured as longas they satisfy minimum quality requirements. Recent evidence confirms

SUBMISSION TO THE REVIEW OF HIGHER EDUCATION FINANCING AND POLICY
14
some student dissatisfaction with course content and teaching methods andcriticisms by employers of graduate quality (DEETYA & OECD 1997).
• The present system distorts the operation and development of the highereducation market by supporting a funding bias in favour of publicly-basedinstitutions over private institutions. This conflicts with competitiveneutrality principles and differs from the approach adopted in relation tosecondary education.
Debate about means to alleviate these shortcomings and improve the performanceof higher education institutions has identified a variety of approaches to reform.These approaches fall into two broad categories — administratively-basedreforms and reforms which rely on market-based incentives, in concert withspecific government programs.
Two fundamental issues common to both approaches revolve around thequestions of the appropriate level of private relative to public contributions forhigher education teaching and methods for improving the cost-effectiveness ofthe public subsidy provided for teaching. These issues are dealt with in the nextsection.
5 The level and form of the public contribution forteaching
Determining the appropriate size of the public contribution for higher educationis not a straightforward exercise. As higher education produces spillover benefits,it is inappropriate to seek full cost recovery from students. Equally, however, thesizeable private benefits arising from higher education mean that it is notappropriate to seek an insignificant degree of cost recovery.
Reflecting differing views on the magnitude of relevant spillover benefits, anumber of alternative approaches could be adopted for setting the level of thepublic contribution and, hence, the level of fees/charges for higher education.One approach would be to set the public contribution at a level equivalent to theaverage gap between course costs and the average charge applying under theexisting differential HECS. On this basis, the public contribution would, onaverage, amount to about 60 per cent of course costs. This level of public fundingand associated cost recovery from students would be consistent with those whoargue that spillover benefits are probably sufficient to warrant the maintenance ofexisting funding levels (eg Karmel 1997a).
However, the size of the public contribution associated with this level of costrecovery implies large spillover benefits to higher education. While themagnitude of these benefits is uncertain, some studies suggest the public

KEY MESSAGES
15
contribution should be smaller (ie the level of cost recovery higher). Forexample:
• Pincus and Miller (1997) have argued a case for a public subsidy equal to50 per cent of direct course costs; while
• other writers, such as Brennan (1971, 1988) and Fane (1988), havesuggested that the spillover benefits of higher education are likely to berelatively small or even negligible. On this basis, a subsidy equivalent to(say) 25 per cent of direct course costs could be seen as relatively generous.
The paucity of empirical information about the level of spillover benefitsnecessarily means that assessments are a matter of judgement. Nevertheless, asoutlined in appendix 3, the current level of public subsidy appears to be ‘toohigh’ (ie the level of cost recovery ‘too low’) given:
• evidence that some of the spillover benefits arising from education areassociated with primary and secondary education, rather than beinggenerated at the tertiary level;
• that most of the claimed spillover benefits will arise anyway as a by-product of the considerable private incentives to undertake highereducation; and
• evidence that the overall demand for higher education is relativelyinsensitive to its cost and that, as a result, any subsidy will have a relativelysmall impact on participation rates. Consequently, a large part of anysubsidy represents a simple transfer of income from taxpayers to students.
In the Commission’s view, a detailed analysis of the nature and the extent ofspillover benefits associated with different types of higher education is needed toinform the policy debate. The study should also examine the price sensitivity ofstudent demand for particular courses for various classes of students. In theinterim, the Commission judges that it would be appropriate to adopt a costsharing arrangement with a 50:50 split between the public and privatecontributions to financing the direct costs of higher education courses at theundergraduate level.
The Commission considers that there is also scope to improve the costeffectiveness of the existing subsidy through better targeting. Some targeting ofthe public subsidy to higher education teaching already occurs, namely:
• no public tuition subsidy applies to overseas students;• students undertaking non-award courses and some graduate and
postgraduate courses are also subject to full fees; and• an additional or top-up subsidy via a scholarship program is provided,
mainly to research postgraduate students of exceptional ability.

SUBMISSION TO THE REVIEW OF HIGHER EDUCATION FINANCING AND POLICY
16
Other opportunities for improving the cost-effectiveness of the public subsidyneed to be pursued. Two options are to:
• apply lower subsidies, or even levy full-fees, on second degree andpostgraduate students undertaking course work on the basis that the benefitsare predominantly captured by the students; and
• introduce a penalty in the form of a loading to the relevant standard HECScharge for completion of publicly subsidised courses outside specifiedminimum time periods.
There are likely to be additional options for improving the cost-effectiveness ofthe public subsidy to higher education teaching (appendix 3). These could beexamined as part of the study, referred to earlier, on the nature and extent ofspillover benefits arising from different types of higher education.
6 Administratively-based reforms
Administratively-based reform seeks to overcome the current deficiencies whileretaining core elements of the existing policy framework. These core elementscomprise:
• an emphasis on centrally determined fees; and• a central institution-based funding system for delivering the public subsidy
to designated service providers.While reform initiatives over the last 10 to 15 years have focussed on theseelements, significant opportunities for further administrative reform exist in eachcore area.
Reforming the centrally determined structure of fees — the HECSstory
The latest differential HECS has some strengths as a mechanism for collectingprivate contributions. But the weaknesses outlined earlier significantly impair itseffectiveness.
A new basis for setting HECS
The charges within the differential HECS are intended to reflect differences incourse costs and expected future private benefits to graduates. However, attemptsto factor expected future private benefits into HECS are unlikely to yield efficientoutcomes because:

KEY MESSAGES
17
• future earnings profiles differ markedly between graduates, even withinparticular disciplines. The differences are attributed to many factors — notjust the education a graduate receives; and
• constraints on funding and competition within the current system weakenthe potential gains from linking charges to student demand for courses.
Given the lack of an objective measure of spillover benefits and the limitedcapacity of current procedures to relate HECS meaningfully to private benefitsand student demand, the key focus should be on cost recovery. The Commissionfavours a charge which is a fixed proportion of costs rather than a uniform fixeddollar charge. This would ensure that a similar proportion of cost recoveryapplies across the range of disciplines. This would distort student choice less thanthe current HECS arrangements which lead to widely varying cost recovery rates.
Improving other aspects of HECS
The efficiency and equity of the current HECS could be improved by modifyingother elements of the scheme. This would involve: introducing a capital chargeinto the cost base; reducing the interest rate subsidy; modifying the repaymentrates and introducing some diversity into the existing fee bands by allowing forsome fee differentiation between institutions (appendix 5).
• The current cost base for determining HECS charges does not include anallowance for capital maintenance or a return on the capital associated withpublicly funded universities. The absence of such an allowance provides a‘hidden’ subsidy to students, potentially distorts the consumption andproduction decisions of students and universities, and disadvantages privateinstitutions. The Commission suggests that the West Review consider themerits of including a capital charge in the cost base for HECS, including thepossibility of applying such a charge on a institution-by-institution or zonalbasis in preference to a system-wide approach.
• Currently, if students defer their HECS payments, the resulting debt isindexed to the inflation rate, but is not subject to an explicit interest charge.This provides an implicit loan subsidy to students as it only partiallyreflects the costs to the community of providing an income-contingent loan.The Commission suggests that the West Review examine the merits ofapplying a real rate of interest to HECS debt. In this context, it may beuseful to examine the student loan arrangement applying in New Zealand.
• Repayment rates applying to HECS debt are determined by total incomeonce income thresholds have been passed, not just by increases in incomeabove the thresholds. As a result, the existing repayment arrangements canhave perverse effects on students’ incentives to seek employment. To avoid

SUBMISSION TO THE REVIEW OF HIGHER EDUCATION FINANCING AND POLICY
18
this outcome, the Commission considers that the West Review shouldexamine the merits of applying a modified repayment regime to HECS.
• Current HECS charges are the same for each UNS institution. However,considerable variations exist in cost structures, resources and the extent ofcapacity utilisation between institutions. A system-wide charging regimelimits the scope for institutions to set prices which reflect these differences.The Commission considers that the West Review should examine the meritsof adopting a charge structure which provides institutions with someflexibility to set prices within the existing three (or a revised number of)price bands.
Extending HECS beyond publicly funded institutions
HECS loans are only available to students attending publicly funded highereducation institutions operating within the unified national system. This createsinequities by denying other post-secondary students wishing to defer payment offees access to an income-contingent loan mechanism. The Commission considersthat the West Review should examine the merits of offering aHECS-style student loan to all tertiary education students at accreditedinstitutions, whether they are fee-paying undergraduate students in the unifiednational system, studying at TAFE or equivalent private sector institutions, or ata private university.
Improving the existing public subsidy delivery mechanism — aperformance-based funding option
Under the existing centrally allocated block grant, institutions receive funding onthe basis of an agreed student load target and educational profile. Within thisframework, outcome-oriented performance measures only apply to some smallprograms, including quality assurance and the research quantum.
Greater use of performance funding could be made in allocating the current blockgrant. Performance-based funding represents a form of ‘managed competition’.Funding is linked to how well institutions perform in delivering specifiedoutcomes against agreed indicators. Potential advantages of such a fundingsystem over existing arrangements include:
• better clarification of desired outcomes, leading to greater transparency andstrengthened accountability;
• the identification of ‘best practice’ which can be used to reinforce betterapproaches to teaching and learning;

KEY MESSAGES
19
• the collection and reporting of performance measures which provides users— and potential users — with better information to assess the effectivenessof available services; and
• the development of performance incentives to encourage institutions tofocus on lifting their performance over time.
Any performance-based funding mechanism needs to develop indicators againstwhich to assess the performance of participating institutions. The SteeringCommittee for the Review of Commonwealth/State Service Provision hasdeveloped a generic framework for measuring performance encompassing bothefficiency and effectiveness measures. The measures recognise that serviceproviders, including those from the higher education sector, have multipleobjectives and are engaged in providing a range of services.
Interest in the use of performance indicators as a management and monitoringtool within the higher education sector is not new. The OECD has undertakenwork in this area since the late 1970s. In Australia, various reviews andcommentators have examined issues relating to performance measures, includingtheir possible use in funding mechanisms (eg Williams 1979; Linke et. al. 1984;Linke 1991; Bourke 1986; Dawkins 1988b; AVCC 1988; HEC 1996).
There are many practical issues which need to be addressed in developing andapplying performance measures, including:
• securing access to good information and data;• developing measures for dimensions of performance that are often difficult
to quantify — obvious examples include quality of teaching and value-added by the education process;
• assessing inevitable trade-offs between measures — such as quality ofoutputs and quantity and type of resources used; and
• evaluating trade-offs between using system-wide standards and allowing fordifferences between institutions attributable to product differentiation.
Based on a review of the literature and its own experience in developingperformance measures, the Commission has identified a number of broadprinciples to guide the development of a performance-based funding mechanism.These principles are discussed in appendix 6.
At present, the research quantum of the block operating grant — about 5 per centof the total grant — is subject to performance-based funding. In principle,performance funding could be extended to all of the block grant. However,greater reliance on performance funding is probably best attempted on a trialbasis for a relatively small portion of the grant — say 5 to 10 per cent. Indeed,
SUBMISSION TO THE REVIEW OF HIGHER EDUCATION FINANCING AND POLICY
20
the HEC (1996, p. 62) judged that such an approach could provide enough
leverage to have a performance enhancing effect:
... the prospect of a relatively small prize is frequently sufficient to provoke a verysubstantial response.
Experience with the performance funding arrangements for the research quantumdemonstrates the value of ‘learning by doing’. For example, in 1995, 90 per centof research quantum funds were allocated on the basis of inputs, notably thesuccess of institutions in securing competitive research grants. Criticisms of theweights used in the performance index led to more emphasis being placed onperformance in other areas — higher degree research completions andpublications (IC 1995; HEC 1996). Nonetheless, the cost-effectiveness of theperformance measures incorporated in the composite index presently used toallocate research funds is still being questioned. For instance, there appears to beconsiderable overlap between the components used to compile the index (HEC1996). On this basis, there would appear to be scope for simplifying the indexand associated reporting requirements.
Clearly, the design of an effective performance-based funding frameworkrepresents a highly challenging task. Nevertheless, where it is not feasible (or it isjudged inappropriate) to promote competition directly, performance fundingoffers an administratively-based route that can mimic some competitivedisciplines.
Within a performance-based funding mechanism it would be appropriate todistribute research funding which directly supports the teaching/training ofstudents so that it broadly reflects differences between institutions in terms oftheir discipline mix, the number of students in each discipline area and the levelof teaching (ie undergraduates, graduates and postgraduates). In line with currentpractice, other research is more likely to be effectively funded through theprovision of selective grants on a competitive basis linked to the relative meritsof different proposals and institutions (IC 1995).
7 Market-based reforms
A market-based approach to reform involves establishing direct competitionwithin the higher education sector — not because competition is an end in itself,but because it is a powerful mechanism for delivering improved performance,innovation and wider community benefits. As observed by the NCC (1997a,p. 1):
KEY MESSAGES
21
Competition contributes to achieving higher growth by helping to ensure that thecommunity’s resources — the physical environment, financial resources andpeople’s skills and ideas — are used in the most valuable way. Accordingly,Australia’s governments have taken the logical view that the disciplines imposedby effective competition, being the greatest drivers for improving productivity andencouraging innovation, need to be extended throughout all sectors of the economy... .
Deregulation and other reform initiatives directed at promoting competition havebeen applied to a wide range of activities in recent years. They have beensuccessfully applied in areas in which competition was previously thought not tobe a viable option — for instance, electricity supply, public transport,telecommunications and various social services. In primary and secondaryeducation, some Australian governments have facilitated competition byallowing public schools to accept students from outside defined catchment areasand by providing subsidies to private as well as public providers.
In a paper directed at exploring the future of our universities, Karmel (1991,pp. 39–40) observed:
Deregulation is, I believe, our best hope for a strong independent and diversesystem of universities. Five years ago I would not have argued this. But thestructural changes that have taken place since 1988 (including the elimination ofvery small institutions), the general shift towards deregulation in economic affairs,the fact that DEET has not been exercising a coordinating role and the availabilityof a mechanism for the deferment of payment of fees (HECS) have changed mymind.
... We need a differentiated system of higher education that will encourageinnovation and respond to changing needs. In such a system the successful willprosper, the less successful adapt and the system as a whole will serve its intrinsicmission to conserve, transmit and extend knowledge.
A market-oriented approach to higher education would establish a strongercustomer-supplier relationship between students and institutions. Institutionswould be empowered to offer services at prices and in quantities and qualitiesthat reflect their specific circumstances and the preferences of their students.Institutions would have greater freedom in the types of courses they offered,including their quality and prices, subject to government regulations relating toanti-competitive behaviour, course accreditation and related quality assurance.The fundamentals of such an approach to reform involve:
• mechanisms which facilitate direct competition for government funding;and
• allowing institutions to set student fees.
SUBMISSION TO THE REVIEW OF HIGHER EDUCATION FINANCING AND POLICY
22
Facilitating direct competition for government funding
As with much of the specific research funding for higher education institutions,the public subsidy for teaching and related activities could be subjected to directcompetition. In principle, it would be desirable to allow all public and privateinstitutions offering accredited tertiary education courses to compete for thepublic subsidy. Two possible mechanisms for facilitating direct competitionbetween institutions are competitive tendering and a portable scholarship system.
Competitive tendering
As with performance-based funding, part or all of the existing block funding forhigher education could be allocated via a competitive tendering process.Institutions could be asked to tender to supply new places beyond existing baselevels or, alternatively, to tender for a portion of existing base funding — say 10–20 per cent. In both cases, the tenders could be based on a rolling triennium.
This would involve a less fundamental change than may first appear to be thecase. The existing funding mechanism is, in effect, a limited form of contractfunding, where the main negotiated elements are an institution’s student load andbroader educational profile (having regard to government objectives and asystem-wide unit cost allowance).
Competitive tendering aims to employ competition directly to improve servicedelivery outcomes. The tender process and conditions in the market for highereducation drive the potential benefits from such an approach. The potentialbenefits include: better clarification of objectives and desired outcomes;improved transparency and accountability; and improved service outcomes.
The use of a competitive tendering process to fund enrolment growth within thehigher education and vocational sectors has been canvassed by NBEET (1992).And the ACT Government recently announced that, from 1998, it will operate atendering arrangement for the provision of vocational and training services worthsome $5 million. Local, interstate and possibly overseas institutions will be ableto compete for the tender.
Drawing on its recent inquiry into competitive tendering (IC 1996), theCommission has examined some key issues in applying this mechanism to highereducation institutions (appendix 7).
In principle, it would be desirable to allow private as well as public institutions toparticipate in any tendering process. Hence, the introduction of competitivetendering would require the higher education sector to address systematicallycompetitive neutrality issues to ensure that public and private providers competeon an equal footing.

KEY MESSAGES
23
Competitive tendering can yield benefits to students, institutions andgovernments alike. The potential gains are likely to be greatest for standardisedcourses for which it is relatively easy to specify and measure outcomesaccurately. While specification and measurement problems may reduce thebenefits of using competitive tendering for some non-standardised courses, thesefactors are likely to militate against the use of tendering only in isolated cases.Tender processes would need to be carefully managed to avoid creating barriersto innovation and product differentiation and to ensure that the costs of supplyingand delivering courses to students were effectively assessed.
Portable scholarships
The public subsidy could be provided to students in the form of a portablescholarship. The essence of a portable scholarship scheme is that the tuitionsubsidy is attached to the student — institutions must compete to obtain it. Thescholarship could be made directly available to the student or obtained by thestudent on admission to an institution (or on transfer between institutions). Thelatter would be administratively simpler.
The idea of directing tuition subsidies via students is not new. There is anextensive literature canvassing the merits of applying student-based fundingarrangements to education. Such arrangements are currently used as a financinginstrument for primary and secondary education in a number of countries(West 1997). In Australia, student-based funding for the higher education sectorhas been proposed by various writers (eg Karmel 1991, 1996, 1997a; NCA 1996)as a means of providing students with greater influence over the provision ofeducation services. In this context, the NCA (1996, p. 57) has observed:
The providers of education, in various organisational guises, appear to havegathered influence at the expense of consumers — students, parents and industry.The focus of education policy and delivery should be less on the providers andmore on the consumers.
The main benefits arising from a demand driven approach to financing highereducation are:
• students would have a more direct influence over the course offerings ofinstitutions; and
• public institutions would face stronger competitive pressures and be directlyrewarded for responding effectively to student preferences. This couldproduce gains in various areas, notably:– a greater variety of course offerings in terms of price/quality
combinations;
– increased stimulus to improve efficiency;

SUBMISSION TO THE REVIEW OF HIGHER EDUCATION FINANCING AND POLICY
24
– enhanced capacity to strike a better balance between revenues and costsin providing different course combinations; and
– stronger stimulus and rewards to innovation.
As with other approaches to dispensing the public subsidy, the Commissionconsiders that it would be desirable if scholarships were available for accreditedcourses at public and private higher education institutions, including equivalentTAFE courses.
The magnitude of the public subsidy to public and private institutions would becontrolled through the key design elements of the approach — the number ofscholarships offered, their value and the fee regime applying to students(appendix 8). Provision could be made to allocate undergraduate scholarships ona national basis each year to students who satisfy the necessary eligibility criteria.These scholarships could provide a partial remission of course fees — equal to 50per cent in line with the earlier proposed cost sharing arrangement. Thesescholarships could be supplemented with a further category of full fee remissionscholarships for postgraduate students of exceptional ability. Access to highereducation could be preserved at recent levels, increased or decreased bymodifying the number of scholarships made available. Funding in other areasrelating to targeted access and equity programs, specific research and otherspecific programs could continue under existing arrangements. The success of ascholarship system would be contingent upon the redesign of performancemonitoring, accountability and quality control mechanisms (in particularaccreditation arrangements) to reflect a more decentralised approach to publicfunding.
Potential problems identified by some commentators with a demand-basedapproach involve:
• the possibility that students do not have sufficient information to makeinformed choices;
• the potential for low student demand and high-cost courses to bediscontinued;
• planning difficulties and uncertainties facing institutions as a result ofvariations in student demand;
• the possibility that teaching quality and research may suffer if institutionsbecome more attuned to student demands; and
• threats to the viability of institutions that are heavily reliant on cross-subsidies generated under the current system.
KEY MESSAGES
25
These potential problems and related issues are examined in appendix 8. In theCommission’s view, while some of these points may have substance, they do notmake a demand-based approach unworkable or unattractive.
Some of the problems raise issues which are not specific to a demand-basedapproach to funding. For example, students already make choices about coursesand institutions using a variety of information sources. These information sourcesgenerally seem well suited and capable of adaptation to the needs of a demand-based approach. Similarly, course rationalisations in response to falling studentnumbers and/or rising costs of provision already occur.
If, under a demand-based approach, ‘vulnerable’ courses are considered togenerate large spillover benefits, there may be a case for additional governmentsupport to guarantee their retention in some universities (English literature,Philosophy and Aboriginal studies may be examples). On the other hand, if areduction in student load reflected uncompetitiveness due to inefficiencies orassessments about the value of a course, it may be appropriate that it no longer betaught.
The Commission considers that a system of portable scholarships represents thepreferable way of delivering the public subsidy provided for teaching andresearch related to teaching. However, in view of the significant changesassociated with the adoption of a portable scholarship system some form oftransitional arrangement would be necessary. Such an arrangement would allowcloser assessment of key design, operational and implementation issues(appendix 8).
Allowing institutions to set student fees
Centrally determined fees applying to the bulk of public students have imposedpressures on institutions to contain costs, but they are not without theirdrawbacks. In the face of tighter constraints on public funding, they limit thecapacity of institutions to maintain course quality and offer courses with varyingprice/quality attributes. In some cases, they may lead to fees above the actualcosts of delivery (this is likely to apply where existing HECS charges arerelatively close to system-wide full course costs). They also limit the adjustmentresponses available to institutions attempting to retain/attract quality staff (Milne1996; Coady 1996; Nicholls 1996).
In recent years, the fee structures applying to Australia’s public higher educationinstitutions have been partially deregulated. Institutions are now able to charge‘full’ fees to overseas students, some graduate and postgraduate students and,from 1998, over-quota (non-HECS) domestic undergraduates.

SUBMISSION TO THE REVIEW OF HIGHER EDUCATION FINANCING AND POLICY
26
Building on these initiatives and allowing public institutions to determine fees forall students is an important reform in support of the development of a moremarket-oriented higher education sector. It would introduce greater pricecompetition between institutions which would supplement competition thatwould be promoted by the use of portable scholarships. It should result in a morediverse fee structure. Fees could then reflect differences in course costs, qualitydifferentials and levels of student demand.
Concerns have been expressed that fee autonomy would allow institutions toexploit students by charging excessive prices for education services. While theseconcerns are understandable, the Commission considers that they are overstated(appendix 8). In practice, the ‘market power’ of higher education institutionswould be constrained by a number of factors including:
• in most locations, students would be able to choose between several serviceproviders and would be free to assess courses and services against the feescharged;
• advances in information and communication technologies and thecontinuing development of distance education courses would add tocompetitive pressures on service providers in city and regional centresalike; and
• the Trade Practices Act — overseen by the Australian Competition andConsumer Commission — which prohibits the misuse of market power andother forms of anti-competitive behaviour.
The fees paid by students would be offset against the value of the publiccontribution provided by the portable scholarship. Presuming a 50:50 costsharing arrangement, the undergraduate scholarships would meet 50 per cent ofthe fees of an accredited course, with a student meeting the balance of the coursefee. Those students not gaining a scholarship would be liable for the full feeapplying to their course. Students (ie scholarship recipients and non-recipientsalike) would have the option of paying their fees upfront or deferring payment. Inthis context, there would continue to be a role for a HECS-style loan arrangementto enable students to exercise a deferred payment option. However, as discussedearlier, it would be desirable to reform the interest charging and repaymentarrangements for such a loan arrangement.
8 Concluding comments
There is evidence of fundamental problems with the current policy frameworkwhich are reducing the effectiveness of the higher education sector. Change isclearly needed. But exactly where? What sort of change? How quickly?

KEY MESSAGES
27
Working within the existing policy framework, a number of reforms could beintroduced reasonably quickly:
• apply ‘full’ fees to second degrees and postgraduate course workdegrees/courses;
• introduce an explicit penalty (in the form of a loading on the relevant HECScharge) for unwarranted delays in the on-time completion of publiclysubsidised courses;
• implement the recommendations set out in the Commission’s Research andDevelopment report (IC 1995) to provide greater contestability in thefunding of university research;
• modify the announced full-fee policy for over-quota domesticundergraduates by making a HECS-style income-contingent loan availableto such students; and
• modify HECS charges by:
– setting fee bands on the basis of course costs alone;
– applying a uniform fixed proportionate charge to each course; and
– setting private contributions at a higher level than currently applies.
These reforms would improve the performance of the higher education sector.But they would leave many of the earlier identified problems unaddressed. Theresolution of these problems requires more fundamental reform. This is clearlyrecognised by some commentators, although there are different views about whatconstitutes the ‘most appropriate’ path for further reform.
The existence of differing views is not surprising. Put simply, many aspects ofhigher education policy are not straightforward. It is complicated by variousfactors.
• The existence of multiple objectives and a need to accommodate policytrade-offs.
• The absence of reasonably clear evidence in a number of important areas(eg the nature and size of spillover benefits).
• The existence of a number of approaches to reform which seem compatiblewith improved outcomes:– administratively-based reform involving significant modifications to a
central institutional-based funding, charging and regulatory regime; and
– market-based reforms involving various initiatives aimed at promotingcompetition directly and empowering students as well as institutions.

SUBMISSION TO THE REVIEW OF HIGHER EDUCATION FINANCING AND POLICY
28
• The mixed output and highly interactive nature of the higher educationsystem.
Each approach would, as at present, include a targeted equity program and handlespecific research funding through the research quantum and contestable fundingroutes.
Each approach to reform has merits and demerits. And each has differentimplications for the extent and nature of competition within the sector, the role ofstakeholders, adjustment pressures and the nature of the supporting regulatoryframework.
The Commission favours a market-based approach encompassing full feeautonomy and portable scholarships. This approach is a logical extension of thegradual deregulation route followed by successive governments since the mid1980s. It would actively promote competition within the sector, thereby creatingstronger incentives for institutions to improve efficiency and be more responsiveto student preferences. It would provide the sector with greater flexibility inadapting its resources to suit the output mix of its clients. These attributes wouldprovide a more flexible framework for institutions to respond to the challengesand opportunities created by further advances in information andcommunications technology and the growing internationalisation of teaching andresearch.
In view of the significant changes associated with the adoption of a market-basedapproach, a transitional period will be needed. The transitional period would needto be carefully managed to avoid unnecessary costs and unwarranted delays.While there are a number of approaches which could be taken, two possibilitiesinclude: the adoption of a detailed planning arrangement to prepare for theintroduction of all the necessary changes from a pre-determined date; or theprogressive adoption of the main elements of a market-based approach.
Such an approach is not unusual in complex areas of public policy making. Theadoption of a transitional arrangement would aid the process of examiningdifferent design, implementation and operational issues linked to the applicationof a full fee autonomy and portable scholarship approach.
Alternatively, a package of administrative-based reforms involving significantmodifications to the current charging system and a progressive shift to aperformance-based funding mechanism could be adopted. These reforms wouldyield some worthwhile gains although, in the Commission’s view, this approachwould be a second-best option.

31
APPENDIX 1 AN OVERVIEW OF THE HIGHEREDUCATION SECTOR
The higher education sector is a large and important sector of the Australianeconomy. In 1996, it employed 83 000 full-time equivalent staff (including26 300 teaching and research staff) and was involved in teaching 634 000students (53 000 from overseas). It spent $2 billion on research and generateddirect export revenue of $600 million.
The sector is also significant in terms of public funding. In 1994–95, highereducation accounted for about one quarter of the $22.6 billion outlaid byAustralian governments on education. The Commonwealth provides almost all ofthe government funding to the sector. In 1994–95, Commonwealth Governmentexpenditure on higher education was $5 billion or 4 per cent of total governmentoutlays. Direct expenditure from non-government sources exceeded $4 billion in1994–95.
The universities, constituting the core of the sector, are established under stateand territory government legislation (except the Australian National Universitywhich was established under Commonwealth legislation). While theseinstitutions are self-governing, significant aspects of their operation areinfluenced by governments, particularly by the Commonwealth Government.This influence is primarily exercised through accountability and reportingmechanisms and conditional payments related to the provision of public funds tothe sector.
This appendix provides a broad overview of the sector. It outlines the mainservice providers, describes funding arrangements within the sector, reports onrecent trends in participation rates and presents some international comparisons.
A1.1 The broad structure of the sector
The higher education sector has experienced profound changes over the pastdecade. The binary system was abolished in 1988, and through a series ofamalgamations, the 19 universities and 46 colleges of advanced education werereduced to the public universities of today. In addition to the 36 publicuniversities, there are 4 public colleges, 3 other public providers, 2 privateuniversities and about 40 other private providers (including theological colleges)that make up the higher education sector. Amongst these institutions, only theuniversities are authorised to award degrees.

SUBMISSION TO THE REVIEW OF HIGHER EDUCATION FINANCING AND POLICY
32
Funding arrangements differ markedly between the different types of institutions.The 36 public universities making up the Unified National System (UNS) areguaranteed Commonwealth funding on a rolling triennial basis. Outside the UNS,the 4 public colleges receive government funding on an annual contract basis tocover their teaching activities only (ie research funding is not guaranteed). Thethree other public providers are also partly funded by government. The privatelyowned and operated universities — Bond and Notre Dame — receive no directpublic funding, although they compete with the public universities for researchgrants.
Amongst the more than 80 service providers, the 36 public universities dominatethe sector in terms of student numbers and research activity. There are significantdifferences in the overall size, revenue mix and teaching/research mix of theseuniversities. For example, equivalent full-time student unit (EFTSU) numbersranged from 2 900 at the Northern Territory University to 30 700 at MonashUniversity in 1996. Total operating revenues ranged from $43 million at theUniversity of Ballarat to $579 million for the University of Sydney in 1995. Inthe same year, the Commonwealth’s contribution to total operating revenuesranged from 46 per cent for the University of Western Australia to 69 per cent forSouthern Cross University and the University of Tasmania.1
The formation of Open Learning Australia (OLA) has expanded the institutionaloptions available to students. OLA — which commenced in 1993 — offersstudents the opportunity to study university or TAFE units at home usingtelevision, radio or other media (such as the internet) to receive lectures. Coursesare very accessible; there are no entry requirements and no limits on the numberof places. OLA operates four study periods each year, as opposed to thetraditional two for campus-based study. Degrees in six courses and course workcomprising up to two-thirds of a further 12 degree courses can be obtainedthrough OLA via 21 universities. Eight TAFE colleges are involved in theprogram (ABS 1996a). Clearly, technological opportunities are changing the faceof tertiary education in Australia and are likely to have a major bearing onofferings and institutional relationships in the years to come.
Universities are also forging stronger relationships with the vocational sector,business and overseas institutions. Course articulation, credit transfer andalternative admission arrangements are bridging the gap between TAFE anduniversities. Institutions are also developing partnerships with industry in areassuch as curriculum design, teaching and assessment. New courses are also beingdeveloped in partnerships with institutions both in Australia and overseas.
1 For more information on student numbers, staff numbers, teaching and research mix and
sources of revenue by institution see DEETYA 1996a,b and 1997a.

APPENDIX 1: AN OVERVIEW OF THE HIGHER EDUCATION SECTOR
33
A1.2 Funding of the sector
The higher education sector in Australia receives a significant share of publicfunding (it was the seventh largest component of Commonwealth expenditure ongeneral public services in 1995–96). However, diversification of the funding basehas seen the proportion of total revenue provided by the CommonwealthGovernment fall from 90 per cent in 1983 to 57 per cent in 1995 (table A1.1),while revenues from the higher education contribution scheme (HECS), otherfees and charges and income from other sources have become more significant —rising from 10 per cent in 1983 to 42 per cent in 1995.
Table A1.1: Sources of revenue for publicly funded institutions, 1983 to1995 (Per cent) a
Source of revenue 1983 1990 1993 1995
Commonwealth grantsb 90 63 56 57
State governments 1 5 4 1
HECS na 12 13 12
Fees and charges 3 8 12 12
Investment income 4 5 3 4
Donations and bequests 3 2 2 1
Other sourcesc 0 4 10 13
Total 100 100 100 100
a Comprises the 36 public universities and the 4 public colleges. b Comprises recurrent funding from theDepartment of Employment, Education, Training and Youth Affairs and funding from other CommonwealthDepartments. c Comprises scholarships and prizes, funds provided by independent organisations, researchcontracts, loans, proceeds from the sale of products and assets, and other funding. na not applicable (HECS wasintroduced in 1989).Sources: Dawkins 1987; ABS 1992; DEET 1995a; and DEETYA 1997a.
Fees have applied to undergraduate courses and various postgraduate coursessince the late 1980s, while full fees have applied to a growing proportion ofoverseas students since 1986. From 1998, institutions will be able to charge feesfor up to 25 per cent of Australian undergraduate students (excluding medicine)after agreed student load targets (HECS only students) have been reached. In1995, the total operating revenue of publicly funded institutions was $7.5 billion.
In 1994–95, Commonwealth and State government funding for higher educationtotalled $5.4 billion. Of this, the Commonwealth outlaid a little over $5 billion,with most going directly to institutions and students. The rest was in the form ofspecific payments to the states and territories (figure A1.1). Part of the directfunding to institutions includes payments from the Higher Education Trust Fund

SUBMISSION TO THE REVIEW OF HIGHER EDUCATION FINANCING AND POLICY
34
(HECS contributions and associated earnings) of about $1.2 billion. TheCommonwealth also provided about $785 million in 1994–95 for studentassistance through programs such as AUSTUDY and ABSTUDY. Beyond this,about 20 per cent of bachelor and higher degree students receive employersupport for their education.
Figure A1.1: Commonwealth funding of higher education, 1984–85 to1994–95 ($m, 1994–95 prices)
0
1 000
2 000
3 000
4 000
5 000
6 000
1984
-85
1985
-86
1986
-87
1987
-88
1988
-89
1989
-90
1990
-91
1991
-92
1992
-93
1993
-94
1994
-95
Total outlays (incl. grants)
Total grants
$ milliona
b
a Total outlays include payments to the institutions for teaching and research, payments from the HECS TrustFund, specific purpose payments to the States and Territories, and payments to students underAUSTUDY/ABSTUDY. b Total grants refer to grants from the Commonwealth to State and TerritoryGovernments.Sources: ABS 1991, 1996b,c.
In addition to specific purpose payments from the Commonwealth, the States andTerritories contributed $360 million in 1994–95. This was mostly funding forcapital purposes. Further, both levels of government provide implicit subsidies tothe sector in various ways including through tax exemptions and by exemptinginstitutions from meeting a rate of return requirement.
In 1996, the Commonwealth provided assistance totalling $6.2 billion to highereducation institutions and students. Of this, $5.4 billion was provided directly toinstitutions (DEETYA 1996c), mainly through an operating grant for teaching,research and capital-related activities (table A1.2). A similar level of funding isproposed for 1997, 1998 and 1999.

APPENDIX 1: AN OVERVIEW OF THE HIGHER EDUCATION SECTOR
35
Table A1.2: Commonwealth funding for higher education, 1996 and 1999a
Activity/area 1996 Shareof total
1999b Share of total
$m % $m %
Operating grants
Teaching (approx)c 4 247.6 4 307.0
Research quantum 218.6 213.8
Capital roll-in 253.0 255.7
Subtotal 4 719.2 88.1 4 776.5 88.7
Other operating grants
Superannuation 102.0 102.0
Higher Education Innovation Program 67.2 0
Higher Education Equity Program 5.3 0
Otherd 25.9 32.1
Subtotal 200.4 3.7 134.1 2.5
Other research programs
Grants 121.8 2.3 126.7 2.4
Othere 263.8 4.9 306.1 5.7
Other funding
Open Learning Initiative 12.6 0.2 0.2 0.0
Capital program 36.9 0.7 37.6 0.7
Other institutional fundingf 1.8 0.0 1.3 0.0
Total Institutional Grants 5 356.6 100.0 5 382.6 100.0
a Includes funding provided to UNS institutions and the four public colleges. b Estimated 1997 outturn prices,(ie prices in 1997 terms, adjusted for expected inflation). c Includes payments from the HECS Trust Fundamounting to approximately $1 billion. d Includes items such as advance engineering centres, teaching hospitalgrants and student unions. e Includes Australian postgraduate awards, research fellowships, researchinfrastructure and special research centres and key centres. f Includes evaluations and investigations, and fundingfor programs to inform school children and some adults about constitutional, civic and citizenship issues.Source: DEETYA 1996c.
The Commonwealth also provides funding for other education programs andcompetitive research grants (to both public and private institutions). Whilefunding for teaching activities is distributed on a centrally determined targetedstudent load basis, specific research funding is performance-based (see appendix2 for details). In 1996, nine universities received about 70 per cent of the totalspecific research funding from the operating grant (the research quantum).2
2 The nine universities were: Melbourne; Sydney; New South Wales; Queensland; Monash;
Adelaide; Western Australia; Australian National University; and Flinders.

SUBMISSION TO THE REVIEW OF HIGHER EDUCATION FINANCING AND POLICY
36
Besides the research quantum, a further $385.6 million was available for researchfunding in 1996 (table A1.2). Institutions were eligible to receive $309 million ofresearch funding (most of it performance-based), and $76.6 million was availableto postgraduate students via the Australian Postgraduate Awards.
In real terms, Commonwealth institutional expenditure on higher education(including inter-governmental grants) increased by 65 per cent from 1984–85 to1994–95 (an average growth rate of about 5.7 per cent per year). Much of thisincrease reflected the rapid expansion of the sector. However, funding on a perstudent basis also increased, but at a much slower rate (figure A1.2). From 1990to 1996, funding for each student increased at a rate of about 1 per cent each yearafter declining in the period 1983 to 1989. However, from 1996 to 1999, totalinstitutional funding (on a target load basis) per student will remain relativelystable.
Figure A1.2: Commonwealth funding of higher education per student,a
1983 to 1999b (estimated 1997 outturn prices)
10 000
10 500
11 000
11 500
12 000
12 500
13 000
13 500
1983 1984 1985 1986 1987 1988 1989 1990 1991 1992 1993 1994 1995 1996 1997 1998 1999
Operating grant
Total institutional funding
$
a Equivalent full-time student unit. b Forward estimates for 1997 to 1999 inclusive.Source: DEETYA (requested data).
A1.3 Participation in higher education
Total students
Following the completion of secondary schooling (year 12), students can enterthe labour force, undertake university or other tertiary study, or combine the two.

APPENDIX 1: AN OVERVIEW OF THE HIGHER EDUCATION SECTOR
37
Other persons can undertake tertiary study as ‘mature age’ entrants. In 1996,77 400 students who completed secondary schooling in the previous year,commenced study at higher education institutions. In the same year, the intake ofother students was about 183 800.
The total number of students commencing higher education courses has increasedstrongly since 1983 (figure A1.3). However, it appears that more school-leaversare choosing to defer university studies. Reflecting this, the proportioncommencing at university from the 19 and under age group declined from 43 to36 per cent from 1987 to 1996. Although about 40 per cent of studentscommencing study at a bachelor degree level or below had come straight fromhigh school, an analysis of age cohorts reveals this is becoming less common.
Figure A1.3: New commencements in higher education, 1983 to 1996
0
50 000
100 000
150 000
200 000
250 000
300 000
1983 1984 1985 1986 1987 1988 1989 1990 1991 1992 1993 1994 1995 1996
Students
Source: DEETYA 1996a.
In the ten years to 1996, commencing student numbers in the 20 to 24 age cohortincreased by 80 per cent, raising their share of the total student population from29 to 32 per cent. Commencing student numbers in the 30 and over category alsoincreased — from 27 to 28 per cent of the total.
Overall participation in higher education has expanded rapidly in Australia. Inthe decade to 1996, enrolments in higher education increased by 63 per cent or244 126 persons, with female students contributing over 60 per cent of this rise.This growth rate is four times that of the overall population in the same period.Thus, per head of population, the number of people attending university hasgrown from 31.7 to 46.0 per thousand people. In addition to campus-basedstudents, there were 7 735 students in the OLA scheme in 1995, up 60 per cent

SUBMISSION TO THE REVIEW OF HIGHER EDUCATION FINANCING AND POLICY
38
from the inaugural 1993 level of 4 854. In 1996, there were 634 094 students (or491 312 on an equivalent full-time basis) in the publicly funded higher educationsector.
Selected characteristics of the higher education student population for 1986 and1996 are shown in figure A1.4. In 1996, the bulk of higher education studentswere studying full-time (59 per cent). Women represented over half of thestudent body (54 per cent). Aboriginal or Torres Strait Islanders represent about 1per cent of the student body, compared with about 1.3 per cent of the 15 yearsand over population. Between 1986 and 1996, the proportion taking bachelor andpostgraduate studies increased, while there was a decline in the proportion ofstudents taking other award courses.
Figure A1.4: Characteristics of higher education students, 1986 and 1996
0 10 20 30 40 50 60 70 80
Females
External
Full-time
Bachelor degree
Postgraduate award
Other award
19 and under
20 to 24
25 to 29
30 and over
1986
1996
Per cent
a
a Includes distance education students.Source: DEETYA 1996a.
Analysis by field of study shows the courses with the highest enrolment levels in1996 were humanities, business-related courses and science (figure A1.5).

APPENDIX 1: AN OVERVIEW OF THE HIGHER EDUCATION SECTOR
39
Figure A1.5: Share of total higher education students by broad field of study, 1986 and 1996
0 5 10 15 20 25 30
Agriculture
Architecture, building
Arts and social sciences
Business & economics
Education
Engineering, surveying
Health
Law, legal studies
Science
Veterinary science
Non-award course
1986
1996
Per cent
Source: DEETYA 1996a.
Over the decade to 1996, enrolments have grown fastest in vocationally-orientedcourses such as law and legal studies, health, and business administration andeconomics. The large increase in the health field is, however, partly explained bythe reclassification of nursing to higher education in 1989. On the other side ofthe ledger, there was a substantial drop in students studying education. The shareof students in arts and social sciences and veterinary science also fell.
There has also been marked growth in students enrolling in postgraduate studies(figure A1.6). Postgraduate student numbers have increased at an average rate of9 per cent each year since 1989, compared with an increase of 3.6 per cent peryear for undergraduates. As a consequence, postgraduate students as a share oftotal higher education students increased from 16 per cent in 1989 to 21 per centin 1996.

SUBMISSION TO THE REVIEW OF HIGHER EDUCATION FINANCING AND POLICY
40
Figure A1.6: Higher education student numbers, 1983 to 1996
0
100 000
200 000
300 000
400 000
500 000
600 000
700 000
1983 1984 1985 1986 1987 1988 1989 1990 1991 1992 1993 1994 1995 1996
Total
Undergraduates
Postgraduates
Students
Source: DEETYA 1996a.
The Australian higher education system has not been able to keep pace with thestrong growth in demand that has occurred since 1989. Each year since 1989, atleast 6 per cent of people eligible for university have been unable to obtain aplace in a university and/or course that was acceptable to them. In 1996, theestimated number of eligible applicants who were not offered a university placewas between 16 000 and 23 900 people — equivalent to 6 to 9 per cent of totalcommencing students (AVCC 1996).
Demand for higher education is expected to slow over the next 10 years. On thebasis of projected growth in population and changes in age structure (but with noassumed changes to existing participation rates), higher education enrolments areprojected to rise by only 1.7 per cent (an increase of about 9 000) between 1994and 2005. Assuming modest growth in participation rates for young students(while maintaining participation rates for older students), enrolments of domesticstudents could increase by around 13 per cent (about 69 000) over the sameperiod (DEET 1995b). These projections do not take account of possibleincreases in participation rates linked to a growing emphasis on lifelongeducation or changes in demand linked to labour market changes or otherinfluences.
Foreign students
Exports of education and related services were $1.7 billion in 1994–95. Thisincludes fees from overseas students studying in Australia of about $893 million— of which approximately $600 million is attributed to higher education (AVCC
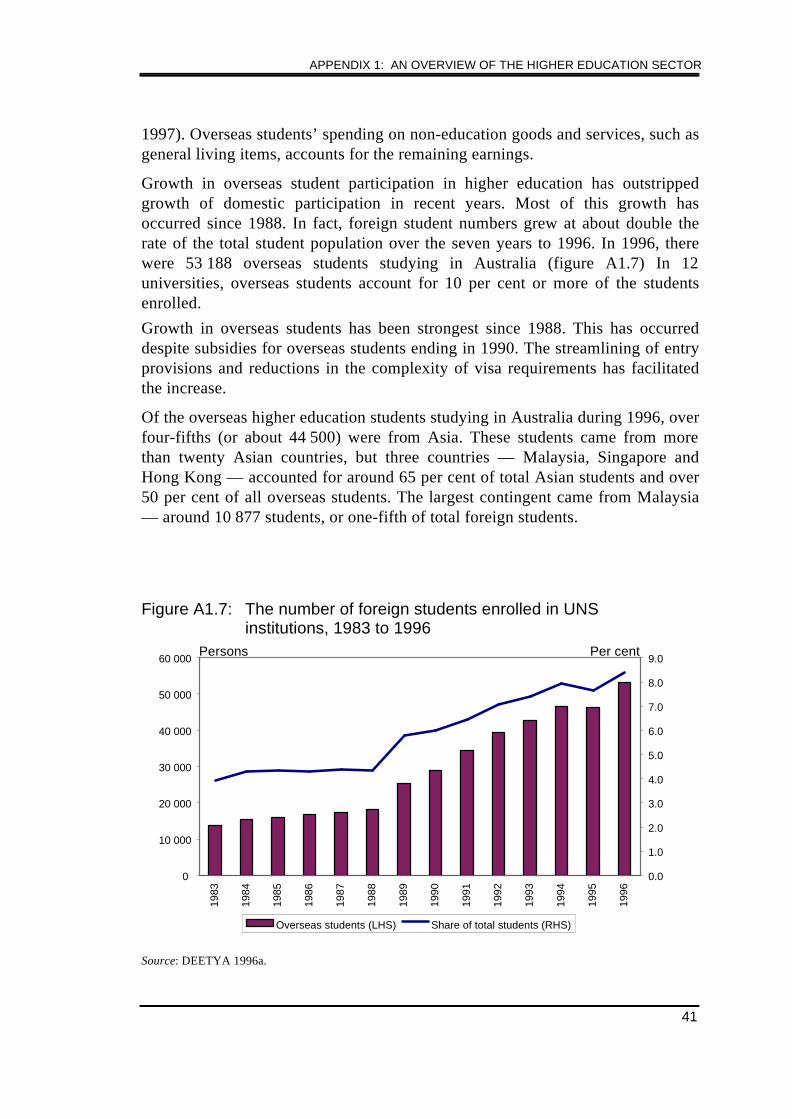
APPENDIX 1: AN OVERVIEW OF THE HIGHER EDUCATION SECTOR
41
1997). Overseas students’ spending on non-education goods and services, such asgeneral living items, accounts for the remaining earnings.
Growth in overseas student participation in higher education has outstrippedgrowth of domestic participation in recent years. Most of this growth hasoccurred since 1988. In fact, foreign student numbers grew at about double therate of the total student population over the seven years to 1996. In 1996, therewere 53 188 overseas students studying in Australia (figure A1.7) In 12universities, overseas students account for 10 per cent or more of the studentsenrolled.Growth in overseas students has been strongest since 1988. This has occurreddespite subsidies for overseas students ending in 1990. The streamlining of entryprovisions and reductions in the complexity of visa requirements has facilitatedthe increase.
Of the overseas higher education students studying in Australia during 1996, overfour-fifths (or about 44 500) were from Asia. These students came from morethan twenty Asian countries, but three countries — Malaysia, Singapore andHong Kong — accounted for around 65 per cent of total Asian students and over50 per cent of all overseas students. The largest contingent came from Malaysia— around 10 877 students, or one-fifth of total foreign students.
Figure A1.7: The number of foreign students enrolled in UNS institutions, 1983 to 1996
0
10 000
20 000
30 000
40 000
50 000
60 000
1983
1984
1985
1986
1987
1988
1989
1990
1991
1992
1993
1994
1995
1996
0.0
1.0
2.0
3.0
4.0
5.0
6.0
7.0
8.0
9.0
Overseas students (LHS) Share of total students (RHS)
Persons Per cent
Source: DEETYA 1996a.

SUBMISSION TO THE REVIEW OF HIGHER EDUCATION FINANCING AND POLICY
42
A1.4 International comparisons
Higher education systems across the world vary significantly. There aredifferences in the way education systems are organised, structured and managed.Length of courses and the emphasis placed on general and vocational education,as well as research and teaching, also vary markedly. Many factors contribute tothese variations, including differing economic and demographic conditions andhistorical, cultural and social influences. Consequently, while internationalcomparisons can provide some insights into key differences across systems,caution should be exercised in drawing firm inferences for policy purposes.
Like Australia, most OECD countries devote a significant proportion of nationalresources to tertiary (university and technical) education.3 According to the latestOECD statistics, the OECD region spent, on average, about 1.6 per cent of GDPon tertiary education in 1993 (figure A1.8 and table A1.3).
Figure A1.8: Expenditure on tertiary education as a share of GDP for selected countries, by source of funds,a 1993
Sha
re o
f GD
P (%
)
0.0
0.5
1.0
1.5
2.0
2.5
3.0
Can US Aust Swe NZ Net ROK Ger Fra Jap UK
Private
Public
OECD totalb
Country meanc
a Includes direct subsidies to institutions and households, but excludes subsidies for student living costs. b OECDtotal refers to the weighted (by GDP) average of all 27 OECD countries for which data are available or can beestimated. c Country mean refers to a simple average of the values of all 27 OECD countries for which data areavailable or can be estimated.Source: OECD 1996.
3 Unless otherwise specified, data refer to tertiary education, not simply higher education.

APPENDIX 1: AN OVERVIEW OF THE HIGHER EDUCATION SECTOR
43
While Australia is in line with this figure, there is considerable diversity amongindividual OECD countries. Canada and the US spent a relatively large share oftheir resources on tertiary education (2.4 per cent or more of GDP). At the otherend of the spectrum, Japan and the UK devoted less than 1 per cent of GDP totertiary education.
Countries also vary in the extent to which public funding is used to supporttertiary education. For instance, in many European countries, the tertiary sector isvirtually wholly government funded. In the US, Japan and Korea, publicexpenditure as a proportion of total tertiary education spending is relatively low— 52 per cent, 40 per cent and 22 per cent, respectively. In 1993, the AustralianGovernment accounted for about 75 per cent of direct expenditure within thesector, compared to the average for the OECD region of about 65 per cent.
The high level of government expenditure as a share of GDP devoted to thetertiary sector in countries such as Australia, Canada, Sweden and theNetherlands is also reflected in relatively high ratios of public tertiary funding tototal educational expenditure and total public spending more generally.Australia’s public expenditure on tertiary education relative to primary andsecondary education is high, accounting for 26.6 per cent of education spending,compared to the OECD country average of 22.8 per cent. Similarly, Australiadevoted 3.8 per cent of all government outlays to tertiary education, the thirdhighest in the selection of countries.
Spending on a per student basis also differs among countries. In line with highlevels of general expenditure, Canada, the US and Sweden had relatively highlevels of spending per student in 1993 (table A1.3). Australia spent an equivalentof US$9 036 on each tertiary student, which is just below the OECD average.Apart from Sweden, many of the European countries had relatively low levels ofexpenditure per tertiary student.

SUBMISSION TO THE REVIEW OF HIGHER EDUCATION FINANCING AND POLICY
44
Table A1.3: Expenditure on tertiary education in selected countries, 1993
CountryTotal expenditure as a
share of GDP%
Share ofpublic
education funding
Share ofall publicspending
Totalspending
per tertiarystudenta
Publicb Private Total % % US$ PPP
Australia 1.2 0.4 1.7 26.6 3.8 9 036
Canada 2.2 0.4 2.6 35.1 4.7 11 132
US 1.3 1.2 2.4 25.4 3.6 14 607
Japan 0.4c 0.6 0.9 10.5 1.1 7 556
New Zealand 1.5 na na 25.9 4.4 7 337
France 0.9 0.2 1.1 17.3 1.8 6 033
Germanyd 0.9 0.1 1.1 22.1 2.1 7 902
Netherlands 1.4 0.0 1.4 31.5 2.9 8 665
Sweden 1.5 0.1 1.6 27.4 2.9 12 693
UK 0.9 .. 0.9 22.6 2.6 8 241
Country meane 1.1 0.2 1.3 22.8 2.8 9 665
OECD totalf 1.1 0.6 1.6 na na na
South Korea 0.3 1.1 1.4 7.2 2.0 2 589
Singapore na na na 26.0g 9.6g na
a Spending (public and private) in equivalent US dollars using purchasing power parity. The purchasing powerparity exchange rate gives the amount of a national currency that will buy the same basket of goods and servicesin a country as the US dollar will in the United States. b Includes direct subsidies to institutions and households,but excludes subsidies for student living costs. c Direct subsidies to institutions only. d Refers to the formerFederal Republic of Germany. e Simple average of the values of all 27 OECD countries for which data areavailable or can be estimated. f Refers to the weighted (by GDP) average of all 27 OECD countries for whichdata are available or can be estimated. g 1990 data. na Data were not available or not reported. .. Negligible orzero.Sources: OECD 1996; and Selvaratnam 1994.
However, expenditure per student is affected by the share of university educationrelative to the non-university sector. In Germany and Australia for example,funding between these sectors varies significantly, with university studentsreceiving around double the average subsidy given to non-university students. InJapan and New Zealand, average funding per student in the university and non-university sectors is more even.
Many factors contribute to the level of resources devoted to the tertiary sector,among them the wealth of a country, the size of the youth population,employment opportunities and public policy in relation to institutional andstudent support. High enrolment rates will require more financial resources, other

APPENDIX 1: AN OVERVIEW OF THE HIGHER EDUCATION SECTOR
45
things being equal. Participation rates across a number of OECD countries arereported in table A1.4.
Table A1.4: Net enrolments in university and other tertiary education,selected age groups, 1994 (per cent)a, b
Age 18–21 Age 22–25 Age 26–29
UniversityOther
tertiary UniversityOther
tertiary UniversityOther
tertiary
Australia 20.5 8.7 8.4 5.2 4.7 3.8
Canada 26.2 14.0 14.6 8.2 5.4 4.2
US 21.3 13.6 14.4 6.6 6.5 3.9
Japan na na na na na na
NZ 23.8 7.1 10.1 3.8 4.8 2.5
France 23.3 9.9 14.1 2.9 4.2 0.4
Germanyc 8.7 2.4 15.5 1.7 8.6 1.7
Netherlandsd 22.1 na 18.4 na 6.2 na
Swedend 12.3 na 15.3 na 7.2 na
UK 18.7 4.8 5.8 2.6 2.8 1.6
Country meane 15.9 5.6 12.1 3.3 5.1 1.6
South Korea 19.8 11.0 12.7 3.6 2.7 ..
a Net enrolments is the number of students in the age group as a percentage of the total population in that agegroup. b No adjustment has been made for part-time and full-time students. c These data refer to the formerFederal Republic of Germany. d University figures include net enrolments in other tertiary. e Simple average ofthe values of all 27 OECD countries for which data are available or can be estimated. na. Not available or notreported. .. Negligible or zero.Source: OECD 1996.
In most OECD countries, the highest net enrolments in tertiary education arereported for the 18–21 age group. Tertiary education participation in this agegroup for Australia was above that reported in many OECD countries. YetAustralia tends to lag France, New Zealand and Korea, which devote about thesame or less resources to the sector. Similarly, Australia lags many OECDcountries in terms of participation in the older age groups for university-basededucation.
Strong competition for places in tertiary institutions and the internationalisationof higher education has stimulated the development of an export market foreducation. Funding pressures are also encouraging institutions to find ways tobroaden their enrolment base. These factors have contributed to the strong growthin international trade in educational services over the past few decades.
Australia appears to be capturing an increasing share of this market (table A1.5).While starting from a relatively low base, the number of foreign students enrolled

SUBMISSION TO THE REVIEW OF HIGHER EDUCATION FINANCING AND POLICY
46
in Australian institutions has expanded more than four-fold over the period 1980to 1993. Following a rapid expansion in export services, Australia has becomeone of the larger exporters of educational services.
Table A1.5: Foreign students enrolled in tertiary education by country,1980 and 1993
Foreign students enrolledForeign enrolments as a share of
total students (%)
Country 1980 1993 Percentagechange
1980 1993 Percentagechange
US 311 882 449 749 44.2 2.6 3.1 20.5
France 110 763 139 562 26.0 10.3 6.7 -34.6
UK 56 003 95 594a 70.7 6.8 6.3 -7.6
Australia 8 777 42 571 385.0 2.7 4.4 62.8
Canada 28 443 35 451 24.6 2.4 1.8 -27.3
Austria 12 885 23 911 85.6 9.4 10.5 11.6
Italy 29 447 22 618 -23.2 2.6 1.3 -49.0
China 1 381 22 617 1 537.7 0.1 0.5 322.2
Norway 1 114 11 290 913.5 1.4 6.4 353.7
New Zealand 2 464 4 489 82.2 3.2 2.8 -14.3
South Korea 1 015 1 908 88.0 0.2 0.1 -42.0
a Data for 1992.Source: UNESCO 1995.
47
APPENDIX 2 CURRENT FUNDING ANDCHARGING ARRANGEMENTS
The Commonwealth Government has implemented major reforms in the highereducation sector in recent years in an effort to raise participation and widenaccess to higher education, while at the same time containing costs throughrationalisation and streamlining of the system.
The reforms involved the removal of the binary divide between the universitiesand the former Colleges of Advanced Education and a major rationalisationthrough amalgamation of smaller institutions. New funding arrangementsimposed stricter accountability standards on universities within the centralisedframework of the Unified National System (UNS). Key aspects of the newarrangements include:
• the allocation of resources through the provision of block operating grantsto UNS universities determined on the basis of student load profiles;
• the reintroduction of student tuition fees in the form of HECS; and• partial regulation of fees set by UNS institutions.This appendix outlines key features of the reforms, existing higher educationfunding programs and charging arrangements. The framework for funding highereducation and the allocation of block funding is examined in section A2.1.Recent reforms to the HECS are outlined in section A2.2. The structure andregulation of tuition fees across the higher education sector are examined insection A2.3. Other Commonwealth higher education policies and studentassistance measures are briefly described in sections A2.4 and A2.5, respectively.
A2.1 The Unified National System: a framework for reform
The central feature of the new reforms to higher education was the creation of theUNS. To receive full Commonwealth funding, institutions were required tobecome a part of the UNS and to achieve a minimum sustainable student load ofat least 2000 equivalent full-time student units (EFTSU). Smaller institutionswere obliged to merge or establish a formal working relationship with a largerinstitution. Through the merger process the total number of public universities inthe UNS was reduced to 36.
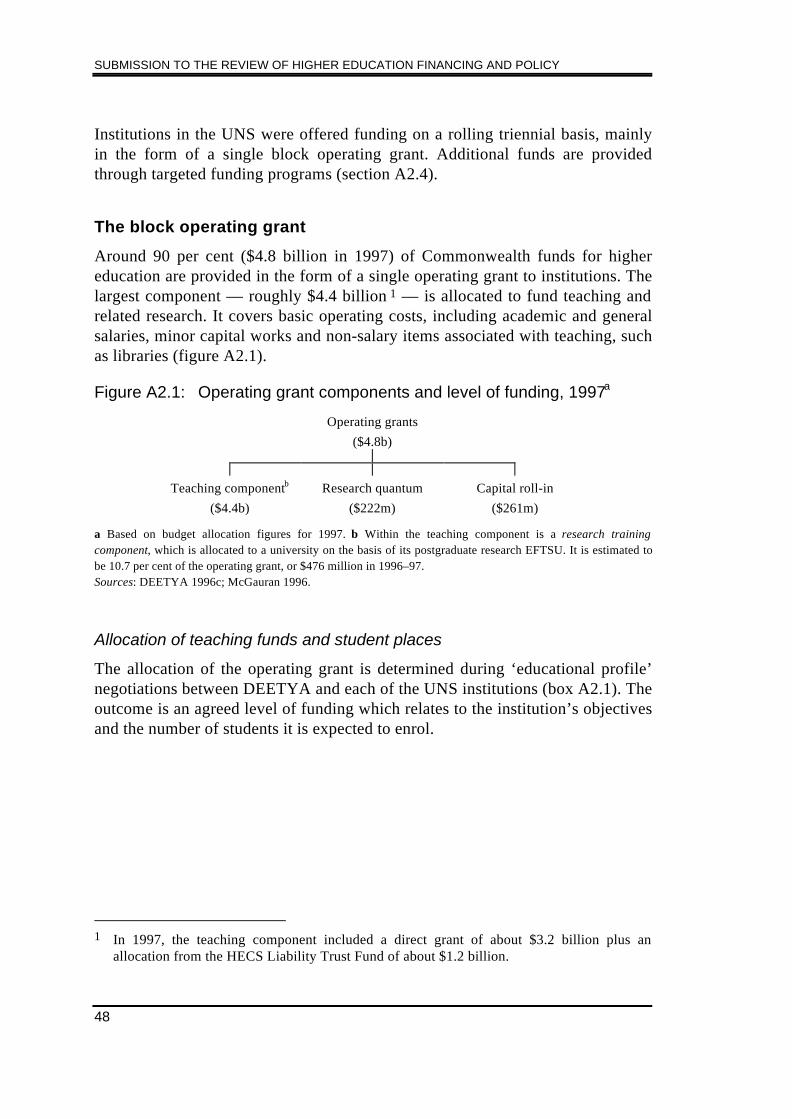
SUBMISSION TO THE REVIEW OF HIGHER EDUCATION FINANCING AND POLICY
48
Institutions in the UNS were offered funding on a rolling triennial basis, mainlyin the form of a single block operating grant. Additional funds are providedthrough targeted funding programs (section A2.4).
The block operating grant
Around 90 per cent ($4.8 billion in 1997) of Commonwealth funds for highereducation are provided in the form of a single operating grant to institutions. Thelargest component — roughly $4.4 billion 1 — is allocated to fund teaching andrelated research. It covers basic operating costs, including academic and generalsalaries, minor capital works and non-salary items associated with teaching, suchas libraries (figure A2.1).
Figure A2.1: Operating grant components and level of funding, 1997a
Operating grants($4.8b)
Teaching componentb
($4.4b)Research quantum
($222m)Capital roll-in
($261m)
a Based on budget allocation figures for 1997. b Within the teaching component is a research trainingcomponent, which is allocated to a university on the basis of its postgraduate research EFTSU. It is estimated tobe 10.7 per cent of the operating grant, or $476 million in 1996–97.Sources: DEETYA 1996c; McGauran 1996.
Allocation of teaching funds and student places
The allocation of the operating grant is determined during ‘educational profile’negotiations between DEETYA and each of the UNS institutions (box A2.1). Theoutcome is an agreed level of funding which relates to the institution’s objectivesand the number of students it is expected to enrol.
1 In 1997, the teaching component included a direct grant of about $3.2 billion plus an
allocation from the HECS Liability Trust Fund of about $1.2 billion.

APPENDIX 2: CURRENT FUNDING AND CHARGING ARRANGEMENTS
49
Box A2.1: Educational profiles
Operating grants in the UNS are based on educational profiles that institutions mustdevelop in negotiation with DEETYA. These negotiations occur annually within thecontext of the triennial cycle, with the opportunity to negotiate major alterations orproposed new developments as the need arises. Profiles include a statement identifying therole and mission of institutions in broad terms and separate management plans outliningtheir activities in teaching, research and capital management, as well as statements ofintent on dealing with equity issues, including an Aboriginal and Torres Strait Islandereducation strategy.
Student load targets are set during the negotiation process. These targets form the basisfor determining the maximum grant allocated to an institution. While each institution isexpected to meet or exceed a total enrolment target as well as an undergraduate target,they receive funding only up to the agreed targets. From 1998, institutions will receive anamount equivalent to the minimum HECS liability of each undergraduate student enrolledbeyond target. Correspondingly, the Commonwealth will reduce an institution’s fundingby the equivalent of the minimum upfront differential HECS payment for each EFTSU thatinstitutions fall short of their agreed undergraduate target.
Sources: Dawkins 1988b; DEETYA 1997b.
Student place allocations are largely determined on the basis of previousallocations, with some adjustments to accommodate changes in demand andgrowth within the system. In determining which institutions will receive growthfunding, DEETYA takes account of state and regional needs, the capacity ofinstitutions and their individual bids. This process involves consultation betweenthe Commonwealth, State and Territory governments (via specially establishedJoint Planning Committees), Australian education administrative bodies andhigher education institutions.
Since 1990, the relative funding model has been used to assist in the reallocationof funds from the pre-1987 system to the new institutions to ensure that they arefunded on an equitable basis. This model assigns weights to the differentdisciplines and level of study on a system-wide unit cost basis. The mostexpensive disciplines and courses receive the greatest weight and funds.Disciplines such as medicine, dentistry and veterinary science are among themost costly to provide, while humanities, education and law are the least costly.Similarly, students enrolled in higher degree research are weighted more heavilythan those at the undergraduate level.
The relative funding model was designed to be a once-off adjustment, rather thanfor use on an ongoing basis. Each year since 1990, DEETYA has adjustedinstitutional grants to bring each institution’s teaching funds within a tolerance

SUBMISSION TO THE REVIEW OF HIGHER EDUCATION FINANCING AND POLICY
50
band of about 3 per cent of the funding relativities of the model. This process ofadjustment has been completed. Consequently, in 1997, DEETYA abandoned therelative funding model. Allocation of teaching funds is now determined on thebasis of the average rate of funding per EFTSU at each institution. This averagefunding rate in turn reflects the distribution of EFTSU across disciplines andlevels of study, as specified in the relative funding model. On average, thesubsidy provided in 1997 was roughly equivalent to $9 500 for each EFTSU inthe total enrolment load.
Research funding
In 1988, there was a major restructuring to the way research was managed andfunded. Research directly related to teaching is allocated to universities via theteaching component of the block operating grant. The bulk of other researchfunding has been separated from the operating grant to encourage greaterefficiency through competitive schemes and to ensure closer alignment withbroader national objectives. However, a small component of the operating grant,known as the Research Quantum, has been retained to support basic researchactivities that are not directly related to teaching and research training.
Funds for the research quantum were created from a ‘clawback’ of $65 millionper annum (phased in over the 1989–91 triennium), or 1.5 per cent of theoperating grants from the pre-1987 universities for distribution on a competitivebasis. It accounts for about 5 per cent of total operating funds. Since 1990, thesefunds have been allocated on the basis of a ‘composite index’, which takesaccount of research inputs (measured as success in attracting research grants) andoutputs (as measured by postgraduate research completions and numbers ofpublications). In 1995, about 90 per cent of funds were allocated on the basis ofinputs, particularly from national competitive research grants. Criticisms over theweights used in the index has led to more emphasis being placed on outputsthrough increasing the weights on publications and higher degree researchcompletions, but success in attracting research grants is still the major componentfor allocating funds (IC 1995; HEC 1996).
Capital funding
The capital component of the block operating grant, known as the capital roll-in,is provided to support infrastructure development for all university activities.This funding is allocated to institutions and reflects their agreed student targetloads.
In addition, the Commonwealth has set aside $37.6 million for each year of thecurrent triennium to fund additional capital projects. These funds are held in acapital development pool, which provides specific purpose grants to assist

APPENDIX 2: CURRENT FUNDING AND CHARGING ARRANGEMENTS
51
institutions that have experienced extraordinary levels of Commonwealth-fundedgrowth since 1994, and to expand, develop and upgrade electronic deliveryinfrastructure, particularly for new campus developments (DEETYA 1996c).
A2.2 User charges for higher education — HECS
In 1987, the Hawke government reintroduced an annual tuition fee for highereducation in the form of a Higher Education Administration Charge of $250 perstudent. In 1989, this charge was replaced by the HECS. Under this scheme,Australian university students were required to contribute a uniform amount($2 478 annually in 1997 for continuing full-time students) that, on average,accounted for roughly 23 per cent of the tuition cost of their education. Thiscontribution can be made as an upfront payment, which receives a 25 per centdiscount, or deferred.2
The HECS is becoming an increasingly important element of higher educationfunding. All funds collected via HECS are put into a HECS Liability Trust Fund.The revenue is reallocated to institutions as part of the teaching component of theblock operating grant. About $1.2 billion was allocated from this fund in 1997.
The Government recently made a major change to the structure of the HECS.Since January 1997, all commencing students have been required to pay a tuitionfee of between $3300–$5500 for a full year of study (table A2.1). All units ofstudy are divided into three HECS bands. The amount of HECS payable dependson which band a student’s units of study fall within (ATO & DEETYA 1996).The required payment is also adjusted for their study load. For example, a studentcommencing a Bachelor of Economics in 1997 with a full-time load wouldundertake eight units. If the student enrolled in six economics units and two artsunits their HECS liability would be $4 350 (ie 6/8 x $4 700 [economics rate] +2/8 x $3 300 [the arts rate] = $3 525 + $825).
Under the new HECS, students continue to have the option to pay upfront andreceive a discount. Alternatively, they may defer payment until their taxableincome reaches a threshold, now $20 701, previously equal to average weeklyearnings ($28 495 in 1996–97) (table A2.2). In addition, new repayment ratesapply. These changes mean that most HECS-liable individuals will beginrepaying their debt sooner and will complete repayment more quickly.
2 When students choose to pay HECS upfront, the institution is paid the outstanding 25 per
cent of the contribution by the Commonwealth.

SUBMISSION TO THE REVIEW OF HIGHER EDUCATION FINANCING AND POLICY
52
Table A2.1: Differential HECS, 1997a
Category CoursesAnnualcharge
$
Band 1 Arts, Humanities, Social Studies/Behavioural Studies,Education, Visual/Performing Arts, Nursing and LegalStudies.
3 300
Band 2 Mathematics/Computing, Other Health Studies,Agriculture/Agricultural Science, Science, BuiltEnvironment, Administration, Business, Economics andEngineering.
4 700
Band 3 Law, Medicine, Dentistry and Veterinary Science. 5 500
Continuing students All HECS-liable courses 2 478
a Students making a partial upfront payment of $500 or more of their HECS liability for a semester receive adiscount of 25 per cent.Sources: Vanstone 1996a; DEETYA 1996c.
Table A2.2: Changes to HECS repayment ratesa, b
1997–98 repayment schedule 1996–97 repayment schedule
Threshold income Repayment rate Threshold income Repayment rate$ % $ %
Below 20 701 nil Below 28 494a nil
20 701 to 21 830 3.0 28 495 to 30 049 3.0
21 831 to 23 524 3.5 30 500 to 32 381 3.5
23 525 to 27 288 4.0 32 382 to 37 563 4.0
27 289 to 32 934 4.5 37 564 to 45 335 4.5
32 935 to 34 665 5.0 45 336 to 47 718 5.0
34 666 to 37 262 5.5 47 719 to 51 292 5.5
37 263 and above 6.0 51 293 – 6.0
a Graduates with dependants are exempted from making repayments if they qualify for the medicare levyexemption. Individuals may also make voluntary repayments at any time. Voluntary payments of $500 or moreattract a 15 per cent bonus. b Income threshold and repayment schedules for 1996–97 and 1997–98 are moregraduated than those that applied prior to the 1996–97 Budget changes.Sources: Vanstone 1996a; DEETYA 1996c.
Around 80 per cent of university students are HECS-liable. Some studentsundertaking non-award, enabling, postgraduate and graduate courses are subjectto fees and are exempt from HECS. Some students that are liable for HECSchoose to pay the fee upfront. Most however, particularly at the undergraduatelevel, take the option to defer payment. For example, in 1996, about three-quarters of undergraduate students and roughly half of graduate and postgraduate

APPENDIX 2: CURRENT FUNDING AND CHARGING ARRANGEMENTS
53
students chose to defer payment of their HECS obligation. Most students takingthis option are expected to repay their debt within 6 to 10 years (Vanstone1996a). It is currently estimated that about 17.2 per cent of all HECS debt willnot be recovered (DEETYA & OECD 1997).
A2.3 Higher education fees
The higher education system comprises more than just the Commonwealth-funded institutions. Higher education courses are also provided by AustralianTechnical and Further Education (TAFE) colleges, private colleges and privateuniversities. Universities are the only institutions able to offer degree courses, butthrough articulation arrangements students can gain credits towards a universitydegree from courses undertaken at other tertiary institutions.
Students face a range of different fees depending on the institution they attendand the regulations that apply. The Commonwealth is responsible for regulatingfees in the public higher education sector.
Most domestic students attending public universities are required to pay a usercharge in the form of the HECS. No other tuition fees apply, although studentsmay be charged for administrative and ancillary services (eg computer facilitiesand lecture notes). Some students must pay upfront fees that are determined bythe institutions. However, as part of the funding arrangements, these fees areregulated by the Commonwealth. In the TAFE sector, fees are regulated by stateand territory governments. Outside the public system, higher educationinstitutions have full autonomy to determine fees. Fees for a Bachelor of Artsdegree that applied at selected institutions in 1997 are presented in box A2.2.Details of fees that apply at various institutions are detailed below.

SUBMISSION TO THE REVIEW OF HIGHER EDUCATION FINANCING AND POLICY
54
Box A2.2: Tuition fees for a Bachelor of Arts degree at selectedinstitutions, 1997
_____________________________________________________________________________Caseya MCb University of Bond
UNS + MU + SCU Notre Dame University_______________________________________________________________________Completion time (yrs)c 3 4 2 2.5 2
Deferred HECS ($) 9 900 7 425 3 300 na naTuition feed ($) nil 1 200 11 500 18 000 51 600Total cost ($) 9 900 8 625e 14 800f 18 000 51 600_____________________________________________________________________________
a Casey Institute of Technical and Further Education (Victoria) and Monash University.b Macleay College and Southern Cross University (SCU). c Represents the minimum number ofyears. d Administrative, ancillary service charges and non-refundable deposits are not included.e Equivalent to the cost of combining study towards a Diploma of Arts (Professional Writing &Editing) at Casey and a Bachelor of Communications at Monash University. The HECS liabilitywas calculated based on a student undertaking 18 university arts study units. The Casey fees are$500 for the first year and $350 for the following two years. f Equivalent to the minimum tuitionfee for a diploma in Advertising or Journalism that takes 1 year to complete. The degree coursetakes an additional year to complete and is provided by SCU on a HECS-liable basis. na Notapplicable.Sources: Bond University 1996; University of Notre Dame 1997; Macleay College 1997; Casey Institute
of Technical and Further Education 1997; DEETYA 1996c.
Fees set within the UNS
From the late 1980s, the government has increasingly expected universities tofind additional sources of revenue to fund their operations. To facilitate this, theuniversities have been given more freedom to charge fees.
Fees set within the UNS are regulated by the Higher Education Funding Act1988 and associated Ministerial guidelines. They aim to ensure that studentscounted within the enrolment target are able to access HECS and to prevent fee-paying students from limiting the availability of places for HECS-liable students.
Postgraduate, graduate and non-award course fees
Under existing guidelines, ‘full’ fees may be charged to domestic studentsundertaking certain graduate, non-award and postgraduate courses (irrespectiveof the level of research content). Some limits apply. Fees may not be levied oncourses that result in a basic professional qualification that requires graduate orpostgraduate entry, including postgraduate general nursing courses required forinitial registration and graduate diploma of education courses. Fees cannot beapplied to students holding an Australian Postgraduate Award either.

APPENDIX 2: CURRENT FUNDING AND CHARGING ARRANGEMENTS
55
Institutions have some discretion as to whether they accept students on a HECS-liable basis, which is counted towards their student load target, or accept them ona fee-paying basis. Often fees are applied to courses in high demand, such asbusiness and commerce courses. Alternatively, institutions may differentiatebetween particular types of students. For example, the Australian NationalUniversity accepts some full-time students into graduate courses on a HECS-liable basis, while part-time students are subject to fees. Overall, around a thirdof non-research graduate and postgraduate students enter university on a fee-paying basis, either self-financed or employer-sponsored. The remaining studentsare largely HECS-liable. In total, less than 1 per cent of postgraduate researchstudents pay institutionally determined fees. About 85 per cent of postgraduateresearch students receive scholarships. The remaining research students aresubject to HECS.
In the case of non-award courses, institutions are required to charge a fee that isat least equivalent to HECS. The government no longer sets minimum fees forpostgraduate and graduate domestic fee-paying students. However, in practice,most institutions charge an amount at least equivalent to HECS.
Institutions are free to retain all income earned from fee-paying students as longas they meet their student load target. Where institutions enrol fee-payingstudents within their funded load targets, their operating grant is adjusted by thediscounted HECS payment for each fee-paying student.
Undergraduate fees
From 1998, greater freedom to charge tuition fees to domestic undergraduatestudents who were unable to obtain a government-funded place will enableinstitutions to expand places for these students. However, strict regulations apply.Institutions are not able to offer fee-paying places to medical students. For othercourses, the Government has placed a limit of 25 per cent on the number ofplaces that may be offered to undergraduates on a ‘full’ fee basis. If institutionswish to expand the number of fee-paying places beyond the initial limit theymust also expand HECS places to maintain the ratio between government-fundedstudents and fee-paying students. Institutions must meet the student load targetbefore fee-paying undergraduate students may be accepted. Funding penaltiesapply if institutions breach this condition.3 A minimum fee equivalent to thedifferential HECS contribution also applies. In addition, the HECS loan facility isnot available to fee-paying domestic undergraduate students.
3 The penalty is $9 000 for each fee-paying student that could have been counted towards the
target in 1998 (and indexed in subsequent years). This is in addition to any fundingadjustments made for under-enrolment against the target.

SUBMISSION TO THE REVIEW OF HIGHER EDUCATION FINANCING AND POLICY
56
Overseas students
The Government requires institutions to charge fees to overseas students. Unlessapproval for lower fees is granted by the Higher Education Division ofDEETYA, a minimum scheduled fee must be applied. The 1996 administrativeguidelines require institutions to recover the full economic cost (full average costrather than marginal cost) of providing a course having regard to teachingservices, administration and capital facilities for the course on offer (HED 1996).Previously, the Government placed limits on the number of overseas students thatinstitutions could accept. These limits no longer apply.
Institutions are able to retain all fee income as long as they at least meet theinstitution’s total student load target. The guidelines stipulate that this revenuemust only be used for the purposes of providing additional places or providingadditional support for institutional activities (HED 1996). If institutions take onoverseas students and do not meet their student load target, the Governmentwithholds from their operating grant the equivalent of one discounted HECScharge for each EFTSU of fee-paying load that is within the total load target.
TAFE fees
Public TAFEs are the dominant suppliers of vocational education and training(VET) in Australia. TAFE colleges offer diploma, certificate or other awardcourses in competition with other higher education institutions. TAFE forms animportant link in the education system for students going on from secondaryschool to higher education. Through the various articulation arrangements inplace between individual universities and TAFEs, it is possible for a collegestudent to gain credits towards a university degree. Typically, a TAFE diplomacourse will provide a year of credit towards a degree. Given the large subsidiesprovided to the TAFE sector by state and territory governments, in terms oftuition costs, it is often less costly for the student to combine TAFE anduniversity to obtain a degree. However, because it usually takes at least a yearlonger to obtain a degree in this way, students choosing this method of study mayface higher costs when the lost opportunities for work are taken into account.
The states and territories have prime responsibility for funding the TAFE sector.In 1995, State and Territory Governments contributed about 59 per cent of allfunds to the VET sector. The Commonwealth Government contributed anadditional 23 per cent of funds. Student fees and charges accounted for 4 per centof funds (ACVETS 1996).
Within the TAFE system, the most common method for setting fees is to set themin line with course costs. Some charges vary according to the type ofqualification gained (eg fees for a diploma course are higher than for a certificate

APPENDIX 2: CURRENT FUNDING AND CHARGING ARRANGEMENTS
57
course). Fees and charges vary considerably. For example, in 1997, tuition feesranged from $350 to $1 420 per year at the Canberra Institute of Technology(CIT 1997).4 These fees must be paid upfront and no government guaranteed loanscheme, similar to the HECS arrangement, is available. However, some studentsmay be able to obtain a loan through the AUSTUDY/ABSTUDY supplementscheme.
Private higher education fees
The government does not regulate fees at non-subsidised higher educationinstitutions. There are only two private universities in Australia — Bond andNotre Dame — both operate on a non-profit basis. However, some privatecolleges, such as Macleay College, offer degrees in conjunction with otheruniversities.
The University of Notre Dame offers courses within a Christian context, runningcourses in education, theology, arts and sciences, business and law. BondUniversity offers a similar range of vocationally oriented arts, law and businesscourses. At Macleay College, students that complete the one-year diplomacourses in journalism and advertising can continue for an additional year tocomplete a Bachelor of Arts offered in conjunction with Southern CrossUniversity. All of these institutions offer courses over most of the year allowingfor accelerated completion of degrees in two years.
Tuition fees at private institutions vary considerably. For example, in 1997, BondUniversity set most undergraduate tuition fees at $2 100 per study unit, so that adegree cost about $51 600 ($17 200 for a two semester year). Postgraduatecourses are more expensive. At Notre Dame, tuition fees are $250 ($325 for law)per credit point. An Arts degree costs around $18 000 ($6 000 for a two semesteryear).5 Fees for postgraduate students are roughly the same as for undergraduates,but may be increased depending on the level of supervision required. At MacleayCollege, the degree courses are offered on a HECS basis, but the prerequisitediploma course costs about $11 500.
Various payment options are usually available to students in private institutions.Fees can be paid upfront and may attract a discount. Alternatively, payments canbe made on a periodic basis. The institutions often offer other specialarrangements to suit individual students. Notre Dame provides interest free loansto students for an amount up to half the payable fees. Notre Dame also offers a
4 These figures exclude student association fees and any additional ancillary charges.5 Fees for overseas students at Notre Dame are about double the domestic student rate — $425
per credit point in 1997 ($10 200 for a two semester year).

SUBMISSION TO THE REVIEW OF HIGHER EDUCATION FINANCING AND POLICY
58
work study program to needy students. This program provides opportunities forstudents to gain fee remission for services rendered to the university. Bond andMacleay College have negotiated special student loan arrangements withcommercial banks. Loans are typically offered on a deferred payment basis.However, commercial conditions apply to these loans. Students may also be ableto access the AUSTUDY/ABSTUDY assistance and loan supplement scheme.
A2.4 Other higher education programs
Equity
Equity in higher education is a major Commonwealth priority. Apart fromensuring equal access to an undergraduate degree for suitably qualified(domestic) students, a component of the funding provided to higher educationinstitutions includes separately identified funding to support equity initiatives.
There are two main equity programs — the Higher Education Equity Program(HEEP) and the Aboriginal and Torres Strait Islander Support Fund.
Funding for the HEEP in 1997 is $5.3 million. This program targets thefollowing groups:
• students with a disability;• people from socio-economically disadvantaged backgrounds;• women in non-traditional areas of study and postgraduate courses;• people from rural and isolated areas;• Aboriginal and Torres Strait Islander students; and• people from non-English speaking backgrounds.The aim of the HEEP is to raise the participation rates of students in thesegroups, which have been traditionally under-represented in higher education.
The Aboriginal and Torres Strait Islander Support Fund aims to provideadditional funds to meet the special needs of indigenous students and supportsother government policies for indigenous Australians. Funding in 1997 will bearound $21.5 million. An additional $8 million has been allocated for the currenttriennium for the establishment of specialist Indigenous Higher EducationCentres and to improve access to Open Learning.
As part of the profiles process, UNS institutions are required to produce an equityplan and develop strategies for indigenous education. Institutions are alsorequired to establish targets for indigenous students participating in highereducation. Performance in achieving equity goals for each of the target groups is
APPENDIX 2: CURRENT FUNDING AND CHARGING ARRANGEMENTS
59
monitored by DEETYA and, from 1995, institutions have reported against fourequity performance indicators: access; participation; success; and retention. Since1996, allocations under both HEEP and the Aboriginal and Torres Strait IslanderSupport Fund have been based on outcomes against the performance indicators.
The Commonwealth’s new merit-based equity scholarship program also targetsstudents in the equity groups mentioned above. The scholarships offer a HECSexemption and are expected to number more than 4 000 by the year 2000. Thecost of this program over the next four years is estimated to be about $36 million.
Open Learning Initiative
Over the 1997–99 triennium, the Commonwealth Government will providefunding of $0.215 million annually for the Open Learning Initiative. Thisinitiative promotes wider and easier access to tertiary education through theestablishment of the Open Learning Australia (OLA) organisation and thedevelopment of an open learning electronic support service.
OLA involves the collaboration of 29 Australian universities and TAFE colleges,assisted by the Australian Broadcasting Corporation, that offer distance educationservices incorporating the use of television, radio and other electroniccommunications services. The OLA service is open to all Australians, regardlessof age and location. There are no entry requirements and no limit on places. OLAis free to set its own fee levels for these services — it is not tied to HECScharges. Students may also have access to the Open Learning Deferred PaymentScheme (OLDPS) for payment of these fees.
The OLDPS is available for undergraduate university units only. Postgraduateunits and professional and continuing education studies must be paid for upfront.
The OLDPS has many features similar to the HECS and the repaymentarrangements for the two schemes are the same. However, more stringenteligibility criteria apply to OLDPS compared to HECS. To remain eligiblestudents must:
• maintain a pass rate of at least 50 per cent of all units registered, regardlessof method of payment; and
• have registered for fewer than 28 units (usually 24 units have to becompleted for a degree course).
Students must also meet any shortfall between the OLDPS amount and the costof the OLA course. In 1997, the OLDPS amount per standard course unit was$332 ($2 656 for a full year of study), while course costs were $425 ($3 400 for afull year of study).

SUBMISSION TO THE REVIEW OF HIGHER EDUCATION FINANCING AND POLICY
60
Higher Education Innovations Program
The Higher Education Innovations Program was established in 1995 through themerger of the National Priority (Reserve) Fund and Quality Assurance Programs.It is used to support quality and innovation in higher education. Included in thisprogram are initiatives such as:
• the Committee for University Teaching and Staff Development that wasestablished in July 1996 to continue the work of the Committee forAdvancement of University Teaching. Its role is to identify and promotegood practice and improvement, and to encourage and provide staffdevelopment opportunities for academic and administrative staff. About$6 million annually is available under this program, with funds allocated toinstitutions on the basis of performance; and
• the Australian Credit Transfer Agency provides more flexible points ofentry into the Australian higher education system through its role inassessing prior learning and providing advice on national recognition ofprior learning. In 1996, about $0.6 million was allocated to this initiative.An additional $67 000 was provided to assist with the assessment of non-credentialed prior learning of those who are economically disadvantaged.No allocation has been made for the agency for the 1997–99 triennium.
Cooperative Multimedia Centres
The Cooperative Multimedia Centres program aims to support the developmentof a competitive and internationally successful multimedia industry. The programfunds six centres involved in developing collaborative approaches betweeneducation and training, business and creative communities for skill formation inthe industry. Funding of about $8.4 million is provided for this program annually.
Advanced Engineering Centres
The Advanced Engineering Centres program was established in 1992 to foster anengineering culture in Australia. The centres are designed to promotecollaboration between higher education institutions and industry so as to:
• improve advanced engineering education;• increase industry’s capacity to apply and commercialise technology; and• focus on teaching and short-term research and consultancy projects.Three Advanced Engineering Centres located in Sydney, Melbourne andAdelaide, received combined funding of $1.6 million in 1996. A review of the

APPENDIX 2: CURRENT FUNDING AND CHARGING ARRANGEMENTS
61
centres was undertaken in 1995. The government has since decided to fund theprogram for a maximum period of six years.
Evaluation and Investigation Program
The Higher Education Division of DEETYA operates an Evaluation andInvestigation Program. The program funds studies and research projects thatevaluate performance and investigate issues of national importance to Australianhigher education policy. It is a cooperative venture, with projects beingundertaken in areas of interest common to researchers, institutions and theCommonwealth. In 1995–96, funds of $1.3 million were allocated for 58projects.
A2.5 Student assistance schemes
The Commonwealth provides direct financial assistance that largely targetsstudents from disadvantaged backgrounds under two main schemes —AUSTUDY and ABSTUDY. These schemes aim to provide financial assistancethat contributes to student living expenses.
AUSTUDY provides income support grants to students 16 years of age and olderundertaking approved courses of study in secondary schools, TAFE colleges,approved TAFE equivalent and university courses offered by both public andprivate institutions. Assistance is provided on an income and asset means-testedbasis. A loan scheme, known as the AUSTUDY Supplement, is also offered inconjunction with this program. There are two categories of potential recipients:
• tertiary students eligible for AUSTUDY who can trade-in up to $3 500 oftheir grant for a loan of twice that amount (ie $7 000 a year); and
• tertiary students who are ineligible for AUSTUDY, but whose parents’adjusted income was less than $53 138 in 1996, can obtain a loan of up to$2 000.
The repayment conditions for the loan supplement are similar to HECS.However, recipients do not need to begin repaying their loans until about 5 yearsafter graduating, even if their income is above the minimum HECS incomethreshold. About 62 000 AUSTUDY recipients had supplement loans in 1996–97and 1 892 students had taken advantage of the smaller loan scheme.
Outlays on AUSTUDY have been reduced through tighter targeting of assistancethrough an extension of the means-test. The age at which students are assessed asindependent of parental means (and so not subject to the parental means-test) hasbeen increased from 22 to 25 years, and a two year waiting period has been

SUBMISSION TO THE REVIEW OF HIGHER EDUCATION FINANCING AND POLICY
62
introduced for newly arrived migrants before they can become eligible forAUSTUDY. Some increases in assistance have been provided to families wheretwo or more children have to leave home to undertake tertiary study throughincreased concessions under the parental income test. The 1996–97 budgetallocation for AUSTUDY was $1.5 billion (Vanstone 1996a). In 1996, at thetertiary level, there were about 276 600 (183 300 in higher education) recipientsof AUSTUDY.
ABSTUDY is similar to AUSTUDY but focuses on assisting Aboriginal andTorres Strait Islander students by providing income and other assistance tailoredto their needs. The 1996–97 budget allocation for ABSTUDY and otherassistance to aboriginals was $189.1 million (Vanstone 1996a). In 1996, therewere 6 390 recipients of ABSTUDY in higher education.
63
APPENDIX 3 RATIONALES FORGOVERNMENT INVOLVEMENT
Successive Australian governments have acknowledged that higher educationperforms a range of valuable economic and social functions. In its HigherEducation Policy Statement, the former Commonwealth Government observed(Dawkins 1988b, p. 7):
Higher education has much to contribute. It is a primary source of the skills weneed in our cultural, artistic, intellectual and industrial life. It acts to gather andpreserve knowledge. It promotes greater understanding of culture, often at oddswith majority attitudes and, in so doing, supports the development of a more justand tolerant society.
More recently, in a policy statement issued shortly before its election togovernment, the Federal Coalition underlined its commitment to (FederalCoalition 1996, p. 2):
... support high quality universities for the intellectual, cultural, economic andsocial benefit of the nation.
Widespread support for higher education stems from recognition of the social andeconomic benefits it delivers and its ability to confer greater understanding, aswell as financial advantage, on those that embrace it.
This appendix examines the rationales advanced in support of governmentinvolvement in the provision and financing of higher education and its associatedactivities. Efficiency-related rationales are examined in section A3.1. Equity-related rationales are addressed in section A3.2. Performance monitoring andaccountability are examined in section A3.3.
A3.1 Efficiency rationales
In certain circumstances, the level and pattern of economic activities associatedwith the actions of individuals within society differ from those which would be insociety’s best interest. Opportunities to improve on such outcomes, and promotethe use of resources in a way that increases net benefits within the community,underlie efficiency rationales for government intervention.
A range of factors can impede the efficient allocation and use of resources inhigher education including: differences between private and public valuations ofcertain activities; problems faced by students in financing their studies;

SUBMISSION TO THE REVIEW OF HIGHER EDUCATION FINANCING AND POLICY
64
inadequate information; and impediments to institutional best practice andperformance. Each of these are examined below.
Spillover benefits from higher education
Public subsidies to higher education are often justified on the basis that theassociated teaching and research activities produce benefits for the communitybeyond those captured by participants. As a result, these activities may be under-provided unless government lowers their cost, or increases the private rewards.The difference between the benefit a student, researcher or institution receivesfrom their involvement in higher education and the total benefits generated fromtheir activities is called a ‘spillover’ (or ‘externality’).
Claims that higher education is inherently good for society have their roots in thenotion of spillovers.1 Similarly, concerns that researchers may be under-rewardedfor the valuable knowledge they produce, or might be deterred from exploringareas that are unlikely to be directly profitable — yet offer social benefits thatexceed the cost of such research — can also be linked to spillover effects.
However, while few would deny that higher education generates benefits thatextend beyond those people and institutions directly involved in the activity,there is considerable debate about the nature and magnitude of these spillovers,and whether they justify the level of subsidies governments direct toward thehigher education sector and its students. As noted by Blaug (1987, p. 229):
What we have to show is not that higher education has many unintended socialconsequences, because so does every other human activity, but that theseconsequences have economic value and are functionally related to the size of thehigher education system.
While the research and development activities of universities have generally beenaccepted as providing a case for government support, the claimed spilloverbenefits associated with universities’ teaching activities are generally more
contentious. Concern is reflected in claims that:
1 The ‘merit good’ rationale for government intervention is a related notion. This concept is
based on the idea that, in some cases, individuals fail to recognise the full private benefits ofcertain activities, and therefore do not make decisions that are in their own best interests.While a lack of information about educational costs and benefits might lead to such asituation (and offer a case for providing more and better information), the notion thatgovernment can make superior choices to individuals about their welfare and priorities isdifficult to sustain for higher education where participants are mostly adult and of above-average intelligence.

APPENDIX 3: RATIONALES FOR GOVERNMENT INVOLVEMENT
65
• the scope and value of higher education spillover benefits are oftenexaggerated;
• some of the spillover benefits attributed to higher education might also beassociated with other activities (eg other forms of education) that mightrequire lower subsidies to generate the same level of social benefits;
• the significant private benefits that students gain from higher education canunderpin the production of a large proportion of potential spillovers withoutthe need for government action; and
• higher education can impose spillover costs that need to be weighed againstspillover benefits. Perceived costs can include civil disobedience anddisharmony (Grubel 1987; Friedman and Friedman 1980) and ‘screening’effects (Fane 1988; West 1988) linked to credentialism within labourmarkets.2
Typically, the claimed spillover effects from higher education relate to factorssuch as education’s contribution to economic growth and productivity, socialconsequences such as improved law and order, and notions relating toimprovements in the general ‘quality’ of society (box A3.1). However, in severalcases, it is likely that the claimed spillover does, in fact, figure in the costs andbenefits a student associates with their education:
• some claimed spillovers directly advantage the graduate (eg improvedunderstanding and capacities in areas such as law and taxation);
• benefits to society, family and co-workers will often be reflected back to agraduate (either through the satisfaction it gives or, in the case ofrecognisable contributions to productivity, increased salary and greater jobsecurity); and
• the taxes that apply to higher levels of income and the opportunity tobenefit from the welfare safety net, rather than pursue study andemployment, are likely to be factored into a student’s educational andcareer decisions and are not spillovers, per se.
2 Some authors have noted the tendency for militancy and unrest among university students
and graduates at times. The important point is that the empowering nature of education maynot always be consistent with increased social harmony and compliance with existing lawsand customs. References to the ‘screening’ costs of higher education highlight the use ofeducation as a means of identifying, rather than adding to, the inherent abilities of thosewithin the labour force. This sorting function performs a valuable service for employersseeking workers with those characteristics that are being signalled, yet adds little to theproductivity of workers and imposes a cost on those job seekers that are passed over infavour of credentialed applicants. These costs need to be offset against the value of theinformational benefits that accrue to employers as a result of education investments.

SUBMISSION TO THE REVIEW OF HIGHER EDUCATION FINANCING AND POLICY
66
Box A3.1: Positive spillovers commonly attributed to higher education
• General advances in the stock of knowledge, its application and dissemination.
• Improvements in the quality and character of society.
• Better information transmission (facilitating competition, among other things).
• More favourable attitudes to growth, innovation, new technology and risk.
• Improved voting behaviour and increased political and social awareness (eg highervoter participation and appreciation of issues).
• The emergence of social, cultural, political, economic and moral leaders.
• Reduced crime and anti-social behaviour.
• Higher tax-take from graduates.
• Lower welfare payments associated with improved employability.
• Graduate contributions to the skills and productivity of co-workers.
• Family effects (eg educated children confer benefits on siblings and other familymembers).
• Inter-generational effects (eg learned skills and behaviours passed on to offspring).
• Improved understanding of taxation and other laws.Sources: Derived from Brennan 1971; Hope & Miller 1988; and Chapman & Pope 1992.
Nevertheless, there appears to be a core set of spillovers that might justify apolicy response. However, the magnitude of these benefits and their implicationsfor the appropriate level and distribution of tuition subsidies are important andlargely unresolved issues.
How big are the spillovers?
Measuring the spillover effects from higher education is a difficult task.Spillovers, by their nature, are not explicitly valued in a market context and,while a range of benefits are generally attributed to education, the share of thesebenefits attributable to higher education as opposed to other forms and levels ofeducation has not been resolved. Primary and secondary education are generallyconsidered to provide the foundation for an educated and productive societythrough their fundamental contributions to literacy, general knowledge and socialconditioning, while higher education builds on, and attenuates these attributes.Empirical work by Psacharopoulos (1993) suggests that within OECD countriesboth private and social returns to education (variously taking account of privatecosts, education subsidies, increments to private expected earnings and incometax receipts) are greater for lower levels of education — because higher educationis generally more expensive than other forms of education and because of the

APPENDIX 3: RATIONALES FOR GOVERNMENT INVOLVEMENT
67
diminishing returns from incremental improvements to human capital.Unfortunately, differential spillover effects for different levels of education arenot reflected in social rate of return calculations. Consequently, they give littleguide to the extent that privately motivated education decisions might lead tosocially inadequate outcomes.
The importance of knowledge spillovers as a stimulus to economic growth is acentral focus of so-called ‘new growth theory’, which examines factorsunderpinning improvements in the productivity of capital and labour. Investmentin physical and human capital have been emphasised — along with expenditureson research and development — as sources of beneficial spillovers. Nevertheless,robust empirical evidence of these spillovers remains elusive (Benhabib &Jovanovic 1991; BIE 1992). And although education is likely to be a factor inproductivity improvement and economic growth, the relative contributions ofprimary, secondary, technical and higher education — and the spillovers fromeach of these segments — is highly uncertain. In this context, Dowrick (1995, p.33) noted that:
A safe conclusion seems to be that investment in education does indeed create thepre-conditions for growth, but data and modelling problems do not yet allow anyclear conclusion concerning the allocation of educational investment betweendifferent sectors.
Despite claims that the spillover benefits from higher education are substantialand warrant large scale public subsidies, there is little evidence to support such aview. Although difficulties of measurement, together with the inherentlysubjective nature of valuing cultural and social effects, have hampered empiricalanalysis of education spillovers, some economists have expressed scepticism thatsuch spillovers can be large and, at the same time, defy quantification. Blaug(1972, p. 107) contends that:
The idea that the external or indirect benefits of education to society as a whole areenormous in magnitude and vastly exceed the direct personal benefits to the“educatees” is one of the myths of our times ... because there is virtually noevidence of any kind to support it.
While Cohn and Geske (1990, p. 359) observe that:
It is fascinating — to some observers rather disturbing — that massive governmentaid to higher education is given on the basis of plausible yet unsupportedassumptions regarding the existence of external benefits.
In the Australian context, Fane (1988) and Brennan (1971, 1988) have suggestedthat the spillover benefits of higher education may, in fact, be significantly lessthan is generally assumed. Hope and Miller (1988) note that, in view of the lack

SUBMISSION TO THE REVIEW OF HIGHER EDUCATION FINANCING AND POLICY
68
of evidence, one should be wary of being too dogmatic, although theyacknowledge that with closer scrutiny it is possible to considerably reduce the listof potential spillover benefits.
In response to the limited direct empirical evidence on spillovers, somecommentators have sought to estimate the value of spillover benefits Australiangraduates would need to generate during their life in order to repay thecommunity for the education subsidy received while at university.
• Chapman and Chia (1989) calculated that, for social discount rates of3–5 per cent, the average graduate, retiring at age 60, needed to generateadditional real external benefits of between $600 to $900 per year. At a 10per cent discount rate, the average graduate needed to deliver around $1 800per year in spillovers to justify their education subsidy.
• Harrison (1995a) estimated that, at a 10 per cent discount rate, spilloversvalued at over $3 300 per student per year were required, on average.3
Unfortunately, at the present time, it is not possible to say whether graduates doin fact deliver this level of spillover benefit. While some commentators considerthe level of public subsidy flowing to higher education outweighs the spillovers,others (such as Karmel 1997a) judge that the spillovers are sufficient to warrantmaintenance of the current funding levels.
More rigorous analysis of higher education spillovers is required to guide policydecisions on the efficient level of public contribution. However, it should also beborne in mind that the value of these spillovers sets an upper limit for the publiccontribution and funding policy should be directed at maximising the social pay-offs from public subsidies (see below).
Deciding on the efficient level and distribution of subsidy
The absence of information about the value of spillovers produced through highereducation represents a major hurdle for setting and allocating public subsidies ina way that promotes efficient outcomes. By influencing the cost of particularcourses, subsidies can affect the educational choices of students and the level ofresources attracted into particular activities. What’s more, some activities andstudents may be more responsive to subsidies than others; this can present
3 Methodological differences explain much of the disparity between these estimates. While
Chapman and Chia (1989) calculate the per-student subsidy as the difference between theHECS charge and an estimate of marginal teaching costs, Harrison’s are based on averagecost estimates, and imply a much lower level of cost recovery from students. HECSincreases applying from 1997 have reduced the average level of per-student tuition subsidyand, at a 10 per cent discount rate, would be offset by spillovers from graduates averagingaround $2 000 per year.

APPENDIX 3: RATIONALES FOR GOVERNMENT INVOLVEMENT
69
opportunities for increasing the cost-effectiveness of subsidies offered to increasethe supply of spillovers produced.
Differentiating subsidies by course
To address the spillover problem, the value of tuition subsidies for particularcourses should, in principle, be linked to the value of the social benefits derivedfrom those courses. Various options have been proposed for setting the level ofthe tuition subsidy. Notable among these are proposals to provide subsidies in theform of:
• a fixed annual dollar amount that is uniform across courses (Blandy &Sloan 1988); or
• a fixed proportion of course fees — on a capped or uncapped basis (Karmel1991, 1997a).
Under the first option, all courses would attract a subsidy of the same absoluteamount. This implies that each course generates about the same absolute level ofspillover benefits. This would be administratively simple and could be viewed as‘even-handed’. However, because costs differ between courses, a uniformsubsidy would lead to a significant change in price relativities between courses.In turn, this would create disparate incentives for both course providers andstudents. For example, it would encourage consumption and production ofrelatively low cost/low fee courses simply because these courses obtain a greaterproportionate reduction in their cost (net of the subsidy) than higher cost courses.
This problem could be reduced by introducing a multiple subsidy regime withdifferent absolute dollar subsidy rates for different course groupings — in effect,courses with similar cost structures would be grouped into similar bands. Theresulting subsidy regime would be more complex, but it would provide a lessdifferentiated set of incentives to students. However, to maintain relativitiesbetween courses over time it would also be necessary to monitor changes inrelative costs and link the subsidy for particular courses to a price index so as topreserve its real value.
A proportional subsidy deals with uncertainty over the level and sources ofspillover benefits by seeking to minimise changes in relative prices and therebygenerate a relatively neutral incentive environment. Under this approach thesubsidy would be a fixed proportion of course costs. Thus, while the actual dollarvalue of the subsidy would be higher, the higher is the cost of the course, studentswould be faced with paying a uniform proportion of costs, irrespective of the costof the course they choose. In this sense, a proportional subsidy is less likely todistort student preferences and institutions’ decisions about the nature and formof the courses they offer. But it also implies a higher level of social spilloverbenefits are being generated from more expensive courses, or more precisely, the

SUBMISSION TO THE REVIEW OF HIGHER EDUCATION FINANCING AND POLICY
70
same average level of spillover from each additional dollar of educationexpenditure. From an administrative perspective, it may be appropriate toallocate courses to a number of common categories (on the basis of course costand/or fee levels) and apply a common fixed proportional subsidy to eachcategory.
Faced with uncertainty over the value and sources of spillover benefits to highereducation, the Commission favours the proportional approach. This gives priorityto providing a subsidy with a relatively neutral impact on student choice, ratherthan a uniform dollar subsidy which, while ostensibly even-handed, changesrelative prices and tends to bias student choices — and courses offered byinstitutions — towards relatively low cost/low fee courses.
Promoting the cost–effectiveness of higher education subsidies
The appropriate level of government subsidy does not just depend on themagnitude of the spillovers stemming from higher education — it also dependson the sensitivity of student demand to changes in the prices charged foruniversity courses and other related costs. The less responsive demand for highereducation is to price, the less effective each dollar of subsidy will be inpromoting additional spillovers. And the smaller the potential efficiency gainsthat are available from offering a subsidy to all participants.
Overall demand for higher education is likely to be relatively insensitive tosubsidies because:
• tuition costs generally represent a relatively small share of the total costsincurred by students attending university — this is particularly true atcurrent fee levels. Income forgone generally represents a much moresignificant cost; and
• completion of a university degree can offer big financial pay-offs;– analysis of age-earnings profiles consistently show that, on average,
graduates earn higher incomes than non-graduates (Chapman 1988;Chapman & Chia 1989)
– higher graduate incomes are reinforced by greater levels of graduateemployability (Clare & Johnston 1993)
– analysis undertaken by the Commission, based on indicative incomeprofiles used by Chapman and Salvage (1997) and current HECS fees,shows average private rates of return ranging from about 8 per cent toover 20 per cent per annum, depending on the occupation (appendix4).
Recent behaviour reinforces this view. Firstly, the effect of recent cost increasesassociated with the introduction of HECS on student demand appears to have

APPENDIX 3: RATIONALES FOR GOVERNMENT INVOLVEMENT
71
been slight. Secondly, opinion surveys (commissioned by DEETYA and theHEC) and enrolment trends from 1988 to 1996 suggest that increases inuniversity fees under HECS have not been a significant factor in many students’decisions to attend university (Chapman 1996a).
The Australian experience is supported by various studies of the demand forhigher education in the USA (Maani 1996). They suggest overall price elasticitiesin the range 0.2 to 0.7, implying that a 10 per cent cost increase would reduceenrolments by between 2 and 7 per cent. Freeman (1986) refers to a tuition-elasticity of enrolment of about 0.3 based on a variety of US cross-sectional andtime series studies. Unfortunately, quota restrictions on subsidised undergraduateplaces in Australia make comparable estimation of student demand elasticitiesimpractical. Nevertheless, for the reasons outlined above, and based on the price-demand evidence associated with HECS changes, it is reasonable to concludethat, like the US, aggregate demand for higher education in Australia is likely tobe fairly insensitive to price.
This has a number of potentially important policy implications. These are:
• subsidies to higher education may not be a cost-effective means ofstimulating certain spillovers — particularly if these spillovers are alsoavailable from other activities which are more sensitive to price. Forexample, the behavioural benefits claimed to arise from higher educationmight be greater if subsidies were paid to support relevant secondary schoolactivities or other programs that promote good citizenship to the young.Similarly, it is possible that improvements in law and order might be betterpromoted through improved policing or an expansion of youth programs;and
• a large share of the spillover benefits available from higher education willoccur anyway — as a by-product of the privately motivated decision topursue a university qualification. Hence, general subsidies to highereducation involve a transfer of public funds to a large group of studentswithout materially increasing the level of spillovers produced:– such transfers do not enhance efficiency and may have undesirable
implications for equity; and– administrative costs can significantly erode net efficiency gains,
particularly if total administrative costs grow as the subsidy increases.
Can tuition subsidies be better targeted?
To increase the net social gains from the higher education subsidy direct publicfunding should be directed toward those for whom the decision to engage inhigher education is more finely balanced, and away from those whoseparticipation decisions are less likely to be affected by the availability of the

SUBMISSION TO THE REVIEW OF HIGHER EDUCATION FINANCING AND POLICY
72
subsidy. Ideally, policymakers should aim to match the subsidy as closely aspossible to the minimum amount necessary to induce students to undertakeactivities that produce public benefits — without exceeding the value of thosebenefits. While it is impossible to get this balance right for everyone, it may bepossible to identify broad segments of the student population that require lessinducement, or are likely to deliver fewer spillovers, than others.
A degree of subsidy targeting, consistent with efficient use of public resources,already exists under current higher education funding arrangements:
• the bulk of R&D financial support is awarded on a competitive basis to thebest and most prospective proposals;
• foreign students do not have access to tuition subsidies; and• a system of postgraduate scholarships is available for students of superior
ability.In principle, it would be efficient to subsidise only those students who would nototherwise pursue higher education activities that produced spillover benefits.Alchian (1968, p. 213) highlighted this point, noting that:
If a student were paid for doing what he would have done anyway, or his educationwere subsidised to increase his wealth, he would be receiving a gift. But payment(whether as zero tuition or a money payment) to the student to extend hiseducation, for the sake of achieving real external benefits that he otherwise wouldnot have produced, is a payment for services ... for the benefit of the rest ofsociety.
Maani (1996) notes that, within the spectrum of university participants, olderstudents, women and students from lower socio-economic backgrounds tend toexhibit greater sensitivity to changes in tuition costs. Closer analysis of thefactors that underlie the price sensitivity of these groups might lead to theidentification of traits that have a significant direct influence on participationdecisions, and which lend themselves to targeting. For instance, there is reason tobelieve that family and personal wealth have a strong influence on a student’spreference, and ability to pay, for higher education. Hence, it is conceivable thata reduction or withdrawal of tuition subsidies might have a negligible impact onthe education decisions of students from particularly advantaged backgrounds.Further work in this area is needed to draw out the potential for targeting.4
A more targeted approach could also apply to second degrees and postgraduatestudy. In 1996, over 60 per cent of postgraduates were enrolled under the HECSsystem (DEETYA 1996a). And normal HECS and entry arrangements still applyto second degrees. 4 Chapman (1996a) notes that the assumption that students from wealthy backgrounds have
ready access to family resources can sometimes be erroneous.

APPENDIX 3: RATIONALES FOR GOVERNMENT INVOLVEMENT
73
In the majority of cases, study beyond a first degree is likely to provide adiminishing social return on the public investment represented by the subsidy.This is particularly likely to be the case for courses of a vocational nature andthose that are predominantly coursework. Moreover, many postgraduates, havingbenefited from their first degree, are likely to be both willing and able to fundtheir additional study. Davis (1996, p. 16) suggests that:
... the case for public subsidy of graduate diplomas and Masters by courseworkdegrees seems flimsy. The great majority of such degrees are undertaken part-time... often with employers support of fees and with direct personal careeradvancement as a primary goal.
There would appear to be a case, based on an expectation of diminishingspillover benefits from additional (and/or duplicative) education, for reducing (oreven eliminating) the level of public subsidy generally available to studentspursuing second degrees and postgraduate courses that are strongly vocational.However, the Commission considers that mechanisms for rewarding andencouraging academic excellence should be retained and reinforced as necessary.It notes the existence of postgraduate scholarships within the current environmentas a means by which talented students — those displaying the potential to make asignificant intellectual and economic contribution to this country — can gainpublic support for their further study.
Other possibilities for targeting also deserve consideration. For example, whilestudies involving a significant amount of original research might generate higherlevels of spillover benefits, this may be truer of theoretical research than thatwhich is highly applied. It is also feasible that lower levels of spillover benefitare generated by students performing poorly in their course (yet failing studentscurrently attract greater amounts of subsidy than their peers). These issueswarrant consideration in the context of the flow of spillover benefits expectedfrom particular higher education activities and student groups, and opportunitiesand incentives for progression through the various stages of higher education —recognising that different stages might offer different combinations of potentialprivate and social benefit.
Problems in the capital market
Problems associated with financing education arise because the associated skillsand knowledge acquired cannot be separated from the individuals that possessthem, nor in a ‘slave-free’ society can ownership be extended to individuals ortheir future earnings streams. For instance, with most investments, if a borrowerdefaults on a loan the lender has a residual claim on the asset — this facility isnot available with investments in education.

SUBMISSION TO THE REVIEW OF HIGHER EDUCATION FINANCING AND POLICY
74
As a result, people wishing to invest in their education tend to have less securityto offer lenders than if they were seeking to borrow against a physical asset. Andhigh variations in the private returns on education compound the uncertainty ofrepayment facing lenders. Consequently, if financiers are willing to lend, it islikely to involve a relatively high interest premium. While equity financing andthe existence of venture capital markets help overcome problems of risk sharingfor commercial entities, they offer less of a solution to student-borrowers becauseof the impracticality of transferring human capital assets, the absence of limitedliability arrangements and difficulties facing commercial entities in keeping trackof student-borrowers over their lifetimes(Friedman 1955).
There is some disagreement among economists about the efficiency implicationsof financiers’ reluctance to lend for investment in education. Harrison (1995a)argues that capital market problems represent one of the strongest arguments forgovernment intervention in higher education, while Fane (1988) considers thatthe efficiency case for special treatment of student-borrowers is not compelling.However, in the Commission’s view, there is justifiable cause for concern whenan entire class of income-earning assets, comprising the skills and potential ofAustralians from a variety of backgrounds, faces major difficulties in gaining thefinancial backing necessary for development.
Policy responses to capital constraints
Overseas experience with student loan programs has been mixed.Woodhall (1987) reports on a range of programs incorporating measures such asinterest rate subsidies, deferred repayment, income contingent repayments andloan guarantees.
She notes that, while there have been some instances of private student lending(generally operated by individual colleges, universities and charitableorganisations), loan guarantee arrangements have generally underpinned studentsloans offered by commercial financiers. However, in most cases, student loanprograms tend to be operated by, or on behalf of, governments.
Problems with loan guarantees and income-contingency
Several problems are likely to be associated with arrangements that effectivelytransfer a large share of the risk of educational investment to the government:
• government underwriting of student loans gives lenders an incentive toreduce the stringency of their assessment procedures because they no longerbear the cost of poor lending decisions; and– payment of an interest rate subsidy or application of some sort of
‘insurance’ charge in combination with full or partial guarantee

APPENDIX 3: RATIONALES FOR GOVERNMENT INVOLVEMENT
75
arrangements could be a more efficient means of addressing collateralproblems faced by borrowing students.
• income contingency arrangements result in the lender bearing a large shareof the risk that education investments will not deliver the expected pay-offs(in terms of future earnings):– the degree of risk sharing depends on the level of the repayment
threshold and the interest rate (or income-sharing) arrangements thatare in place;5 and
– if borrowers derive a large consumption benefit (eg pursue highereducation as an enjoyable pastime rather than as an income-generatinginvestment), they may face an incentive to under-achieve or under-utilise — from a financial perspective — the skills and knowledgethey have accumulated. This incentive can be magnified whenattainment of the repayment threshold triggers repayments that leavethe borrower worse off (within a range of income above thethreshold), despite being on a higher income.
Current HECS arrangements embody the latter risk in that, for a range of incomelevels above the threshold, repayments exceed the additional income earned(appendix 5). In contrast, New Zealand’s student loan scheme employs a muchlower repayment threshold, coupled with payments linked to over-thresholdearnings.
Arguments for government provision of student loans
Hope and Miller (1988) note that one explanation for the reluctance of financialinstitutions to initiate income contingent loan schemes may be the cost ofcollecting accurate information on student income, given that these institutionshave no legal right to obtain this information.
The government may be able to implement an income-related scheme at a lowercost than the private sector — both the Medicare levy and HECS currentlyoperate through the tax system. As a sole supplier, the government can span awider range of students, thereby achieving a more diversified portfolio of loansand contingent liabilities. These potential advantages, however, could be eroded
5 In some respects, income-contingent loan repayments mirror an equity finance arrangement
for human capital in that payments are not required if the ‘investment’ performs poorly(from an earnings perspective) and it is feasible to link the size of the repayments to the sizeof the over-threshold earnings (Nerlove 1975). However, they fall short of an equity financearrangement to the extent that the lender’s income from a profitable investment is limited tothe loan amount plus interest, while the borrower reaps all earnings beyond that. As aconsequence, an efficient balance of risks and rewards may not be achieved between thepartners.

SUBMISSION TO THE REVIEW OF HIGHER EDUCATION FINANCING AND POLICY
76
if administrative costs under a government scheme proved to be higher thanunder a private sector program.
The issue of collateral raises important fairness issues which are oftenintertwined with efficiency arguments. Barr (1993), for instance, argues thatstudents from poor backgrounds are less willing and less able to borrow and thatthis results in inefficiency because it ‘wastes talent’. The relevant policy concernis that students from disadvantaged groups are over-represented among those thatfail to secure finance.
In this context, there are clear equity rationales for government intervention incapital markets. Wealthy families can internally finance education for theirchildren, while a student from a poorer background with the same ability and riskattitude as a wealthier student is more likely to face a borrowing constraint. Thedesirability of breaking the link between socio-economic background andlifetime outcomes relates to the ‘equality of opportunity’ objective of highereducation. This is taken up later in the discussion of equity.
Information deficiencies
Concerns about the adequacy of information can provide a rationale forgovernment involvement in higher education. These centre around issues ofquality assurance/monitoring, awareness of institutions and their products, andthe ability of students and universities to recognise and respond to emerging skillneeds within the economy.
Quality and accreditation
Information has public good characteristics in that, once it is collected andassimilated, it can often be easily and cheaply distributed. Indeed, it is oftendifficult or impossible for the original supplier of information to preventdissemination. In cases where a gatherer or provider of information receives nopayment from beneficiaries, there is a reduced incentive to provide this service,even though its value may be many times its cost.
Difficulties faced by students in assessing prospective labour market conditionsfor particular skills or comparing the value for money represented by differentinstitutions may be associated with this phenomenon. Similarly, employers or thegeneral public may face high individual costs in gathering information on thequality and skill levels of graduates emerging from different universities.
Tirole (1990) notes that, in such cases, a solution may be to share the cost ofinformation gathering amongst a group of beneficiaries. However, to the extentthat not all beneficiaries can be found or persuaded to join the ‘club’, theinformation may be under-provided. In these circumstances, there may be a case

APPENDIX 3: RATIONALES FOR GOVERNMENT INVOLVEMENT
77
for government action to support information collection and provision (with thepossibility of levying beneficiaries).
At present, information on universities is provided through a number of publicand private sources. Universities provide a range of promotional material andstudent guidebooks are available that compare university courses and facilities.The Graduate Careers Council of Australia also provides information on theemployment rates and income of recent graduates together with information ontheir course experiences. These sources are supplemented by career advisoryservices, employer recruitment campaigns and the student ‘grapevine’.Nevertheless, the adequacy of these mechanisms in ensuring appropriate andreliable information to domestic and overseas students, and their influence onuniversity and vocational decisions, is difficult to determine.
Accreditation and quality assurance procedures relating to institutions andcourses can help reduce the costs faced by students in making their own qualityassessments by assuring minimum teaching and curriculum standards are adheredto. However, while accreditation and minimum standards can be in the interestsof those students that are seeking courses with the attributes specified by thesestandards, they can also impose costs on those students willing to accept lowerquality courses at lower prices (Harrison 1995b). Imposed standards can alsounnecessarily restrict variety in the education market and can be used to limit thesupply of new graduates in some professions — thereby driving up ormaintaining the incomes of established members. The anti-competitive potentialof accreditation arrangements is an issue that governments need to be aware of,and monitor.
Manpower planning and national priorities
The essence of manpower planning is the development of labour market forecastsand intervention by government to reduce likely market imbalances and/orpromote ‘efficient’ adaptation. Such planning is viewed as being more importantin areas where there is a sizeable time-lag between an initial policy response andan associated impact on the labour market. Higher education provides anexample where supply responses may lag labour market demands by 3 to 6 yearsor more.
While recognising a potential role for such ‘planning’, it is important not tooverlook the incentives that students, industry and educators have to interactdirectly with one another and the function of relative prices (salaries) and marketinformation in signalling the level of demand for labour in particular skill areas.Moreover, opportunities for skill adaptation and drawing on labour in othermarkets (both domestic and foreign) can relieve mismatches between supply anddemand.

SUBMISSION TO THE REVIEW OF HIGHER EDUCATION FINANCING AND POLICY
78
Although students and industry do not have perfect foresight of future labouropportunities and levels of remuneration, neither do bureaucratic planners.Experience abroad suggests that planned models of skill needs generally have notperformed well relative to less centralised approaches (Blaug 1972; Hinchliffe1987a). In the Australian context, various analysts have been sceptical about thebenefits of manpower planning (Australian Universities Commission 1976;Niland 1984; and the Kirby Committee 1985). However, there may be scope forgovernments to perform a useful role through the development of broad-basedindicative scenarios to stimulate discussion and dialogue between institutions,industry and students. The Australian Workplace series produced by DEET(1995b) is an example of such work.
Beyond this, successive governments have asked higher education institutions togive priority to particular areas of study and allocated funds accordingly. Forexample, computer science, engineering, accountancy and business studies,teacher education in maths and science and foreign languages and Asian studiesand environmental studies have been highlighted as national priority areas ofteaching.
Impediments to best practice/performance
Various factors may impede the flow of information relating to ‘best practice’techniques and processes within the higher education sector. Market failures canarise in this context because of:
• the public good nature of information relating to new techniques and theirapplication;
• uncertainty about the benefits of new techniques relative to their costs; and• indivisibility problems.There are many options available to deal with such market failures. Serviceproviders can seek to overcome the problems themselves though facilitating themovement of employees between institutions (both at a domestic andinternational level) and agreeing to cooperate in the exchange of certaininformation.
Governments can also respond in various ways. For example, Australiangovernments have recently endorsed moves to open aspects of universityoperations up to greater competition. This endorsement takes the form of anational competition policy agreement in response to the report of the HilmerCommittee (1993) and extensions to the Trade Practices Act that cover, amongstother things, the conduct and terms of operation of publicly-owned businessenterprises (NCC 1997b). While the extent to which the core teaching functionsof public universities will be subject to ‘competitive neutrality’ arrangements is

APPENDIX 3: RATIONALES FOR GOVERNMENT INVOLVEMENT
79
unclear, this legislation highlights the widely held desire for public entities tocompete on their merits and be responsive to market forces.
Other responses include the establishment by the government of variousnetworking mechanisms. In this context, successive governments haveestablished university teaching and development committees to provide advice onthe provision of grants in support of identifying and promoting practicalimprovements in teaching practice and to provide development opportunities foracademic staff. The Federal Government has also provided continuing support tothe Open Learning Initiative directed at facilitating the continuing developmentof more flexible access arrangements for tertiary education. A key aspect of thisinitiative involves the better use of modern communications technology toenhance instructional options for students (appendix 2).
Actions by governments in these areas need to be continuously re-assessed toensure that taxpayers are getting value for money. Specific programs supportingperformance enhancement initiatives should also seek to complement rather thancompete with market-based responses.
A3.2 Equity rationales
Successive Australian governments have seen higher education as a valuableresource in which all segments of the community should have the opportunity toshare. To this end, they have sought to improve the access and participation ofindividual’s belonging to identified disadvantaged groups through a range offinancial and other measures.6
Issues of central importance to the use of higher education as an equityinstrument are discussed below in the context of inter-generational benefits andequality of opportunity, and the regressivity of higher education subsidies.
Inter-generational benefits and equality of opportunity
The high correlation between educational attainment and income is widelyaccepted as evidence of the ability of education to improve the financialprospects of recipients. And, importantly, improvements in socio-economic statusobtained through higher education can cascade to subsequent generations.
6 Equity target groups include: indigenous Australians; people from low income families;
women (in non-traditional areas of study); people from isolated areas; people from non-English speaking backgrounds; and students with a disability.

SUBMISSION TO THE REVIEW OF HIGHER EDUCATION FINANCING AND POLICY
80
There is a considerable body of evidence suggesting that educational values, aswell as genetically inherited ability, are transmitted to subsequent generations viathe family relationship (eg Hope & Miller 1988; Clare & Johnston 1993). That is,parents who pursued higher education are more likely to have children thatpursue higher education. And, according to Richardson (1988), although parentaleducation and income tend to be correlated, it is generally the former that has thegreater (but by no means decisive) influence on the education and career choicesof the offspring. Nevertheless, while parental influences can provide only apartial guide to the educational outcomes of subsequent generations, there is littledispute that a link does exist and that it might provide a way of reducing thetransmission of poverty from one generation to the next.
However, it is possible that equity and access objectives may be more effectivelymet if subsidies targeting equity are channelled outside the tertiary educationsector. For instance, analysis of school retention and matriculation rates suggeststhat increasing the incentives for participation in the latter years of secondaryschool might be a better way of encouraging increased participation in highereducation by target groups (Williams 1987; Miller & Volker 1987). And there isthe broader issue of whether assisting poor students into higher education islikely to be the most effective way of achieving equity goals. Harrison (1995a,p.6) observes that:
Although it may be possible to come up with subsidies to specific higher educationstudents that improve equity, there are better ways of helping the poor. ... Manydisadvantaged students do not go on to higher education due to low academicability and aspirations and cannot benefit from subsidies at the higher educationlevel. ... Education subsidies and reform efforts targeted earlier in the educationprocess will be more equitable. Cutting education expenditure and otherprogrammes or reducing regressive taxes may be a further improvement.
The regressivity of higher education subsidies
Subsidies to higher education are motivated, in part, by equity concerns and adesire to improve access and earnings opportunities for students fromdisadvantaged groups. However, there are at least two grounds for questioningthe broader equity implications of the taxpayer-funded general subsidies to highereducation students:
• those that have the intellectual ability to engage in higher education arelikely to have a natural advantage over many other members of thecommunity, irrespective of whether they progress to university or not. As aconsequence, subsidies to this group could be perceived as a ‘doubleblessing’. Alchian (1968, p. 206) put the case powerfully when he wrote:Subsidised higher education, whether by zero tuition, scholarships, or zero-interestrates, grants the college student a second windfall — a subsidy to exploit his initial

APPENDIX 3: RATIONALES FOR GOVERNMENT INVOLVEMENT
81
windfall inheritance of talent. This is equivalent to subsidising drilling costs forowners of oil-bearing lands in Texas.
• university students tend to move from low income levels whilst studying, torelatively high income brackets after graduation.
Viewed from either of these perspectives, subsidies to higher education could beseen as public transfers to relatively wealthy segments of society.
Statistical information shows participation in higher education variessignificantly between socio-economic groups. Figure A3.1 highlights thepredominance of students from advantaged socio-economic backgrounds atuniversity. Drawing on data for 1989, it shows disparities in the representation ofparticular groups and socio-economic characteristics at university. Theproportion of commencing students from the wealthiest 25 per cent of Australianfamilies was 10 percentage points greater than their share of the generalpopulation, while students from poorer families had participation shares about 8percentage points less than their share of the population. Similarly, the universitypopulation appears to be skewed toward students that attended private schoolsand those with parents in professions. Students from blue-collar backgrounds andgovernment schools were significantly under-represented at Australianuniversities. Data for more recent years suggest similar trends.
Figure A3.1: Deviation of the background characteristics of commencing university students from the population cohort, 1989a
Parents’ occupation
-10 -5 0 5 10 15
Professional
Managerial
White collar
Skilled
Semi-skilled
Unskilled
Per cent
Parents’ education
-5 0 5 10
Postsecondary
Completedsecondary
Somesecondary
Primary
Per cent

SUBMISSION TO THE REVIEW OF HIGHER EDUCATION FINANCING AND POLICY
82
Family wealth
-12 -8 -4 0 4 8 12
Wealthiest 25%
Middle 50%
Poorest 25%
Per cent
School attended
-20 -10 0 10 20
Private
Catholic
Government
Per cent
a The figures show the difference between the percentage of university entrants with particular backgroundcharacteristics and the percentage of 19 year olds with these characteristics in the general population.Source: ACER 1993 as cited in Clare & Johnston 1993.
1991 census data show that over 60 per cent of higher education students camefrom households with family incomes in excess of $40 000 per year, and 56 percent of these had family incomes greater than $60 000 per year. In 1991, themedian income of Australian families was about $32 500; and that of all familieswith dependent children aged 15–24 was $35 500.7 Taken at face value, thissuggests that wealthier families within the community are significantbeneficiaries of government subsidies to higher education.
However, when taxpayer contributions to government revenue are viewedalongside patterns of expenditure, higher education subsidies look less regressive.Figure A3.2 suggests that, rather than representing a redistribution from the poorto the rich, subsidies to higher education might be better characterised as‘revenue recycling’. They reflect a redistribution of tax receipts from middle andupper income families to the children of middle and upper income families.While such recycling may be inefficient, its ramifications for equity are moresubtle and less regressive than is often claimed. Nevertheless, viewed against thebackground of other government benefits, it is true that higher educationsubsidies certainly do not mirror the highly redistributive effects of other socialpolicy expenditures.
If equity is a goal of higher education policy, it is apparent that general tuitionsubsidies are a rather poor device for achieving this objective — the opportunityto benefit from tuition subsidies is grasped with greater frequency by the well-off 7 Further analysis of unpublished ABS data shows the median family income of students (aged
15–24) attending university in 1991 was about $50 700, while the median income of familieswith dependent children aged 15–24 not attending university was around $34 700.

APPENDIX 3: RATIONALES FOR GOVERNMENT INVOLVEMENT
83
than by the poor. More targeted measures are necessary to encourage studentsselectively from poorer backgrounds to pursue further education. Importantly,such encouragement, while having university as its goal, might more efficientlyinvolve targeting these students during their late secondary school years.
Given the strong pecuniary benefits normally associated with higher education, asystem of student loans has often been presented as being preferable to grants(and particularly non-means tested grants) on equity grounds (Woodhall 1987).Such loans may prove to be an attractive means of shifting the burden of highereducation funding from the general community to those who reap the substantialbenefits of that education, yet do not have the means to pay their tuition andliving costs during their study years.
Figure A3.2: Share of taxes and government benefits by householdincome quintiles, 1993–94
0
10
20
30
40
50
60
70
Direct taxa Indirecttaxes
Totaltaxes
Tertiary Totalindirect
benefitsc
Totaldirect
benefitsd
Totalbenefitse
Lowest 20%
Second
Third
Fourth
Highest 20%
per cent
a Personal income tax and the Medicare levy. b Tertiary education indirect benefits were calculated by dividingthe amount of government subsidy by the number of students, net of HECS. c Indirect benefits consist of goodsand services provided free or at subsidised prices by the Commonwealth, state or local government. d Directbenefits consist of cash payments from government (eg AUSTUDY). e Total benefits before tax.Source: ABS 1996d.
Student loans also have the benefit of improving educational access by providingthe means to enter courses and institutions that do not benefit from HECSdeferred repayment arrangements. At present, student loan facilities mirroringHECS are not generally available to students pursuing their studies in the TAFEor private education systems, or those wishing to take a place in the UNS as a fullfee-paying student from next year (Chapman 1996a).
SUBMISSION TO THE REVIEW OF HIGHER EDUCATION FINANCING AND POLICY
84
A3.3 Performance monitoring and accountability
Both in Australia and overseas, substantial government funding is provided insupport of the teaching and research activities of universities. Beyond this, anumber of programs focussing on specific purposes, such as access and equitygoals, are also funded by governments.
In view of this substantial commitment to higher education, governments have aresponsibility to develop mechanisms for monitoring the performance of theseinstitutions and to hold them accountable for the effective use of public finds.The nature of these mechanisms varies between countries reflecting differencesin the degree of autonomy extended to universities and the nature of the widerpolicy framework applying to universities (OECD 1990).
Differences in the method of financing higher education institutions will affectthe design of performance monitoring and accountability mechanisms. In general,centralised approaches to funding that lack built-in performance incentives arelikely to necessitate elaborate monitoring and accountability mechanisms torepresent the interests and capacities of clients and individual institutionsadequately.
However, even in the case of a student-based approach to funding, it will benecessary to have some monitoring and accountability mechanism to ensure thatthe markets established are operating effectively. At a minimum, there is a needto ensure subsidy programs and other areas of public expenditure are providingvalue for money and, in addition, to monitor the impact of competition on courseofferings and quality standards. Processes of accreditation and quality assurancethat ensure public monies are only flowing to organisations offering programs ofacceptable quality need to form part of this accountability mechanism. However,these processes need to be effectively designed to avoid unnecessary restrictionson choice and innovation.
In designing and applying monitoring and accountability mechanisms to thehigher education sector, some basic principles should apply:
• such mechanisms should be strategically based (ie they should explicitlyaddress the government’s policy objectives and ensure that the strategicplans of universities are consistent with these objectives);
• reporting requirements across jurisdictions should avoid duplication;• reporting systems should be simple and well-focussed, thereby avoiding
requests for unnecessary data;• impediments to institutional flexibility and autonomy should be minimised;
and

APPENDIX 3: RATIONALES FOR GOVERNMENT INVOLVEMENT
85
• annual reports from educational institutions should provide informationwhich satisfies the reporting requirements of stakeholders.
In response to perceived deficiencies in existing monitoring and accountabilityprocesses, the Government has announced a review of existing reportingrequirements (Vanstone 1996a). Decisions arising from the West Review arelikely to have important implications for future monitoring and accountabilityprocesses.

87
APPENDIX 4 PRIVATE RATES OF RETURNTO HIGHER EDUCATION
University graduates enjoy many benefits from undertaking higher education.Gregory (1995) has estimated that university graduates can, on average,command incomes 1.7 times higher than those who only complete secondaryschool. University graduates also tend to work in industries with higher rates ofemployment growth. Between 1968–69 and 1989–90, half of all new full-timejobs went to university graduates, although they accounted for only 14 per cent ofthe labour force (Maglen 1993; ABS 1996a). University graduates also benefitfrom lower rates of unemployment, shorter durations of unemployment andgreater on the job training (ABS 1996a, 1994).
This appendix compares the private rates of return to higher education for aselection of occupations drawing on work by Chapman and Salvage (1997). Theanalysis takes account of recent reforms to undergraduate fees (appendix 2) andexamines the implications of different degrees of cost recovery under a revisedHECS regime. It also comments on the implications of recent and proposedchanges to fee structures on student participation in the higher education sector.
A framework for examining the costs and benefits of higher education is outlinedin section A4.1. The data sources and assumptions underlying the analysis arepresented in section A4.2. Private rates of return to different occupations arepresented, under a range of fee scenarios, in section A4.3. A summary ispresented in section A4.4.
A4.1 A framework for examining the costs and benefits ofhigher education
There are several theories that explain why individuals undertake educationbeyond compulsory schooling (see Schultz 1961; Becker 1964, 1975; Spence1974; Layard & Psacharopoulos 1974). The methodology employed in thisappendix originates from the human capital theory of education. According tothis theory, the decision to undertake higher education is an investment decision.People are willing to incur initial costs in return for expected future benefits fromobtaining a university qualification.
This appendix focuses purely on the pecuniary costs and benefits associated withhigher education, although it is recognised that non-pecuniary costs and benefitsare also relevant in the overall decision making process.

SUBMISSION TO THE REVIEW OF HIGHER EDUCATION FINANCING AND POLICY
88
Costs of higher education
Students, assumed to finish secondary school at age 18, are faced with thedecision either to ‘invest’ in higher education or commence full-timeemployment. The main cost to a student of undertaking higher education is theincome foregone by choosing to study. Foregone income is often assumed to beequal to the actual income of people who obtain employment after completingsecondary school.1 However, this implicitly assumes that students have zeroearnings. In practice, many tertiary students undertake casual or part-time work.2Part-time earnings reduce the opportunity cost of higher education.
It is often argued that the students choosing to attend university have greaterinnate ability and could command a higher wage even if they did not attenduniversity. If this is correct, the opportunity cost of attending university (afteradjusting for part-time earnings) would be higher than assumed here, overstatingthe measured returns to higher education.
There are also direct costs associated with studying, such as the cost of materialsand books, that would not otherwise be incurred. The basic costs of living are notincluded as an ‘investment cost’ as these would be borne whether or not theperson was studying.
Australian students also pay a HECS charge. This charge can be paid upfront(attracting a discount) or deferred and paid through the tax system (appendix 2).The HECS charge is modelled as a deferred liability, as 75 per cent of studentselect to take this option (Chapman 1996b). As HECS is not usually paid duringthe investment years, it is modelled as a reduction in graduate income and not asa direct cost.
The burden of any HECS debt borne by students diminishes with time as deferredpayments are only indexed to preserve their real value (appendix 5). The burdenmay be further diminished if graduates are able to shift part of the cost on to theirfuture employers through the payment of compensatory increases inremuneration. In this sense, the final incidence of student fees is likely to varyacross different occupational groups and over time in response to changes in therelative demand and supply of graduates.
The total costs of higher education borne by a student are related to the numberof years it takes to complete a university degree. Students undertaking a five yeardegree, as opposed to a three year degree, make a bigger investment as theyforego an extra two years income and incur the direct costs of education for
1 It is assumed no further education and training is undertaken by these people.2 Flatau and Simpson (1996) found that approximately 95 per cent of full time tertiary
students were in paid part-time employment.

APPENDIX 4: PRIVATE RATES OF RETURN TO HIGHER EDUCATION
89
another two years. The results presented later in this appendix take account ofvariations in course length.
Benefits of higher education
The main expected pecuniary benefit from higher education is a higher lifetimeincome stream.3 For simplicity, the entire income differential betweennon-graduates and graduates is attributed to higher education. Nevertheless, it isrecognised that some of the differential can be attributable to innate ability,socio-economic background and effort (Hunt & Hicks 1985). The result of nottaking these other factors into account overstates the measured benefits of highereducation. Many studies have attempted to isolate the effect of education onincome from these other factors (eg Hinchliffe 1987b; Psacharopoulos 1975).After controlling for other factors, education and age are the two most importantfactors that influence earnings. As ability, socio-economic background andeducation are correlated, any estimate that attempts to disentangle their separateeffects will be essentially arbitrary (Norris 1993).
Calculating the rate of return to higher education
Figure A4.1 illustrates the investment process for a stylised Australian graduate,incorporating the pecuniary costs and benefits associated with studying. Thisgraduate is assumed to leave secondary school at age 18, study full-time atuniversity, and then work full-time until retirement.4 Using this stylisedage-earning profile, the pecuniary costs and benefits of higher education arerepresented by areas C and B, respectively (figure A4.1).
3 It is well established that people with higher levels of education have higher earnings.
Human capital theory links education and earnings via productivity — higher levels ofeducation make employees more productive and hence they typically earn higher levels ofremuneration.
4 Retirement age is assumed to be 55. The results are not highly sensitive to this assumption.

SUBMISSION TO THE REVIEW OF HIGHER EDUCATION FINANCING AND POLICY
90
Figure A4.1: A stylised age-earnings profile
-10 000
0
10 000
20 000
30 000
40 000
50 000 graduate earningsretirement
non-graduate earnings
HECS repayments
B
C
$
graduation
Age5521
This cost-benefit framework is extremely flexible and can accommodate a varietyof different profiles, such as people leaving the workforce to raise children andsubsequently resuming employment at a later stage. Although it is possible tomodel these scenarios, they require considerably more information and have notbeen modelled here.
To evaluate a student’s decision to invest it is necessary to weigh up the presentvalue (PV) of costs (C) and benefits (B), as the costs and benefits of highereducation are incurred over different time periods. Any investment is consideredprofitable when the net present value (NPV) is greater than zero(NPV=PVB-PVC>0). However, this requires information about each person’stime preference or discount rate — the rate at which they need to be compensatedfor foregoing income today in order to achieve greater future income. As eachperson has their own discount rate, the point at which an individual decides toundertake higher education differs for every person. This results in an infinitenumber of possible returns to higher education.
However, it is possible to determine the minimum rate of return that anindividual would need to earn to consider higher education a profitableinvestment. This is the point where the discount rate sets the NPV to zero(NPV=PVB-PVC=0) (Chia 1990). This discount rate is known as the internal rateof return (IRR) and is interpreted as the private rate of return to higher education.An individual considering undertaking a course of study could be presumed tocompare this rate of return with the rate of interest available for alternativeinvestments or, if the individual borrows to finance their study, the cost offinance.
In deciding whether to undertake higher education, the IRR and NPV methodswill generally lead to the same conclusion. However, when comparing the
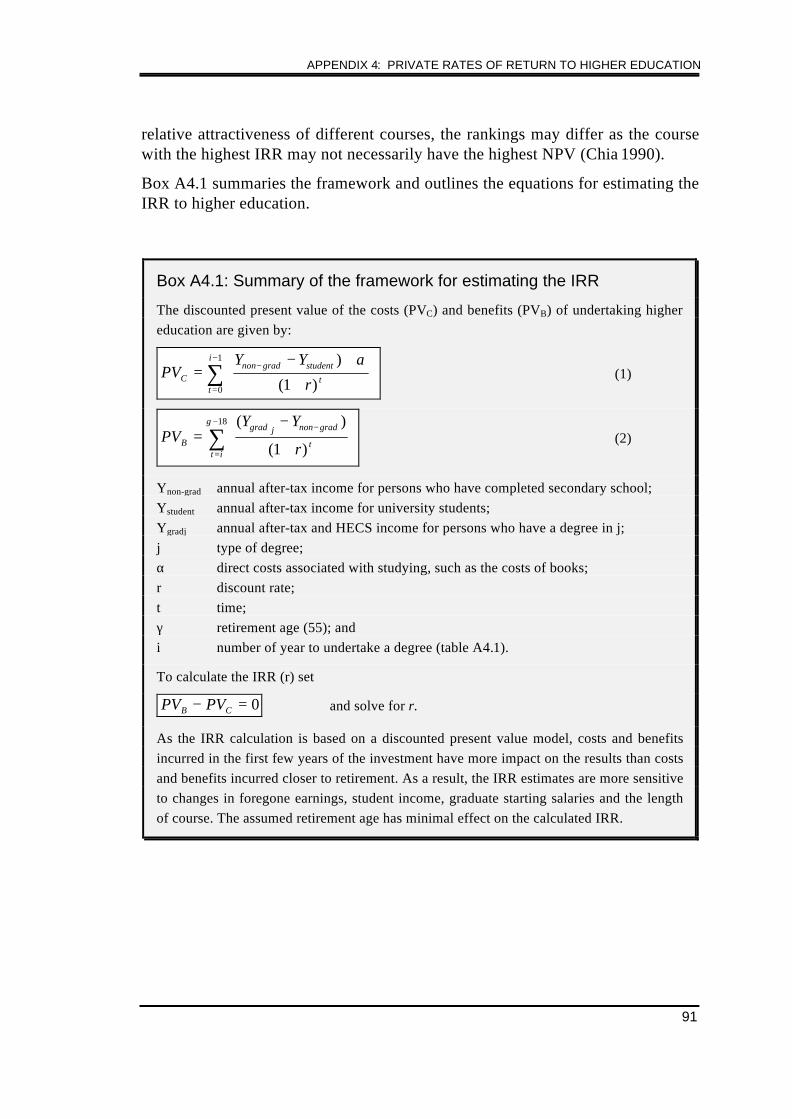
APPENDIX 4: PRIVATE RATES OF RETURN TO HIGHER EDUCATION
91
relative attractiveness of different courses, the rankings may differ as the coursewith the highest IRR may not necessarily have the highest NPV (Chia 1990).
Box A4.1 summaries the framework and outlines the equations for estimating theIRR to higher education.
Box A4.1: Summary of the framework for estimating the IRR
The discounted present value of the costs (PVC) and benefits (PVB) of undertaking highereducation are given by:
PVY Y
rCnon grad student
tt
i
=− +
+
−
=
−
∑)
( )
α
10
1
(1)
PVY Y
rB
grad j non grad
tt i
=−
+
−
=
−
∑( )
( )1
18γ
(2)
Ynon-grad annual after-tax income for persons who have completed secondary school;Ystudent annual after-tax income for university students;Ygradj annual after-tax and HECS income for persons who have a degree in j;j type of degree;α direct costs associated with studying, such as the costs of books;r discount rate;t time;γ retirement age (55); andi number of year to undertake a degree (table A4.1).
To calculate the IRR (r) set
PV PVB C− = 0 and solve for r.
As the IRR calculation is based on a discounted present value model, costs and benefitsincurred in the first few years of the investment have more impact on the results than costsand benefits incurred closer to retirement. As a result, the IRR estimates are more sensitiveto changes in foregone earnings, student income, graduate starting salaries and the lengthof course. The assumed retirement age has minimal effect on the calculated IRR.

SUBMISSION TO THE REVIEW OF HIGHER EDUCATION FINANCING AND POLICY
92
A4.2 Data sources
Foregone income
All age-income profiles used in this appendix were supplied, on special request,by Chapman and Salvage (1997). The original source of the income profiles forpeople without post-secondary school qualifications is the Department of HumanServices (1995), National Drug Strategy Household Survey. All estimates are in1996 dollars.
Student income
Student employment tends to be part-time or casual, with large variations in thenumber of hours worked each week. Robinson (1996) uses the AustralianLongitudinal Survey to estimate the average hours worked per week and theaverage hourly wage for all students.5 Using Robinson’s estimates, theCommission estimates university students aged 18–21 years earn, on average,$5 960 per year (1996 dollars). Although, these estimates are not broken downaccording to gender, male students tend to earn more per hour, but females workslightly more hours per week, resulting in similar average yearly incomes formales and females (Robinson 1996).
Books and tuition costs
Tuition costs, using a previous estimate provided by the then DEET (1987), havebeen indexed to approximately $1 054, in 1996 dollars (Chia 1990).
Number of years at university
To calculate the total cost of a student’s investment in higher education, it isnecessary to specify the number of years spent at university (ie the number ofyears of investment). This is not a straightforward task as course lengths varyacross courses and institutions. Furthermore, students often take longer than theminimum time to complete their degree. To overcome these problems, a selectionof courses was examined. Students are also assumed to complete their degree inthe minimum time. Lengths of the selected courses are outlined in table A4.1.
5 The Australian Longitudinal Survey has detailed employment records over an entire year
rather than a single point in time, thus overcoming the problem of week to week fluctuations.
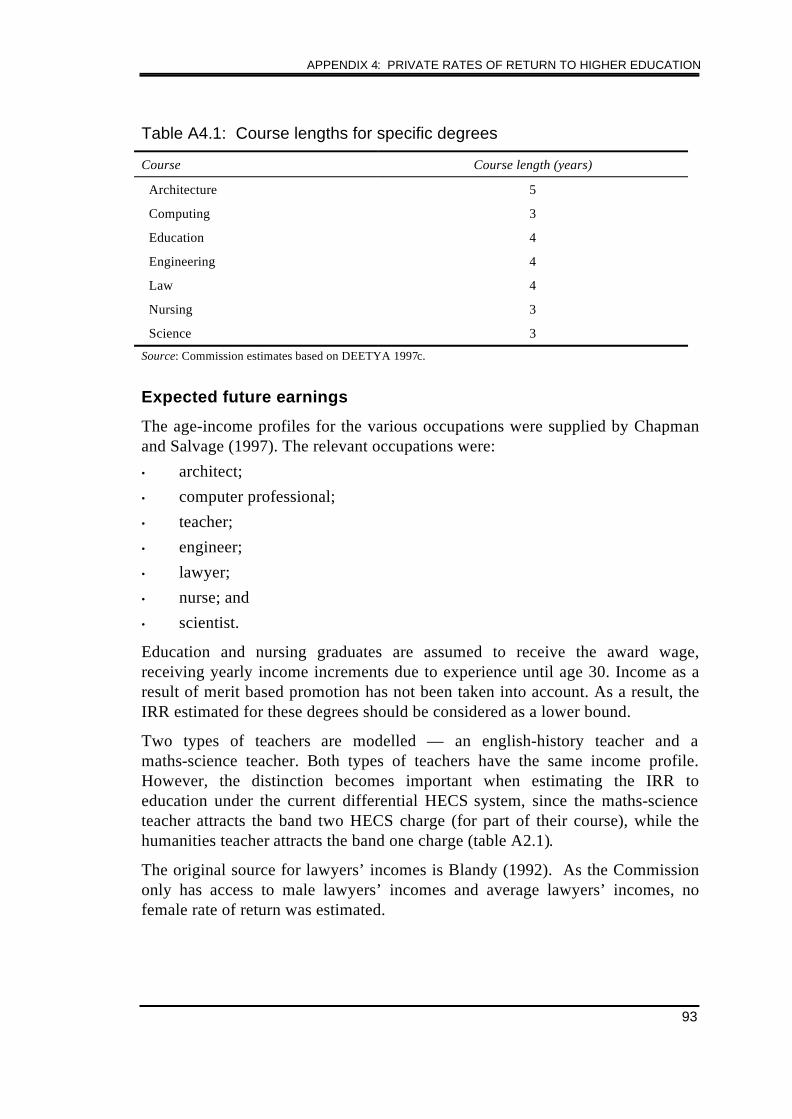
APPENDIX 4: PRIVATE RATES OF RETURN TO HIGHER EDUCATION
93
Table A4.1: Course lengths for specific degrees
Course Course length (years)
Architecture 5
Computing 3
Education 4
Engineering 4
Law 4
Nursing 3
Science 3
Source: Commission estimates based on DEETYA 1997c.
Expected future earnings
The age-income profiles for the various occupations were supplied by Chapmanand Salvage (1997). The relevant occupations were:• architect;• computer professional;• teacher;• engineer;• lawyer;• nurse; and• scientist.
Education and nursing graduates are assumed to receive the award wage,receiving yearly income increments due to experience until age 30. Income as aresult of merit based promotion has not been taken into account. As a result, theIRR estimated for these degrees should be considered as a lower bound.
Two types of teachers are modelled — an english-history teacher and amaths-science teacher. Both types of teachers have the same income profile.However, the distinction becomes important when estimating the IRR toeducation under the current differential HECS system, since the maths-scienceteacher attracts the band two HECS charge (for part of their course), while thehumanities teacher attracts the band one charge (table A2.1).
The original source for lawyers’ incomes is Blandy (1992). As the Commissiononly has access to male lawyers’ incomes and average lawyers’ incomes, nofemale rate of return was estimated.
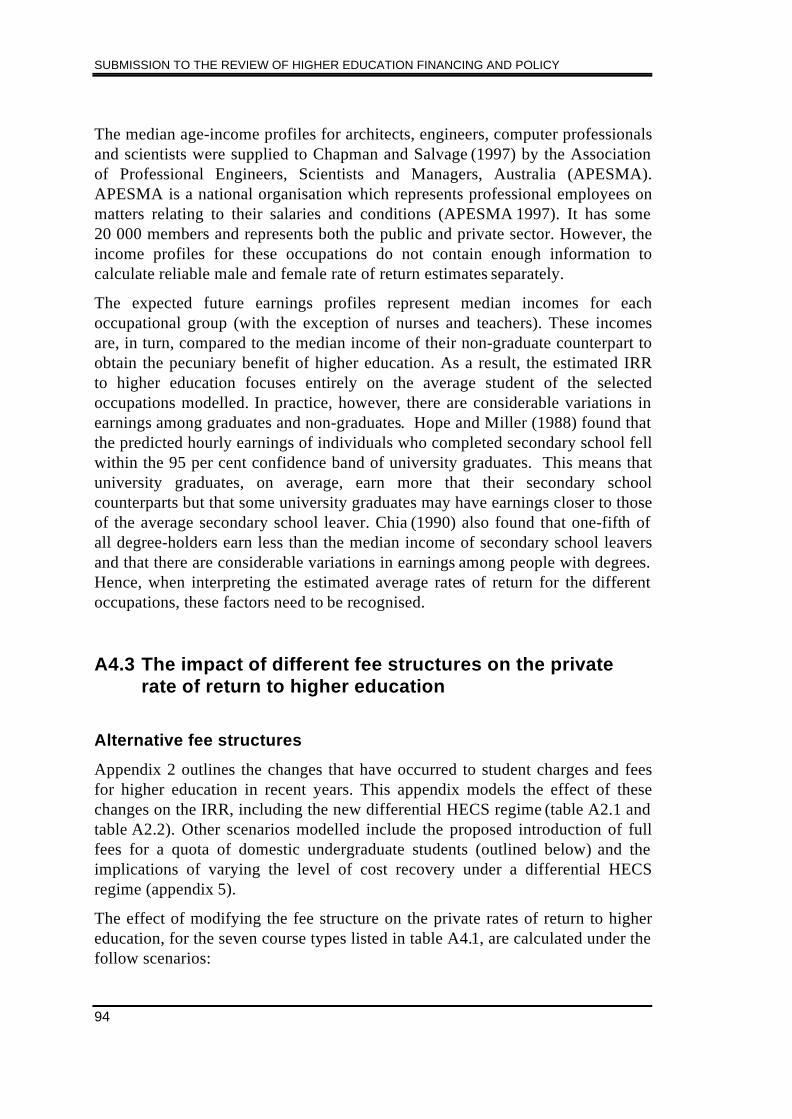
SUBMISSION TO THE REVIEW OF HIGHER EDUCATION FINANCING AND POLICY
94
The median age-income profiles for architects, engineers, computer professionalsand scientists were supplied to Chapman and Salvage (1997) by the Associationof Professional Engineers, Scientists and Managers, Australia (APESMA).APESMA is a national organisation which represents professional employees onmatters relating to their salaries and conditions (APESMA 1997). It has some20 000 members and represents both the public and private sector. However, theincome profiles for these occupations do not contain enough information tocalculate reliable male and female rate of return estimates separately.
The expected future earnings profiles represent median incomes for eachoccupational group (with the exception of nurses and teachers). These incomesare, in turn, compared to the median income of their non-graduate counterpart toobtain the pecuniary benefit of higher education. As a result, the estimated IRRto higher education focuses entirely on the average student of the selectedoccupations modelled. In practice, however, there are considerable variations inearnings among graduates and non-graduates. Hope and Miller (1988) found thatthe predicted hourly earnings of individuals who completed secondary school fellwithin the 95 per cent confidence band of university graduates. This means thatuniversity graduates, on average, earn more that their secondary schoolcounterparts but that some university graduates may have earnings closer to thoseof the average secondary school leaver. Chia (1990) also found that one-fifth ofall degree-holders earn less than the median income of secondary school leaversand that there are considerable variations in earnings among people with degrees.Hence, when interpreting the estimated average rates of return for the differentoccupations, these factors need to be recognised.
A4.3 The impact of different fee structures on the privaterate of return to higher education
Alternative fee structures
Appendix 2 outlines the changes that have occurred to student charges and feesfor higher education in recent years. This appendix models the effect of thesechanges on the IRR, including the new differential HECS regime (table A2.1 andtable A2.2). Other scenarios modelled include the proposed introduction of fullfees for a quota of domestic undergraduate students (outlined below) and theimplications of varying the level of cost recovery under a differential HECSregime (appendix 5).
The effect of modifying the fee structure on the private rates of return to highereducation, for the seven course types listed in table A4.1, are calculated under thefollow scenarios:

APPENDIX 4: PRIVATE RATES OF RETURN TO HIGHER EDUCATION
95
• Scenario 1: no tuition fees;• Scenario 2: uniform HECS charge;• Scenario 3: differential HECS charge;• Scenario 4: over-quota full fee regime; and• Scenario 5: differential HECS charge with varying levels of cost
recovery.
The estimated average private rates of return for the selected occupationsmodelled are ‘expected’ rates of return, as the income profiles used are staticprofiles. In addition, they presume that the full cost of any fees are borne bystudents and not passed on to employers via commensurate increases in income.As a result, the estimated effects are immediate impacts of varying highereducation charges and do not take into account the possibility that changes in feeswill effect the demand for higher education and their future incomes, and in turnhave feedback effects on the supply of higher education.
Chapman and Salvage (1997) have also examined the consequences of recentchanges in fees for higher education. They focus, firstly, on the effect ofdifferential HECS and faster debt repayment rates on the NPV of the HECSliability across a selection of occupations. They also examine the effect of thesechanges on the private rate of return to these occupations.
The Commission also looks at these recent changes, but extends the analysisfurther to examine effects of an over-quota ‘full’ fee regime for domesticundergraduates and a HECS regime with differing levels of cost recovery. TheCommission also comments on possible demand changes under these alternativefee scenarios. The no tuition fee and uniform HECS charge scenarios areincluded to illustrate the effect of past changes and give some relativity to theeffect of the other scenarios. While the Commission has used the same incomeprofiles as Chapman and Salvage (1997), its estimated average private rates ofreturn differ somewhat from theirs. The main sources of difference reflectvariations in the treatment of:• student earnings;• the cost of books and materials; and• the number of years at university.
Scenario 1 — No tuition fees
The private rate of return to higher education, assuming no fees, varies from8.9 per cent, on average, for architects to 23.3 per cent, on average, for computerprofessionals. The IRRs to higher education for female graduates are higher than

SUBMISSION TO THE REVIEW OF HIGHER EDUCATION FINANCING AND POLICY
96
for their male counterparts (table A4.2). For example, the average IRR toteaching for females is 14.6 per cent, while for males it is 8.1 per cent.
Table A4.2: Internal rate of return to higher education: no fees (per cent)
Occupations Male Female Average
Architect a a 8.9
Computer professional a a 23.3
Teacher 8.1 14.6 11.9
Engineer a a 17.4
Lawyer 19.6 a 18.1
Nurse 7.5 16.9 13.6
Scientist a a 22.3
a Male/female breakdown was not estimated because of a limited sample.Source: Commission estimates.
Female returns to higher education are generally greater than male returns,because female graduates have relatively higher participation rates, lowerunemployment rates, and longer working hours compared to femalenon-graduates (Chia 1990). There are only slight differences between theselabour force characteristics for male graduates and non-graduates. As the rate ofreturn to higher education is estimated by comparing the incomes of the femalegraduates with those of female secondary school leavers, the differing labourforce characteristics result in female graduate incomes being significantly higherthan female secondary school leavers, boosting the rate of return to highereducation for female graduates above male graduates for those occupations wheremale/female splits are reported.
Scenario 2 — Uniform HECS charge
The introduction of fees unambiguously lowers the private rate of return to highereducation, as it introduces an additional cost to the individual undertaking auniversity degree with no offsetting benefits. The extent to which the IRR islowered depends not only on the absolute value of the fee, but also on the speedof repayment. As fees under HECS can be converted into income-contingentloans, people in occupations with higher starting incomes and rapid income riseswill pay their HECS debts back sooner. In contrast to voluntary early
APPENDIX 4: PRIVATE RATES OF RETURN TO HIGHER EDUCATION
97
repayments, for which there is a discount, earlier repayment of HECS liabilitiesincreases the NPV of the HECS charge, having a greater impact on the IRR.6
The private rate of return to higher education, assuming a uniform HECS chargeof $2 478 per student per year, ranges from 8.4 per cent, on average, forarchitects to 21.7 per cent, on average, for computer professionals (table A4.3).
The introduction of a uniform tuition charge lowers the return to higher educationby 1.3 to 1.7 percentage points for male graduates and by approximately onepercentage point for female graduates. Occupations such as lawyers andcomputer professionals have the greatest drop in return as their starting salariestend to be higher, hence they pay the HECS charge back earlier than otheroccupations.
Table A4.3: Internal rate of return to higher education: uniform HECScharge (per cent)
Occupations Fee$ paa
Male Female Average
Architect 2 478 b b 8.4
Computer professional 2 478 b b 21.7
Teacher 2 478 6.8 13.5 10.8
Engineer 2 478 b b 16.2
Lawyer 2 478 18.4 b 17.2
Nurse 2 478 5.8 15.9 12.3
Scientist 2 478 b b 20.7
a HECS charge payable for all students re-enrolling in 1997. b Male/female breakdown was not estimatedbecause of a limited sample.Source: Commission estimates.
Scenario 3 — Differential HECS charge
Under this scenario, charges vary across courses. In some cases, charges mayvary within the same occupational group. For example, HECS charges forteachers will vary according to their specialisation (Chapman & Salvage 1997).Consequently, two teacher scenarios are modelled. The first scenario is anenglish-history teacher who studies three years of humanities (low HECS band,table A2.1) and one year of education (also low HECS band). The second
6 For more details on the NPV of HECS charges by occupations, see Chapman and
Salvage (1997).

SUBMISSION TO THE REVIEW OF HIGHER EDUCATION FINANCING AND POLICY
98
scenario is a maths-science teacher who studies a three year science degree(medium HECS band, table A2.1) and one year of education.
The introduction of the three tier differential HECS charge and faster HECS debtrepayment rates lowers the private rate of return to higher education by a greateramount than the uniform charge discussed above. The rates of return to theselection of university degrees modelled are up to 1 percentage point lower thanin scenario 2 (uniform charge). The IRR ranges from 7.8 per cent for architects,on average, to 20.8 per cent, on average, for computer professionals (table A4.4).
Table A4.4: Internal rate of return to higher education: differential HECScharge
Male Female Average
Occupations Fee$ pa
IRR%
Changea
IRR%
Changea
IRR%
Changea
Architect 4 700 b - b - 7.8 -0.6
Computerprofessional
4 700 b - b - 20.8 -0.9
Teacher Ic 3 300 6.5 -0.3 13.2 -0.3 10.4 -0.4
Teacher IId 4 350 6.1 -0.7 13.0 -0.5 10.1 -0.7
Engineer 4 700 b - b - 15.6 -0.6
Lawyer 5 500 17.5 -0.9 b - 16.3 -0.9
Nurse 3 300 5.1 -0.7 15.1 -0.8 11.5 -0.8
Scientist 4 700 b - b - 19.7 -1.0
a This represents the change in the IRR (measured in percentage points) for this scenario relative to scenario 2(uniform HECS charge). b Male/female breakdown was not estimated because of a limited sample.c English/history teacher. d Maths/science teacher.Source: Commission estimates.
Introducing a differential HECS system affects the private returns to differenthigher education courses differently. At the margin, this may lead to somestudents choosing to do another course or not studying at all. However, in theabsence of estimates of the own price elasticity of demand for higher education,it is not possible to be precise about the impact of different fee structures onstudent participation in higher education. Nonetheless, it is possible to draw somebroad inferences based on Australia’s recent experience. Although a crudeindicator, examination of enrolment data, for the period 1988 to 1993, suggeststhat the introduction of the uniform HECS charge had, on average, no discernibleimpact on enrolments (Chapman 1996b). In the case of the lowest price band ofthe differential HECS, a similar effect can be expected, since the relevant fee islittle different from the previous uniform HECS charge. In the case of the other

APPENDIX 4: PRIVATE RATES OF RETURN TO HIGHER EDUCATION
99
two price bands comparatively small effects could be expected in view of therelatively small changes in the underlying estimated average private rates ofreturn to higher education.
Scenario 4 — Over-quota ‘full’ fee regime
From 1998, universities have the option of charging full fees to 25 per cent ofdomestic undergraduate students.7 Some universities have announced that theywill take up this option. While no official over-quota fee structures have beenannounced, some universities considering introducing these fees have indicatedthat they may set fees somewhat below the current charges for overseas students.In estimating the IRR for these students, the Commission has assumed over-quota fees are set at a level approximately $1 000 below the full fee set foroverseas students (table A4.5).
Under the proposed arrangements, students will be required to pay tuition feesupfront as no government student loan system is currently proposed. Thispayment method has a greater impact on the rate of return to higher education asthe entire tuition cost is borne in the initial years of investment. For the selectionof courses modelled, upfront over-quota fees reduce the IRR to higher educationby 3 to 8 percentage points (on average) relative to the current differential HECSsystem (table A4.6).
As a result of upfront charges, some courses would, on average, yield a very lowprivate rate of return. For example, the estimated rate of return on a nursingdegree for a male is only 0.7 per cent, after fees of $39 150 are paid (tables A4.5and A4.6). This means that, after all costs are taken into account, includingforegone income, male nurses are only marginally ‘better off’ (in pecuniaryterms) than their secondary school counterparts. However, this is a conservativeIRR estimate since improved earnings linked to merit-based promotion have notbeen taken into account.
7 Universities must fill government subsidised places before offering places to fee paying
domestic students.

SUBMISSION TO THE REVIEW OF HIGHER EDUCATION FINANCING AND POLICY
100
Table A4.5: Indicative fee structure for over-quota domestic students
Course Annual charge$ pa
Course lengthyears
Total fee$ per course
Architecture 12 050 5 60 250
Computing 13 330 3 39 990
Education 9 050 4 36 200
Engineering 14 050 4 56 200
Law 10 050 4 40 200
Nursing 13 050 3 39 150
Science 13 230 3 39 690
Source: Commission estimates.
Once again, in the absence of estimates of the own price elasticities of demandfor higher education, it is not possible to be precise about the impact of upfrontfees on student participation in higher education. Nevertheless, these impacts arelikely to be different from those that stem from the introduction of the differentialHECS system currently in place. Upfront fees will only affect a proportion ofstudents, namely those who fail to satisfy the tertiary entry requirements for theHECS market. The price sensitivity of student participation in the over-quotamarket is likely to be less, on average, than for students overall as the studentstaking up this option are more likely to come from socio-economicallyadvantaged backgrounds. Furthermore, the over-quota fee regime may give somestudents the opportunity to study at their preferred university or in their preferredcourse. Thus, a student who has gained entry into a law degree at university Xmay choose to pay upfront fees to go to university Y, which has a betterreputation in teaching law. This type of behaviour takes into account non-pecuniary considerations and cannot be predicted from the estimated IRR.
Under a HECS-style deferred payment system, the introduction of tuition fees forover-quota students lowers the IRR to a university degree by a much smalleramount (relative to scenario 3) — 0.5 to 2.2 percentage points for all occupations(with the exception of male nurses) (table A4.6). Where a deferred fee facility isapplied to the over-quota market, a smaller impact on prospective enrolments andcomposition of those enrolments could be expected.

APPENDIX 4: PRIVATE RATES OF RETURN TO HIGHER EDUCATION
101
Table A4.6: Internal rate of return to higher education — over-quota ‘full’fee regime
Male
Female Average
Occupations Fee$ pa
IRR%
Changea
IRR%
Changea
IRR%
Changea
Upfront payment of fees
Architect 12 050 b - b - 4.9 -2.9
Computerprofessional
13 330 b - b - 12.8 -8.0
Teacher 9 050 3.5 -2.6c 8.9 -4.1c 6.6 -3.5
Engineer 14 050 b - b - 9.4 -6.2
Lawyer 10 050 12.4 -5.1 b - 11.7 -4.6
Nurse 13 050 0.7 -4.4 8.5 -6.6 5.5 -6.0
Scientist 13 230 b - b - 11.9 -7.8
Deferred payment of fees
Architect 12 050 b - b - 7.1 -0.7
Computerprofessional
13 330 b - b - 19.7 -1.1
Teacher 9 050 4.8 -1.3c 12.3 -0.7c 9.2 -0.9
Engineer 14 050 b - b - 14.6 -1.0
Lawyer 10 050 16.9 -0.6 b - 15.8 -0.5
Nurse 13 050 1.1 -4.0 13.6 -1.5 9.3 -2.2
Scientist 13 230 b - b - 18.5 -1.2
a This represents the change in the IRR (measured in percentage points) for this scenario relative to thedifferential HECS (scenario 3). b Male/female breakdown was not estimated because of a limited sample. cChange relative to math-science teacher in scenario 3.Source: Commission estimates.
Scenario 5 — Differential HECS charge with varying levels of costrecovery
Appendix 5 discusses some principles for determining the level of cost recoveryunderlying HECS. The Commission favours a HECS with charges based on afixed proportion of course costs. Such a charge reduces the potential fordistorting student demand for particular courses by maintaining the relativitybetween prices and costs for different courses.

SUBMISSION TO THE REVIEW OF HIGHER EDUCATION FINANCING AND POLICY
102
There are a number of potential cost recovery levels. The Commission estimatesthat the average of the existing differential HECS regime represents a costrecovery rate of roughly 40 per cent (appendix 5). Under this fee regime, chargesfor some courses would fall relative to their current levels, while others wouldincrease. Two other cost recovery levels are modelled, namely — 50 and 75 percent. The fee structures associated with these different levels of cost recovery (ie40, 50 and 75 per cent) and associated rate of return estimates are presented intable A4.7.
Under a 40 per cent cost recovery scheme, the estimated IRR to higher educationfor architects, computer professionals, maths-science teachers and lawyerincreases by 0.1 to 0.6 percentage points (compared with estimated IRR underthe existing differential HECS). The estimated IRR to higher education forengineers, nurses and scientists all fall by 0.3 percentage points. Under a 50 percent cost recovery HECS, the IRR to higher education either remain constant orfalls by up to 0.6 percentage points relative to the current system (with theexception of law where the IRR improves slightly). Male nurses are affectedmore severely.
It is not until HECS is set at 75 per cent of course costs that the private rate ofreturn to higher education reduces across all courses modelled (with theexception of law). The estimated IRR to all occupations declines byapproximately 1 percentage point. Even with students paying 75 per cent ofcourse cost, the IRR ranges, on average, from 7.4 per cent for architects to 20.2per cent for computer professionals.
There are some important differences between a cost-based differential HECSscheme and the current differential HECS scheme. One notable difference is thatthe current differential HECS system (modelled in scenario 3) is a hybrid regime.Its design has been influenced by course cost, graduate return and studentdemand considerations. For example, despite being relatively cheap to teach, acourse such as law attracts a high charge within the existing differential HECSsystem, as law graduates have been judged as having a greater potential to earnhigher incomes. However, under the cost-based differential HECS structure,discussed in appendix 5, the charge applied to law would be based on itsrelatively low course cost. As a result, when a 75 per cent cost recovery charge isset, law students would be charged $5 127 which is lower than the current HECScharge of $5 500. This lower charge for law increases the relative rate of return tostudying law (table A4.7).

APPENDIX 4: PRIVATE RATES OF RETURN TO HIGHER EDUCATION
103
Table A4.7: Internal rate of return to higher education — cost recoverybased HECS
Male Female Average
OccupationsFee$ pa
IRR%
Changea
IRR%
Changea
IRR%
Changea
40 per cent cost recovery
Architect 4 147 b - b - 7.9 0.1
Computerprofessional
4 147 b - b - 21.0 0.2
Teacher 3 524 6.4 0.3c 13.1 0.1c 10.3 0.2
Engineer 5 990 a - b - 15.3 -0.3
Lawyer 2 734 18.2 0.7 b - 16.9 0.6
Nurse 4 147 4.7 -0.4 14.9 -0.2 11.2 -0.3
Scientist 5 990 b - b - 19.4 -0.3
50 per cent cost recovery
Architect 5184 b - b - 7.8 0.0
Computerprofessional
5 184 b - b - 20.7 -0.1
Teacher 4 405 6.1 0.0c 12.9 -0.1c 10.1 0.0
Engineer 7 488 b - b - 15.1 -0.5
Lawyer 3 418 18.0 0.5 b - 16.7 0.4
Nurse 5 184 4.2 -0.9 14.6 -0.5 10.9 -0.6
Scientist 7 488 b - b - 19.1 -0.6
75 per cent cost recovery
Architect 7 775 b - b - 7.4 -0.4
Computerprofessional
7 775 b - b - 20.2 -0.6
Teacher 6 607 5.4 -0.7c 12.6 -0.4c 9.6 -0.5
Engineer 11 231 b - b - 14.8 -0.8
Lawyer 5 127 17.6 0.1 b - 16.4 0.1
Nurse 7 775 3.1 -2.0 14.1 -1.0 10.2 -1.3
Scientist 11 231 b - b - 18.6 -1.1
a This represents the change in the IRR (measured in percentage points) for this scenario relative to the currentdifferential HECS (scenario 3). b Male/female breakdown was not estimated because of a limited sample. cChange relative to math-science teacher in scenario 3.Source: Commission estimates.

SUBMISSION TO THE REVIEW OF HIGHER EDUCATION FINANCING AND POLICY
104
A4.4 Summary
This appendix focuses on the pecuniary benefits and costs of higher education,calculating the private rate of return to various higher education courses inAustralia, under a range of different fee regimes. The following fee structures areconsidered:• Scenario 1: no tuition fees;• Scenario 2: uniform HECS charge;• Scenario 3: differential HECS charge;• Scenario 4: over-quota full fee regime; and• Scenario 5: differential HECS charge with varying levels of cost
recovery.
Relative to the case of no fees, the effect of introducing a uniform HECS chargeis to lower the private rate of return to higher education by 1 to 2 percentagepoints on average across the occupational groups examined. The introduction ofthe recent differential HECS reduces the estimated average rate of return by afurther 1 percentage point. In the case of the proposed introduction of over-quota‘full’ fees, the reductions are in the vicinity of 3 to 8 percentage points relative tothe current differential HECS (scenario 3). This effect would be significantlyreduced if the existing deferred payment option were available to full fee over-quota students. While the average private rates of return to higher education,under a modified cost-based HECS system (scenario 5) would be similar to thecurrent differential HECS system, there are important differences for individualcourses.
The effect of the different fee structures modelled on student participation inhigher education is unknown as there are no estimates of the price elasticity ofdemand for Australian higher education. However, based on recent Australianexperience, the expected effects on student participation of the currentdifferential HECS system are relatively small, on average. Greater relative effectsare expected for students studying courses with fees in the highest HECS bracket.The introduction of over-quota ‘full’ fees may lead to more subtle changes instudent composition, despite the large reductions in private returns, as the pricesensitivity of student participation in the over-quota market is likely to be less, onaverage, than for students overall.
The estimated changes in private rates of return to higher education are theimmediate impacts of varying higher education charges. They do not take intoaccount the effect of changes in fees on student participation rates in highereducation which would affect the supply of graduates and graduate incomes.Further, depending on conditions in the labour market for different occupations,

APPENDIX 4: PRIVATE RATES OF RETURN TO HIGHER EDUCATION
105
there may be scope for graduates to shift a portion of any fee increase on toemployers via compensating increases in remuneration.
Estimation of the impact of changing fee regimes on student participationdecisions needs to recognise the influence of non-pecuniary benefits as well. Thenon-pecuniary benefits of undertaking higher education can be significant andplay a role in a student’s overall decision process.

107
APPENDIX 5 IMPROVING THE EXISTINGCHARGE REGIME
The Higher Education Contribution Scheme (HECS) plays a central role infinancing Australia’s higher education sector. It provides a means of recovering aproportion of the costs of providing higher education to most students (currentlyabout 40 per cent, on average, of direct tuition costs). While students can paycharges upfront, HECS also provides an income-contingent loan mechanism thatallows students to defer payment of their tuition fees — currently about 75 percent of eligible students take advantage of this mechanism.
The level and structure of fees under the HECS influence institutional decisionsabout course offerings and affect the capacity of publicly funded institutions toattract students. The operation of HECS, together with guidelines relating to thecharging of HECS exempt students, also affects the capacity of privateinstitutions to attract students. In this context, getting HECS ‘right’, in terms ofthe level and structure of course fees and the operation of the income-contingentloan mechanism, is important to the development of an efficient and equitablehigher education sector.
Some key issues relating to the structure and level of HECS charges areexamined in section A5.1. Improvements that could be made to the design of theHECS charge regime and the loan mechanism are discussed in section A5.2. Theissue of improving the regulations governing fee setting by institutions is takenup in section A5.3.
A5.1 Improving the HECS charge regime
In 1989, HECS was introduced as a flat charge across most courses. Under recentamendments, HECS contributions have been increased to provide a betterbalance between the private and public contributions to higher education. Thesingle flat charge has been replaced by a differentiated regime with three feebands of $3 300, $4 700 and $5 500 (for a full year of study), depending on thecourse undertaken (appendix 2). The government’s decision to adopt adifferentiated charge regime aims broadly to reflect differences

SUBMISSION TO THE REVIEW OF HIGHER EDUCATION FINANCING AND POLICY
108
across disciplines in:
• expected future private benefits in terms of higher life-time earnings ofgraduates; and
• course costs.This section examines the current structure and level of HECS and identifiessome broad improvements that could made to the charge regime.
Should HECS charges reflect the expected future earnings ofgraduates?
Expected future earnings have an important bearing on the demand for highereducation (appendix 4). Those individuals that anticipate earning a relatively highincome as graduates will have a greater capacity and willingness to pay for theireducation than those expecting lower graduate incomes. Differentiating chargesaccording to individuals willingness to pay will be efficient in the sense thatscarce resources will be allocated to the students that value them most highly.However, in practice, attempts to set HECS charges to reflect expected futureearnings is not a straightforward exercise.
First, examination of earnings profile data reveal significant differences in theexpected future earnings profiles of graduates relative to non-graduates andbetween graduates from different disciplines. Beyond this, there are also markeddifferences in earnings between graduates within the same disciplines. Isolatingthe factors responsible for these shifts in earnings distributions is fraught withdifficulty. The capacity to attract high earnings depends not only on education,but also on a range of other factors, including innate abilities, on-the-job training,experience and, in some cases, the influence of restrictions on entry into certainoccupations. It is often difficult to identify the relative contribution of thesediffering elements to observed earnings differentials. Thus, there are fundamentalproblems in assuming a uniform level of future private benefits for all studentsarising from the studying of a particular discipline.
Second, the expected future earnings profiles for different disciplines are notstatic. The earnings relativities between discipline groups (ie occupations) changeover time. For example, rapid changes in technology may erode expected highreturns from particular skills and knowledge. This implies a requirement forregular monitoring and adjustment of fees. However, for the reasons alluded toabove, such an approach is unlikely to be practical.
Finally, the expected future earnings criterion is in itself questionable. Australiaalready has in place a progressive income tax system that redistributes incomefrom high income earners to those receiving relatively low incomes.

APPENDIX 5: IMPROVING THE EXISTING CHARGE REGIME
109
Overall, the Commission considers that there are no strong arguments for linkingHECS charges to the expected future earnings of graduates. Income distributionquestions are best addressed through the taxation and social security systems, andreform to institutional barriers which may cause earnings to vary acrossoccupations. Even if there were a case for linking HECS to future earnings,practical difficulties prevent its achievement.
Should HECS charges reflect differences in course costs?
One of the criticisms of the previous single rate HECS was that it did not providestudents with any signals about significant differences in costs between courses.Consequently, it tended to bias enrolment decisions toward courses offering thegreatest pay-offs, regardless of costs (Harrison 1995a), although government-imposed student load targets limited the extent of this bias. It also provided noinformation to institutions on which to base decisions on future course offerings.
In principle, a cost-differentiated HECS can overcome some of these problems.However, the current differential HECS only partially addresses these problems.The existing form of the charge — a fixed dollar amount for three designatedcourse groupings — yields sizeable variations in the balance between private andpublic contributions towards course costs (table A5.1). The balance variesconsiderably both within and between the existing three fee bands. Students alsopay the same HECS whether studying at the undergraduate or postgraduate level,despite the fact that postgraduate courses are generally more costly to provide.
The adoption of a fixed proportionate charge would allow private contributions toreflect differences in course costs. It would also provide a simple pricing rulethat, in the absence of information on the level and pattern of external benefitsacross disciplines, is likely to reduce distortions to students’ course choices. But,what should be the level of the charge? This issue is taken up below.

SUBMISSION TO THE REVIEW OF HIGHER EDUCATION FINANCING AND POLICY
110
Table A5.1: Cost recovery under differential HECS per student, 1997
Discipline
Costper
EFTSUaMedianincomeb
Enrolmentgrowth
1986–1996Unmet
demand c HECS
HECSshare
of costd
$ $ % % $ %
Arts, Humanities 6 836 28 300 49 24.0 3 300 48.3
Education 8 809 33 800 -9 22.0 3 300 37.5
Nursing 10 367 25 300 nr nr 3 300 31.8
Computing 10 367 nr nr nr 4 700 45.3
Agriculture etc. 18 096 29 900 74 16.0 4 700 26.0
Science 14 975 35 400 64 9.9 4 700 31.4
Admin, Busn., Econ. 6 836 nr 96 19.1 4 700 68.8
Engineering 14 975 40 100 67 12.9 4 700 31.4
Law 6 836 47 900 151 34.1 5 500 80.5
Medicine 18 096 51 900 172 38.5 5 500 30.4
Veterinary Science 18 096 nr 14 62.4 5 500 30.4
a Estimated cost (based on the Commonwealth recurrent funding rate for undergraduate teaching for eachdiscipline group). DEETYA does not have information on the actual costs of provision of various units. b Mediangross income (1991–92 dollars) for people holding a bachelor degree as their highest qualification, completed 6to 10 years previously. The data do not distinguish between part-time and full-time earnings. c Eligible applicantsthat did not receive an offer in the 1996 intake. d At the postgraduate level, the share of costs that HECSrepresents would be lower as course costs tend to be higher than for undergraduate students. nr Not reported.Source: AVCC 1996.
What is the appropriate degree of cost recovery?
Determining the appropriate level of private contributions made by studentstowards the costs of higher education is not a clear-cut issue. Since highereducation yields spillover benefits, it is inappropriate to seek full cost recovery.Equally, in the presence of substantial private benefits, it is inappropriate to seekan insignificant degree of cost recovery.
As discussed in appendix 3, there are many views on the size of spillover benefitsarising from higher education and, consequently, the appropriate degree of costrecovery. Based on this, the Commission has examined three approaches:
• a 40 per cent cost recovery rate equivalent, on average, to the chargesassociated with the existing differential HECS and broadly consistent withmaintaining existing funding levels as supported by Karmel (1997a);
• a 50 per cent cost recovery rate, consistent with the proposal by Pincus andMiller (1997) in their submission to the Review; and

APPENDIX 5: IMPROVING THE EXISTING CHARGE REGIME
111
• a 75 per cent cost recovery rate, which could be viewed as relativelygenerous in the context of the observations of Brennan (1971, 1988) andFane (1988) who have suggested that the spillover benefits from highereducation are likely to be relatively small or even negligible.
A comparison of the current differential HECS charges with the resulting HECScharges from the three approaches canvassed above is presented in table A5.2.The comparison is based on the estimated cost per EFTSU for different disciplinegroups linked to the existing recurrent funding rate for universities reported intable A5.1. The estimated costs do not take capital costs into account and, as aresult, the cost base does not fully reflect the costs of providing courses. (Theissue of the appropriate cost base on which to set HECS charges is discussed inthe next section.)
Compared to the current regime, a uniform pro rata charge that recovered 40 percent of costs would lead to lower charges for computing and for low cost coursessuch as arts and humanities, administration, business and economics, and law.For higher cost courses such as education, nursing, agriculture, science,engineering, medicine and veterinary science, HECS charges would rise. At 50per cent cost recovery, HECS charges rise for all courses, except administration,business and economics, and law. At the 75 per cent rate of cost recovery, theHECS charge would rise for all courses except law — where it would yield acharge less than that currently applied.
The initial HECS does not appear to have had a significant impact on enrolments(Chapman 1996a). Although it is too early to assess the impact on demand ofrecent changes to HECS, initial evidence suggests that it has not adverselyaffected the overall level of enrolments in 1997 (Vanstone 1997b). Similarly, theCommission does not expect that applying the higher cost recovery rates(referred to above) to the HECS regime would significantly impact on overallenrolments. Based on an examination of selected occupational groupings, even a75 per cent cost recovery regime would permit many graduates to continue toearn, on average, private rates of return in excess of 10 per cent (appendix 4).

SUBMISSION TO THE REVIEW OF HIGHER EDUCATION FINANCING AND POLICY
112
Table A5.2: Illustrative HECS charges at varying levels of cost recoverya
1997 levelb Level of cost recovery ($)
Discipline $ 40 per cent 50 per cent 75 per cent
Arts, Humanities 3 300 2 734 3 418 5 127
Education 3 300 3 524 4 405 6 607
Nursing 3 300 4 147 5 184 7 775
Computing 4 700 4 147 5 184 7 775
Agriculture etc. 4 700 7 238 9 048 13 572
Science 4 700 5 990 7 488 11 231
Admin, Busn., Econ. 4 700 2 734 3 418 5 127
Engineering 4 700 5 990 7 488 11 231
Law 5 500 2 734 3 418 5 127
Medicine 5 500 7 238 9 048 13 572
Veterinary Science 5 500 7 238 9 048 13 572
a The figures presented for the three different levels of cost recovery were derived from the estimated cost perEFTSU for each discipline as reported in table A5.1. b These figures correspond to the actual fees applying underHECS to these disciplines. The level of cost recovery associated with the existing HECS fee regime variesconsiderably across disciplines as shown in table A5.1.Source: Commission estimates.
The Commission acknowledges that the paucity of empirical data about the sizeof the spillover benefits from higher education necessarily means that anassessment of the appropriate degree of cost recovery is judgemental. However, itis clear that there are substantial private benefits linked to higher education.Further, while an examination of the literature on spillover benefits (appendix 3)highlights considerable uncertainty about the magnitude of these benefits, it doesprovide some support for the view that the current broad level of cost recoverymay be too low. A detailed examination of the nature and extent of spilloverbenefits associated with different types of higher education is urgently needed toinform the policy debate. In the interim, the Commission judges that it would beappropriate to raise the current level of cost recovery to 50 per cent. This wouldimply a greater absolute increase in HECS charges at the postgraduate levels,where typically course costs are greater.
A5.2 Improving other aspects of the design of HECS
HECS has proved to be a relatively successful method for ensuring that studentscontribute to the costs of their education. Administrative and default costs are

APPENDIX 5: IMPROVING THE EXISTING CHARGE REGIME
113
reasonably low compared to other forms of student loans and a number of studieshave shown that, at least up until the latest round of changes, the HECS chargehas had no discernible effect on the participation of disadvantaged students (seeChapman 1996a; Harding 1995). Nevertheless, a number of aspects of HECSimpair its efficiency and equity. This section discusses improvements that couldbe made to HECS, including:
• introducing a capital charge into the cost base;• allowing for some fee flexibility between institutions;• introducing a penalty for completion of courses outside acceptable
minimum periods; and• modifying the loan mechanism in terms of the:
– interest rate applied;– repayment rates and income thresholds; and– coverage of educational institutions and students.
Broadening the cost base of HECS
The Commonwealth, and particularly the State and Territory governments, haveprovided land and buildings for university activities and continue to providefunds for new buildings and facilities as well as capital maintenance.
Institutions are required to charge fees to overseas students that partly reflectcapital costs (ie there is no rate of return requirement). The DEETYAadministrative guidelines covering fees for overseas students explicitly specifythat the following costs are relevant:
• operating costs, including equipment costs, which should take account of:– staff costs;– overheads (eg utilities, rent and marketing costs);– common services costs (eg libraries and student counsellors); and
• average capital costs, which should include an appropriate amortisation ratefor capital and interest, but do not need to take account of capital facilitiesprovided by sponsors (HED 1996).
The current cost base of the HECS does not include an allowance for capitalmaintenance, nor are institutions required to generate a notional return on capital.This provides a ‘hidden subsidy’ to students and may distort the purchasing andproduction decisions of students and institutions alike. The absence of a capitalcharge also provides a notional subsidy to ‘asset rich’ institutions relative to‘asset poor’ institutions. It also disadvantages private institutions that are required

SUBMISSION TO THE REVIEW OF HIGHER EDUCATION FINANCING AND POLICY
114
to set fees on a commercial basis. It would be consistent with a mixed fundingmodel if part of these capital costs were borne by users through their HECScontributions.
Accordingly, the Commission considers that the West Review should considerthe merits of this proposal, including the possibility that the charge could beapplied on an institution-by-institution or zonal basis (ie capital city and regionalrate), rather than on a system-wide basis. Such differentiation in charges is likelyto be desirable in view of the potential for sizeable variations in capital costsbetween institutions.
Allowing for some fee flexibility between institutions
Costs vary from one institution to another, even for courses of a similar contentand quality. Differences in the materials used, the number of staff employed andin the capacity of the institution affect costs across courses. This is confirmed in astudy by Williams et al. (1989) which found wide variations in unit teachingcosts in selected Victorian institutions.
Because of cost variations, it may even be possible for some institutions toprovide some courses — such as law — at a lower charge than the current HECS.However, a system-wide charge regime prevents institutions from reflecting costdifferences in the charges applied to students and provides little opportunity foruniversities to attract students on the basis of lower costs.
The Committee on Higher Education Funding (1988) discussed a proposal forallowing some price flexibility within a system-wide charging regime. TheCommittee canvassed a proposal whereby institutions would be free to vary theircharges by up to 15 per cent above or below the standard charges. Whileacknowledging that differential charging between institutions would make thesystem more complex to administer and could have equity consequences, theCommittee considered that the proposal could enhance institutional efficiencyand flexibility.
If the West Review decides that it is desirable to maintain a central fee-settingmechanism, it should consider the merits of permitting some flexibility of thistype.
Introducing a penalty for completion of courses outside acceptableminimum periods
In a situation where there is excess demand for some university courses, access tohigher education for new students can be affected by the time that existingstudents take to finish their courses. Students swapping courses during the year or

APPENDIX 5: IMPROVING THE EXISTING CHARGE REGIME
115
having to repeat courses can add to difficulties some students face in being ableto secure a university place. The most efficient outcome would be for students tocomplete their courses as quickly as possible.
Additional time spent at university means forgoing income, which provides someincentive to complete studies quickly, as does HECS. A penalty for undue delaysin course completion rates could increase these incentives. It could take the formof an extra loading to the standard HECS charge, which would have the effect ofreducing the course subsidy.
Prior to adopting such a proposal it would be desirable to examine a number ofissues. Key issues include the current levels of waste and failure rates, the mainproximate causes, the extent to which a ‘fee penalty’ could improve completionrates and the identification of acceptable performance targets.
Modifying the loan mechanism
Interest rates
If students elect to defer payments under HECS, the charge becomes a debtwhich is owed to the government. The debt is indexed to the inflation rate, so thatits real value is maintained over time. No explicit interest rate charges are appliedto the debt.1 This arrangement provides an implicit loan subsidy to students thatelect to defer their HECS payments. The implicit loan subsidy arises becausegraduates are not required to contribute to the full costs incurred by thegovernment in providing the loan, including administration costs, default costs 2and the financing costs. Individuals who study the highest cost courses, study forthe longest periods of time and take the longest time to repay their debt attract thegreatest subsidy (Harrison 1995a).
Harrison (1995a) and Harding (1995) note that the loan subsidy could reduceincentives to work, as higher current repayments mean forgoing some of thesubsidy. The failure to apply an explicit real rate of interest to HECS loans alsoadds to the bias against private universities inherent in the current policyframework.
1 However, if at least $500 of a HECS charge is paid upfront, the debt attracts a discount of 25
per cent. Beyond this, voluntary contributions of $500 or more at any time attract a 15 percent discount. From the students’ perspective, this effectively implies that a real rate ofinterest is applied to deferred HECS payments. For each student this real interest rate willdepend on when the loan is repaid — that is, the time path of future income. This isunknowable at the time of decision making.
2 Default costs, in the context of an income-contingent loan, refer to any debt that cannot berecovered.

SUBMISSION TO THE REVIEW OF HIGHER EDUCATION FINANCING AND POLICY
116
Much of the support for the loan subsidy attaching to deferred payments hasrested on access/equity arguments. The concern is that students fromdisadvantaged backgrounds are relatively more risk averse than those fromadvantaged backgrounds and may be further deterred from incurring debt if asignificant interest charge applies (Maani 1996). However, the income-contingent nature of HECS already provides a strong degree of protection tostudents in relation to the risks associated with investing in higher education,despite the recent reduction in the income threshold that triggers repayments(appendix 2).
At a more general level, Harrison (1995a) has argued that the HECS loan subsidyis not a good equity instrument as, at best, it targets graduates with low incomes,which does not necessarily correspond with the most needy in society (ie it takesno account of individuals’ asset holdings).
There appears to be a case to support the application of an explicit interest rate tothe deferred payment under HECS. In principle, the interest rate should be set torecover the cost of providing the loan. Thus, it should at least reflect the cost ofproviding finance — that is, the government borrowing requirement.
In addition, an interest rate premium designed to recoup default costs could beadded. However, seeking to recover the default costs of the loan scheme mayrequire applying relatively high interest rates. This may deter some individualsfrom investing in education and/or affect later labour force participationdecisions. Alternatively, some form of tax surcharge would allow these costs tobe recovered from successful graduates. However, its deterrent effects relative toequity objectives would need to be assessed.
The effect of applying a real interest rate charge to HECS needs to be weighed upcarefully in determining the appropriate interest rate. The Commission suggeststhat the West Review examine the merits of applying an explicit (real) interestcharge to the HECS debt. In this context, it may be useful to examine the studentloan arrangement applying in New Zealand.
Repayment rates
Repayment rates applying to debt incurred under the HECS are determined bytotal income, not just increases in income beyond the repayment threshold(table A5.3). While this potentially speeds repayment, it can have unintendedeffects on individuals at the margins of the income thresholds associated with therepayment schedule.
Under the current HECS repayment arrangements, a dollar earned above eachincome threshold necessitates an additional payment greater than the additionaldollar earned. This can leave the borrower with a lower net income (after a debt

APPENDIX 5: IMPROVING THE EXISTING CHARGE REGIME
117
repayment), despite being on a higher income. For example, if a graduate’sincome was to rise from $20 700 by just one dollar, that graduate would be worseoff in net income terms by $620. Viewed another way, the graduate would needto earn at least $21 430 to be no worse off in net income terms. (There is, ofcourse, an offsetting wealth effect due to the reduction of the debt.) If graduatesare also repaying an AUSTUDY loan, the impact can be much greater (Harding1995). This might have some impact on incentives to work or evade income tax(Harding 1995; Harrison 1995a).
In recognition of these potentially adverse incentive effects, the government hasrecently amended the HECS repayment schedule by introducing additionalincome threshold bands incorporating more graduated repayment rates (tableA5.3). However, as can be gleaned from table A5.3, the threshold problemcontinues to exist.
In view of these potential adverse incentive effects, the West Review shouldconsider the benefits of applying marginal repayment rates to HECS. To generatethe same level of revenue, the marginal repayment rates for HECS would need tobe higher and/or the income threshold lower than under the current system.Alternatively, the initial income threshold could be maintained by applying anaverage rate initially and marginal rates for income beyond the minimumthreshold level. A comparison of the existing system with average and marginalrepayment rates (of 10 per cent) is provided in table A5.3.
As the Commission favours a scheme that minimises adverse incentive effects, itprefers a scheme based on marginal repayment rates. However, such a schemecould raise concerns because it requires a lower minimum income threshold. Ifthis is judged to be a serious drawback, a scheme incorporating a combinedaverage and marginal rate schedule could be introduced. In the Commission’sopinion, this would represent a significant improvement over the existing regime.

SUBMISSION TO THE REVIEW OF HIGHER EDUCATION FINANCING AND POLICY
118
Table A5.3: Illustrative annual HECS repayment schedulesa
Threshold income1997–98 repayment
scheduleMarginal rate
repayment schedule bCombination rate
repayment systemc
RateAnnual
repayments RateAnnual
repayments RateAnnual
repayments
$ % $ % $ % $
Below 14 491 nil nil nil nil nil nil
14 491 to 20 700 nil nil 10 0–621 nil nil
20 701 to 21 830 3 621–655 10 621–734 3d, 10 621–734
21 831 to 23 524 3.5 764–823 10 734–903 10 734–903
23 525 to 27 288 4 941–1092 10 903–1 280 10 903–1 280
27 289 to 32 934 4.5 1228–1 482 10 1 280–1 844 10 1 280–1 844
32 935 to 34 665 5 1647–1 733 10 1 844–2 017 10 1 844–2 017
34 666 to 37 262 5.5 1907–2049 10 2 018–2 277 10 2 018–2 277
37 263 and above 6 2236 – 10 2 277 – 10 2 277 –
a Repayment rates and income thresholds are based on those required to maintain revenue in the existing incomethresholds at roughly the current level. b Assumes that the initial income threshold is $14 491 and repayment ismade at a marginal rate of 10 per cent thereafter. c Assumes that an average repayment rate of 3 per cent appliesat the initial income threshold of $20 701, and thereafter a marginal repayment rate of 10 per cent applies. dAverage repayment rate.Sources: DEETYA 1996c and Commission estimates.
Coverage of educational institutions and students
The Commission believes that the West Review should consider the merits ofoffering a HECS-style student loan, on a capped or uncapped basis, to all tertiaryeducation students at accredited institutions, whether they are fee-payingundergraduate students in the UNS, studying at TAFE or equivalent privatesector institutions, or at a private university. This would:
• be fully consistent with the rationale for providing a student loan scheme toovercome capital market problems;
• promote competition across the tertiary education sector; and• promote equality of opportunity.This proposal is consistent with suggestions made by some other partiesparticipating in the West Review (eg the University of Notre Dame) and with theviews expressed by the Committee on Higher Education Funding (1988) whichrecommended that HECS be extended to higher education courses provided atTAFE. The complexities of Commonwealth and state/territory responsibilities foreducation may have contributed to the Government’s decision not to apply HECS

APPENDIX 5: IMPROVING THE EXISTING CHARGE REGIME
119
charges to TAFE colleges. However, provision of a student loan facility shouldnot present these problems. Indeed, students at TAFE colleges and privateuniversities have access to the AUSTUDY loan supplement scheme already.Providing a loan facility to the wider student body would be a natural extensionof existing policy. Moreover, in the light of the government’s recent changes toyouth unemployment benefits, which are likely to increase demand for tertiaryeducation significantly, having a broad-based student loan scheme in place mayhelp to alleviate pressures on particular institutions.
A5.3 Improving institutional fee regulations
The basic aim of the Government’s regulations of fees set by UNS institutionshas been to ensure that all students that meet required entry standards (asdetermined by individual institutions) undertaking a basic professionalqualification (in most cases a bachelor degree) are HECS-liable rather than beingrequired to pay upfront fees. In line with this principle, the Government hasconcentrated its funding efforts on increasing the domestic undergraduate intake.To provide incentives for institutions to expand university places further and togive students opportunities to purchase a place, the government has also giveninstitutions greater freedom to charge fees in different segments of the highereducation market. Fees now apply to overseas students and those undertakingnon-award courses, with the Government making no direct contribution to thecost of these courses. In addition, institutions have been given greater freedom toapply fees to postgraduate and graduate students (appendix 2).
At the time of the 1996–97 Budget, the Government announced a further feederegulation initiative. From 1998, universities will be able to charge up to 25per cent of domestic undergraduates enrolling in courses upfront fees.
This section comments briefly on two areas where there is scope to improveinstitutional fee setting arrangements — charging arrangements for secondundergraduate degrees and for domestic undergraduates.
Charging arrangements for second undergraduate degrees
With the exception of the over-quota market for domestic undergraduates, whichis to become operational next year, universities are precluded from chargingstudents undertaking undergraduate degrees. Yet, as discussed in appendix 3,study beyond a first degree is likely to provide a diminishing social return on thepublic investment represented by the subsidy. Greater scope for institutions tocharge fees to students undertaking study beyond a first degree, including asecond degree or additional study units towards a combined degree, would

SUBMISSION TO THE REVIEW OF HIGHER EDUCATION FINANCING AND POLICY
120
improve access to higher education for new students and target the existingsubsidy more cost-effectively.
This initiative would also remove an inconsistency with other fee policies. Morespecifically, institutions are able to charge most graduates full fees if theyundertake graduate or postgraduate studies. However, if the same student were toundertake further undergraduate studies, an institution is precluded from chargingthat student.
Charging for domestic undergraduate award courses
From 1998, higher education institutions will be able to directly charge upfrontfees to 25 per cent of the total enrolment of domestic undergraduates in allcourses, except medicine. However, to preserve opportunities for entry to courseson a HECS liable basis, institutions will be required to fill their target load ofHECS places before offering fee-paying places. At a minimum, institutions willbe required to charge fee-paying students the equivalent of the relevantdifferential HECS charge.
In principle, this fee initiative would seem sensible — full fees are, for example,paid by overseas students. Moreover, this initiative removes the inequity ofexcluding Australian students who are willing to pay for a place while providingfee-paying places to overseas students. It also provides greater choice forundergraduate students as they may be able to purchase a place in institutionsand/or courses from which they may otherwise be precluded. However, a loanscheme has not been included as part of this new initiative.
The lack of a loan scheme severely limits the potential benefits from the newinitiative because, in practice, it provides an option that can only be exercised bythose who can secure the necessary financial backing. It clearly provides onlyvery limited access for students from less advantaged backgrounds. Incommenting on these issues, Chapman and Salvage (1997, pp. 18–19) observed:
When higher education financing policy is one in which access is increasinglydetermined by the ability to pay, and decreasingly determined by the capacity andmotivation to learn, many able but poor prospective students are likely to beexcluded. This wastes talent and is thus poor economics. Perhaps mostimportantly, having up-front fees without an appropriate loans mechanism means agreater entrenchment of the nexus between one’s socio-economic background andfuture life opportunities; this has to be poor policy for those who believe inequality of opportunity.
The Commission’s agrees with this assessment, and considers that it would behighly desirable to make loans available to domestic fee-paying students.

123
APPENDIX 6 PERFORMANCE-BASEDFUNDING — SOME KEY ISSUES
The institutional block grant currently used to deliver most of the public funds topublic higher education institutions is largely determined on the basis of the sizeand mix of an institution’s agreed student load, with limited regard to efficiencyand/or effectiveness. Under a performance-based funding mechanism, part or allof the block grant would be allocated to each institution in line with itsperformance in key areas. The more ‘efficient’ and ‘effective’ providers wouldgain a growing proportion of public funding. In this way, performance-basedfunding would promote an indirect form of competition between providers.
The previous Government’s White Paper on Higher Education (Dawkins 1988b,p. 85), flagged an intention to develop a funding system designed to respond ‘...to institutional performance and the achievement of mutually agreed goals’ thattook ‘... into account a range of output, quality and performance measures ...’.However, to date, performance measures have only been used to a limited degree— as the basis for funding of quality assurance and equity programs, and fordistributing some research funds (ie the research quantum). Experience in theseareas has been relatively successful. Clearly, there is scope to apply performancefunding more broadly and, in particular, to teaching, the dominant component ofthe institutional block grant.
This appendix examines some key issues relating to the development and use of aperformance-based funding mechanism. Some broad benefits from adopting sucha mechanism are outlined in section A6.1. The main elements of a framework forperformance measurement and monitoring are outlined in section A6.2. Someadditional design issues for a performance-based funding mechanism arediscussed in section A6.3. Finally, some broad principles for linking funding toperformance are summarised in section A6.4.
A6.1 Benefits from performance-based funding
The adoption of a performance-based approach to the delivery of some or all ofthe public funding for higher education institutions offers a number of potentialadvantages over the present arrangements.
First, the process of developing and reporting performance measures wouldrequire clarification of the objectives underlying public funding of theseinstitutions and the desired outcomes associated with such funding. This processwould make more explicit the expectations of government — as one of the

SUBMISSION TO THE REVIEW OF HIGHER EDUCATION FINANCING AND POLICY
124
purchasers of services. This would help to make performance more transparentand strengthen accountability.
Second, the information obtained from the performance monitoring system couldbe drawn on and used to reinforce the wider dissemination of ‘best practice’approaches to teaching and learning.
Third, the collection and reporting of performance measures would also provideuseful information to students and other groups in the community about thequality and effectiveness of outputs produced by individual higher educationinstitutions.
Lastly, by identifying performance differences, it could form the basis fordeveloping performance incentives to encourage institutions to focus onimproving their performance over time.
All but the last of these benefits could be obtained by simply introducing aperformance measurement and monitoring system to complement the existingfunding system. However, incentives for improved performance would beconsiderably enhanced by formally linking funding to relative performanceoutcomes.
A6.2 Performance measurement and monitoring
Any performance-based funding mechanism, or even a performance monitoringsystem, relies on the development of measures against which to judge theperformance of service providers.
Performance measurement and monitoring is, of course, not new to the highereducation sector. Various reviews and commentators have examined issuesrelating to performance measures, including their use in funding mechanisms (egWilliams 1979; Linke 1984; 1991; Bourke 1986; AVCC 1988; HEC 1996).Moreover, as a recent survey by the HEC (1996) demonstrates, a number ofAustralia’s universities already use performance measures as a factor inallocating publicly provided funds between their operating units (ie faculties andschools).
The Steering Committee for the Review of Commonwealth/State ServiceProvision (SCRCSSP) has developed a generic framework for measuring theperformance of public service providers. The framework encompasses measuresof both efficiency and effectiveness. These measures recognise that serviceproviders (including universities, although they are not currently included in theReview) have multiple objectives and offer a range of services (SCRCSSP 1995,1997a,b).
APPENDIX 6: PERFORMANCE-BASED FUNDING – SOME KEY ISSUES
125
Efficiency generally relates to organisations’ use of resources in producingservices. This can be measured in terms of the quantity of output relative toinputs or on a cost basis. In general, the lower the inputs for a given level ofoutputs the greater the efficiency. Effectiveness reflects how well the outputs orservices of an organisation achieve their stated objectives. Effectiveness normallyencompasses a number of different dimensions of a service. From the perspectiveof (say) the teaching function of universities, relevant dimensions ofeffectiveness could include:
• appropriateness — do services match clients’ needs? This could be assessedin terms of how satisfied students, employers and staff are with the teachingprocess and how well places supplied match demand for those places;
• accessibility — how easily can university services be accessed by students,particularly those students traditionally under-represented at university (egsocio-economically disadvantaged groups)?
• quality — the degree of excellence in service provision (often a particularlychallenging dimension of service to assess). It could relate to excellence inteaching and efforts to improve quality standards; and
• outcomes — the key results arising from providing a service. It couldencompass various dimensions such as pass and completion rates, studentlearning outcomes in terms of value-added to their skills and the time takenfor graduates to find employment.
For illustrative purposes, a selection of efficiency and effectiveness measures issummarised in table A6.1. None of the measures represents a perfect measure ofperformance. Each provides useful information, but also has some drawbacks.For example, teaching expenditure per student only provides a useful measure ofefficiency if the quality of teaching is similar. Interpretation of this indicatorwould require additional contextual information, such as the learning outcomesachieved and the composition of the student body.

SUBMISSION TO THE REVIEW OF HIGHER EDUCATION FINANCING AND POLICY
126
Table A6.1: An illustrative selection of performance measures foruniversities
Measure Definition Some examples
Efficiency Ratio of outputs to inputs • Teaching expenditure per student• Student to staff ratios• Asset utilisation rates
Effectiveness
Appropriateness Do services supplied meetclient needs?
• Student/employer/staff satisfaction• Non-completion rates
Access Ability of students to usethe university
• Flexibility of course timetables,content and location
• Representation of target equity groupsin the student body
• Credit transfer arrangements andcross-institutional offerings
• Remote learning options
Quality Degree of excellence • Entry scores• Perceived quality and relevance of
teaching (student and peer review)• External student awards, prizes and
scholarships• External course accreditation• Teaching excellence awards
Outcomes Service results and theability to add to studentsskills and knowledge
• Progression or retention rates• Student completion rates• Employment rates• Graduate starting salaries
Sources: Derived from SCRCSSP 1995, 1997b; and HEC 1996.
Many practical matters must be addressed in developing a set of performancemeasures. For example, their usefulness depends on having good information anddata. But information on some aspects is scarce. For instance, the output of onepart of the education process (eg secondary schools) is often an input forsubsequent parts (eg higher education) and can affect the capacity of thesedownstream activities to add value. Thus, numeracy and literacy skills gained atprimary and secondary schools are essential for higher education. Qualityassessment presents another problem because it is often difficult to quantify andinvolves subjective judgements. Further, associated data can be costly to obtainand hard to verify. These transactions costs need to be kept in mind in developingperformance measures.

APPENDIX 6: PERFORMANCE-BASED FUNDING – SOME KEY ISSUES
127
Some aspects of performance may be complementary, while others may conflict.For example, universities may be able to progress students through the systemquickly, but at the cost of a poor education which, amongst other things, mayimpair their effectiveness in the workplace. Similarly, better research may meaninstitutions pay less attention to teaching activities. As a rule, the more diversethe range of outputs, the less useful will simple output indicators be for assessingproviders and the level of services received by clients. Thus, a suite of measuresis needed to judge performance adequately.
However, using a suite of measures adds to the complexity of the system,particularly if an overall assessment requires that weights be attached to eachmeasure. The weights applied to particular indicators could be applied system-wide as with the research quantum or be adjusted to better reflect the prioritiesagreed for individual universities. There are obviously trade-offs between settinga system-wide standard and seeking to reflect variations between institutionsarising from product-based differences between them.
According to Ashworth (1994, p.5), the ‘touchstones for any performancefunding system should include availability of data, simplicity, and flexibility tomeasure performance…’. The HEC (1996) and SCRCSSP (1995 and 1997a,b)have made similar observations. Some useful principles to follow in developingperformance measures are summarised in box A6.1.
Box A6.1: Principles to follow in developing performance measures1. Set out clearly the service objectives and broader policy goals underlying the
funding of higher education.
2. Consult with students, employers and service providers.
3. Keep the number of performance measures to a manageable size.
4. Adopt a set of performance measures that reflect the effectiveness of the servicerelative to key objectives and overall levels of efficiency.
5. Collect adequate contextual information so that the value added by each serviceprovider can be assessed from the performance measures.
6. Be mindful of the costs as well as the benefits of collecting performance measures.
Sources: Drawn from SCRCSSP 1995, 1997a,c.
A6.3 Some additional design issues
A number of additional issues need to be addressed in developing a performance-based funding mechanism. Three key issues include: the scope of performancefunding; the method of allocating performance funds; and the extent of controlexercised over the use of performance funds. These issues are addressed below.

SUBMISSION TO THE REVIEW OF HIGHER EDUCATION FINANCING AND POLICY
128
The scope of performance-based funding
Some key questions to be resolved about the scope of a performance-basedfunding mechanism include which areas to target (eg teaching, research and/orequity programs) and whether it applies to some or all of existing base funding oronly additional funds tied to system growth.
At present, the only component of the block operating grant subject toperformance-based funding is the research quantum. The adoption of a morecomprehensive approach would involve the extension of performance funding toother areas of the grant — notably teaching.
A number of Australian universities have elected to use performance measures toassist in the internal allocation of public funds for teaching, research and otheractivities. However, the use of performance funding for a sub-set of aninstitution’s activities can have perverse effects. For example, the HEC (1996, p.63) noted that:
The research quantum is reported to have had the effect of diverting interestfrom students and shifting resources in departments towards research and awayfrom teaching.
Performance-based funding applies to teaching in a number of countries —including the Netherlands, Sweden, Denmark and, within the USA, to publiclyfunded higher education institutions in Tennessee (box A6.2).
The funds allocated on a performance-basis could be provided from the existingblock grant or from supplementary funds. The research quantum was establishedby earmarking funds within the block grant for this component of funding. InSweden, Denmark and the Netherlands, performance-based funds represent aportion of base funds. In contrast, they represent a supplement or bonus paymentin Tennessee (box A6.2). Based on its survey of performance funding overseasand in Australia, the HEC (1996, p. 62) observed that ‘the prospect of a relativelysmall prize is frequently sufficient to provoke a very substantial response’.Consistent with this assessment, performance-based funding could be applied, atleast in the first instance, to a portion — say 5–10 per cent — of the existingblock grant.

APPENDIX 6: PERFORMANCE-BASED FUNDING – SOME KEY ISSUES
129
Box A6.2: Examples of performance-based funding from overseas
In the Netherlands, universities receive funding for students that complete theirdegree program in the normal time (usually four years). In Sweden, around 60 per centof the base grant for undergraduates is provided to higher education institutionsaccording to student progress rates. Output funding has encouraged institutions to takesteps to eliminate avoidable failure drop-out. Moreover, it appears that this hasoccurred without any decline in standards. However, it may have adverse effects onaccess. For example, in Denmark, around 95 per cent of teaching funds are allocatedon the basis of ‘active students’ and pass rates. According to the Head of the DanishHigher Education Division (cited in HEC 1996, p. 18):
One clear impact is that universities do not race to enrol students. The fact is thatuniversities are reluctant to admit as many students as our government wantsthem to .... This reluctance presumably stems from the fact that universities preferto enrol students who are very likely to pass.
In 1979, in consultation with institutions, the State Government of Tennessee beganoffering its publicly-funded universities and colleges a budget supplement if theyachieved specified quality measures. After several revisions, the performancemeasures now cover accreditation of courses, assessment of student performance,student satisfaction, external review and equity goals. The funding supplement has alsogrown — from 2 to 5.45 per cent of the operating grant. This is offered as a bonus —institutions cannot lose any of their base operating grant. Other key features of thesystem are that funds: are for substantial improvements in performance against aninstitution’s stated goals and targets; may be spent at the discretion of the institutions;and are not offered on a competitive basis (any funds that are not allocated are returnedto consolidated revenue).
The aim of the scheme has been to improve teaching and student learning and toreward good performance. While evaluations of the scheme are generally positive, ithas created an additional workload for staff and there is little direct evidence that it hasimproved quality. Students’ test scores have not changed much and the scheme hashad a limited impact on incentives for academic staff not directly involved in themeasurement process.
Source: Derived from HEC 1996.
The method of allocation
Performance-based funds could be allocated competitively to institutions from acommon funding pool or non-competitively at a set rate to all institutionssatisfying minimum agreed standards of performance. A system of rewards

SUBMISSION TO THE REVIEW OF HIGHER EDUCATION FINANCING AND POLICY
130
and/or sanctions could be included as an element of the allocation process ineither case.
The research quantum is presently allocated on a competitive basis tied tosuccess in attracting competitive research grants as well as other performancemeasures (appendix 2). The performance-based funding of teaching in Sweden,the Netherlands and Denmark is also competitively allocated. However,performance funding in the Tennessee scheme is based on meeting agreedminimum standards (box A6.2).
The method of allocation used will influence incentives and patterns of resourceuse within institutions. Where there is broad agreement about desired outcomesand the attributes of ‘good’ performance, a competitive approach is likely to beappropriate. However, where such outcomes are less clear, it may be desirable tovary the weights to recognise institutions’ differing capabilities and positioningstrategies.
The allocation mechanism could also include a system of rewards and sanctions.For example, institutions exhibiting ‘good’ performance could be given a firstoption to bid for growth funding linked to the expansion of teaching and/orresearch activities. As a further incentive to encourage better use of public funds,institutions could be allowed to retain a portion of any cost savings arising frombetter management and work practices.
These considerations emphasise the importance of weighing up the implicationsof different allocation and incentive mechanisms for the internal use of funds byinstitutions, as well as their wider impact on the diversity and innovativeness ofinstitutions.
The extent of control over the use of funds by institutions
Once performance funding is allocated, guidelines could be applied to their use.Alternatively, this could be left to the discretion of the institutions.
The Commission considers that institutions should have full discretion in the useof performance funds. However, this should be subject to meeting agreedoutcomes as this would provide government with an effective accountabilitydevice. Indeed, a number of studies have found that institutions often adapt theirinternal funding and management systems to take account of the criteria includedin public funding mechanisms. For example, most universities have used therelative funding model or a close variant to allocate the teaching component ofthe block operating grant (IC 1991; Piper 1995). Similarly, a significant numberof institutions distribute the greatest part of the research quantum to thedepartments or faculties that secured the funds (HEC 1996).

APPENDIX 6: PERFORMANCE-BASED FUNDING – SOME KEY ISSUES
131
A6.4 Principles and observations
Performance-based funding offers a mechanism for focusing funding on keyoutcomes or outputs and promoting indirect competition between institutions.However, the design of an effective performance framework represents a highlychallenging task.
Some commentators consider the practical issues associated with developing asystem of performance-based funding preclude its effective operation. Someidentify potential gains relative to the existing system of funding, but expressconcerns about the potential costs and, hence, have doubts about whether such amechanism would produce net benefits. For others, the potential benefits arejudged as being more significant. However, the Commission considers that,where it is not possible (or it is judged inappropriate) to promote competition bymore direct routes (eg competitive tendering or student-based funding),performance-based funding offers a technique for promoting competitionindirectly.
Clearly, the introduction of performance measures, and tying funding directly tothese measures, must be done with care to avoid perverse incentives and gamingof the system. It is essential to develop robust performance measures. Structuresfor improved performance (including the profiles process and supportingreporting mechanisms), experience with small scale performance-based fundingmechanisms and growing use of performance measures as an internalmanagement device within institutions have laid a foundation which couldsupport the greater use of this form of funding.
If the uncertainties about the introduction of a broadly-based performance relatedfunding mechanism are judged to be relatively high, one option would be toconduct small scale experimental exercises to trial such mechanisms. Widerapplication of performance-based funding would effectively be delayed pendingthe outcome of such trials, which could provide useful ‘learning by doing’insights.
Based on a review of the literature and its own experience in developingperformance measures, the Commission has developed a set of principles forlinking funding directly to performance (box A6.3). Prior to applying such afunding mechanism, it would be necessary to address the principles set out in boxA6.1, including the clear identification of policy goals underlying the funding ofhigher education and the service objectives for providers.

SUBMISSION TO THE REVIEW OF HIGHER EDUCATION FINANCING AND POLICY
132
Box A6.3: Principles for linking funding directly to performance
1. Determine whether providers can directly control definable and measurableoutcomes. If not, focus on outputs.
2. Clearly define the outputs or outcomes, including quality specifications, that arefunded, paying attention to boundaries and complementarities between outputs(eg research and teaching) to limit the potential to shift costs or shave quality.
3. Determine how different client aptitudes and needs can be classified (eg studentsfrom non-English speaking backgrounds and rural and remote areas).
4. Establish robust information on the structure and level of costs across outputs(eg different courses; on-campus versus off-campus), institutions (egurban/regional; different service categories), different client aptitudes and needs,on a neutral basis (ie include tax equivalents and capital charges).
5. Determine whether adjustments need to be made for different providercharacteristics (eg scale of operations, age of capital and capital/labour mix if onlyfunding recurrent costs).
6. Establish the appropriate cost relativities to ensure an appropriate mix of courses,and access for students that are more costly to service than the average.
7. Determine the most appropriate mix of incentives and sanctions, after considering:whether the portion of funds allocated on the basis of performance should bephased in over a number of years; who should bear the final incidence of anysanctions; and whether there are any barriers to the effective operation of rewardsand sanctions (eg employment arrangements).
8. Establish the appropriate frequency for revision of the level and structures ofregulated fees after considering the pace of technical change, the likely precision ofcost estimates (and thus the need to revise them) and the need to offer providerscertainty to foster sound investment decisions.
9. Consider conducting periodic and independent reviews of the mechanism to assessits efficiency and effectiveness.
Sources: Adapted from SCRCSSP 1997a,b,c.

133
APPENDIX 7 COMPETITIVE TENDERING —SOME KEY ISSUES
Competitive tendering offers a mechanism for allocating the public subsidy forteaching and related services on a competitive basis, in a way similar to much ofthe public funding provided for research undertaken by the higher educationsector. Under a competitive tendering approach, institutions would competedirectly for the right to supply teaching and related services. For instance, highereducation institutions could be asked to tender for all, or a portion of, the publicfunds currently provided for these purposes.
Competitive tendering would involve a shift to a formal contractual arrangementfor funding the higher education teaching function. This would involve a lessfundamental change then may first appear to be the case. Indeed, the existingfunding arrangement represents a form of contract funding — the main elementsbeing an institution’s agreed student load target set in the context of a broadereducational profile and a system-wide unit cost allowance. However, thepotential usefulness of competitive tendering is shaped by the nature of the goodor service involved and features of the market in which they are provided.Important issues in this regard include the qualitative dimensions of educationand the extent of effective competition.
As recognised by the IC (1996, p. 1) in its report on Competitive Tendering andContracting by Public Sector Agencies, competitive tendering:
... is not an end in itself. It is a valuable, but currently under-utilised, option forimproving government throughout Australia. To maximise its potential, it must beapplied intelligently.
Competitive tendering seeks to employ competition directly to improve servicedelivery outcomes. The main perceived benefits include: better clarification ofobjectives and desired outcomes; improved transparency and accountability; andimproved service outcomes (ie more cost-effective services).
The use of competitive tendering to allocate funds for enrolment growth withinthe higher education and vocational sectors has been canvassed byNBEET (1992). Indeed, some governments are already using competitivetendering to allocate public funds to technical education institutions. Forinstance, the ACT Government recently announced that, from 1998, it willoperate a tendering process for the provision of $5 million of vocationaleducation and training services.

SUBMISSION TO THE REVIEW OF HIGHER EDUCATION FINANCING AND POLICY
134
This appendix briefly discusses some key issues relating to the use of competitivetendering to allocate public funds for teaching in the higher education sector.1 Anumber of issues relating to developing a tender process are examined in sectionA7.1. Two key elements to managing service providers are addressed in sectionA7.2. Barriers to the application of competitive tendering are discussed in sectionA7.3. Finally, some broad principles to follow in applying competitive tenderingare outlined in section A7.4.
A7.1 Developing a tender process
There are four main elements to developing a tender process — servicespecifications, the size and scope of the contract, contract length and the form ofthe tender. The effective design and management of each of these elements isimportant if the potential benefits of competitive tendering are to be realised.
In principle, it would be desirable to allow all existing and potential highereducation service providers (including private institutions) to participate in acompetitive tendering process. However, this would require the higher educationsector to address competitive neutrality issues to ensure that public and privateproviders were able to compete on an ‘equal footing’. Issues relating to theoperation of not-for-profit and profit-making institutions would also need to beaddressed if competitive tendering was applied beyond the existing UNSinstitutions.
Service specifications
The service specifications provided by the purchaser (ie government) for anytendering process comprise the primary source of information for serviceproviders (ie higher education institutions). To ensure the service meets theexpectations of the various stakeholders, it is crucial that the expected serviceoutcomes are clearly specified. It is also important that program and policyobjectives are made explicit and that they are related to the desired outcomes. Toachieve these ends, the purchaser needs to develop a systematic approach toconsidering client views, as well as those of service providers.
The specification of service requirements could be achieved by documentingrequired process characteristics or desired performance attributes. Processcharacteristics are typically input related, whereas performance attributes are
1 A detailed examination of the benefits and costs and implementation issues associated with
competitive tendering is contained in the IC (1996) report on Competitive Tendering andContracting by Public Sector Agencies.

APPENDIX 7: COMPETITIVE TENDERING – SOME KEY ISSUES
135
typically output or outcome focussed. In general, it is better to outline desiredoutcomes or performance levels and allow providers to outline how these desiredresults could be best achieved. This approach allows providers to consideralternative processes and approaches. It also supports innovation in servicedelivery.
The current educational profile process does not meet this latter criterion. Thebulk of block grant funds are allocated to providers on the basis of an agreedstudent load rather than desired outcomes relating to the delivery of theteaching/training function.
Many of the desired outcomes which would need to be included in the tenderspecification could draw on performance measures like those outlined inappendix 6. Drawing on its existing knowledge of the services provided byhigher education institutions and experience in funding these services, DEETYAwould have a number of options in setting up a formal competitive process forallocating public funds to teaching. For example, it could specify:
• the total amount of funds available and the minimum acceptable quality ofoutputs, with providers competing on quantity and quality (above aprescribed minimum) and, thus, partly on unit cost;
• the unit cost and quantity of outputs (and thus a fixed level of funding),with providers competing on quality;
• the quantity and quality of outputs, with providers competing on unit cost;or
• the unit cost, with providers required to accept all clients meeting agreedadmission requirements, and competing on service quality.
Thus, DEETYA could seek to promote direct competition on the basis ofquantity, quality and unit cost. Alternatively, it may elect not to seek competitionin some of these dimensions. In these circumstances, it could specify the desiredor acceptable parameter value (eg unit cost per student) and encouragecompetition in the remaining areas.
Contract size and scope
The size and scope of a contract is important to a successful tender process.Broadly specified contracts that group the delivery of a number of services (saydelivery of courses in all disciplines and a range of other student services) intoone contract gives bidders the potential to offer innovative solutions regardingthe integration of related or complementary services. This approach also providesgreater scope for institutions to achieve the benefits of large scale operations andconsider opportunities for collaboration in meeting service requirements. On the

SUBMISSION TO THE REVIEW OF HIGHER EDUCATION FINANCING AND POLICY
136
other hand, a broad based approach would reduce competition if it locked outsmaller specialised institutions from the process. Many of the private universitiesand colleges are considerably smaller (in terms of student numbers and courseofferings) than most UNS institutions. Similarly, the purchasing process mayneed to allow for consortia bids that allow suppliers to offer specialised coursesusing expertise across a range institutions. Cooperative solutions would be anatural extension of current articulation and infrastructure sharing arrangementsand may provide opportunities for considerable cost savings.
In developing tenders, the implications of the spatial distribution of suppliers forthe scope of the contract needs to be addressed. In this context, tenders could beorganised on a geographical or zonal basis with the aim of promoting economiesin the supply as well as the distribution of services.
The introduction of contracts could be linked to making funding of growthbeyond existing agreed targets contestable. Alternatively, a portion of basefunding — say 10–20 per cent — could be subject to tendering.
Contract length
In determining the appropriate length of contracts, the government — as thepurchaser — needs to balance a number of considerations. Short contractsprovide opportunities to revisit service specifications, ensure flexibility inresponding to changing needs and resources, and provide opportunities for newproviders to emerge. They may also carry less risk of inadequate performance,particularly in service areas where it is difficult to monitor quality. Longer termcontracts give providers greater opportunities to invest in developing staff,courses, teaching processes and physical facilities. They also provide greatercertainty for students and staff. These features of longer term contracts mayprovide stronger incentives for improvements in service quality and effectivenessand/or reductions in service costs.
While some higher education institutions are funded by the CommonwealthGovernment on an annual contract basis, the bulk are funded on a rollingtriennial basis with opportunities to re-negotiate aspects of the profile as the needarises. A similar approach could be adopted with a competitive tendering process.However, provision needs to be made for re-negotiation in response to changingpolicy priorities and significant unexpected developments.
The form of the tender process
As a part of the tender process it is useful to include the relevant evaluationcriteria and associated ranking or weighting system in the tender documentation.

APPENDIX 7: COMPETITIVE TENDERING – SOME KEY ISSUES
137
This assists tenderers in preparing their tenders and also enhances the objectivityof the tender process.
At a broad level, there is a choice between selecting a single or multi-stagetendering process.
In a single stage or open tender process, bidding institutions address the fullrange of selection criteria and conditions specified in the tender. An open tendermay maximise the number of potential participants, but it can impose significantcost burdens on bidders and the contracting agency.
A multi-stage tender process enables shortlisting of bidders through an initialexpression of interest. This allows the purchaser to undertake a preliminaryevaluation of the bids with a view to inviting a smaller number of bidders toprepare a full tender. This approach has the advantage of leaving the purchaserwith a more manageable number of tenders to evaluate. In addition, institutionswith limited prospects of ultimate success are spared the cost of preparing a fulltender.
Multi-stage tendering is likely to be more effective in higher education because:
• outcomes and quality are difficult to define accurately;• the service requirements are relatively complex — there may be several
alternative approaches to particular tasks; and• service providers vary considerably in focus as well as in skills and
capabilities.
A7.2 Managing service providers
Any competitive tendering mechanism needs to incorporate performanceindicators against which to assess outcomes and the ongoing performance of theservice providers. Beyond this, it may be useful to develop an incentivesframework to encourage service providers to improve their performance.
Performance monitoring is an important element of any purchase-providerarrangement and should be closely linked to the agreed service specifications. Atthe same time, the performance monitoring process needs to be well focussed toensure that providers are not burdened with unnecessary costs.
Competitive tendering arrangements could also incorporate an incentivesframework to reward good performance and penalise poor performance.Examples of potential rewards/sanctions in the context of higher educationfunding arrangements include increasing or decreasing the rigours ofperformance monitoring, providing bonus payments or applying penalties,

SUBMISSION TO THE REVIEW OF HIGHER EDUCATION FINANCING AND POLICY
138
allowing providers to retain a portion of any cost savings they realise, andexpanding or reducing the value of future contracts.
A7.3 Barriers to the application of competitive tendering
The aim of competitive tendering is to employ direct competition betweenservice providers to improve service delivery outcomes. The tender process andconditions in the market for higher education are important factors influencingthe likely success of tendering.
In this context, a number of factors are relevant including genuine rivalrybetween suppliers, absence of collusion between bidders and the attributes of thegood or service.
The higher education market and post-secondary school education market arecharacterised by a relatively large number of potential bidders. While there arelegislative barriers to new entrants to parts of the market, including the universitymarket, many segments of the market are potentially highly competitive. In somecases, spatial factors may limit the scope of effective competition faced byregional universities, although more flexible learning packages such as OpenLearning impose some competitive disciplines on these institutions. In othercases, government policies circumscribe the competitive process somewhat. Forexample, public subsidies for teaching only apply to UNS institutions. From acompetitive neutrality perspective, it would seem appropriate for governments toreview the merits of these arrangements.
Collusion between bidders can significantly undermine the benefits associatedwith competitive tendering. The university system is characterised by bothcooperative and competitive activities. Thus, there is scope for collusivebehaviour. For example, in the US, there is some evidence of higher educationinstitutions engaging in price fixing (Rothschild & White 1993). In the UK, acompetitive tendering scheme for university places was abandoned due to theuniformity in the bids received, while a scheme covering the polytechnic sectorwas found to be successful (box A7.1).
The UK experience suggests that it may be advisable to introduce tendering withonly a small pool of funds or services. The pool could be progressively expandedas service providers and the government acquired greater experience with aformal contracting approach. The UK experience also reinforces the importanceof developing an effective tender process.
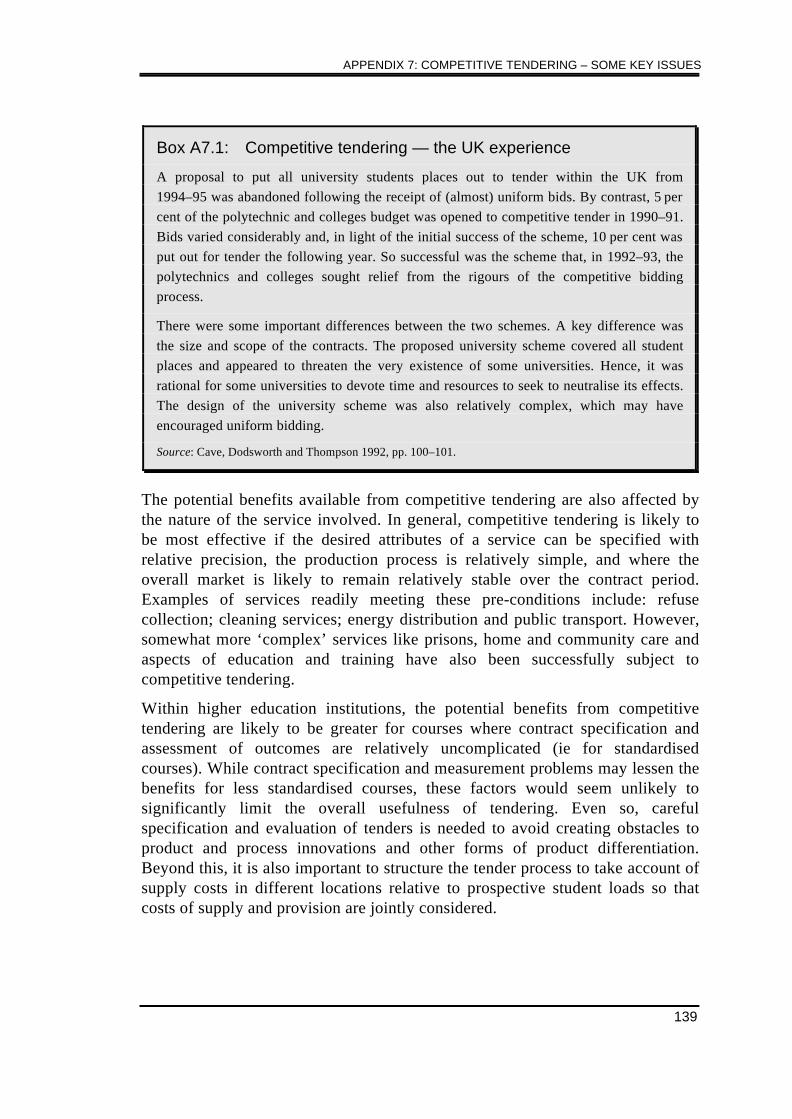
APPENDIX 7: COMPETITIVE TENDERING – SOME KEY ISSUES
139
Box A7.1: Competitive tendering — the UK experience
A proposal to put all university students places out to tender within the UK from1994–95 was abandoned following the receipt of (almost) uniform bids. By contrast, 5 percent of the polytechnic and colleges budget was opened to competitive tender in 1990–91.Bids varied considerably and, in light of the initial success of the scheme, 10 per cent wasput out for tender the following year. So successful was the scheme that, in 1992–93, thepolytechnics and colleges sought relief from the rigours of the competitive biddingprocess.
There were some important differences between the two schemes. A key difference wasthe size and scope of the contracts. The proposed university scheme covered all studentplaces and appeared to threaten the very existence of some universities. Hence, it wasrational for some universities to devote time and resources to seek to neutralise its effects.The design of the university scheme was also relatively complex, which may haveencouraged uniform bidding.
Source: Cave, Dodsworth and Thompson 1992, pp. 100–101.
The potential benefits available from competitive tendering are also affected bythe nature of the service involved. In general, competitive tendering is likely tobe most effective if the desired attributes of a service can be specified withrelative precision, the production process is relatively simple, and where theoverall market is likely to remain relatively stable over the contract period.Examples of services readily meeting these pre-conditions include: refusecollection; cleaning services; energy distribution and public transport. However,somewhat more ‘complex’ services like prisons, home and community care andaspects of education and training have also been successfully subject tocompetitive tendering.
Within higher education institutions, the potential benefits from competitivetendering are likely to be greater for courses where contract specification andassessment of outcomes are relatively uncomplicated (ie for standardisedcourses). While contract specification and measurement problems may lessen thebenefits for less standardised courses, these factors would seem unlikely tosignificantly limit the overall usefulness of tendering. Even so, carefulspecification and evaluation of tenders is needed to avoid creating obstacles toproduct and process innovations and other forms of product differentiation.Beyond this, it is also important to structure the tender process to take account ofsupply costs in different locations relative to prospective student loads so thatcosts of supply and provision are jointly considered.

SUBMISSION TO THE REVIEW OF HIGHER EDUCATION FINANCING AND POLICY
140
A7.4 Some broad principles
A competitive tendering process offers an avenue to open the higher educationmarket up to more direct competition and, in the process, yield improvements inservice delivery. However, to be effective, the tendering process must be welldesigned and intelligently applied (IC 1996). As part of a broad investigation ofthe practice of competitive tendering, the Commission has identified some keyprinciples to help users develop an approach to tendering. These principles —which are summarised in box A7.2 — are also relevant to higher education.
Box A7.2: Some key principles to follow when applying competitivetendering
1. Specify the service objectives in clear, accurate and easy to follow terms.
2. Consult both the clients (or their representatives) and service providers in preparingthe specifications and other aspects of the tender documentation.
3. Adopt performance-based specifications wherever possible.
4. Use industry-wide standard forms of tender documentation (including contracts) andstandardised tender processes where possible.
5. Select a type of contract appropriate to the characteristics of the service and nature ofthe market.
6. Include an appropriate mix of incentives and penalties when specifying the servicecontract.
7. Consider incorporating dispute resolution procedures which reduce the need andlikelihood of court action into the service contract.
8. Identify the risks involved in any contractual arrangement and allocate these risks tothe party best able to manage them.
9. Use multi-stage tendering whenever feasible and shortlist as quickly as possible.
10. Allow adequate time for bid preparation and between tender stages, taking intoaccount the scope and difficulty of information requested from tenderers.
11. Seek no more than the information required at each tendering stage.
12. Publish tender evaluation schedules as early as possible, and adhere to them.
Box A7.2: (Cont’d)
13. Specify the selection criteria to be used in the tender evaluation and rank them in orderof importance in tender documentation.
14 Consider employing an independent auditor on the evaluation panel and undertaking aprobity audit of the tendering process.
Source: Adapted from IC 1996, p. 41.

APPENDIX 7: COMPETITIVE TENDERING – SOME KEY ISSUES
141

143
APPENDIX 8 DEMAND-BASED FUNDING —SOME KEY ISSUES
Competition is being increasingly embraced in a wide range of areas, includinginfrastructure and social services, as a means of promoting better outcomes.Specific examples include reforms in areas such as public transport, electricity,telecommunications and health services. In primary and secondary education,various governments have facilitated competition by allowing public schools toaccept students from outside defined ‘catchment’ areas and directing publicsubsidies to private providers.
In higher education, recent and announced reforms have seen a growing share ofuniversity incomes derived from private sources. The introduction of the HECS,the expansion of full-fee paying places for foreign students, the introduction offull fees for some postgraduate courses, commercialisation of various activitiesand, from 1998, the capacity to admit full-fee paying domestic undergraduatestudents all point to a growing market orientation within the sector and a shift infunding from taxpayers to users.
Similar trends are apparent in a variety of developed countries. According to theOECD (1990, p. 3):
In many OECD countries the 1980s has been a decade of rapid and quite radicalchanges in the pattern of financing and control of higher education systems. Keyfactors behind these changes are strong limitations on central public funds,increased reliance on the market, trends toward decentralisation and greateropenness to community needs, and claims for greater institutional autonomy. Bynow many governments see financial schemes and incentives as a more effectiveway of steering developments in higher education institutions than directadministrative intervention.
This appendix examines options for increasing the efficiency and effectiveness ofAustralia’s higher education system by placing greater reliance on a decentralisedmarket-oriented approach. Key elements required to link institutional fundingmore closely to student demand are discussed in section A8.1. Section A8.2examines the pros and cons of a shift toward student-driven funding, whilesection A8.3 discusses factors that impinge on the ability of this approach todeliver better outcomes. Equity and research issues are addressed in section A8.4.

SUBMISSION TO THE REVIEW OF HIGHER EDUCATION FINANCING AND POLICY
144
A8.1 Key elements of a demand-based funding model
Demand-based funding can improve the performance and student orientation ofhigher education institutions by placing greater reliance on competition and thecapacity of prices to reflect differences in the cost and perceived value ofdifferent courses. It links public contributions to the performance of theseinstitutions (judged from a student’s perspective) by attaching teaching subsidiesto student enrolments at particular institutions. In this way, the distribution oftuition subsidies reflects student valuations and choices — recognising thateducation is a significant investment for students, primarily, in earnings foregonein delaying their entry to the workforce. Consequently, they have a significantinterest in the overall cost and quality of the teaching services they receive.
Demand-based funding gives institutions greater freedom to determine the price,quantity and the range of services offered in response to student demands. Itinvolves:
• linking tuition subsidies to individual students;• removing restrictions on the number of subsidised students each institution
can enrol;• allowing institutions to determine their own fees; and• allowing full portability of tuition subsidies (ie giving subsidised students
that satisfy entrance requirements an unrestricted choice of institutions andcourses).
A system of funding in which subsidies to higher education follow and reinforcestudent demand has found support among various commentators, both overseas(eg Friedman 1955, 1980; Blaug 1972; Crew and Young 1977; West 1988, 1997)and domestic (eg Hogbin 1988a; Blandy & Sloan 1988; NCA 1996; Karmel,1991, 1995, 1996, 1997a,b). Discussion has generally occurred in the context ofeducation ‘vouchers’, but variations on this theme include proposals for ‘feeremission entitlements’, ‘tuition scholarships’ and ‘learning entitlements’. Inwhat follows, the term ‘portable scholarships’ is used to cover these options.
In some respects, a shift from the current funding system to a portablescholarship system would involve only minor administrative changes.Universities are already paid a teaching grant on the basis of student load(amounting to around $4.4 billion this year). West (1988, 1997) has noted thegrowing use of payment systems in which ‘funds-follow-the-student’ and hassuggested that these might be seen as a de-facto voucher arrangement. However,while this is an important feature of demand-driven funding, it is only one of anumber of measures needed to promote competitive service delivery. It needs tobe complemented by action to remove restrictions on student intake, pricing and

APPENDIX 8: DEMAND-BASED FUNDING – SOME KEY ISSUES
145
the range of eligible education providers, all of which can limit competitivepressures and reduce the potential gains from linking scholarships to students.
Karmel (1997a,b) has outlined in some detail how a system of studentscholarships might operate within Australia. An overview of key elements isprovided in box A8.1. However, a variety of options are available for the ultimatedesign of a portable scholarship scheme, with differing implications for the cost,flexibility, diversity, efficiency and perceived fairness of the system. Theultimate form and impact of a portable scholarship system would depend ondecisions about the following five key elements.
• • Number of scholarships– a fixed number each year?
– a proportion of the population or a target group within the population?
• • Criteria for scholarship eligibility– merit-based?
– means-tested?
– available for second and further degrees?
– available to Australian residents only?
• • Value of scholarships– fixed?
– proportion of course fees?
– capped or uncapped?
– uniform duration?
– duration linked to scheduled course length?
• • Degree of institutional fee autonomy– partial regulation — prescribed fee bands?
– full autonomy — no fee controls?
• • Degree of scholarship portability– accredited public universities only?
– accredited public and private providers, including equivalent or allaccredited TAFE courses?
– redeemable at recognised overseas universities?

SUBMISSION TO THE REVIEW OF HIGHER EDUCATION FINANCING AND POLICY
146
Box A8.1: The Karmel higher education scholarship proposalValue of scholarships
• Varies with course costs, but should be set to promote efficient resource allocation.
• On current course costs, would vary from $5 000 per annum for less expensive courses to$13 500 per annum for the most expensive courses.
• Average scholarship value determined to be equal to current average subsidy per full-timestudent equivalent.
Number of scholarships
• Could be linked to demographic changes by setting the number equivalent to a proportion ofa cohort (eg 40 per cent of 18–24 year olds); or
• Could be linked to tertiary entry scores with appropriate provision for mature age entry (egaccess to a scholarship would be granted to all those above the 50th percentile); or
• Could be varied at the government’s discretion.
Allocation of scholarships
• Awarded on a national ranking basis in response to student applications.
• Provided to students entering the higher education system for the first time.
• Provision for entrants from secondary school and mature age or special entry with scope for atranche provided direct to universities for special cases or to meet regional needs.
• Scholarships would be of limited tenure (say, for a maximum of 5 or 6 years), beyond whichstudents would be required to pay in full for further study.
• Unsubsidised university students eligible for scholarship after displaying successfulperformance.
Fees
• Universities have full autonomy over fees (against which the scholarships would be offset).
• HECS deferral and repayment arrangements would continue to apply up to a specifiedmargin beyond the value of the scholarship.
Transitional arrangements
• Current funding arrangements would apply to students enrolled prior to commencement ofthe scholarship program; or
• Transitional scholarships awarded for partially completed degrees.
Source: Karmel 1997a,b.
A8.2 Potential implications of a demand-based approach
A degree of competition already occurs within the current system. Universitiescompete for the best students — because they are most likely to enhance thereputation of the university, are often easier to teach, and can confer benefits onother students (Rothschild & White 1995). Many students compete for theirpreferred university through their performance at secondary school — yet for

APPENDIX 8: DEMAND-BASED FUNDING – SOME KEY ISSUES
147
those that miss out on a place at their preferred university or in their preferredcourse, there is currently little scope to gain entry.1
Against this background, for most students and institutions a portable scholarshipsystem might not result in a radical departure from current enrolment and fundingpatterns. But, at the margin, a move to a portable scholarship system could haveimportant effects. Students would have greater scope to influence the nature ofcourses offered by institutions in terms of attributes such as price, teachingmethods and quality. Similarly, institutions would have greater freedom torespond to these preferences and adapt course offerings accordingly. Thisenhanced flexibility and responsiveness could deliver considerable benefits.
While proponents of a demand-based system highlight the potential gains such anapproach might bring, others point to the potential costs, and question whetherthe structure and characteristics of the higher education market lend themselvesto effective competition, and the realisation of net gains. These issues areexamined below.
Expected benefits
Demand-based approaches to funding the teaching activities of universities aredirected at promoting efficiency and dynamism within the sector. Allowingprices to reflect the cost of providing particular courses and students’ valuationsof those courses and teaching techniques would give important signals touniversities about how to allocate their resources so they provide the greatestbenefit to participants.
Demand-driven teaching also increases incentives to adopt new and bettermethods of teaching that can enhance the educational experience of studentsand/or allow universities to reduce their costs.
Harrison (1993, p. 32) notes that:
The outcome would most likely be a greater variety of offerings, as each universitystrove to find a market for its services and to match the vast diversity in studentcircumstances, abilities and interests. The appropriate mix of subjects and qualitieswould then be determined by market demands, resulting in a more diverse andresponsive system.
Proponents of demand-driven funding for higher education point to a range ofpotential benefits.
1 From 1998, students that fail to get into their preferred course/institution may be able to buy
a place. However, this would mean relinquishing the tuition subsidy that most wouldotherwise be entitled to. This significantly constrains mobility.

SUBMISSION TO THE REVIEW OF HIGHER EDUCATION FINANCING AND POLICY
148
• • Students, who bear significant costs in undertaking education, wouldhave a more direct influence over the range and quality of courseofferings– this could underpin more effective communication of labour market
needs to training institutions, through the students themselves andthrough incentives for greater liaison between universities and industryaimed at identifying and anticipating employment and skill needs;
– institutions would have greater incentives to be responsive to studentneeds and values; and
– the need for bureaucratic (and administratively costly) approaches tofunding would be reduced.
• • Public universities would face greater competitive pressures andrewards– funding would flow to those courses and institutions offering the most
attractive combination of price, quality, flexibility, facilities,convenience, etc;
– there would be greater scope for institutions to offer higher qualitycourses in response to student demand;
– increased scope would exist to attract and retain high quality staff;
– incentives for institutions to specialise in courses that they can provide atlower cost or higher quality than competitors would be greater; and
– there would be greater incentives and scope for innovation, includingdevelopment of new techniques and imitation of best-practices.
• • Increased transparency– cross-subsidies between courses and institutions that were not consistent
with demand and cost considerations would become more transparentand would need explicit justification; and
– government intervention in support of particular courses or institutionswould be explicit.
Demand driven approaches have been emphasised as a means of promoting andrewarding excellence within the higher education system. For example, Milne(1996) highlights the difficulties of maintaining adequate career paths fortalented academics in Australia under current pricing and funding constraints,and the tendency for this to lead to a ‘brain drain’ to the UK and North America.Concerns that academic salaries are currently too low to attract and hold high

APPENDIX 8: DEMAND-BASED FUNDING – SOME KEY ISSUES
149
quality staff, particularly within vocational disciplines, are echoed by Karmel(1997a); Coady (1996); Nicholls (1996) and others in the academic community.
Removal of fee controls would permit greater flexibility in the pricing ofdifferent types of courses and also provide institutions with greater freedom todevelop effective remuneration packages for good staff, subject to students beingprepared to pay a premium for entry to an institution offering better instructorsand better education. Conversely, institutions offering lower quality instruction,or a less attractive education ‘package’, would face pressure to lower tuition feesor improve their performance.
Nevertheless, there are fears that a move to a demand-driven approach mighthave some undesirable effects. These are examined below.
Potential costs
Potential costs or difficulties associated with increasing the market disciplinefaced by higher education institutions have been raised by various writers(Sale 1992; Albrecht and Ziderman 1992; Nicholls 1996; Carnoy 1997; Karmel1997a). The key ones include:
• the possibility that students do not have sufficient information to makeinformed choices;
• the potential for low student demand and high-cost courses to bediscontinued, even though there may be important external (society-wide)benefits associated with the courses;
• planning difficulties and uncertainties facing institutions as a result ofvariations in student demand;
• the possibility that teaching quality and research may suffer if institutionsbecome more attuned to student demands;
• threats to the viability of institutions that are heavily reliant on the cross-subsidies generated under the current system; and
• the potential for abuse of market power, reflected in significant feeincreases and reduced student access.
These potential problems are discussed below.
The possibility that students do not have sufficient information to makeinformed choices
Within the existing market for higher education, educational institutions, industrygroups and client based groups (eg the Graduate Careers Council of Australia)provide a variety of information services to assist students in making decisions

SUBMISSION TO THE REVIEW OF HIGHER EDUCATION FINANCING AND POLICY
150
about courses and institutions. Students also rely on a number of informalinformation sources, including parents and friends.
While the extent and quality of information about institutions varies, there isclearly a considerable body of readily accessible information on career paths,necessary qualifications, course offerings, accreditation by professional orindustry groups, quality of institutions, and ancillary information on course andliving costs. Within a market where opportunities for competition are beingenlarged, institutions and client servicing groups will have considerableincentives to identify new information needs and seek to satisfy them. Forexample, institutions seeking to demonstrate ‘quality’ in terms of acceptance oftheir courses, good teaching techniques and learning outcomes would have anincentive to participate in course accreditation and quality assurance programsinvolving professional groups and peer assessment. Similarly, they would havean interest in demonstrating high levels of satisfaction amongst their graduates interms of teaching techniques and learning outcomes, as well as employment.
In this context, it is not readily apparent that the existing arrangements would failto serve the information needs of students adequately. However, if a move tostudent-based funding were initiated, it may be useful for government to monitorthe performance of the various information agents relative to identified studentneeds and assess whether there was a need to improve information flows.
The potential for low student demand and high-cost courses to be lost
Under a demand-based funding system, low demand and high-cost courses willundeniably experience greater pressure in attracting, or even retaining, resources.In fact, one of the advantages of such a system is that it puts pressure onuniversities and their administrators to examine the revenue and costrelationships for different courses and allocate resources to activities whose valueto students exceeds their cost of supply.
It is important to recognise that decisions about the teaching and researchactivities of universities are not just demand driven, they also have regard tointerdependencies between activities. To the extent that some courses arecomplementary to others, there will be scope for institutions to carry courses thatare not in high demand and/or have relatively high costs. Some courses may, ineffect, be an input to a wider program that is highly valued, making it feasible forinstitutions to cross-subsidise lower demand and/or high-cost units. The use ofcross-subsidies to finance a wider range of courses has parallels with thestrategies of commercial entities, such as the way that shopping centres find itprofitable to support child care services or department stores find it profitable toprovide ‘marginal’ services to enhance their overall attractiveness to customers.
APPENDIX 8: DEMAND-BASED FUNDING – SOME KEY ISSUES
151
Similar interdependencies are likely to exist between teaching and researchactivities. For example, Nerlove (1972, p. 201) suggests that ‘... a range ofresearch and teaching activities are mutually supportive and more efficientlycarried on (using fewer scarce resources) together than apart’. In cases where thisis true, competition is unlikely to drive out courses and activities that contributeto synergies within the university environment.
There are some areas in which the private interests of students may not coincidewith wider community interests — certain courses such as (say) Philosophy andEnglish Literature may be under-valued in the marketplace, yet their existencemay be seen as socially desirable. As discussed in appendix 3, if external benefitsare thought to attach to particular courses there may be a case for providingexplicit subsidies to the courses.
Planning difficulties and uncertainties facing institutions as a result ofvariations in student demand
A portable scholarship system could make the life of universities more uncertainbecause it would remove the ‘assurance’ of a minimum number of enrolmentseach year at a guaranteed price — although, even under the current system, someuniversities have not been able to fill their student load targets(DEETYA 1996c). To some extent, the increased uncertainty is the ‘price’ paidfor increasing dynamism within the sector and introducing greater incentives toinnovate and serve student needs. The Commission recognises that the teachingand research activities undertaken within universities have relatively longplanning horizons and are likely to benefit from operational and financialpredicability. However, these supply characteristics are shared by a wide range ofactivities which have to compete in the market place without ‘assured’ levels ofdemand for their goods and services. More specifically, a variety of large andresearch-oriented enterprises must live with considerable uncertainties about theenvironment in which they trade. Typically, they respond to these circumstancesby engaging in market research, active marketing, competitive pricing andcontinuous product and process improvement. Moreover, the apparently lowmobility of Australian students and relative stability of enrolment trends suggestthat there are unlikely to be sizeable ‘swings’ in enrolments.
The possibility that teaching quality and research may suffer
Albrecht and Ziderman (1992) note the potential for a student driven fundingsystem to lead to a drop in higher education standards. They suggest that it islikely to increase pressures on institutions to pass marginal students, or givestudents incentives to seek out ‘degree mills’ where the chances of passing, orobtaining better grades, are higher.

SUBMISSION TO THE REVIEW OF HIGHER EDUCATION FINANCING AND POLICY
152
To some extent, these incentives are present in the Australian system already.While a change in the status of lecturers, from ‘pedagogue’ towards ‘purveyor ofteaching services’ has understandable ramifications for the power balancebetween university staff and students, the current arrangements can just as easilylend themselves to the perpetuation of poor teaching practices and lethargyamong both students and staff as they can to the pursuit of academic excellence.
Within a more competitive environment there would, however, be strongcommercial incentives for the maintenance of academic standards. Factors thattarnish an institution’s reputation would make the job of attracting students moredifficult and reduce income in the medium to longer term. However, this pointsto the need for effective mechanisms for communicating information on teachingand graduate performance and, in light of the long lead times often involved inestablishing this sort of feedback, processes of external assessment andaccreditation. Such mechanisms are important irrespective of whether the currentarrangements, or portable scholarships, underpin university funding.
The scope for research activity to be diminished under a more student-orientedhigher education system is also relevant. The teaching component of theoperating grant currently paid to universities includes general funds for researchactivity linked to teaching and research training. Universities have full discretionin allocating these funds between their operating units, including the level offunds earmarked for general research. In its inquiry into Research andDevelopment (IC 1995), the Commission recognised that some research wasintegral to good teaching practice and maintaining expertise within a particularfield. Hence good teaching would necessarily imply a need for accompanyingresearch activity. In this context, it would seem appropriate to include an elementof general research funding within the value of each tuition scholarship. Theissue of funding research is taken up in section A8.4.
Fels (1996) has observed that within the US higher education sector there is atendency for students to be drawn toward the better research universities therebyreinforcing, rather than detracting from, quality research effort withinuniversities. According to Fels, this is because the reputation of universities isoften built on their research rather than their teaching — largely because theformer is easier for outsiders to assess. Hogbin (1988b) has also noted thisreinforcing effect.
Threats to the viability of institutions that are heavily reliant on the cross-subsidies generated under the current system
The potential for significant reductions in student loads at some regionaluniversities — and associated implications for the viability of the range ofcourses and faculties that are currently available — is sometimes raised as an

APPENDIX 8: DEMAND-BASED FUNDING – SOME KEY ISSUES
153
argument against the introduction of portable scholarships (Sale 1992;Nicholls 1996). Given the demonstrated capacity of these institutions to developmarket niches and take advantage of opportunities for distance education underthe existing funding arrangements, the extent to which these activities andinstitutions would be put at risk is unclear. Nevertheless, there are likely to besome universities that expand their student numbers at the expense of others.
To the extent that some institutions might face problems in attracting sufficientstudents to retain a critical mass, there would be scope for governments to assistthese institutions by direct and transparent means — if this were consideredappropriate. At present, the cost of supporting high cost/low demand institutionsis effectively hidden, hindering explicit assessment of the economic, social andregional benefits and costs of such policies. This is not to deny the possibilitythat, in some circumstances, it may be appropriate for some courses, or evenwhole institutions, to close.
The potential for abuse of market power, reflected in significant feeincreases and reduced student access
Concerns have been expressed that a move to greater fee autonomy would enablesome institutions to set ‘excessive’ fees for some courses and earn ‘excess’profits (Marginson 1996). This could occur if some universities have marketpower and are able to extract a price premium from students. Perceiveddifferences in the quality and prestige of institutions, the availability of particularcourses, or the fact that significant relocation costs might be associated with by-passing a local university to attend another could all provide institutions with adegree of market power.
In practice, the market power of higher education institutions would becircumscribed by a number of features.
First, while rationing of places within universities with strong reputations can bea device for supporting tuition fees that are significantly above course costs, it isunlikely that such practices could be sustained in the long term if reputation isnot backed up by actual performance. Quality commands a price premium but, ifquality and reputation diverge, demand will eventually become more pricesensitive. Related to this, the ability of some institutions to charge higher pricesacts as an incentive to rival suppliers to compete in these relatively high pricemarket niches. In the medium to longer term, this constrains the ability of leadinguniversities to sustain fees at levels that are significantly above the cost ofdelivering particular courses.
Second, although the higher education market is regionalised, major citiesnormally offer several providers. As a result, the majority of students will have a

SUBMISSION TO THE REVIEW OF HIGHER EDUCATION FINANCING AND POLICY
154
range of institutions and courses available to them, and the opportunity toidentify those that represent better value.
Third, the extent of competition within the higher education market is not justinfluenced by the existence of rival suppliers at a particular location. Advances ininformation and communication technology and the continuing development ofdistance learning options are a further source of competitive pressure. Indeed,these developments are broadening the base of competition beyond a national toan international market.
Finally, decisions by institutions to exercise market power would be influencedby provisions within the Trade Practices Act relating to market conduct and anti-competitive behaviour. These provisions, together with the risk of governmentsanctions in the event of serious abuses of market power, are likely to providestrong incentives for institutions to avoid the misuse of any market power theymay possess.
A8.3 Promoting competitive outcomes in higher education
A demand-based funding system encourages competition and efficiency bygiving students greater freedom to choose between education providers. And, byfreeing up fees and student places, it gives greater incentive to institutions totailor their teaching practices and levels of quality to demands within the studentpopulation. However, the magnitude of the benefits, in terms of more cost-reflective pricing, more relevant course offerings and greater innovation, willdepend on the degree of effective competition.
The New Zealand experience of deregulation in the tertiary education sectoroffers some lessons for Australia. Constraints on tuition fees were removed in1992. At the same time, the government introduced a student loan program andreduced the per-student tuition subsidy. These changes took place against thebackdrop of a sector experiencing excess demand and pressures on coursequality. With fee deregulation there are now much wider differences in fee levelsacross courses and institutions. The average level of fees increased considerablyinitially, in part, as a response to the reduction in the per-student tuition subsidyand the existence of pent-up demand. The fee increases have allowed universitiesto improve the quality of courses, fund more places (even in the face of shrinkingtuition subsidies), and student participation rates have increased. Someuniversities are now moving to open new campuses in direct competition withestablished providers. The larger private contributions of students toward theirtuition costs has also led to greater demands on institutions to provide qualityservices and to increased scrutiny of universities’ costs and pricing policies.

APPENDIX 8: DEMAND-BASED FUNDING – SOME KEY ISSUES
155
Some concerns have been expressed about the extent to which some of the feeincreases in New Zealand have reflected the use of market power by certaininstitutions. In part, this could be due to failure of policy initiatives in NewZealand to ensure that all obstacles to the development of effective competitionwere removed. To this end, all regulatory barriers to competition should beremoved and measures introduced to ensure that public and private providerscompete on equal terms (ie regulations and other government measures treatsuppliers within the same market on a competitively neutral basis). Thesecomplementary policy initiatives were applied only partially in New Zealand.
Factors likely to play an important role in influencing the degree of effectivecompetition in the higher education market include:
• • Student mobility– Competitive pressure will be increased if students have a choice of
universities and courses and are able to ‘shop around.’– In general it is likely that low student mobility will be less of an
impediment to competition in city-based education markets wherethere are usually several higher education institutions.
– Although students have tended to exhibit low levels of mobility(DEET 1993), greater use of information and communicationtechnology and open learning systems provide growing opportunitiesfor the university to ‘travel’ to the student.
• • Barriers to market entry– It is important that government-based entry requirements for new
higher education institutions are not overly restrictive.– Accreditation procedures provide students with an assurance that
courses are appropriate and satisfy minimum standards. Universitylevel courses are accredited by the relevant academic board,sometimes in consultation with professional bodies. Private providerscan only offer a course leading to a higher education award if thecourse is accredited under the Tertiary Education Act and the provideris authorised to provide the course. Such courses must also beincluded on the relevant State/Territory Register of AccreditedCourses. Similar arrangements apply for accrediting vocationaleducation and training courses.
– While these accreditation and quality assurance arrangements promoteadherence to minimum standards and help to reduce the costs tostudents of gaining information on service providers and courses, anappropriate balance needs to be struck between maintaining quality

SUBMISSION TO THE REVIEW OF HIGHER EDUCATION FINANCING AND POLICY
156
standards and facilitating student access to diverse and innovativeproviders.
• • Competitive neutrality– As far as possible, public and private providers should compete on
their merits and be subject to similar regulatory and other obligations.– At present, lack of portability of tuition subsidies to private
institutions and constraints on the ability of their students to borrowon the same terms as public university students are key areas ofcommercial inequality.
– Tax exemptions for public universities, establishment concessions andcapital charge issues require further consideration in the context of thedominance of not-for-profit institutions in the higher education sectorand the desirability of establishing a level playing field for allproviders. As noted in appendix 5, inherent commercial advantagesare enjoyed by public universities with city locations and, currently,neither city or regional public universities are explicitly required toprovide a return on the valuable land and buildings they occupy.

APPENDIX 8: DEMAND-BASED FUNDING – SOME KEY ISSUES
157
• • Availability of information on relative performance– The availability of reliable and relevant information on university
performance can facilitate informed student choice and signal apotential divergence between reputation and current practice.
– As indicated in appendix 3, the public good nature of this sort ofinformation once it is provided can lead to under-supply by privateproviders.
– Technological developments, such as the internet, can help increasethe efficiency of information dissemination, thereby allowing studentsto gauge teaching performance and value for money more accurately.
Technological developments can be expected to increase significantlyopportunities for competition and efficiency within higher education. It is likelythat they will allow students to make more informed education choices, reducethe cost of ‘attending’ distant universities, and provide scope for cheaper teachingmethods.
The rapid growth of enrolments under the Open Learning Initiative and scope forfurther improvements in the quality of distance education suggest an increasedpotential for these facilities to offer a flexible, low cost alternative to traditionalteaching methods in many subjects. A recent evaluation of the Open LearningInitiative (CSHE 1996) found that students within the program achieved resultscomparable with, and in some cases better than, those obtained by studentsstudying on campus or through distance education. While the financing of OpenLearning as an add-on to the existing higher education infrastructure suggestssome cross-subsidisation of it by established facilities, the direct costs associatedwith its operation nevertheless point to its capacity to drive price competition insome areas.
Recent moves by the University of Melbourne to establish an internationalconsortium of universities, Universitas 21, also highlights the increasing scopefor international co-ordination and competition in the higher education sector,made possible largely through technological development. Such consortia mayhave a significant impact on the complexion and relative standing of Australianuniversities in coming years. The university’s strategic plan (University ofMelbourne 1997, p. 2) suggests that:
The world’s leading universities of the twenty-first century will be first andforemost international institutions.
Such universities will recruit and retain academic and general staff of the highestquality from around the world, attract national and international students ofexceptional ability, promote high levels of staff and student interaction with otherleading universities, irrespective of location and maintain curricula that are validand relevant internationally.

SUBMISSION TO THE REVIEW OF HIGHER EDUCATION FINANCING AND POLICY
158
Against this changing background, the design features of a portable scholarshipsystem will have an important bearing on the degree of competition within thehigher education market as well as the vocational training and education market.
Currently, students attending private institutions do not have access to the publicsubsidy for higher education or income-contingent loans (as provided underHECS). These represent formidable competitive disadvantages for theseproviders. Both private universities are fully accredited and have demonstrated adegree of innovation within the Australian system, yet pressure on publicproviders to emulate these innovations is muted by the substantial ‘comfort zone’that the current funding arrangements provide. Allowing these and other privateproviders that satisfy minimum quality and probity requirements to enrol publicscholarship bearing students would be a significant stimulus to competitionwithin the higher education market.
Applying the same funding principles to TAFE equivalent courses would placepublic funding for equivalent study on a comparable basis. Students would havewider choices and the degree of competition between institutions would beincreased. Hence, the Commission considers that the West Review shouldexamine the merits and feasibility of extending a portable scholarship andautonomous fee regime (with provision for an income-contingent loanmechanism) to courses offered by TAFE colleges.
Other features of a portable scholarship system of relevance in this contextinclude the number and basis for allocating scholarships, the value assigned tothem and the process of implementation.
A decision about the number of portable scholarships to offer would reflectjudgements about the appropriate scale of the publicly funded component of thepost-secondary education sector. Clearly governments would need to determinethe appropriate level of funding. Students’ eligibility for a portable undergraduatescholarship could be based on their tertiary entrance scores and, in the case ofmature aged entrants, their results for an admission test. Students would receive ascholarship having regard to their relative merit in national rank order.Postgraduate and merit-based equity scholarships would be allocated on much thesame basis.
As previously discussed, the Commission favours an interim cost-sharingarrangement for funding higher education teaching involving a uniformproportional 50:50 split between private and public contributions forundergraduate students (appendixes 3 and 5). Accordingly, the Commissionproposes that the portable scholarships would — pending more evidence onspillover benefits — cover 50 per cent of undergraduate course fees at accreditedinstitutions, including TAFE equivalent courses. In the case of postgraduatestudents of exceptional ability the Commission considers that an arrangement

APPENDIX 8: DEMAND-BASED FUNDING – SOME KEY ISSUES
159
similar to the Australian Postgraduate Awards Scheme would continue to beappropriate. Postgraduate students meeting the eligibility criteria would receive aportable scholarship with a full fee remission.
For the undergraduate scholarships and, with full fee autonomy, the absolutevalue of the public and private contributions would vary in accordance with thecourse and institution in which a student enrolled.
The cost sharing arrangement, together with competition between accreditedinstitutions for students, would impose disciplines on institutions in settingcourse fees. However, if the government were to be concerned about its exposureto unpredictable budgetary costs it could apply a funding cap to its component ofthe cost-sharing arrangement. To the extent that fees increased so as to triggersuch a cap, students would become liable for any ‘excess’.
All students (subsidised and unsubsidised, public and private) would have theoption of paying their share of the fee up-front or deferring payment. Wherestudents opted to defer payment of their fees, they would be able to access agenerally available income-contingent loan facility — similar to that availableunder the HECS. However, as outlined in appendix 5, it would be desirable toreform the interest charging and repayment arrangements for this loanmechanism.
The actual pattern of fees, teaching outcomes and student flows that wouldemerge under a portable scholarship scheme is difficult to predict. However, inview of the significant nature of the changes associated with adopting a portablescholarship/full fee autonomy approach, the Commission recognises a transitionperiod would be necessary to address design, operational and implementationissues. The transition period would need to be carefully managed to avoidunnecessary costs and unwarranted delays. There are a number of possibilities.
A detailed planning phase could be initiated to address key design andimplementation issues. A key aspect of this would involve finalisingarrangements for the introduction of a full portable scholarship/autonomous feesetting regime from a specified date.
Alternatively, a formal evaluation project could be set up involving either asimulation exercise or a staged approach to implementation. The simulationexercise could involve running a portable scholarship/full fee autonomyarrangement in parallel with the existing funding mechanism, with a focus onsettling design issues, identifying areas of adjustment pressure and formulatingproposed responses to them.
A staged approach could involve allowing public universities greater discretionto deviate from enrolment targets (for subsidised students) and HECS-prescribedfee levels within allowable limits (say by up to 20 per cent above prescribed fee

SUBMISSION TO THE REVIEW OF HIGHER EDUCATION FINANCING AND POLICY
160
and enrolment levels) in combination with the introduction of portablescholarships (and loans) redeemable at all accredited institutions. Theseconstraints could be progressively modified or lifted so that after a period (say 2to 3 years) implementation would be complete.
A8.4 Approaches to equity and research funding
Government involvement in the higher education sector is partly driven by adesire to promote equity objectives and ensure adequate and effective funding ofresearch activities (appendix 3). Moves to more market-oriented fundingarrangements for the financing of higher education often generate fears in relationto equity and research funding issues. These issues are briefly examined below.
Equity issues
The adoption of a demand-driven approach to financing higher education wouldnot preclude the continuation of programs directed at addressing equityobjectives relating to access and promoting equality of opportunity. Indeed, asthe equity discussion in appendix 3 demonstrates, there is a need for a range ofgeneral and specific measures to address equity objectives.
Hence, there would remain scope to continue initiatives like an income-contingent loan mechanism for students who opt to defer fee payments, as well asspecific equity initiatives such as the merit-based equity scholarship scheme toprovide certain students with full or partial exemptions from course fees.Similarly, there would be scope to continue other specific programs which targetaccess related barriers for particular student groups — such as AUSTUDY andthe higher education equity program.
Incorporating equity-related programs into a demand-based funding approachwould also help to overcome legitimate concerns, commonly associated withportable scholarship schemes, that greater fee autonomy and student discretion toattend those institutions that best match their educational aspirations and budgetscan lead to social stratification within the system (Carnoy 1997).
The essence of a portable scholarship system is to reduce restrictions on bothstudents and institutions and increase the range of choices available to allstudents. This outcome would complement equity initiatives.

APPENDIX 8: DEMAND-BASED FUNDING – SOME KEY ISSUES
161
Research funding
Research within universities is a key issue in its own right. It has beenextensively reviewed by the Commission in its inquiry into Research andDevelopment (IC 1995).
Research activities within universities can be broadly broken into twocomponents. The first is research (and associated training) necessary tocomplement and inform teaching within a university environment. The second isleading-edge research directed towards adding to the stock of knowledge. Inpractice, there is considerable overlap between these components.
Currently, the teaching component of the block operating grant includes notionalfunding for the first form of research mentioned above. Because teaching andresearch activities are intertwined, and often complementary, it is not possible tobe definitive about the appropriate split between teaching and research fundingwithin this component of the block operating grant. Indeed, under existingarrangements, institutions are given full discretion in determining the allocationof these funds between teaching and research in support of teaching.
In the Commission’s view, this is appropriate as it provides institutions withflexibility in allocating funds to different disciplines. The costs of undertakingresearch in support of teaching vary across discipline areas. For example, largerstudent numbers usually require more teachers with an associated increase insupporting research requirements. Research that requires laboratories is usuallymore expensive than ‘desk type’ research and requires more resources. Similarly,courses with a larger research component will benefit from being taught by thoseresearchers at the cutting-edge and will, in general, require more researchresources. Overall, institutions are in the best position to assess the needs of theirstudents, as well as the capabilities and skills of their staff. Reflecting theseconsiderations, the Commission considers that the public subsidy correspondingto the value of the portable scholarship under a demand-based funding approachshould cover the teaching and research training elements of the existing teachingcomponent of the block operating grant.
The second component of research is more variable in nature across institutionsand is not well suited to funding based on student numbers and types of teaching.Consequently, it has different funding arrangements and is currently primarilyfunded by grants from the research quantum and research infrastructureprograms, selective funding of projects under the control of the AustralianResearch Council and through other mechanisms such as the National Health andMedical Research Council and the Cooperative Research Centres program.Postgraduate awards for research represent a separate stream of research funding.In the Commission’s view, it would be appropriate to broadly retain thesearrangements although, as outlined in its Research and Development report (IC

SUBMISSION TO THE REVIEW OF HIGHER EDUCATION FINANCING AND POLICY
162
1995), it considers the Australian Research Council is best placed to assumeongoing responsibility for the research quantum, including the disbursement ofquantum grants and decisions relating to the performance of universities relativeto the funding criteria.

163
REFERENCES
ABS (Australian Bureau of Statistics) 1991, Expenditure on Education, Australia,1989–90, Cat. no. 5510.0, AGPS, Canberra.
—— 1992, Education and Training in Australia, Cat. no. 4224.0, AGPS, Canberra.
—— 1994, Training and Education Experience, Australia, Cat. no. 6278.0, AGPS,Canberra.
—— 1996a, Education and Training in Australia, Cat. no. 4224.0, AGPS, Canberra
—— 1996b, Expenditure on Education, Australia, 1994–95, Cat. no. 5510.0, AGPS,Canberra.
—— 1996c, Australian National Accounts: National Income, Expenditure and Product,Cat. no. 5204.0, AGPS, Canberra.
—— 1996d, 1993–94 Household Expenditure Survey, Australia: The Effects ofGovernment Benefits and Taxes on Household Income, Cat. no. 6537.0, AGPS,Canberra.
—— 1997, Research and Experimental Development: Higher EducationOrganisations; Australia, Cat. no. 8111.0, AGPS, Canberra.
ACER (Australian Council for Educational Research) 1993, Higher Education:Participation and Access in the 1980s, ACER, Melbourne, as cited in Clare andJohnston 1993, Education and Training in the 1990s, Economic Planning AdvisoryCouncil, Background Paper No. 31, AGPS, Canberra.
ACVETS (Australian Committee on Vocational Education and Training Statistics)1996, Selected Vocational Education and Training Statistics 1995, National Centrefor Vocational Education Research, Adelaide.
Albrecht, D. and Ziderman, A. 1992, Funding Mechanisms for Higher Education:Financing for Stability, Efficiency and Responsiveness, World Bank DiscussionPaper 153, World Bank, Washington.
Alchian, A. 1968, ‘The economic and social impact of free tuition’, reprinted inAlchian, A. 1977, Economic Forces at Work, Liberty Press, Indianapolis, pp. 203–26.
APESMA (Association of Professional Engineers, Scientists and Managers,Australia ) 1997, mimeo (internet).
Ashworth, K. H. 1994, ‘Performance-based funding in higher education: the Texas casestudy’, Change, November/December, USA.

SUBMISSION TO THE REVIEW OF HIGHER EDUCATION FINANCING AND POLICY
164
ATO (Australian Taxation Office) and DEETYA (Department of Employment,Education, Training and Youth Affairs) 1996, HECS Your Questions Answered1997, AGPS, Canberra.
Australian Universities Commission 1976, Report for the 1977–79 Triennium, AGPS,Canberra.
AVCC (Australian Vice-Chancellors’ Committee) 1988, Report of the AVCC/ACDPWorking Party on Performance Indicators, Canberra.
—— 1996, Survey of Applicants for Undergraduate Higher Education Courses 1996,mimeo (internet).
—— 1997, ‘Shaping Australia’s future: investing in higher education’, Submission tothe Review of Higher Education Financing and Policy, mimeo (internet).
Barr, N. 1993, ‘Alternative funding resources for higher education’, The EconomicJournal, no. 103 (May), pp. 718–728.
Becker, G. 1964, Human capital, National Bureau of Economic Research, New York.
—— 1975, Human Capital: a Theoretical and Empirical Analysis, with SpecialReference to Education, 2nd ed., University Chicago Press, USA.
Benhabib, J. and Jovanovic, B. 1991, ‘Externalities and growth accounting’, AmericanEconomic Review, vol. 81, no. 1, March, pp. 82–113.
BIE (Bureau of Industry Economics) 1992, Recent Developments in the Theory ofEconomic Growth: Policy Implications, Occasional Paper 11, AGPS, Canberra.
Blandy, R. 1992, ‘Lawyers’ incomes in Australia’, Paper presented at the Conference ofEconomists, Melbourne, July.
—— and Sloan, J. 1988, ‘In search of excellence and efficiency in Australian highereducation’, in Hogbin (ed), Withering Heights: The State of Higher Education inAustralia, Allen & Unwin, Sydney.
Blaug, M. 1972, An Introduction to the Economics of Education, Penguin Books,Middlesex.
—— 1987, The Economics of Education and the Education of an Economist, EdwardElgar Publishing, Aldershot.
Bond University 1996, mimeo (internet).
Bourke, P. 1986, Quality Measures in Universities, Commonwealth Tertiary EducationCommission, Canberra.
Brennan, H.G. 1971, ‘Fee abolition: an appraisal’, The Australian University, vol. 9, no.2, July, pp. 81–149.

REFERENCES
165
—— 1988, ‘Tertiary education fees — yet again’, in Hogbin, G.R (ed), WitheringHeights — the State of Higher Education in Australia, Allan & Unwin, Sydney,pp. 186–209.
Carnoy, M. 1997, ‘Is privatization through education vouchers really the answer? acomment on West’, The World Bank Research Observer, vol. 12, no. 1, February,pp. 105–16.
Casey Institute of Technical and Further Education 1997, mimeo (internet).
Cave, M., Dodsworth, R., and Thompson, D. 1992, ‘Regulatory reform in highereducation in the UK: incentives for efficiency and product quality’, Oxford Reviewof Economic Policy, vol. 8, no. 2, pp. 79–101.
Chapman, B. 1988, An Economic Analysis of the Higher Education ContributionScheme of the Wran Report, Discussion Paper No. 196, Centre for EconomicPolicy Research, Australian National University, Canberra.
—— 1996a, Conceptual Issues and the Australian Experience with Income ContingentCharges for Higher Education, Discussion Paper No. 350, Centre for EconomicPolicy Research, Australian National University, Canberra.
—— 1996b, ‘The rationale for the higher education contribution scheme’, AustralianUniversities Review, vol. 1, pp. 43–50.
—— and Chia, T. 1989, Financing Higher Education: Private Rates of Return andExternalities in the Context of the Tertiary Tax, Discussion Paper No. 213, Centrefor Economic Policy Research and Department of Economics, Australian NationalUniversity, Canberra.
—— and Pope, D. 1992, Government, Human Capital Formation and HigherEducation, Discussion Paper No. 271, Centre for Economic Policy Research,Australian National University, Canberra.
—— and Salvage, T. 1997, The Consequences of Recent Changes in Financing forAustralian Higher Education, Centre for Economic Policy Research, AustralianNational University, Canberra.
Chia, T. 1990, Returns to Higher Education, PhD thesis, Australian NationalUniversity.
CIT (Canberra Institute of Technology) 1997, Course handbook, CIT, Canberra.
Clare, R. and Johnston, K. 1993, Education and Training in the 1990s, EconomicPlanning Advisory Council Background Paper No. 31, AGPS, Canberra.
Coady, T. 1996, ‘The very idea of a university’, Australian Quarterly, vol. 68, no. 4, pp.49–62.
SUBMISSION TO THE REVIEW OF HIGHER EDUCATION FINANCING AND POLICY
166
Cohn, E. and Geske, T.G. 1990, The Economics of Education, 3rd ed, Pergamon Press,Oxford.
Committee of Inquiry into Education and Training 1979, Education, Training andEmployment, Report of the Committee of Inquiry into Education and Training(B. Williams, Chairman), AGPS, Canberra.
Committee of Inquiry into Labour Market Programs 1985, Report of the Committee ofInquiry into Labour Market Programs, (P.E.F. Kirby, Chairman), AGPS,Canberra.
Committee on Higher Education Funding 1988, Report of the Committee on HigherEducation Funding, (N. Wran, Chairman), AGPS, Canberra.
Crew, M.A. and Young, A. 1977, Paying by Degrees, Institute of Public Affairs,London.
CSHE (Centre for the Study of Higher Education) 1996, Evaluation of the OpenLearning Initiative: Tertiary Access Through a National Brokerage Agency, FinalReport, University of Melbourne.
Davis, J. 1996, ‘Paying several pipers’, Australian Quarterly, vol. 68, no. 4, pp. 9–22.
Dawkins, J. (Minister for Employment, Education and Training) 1987, HigherEducation: A Policy Discussion Paper, AGPS, Canberra.
—— 1988a, A New Commitment to Higher Education in Australia, AGPS, Canberra.
—— 1988b, Higher Education: a Policy Statement, AGPS, Canberra.
DEET (Department of Employment, Education and Training) 1987, 1984 Survey ofFull-time Tertiary Student Finances, AGPS, Canberra.
—— 1993, National Report on Australia’s Higher Education Sector, AGPS, Canberra.
—— 1995a, Selected Higher Education Finance and Research Expenditure Statistics1993, AGPS, Canberra.
—— 1995b, Australia’s Workforce 2005: Jobs in the Future, AGPS, Canberra.
DEETYA (Department of Employment, Education, Training and Youth Affairs) 1996a,Selected Higher Education Student Statistics 1996, AGPS, Canberra.
—— 1996b, Selected Higher Education Staff Statistics 1996, AGPS, Canberra.
—— 1996c, Higher Education Funding Report for the 1997–99 Triennium, AGPS,Canberra.
—— 1997a, Selected Higher Education Finance Statistics 1995, AGPS, Canberra.
—— 1997b, Background to Higher Education in Australia, Canberra.
—— 1997c, Job Guide, mimeo (internet).

REFERENCES
167
—— and OECD (Organisation for Economic Co-operation and Development) 1997,Thematic Review of the First Years of Tertiary Education: Australia, OECD, Paris.
Department of Human Services 1995, National Drug Strategy Household Survey,distributed by the Social Sciences Data Archive, ANU, Canberra.
Dowrick, S. 1995, ‘The determinants of long-run growth’, in Andersen, P., Dwyer, J.and Gruen, D. (eds), Productivity and Growth, conference proceedings 10–11 July1995, Economic Group, Reserve Bank of Australia, Sydney.
Fane, G. 1988, ‘Unto everyone that hath shall be given: Australian policies for highereducation’ in Hogbin, G.R. (ed), Withering Heights, Allen & Unwin, Sydney,pp. 137–164.
Federal Coalition 1996, Coalition Higher Education Policy, mimeo (internet), 20February 1996.
Fels, R. 1996, ‘Making US schools competitive’, ch3 in Becker, W.E. and Baumol,W.J. (eds) 1996, Assessing Educational Practices: The Contribution of Economics,The MIT Press, Cambridge (Mass).
Flatau, P. and Simpson, M. 1996, ‘Part-time youth employment and training: evidencefrom the Australian Youth Survey’, Labour Economics and Productivity, vol. 8,pp. 131–160.
Freebairn, J., Porter, M. and Walsh, C. (ed) 1988, Spending and Taxing II: TakingStock, Allen & Unwin, Sydney.
Freeman, R.B. 1986, ‘Demand for education’, in Ashenfelter, O. and Layard, R. (eds)Handbook of Labour Economics, vol. 1, North-Holland, Amsterdam.
Friedman, M. 1955, ‘The role of government in education’, in Solo, R.A.(ed),Economics and the Public Interest, Rutgers University Press, New Brunswick,pp. 123–144.
—— and Friedman, R. 1980, Free to Choose, Macmillan, Melbourne.
Gregory, R. 1995, ‘Higher education expansion and economic change’, AustralianBulletin of Labour, vol. 21, pp. 295–322.
Grubel, H.G. 1987, ‘The economics of the brain drain’, in Psacharopoulos, G. (ed),Economics of Education: Research and Studies, Pergamon Press, Oxford, pp. 201–206.
Harding, A. 1995, ‘Financing higher education: an assessment of income-contingentloan options and repayment patterns over the life cycle’, Education Economics,vol. 3, no. 2.
Harrison, M. 1993, ‘Fees, subsidies and the market for higher education’, Policy,Spring, pp. 28–32.

SUBMISSION TO THE REVIEW OF HIGHER EDUCATION FINANCING AND POLICY
168
—— 1995a, Government Financing of Higher Education in Australia: Rationale andPerformance, mimeo, Department of Economics, Australian National University,Canberra.
—— 1995b, Management training & higher education: an economic perspective’,Ch 12 in (The Karpin Report), Enterprising Nation: Renewing Australia’sManagers to Meet the Challenges of the Asia-Pacific Century, Industry Task Forceon Leadership and Management Skills, AGPS Canberra.
HEC (Higher Education Council) 1996, Performance-Based Funding of Universities,Commissioned Report no. 51, AGPS, Canberra.
HED (Higher Education Division of DEETYA) 1996, Administrative GuidelinesManual for Higher Education Institutions on HECS and Fees 1996, AGPS,Canberra.
Higher Education Management Review Committee 1995, Higher EducationManagement Review, AGPS, Canberra.
Hilmer Committee. See Independent Committee of Inquiry 1993.
Hinchliffe, J.K. 1987a, ‘Forecasting manpower requirements’, in Psacharopoulos, G.(ed), 1987, Economics of Education — Research and Studies, Pergamon Press,Oxford, pp. 315–23.
—— 1987b, ‘The alpha coefficient’, in Psacharopoulos, G. (ed), 1987, Economics ofEducation — Research and Studies, Pergamon Press, Oxford.
Hogbin, G.R. 1988a, ‘Introduction’, pp. 1–58 in Hogbin (ed), Withering Heights, Allen& Unwin, Sydney.
—— 1988b, ‘Internal control and efficiency in higher education’, 1988 AustralianEconomics Congress, 28 August to 2 September, ANU, Canberra.
Hope, J. and Miller, P. 1988, ‘Financing tertiary education: an examination of theissues’, The Australian Economic Review, 4th quarter, pp. 37–57.
Hunt, D., and Hicks, J. 1985, ‘Economic returns to university education in NewZealand’, New Zealand Journal of Educational Studies, vol. 20, no. 2, pp. 170–185.
IC (Industry Commission) 1991, Exports of Education Services, Report no. 12, AGPS,Canberra.
—— 1995, Research and Development, Vol. 1–3, Report no. 44, AGPS, Canberra.
—— 1996, Competitive Tendering and Contracting by Public Sector Agencies, Reportno. 48, AGPS, Canberra.
Independent Committee of Inquiry 1993, National Competition Policy, Report by theIndependent Committee of Inquiry, (F. Hilmer, Chairman), AGPS, Canberra.

REFERENCES
169
Karmel, P. 1991, Past, Present and Future: The Australian University into the Twenty-First Century, John Curtin Memorial Lecture, ANU, Canberra.
____ 1995, ‘Establishing a free market for higher education services’, HigherEducation Funding, AIC Conference, 24–25 July, Sydney.
____ 1996, ‘At the crossroads’, Opening address at 20th Conference of the AustralasianInstitute of Tertiary Education Administrators: Management Strategies for the NewMillennium: Tertiary Education at the Crossroads, 24–28 September, Perth.
—— 1997a, Submission to the Review of Higher Education Financing and Policy,mimeo (internet).
—— 1997b, Policy Perspectives on Higher Education Financing: A ComprehensiveProgram of National Scholarships, Discussion Paper No. 360, Centre forEconomic Policy Research, Australian National University, Canberra.
Kirby Committee 1985. See Committee of Inquiry into Labour Market Programs.
Layard, R. and Psacharopoulos, G. 1974, ‘The screening hypothesis and the returns toeducation’, Journal of Political Economy, vol. 82, no. 5, pp. 985–98.
Linke, R. 1991, Performance Indicators in Higher Education: Report of a TrialEvaluation Study Commissioned by the Commonwealth Department ofEmployment, Education and Training. Vol. 1, AGPS, Canberra.
——, Birt, L., Fensham, P., Scott, R. and Smith, B. 1984, Report of a Study Group onthe Measurement of Quality and Efficiency in Australian Higher Education,Commonwealth Tertiary Education Commission, Canberra.
Maani, S. 1996, ‘The effects of fees on participation in higher education: a survey ofOECD countries, New Zealand Economic Papers, vol. 30, no. 1, pp. 55–86.
Macleay College 1997, Handbook 1997, Sydney.
Maglen, L. 1993, ‘Education expansion and the private returns on a university degree’,Economic Papers, vol. 13, pp. 57–71.
Marginson, S. 1996, ‘Competition in higher education in the post-Hilmer era’,Australian Quarterly, vol. 68, no. 4, pp. 23–35.
McGauran, P. (Minister for Science and Technology) 1996, Science and TechnologyBudget Statement 1996–97, AGPS, Canberra.
Miller, P. and Volker, P. 1987, The Youth Labour Market in Australia: A Survey ofIssues and Evidence, Discussion Paper No. 171, Centre for Economic PolicyResearch, Australian National University, Canberra.
Milne, F. 1996, Lessons From Australian Academic Experience, EconomicsDepartment, Queens University, Kingston, Ontario, mimeo.
SUBMISSION TO THE REVIEW OF HIGHER EDUCATION FINANCING AND POLICY
170
NBEET (National Board of Employment, Education and Training) 1992, Post-compulsory Education and Training: Fitting the Need, AGPS, Canberra.
NCA (National Commission of Audit) 1996, Report to the Commonwealth, AGPS,Canberra.
NCC (National Competition Council) 1997a, Competitive Neutrality Reform: Issues inImplementing Clause 3 of the Competition Principles Agreement, AGPS, Canberra.
—— 1997b, Compendium of National Competition Policy Agreements, AGPS,Canberra.
Nerlove, M. 1972, ‘On tuition and the costs of higher education: prolegomena to aconceptual framework’, Journal of Political Economy, vol. 80, no. 2,pp. 178–218.
—— 1975, ‘Some problems in the use of income-contingent loans for the finance ofhigher education, Journal of Political Economy, vol. 83, no. 1, pp. 157–83.
Nicholls, J. 1996, ‘Tuition fees and the future of public higher education’, AustralianQuarterly, vol. 68, no. 4, pp. 36–48.
Niland, J.R. 1984, ‘Special labour market adjustment measures’ in B.J. Chapman, J.E.Isaac and J.R. Niland (eds) Australian Labour Economics: Readings, 3rd ed,Macmillan, Melbourne, pp. 531–547.
Norris, K. 1993, The Economics of Australian Labour Markets, 3rd ed, LongmanCheshire, Melbourne.
OECD (Organisation for Economic Co-operation and Development) 1990, FinancingHigher Education Current Patterns, Paris.
—— 1996, Education at a Glance, Centre for Educational Research and Innovation,Paris.
Pincus, J. and Miller, P. 1997, ‘Funding of higher education in Australia: Performanceand diversity’, Submission to the Review of Higher Education Finance and Policy,mimeo (internet).
Piper, D. 1995, ‘Performance related resource allocation within universities’, Journal ofTertiary Education Administration, vol. 17, Nov. 2.
Psacharopoulos, G. 1975, Earnings and Education in OECD Countries, OECD, Paris.
—— 1984, ‘The contribution of education to economic growth: internationalcomparisons’, reproduced in Blaug, M. (ed) 1992, The Economic Value ofEducation: Studies in the Economics of Education, Edward Elgar Publishing,Aldershot, pp. 470–90.
—— (ed) 1987, Economics of Education — Research and Studies, Pergamon Press,Oxford.
REFERENCES
171
—— 1993, Returns to Investment in Education — A Global Update, Policy ResearchWorking Paper WPS 1067, The World Bank, Washington.
Richardson, S. 1988, ‘Who benefits from higher education’, in Hogbin, G.R (ed),Withering Heights — the State of Higher Education in Australia, Allen & Unwin,Sydney.
Robinson, M. 1996, Modelling Earned Income for Full-Time Students: Research Notes,National Centre for Social and Economic Modelling, University of Canberra.
Rothschild, M. and White, L.J. 1993, ‘The university in the marketplace: some insightsand puzzles’, Ch 1 in Clotfelter, C.T. and Rothschild, M. (eds), Studies of Supplyand Demand in Higher Education, University of Chicago Press, Chicago.
—— 1995, ‘The analytics of the pricing of higher education and other services in whichthe customers are inputs’, Journal of Political Economy, vol. 103, no. 3, pp. 573–86.
Sale, T. 1992, The Funding of Postsecondary Education in Canada: Can the DilemmaBe Resolved?, Economic Council of Canada, Working Paper No. 28, Ottowa.
Schultz, T. 1961, ‘Investment in human capital’, American Economic Review, vol. 51,pp. 1–17.
SCRCSSP (Steering Committee for the Review of Commonwealth/State ServiceProvision) 1995, Report on Government Service Provision, AGPS, Canberra.
—— 1997a, ‘Performance measurement for universities’, Submission to the Review ofHigher Education Financing and Policy, mimeo.
—— 1997b, Report on Government Service Provision, vol. 1–2, AGPS, Canberra.
—— 1997c, Reforms in Government Service Provision, Case Studies: Human Servicesin South Australia; Public Hospitals in Victoria; Correctional Services inQueensland, AGPS, Canberra.
Selvaratnam, V. 1994, Innovations in Higher Education: Singapore at the CompetitiveEdge, World Bank Technical Paper Number 222, The World Bank,Washington D.C.
Spence, M. 1974, ‘Competitive and optimal responses to signals: an analysis ofefficiency and distribution’, Journal of Economic Theory, vol. 7, no. 3, pp. 296–332.
Tirole, J. 1990, The Theory of Industrial Organization, The MIT Press, Cambridge,Mass.
UNESCO (United Nations Educational, Scientific and Cultural Organization) 1995,Statistical Yearbook 1995, UNESCO Publishing and Bernan Press, USA.

SUBMISSION TO THE REVIEW OF HIGHER EDUCATION FINANCING AND POLICY
172
University of Melbourne 1997, Earning Esteem: Strategic Plan 1997–2001, Universityof Melbourne.
University of Notre Dame 1997, ‘General information’, mimeo (internet).
Vanstone, A. (Minister for Employment, Education, Training and Youth Affairs) 1996a,Higher Education Budget Statement 1996, AGPS, Canberra.
—— 1996b, ‘Relieving the pressure on higher education’, Australian Quarterly,vol. 68, no. 4, pp. 1–8.
—— 1997, ‘Enrolments show universities are thriving’, DEETYA Media Release,V76/97.
West, E.G. 1988, Higher Education in Canada: An Analysis, The Fraser Institute,Vancouver.
—— 1997, ‘Education vouchers in principle and practice: a survey’, The World BankResearch Observer, vol. 12, no. 1, February, pp. 83–101.
Williams, B. 1979. See Committee of Inquiry into Education and Training.
Williams, R.A., Pye, W., Anwyl, J.E. and Waniganayake, M. 1989, RelativeTeaching Costs in Higher Education, Selected Victorian Institutions,University of Melbourne.
Williams, T. 1987, Participation in Education, Australian Council for EducationalResearch Monograph No. 30, ACER, Melbourne.
——, Long, M., Carpenter, P. and Hayden, M. 1993, Entering Higher Education in the1980s, AGPS, Canberra.
Woodhall, M. 1987, ‘Student loans’, in Psacharopoulos, G. (ed), Economics ofEducation — Research and Studies, Pergamon Press, Oxford, pp. 445–50.


