Copy Rights © LEGEND Co. 2010 - E-Learning/An-Najah...
74
11/08/2014 1 Copy Rights © LEGEND Co. 2010 Copy Rights © LEGEND Co. 2010
-
Upload
trinhxuyen -
Category
Documents
-
view
216 -
download
1
Transcript of Copy Rights © LEGEND Co. 2010 - E-Learning/An-Najah...
11/08/2014
1
Copy Rights © LEGEND Co. 2010
Copy Rights © LEGEND Co. 2010

11/08/2014
2
Copy Rights © LEGEND Co. 2010
Introduction
RF people work in either
RF Planning RF Optimization
Responsibilities
Nominal Plan Design
Sites Survey
Validation from field
Set RF design (Structure, Azimuth,
Height, Tilt, Cables type)
Frequency Plan
Sites Acceptance
They have to provide the coverage either
outdoor or indoor.
Responsibilities
Maintain the Network‘s Accessibility KPIs
Maintain the Network’s Retain ability KPIs
Maintain the Network’s Service Integrity KPIs
Study and Apply new features
Try to think of innovative solutions to
maximize the Network capacity
They have to maintain the performance of
the Network as good as possible.
Copy Rights © LEGEND Co. 2010

11/08/2014
3
Copy Rights © LEGEND Co. 2010
Course Outlines
Planning Process and Procedures.
Dimensioning Process.
Site Tuning.
Technical Site Survey.
Neighbors and Frequency Planning.
Copy Rights © LEGEND Co. 2010
11/08/2014
4
Copy Rights © LEGEND Co. 2010
Copy Rights © LEGEND Co. 2010
GSM System Survey Revision
GSM stands for “ Global System for Mobile Communication”
Second Generation for Mobile System.
Digital System.
Efficient Use of the Spectrum.
Speech privacy and security.
Better resistance to interference (Introducing the frequency Hopping)
Efficient use of the power battery (Introducing the power control)
GSM Networks are called “PLMN: Public Land Mobile Networks” i.e. the
Radio Sites are located on land, not using satellites.
11/08/2014
5
Copy Rights © LEGEND Co. 2010
GSM System Survey Revision
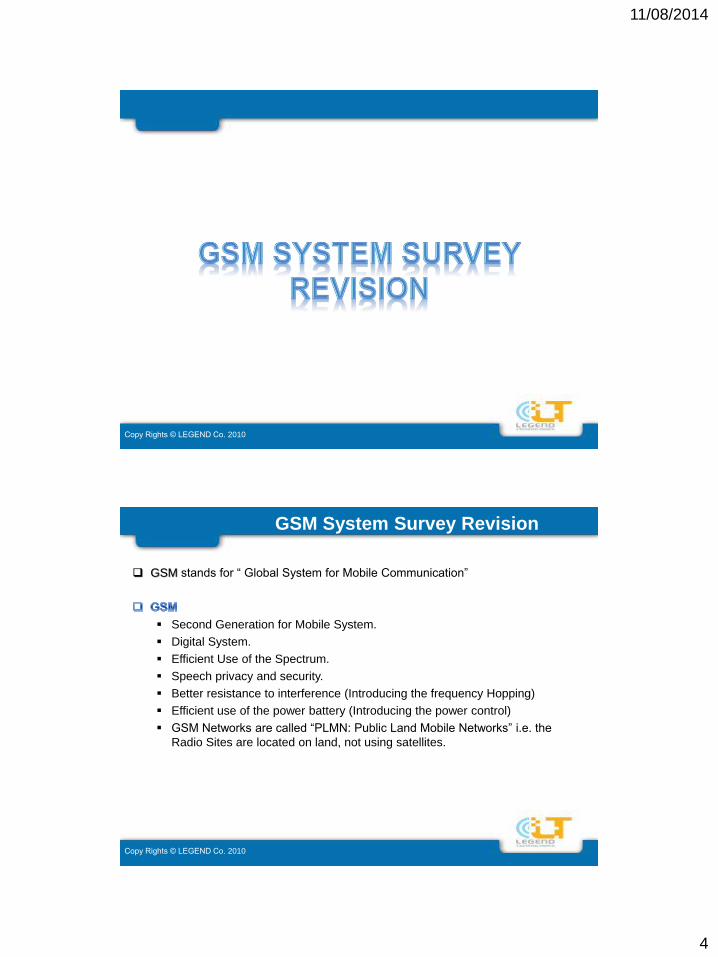
• GSM System can work in different bands as follows:
– DCS: Digital Cellular System PCS: Personal Communication Services.
• But what do we mean by frequency Band?
• What is the DL and UL?
• Why DL is higher than UL band?
Frequency Band-Down Link Frequency Band-Up Link
GSM 800 869 894 MHz 824 849 MHz
E-GSM (Extended GSM) 925 935 MHz 880 890 MHz
P-GSM 900 935 960 MHz 890 915 MHz
GSM 1800 (DCS) 1805 1880 MHz 1710 1785 MHz
GSM 1900 (PCS) 1930 1990 MHz 1850 1910 MHz
Copy Rights © LEGEND Co. 2010
GSM System Survey Revision
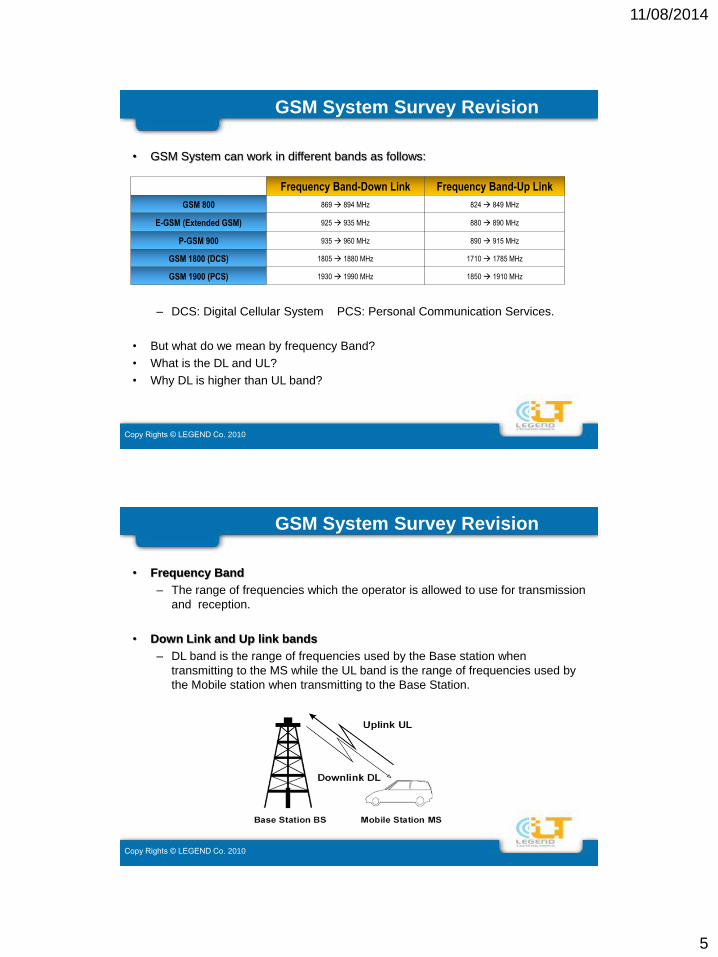
• Frequency Band
– The range of frequencies which the operator is allowed to use for transmission
and reception.
• Down Link and Up link bands
– DL band is the range of frequencies used by the Base station when
transmitting to the MS while the UL band is the range of frequencies used by
the Mobile station when transmitting to the Base Station.

11/08/2014
6
Copy Rights © LEGEND Co. 2010
GSM System Survey Revision
• Why DL band is higher than the UL band?
– As freq then attenuation with air
– Since Power BaseStation > Power MobileStation then it is wise to configure the higher
frequencies that will be attenuated fast to the side that is using higher power.
Copy Rights © LEGEND Co. 2010
GSM System Survey Revision
• Access Techniques What do we mean by Access techniques?
These are the Techniques through which many MSs can access the shared media
which is the air interface.
i. FDMA ( Frequency Division Multiple Access)
Each MS is assigned a dedicated frequency through which he can talk.
ii. TDMA (Time Division Multiple Access)
All MSs are using the same frequency but each of them will be utilizing
it only over a certain period of time called Time Slot (TS)
In GSM System we’re using TDMA over FDMA where the frequency band
is divided into no. of frequencies each of which is shared among no. of
MSs, where each MS will be assigned a certain TS on certain
frequency.

11/08/2014
7
Copy Rights © LEGEND Co. 2010
GSM System Survey Revision
• For P-GSM (GSM 900)
– UL Band 890MHz 915MHz, DL Band 935MHz 960MHz
– Each Band is 25 MHz
– Guard Band between DL and UL is 20 MHz
– Duplex Distance = 45 MHz
– Carrier separation = 200 KHz
– No. of frequencies = 124
GSM 900 Frequency Allocation
F (MHz)915890
Uplink1 2 3 4 121 122 123 124
F (MHz)
Downlink
960935
1 2 3 4 121 122 123 124
890.2
890.4
890.6
935.2
935.4
935.6
200 KHz
1
1
121
121
Downlink 935 – 960 MHz
Uplink 890 – 915 MHz
Copy Rights © LEGEND Co. 2010
GSM System Survey Revision
• For the all GSM Bands
System P-GSM 900 E-GSM 900GSM(DCS)
1800
GSM(PCS)
1900
Uplink (MS BS)
Downlink(BS MS)890 – 915 MHz
935 – 960 MHz
880 – 915 MHz
925 - 960 MHz
1710 – 1785 MHz
1805 - 1880 MHz
1850 – 1910 MHz
1930 - 1990 MHz
Wavelength 33 cm 33 cm 17 cm 16 cm
Bandwidth 25 MHz 35 MHz 75 MHz 60 MHz
Duplex distance 45 MHz 45 MHz 95 MHz 80 MHz
Carrier separation 200 kHz 200 kHz 200 kHz 200 kHz
No. of carriers 124 174 374 299
Channel rate 270.8 kbps 270.8 kbps 270.8 kbps 270.8 kbps
11/08/2014
8
Copy Rights © LEGEND Co. 2010
GSM System Survey Revision
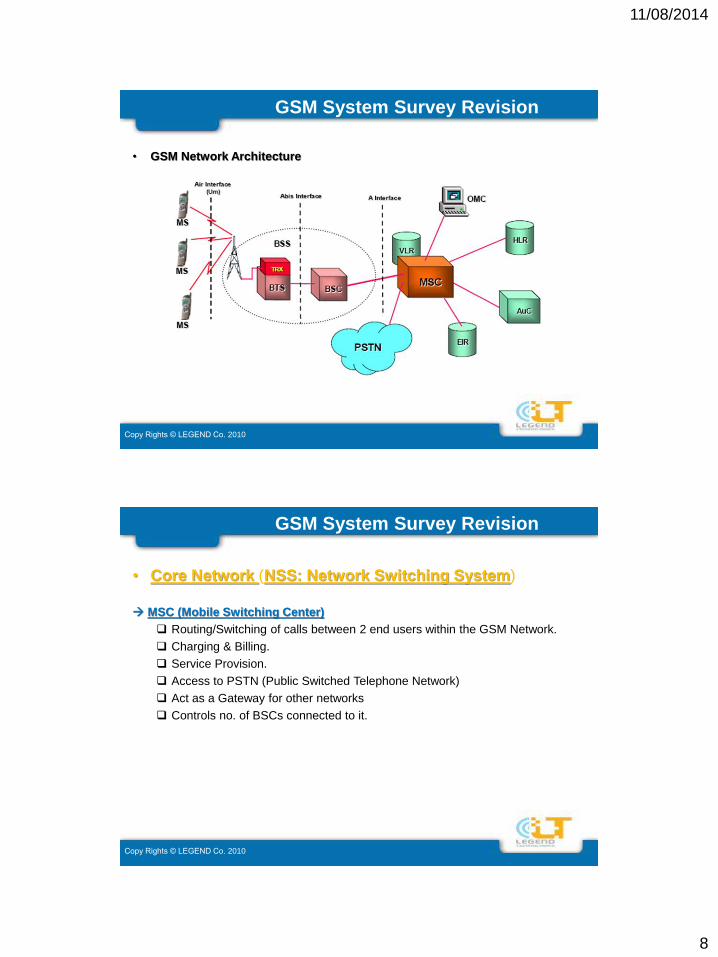
• GSM Network Architecture
Copy Rights © LEGEND Co. 2010
GSM System Survey Revision
• Core Network (NSS: Network Switching System)
MSC (Mobile Switching Center)
Routing/Switching of calls between 2 end users within the GSM Network.
Charging & Billing.
Service Provision.
Access to PSTN (Public Switched Telephone Network)
Act as a Gateway for other networks
Controls no. of BSCs connected to it.
11/08/2014
9
Copy Rights © LEGEND Co. 2010
GSM System Survey Revision
HLR (Home Location Register)
Centralized Network data base stores and manages all mobile subscriptions.
Example: IMSI, MSISDN, MSRN, Services subscribed/restricted for that user.
VLR (Visitor Location Register)
It is co-located with the MSC.
Stored in it a copy of the user’s profile on temporary basis.
AUC (Authentication Center)
Provides the HLR with the authentication parameters and ciphering Keys used
by the MSC/VLR to authenticate center user. (Triplets: RAND, SRES, Kc)
EIR (Equipment Identification Register)
Used to authenticate the user equipment through the IMEI.
IMEI = International Mobile Equipment Identification
Copy Rights © LEGEND Co. 2010
GSM System Survey Revision
• BSS (Base Station System) BSC (Base Station Controller)
It controls the air interface, it takes the decisions based on the reports came
from the MS and BTS.
Channel Allocation.
Controls the Handover Process.
Dynamic Power Control.
Frequency Hopping.
BTS (Base Transceiver Station)
It is the Hardware equipment needed to provide the radio coverage.
Speech Coding/Channel Coding/Interleaving/Ciphering/Burst
formatting/Modulation all these are done within the BTS (RBS=Radio Base
Station)
Equipment: Cabinet, jumpers, feeders, combiners, antennas.

11/08/2014
10
Copy Rights © LEGEND Co. 2010
GSM System Survey Revision
• MS (Mobile Station) Mobile Equipment
Transmit the radio waves.
Speech coding and decoding.
Call control.
Performance measurement of radio link.
SIM card (Subscriber Identification Module)
Stores user addresses (IMSI, MSISDN, TMSI).
Stores authentication key Ki, authentication algorithm A3 and ciphering
algorithm A8&A5
Stores the subscribed services.
Copy Rights © LEGEND Co. 2010
GSM System Survey Revision
• Over the Air Interface Frequency Band is divided into no. of frequencies.
Each frequency is divided into 8 Time slots (TS)
Each user will be assigned 1 TS.
One time slot =156.25 bits
1 Bit duration=3.69 µsec
Time slot duration =156.25x3.69 µsec= 0.577 msec
1 Frame = 8 TSs
Frame duration=0.577x8= 4.615 msec
Bit rate on the air interface is 270 Kbps, but for each user it is 33.8 Kbps
11/08/2014
11
Copy Rights © LEGEND Co. 2010
GSM System Survey Revision
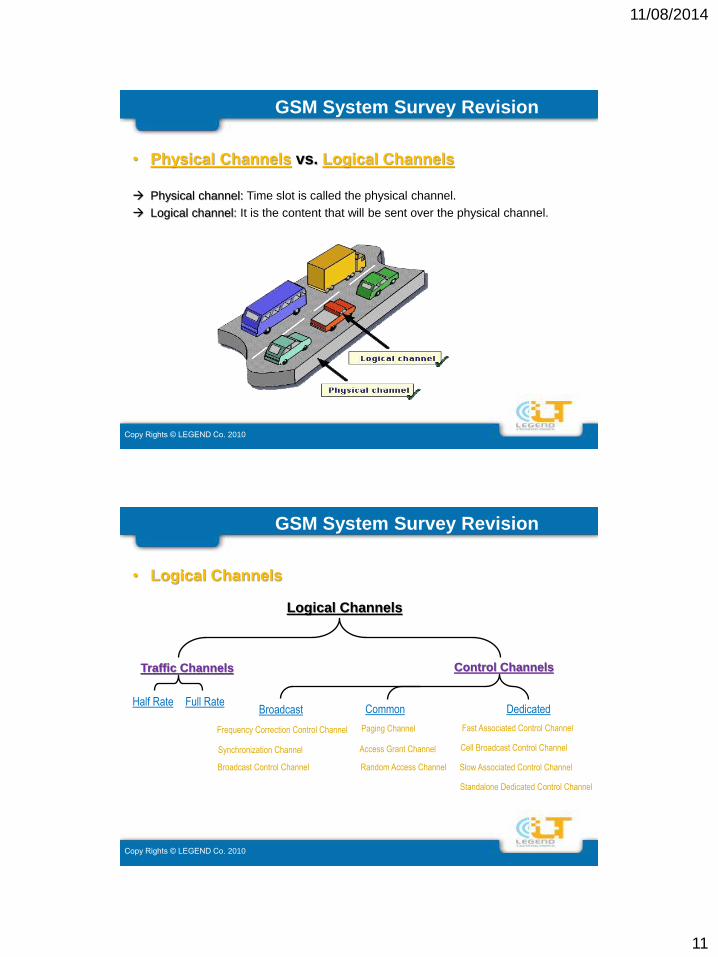
• Physical Channels vs. Logical Channels
Physical channel: Time slot is called the physical channel.
Logical channel: It is the content that will be sent over the physical channel.
Copy Rights © LEGEND Co. 2010
GSM System Survey Revision
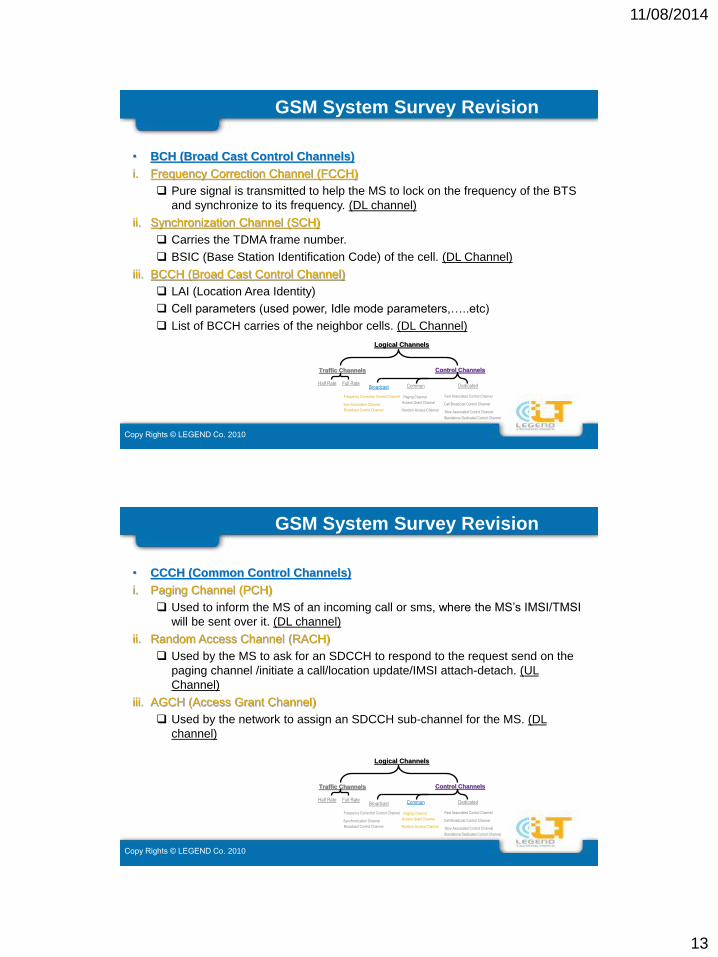
• Logical Channels
Logical Channels
Control ChannelsTraffic Channels
Half Rate Full Rate
Synchronization Channel
Broadcast Control Channel
Frequency Correction Control Channel
Standalone Dedicated Control Channel
Slow Associated Control Channel
Fast Associated Control Channel
Cell Broadcast Control Channel
Broadcast Dedicated
Random Access Channel
Access Grant Channel
Common
Paging Channel

11/08/2014
12
Copy Rights © LEGEND Co. 2010
GSM System Survey Revision
• Traffic Channels
Full Rate Channels (FR)
Carries user’s speech traffic or user data DL and UL.
Each user is assigned 1 TS.
Transmission rate is 13 Kbit/s.
Half Rate Channels (HR)
Carries user’s speech traffic or user data DL and UL.
2 users will share 1 TS (physical channel), each of them will be utilizing it
each frame.
Transmission rate is 6.5 Kbit/s
Logical Channels
Control ChannelsTraffic Channels
Half Rate Full Rate
Synchronization Channel
Broadcast Control Channel
Frequency Correction Control Channel
Standalone Dedicated Control Channel
Slow Associated Control Channel
Fast Associated Control Channel
Cell Broadcast Control Channel
Broadcast Dedicated
Random Access Channel
Access Grant Channel
Common
Paging Channel
Copy Rights © LEGEND Co. 2010
GSM System Survey Revision
• Control Channels
These are used to carry signaling or synchronization data, they’re divided into
three types:
Broad Cast Channels (BCH)
Common Control Channels (CCCH)
Dedicated Control Channels (DCCH)
Logical Channels
Control ChannelsTraffic Channels
Half Rate Full Rate
Synchronization Channel
Broadcast Control Channel
Frequency Correction Control Channel
Standalone Dedicated Control Channel
Slow Associated Control Channel
Fast Associated Control Channel
Cell Broadcast Control Channel
Broadcast Dedicated
Random Access Channel
Access Grant Channel
Common
Paging Channel
11/08/2014
13
Copy Rights © LEGEND Co. 2010
GSM System Survey Revision
• BCH (Broad Cast Control Channels)
i. Frequency Correction Channel (FCCH)
Pure signal is transmitted to help the MS to lock on the frequency of the BTS
and synchronize to its frequency. (DL channel)
ii. Synchronization Channel (SCH)
Carries the TDMA frame number.
BSIC (Base Station Identification Code) of the cell. (DL Channel)
iii. BCCH (Broad Cast Control Channel)
LAI (Location Area Identity)
Cell parameters (used power, Idle mode parameters,…..etc)
List of BCCH carries of the neighbor cells. (DL Channel)
Logical Channels
Control ChannelsTraffic Channels
Half Rate Full Rate
Synchronization Channel
Broadcast Control Channel
Frequency Correction Control Channel
Standalone Dedicated Control Channel
Slow Associated Control Channel
Fast Associated Control Channel
Cell Broadcast Control Channel
Broadcast Dedicated
Random Access Channel
Access Grant Channel
Common
Paging Channel
Copy Rights © LEGEND Co. 2010
GSM System Survey Revision
• CCCH (Common Control Channels)
i. Paging Channel (PCH)
Used to inform the MS of an incoming call or sms, where the MS’s IMSI/TMSI
will be sent over it. (DL channel)
ii. Random Access Channel (RACH)
Used by the MS to ask for an SDCCH to respond to the request send on the
paging channel /initiate a call/location update/IMSI attach-detach. (UL
Channel)
iii. AGCH (Access Grant Channel)
Used by the network to assign an SDCCH sub-channel for the MS. (DL
channel)
Logical Channels
Control ChannelsTraffic Channels
Half Rate Full Rate
Synchronization Channel
Broadcast Control Channel
Frequency Correction Control Channel
Standalone Dedicated Control Channel
Slow Associated Control Channel
Fast Associated Control Channel
Cell Broadcast Control Channel
Broadcast Dedicated
Random Access Channel
Access Grant Channel
Common
Paging Channel

11/08/2014
14
Copy Rights © LEGEND Co. 2010
GSM System Survey Revision
• DCCH (Dedicated Control Channels)
i. Standalone Dedicated Control Channel (SDCCH)
Used for signaling purposes: call setup, location update, IMSI attach-detach.
Used to send/receive SMSs in idle mode. (DL/UL channel).
ii. Slow Associated Control Channel (SACCH)
Always allocated in conjunction with traffic channel/SDCCH channel to
transmit measurement reports.
DL measurement reports will include commands from the network to the MS
to adjust its power level and info about the Time Advance.
UL measurement reports will include information about the MS own power,
received SS & Quality from serving cell and SS from neighbor cells.
Used to send SMSs in active mode
(DL/UL channel).Logical Channels
Control ChannelsTraffic Channels
Half Rate Full Rate
Synchronization Channel
Broadcast Control Channel
Frequency Correction Control Channel
Standalone Dedicated Control Channel
Slow Associated Control Channel
Fast Associated Control Channel
Cell Broadcast Control Channel
Broadcast Dedicated
Random Access Channel
Access Grant Channel
Common
Paging Channel
Copy Rights © LEGEND Co. 2010
GSM System Survey Revision
iii. Fast Associated Control Channel (FACCH)
Used to send necessary Handover information . (DL/UL channel)
iv. Cell Broad Cast Channel (CBCH)
It is sent point to multi point i.e. from the cell to the mobiles attached to it, this
channel may carry information about the traffic, weather reports,…etc. (DL
channel)
Logical Channels
Control ChannelsTraffic Channels
Half Rate Full Rate
Synchronization Channel
Broadcast Control Channel
Frequency Correction Control Channel
Standalone Dedicated Control Channel
Slow Associated Control Channel
Fast Associated Control Channel
Cell Broadcast Control Channel
Broadcast Dedicated
Random Access Channel
Access Grant Channel
Common
Paging Channel
11/08/2014
15
Copy Rights © LEGEND Co. 2010
GSM System Survey Revision
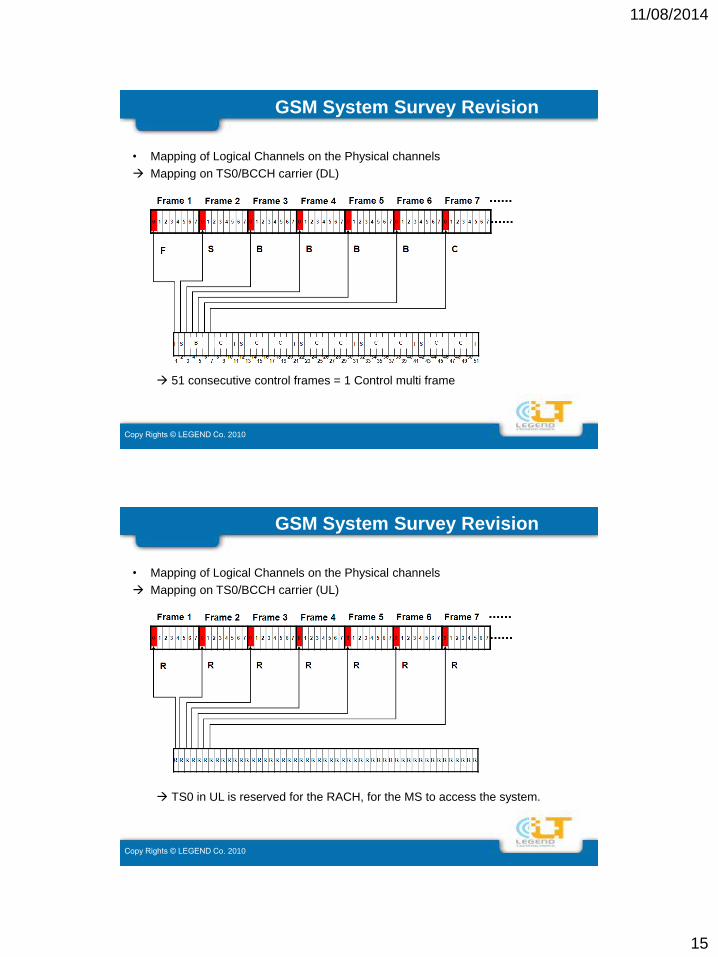
• Mapping of Logical Channels on the Physical channels
Mapping on TS0/BCCH carrier (DL)
51 consecutive control frames = 1 Control multi frame
Copy Rights © LEGEND Co. 2010
GSM System Survey Revision
• Mapping of Logical Channels on the Physical channels
Mapping on TS0/BCCH carrier (UL)
TS0 in UL is reserved for the RACH, for the MS to access the system.
11/08/2014
16
Copy Rights © LEGEND Co. 2010
GSM System Survey Revision
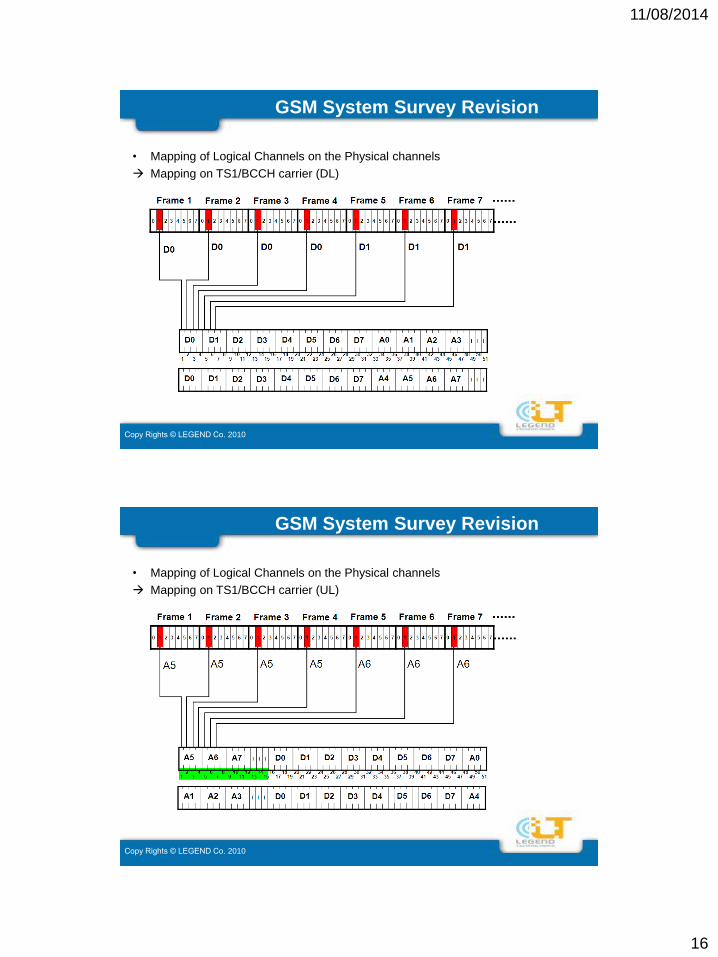
• Mapping of Logical Channels on the Physical channels
Mapping on TS1/BCCH carrier (DL)
Copy Rights © LEGEND Co. 2010
GSM System Survey Revision
• Mapping of Logical Channels on the Physical channels
Mapping on TS1/BCCH carrier (UL)

11/08/2014
17
Copy Rights © LEGEND Co. 2010
GSM System Survey Revision
• Mapping of Logical Channels on the Physical channels
Mapping on TS2/BCCH carrier (DL/UL) if it will be used by certain MS in active
mode
26 consecutive Traffic frames = 1 Traffic multi frame
Copy Rights © LEGEND Co. 2010
GSM System Survey Revision
• TDMA Multi Frames Structure Traffic Multi Frames
Traffic Multi Frame = 26 consecutive traffic frames (4.61msec x 26 =120msec)
Control Multi Frames
Control Multi Frame = 51 consecutive Control frames (4.61msec x 51
=235msec)
Super Frame
51 consecutive Traffic Multi Frames or 26 consecutive Control Multi Frames
Super Frame = 6.12 seconds
Hyper Frame
2048 consecutive super Frames
Hyper Frame = 3 hours and 29 minutes nearly.

11/08/2014
18
Copy Rights © LEGEND Co. 2010
Copy Rights © LEGEND Co. 2010
11/08/2014
19
Copy Rights © LEGEND Co. 2010
Copy Rights © LEGEND Co. 2010
Cell Planning Process
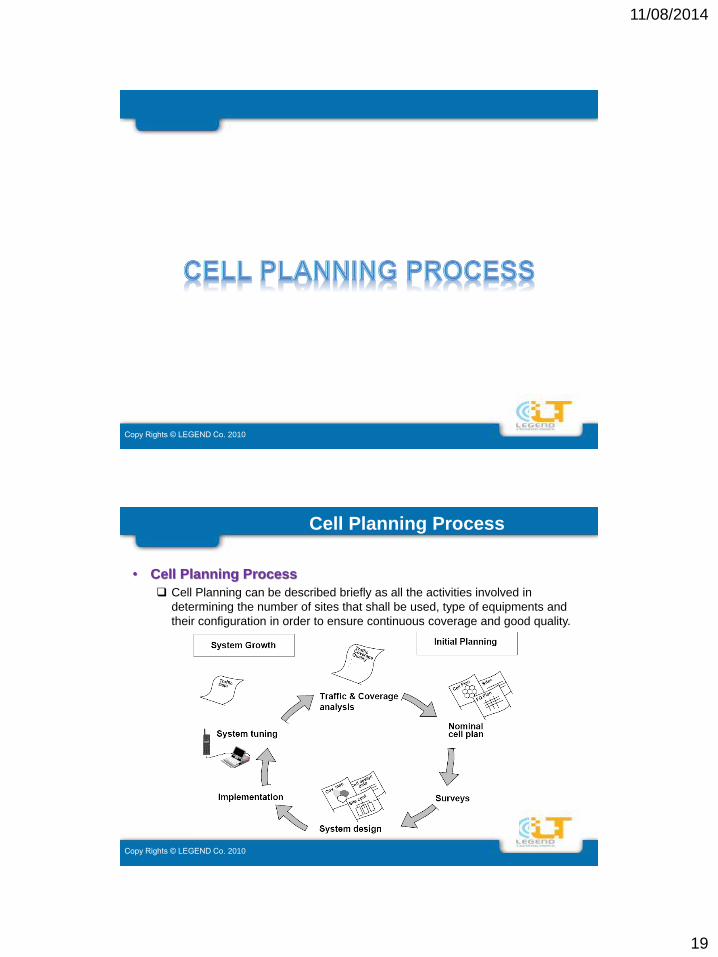
• Cell Planning Process
Cell Planning can be described briefly as all the activities involved in
determining the number of sites that shall be used, type of equipments and
their configuration in order to ensure continuous coverage and good quality.
11/08/2014
20
Copy Rights © LEGEND Co. 2010
Cell Planning Process
• Traffic and Coverage Analysis
The cell planning process starts with a traffic and coverage analysis. The
analysis should produce information about the geographical area and the
expected capacity needed.
The types of data collected are:
Cost, Coverage, Traffic demand and its distribution, GoS, Available Frequencies.
The traffic distribution can be estimated based on:
Population distribution, car usage distribution, income level distribution,
Telephone usage.
Copy Rights © LEGEND Co. 2010
Cell Planning Process
• Nominal Cell Plan
After compilation of the data received from the traffic and coverage analysis, a
coverage and capacity dimensioning will be done to produce the nominal cell
plan.
The Nominal Cell Plan is a graphical representation of the network which
simply looks like a cell pattern on a map.
• Sites Surveys
The sites where the radio equipment will be placed are visited, it is necessary
to assess the real environment to determine whether it is a suitable location or
not.
11/08/2014
21
Copy Rights © LEGEND Co. 2010
Cell Planning Process
• System Design
After the surveys from field are performed the design for each site is done
including: Site Structure, Height, Azimuth, Tilts, Types of Cabinets, Antennas
and Feeders.
• Implementation
This includes sites installation, commissioning testing the hardware and drive
testing to ensure that the sites are behaving well.
Copy Rights © LEGEND Co. 2010
Cell Planning Process
• System Tuning
After the system has been installed it is continuously monitored and evaluated
to determine how well it meets the demand. This is called System Tuning and
it involves:
• Checking that the final plan has been successfully implemented.
• Evaluating the customer complaints.
• Checking the network performance and parameters settings.
The system needs constant retuning due to the fact that the traffic and the
number of subscribers continuously increase.
The network may reach the point where it must be expanded so that it can
manage the increasing load and new traffic and now the coverage and traffic
analysis is performed and the cell planning cycle is repeated.

11/08/2014
22
Copy Rights © LEGEND Co. 2010
Copy Rights © LEGEND Co. 2010

11/08/2014
23
Copy Rights © LEGEND Co. 2010
RF Sites and Hardware Equipments
• Site Types and Hardware Equipment
We have many types for RF sites having different structures and design.
The choice of the RF site used will be during the validation phase, where the
planner will be responsible to choose the proper site type and structure based
on his target for coverage.
Copy Rights © LEGEND Co. 2010
RF Sites and Hardware Equipments
• Site Types
Micro Site
Site Types
Street LevelIndoor
Macro Site
COW Green FieldRoof Top
MonopolePolesStup tower Tower

11/08/2014
24
Copy Rights © LEGEND Co. 2010
RF Sites and Hardware Equipments
• Site Types
Macro Sites
– Macro Sites are those which utilize cabinets that generates high power
(~47dBm = 50W) and used to provide outdoor and indoor coverage over
relatively medium and large distances in cities and on roads.
Micro Site
Site Types
Street LevelIndoor
Macro Site
COW Green FieldRoof Top
MonopolePolesStup tower Tower
Copy Rights © LEGEND Co. 2010
RF Sites and Hardware Equipments
• Site Types
Macro Sites
Roof Top Sites: The antennas are placed on the roof of the buildings, used in
urban and dense urban clutters ex: Inside the cities.
Stub Tower Poles
Micro Site
Site Types
Street LevelIndoor
Macro Site
COW Green FieldRoof Top
MonopolePolesStup tower Tower

11/08/2014
25
Copy Rights © LEGEND Co. 2010
RF Sites and Hardware Equipments
• Site Types
Macro Sites
COW Sites: COW stands for a “ Cell On Wheel”, these are temporary sites
used in events to maximize the capacity ex: exhibitions/Stadiums.
Micro Site
Site Types
Street LevelIndoor
Macro Site
COW Green FieldRoof Top
MonopolePolesStuptower Tower
Copy Rights © LEGEND Co. 2010
RF Sites and Hardware Equipments
• Site Types
Macro Sites
Green Field Sites: These sites are standalone sites used mainly on roads
and high ways to provide coverage for long distances.
Green Field Tower Monopole Palm Trees
Micro Site
Site Types
Street LevelIndoor
Macro Site
COW Green FieldRoof Top
MonopolePolesStuptower Tower
11/08/2014
26
Copy Rights © LEGEND Co. 2010
RF Sites and Hardware Equipments
• Site Types
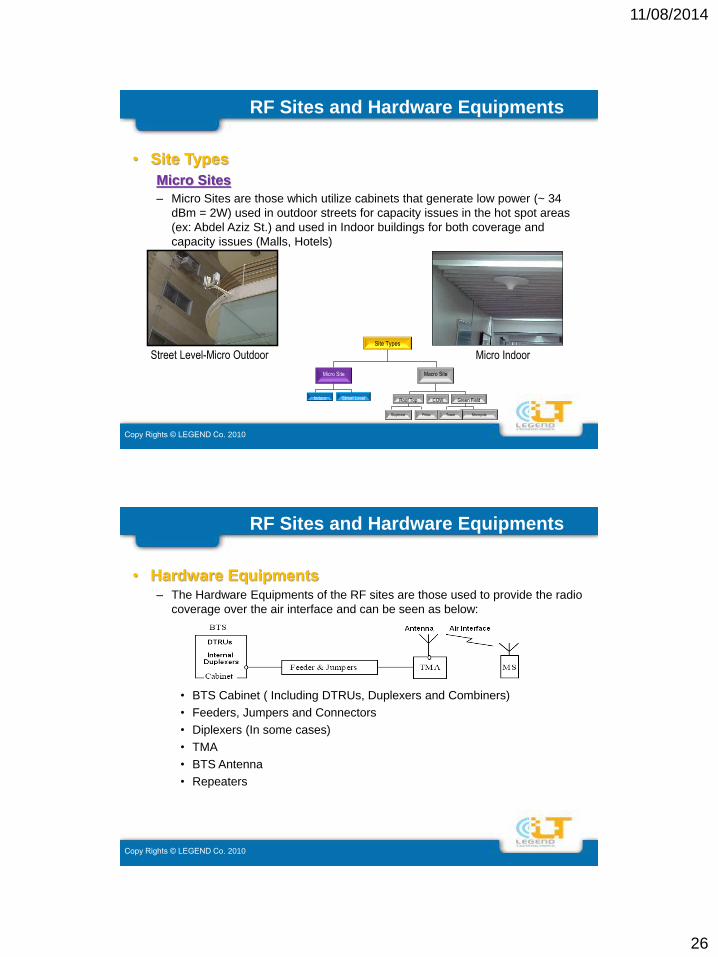
Micro Sites
– Micro Sites are those which utilize cabinets that generate low power (~ 34
dBm = 2W) used in outdoor streets for capacity issues in the hot spot areas
(ex: Abdel Aziz St.) and used in Indoor buildings for both coverage and
capacity issues (Malls, Hotels)
Street Level-Micro Outdoor Micro Indoor
Micro Site
Site Types
Street LevelIndoor
Macro Site
COW Green FieldRoof Top
MonopolePolesStuptower Tower
Copy Rights © LEGEND Co. 2010
RF Sites and Hardware Equipments
• Hardware Equipments– The Hardware Equipments of the RF sites are those used to provide the radio
coverage over the air interface and can be seen as below:
• BTS Cabinet ( Including DTRUs, Duplexers and Combiners)
• Feeders, Jumpers and Connectors
• Diplexers (In some cases)
• TMA
• BTS Antenna
• Repeaters

11/08/2014
27
Copy Rights © LEGEND Co. 2010
RF Sites and Hardware Equipments
• Hardware Equipments
BTS (Cabinet)
“Outdoor Cabinet”
– This type of cabinets is used with Macro sites, it has built-in air conditions, it
doesn’t need shelters and able to resist the different environmental conditions.
Typical Macro Outdoor CabinetFrequency Band P-GSM 900, E-GSM 900, GSM 1800
Tx 935-960MHz, 925-960MHz, 1805-1880MHz
Rx 890-915MHz, 880-915MHz, 1710-1785MHz
Number of Transceivers 12
Dimension (WxDxH) 650x888x1380 mm
Weight 270 Kg
Output Power
Combined, Uncombined)
900MHz: 42.5/46 dBm
1800MHz: 42.0/45.5 dBm
Receiver Sensitivity −110.5 dBmCabinet
DW
H
Copy Rights © LEGEND Co. 2010
RF Sites and Hardware Equipments
• Hardware Equipments
BTS (Cabinet)
“Indoor Cabinet”
− This type of cabinets is used with Macro sites,
external air conditions should be used,
it needs a shelter to prevent the equipment from
the different environmental conditions (rain, heat,…)
Typical Macro Indoor CabinetFrequency Band P-GSM 900, E-GSM 900, GSM 1800
Tx 935-960MHz, 925-960MHz, 1805-1880MHz
Rx 890-915MHz, 880-915MHz, 1710-1785MHz
Number of Transceivers 12
Dimension (WxDxH) 600x400x900 mm
Weight 150 Kg
Output Power
Combined, Uncombined)
900MHz: 42.5/46 dBm
1800MHz: 42.0/45.5 dBm
Receiver Sensitivity −110 .5dBm
Shelter
Cabinet

11/08/2014
28
Copy Rights © LEGEND Co. 2010
RF Sites and Hardware Equipments
• Hardware Equipments
BTS (Cabinet)
− This type of cabinets is used with Micro sites.
Typical Micro CabinetFrequency Band P-GSM 900, E-GSM 900, GSM 1800
Tx 935-960MHz, 925-960MHz, 1805-1880MHz
Rx 890-915MHz, 880-915MHz, 1710-1785MHz
Number of Transceivers 4
Dimension (WxDxH) 433x270x610 mm
Weight 41 Kg
Output Power
Combined, Uncombined)
900MHz: 34/32 dBm
1800MHz: 33.5/31.5 dBm
Receiver Sensitivity −109 dBm
Copy Rights © LEGEND Co. 2010
RF Sites and Hardware Equipments
• Hardware Equipments
Duplexer
− Duplexers are devices make us able to transmit and receive on the same
cable.
− External Duplexers have typical losses = 0.5 dBs
− DTRUs have internal Duplexers that have nearly zero losses.
11/08/2014
29
Copy Rights © LEGEND Co. 2010
RF Sites and Hardware Equipments
• Hardware Equipments
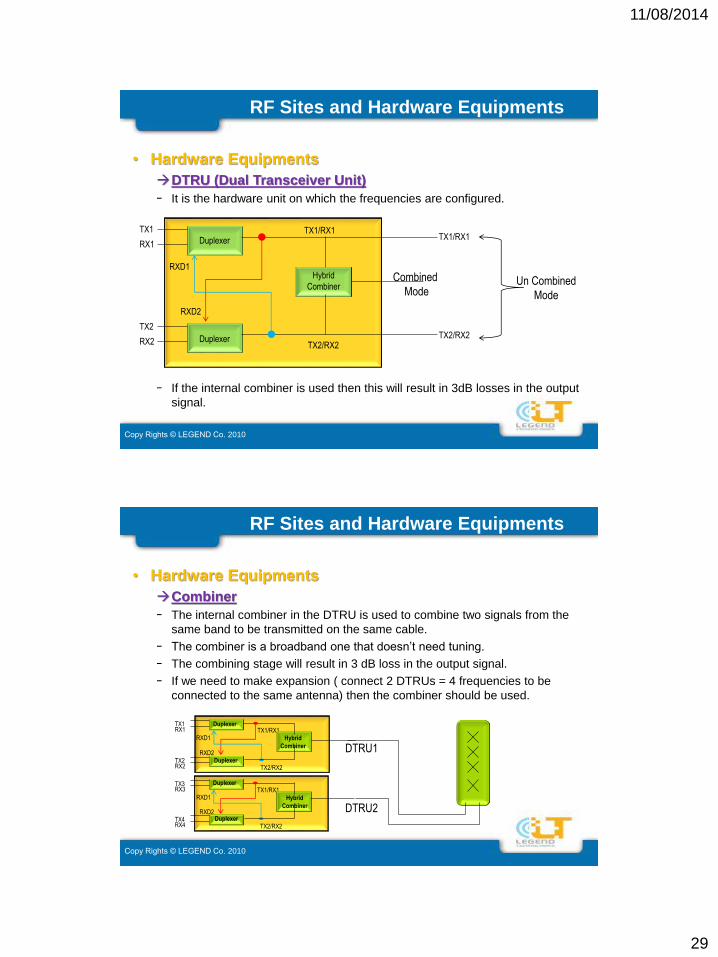
DTRU (Dual Transceiver Unit)
− It is the hardware unit on which the frequencies are configured.
− If the internal combiner is used then this will result in 3dB losses in the output
signal.
Duplexer
TX1
RX1
TX1/RX1
RXD1
RXD2
TX2
RX2 TX2/RX2
Hybrid
Combiner Combined
Mode
TX1/RX1
TX2/RX2
Un Combined
Mode
Duplexer
Copy Rights © LEGEND Co. 2010
RF Sites and Hardware Equipments
• Hardware Equipments
Combiner
− The internal combiner in the DTRU is used to combine two signals from the
same band to be transmitted on the same cable.
− The combiner is a broadband one that doesn’t need tuning.
− The combining stage will result in 3 dB loss in the output signal.
− If we need to make expansion ( connect 2 DTRUs = 4 frequencies to be
connected to the same antenna) then the combiner should be used.
DuplexerTX3RX3 TX1/RX1
RXD1
RXD2TX4RX4 TX2/RX2
Duplexer
DuplexerTX1RX1 TX1/RX1
RXD1
RXD2TX2RX2 TX2/RX2
DTRU1
DTRU2
Duplexer
Hybrid
Combiner
Hybrid
Combiner
11/08/2014
30
Copy Rights © LEGEND Co. 2010
RF Sites and Hardware Equipments
• Hardware Equipments
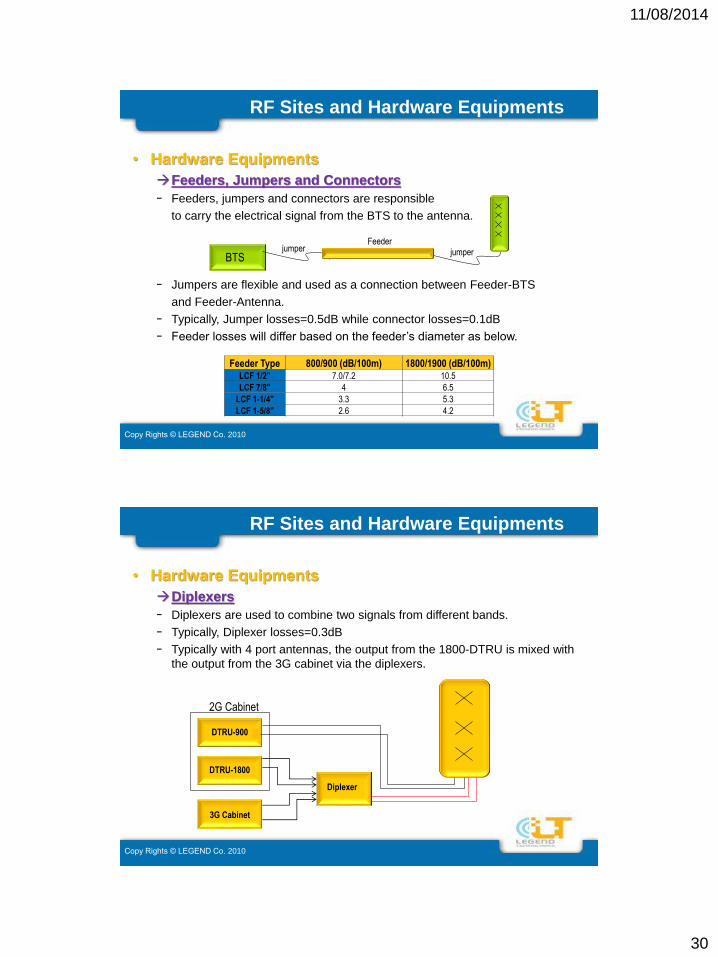
Feeders, Jumpers and Connectors
− Feeders, jumpers and connectors are responsible
to carry the electrical signal from the BTS to the antenna.
− Jumpers are flexible and used as a connection between Feeder-BTS
and Feeder-Antenna.
− Typically, Jumper losses=0.5dB while connector losses=0.1dB
− Feeder losses will differ based on the feeder’s diameter as below.
BTSjumper jumper
Feeder
Feeder Type 800/900 (dB/100m) 1800/1900 (dB/100m)LCF 1/2" 7.0/7.2 10.5
LCF 7/8" 4 6.5
LCF 1-1/4" 3.3 5.3
LCF 1-5/8" 2.6 4.2
Copy Rights © LEGEND Co. 2010
RF Sites and Hardware Equipments
• Hardware Equipments
Diplexers
− Diplexers are used to combine two signals from different bands.
− Typically, Diplexer losses=0.3dB
− Typically with 4 port antennas, the output from the 1800-DTRU is mixed with
the output from the 3G cabinet via the diplexers.
3G Cabinet
DTRU-900
DTRU-1800
2G Cabinet
Diplexer
11/08/2014
31
Copy Rights © LEGEND Co. 2010
RF Sites and Hardware Equipments
• Hardware Equipments
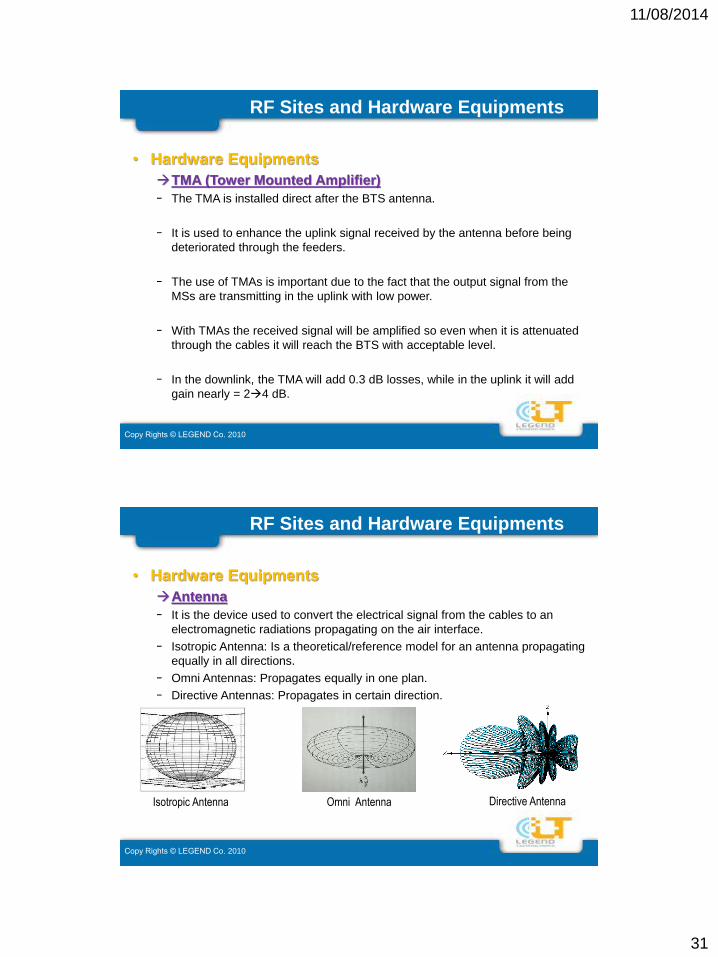
TMA (Tower Mounted Amplifier)
− The TMA is installed direct after the BTS antenna.
− It is used to enhance the uplink signal received by the antenna before being
deteriorated through the feeders.
− The use of TMAs is important due to the fact that the output signal from the
MSs are transmitting in the uplink with low power.
− With TMAs the received signal will be amplified so even when it is attenuated
through the cables it will reach the BTS with acceptable level.
− In the downlink, the TMA will add 0.3 dB losses, while in the uplink it will add
gain nearly = 24 dB.
Copy Rights © LEGEND Co. 2010
RF Sites and Hardware Equipments
• Hardware Equipments
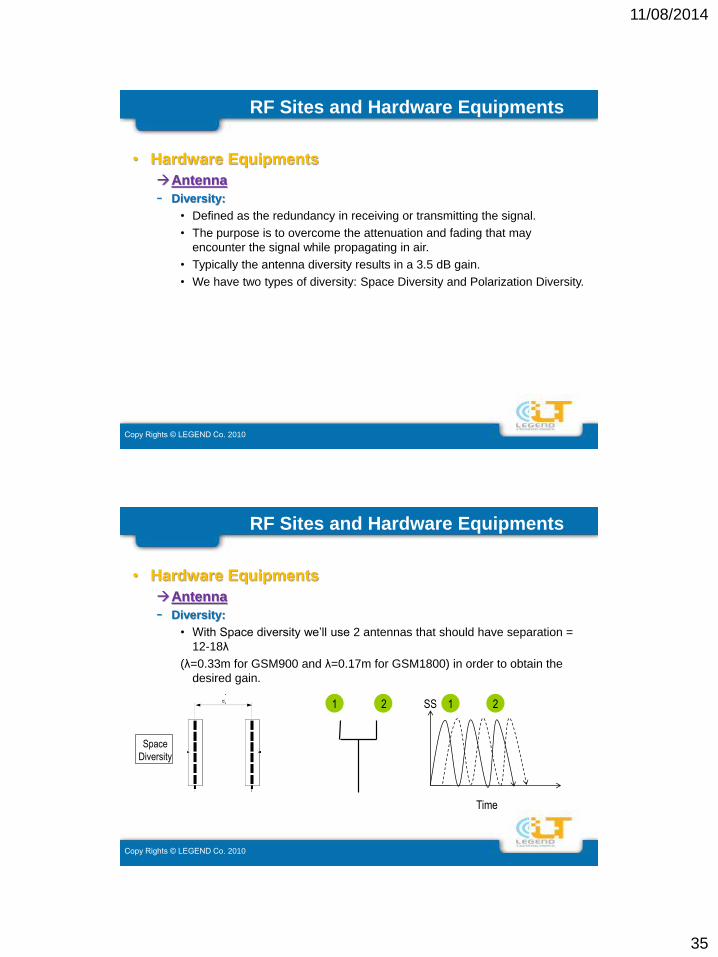
Antenna
− It is the device used to convert the electrical signal from the cables to an
electromagnetic radiations propagating on the air interface.
− Isotropic Antenna: Is a theoretical/reference model for an antenna propagating
equally in all directions.
− Omni Antennas: Propagates equally in one plan.
− Directive Antennas: Propagates in certain direction.
Isotropic Antenna Omni Antenna Directive Antenna

11/08/2014
32
Copy Rights © LEGEND Co. 2010
RF Sites and Hardware Equipments
• Hardware Equipments
Antenna
− Antenna Gain:
• Since Antennas are passive elements, then the only way to have gain in
any direction is to increase the directivity by concentrating the radiations
in the desired direction.
• Now the Antenna gain can be defined as the ratio between the power of
the max direction of the antenna to the power obtained by an isotropic
antenna in the same direction.
• Gain for Typical directive antennas = 18 dBi and for Omni antennas = 11
dBi
Copy Rights © LEGEND Co. 2010
RF Sites and Hardware Equipments
• Hardware Equipments
Antenna
− Beam Width:
• Defined as the angel between the max direction to the direction where the
power is reduced to the half in the max direction.
Horizontal Beam
width =65
3dB
Direction of
the max
power

11/08/2014
33
Copy Rights © LEGEND Co. 2010
RF Sites and Hardware Equipments
• Hardware Equipments
Antenna
− Beam Width:
• The standard antenna has a horizontal beam width of 65deg, this means
that the gain at 32.5deg is 3 dB less than the maximum gain ( i.e. half the
power)
• Typically the vertical beam width is 7 degrees.
Copy Rights © LEGEND Co. 2010
RF Sites and Hardware Equipments
• Hardware Equipments
Antenna
− Tilting:
• Normally when the antenna is correctly mounted, then the vertical beam
of the antenna is pointing towards the horizon.
• Lowering the beam below the horizon is known as “Down tilt”, and when
the beam is directed above the horizon then it is called “Up tilt”

11/08/2014
34
Copy Rights © LEGEND Co. 2010
RF Sites and Hardware Equipments
• Hardware Equipments
Antenna
− Tilting:
• According to how the tilt is implemented; we have two types: Mechanical
tilting and Electrical tilting.
• Mechanical tilting: the physical body of the antenna is tilted, which cause
tilting in the main beam.
• Electrical titling: we change the phase of the current fed the internal
dipoles which will result in tilting the main beam.
Copy Rights © LEGEND Co. 2010
RF Sites and Hardware Equipments
• Hardware Equipments
Antenna
− Tilting:
• With mechanical down tilting the main beam will be down tilted which is
useful but this will result in up tilting the back lobe which may interfere on
another cells.
• With antennas support mechanical tilting only, we won’t be able to have
different tilting for different bands if needed.
11/08/2014
35
Copy Rights © LEGEND Co. 2010
RF Sites and Hardware Equipments
• Hardware Equipments
Antenna
− Diversity:
• Defined as the redundancy in receiving or transmitting the signal.
• The purpose is to overcome the attenuation and fading that may
encounter the signal while propagating in air.
• Typically the antenna diversity results in a 3.5 dB gain.
• We have two types of diversity: Space Diversity and Polarization Diversity.
Copy Rights © LEGEND Co. 2010
RF Sites and Hardware Equipments
• Hardware Equipments
Antenna
− Diversity:
• With Space diversity we’ll use 2 antennas that should have separation =
12-18λ
(λ=0.33m for GSM900 and λ=0.17m for GSM1800) in order to obtain the
desired gain.
Space
Diversity
SS
Time
1 2 1 2

11/08/2014
36
Copy Rights © LEGEND Co. 2010
RF Sites and Hardware Equipments
• Hardware Equipments
Antenna
− Diversity:
• With Polarization diversity, the antenna will be manufactured with internal
arrays have dual polarizations, either Horizontal & Vertical or +45/-45
Dual Polarized
Antenna
Copy Rights © LEGEND Co. 2010
RF Sites and Hardware Equipments
• Hardware Equipments
Antenna
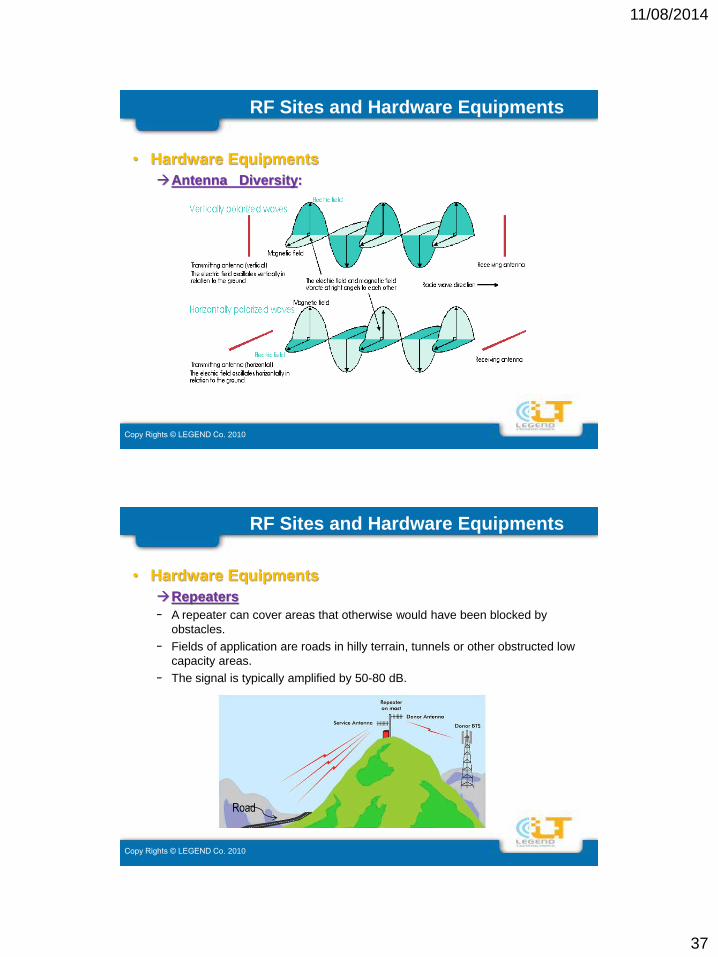
− Diversity:
• The polarization is the direction of oscillation of the electric field with
respect to ground.
• Vertically polarized antennas: Transmit electromagnetic waves where the
electric field component oscillate in direction perpendicular to the ground.
• Horizontal polarized antennas: Transmit electromagnetic waves where the
electric field component oscillate in direction parallel to the ground.
11/08/2014
37
Copy Rights © LEGEND Co. 2010
RF Sites and Hardware Equipments
• Hardware Equipments
Antenna Diversity:
Copy Rights © LEGEND Co. 2010
RF Sites and Hardware Equipments
• Hardware Equipments
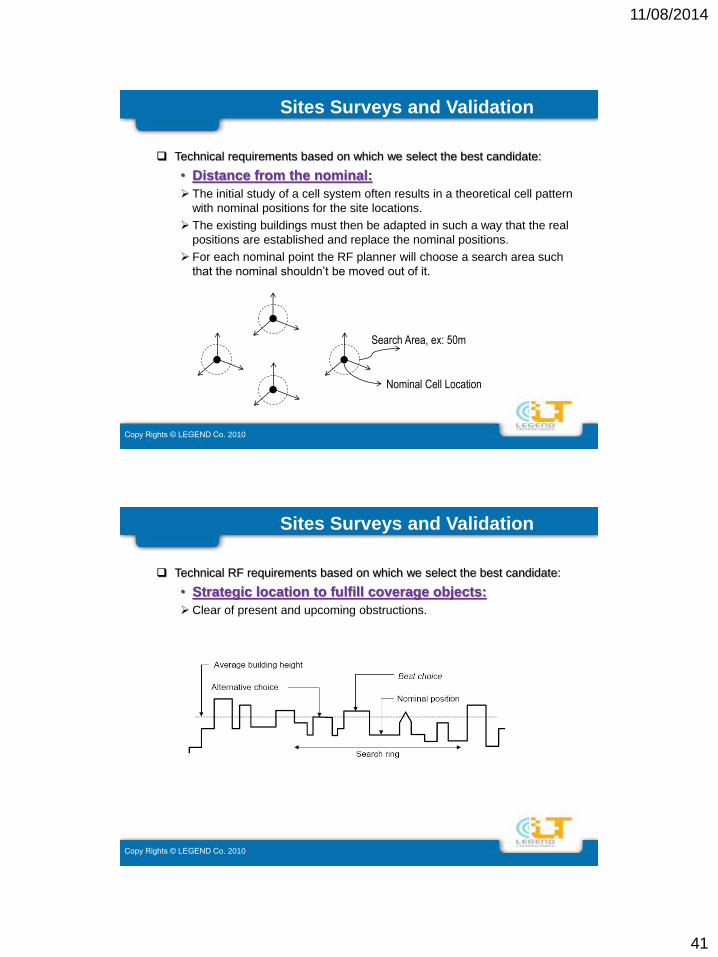
Repeaters
− A repeater can cover areas that otherwise would have been blocked by
obstacles.
− Fields of application are roads in hilly terrain, tunnels or other obstructed low
capacity areas.
− The signal is typically amplified by 50-80 dB.
Road

11/08/2014
38
Copy Rights © LEGEND Co. 2010
RF Sites and Hardware Equipments
• Hardware Equipments
Repeaters
− Repeaters can also been used for indoor applications, like offices and
undergrounds.
Copy Rights © LEGEND Co. 2010

11/08/2014
39
Copy Rights © LEGEND Co. 2010
Copy Rights © LEGEND Co. 2010
Sites Surveys and Validation
The cell planning process results in a cell plan with nominal site positions.
If the operator has access to existing locations (ex: deal with TE, Police,..etc)
then it is necessary to adapt the cell plan according to these locations.
The proposed network design shows only approximate site locations but the
exact site position depends on the possibilities of constructing a site on the
suggested location.

11/08/2014
40
Copy Rights © LEGEND Co. 2010
Sites Surveys and Validation
Non technical issues may contribute in preferring one location than the other
provided that both of them verify the radio requirements:
Obtaining the permits from the different authorities like civil aviation and
military authorities.
Lease contract should be agreed upon with the owner of the site.
Access roads: the site must be accessible for material transport and
installation.
Space requirements for the shelter and passes for the feeders.
Space to construct the antenna supports.
AC power Source.
Copy Rights © LEGEND Co. 2010
Sites Surveys and Validation
Technical RF requirements based on which we select the best candidate:
Distance from the nominal.
Strategic location to fulfill coverage objects.
11/08/2014
41
Copy Rights © LEGEND Co. 2010
Sites Surveys and Validation
Technical requirements based on which we select the best candidate:
• Distance from the nominal:
The initial study of a cell system often results in a theoretical cell pattern
with nominal positions for the site locations.
The existing buildings must then be adapted in such a way that the real
positions are established and replace the nominal positions.
For each nominal point the RF planner will choose a search area such
that the nominal shouldn’t be moved out of it.
Search Area, ex: 50m
Nominal Cell Location
Copy Rights © LEGEND Co. 2010
Sites Surveys and Validation
Technical RF requirements based on which we select the best candidate:
• Strategic location to fulfill coverage objects:
Clear of present and upcoming obstructions.
11/08/2014
42
Copy Rights © LEGEND Co. 2010
Sites Surveys and Validation
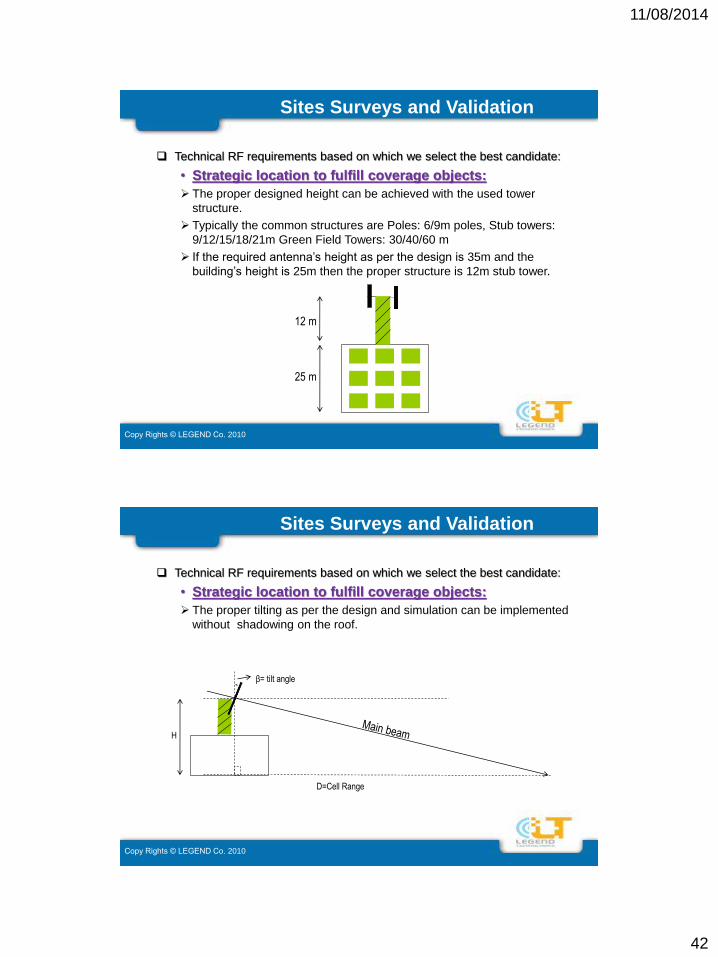
Technical RF requirements based on which we select the best candidate:
• Strategic location to fulfill coverage objects:
The proper designed height can be achieved with the used tower
structure.
Typically the common structures are Poles: 6/9m poles, Stub towers:
9/12/15/18/21m Green Field Towers: 30/40/60 m
If the required antenna’s height as per the design is 35m and the
building’s height is 25m then the proper structure is 12m stub tower.
12 m
25 m
Copy Rights © LEGEND Co. 2010
Sites Surveys and Validation
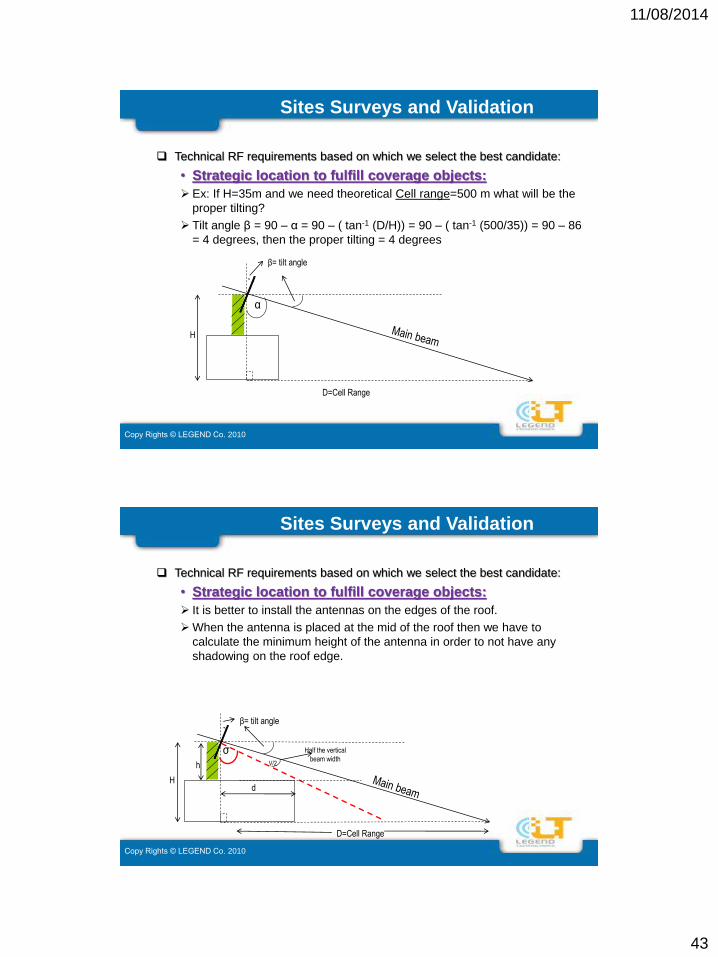
Technical RF requirements based on which we select the best candidate:
• Strategic location to fulfill coverage objects:
The proper tilting as per the design and simulation can be implemented
without shadowing on the roof.
D=Cell Range
H
β= tilt angle
11/08/2014
43
Copy Rights © LEGEND Co. 2010
Sites Surveys and Validation
Technical RF requirements based on which we select the best candidate:
• Strategic location to fulfill coverage objects:
Ex: If H=35m and we need theoretical Cell range=500 m what will be the
proper tilting?
Tilt angle β = 90 – α = 90 – ( tan-1 (D/H)) = 90 – ( tan-1 (500/35)) = 90 – 86
= 4 degrees, then the proper tilting = 4 degrees
D=Cell Range
H
β= tilt angle
α
Copy Rights © LEGEND Co. 2010
Sites Surveys and Validation
Technical RF requirements based on which we select the best candidate:
• Strategic location to fulfill coverage objects:
It is better to install the antennas on the edges of the roof.
When the antenna is placed at the mid of the roof then we have to
calculate the minimum height of the antenna in order to not have any
shadowing on the roof edge.
D=Cell Range
H
β= tilt angle
σV/2h
d
Half the vertical
beam width

11/08/2014
44
Copy Rights © LEGEND Co. 2010
Sites Surveys and Validation
Technical RF requirements based on which we select the best candidate:
• Strategic location to fulfill coverage objects:
If the distance to the roof d = 50m and we’re going to apply tilt = 4
degrees, then we want to calculate the minimum tower height to not have
shadowing on the roof.
σ=90 - (β +V/2) = 90 – (4+3.5) = 90 - 7.5 = 82.5 degrees
Tan σ = ( d/h), then Tan (82.5) = (50/h) = 7.5
then h = 50/7.5 = 6.7meters (min. tower height to not have shadowing with 4
deg down tilt)
D=Cell Range
H
β= tilt angle
σV/2h
d
Half the vertical
beam width
Copy Rights © LEGEND Co. 2010
Sites Surveys and Validation
Some Planning Tips The First Fresnel zone: The area around the visual line-of-sight that radio
waves spread out into after they leave the antenna. This area must be
clear or else signal strength will weaken.
Double Structure sites.
Roads coverage.
Obstacles like Bill Boards.
Terrain difference.
Sites near water.
Tunnels coverage.

11/08/2014
45
Copy Rights © LEGEND Co. 2010
Copy Rights © LEGEND Co. 2010
11/08/2014
46
Copy Rights © LEGEND Co. 2010
Copy Rights © LEGEND Co. 2010
Coverage Dimensioning
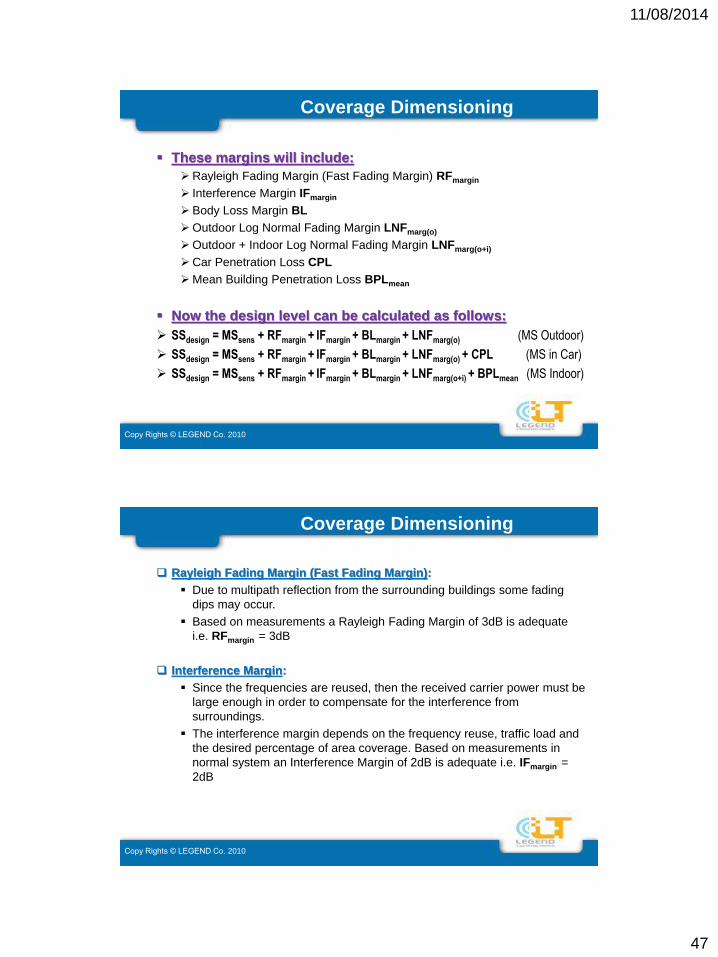
The sensitivity of the BTS and MS is defined as the minimum required
received input level in order to decode the signal correctly.
However, when planning a system it is not sufficient to use this sensitivity level
as a planning criterion.
Various margins must be added to compensate for the degradation in the
signal level during its propagation in air.
11/08/2014
47
Copy Rights © LEGEND Co. 2010
Coverage Dimensioning
These margins will include:
Rayleigh Fading Margin (Fast Fading Margin) RFmargin
Interference Margin IFmargin
Body Loss Margin BL
Outdoor Log Normal Fading Margin LNFmarg(o)
Outdoor + Indoor Log Normal Fading Margin LNFmarg(o+i)
Car Penetration Loss CPL
Mean Building Penetration Loss BPLmean
Now the design level can be calculated as follows:
SSdesign = MSsens + RFmargin + IFmargin + BLmargin + LNFmarg(o) (MS Outdoor)
SSdesign = MSsens + RFmargin + IFmargin + BLmargin + LNFmarg(o) + CPL (MS in Car)
SSdesign = MSsens + RFmargin + IFmargin + BLmargin + LNFmarg(o+i) + BPLmean (MS Indoor)
Copy Rights © LEGEND Co. 2010
Coverage Dimensioning
Rayleigh Fading Margin (Fast Fading Margin):
Due to multipath reflection from the surrounding buildings some fading
dips may occur.
Based on measurements a Rayleigh Fading Margin of 3dB is adequate
i.e. RFmargin = 3dB
Interference Margin:
Since the frequencies are reused, then the received carrier power must be
large enough in order to compensate for the interference from
surroundings.
The interference margin depends on the frequency reuse, traffic load and
the desired percentage of area coverage. Based on measurements in
normal system an Interference Margin of 2dB is adequate i.e. IFmargin =
2dB
11/08/2014
48
Copy Rights © LEGEND Co. 2010
Coverage Dimensioning
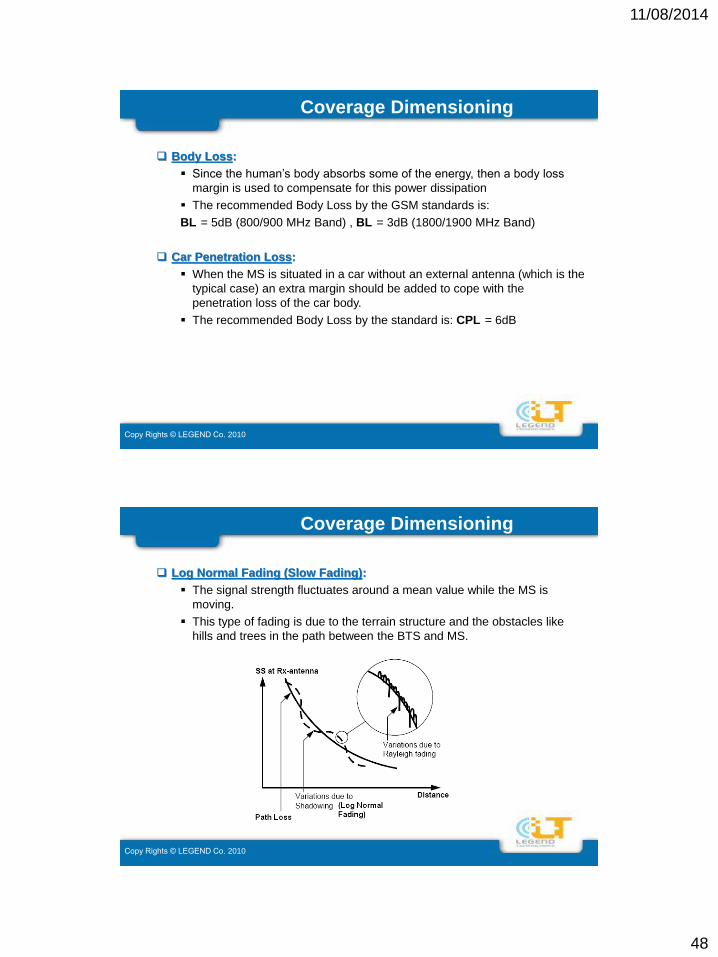
Body Loss:
Since the human’s body absorbs some of the energy, then a body loss
margin is used to compensate for this power dissipation
The recommended Body Loss by the GSM standards is:
BL = 5dB (800/900 MHz Band) , BL = 3dB (1800/1900 MHz Band)
Car Penetration Loss:
When the MS is situated in a car without an external antenna (which is the
typical case) an extra margin should be added to cope with the
penetration loss of the car body.
The recommended Body Loss by the standard is: CPL = 6dB
Copy Rights © LEGEND Co. 2010
Coverage Dimensioning
Log Normal Fading (Slow Fading):
The signal strength fluctuates around a mean value while the MS is
moving.
This type of fading is due to the terrain structure and the obstacles like
hills and trees in the path between the BTS and MS.

11/08/2014
49
Copy Rights © LEGEND Co. 2010
Coverage Dimensioning
Log Normal Fading (Slow Fading):
The log normal fading LNFmarg will differ based on the environment and
the coverage area.
LNFmarg will be calculated from a graph relates environment (Standard
Deviation:σLNF ) with the coverage percentage needed.
N.B: (σLNF marg(o+i) )2 = (σLNF marg(o))
2 +(σLNF marg(i) ) 2
These values were
obtained from field
measurements
Copy Rights © LEGEND Co. 2010
Coverage Dimensioning
Log Normal Fading (Slow Fading):
• LNFmarg will be calculated from a graph relates environment (σLNF ) with
the coverage.
Example:
For an Urban area Outdoor,
then σLNF =8 dB and with
98% coverage, then we can get
from the graph LNFmarg(o) = 8 dB
σLNF
11/08/2014
50
Copy Rights © LEGEND Co. 2010
Coverage Dimensioning
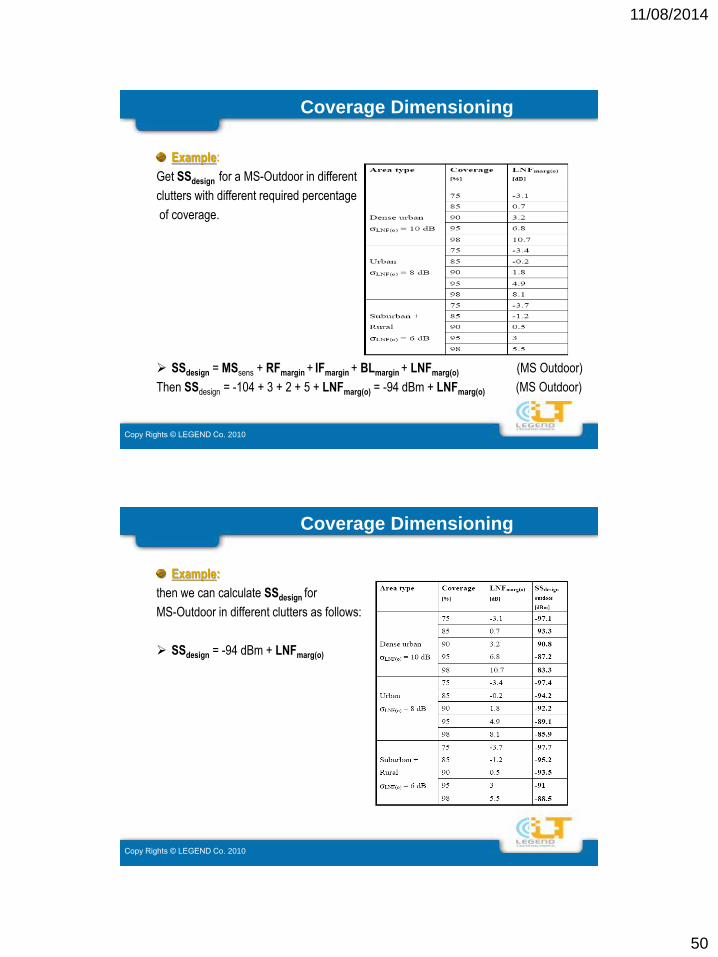
Example:
Get SSdesign for a MS-Outdoor in different
clutters with different required percentage
of coverage.
SSdesign = MSsens + RFmargin + IFmargin + BLmargin + LNFmarg(o) (MS Outdoor)
Then SSdesign = -104 + 3 + 2 + 5 + LNFmarg(o) = -94 dBm + LNFmarg(o) (MS Outdoor)
Copy Rights © LEGEND Co. 2010
Coverage Dimensioning
Example:
then we can calculate SSdesign for
MS-Outdoor in different clutters as follows:
SSdesign = -94 dBm + LNFmarg(o)

11/08/2014
51
Copy Rights © LEGEND Co. 2010
Coverage Dimensioning
Example:
Get SSdesign for a MS-In Car in different
clutters with different required percentage
of coverage.
SSdesign = MSsens + RFmargin + IFmargin + BLmargin + CPL+ LNFmarg(o) (MS in Car)
Then SSdesign = -104 + 3 + 2 + 5+ 6 + LNFmarg(o) = -88 dBm + LNFmarg(o) (MS in Car)
Copy Rights © LEGEND Co. 2010
Coverage Dimensioning
Example:
Get SSdesign for a MS-Indoor in different
clutters with different required percentage
of coverage.
SSdesign = MSsens + RFmargin + IFmargin + BLmargin + BPL+ LNFmarg(o+i) (MS Indoor)
Then SSdesign = -104+3+2+5+BPL+LNFmarg(o+i) = -94 dBm + BPL+ LNFmarg(o+i)

11/08/2014
52
Copy Rights © LEGEND Co. 2010
Coverage Dimensioning
Example:
then we can calculate SSdesign for
MS-Indoor in different clutters as follows:
Then SSdesign= -94 dBm + BPL+ LNFmarg(o+i)
Copy Rights © LEGEND Co. 2010
Coverage Dimensioning
Down Link Budget
• Now, we’re going to calculate the cell radius where the PinMS will be the
SSdesign which was computed previously based on the clutter type and
coverage percentage.
Pout BTS : Output power from the Base Station Cabinet
Lf BTS : Losses in Feeders, Jumpers and connectors
Ga BTS : BTS antenna gain Gd BTS : BTS antenna diversity gain
Lp : Path Loss Pin MS : Input power at the MS Station
Pout BTS PinMS =SSdesign

11/08/2014
53
Copy Rights © LEGEND Co. 2010
Coverage Dimensioning
Down Link Budget
Example:
for Urban clutter with required outdoor coverage= 95% (GSM900-Band) then
Pin MS = SSdesign= -89.1 dBm and given that: Pout BTS = 46 dBm, Lf BTS = 2.6 dB
Ga BTS = 18 dBi Gd BTS = 3.5 dB , then we can calculate the path loss as follows:
Lp = (Pout BTS - Lf BTS + Ga BTS + Gd BTS ) - Pin MS
Lp = 46-2.6+18+3.5-(-89.1)= 154 dB
Then the maximum allowed path loss is Lp is 154 dB and through which we are going to
calculate the cell range “d”
N.B:
d= Cell Range
Inter Site-distance =1.5d
Area ≈ 1.9 d2
d
d
Copy Rights © LEGEND Co. 2010
Coverage Dimensioning
Path Loss Lp
I. Free Space Model:
Theoretical Model not commonly used, it assumed Line Of Sight (LOS)
direct ray between the Transmitter and Receiver.
The Path Loss will be calculated as follows:
Lp = 32.44 + 20 log f (MHz) + 20 log d (Km), where f: frequency and
d:cell range
II. Two Path Model:
Assumes two paths: direct path and a ground reflected path.
It suits the road sites.
Lp = 20 log HBS + 20 log HMS +40 log d (Km) where d:cell range
11/08/2014
54
Copy Rights © LEGEND Co. 2010
Coverage Dimensioning
Path Loss Lp
III.Multi Path Propagation Model:
As stated before, the signal travelling in air will follow different paths
due to reflections from the surroundings where each individual path
affects the signal causing attenuation, delay and phase shift.
The received signals is therefore a result of direct rays, reflected rays
and shadowing or any combination of these signals.
Experimental measurements in different places led to the conclusion
that there is a necessity to make different models for different urban
environments having different civil structures: dense urban, urban,
suburban and rural.
Copy Rights © LEGEND Co. 2010
Coverage Dimensioning
Path Loss Lp
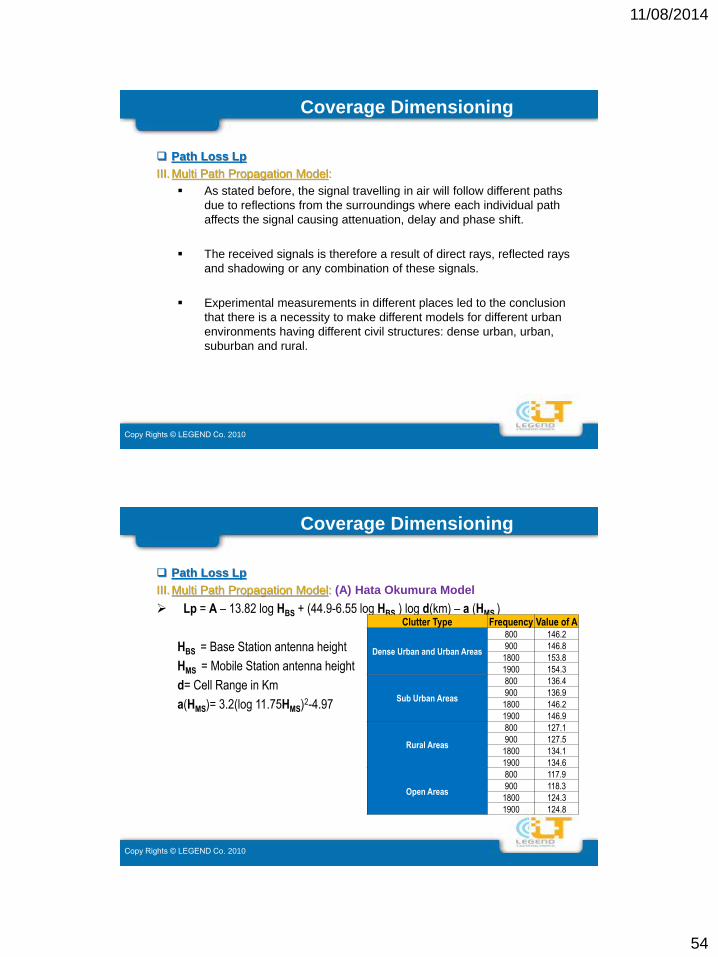
III.Multi Path Propagation Model: (A) Hata Okumura Model
Lp = A – 13.82 log HBS + (44.9-6.55 log HBS ) log d(km) – a (HMS )
HBS = Base Station antenna height
HMS = Mobile Station antenna height
d= Cell Range in Km
a(HMS)= 3.2(log 11.75HMS)2-4.97
Clutter Type Frequency Value of A
Dense Urban and Urban Areas
800 146.2
900 146.8
1800 153.8
1900 154.3
Sub Urban Areas
800 136.4
900 136.9
1800 146.2
1900 146.9
Rural Areas
800 127.1
900 127.5
1800 134.1
1900 134.6
Open Areas
800 117.9
900 118.3
1800 124.3
1900 124.8

11/08/2014
55
Copy Rights © LEGEND Co. 2010
Coverage Dimensioning
Path Loss Lp
III.Multi Path Propagation Model: (A) Hata Okumura Model
In our previous example for Urban clutter ( GSM 900MHz- band),
Lp=154 dB
Assuming HBS=35m and HMS=1.5m
Lp = A – 13.82 log HBS + (44.9-6.55 log HBS ) log d(km) – a (HMS )
Lp = 146.8 – 13.82 log 35 + (44.9-6.55 log 35 ) log d(km) – [ 3.2(log
11.75*1.5)2-4.97]
Lp = 146.8 – 21.34 + 34.786 log d(km) + ( 0.001)
Then log d(km) = 0.76 then d = 6.6 km
Hata Okumura’s mode doesn’t give accurate values with Dense Urban
and Urban areas when the typical cell radius is less than 1 km, so it is
used with rural and open areas only.
Copy Rights © LEGEND Co. 2010
Coverage Dimensioning
Path Loss Lp
III.Multi Path Propagation Model: (B) Walfish-Ikegami Model
Lp = K +38 log d + 18 log (HBS -17)
HBS = Base Station antenna height
d= Cell Range in Km
Concerning our previous example, in Urban clutter (GSM 900-Band), Lp=154 dB
Assuming HBS =35m, then
Lp = 143.2 + 38 log d + 18 log (35-17) = 154
Log d = - 0.3 then d = 0.5 Km = 500 m
Walfish-Ikegami Model is more suitable for estimating the cell range in
Dense Urban and Urban clutters.
Clutter Type Frequency Value of K
Dense Urban, Urban and Sub
Urban Areas
800 142.4
900 143.2
1800 153.2
1900 154.1

11/08/2014
56
Copy Rights © LEGEND Co. 2010
Coverage Dimensioning
Up Link Budget
• Now, we’re going to calculate the cell radius where the PinBTS will be
PinBTS = BTSsensitivity + RFmargin + IFmargin + BLmargin + LNFmarg(o)
Pout MS : Output power from the Mobile Station.
Lf BTS : Losses in Feeders, Jumpers and connectors
Ga BTS : BTS antenna gain Gd BTS : BTS antenna diversity gain
Lp : Path Loss Pin BTS : Input power at the Base Station
GTMA-UL : TMA UL gain
Pin BTS PoutMS
TMA
GTMA-UL
Copy Rights © LEGEND Co. 2010
Coverage Dimensioning
Up Link Budget
Example:
Given that: Pout MS = 33 dBm, Lf BTS = 2.6 dB, G TMA-UL = 4 dB ,
BTSsensitivity = -110 dBm, Ga BTS = 18 dBi Gd BTS = 3.5 dB , then we can calculate the
path loss as follows:
Lp = (Pout MS + G TMA-UL - Lf BTS + Ga BTS + Gd BTS ) – PinBTS
PinBTS = BTSsensitivity + RFmargin + IFmargin + BLmargin + LNFmarg(o)
= -110+3+2+5+4.9=-95.1
Lp = 33 + 4 – 2.6 + 18 + 3.5 – (-95.1) = 151 dB
Based on Walfish-Ikegami, we can calculate the maximum cell range on the
path loss calculated in the UL
Assuming HBS =35m, then
Lp = 143.2 + 38 log d + 18 log (35-17) = 151 dB
Log d = - 0.38 then d ~ 0.42 Km = 420 m

11/08/2014
57
Copy Rights © LEGEND Co. 2010
Coverage Dimensioning
Now
from downlink budget calculations dDL = 500m
while
from the uplink budget calculations dUL = 420m,
then we’re going to design on the lower value.
Copy Rights © LEGEND Co. 2010
Coverage Dimensioning
Power Balance
Now in order to guarantee that there is a power balance between the DL and the UL paths, we’ve to recalculate the BTS output power that will achieve this balance.
Lp = (Pout BTS - Lf BTS + Ga BTS + Gd BTS ) - Pin MS
Lp = Pout BTS - 2.6+18+3.5-(-89.1) = Pout BTS + 108 = 151 dB
Pout BTS = 43 dBm and this is the BTS o/p power for power balance.
DL Coverage
UL Coverage
If the DL and UL coverage are not balanced as in
figure, then in the shaded area in between, the MSs
will receive a good DL signal but their UL signal won’t
reach the BTS.

11/08/2014
58
Copy Rights © LEGEND Co. 2010
Copy Rights © LEGEND Co. 2010
Capacity Dimensioning
The Capacity in cellular system depends on:
The number of channels available.
The Grade Of Service (GOS) the subscribers are encountering in the
system
Traffic Theory attempts to obtain useful estimates, for example the number of
channels needed in a cell these estimates will depend on the selected system
and the assumed or real behavior of the subscribers.

11/08/2014
59
Copy Rights © LEGEND Co. 2010
Capacity Dimensioning
Traffic? Traffic refers to the usage of channels and is usually thought of as
the holding time per time unit.
Traffic: is measured in Erlangs (Er), a traffic of 1 Er means that this channel
was busy for 1 complete hour.
Traffic (Er) =
How much traffic can one cell carry?
This will depend on:
Number of traffic channels available.
Amount of congestion which is the GOS
Number of calls/hr X Average call holding time (Sec)
3600
Copy Rights © LEGEND Co. 2010
Capacity Dimensioning
Erlang-B table: is used to calculate how much traffic a cell can bear given
certain no. of Traffic Channels and certain GOS.
The Erlang-B table: was formed based on certain assumptions:
Poisson distribution (random) traffic
Blocked calls leave the call.
Example:
With a cell configured with 4 frequencies, then the number of available TCH
channels = 4*8 – 2 =30 TCHs, with GOS=2% then using Erlang-B we can
calculate the maximum traffic on this cell = 21.932 Er
If the average traffic/user = 30 mEr (i.e. average call/user = 108 seconds= 1.8
minutes) then at peak (busy) hour this cell can support 21.932/30m = 730 users

11/08/2014
60
Copy Rights © LEGEND Co. 2010
Capacity Dimensioning
Erlang B-Table
N.B:
The numerical
headings indicate
blocking probability %
Copy Rights © LEGEND Co. 2010
Capacity Dimensioning
Example:
If we have input from the marketing team that in a certain city each 100meters we’ll have
in the busy hour 150 users each will talk for 108 seconds = 1.8 minutes (i.e. each
user generates 30mE), calculate the cell range if each cell will be configured with 4
frequencies.
Solution:
For each cell, no. of TCHs = 4*8 – 2 =30 TCHs, with GOS=2% then using “Erlang-B
Table” we can find that each cell can bear up to 21.932 Er
But each user generates 30mE, then this cell can serve (21.9/30e-3) = 732
subscriber.
According to the user’s distribution, then each 100 m we have 150 subscriber, then
for each cell the 732 subscriber will be distributed on 100*(732/150) = 487 meters.
Distance
(meters)10
0
20
0
30
0
40
0
50
0
4.
5E
r
4.
5E
r
4.
5E
r
4.
5E
r
4.
5E
r0
d= 487m

11/08/2014
61
Copy Rights © LEGEND Co. 2010
Capacity Dimensioning
Channel Utilization (Trunking Efficiency)
One of the factors that should be taken into consideration in dimensioning,
and it shows how efficient the resources are utilized.
It is calculated as ηT = 100* (Traffic (Er) / No. of channels )
If we have an area generates a traffic of 20 Erlang, so under GOS=2% is
it better to use 1 cell or to split the traffic between 2 cell each of which to
carry 10 Er ?
• It is apparent from the above that using 1 cell will be more efficient than
splitting the traffic between 2 cells.
• For 1 cell to carry 20 Erlang with GOS=2%,
then no. of TCHs needed = 28, then we
should have at least 4 frequencies.
• 4 freq = 30 available TCHs
• Now Trunking efficiency
ηT = 100* (20/ 30) = 66.67%
• For 2 cells each to carry 10 Erlang with
GOS=2%, then no. of TCHs needed/cell = 17 ,
then we should have at least 3 frequencies.
• 3 freq/cell = 22 available TCHs/ cell, i.e. both
cells will have now 44 available TCHs
• Now Trunking efficiency
ηT = 100* (20/ 44) = 45.5 %
Copy Rights © LEGEND Co. 2010
Capacity Dimensioning
SDCCH Dimensioning
The load on the SDCCH channel is affected by:
Mobility Management procedures, that is, Normal Location Updating,
Periodic Registration and IMSI attach/detach.
Connection Management procedures, that is, Call set-up, SMSs.
The Typical GOS of SDCCH channel will depend either combined or non-
combined modes are used:
Non-Combined: GOS = 0.5% ( SDCCH/8)
Combined: GOS = 1% (SDCCH/4)

11/08/2014
62
Copy Rights © LEGEND Co. 2010
Capacity Dimensioning
SDCCH Dimensioning
Two models are used to estimate the SDCCH load
BAS1 Model: Typical model for SDCCH load estimations in average
network.
ERA5 Model: More aggressive model may be used when the subscribers
behavior in the network is not known.
The SDCCH load estimations, three types of cells are considered:
Border Cell (BC): Cell lies on a location area border and will be subjected
to heavy location updating.
Inner Cell (IC): Cell lies in the core of the location area and will never
subjected to location updating.
Average Cell (AC): Cell having average no. of location updating.
Copy Rights © LEGEND Co. 2010
Capacity Dimensioning
SDCCH Dimensioning
The SDCCH load estimations based on the two models can be seen as
below:
The 1st model:
BAS1 ModelEvent Average Cell Inner Cell Border Cell
Location Updating 0.5 0 1.5 mE/subscriber
IMSI Attach/detach 0.4 0.4 0.4 mE/subscriber
Periodic Registration 0.2 0.2 0.2 mE/subscriber
Call set-up 0.8 0.8 0.8 mE/subscriber
SMS 0.3 0.3 0.3 mE/subscriber
Total 2.2 1.7 3.2 mE/subscriber
20% Traffic Margin added 2.6 2 3.8 mE/subscriber

11/08/2014
63
Copy Rights © LEGEND Co. 2010
Capacity Dimensioning
SDCCH Dimensioning
The SDCCH load estimations based on the two models can be seen as
below:
The 2nd model:
ERA5 ModelEvent Average Cell Inner Cell Border Cell
Location Updating 1 0 3 mE/subscriber
IMSI Attach/detach 1.8 1.8 1.8 mE/subscriber
Periodic Registration 0.5 0.5 0.5 mE/subscriber
Call set-up 0.9 0.9 0.9 mE/subscriber
SMS 1.7 1.7 1.7 mE/subscriber
Total 5.9 4.9 7.9 mE/subscriber
20% Traffic Margin added 7.1 5.9 9.5 mE/subscriber
Copy Rights © LEGEND Co. 2010
11/08/2014
64
Copy Rights © LEGEND Co. 2010
Copy Rights © LEGEND Co. 2010
Frequency Planning
A Cellular system is based upon reuse of the same set of carriers
(frequencies).
The same set of frequencies will be reused every cluster, where the cluster is
formed of defined no. of cells.
When applying certain frequency plan strategy, some issues should be taken
into consideration like: Available frequency spectrum, Subscribers distribution,
required Carrier to Interference ratio (C/I) and Carrier to Adjacent ratio (C/A).
It is recommended to keep C/I > 12 dB, while maintaining C/A > -3 dB

11/08/2014
65
Copy Rights © LEGEND Co. 2010
Frequency Planning
Frequency Assignment Strategies
(I) Fixed Frequency Groups
(A)
4/12 Reuse
Pattern
(B)
3/9 Reuse
Pattern
(II) Multiple Reuse Pattern
Copy Rights © LEGEND Co. 2010
Frequency Planning
Frequency Assignment Strategies
(I) Fixed Frequency Groups
It is the traditional way of assigning frequencies, it is accomplished by dividing
the frequency spectrum into groups each of which has the same no. of
frequencies and each cell will be assigned a certain group.
The advantage with this method is that once the BCCH plan is finished, all
other frequencies will be mapped in the same way.
The disadvantage is that it is not spectrum efficient and doesn’t make use of
the fact that not all cells have the same number of TRUs.
11/08/2014
66
Copy Rights © LEGEND Co. 2010
Frequency Planning
Frequency Assignment Strategies
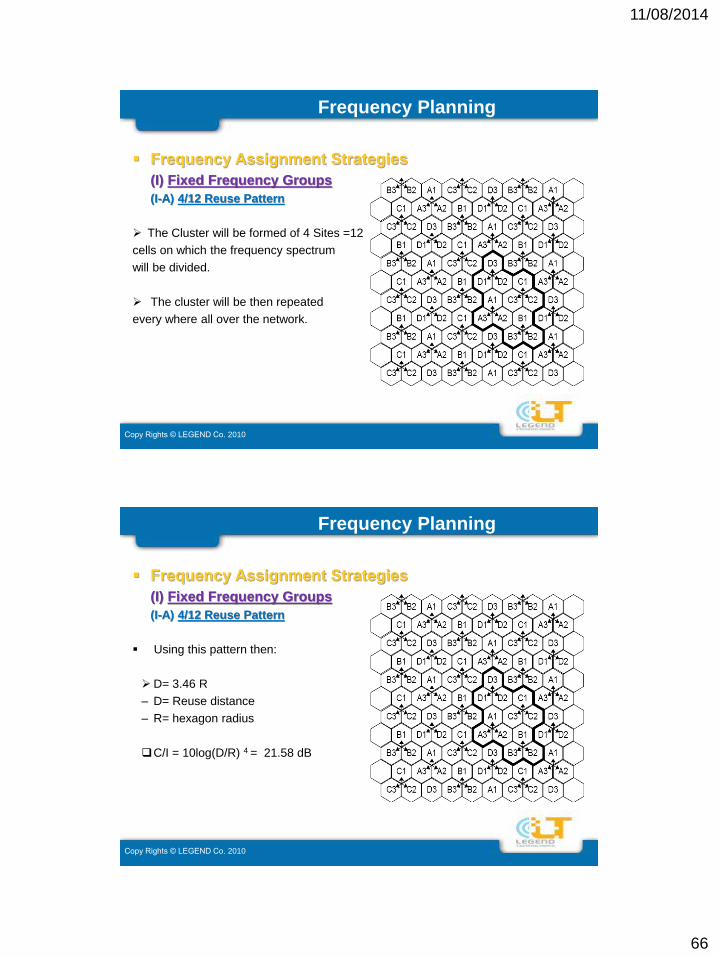
(I) Fixed Frequency Groups
(I-A) 4/12 Reuse Pattern
The Cluster will be formed of 4 Sites =12
cells on which the frequency spectrum
will be divided.
The cluster will be then repeated
every where all over the network.
Copy Rights © LEGEND Co. 2010
Frequency Planning
Frequency Assignment Strategies
(I) Fixed Frequency Groups
(I-A) 4/12 Reuse Pattern
Using this pattern then:
D= 3.46 R
– D= Reuse distance
– R= hexagon radius
C/I = 10log(D/R) 4 = 21.58 dB
11/08/2014
67
Copy Rights © LEGEND Co. 2010
Frequency Planning
Frequency Assignment Strategies
(I) Fixed Frequency Groups
(I-A) 4/12 Reuse Pattern
Example:
If the frequency spectrum is made up of 36 freq, then
what’ll be the distribution of these frequencies/cluster?
Strategy#1: Block Distribution
The frequency band will be divided into blocks
formed of consecutive frequencies, block for the
BCCH frequencies and block for the TCH frequencies.
Then we’ll form 12 groups each group will be
assigned to a cell within the cluster
( 1 BCCH freq. + 2 TCHs frequencies)
BCCH Block TCH Block 1 TCH Block 2
f1 f2 f3 f4 f5 f6 f7 f8 f9 f10f11f12f13f14f15f16f17f18f19f20f21f22f23f24f25f26f27f28f29f30f31f32f33f34f35f36
Copy Rights © LEGEND Co. 2010
Frequency Planning
Frequency Assignment Strategies
(I) Fixed Frequency Groups
(I-A) 4/12 Reuse Pattern
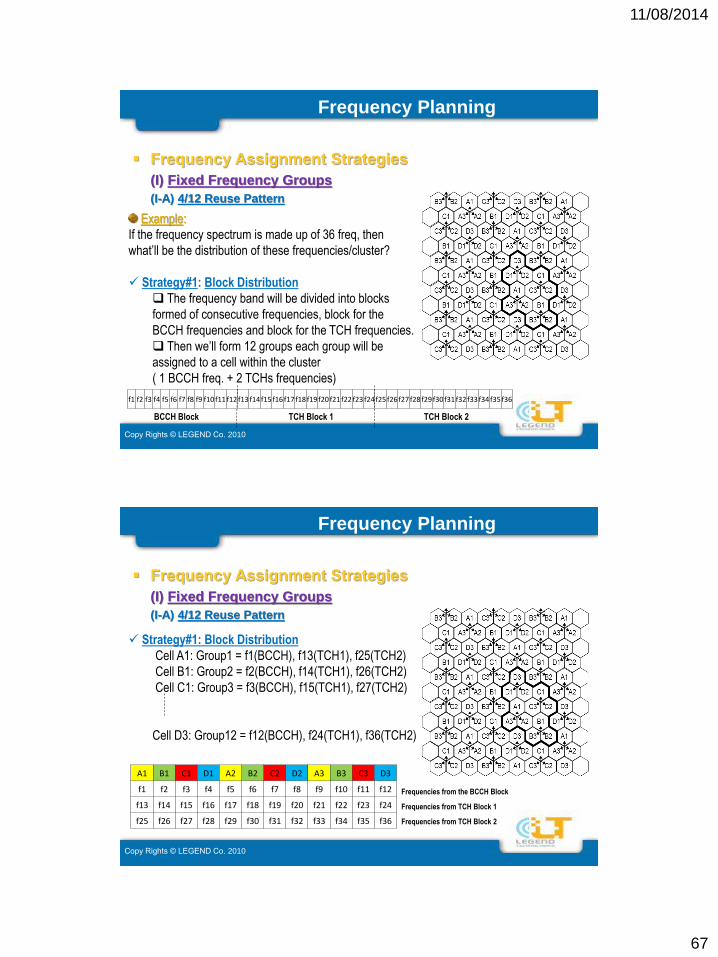
Strategy#1: Block Distribution
Cell A1: Group1 = f1(BCCH), f13(TCH1), f25(TCH2)
Cell B1: Group2 = f2(BCCH), f14(TCH1), f26(TCH2)
Cell C1: Group3 = f3(BCCH), f15(TCH1), f27(TCH2)
Cell D3: Group12 = f12(BCCH), f24(TCH1), f36(TCH2)
A1 B1 C1 D1 A2 B2 C2 D2 A3 B3 C3 D3
f1 f2 f3 f4 f5 f6 f7 f8 f9 f10 f11 f12
f13 f14 f15 f16 f17 f18 f19 f20 f21 f22 f23 f24
f25 f26 f27 f28 f29 f30 f31 f32 f33 f34 f35 f36
Frequencies from the BCCH Block
Frequencies from TCH Block 1
Frequencies from TCH Block 2
11/08/2014
68
Copy Rights © LEGEND Co. 2010
Frequency Planning
Frequency Assignment Strategies
(I) Fixed Frequency Groups
(I-A) 4/12 Reuse Pattern
Strategy#2: Scattered Distribution
The frequencies assigned for both BCCH and TCH
bands will be chosen in a scattered manner and not as
block.
Then we’ll form 12 groups each group will be
assigned to a cell within the cluster
( 1 BCCH freq. + 2 TCHs frequencies)BCCH Frequencies
TCH Frequencies 1
TCH Frequencies 2
f1 f2 f3 f4 f5 f6 f7 f8 f9 f10f11f12f13f14f15f16f17f18f19f20f21f22f23f24f25f26f27f28f29f30f31f32f33f34f35f36
f1 f4 f7 f10f13f16f19f22f25f28f31f34f35 f2 f5 f8 f11f14f17f20f23f26f29f32f33f36 f3 f6 f9 f12f15f18f21f24f27f30
BCCH Frequencies TCH Frequencies 1 TCH Frequencies 2
Copy Rights © LEGEND Co. 2010
Frequency Planning
Frequency Assignment Strategies
(I) Fixed Frequency Groups
(I-A) 4/12 Reuse Pattern
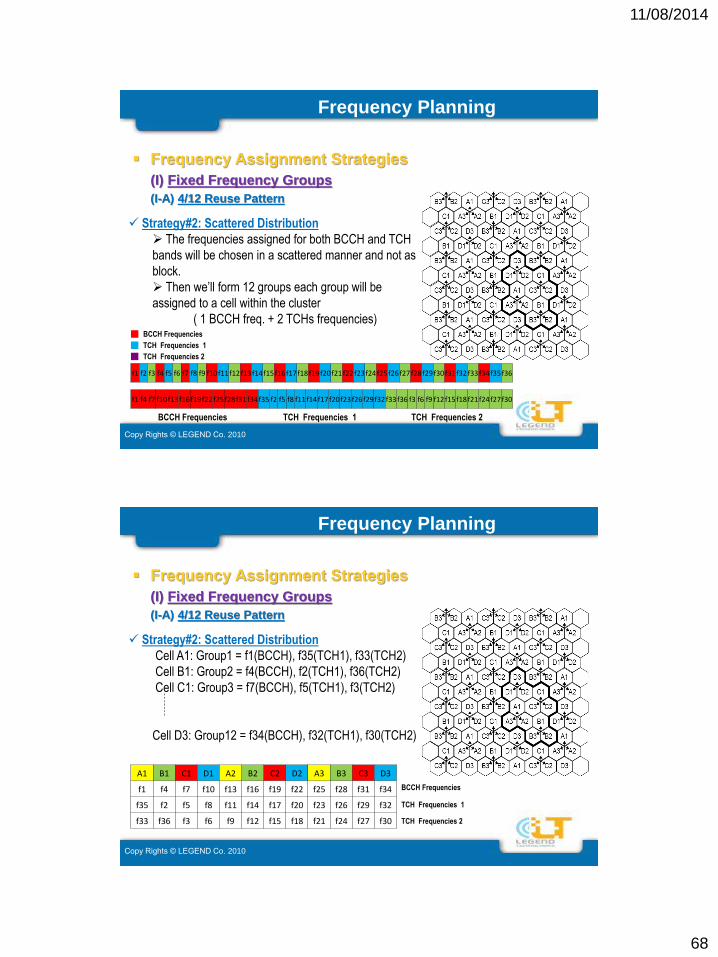
Strategy#2: Scattered Distribution
Cell A1: Group1 = f1(BCCH), f35(TCH1), f33(TCH2)
Cell B1: Group2 = f4(BCCH), f2(TCH1), f36(TCH2)
Cell C1: Group3 = f7(BCCH), f5(TCH1), f3(TCH2)
Cell D3: Group12 = f34(BCCH), f32(TCH1), f30(TCH2)
A1 B1 C1 D1 A2 B2 C2 D2 A3 B3 C3 D3
f1 f4 f7 f10 f13 f16 f19 f22 f25 f28 f31 f34
f35 f2 f5 f8 f11 f14 f17 f20 f23 f26 f29 f32
f33 f36 f3 f6 f9 f12 f15 f18 f21 f24 f27 f30
BCCH Frequencies
TCH Frequencies 1
TCH Frequencies 2

11/08/2014
69
Copy Rights © LEGEND Co. 2010
Frequency Planning
Frequency Assignment Strategies
(I) Fixed Frequency Groups
(I-A) 4/12 Reuse Pattern
For this example whatever the strategy used either
Blocked or scattered, the no. of frequencies/cell = 3.
We can calculate the trunking efficiency as below:
No. of TCHs/Cell = (3*8 – 2 )= 22 Traffic channels,
with GOS=2% then Traffic = 14.9 Er
ηT = 100* (14.9/ 22) = 66.72%
Copy Rights © LEGEND Co. 2010
Frequency Planning
Frequency Assignment Strategies
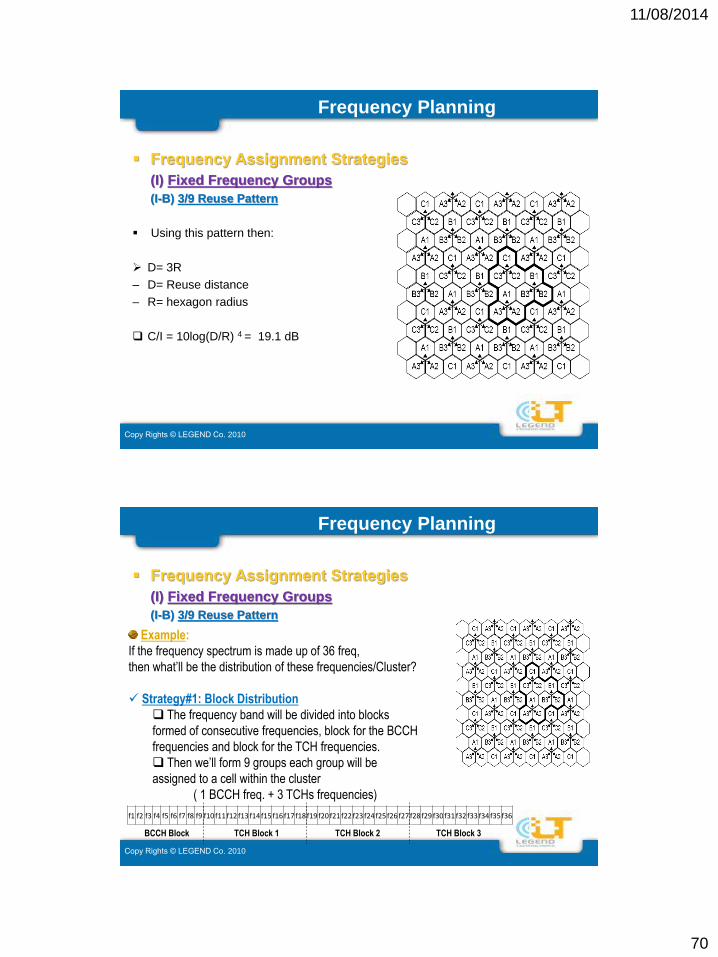
(I) Fixed Frequency Groups
(I-B) 3/9 Reuse Pattern
The Cluster will be formed of 3 Sites = 9 cells
on which the frequency spectrum will be divided.
The cluster will be then repeated every where
all over the network.
11/08/2014
70
Copy Rights © LEGEND Co. 2010
Frequency Planning
Frequency Assignment Strategies
(I) Fixed Frequency Groups
(I-B) 3/9 Reuse Pattern
Using this pattern then:
D= 3R
– D= Reuse distance
– R= hexagon radius
C/I = 10log(D/R) 4 = 19.1 dB
Copy Rights © LEGEND Co. 2010
Frequency Planning
Frequency Assignment Strategies
(I) Fixed Frequency Groups
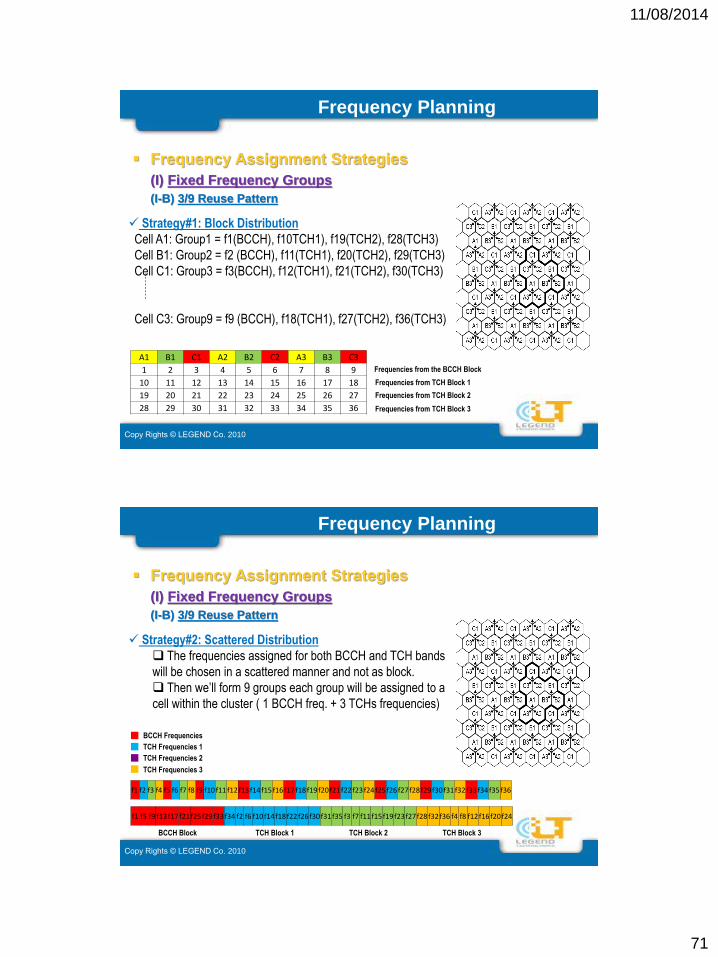
(I-B) 3/9 Reuse Pattern
Example:
If the frequency spectrum is made up of 36 freq,
then what’ll be the distribution of these frequencies/Cluster?
Strategy#1: Block Distribution
The frequency band will be divided into blocks
formed of consecutive frequencies, block for the BCCH
frequencies and block for the TCH frequencies.
Then we’ll form 9 groups each group will be
assigned to a cell within the cluster
( 1 BCCH freq. + 3 TCHs frequencies)
BCCH Block TCH Block 1 TCH Block 2
f1 f2 f3 f4 f5 f6 f7 f8 f9 f10f11f12f13f14f15f16f17f18f19f20f21f22f23f24f25f26f27f28f29f30f31f32f33f34f35f36
TCH Block 3
11/08/2014
71
Copy Rights © LEGEND Co. 2010
Frequency Planning
Frequency Assignment Strategies
(I) Fixed Frequency Groups
(I-B) 3/9 Reuse Pattern
Strategy#1: Block Distribution
Cell A1: Group1 = f1(BCCH), f10TCH1), f19(TCH2), f28(TCH3)
Cell B1: Group2 = f2 (BCCH), f11(TCH1), f20(TCH2), f29(TCH3)
Cell C1: Group3 = f3(BCCH), f12(TCH1), f21(TCH2), f30(TCH3)
Cell C3: Group9 = f9 (BCCH), f18(TCH1), f27(TCH2), f36(TCH3)
A1 B1 C1 A2 B2 C2 A3 B3 C3
1 2 3 4 5 6 7 8 9
10 11 12 13 14 15 16 17 18
19 20 21 22 23 24 25 26 27
28 29 30 31 32 33 34 35 36
Frequencies from the BCCH Block
Frequencies from TCH Block 1
Frequencies from TCH Block 2
Frequencies from TCH Block 3
Copy Rights © LEGEND Co. 2010
Frequency Planning
Frequency Assignment Strategies
(I) Fixed Frequency Groups
(I-B) 3/9 Reuse Pattern
Strategy#2: Scattered Distribution
The frequencies assigned for both BCCH and TCH bands
will be chosen in a scattered manner and not as block.
Then we’ll form 9 groups each group will be assigned to a
cell within the cluster ( 1 BCCH freq. + 3 TCHs frequencies)
BCCH Block TCH Block 1 TCH Block 2
BCCH Frequencies
TCH Frequencies 1
TCH Frequencies 2
TCH Frequencies 3
f1 f5 f9 f13f17f21f25f29f33f34 f2 f6 f10f14f18f22f26f30f31f35 f3 f7 f11f15f19f23f27f28f32f36 f4 f8 f12f16f20f24
TCH Block 3
f1 f2 f3 f4 f5 f6 f7 f8 f9 f10f11f12f13f14f15f16f17f18f19f20f21f22f23f24f25f26f27f28f29f30f31f32f33f34f35f36

11/08/2014
72
Copy Rights © LEGEND Co. 2010
Frequency Planning
Frequency Assignment Strategies
(I) Fixed Frequency Groups
(I-B) 3/9 Reuse Pattern
Strategy#2: Scattered Distribution
Cell A1: Group1 = f1(BCCH), f34(TCH1), f31(TCH2), f28(TCH3)
Cell B1: Group2 = f5(BCCH), f2(TCH1), f35(TCH2), f32(TCH3)
Cell C1: Group3 = f9(BCCH), f6(TCH1), f3(TCH2), f36(TCH3)
Cell C3: Group9 = f33(BCCH), f30(TCH1), f27(TCH2), f24(TCH3)
A1 B1 C1 A2 B2 C2 A3 B3 C3
f1 f5 f9 f13 f17 f21 f25 f29 f33
f34 f2 f6 f10 f14 f18 f22 f26 f30
f31 f35 f3 f7 f11 f15 f19 f23 f27
f28 f32 f36 f4 f8 f12 f16 f20 f24
BCCH Frequencies
TCH Frequencies 1
TCH Frequencies 2
TCH Frequencies 3
Copy Rights © LEGEND Co. 2010
Frequency Planning
Frequency Assignment Strategies
(I) Fixed Frequency Groups
(I-B) 3/9 Reuse Pattern
For this example whatever the strategy used either
Blocked or scattered, the no. of frequencies/cell = 4.
We can calculate the trunking efficiency as below:
No. of TCHs/Cell = (4*8 – 2 )= 30 Traffic channels,
with GOS=2% then Traffic = 21.93 Er
ηT = 100* (21.93/ 30) = 73.1%

11/08/2014
73
Copy Rights © LEGEND Co. 2010
Frequency Planning
Frequency Assignment Strategies
(II) Multiple Reuse Pattern
It is more spectrum efficient than fixed frequency groups for non-uniform
configurations.
The frequency assignment is done according to layered frequency planning
where each band is individually planned.
That is due to the fact that the load on each cell differs according to the
serving area.
Copy Rights © LEGEND Co. 2010
Frequency Planning
Frequency Assignment Strategies
(II) Multiple Reuse Pattern
Assume a frequency bandwidth of 7.2MHz (36 frequency) and configuration
with maximum 4 frequencies per cell is allowed.
The frequencies are then divided into four bands, one band for the BCCH
frequencies and three bands for the TCH frequencies as below:
12 BCCH FrequenciesBCCH Frequencies
f1 f3 f5 f7 f9 f11 f13 f15 f17 f19 f21 f23
10 TCH Frequencies in the 1st TCH band
TCH Frequencies 2
f22 f24 f26 f28 f30 f32 f34 f368 TCH Frequencies in the 2nd TCH band
TCH Frequencies 3
f25 f27 f29 f31 f33 f356 TCH Frequencies in the 3rd TCH band
TCH Frequencies 1
f2 f4 f6 f8 f10 f12 f14 f16 f18 f20
11/08/2014
74
Copy Rights © LEGEND Co. 2010
Frequency Planning
Frequency Assignment Strategies
(II) Multiple Reuse Pattern
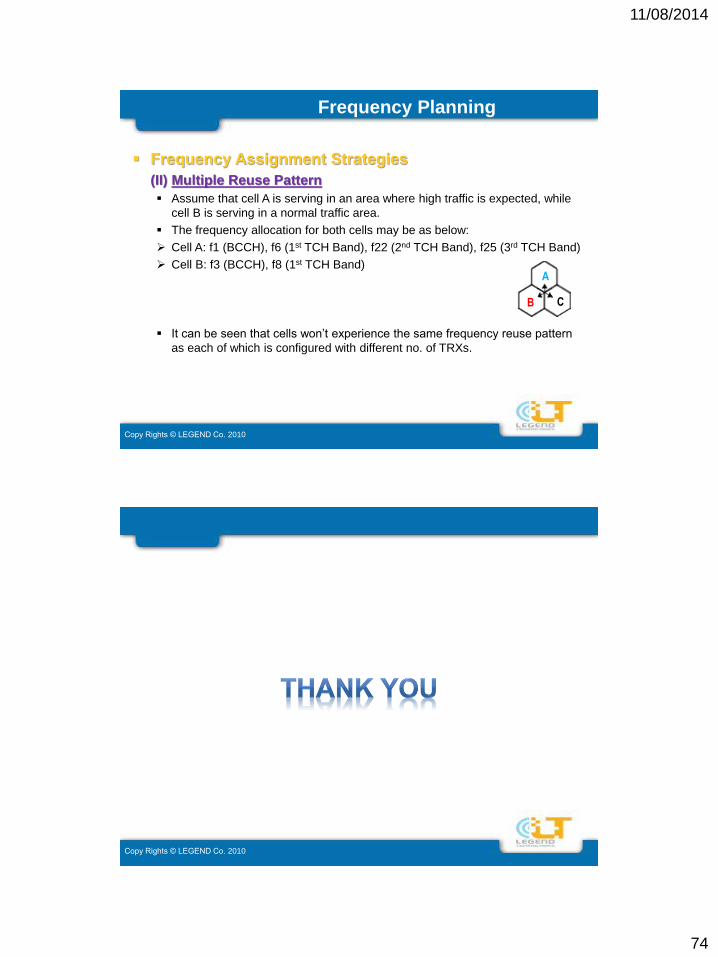
Assume that cell A is serving in an area where high traffic is expected, while
cell B is serving in a normal traffic area.
The frequency allocation for both cells may be as below:
Cell A: f1 (BCCH), f6 (1st TCH Band), f22 (2nd TCH Band), f25 (3rd TCH Band)
Cell B: f3 (BCCH), f8 (1st TCH Band)
It can be seen that cells won’t experience the same frequency reuse pattern
as each of which is configured with different no. of TRXs.
A
CB
Copy Rights © LEGEND Co. 2010