Copy Number Variants: detection and analysis Manuel Ferreira & Shaun Purcell Boulder, 2009.
39
Copy Number Variants: detection and analysis Manuel Ferreira & Shaun Purcell Boulder, 2009
-
Upload
brent-stanley -
Category
Documents
-
view
220 -
download
2
Transcript of Copy Number Variants: detection and analysis Manuel Ferreira & Shaun Purcell Boulder, 2009.

Copy Number Variants:
detection and analysis
Manuel Ferreira & Shaun Purcell
Boulder, 2009

Large chromosomal rearrangements can cause sporadic disease
Down syndromeDuchenne Muscular Dystrophy (DMD)
DiGeorge-Velo cardiofacial syndrome (VCFS)...
Lupski 2007 Nat Genet 39: s43

Sebat et al 2004 Science 305: 525
Iafrate et al 2004 Nat Genet 36: 949

Outline
1. What is a Copy Number Variant (CNV)2. Genome-wide detection of CNVs3. Association analysis of CNVs
4. Online databases

1. What is a CNV?
What is a CNV?
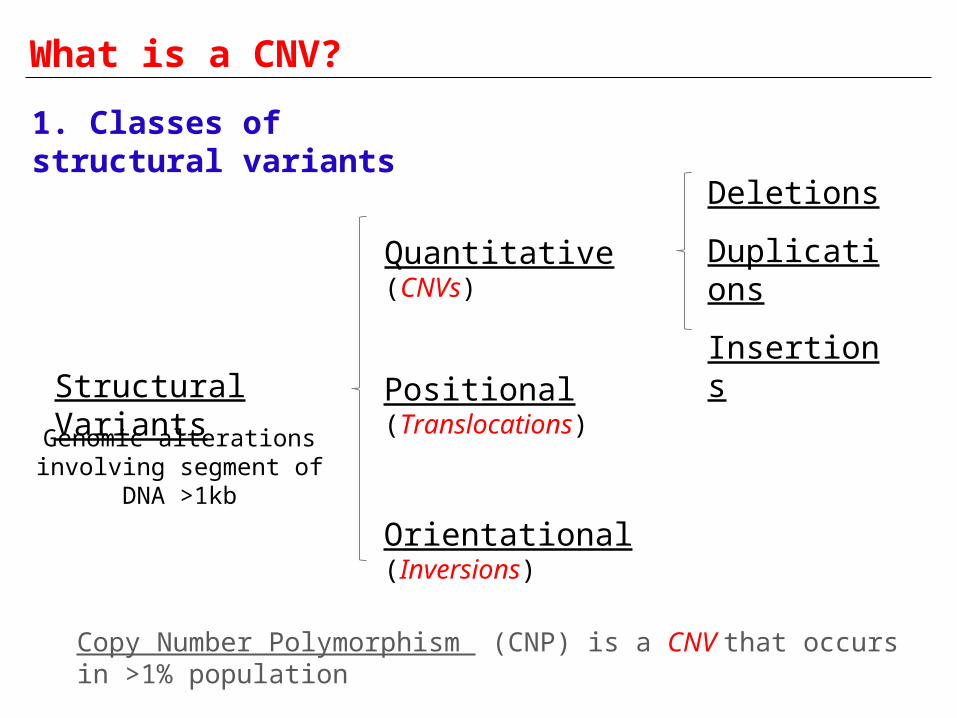
Structural Variants
Genomic alterations involving segment of DNA >1kb
Quantitative (CNVs)
Positional (Translocations)
Orientational (Inversions)
Deletions
Duplications
Insertions
1. Classes of structural variants
Copy Number Polymorphism (CNP) is a CNV that occurs in >1% population
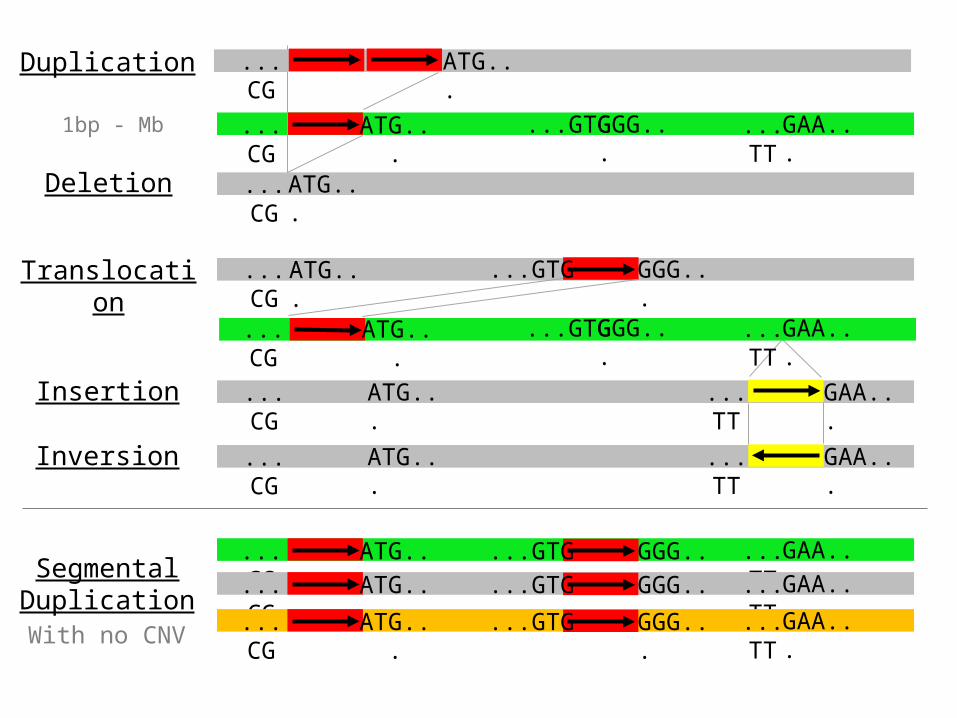
...CG ATG...
ATG......CG
ATG......CG GAA......TT
ATG......CG GAA......TT
ATG......CG
...CG ATG... GAA......TTGGG......GTG
...GTG GGG...
ATG......CG
GAA......TTGGG......GTG
Deletion
Duplication
Translocation
Insertion
Inversion
...CG ATG... GAA......TT...GTG GGG...Segmental Duplication ...CG ATG... GAA......TT...GTG GGG...
...CG ATG... GAA......TT...GTG GGG...With no CNV
1bp - Mb
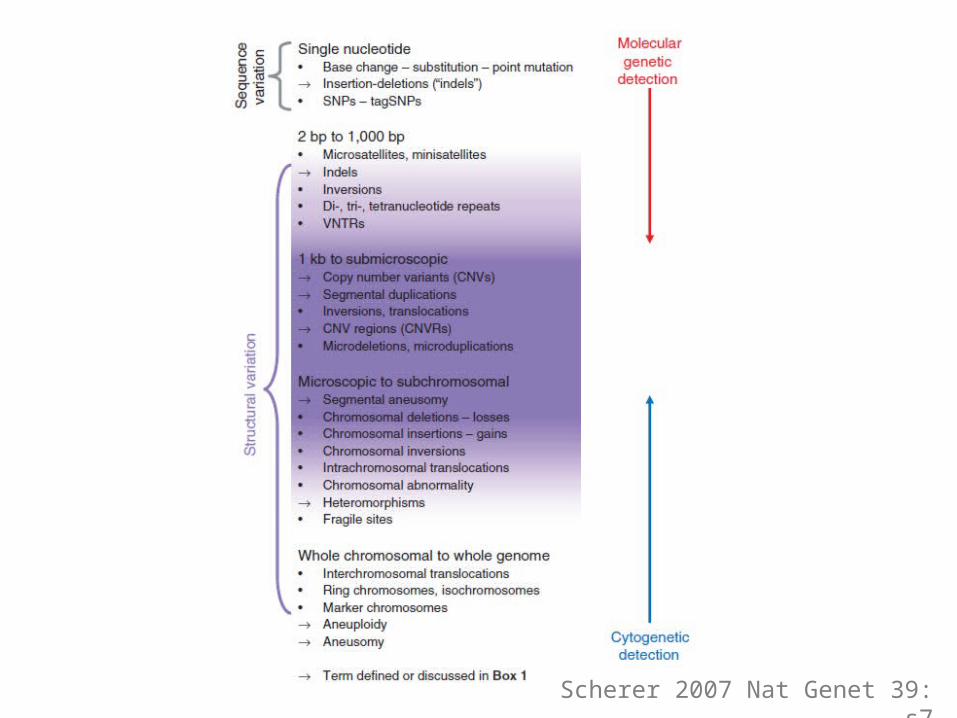
Scherer 2007 Nat Genet 39: s7
What is a CNV?
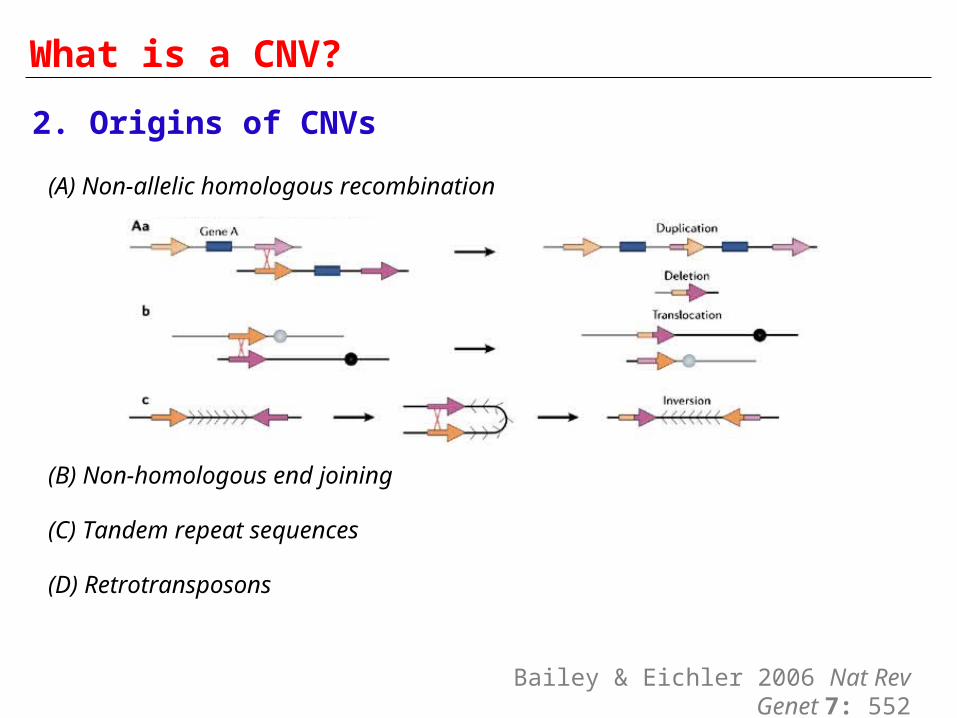
2. Origins of CNVs
(A) Non-allelic homologous recombination
(B) Non-homologous end joining
(C) Tandem repeat sequences
(D) Retrotransposons
Bailey & Eichler 2006 Nat Rev Genet 7: 552

3. CNVs are abundant in the genome
Human vs Human SNPs CNVs
Base pairs 2.5 Mb 4 Mb
1/1,200 bp 1/800
% genome 0.08% 0.12%
Sebat 2007 Nat Genet 39: s3
What is a CNV?

4. CNVs significantly overlap with known genes
Cooper et al 2007 Nat Genet 39: s22
What is a CNV?

5. CNVs influence gene expression
Stranger et al 2007 Science 315: 848
83.6% 17.7%
What is a CNV?

6. In healthy individuals, most CNVs are inherited…
Rare CNVs 10%
de novo
Common CNVs 90%inherited
McCarroll 2008 Hum Mol Genet 17: R135McCarroll et al 2008 Nat Genet 40: 1166
What is a CNV?
>99%
<1%
>1% population

2. Detection of CNVs

Detection of CNVs
A. Using intensity data from whole-genome arrays
SNPs Genotype known common variants
CNVsGenotype known common variants(A)
Identify and genotype new, potentially rarer variants
(B)

Detection of CNVs
Genotype known common CNVs using whole-genome arrays(A)
Affy 6.0
Illumina 1M 36,000 CNV non-polymorphic probescovering ~4,000 CNV regions in DGV
>940,000 CNV non-polymorphic probesHigh-density in ~5,600 CNV regions in DGV +
extended to whole-genome
Nimblegen array-CGH, CNV only, test vs reference custom or whole-genome (up to 2,1M probes)

Detection of CNVs ...CG ATG...
ATG......CGATG......CG
ATG......CGATG......CG
ATG......CGATG......CG
ATG......CGATG......CG
ATG......CGATG......CG
ATG......CGATG......CG
S
Mat/PatIndGenotype
Copy number at S Amount of DNA at S
1 S/S 2
2 SS/S 3
3 S/- 1
4 -/S 1
5 -/- 0
6 SSS/S 4

Detection of CNVs
Non-polymorphic probesMcCarroll et al 2008 Nat Genet 40: 1166

Detection of CNVs
Identify and genotype new, potentially rarer CNVs from whole-genome array data (CGH, Affymetrix/Illumina)
(B)
Example: rs1006737 A/G ... AGCCCGAAATGTTTTCAGA...
... AGCCCGAAGTGTTTTCAGA...
probe 1
probe 2AAAGGG
Intensity of probe 2
Inte
nsity
of
prob
e 1

Detection of CNVs
1 A/G 1 1 2
2 A/- 1 0 1
3 AA/- 2 0 2
4 -/G 0 1 1
5 -/- 0 0 0
6 AAA/G 3 1 4
...CG ATG...
ATG......CGATG......CG
ATG......CG
ATG......CGATG......CG
ATG......CGATG......CG
ATG......CGATG......CG
ATG......CGATG......CG
rs000, A/G
A
AG
A
AA
G
A A AG
ATG......CG
Mat/PatIndGenotype Copy number for:
A G TotalPattern

Detection of CNVs ...CG ATG...
rs000, A/G
A
Normalized intensity of allele A
Nor
mal
ized
inte
nsity
of
alle
le G
Polymorphic probe in CNV region
A/A
A/G
G/G
Individuals with
deletion(s)
Individuals with
duplication(s)ie. total CN > 2
ie. total CN < 2

Detection of CNVs
Combine information across probes to identify new CNVs
For example... Cases Controls
100kb deletion chr. 2 10/5,000 1/5,000
Korn et al 2008 Nat Genet 40: 1253
BirdseyeAffy 5.0, 6.0
Wang et al 2007 Genome Res 17: 1665
PennCNVAffymetrix and Illumina

Detecting CNVs through GWAS arrays is challenging…
Lots of confounders: DNA quality, concentration, source, batch effects, date effects.
Genotype calling software often platform specific, not very user friendly.
Arrays have poor resolution for CNVs (>100kb).
Genotype calling is computationally demanding, as it requires analysis of very large ‘raw’ cell files.

A/A
A/G
G/G
Detection of CNVs
B. Identifying CNVs through genotyping errors
Mendelian Inconsistencies
Failure Hardy-Weinberg equilibrium
GG A-
G-
AA
GG
GG
Conrad et al 2006 Nat Genet 38: 75McCarroll et al 2006 Nat Genet 38: 86

Detection of CNVs
C. Targeted or whole-genome sequencing
Korbel et al 2007 Science 318: 420

Summary so far…
CNVs are abundant, often overlap genes, can influence gene expression and most are inherited in healthy individuals
Known and new CNVs can be identified and genotyped in large-scale studies using whole-genome genotyping arrays, such as the 6.0 and 1M. Low resolution (>100Kb) & low signal/noise ratio.
What are the particular strategies and challenges for association analysis of CNVs?
More accurate CNV genotyping maps/arrays/algorithms expected in the next few years.
3. Association analysis of
CNVs
Association analysis of CNVs
1. Some of the relevant questions
(A) Are CNPs associated with variation in human traits or diseases?
(B) Can we identify rare CNVs associated with large increase in disease risk? Are these de novo or inherited in cases?
(C) When considering the whole-genome, do cases have more CNV events then controls, ie. increased burden?
(D) How to test SNPs in copy number regions?
(E) Are most CNVs tagged by SNPs in genotyping arrays?

Example 1: Autism whole-genome CNV
analysisSample 16p11 Cases Controls P
Discovery Del (600kb) 5/1,441 3/4,2341.1 x 10-4
[Affy 500K] Dup 7/1,441 2/4,234
Replication 1 (CHB) Del 5/512 0/4340.007
[array-CGH] Dup 4/512 0/434
Replication 2 (deCODE) Del 3/299 2/18,8344.2 x 10-4
[Illumina] Dup 0/299 5/18,834
Deletion frequency Iceland
Autism 1%Psychiatric disorder 0.1%General population 0.01%
Weiss et al. N Engl J Med 2008; 358: 667
COPPERBirdseye
CNAT
del dup
inherited 2 6de novo 10 1unknown 1 4

Example 2: SCZ whole-genome CNV
analysis
CasesCases
ControlsControlsChromosome Chromosome →→
Specific loci

A “positive control”
1:4000 live births~30% develop psychosisIn ~0.6-2% SCZ patients
3Mb and 1.5Mb variants
2 additional atypical deletions observed
11 : 0 9 : 0 10 : 1
22q11.2 (VCFS) 15q13.3 1q21.1
CHRNA7, alpha 7 nicotinic acetylcholine
receptor
5 cases w/ impaired cognition; 1 w/ epilepsy
Previously seen in mental retardation with seizures
3 cases had cognitive abnormalities; 1 with
epilepsy
Also seen in a patient with MR and seizures and two patients with
autism.
Specific large (>500kb) rare deletions
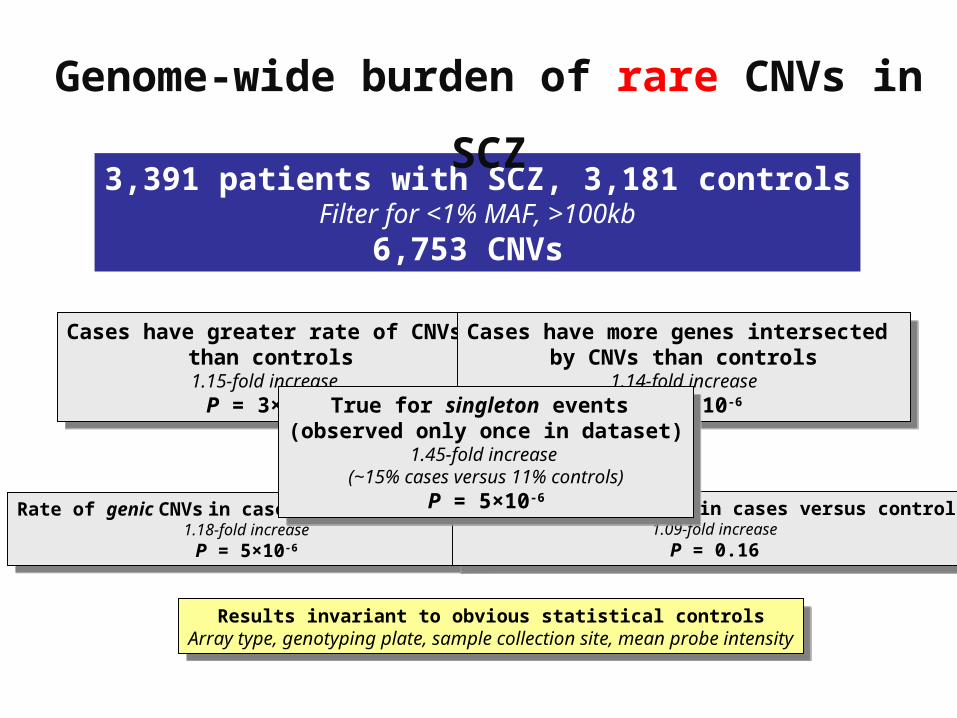
3,391 patients with SCZ, 3,181 controlsFilter for <1% MAF, >100kb
6,753 CNVs
Cases have greater rate of CNVs than controls1.15-fold increase
P = 3×10⁻⁵
Cases have greater rate of CNVs than controls1.15-fold increase
P = 3×10⁻⁵
Cases have more genes intersected by CNVs than controls
1.14-fold increaseP = 2×10⁻⁶
Cases have more genes intersected by CNVs than controls
1.14-fold increaseP = 2×10⁻⁶
Rate of genic CNVs in cases versus controls1.18-fold increase
P = 5×10⁻⁶
Rate of genic CNVs in cases versus controls1.18-fold increase
P = 5×10⁻⁶
Rate of non-genic CNVs in cases versus controls1.09-fold increase
P = 0.16
Rate of non-genic CNVs in cases versus controls1.09-fold increase
P = 0.16
Results invariant to obvious statistical controlsArray type, genotyping plate, sample collection site, mean probe intensity
Results invariant to obvious statistical controlsArray type, genotyping plate, sample collection site, mean probe intensity
True for singleton events (observed only once in dataset)
1.45-fold increase (~15% cases versus 11% controls)
P = 5×10⁻⁶
True for singleton events (observed only once in dataset)
1.45-fold increase (~15% cases versus 11% controls)
P = 5×10⁻⁶
Genome-wide burden of rare CNVs in SCZ

• Two other studies supporting a genome-wide increase in rare CNVs in schizophrenia– Walsh et al (2008) Science
• 5% controls, 15% cases, 20% early onset cases
• neurodevelopmental genes disrupted
– Xu et al (2008) Nature Genetics• strong increased de novo rate in sporadic cases; but increased inherited
rate also
1q21.1 and 15q13.3 also identified by SGENE consortium

Association analysis of CNVs
2. Testing SNPs in CNV regions
Disease
Disease
Disease
Individual analysis of SNPs or CNVs
Healthy
Disease
Healthy
Healthy
Healthy

B/B
A/B
A/A
AA/B
AA/A
BB/B
BB/A
Allele-specific risk CNV
CNV SNP 21 y
BA B-A 21 y
Korn et al 2008 Nat Genet 40: 1253
A-B
Normalized intensity of allele A
Nor
mal
ized
inte
nsity
of a
llele
B

Association analysis of CNVs
3. Testing CNVs through the analysis of SNPs in LD
HapMap1M6.0
Common CNVs
Coverage limited by lack of SNPs in CNV regions (poor genotyping)
McCarroll et al 2008 Nat Genet 40: 1166

4. Online databases

Comprehensive summary of structural variation in the human genome. Healthy control samples
Database of Genomic Variantshttp://projects.tcag.ca/variation/

Database of submicroscopic chromosomal imbalances, from array-CGH data. Focuses on data from patients with
developmental delay, learning disabilities or congenital anomalies.
DECIPHERhttps://decipher.sanger.ac.uk/