Copper deposition during quartz dissolution by cooling ...eps.mcgill.ca/~courses/c644/Willy's...
15
Copper deposition during quartz dissolution by cooling magmatic–hydrothermal fluids: The Bingham porphyry Marianne R. Landtwing a , Thomas Pettke a , Werner E. Halter a , Christoph A. Heinrich a, * , Patrick B. Redmond b,1 , Marco T. Einaudi b , Karsten Kunze c a Isotope Geochemistry and Mineral Resources, Department of Earth Sciences, Swiss Federal Institute of Technology, ETH Zentrum NO, 8092 Zu ¨ rich, Switzerland b Department of Geological and Environmental Sciences, Stanford University, Stanford, CA 94305, USA c Geological Institute, Department of Earth Sciences, Swiss Federal Institute of Technology, ETH Zentrum NO, 8092 Zu ¨ rich, Switzerland Received 23 April 2004; received in revised form 7 January 2005; accepted 18 February 2005 Available online 31 May 2005 Editor: R. Kayser Abstract Scanning electron microscope cathodoluminescence imaging is used to map successive generations of fluid inclusions in texturally complex quartz veinlets representing the main stage of ore metal introduction into the porphyry Cu–Au–Mo deposit at Bingham, Utah. Following conventional fluid inclusion microthermometry, laser ablation–inductively coupled plasma–mass spectrometry (LA-ICPMS) is applied to quantify copper and other major and trace-element concentrations in the evolving fluid, with the aim of identifying the ore-forming processes. Textures visible in cathodoluminescence consistently show that the bulk of vein quartz (Q1), characterized by bright luminescence, crystallized early in the vein history. Cu–Fe-sulfides are precipitated later in these veins, in a microfracture network finally filled with a second generation of dull-luminescing Q2 quartz. Mapping of brine and vapor inclusion assemblages in these successive quartz generations in combination with LA-ICPMS microanalysis shows that the fluids trapped before and after Cu–Fe-sulfide precipitation are very similar with respect to their major and minor-element composition, except for copper. Copper concentrations in inclusions associated with ore formation drop by two orders of magnitude, in a tight pressure–temperature interval between 21 and 14 MPa and 425–350 8C, several hundred degrees below the temperature of fluid exsolution from the magma. Copper deposition occurs within a limited P–T region, in which sulfide solubility shows strong normal temperature dependence while quartz solubility is retrograde. This permits copper sulfide deposition while secondary vein permeability is generated by quartz dissolution. The brittle-to-ductile transition of the quartz–feldspar-rich host rocks 0012-821X/$ - see front matter D 2005 Elsevier B.V. All rights reserved. doi:10.1016/j.epsl.2005.02.046 * Corresponding author. Tel.:+41 1 632 68 51. E-mail addresses: [email protected] (C.A. Heinrich), [email protected] (W.E. Halter). 1 Present address: QGX Ltd., Diplomatic Services Building 95, Suite 69, PO Box-243,210664, Ulaanbaatar, Mongolia. Earth and Planetary Science Letters 235 (2005) 229 – 243 www.elsevier.com/locate/epsl
Transcript of Copper deposition during quartz dissolution by cooling ...eps.mcgill.ca/~courses/c644/Willy's...
www.elsevier.com/locate/epsl
Earth and Planetary Science Le
Copper deposition during quartz dissolution by cooling
magmatic–hydrothermal fluids: The Bingham porphyry
Marianne R. Landtwinga, Thomas Pettkea, Werner E. Haltera, Christoph A. Heinricha,*,
Patrick B. Redmondb,1, Marco T. Einaudib, Karsten Kunzec
aIsotope Geochemistry and Mineral Resources, Department of Earth Sciences, Swiss Federal Institute of Technology, ETH Zentrum NO,
8092 Zurich, SwitzerlandbDepartment of Geological and Environmental Sciences, Stanford University, Stanford, CA 94305, USA
cGeological Institute, Department of Earth Sciences, Swiss Federal Institute of Technology, ETH Zentrum NO, 8092 Zurich, Switzerland
Received 23 April 2004; received in revised form 7 January 2005; accepted 18 February 2005
Available online 31 May 2005
Editor: R. Kayser
Abstract
Scanning electron microscope cathodoluminescence imaging is used to map successive generations of fluid inclusions in
texturally complex quartz veinlets representing the main stage of ore metal introduction into the porphyry Cu–Au–Mo deposit at
Bingham, Utah. Following conventional fluid inclusion microthermometry, laser ablation–inductively coupled plasma–mass
spectrometry (LA-ICPMS) is applied to quantify copper and other major and trace-element concentrations in the evolving fluid,
with the aim of identifying the ore-forming processes.
Textures visible in cathodoluminescence consistently show that the bulk of vein quartz (Q1), characterized by bright
luminescence, crystallized early in the vein history. Cu–Fe-sulfides are precipitated later in these veins, in a microfracture
network finally filled with a second generation of dull-luminescing Q2 quartz. Mapping of brine and vapor inclusion
assemblages in these successive quartz generations in combination with LA-ICPMS microanalysis shows that the fluids
trapped before and after Cu–Fe-sulfide precipitation are very similar with respect to their major and minor-element composition,
except for copper. Copper concentrations in inclusions associated with ore formation drop by two orders of magnitude, in a tight
pressure–temperature interval between 21 and 14 MPa and 425–350 8C, several hundred degrees below the temperature of fluid
exsolution from the magma. Copper deposition occurs within a limited P–T region, in which sulfide solubility shows strong
normal temperature dependence while quartz solubility is retrograde. This permits copper sulfide deposition while secondary
vein permeability is generated by quartz dissolution. The brittle-to-ductile transition of the quartz–feldspar-rich host rocks
0012-821X/$ - s
doi:10.1016/j.ep
* Correspondi
E-mail addr1 Present addr
tters 235 (2005) 229–243
ee front matter D 2005 Elsevier B.V. All rights reserved.
sl.2005.02.046
ng author. Tel.:+41 1 632 68 51.
esses: [email protected] (C.A. Heinrich), [email protected] (W.E. Halter).
ess: QGX Ltd., Diplomatic Services Building 95, Suite 69, PO Box-243,210664, Ulaanbaatar, Mongolia.
M.R. Landtwing et al. / Earth and Planetary Science Letters 235 (2005) 229–243230
occurs in the same temperature range, which further enhances vein reactivation and promotes cooling and expansion of fluids
ascending across the transition from lithostatic to hydrostatic conditions.
D 2005 Elsevier B.V. All rights reserved.
Keywords: cathodoluminescence; fluid inclusions; LA-ICPMS; ore deposit
1. Introduction
Porphyry-type ore deposits are centered on intru-
sions emplaced at depths of a few kilometers and
provide the world’s major resource of Cu, Mo and
Re, and a significant supply of Au [1]. Porphyry
stocks intrude above deeper intermediate to felsic
magma chambers that are the source of metal-trans-
porting magmatic–hydrothermal fluid focused upward
through a dense fracture network in the porphyry [2].
Processes in upper crustal magma chambers are deci-
sive for the generation of a metal charged magmatic
hydrothermal fluid (e.g., [3–6]). Focusing of a large
ascending fluid flux and the physico-chemical
mechanism of metal precipitation in the vein network
are prime factors determining the metal enrichment
factor, which is hundreds to thousand times average
crustal abundance. Several processes have been sug-
gested to trigger sulfide precipitation from magmatic–
hydrothermal fluids, including rapid changes in pres-
sure and/or temperature [7,8], fluid phase separation
into coexisting high-salinity brine and low-salinity
vapor with partitioning of acid volatiles into the
vapor phase [6,9], fluid–rock interaction affecting
physico-chemical parameters such as the pH of the
fluid [10,11], and dilution of magmatic brines by
meteoric water [7,12].
Fluid inclusions provide key insights into miner-
alizing processes (e.g., [13–15]). The advent of quan-
titative microanalysis of ore-forming elements in
single fluid inclusions [16,17] now allows quantifica-
tion of the parameters controlling metal precipitation
(e.g., [18,19]) and led to a first assessment of fluid-
chemical processes in the Alumbrera porphyry–Cu–
Au deposit [8]. In porphyry deposits, vein relation-
ships and mineral textures are invariably complex,
with the result that published fluid inclusion studies
typically report very large ranges in temperatures,
pressures and fluid salinities [8,12,14,15]. These
ranges are probably real and characteristic of such
dynamic fluid systems close to the interface between
hot magmas and the cold surface of the Earth. How-
ever, interpretation in terms of mineral precipitation
mechanisms is hampered by the great complexity of
fluid inclusion associations without clear relation-
ships between fluid inclusion generations and crystal-
lization stages of ore minerals. Scanning electron
microscope cathodoluminescence (SEM-CL) imaging
provides a new view of quartz textures in such com-
plex porphyry-hosted quartz–sulfide veins [20–22].
Together with conventional petrography, CL images
help to resolve successive generations of fluid inclu-
sion assemblages hosted in quartz and their timing
relative to vein quartz and ore mineral formation
(e.g., [22–25]).
This paper reports the first detailed study combining
SEM-CL-imaging and conventional fluid inclusion
microthermometry with quantitative microanalysis of
ore-metal concentrations by laser ablation–inductively
coupled plasma–mass spectrometry (LA-ICPMS). The
results clearly identify the stage of ore-metal precipi-
tation and thus constrain the decisive parameters for
the formation of the giant Bingham porphyry Cu–
Au(–Mo) deposit.
2. Geologic framework
Bingham, located 30 km southwest of Salt Lake
City (Utah), is one of the largest Cu–Au(–Mo) ore-
bodies in the world, containing 27.5 Mt of copper,
0.78 Mt of molybdenum 1600 t of gold and 17,700 t
of silver [26]. A hundred years of open pit mining and
deep drilling provide more than 2 km of vertical
exposure through the deposit, which is centered on
late Eocene porphyry dikes intruded at ~38 Ma (e.g.,
[27]) into equigranular monzonite and a thick
sequence of Pennsylvanian quartzite and silty lime-
stone (e.g., [28]). The sequence of mineralizing por-
phyries as currently recognized is [22,29,30] (1)
quartz monzonite porphyry, (2) latite porphyry, (3)
mafic biotite porphyry (possibly mixed latite and
OHIO COPPER
DIKE
PHOENIX DIKEBEAR
GULCHPORPHYRY
LAST CHANCE STOCK
BINGHAMSTOCK
Bingham
UTAH
Parnell
JordanCommercial
Fold axes
Faults
Limestone / Skarn and endoskarn
Porphyritic monzoniteCalcareous siltstone, limestone,hornfels
Latite porphyry
Biotite porphyry
LEGEND
Quartz latite porphyry breccia
Quartz latite porphyry
Quartz monzonite porphyry
Quartzite
Igneous breccia
Equigranular monzonite
0 500
m
N
>0. 3 5% Cu
Y
X
XY
1997 Pit outline
0.15% Cu
0.35% Cu
0.7% Cu
1ppm
0.15
ppm
Au
Quartz monzoniteporphyry
0.3ppm
Au
Intermediate-density inclusions
Vapor inclusions
Brine inclusions
3ppm
Upper limit ofintermediate-density
inclusions
Predominance ofintermediate-density
inclusions
Sedimentaryrocks
Equigranularmonzonite
Pre-mining surface0 300
m
1500 m
1000 m
500 m
2000 m
Currentelevation
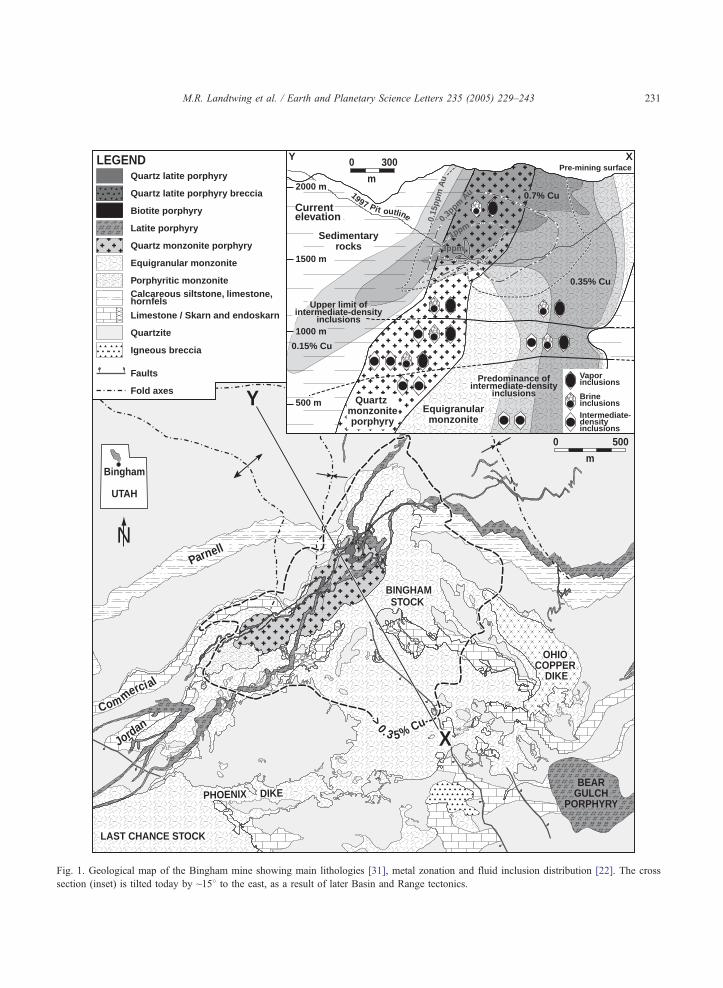
Fig. 1. Geological map of the Bingham mine showing main lithologies [31], metal zonation and fluid inclusion distribution [22]. The cross
section (inset) is tilted today by ~158 to the east, as a result of later Basin and Range tectonics.
M.R. Landtwing et al. / Earth and Planetary Science Letters 235 (2005) 229–243 231
M.R. Landtwing et al. / Earth and Planetary Science Letters 235 (2005) 229–243232
minette magmas), (4) quartz latite porphyry breccia
and (5) quartz latite porphyry. Copper–gold minerali-
zation associated with potassic alteration occurs in all
five intrusions, but the earliest quartz monzonite por-
phyry intrusion is volumetrically most important and
contains the highest ore grade, the highest vein den-
sity and the most intense potassic alteration. Later
porphyries truncate quartz-sulfide veins in the quartz
monzonite porphyry and are markedly less veined,
altered and mineralized [22,29]. The copper orebody,
as defined by the 0.35% copper grade contour, has the
shape of a mushroom cap centered on the quartz
monzonite porphyry as its stem. The rim of the ore-
body extends irregularly downward, into sedimentary
rocks in the north, and into equigranular monzonite in
the south (Fig. 1). High-grade copper–gold ore (N1%
Cu; N1Ag/g Au) forms a central body (approximately
100�300 m in cross section, and 1000 m in SW–NE
strike length), centered on the quartz monzonite por-
phyry [31].
The intrusion of each porphyry phase was followed
by the formation of (a) barren hairline biotite veinlets,
(b) sparse dark micaceous veinlets with biotite–
K-feldspar – muscoviteF andalusiteFchalcopyriteFbornite halos and (c) abundant and multiple genera-
tions of quartz stockwork veins that are intimately
associated with both potassic alteration (quartzFK–
feldsparFbiotite) and the formation of the copper–
gold ore [22,29]. Quartz–molybdenite veins (d)
formed after the last intrusion was emplaced, postdat-
ing Cu–Fe-sulfide introduction [32]. Quartz–molyb-
denite veins are finally cut by (e) quartz–pyrite veins
with sericitic halos [22,29]. Crosscutting relationships
between individual stockwork veins (c), even within
one porphyry intrusion, show that veins (a) to (c)
formed during multiple episodes of fracture opening
and mineral precipitation even though all have essen-
tially identical mineralogy. These quartz veins all
contain bornite, digenite and chalcopyrite and are in
equilibrium with hydrothermal K-feldspar and biotite,
present either in the veins or as alteration selvages
with disseminated sulfides grains. Early quartz stock-
work veins at any one location tend to be undulating
and sheeted and are cut and offset by irregular mas-
sive, blocky or banded quartz veins containing some
K-feldspar as a gangue mineral. The latest quartz
stockwork veins are parallel-walled, but still have
similar ore grades and contain the same sulfide miner-
als. Research presented here is based on a more
extensive geological, petrographic, SEM-CL and
fluid inclusion investigation that focused on the
zone of most abundant quartz veining associated
with the highest copper–gold grades in the central
orebody hosted by quartz monzonite porphyry.
3. Approach and analytical techniques
Following extensive pit mapping, drill core log-
ging and conventional petrographic work [22,29], a
fluid inclusion study of more than 60 quartz veins in
quartz monzonite porphyry was used to assess the
quality and variability of fluid inclusions. The best
of these vein samples were prepared as doubly
polished 150–600-Am-thick wafers and analysed in
detail by SEM-CL to image successive generations
of quartz and to correlate these with fluid inclusion
assemblages using transmitted light microscopy. This
combination of analytical techniques identified a con-
sistent sequence of vein mineral precipitation and a
consistent relationship between quartz generations,
fluid inclusion assemblages and sulfide deposition.
SEM images were obtained using a CamScan
CS44LB instrument. Backscattered electron (BSE)
and CL images were taken in sequence under the
same instrumental conditions (accelerating voltage
of 15 kV, beam current of 10–15 nA, working distance
35 mm, untilted sample adjusted in height to the lower
edge of the CL mirror), using an EDAX Phoenix
digital image acquisition system. The SEM is
equipped with a four-quadrant semiconductor BSE
detector (KE Developments Ltd.) and a motor-driven
elliptical mirror focusing the CL signal onto a stan-
dard photomultiplier detector. The lowest magnifica-
tion was 50�, corresponding to an image size of
~2.2�1.8 mm. For petrographic and fluid inclusion
mapping, larger areas were compiled by digitally
overlaying SEM-CL images on normal transmitted-
light micrographs. Such composite images were used
as a basis to map fluid inclusion assemblages, defined
as coevally entrapped groups of inclusions character-
ized by close spatial association and identical phase
proportions at room temperature [33]. Several cycles
of petrographic inspection, microthermometry and
LA-ICPMS analysis (often using both sides of several
wafer chips) were required in order to properly char-
M.R. Landtwing et al. / Earth and Planetary Science Letters 235 (2005) 229–243 233
acterize each inclusion assemblage and minimize the
loss of inclusions by thermal decrepitation.
Fluid inclusions were measured on a Linkham
THMSG 600 heating–freezing stage, calibrated to
F0.2 8C for the melting point of CO2 (�56.6 8C),and the melting point of H2O (0.0 8C), and to F2.0 8Cfor the critical point of pure H2O (374.1 8C). Theapparent salinity of fluid inclusions, expressed in
wt.% NaCl equivalent (wt.% NaCl eq.), was deter-
mined from final melting of halite [34] or constrained
by clathrate melting [35].
The prototype GeoLas LA-ICPMS system devel-
oped at ETH Zurich [36] consists of a 193-nm ArF
Excimer laser (Lambda Physik, Germany) combined
with an Elan 6100 quadrupole mass spectrometer
(Perkin Elmer, Canada). Instrument setup and data
reduction procedure for fluid inclusion microanalysis
followed that of earlier studies [16,17,37]. Absolute
quantification of LA-ICPMS signals is done by time
integration of all element intensities, correction for
host mineral contributions (in this study Li, Na, K,
Sn, Pb and Bi; see [38]), and external calibration of
intensity ratios against SRM 610 glass from NIST.
Element ratios are recalculated to absolute concentra-
tions for brine inclusions, where the wt.% NaCl
equivalent salinity, corrected for contributions by
cations other than Na [16], provides an internal stan-
dard. For vapor inclusions, where the salinity cannot
be determined microthermometrically (CO2–clathrate
melting but no observation of the homogenization of
CO2 liquid into CO2 vapor [35]), only element ratios
relative to Na are reported.
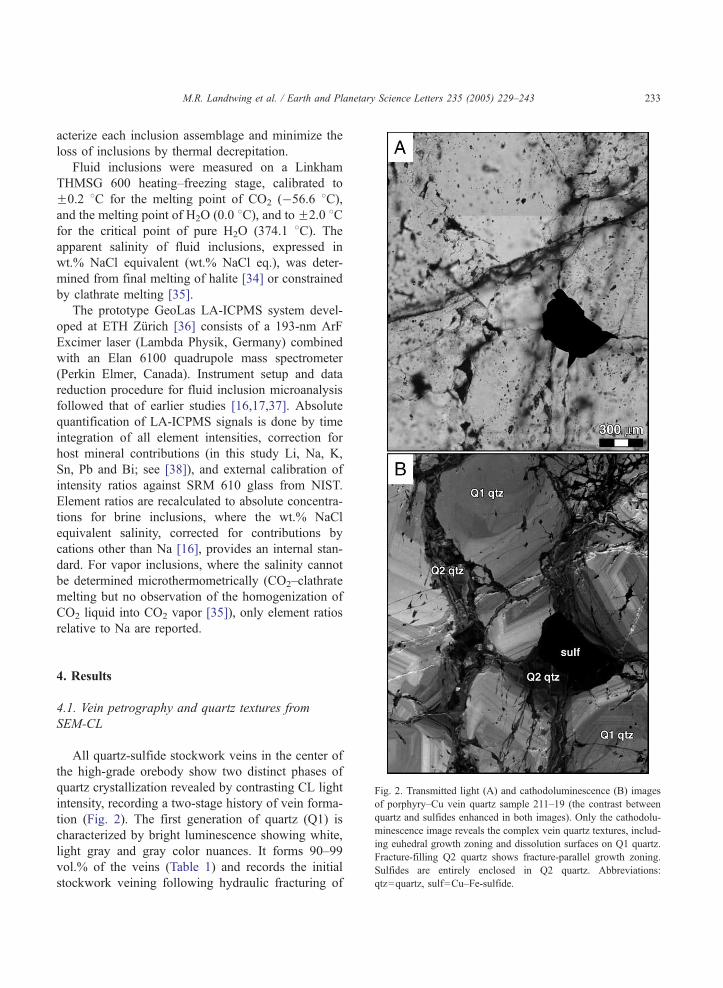
Fig. 2. Transmitted light (A) and cathodoluminescence (B) images
of porphyry–Cu vein quartz sample 211–19 (the contrast between
quartz and sulfides enhanced in both images). Only the cathodolu
minescence image reveals the complex vein quartz textures, includ
ing euhedral growth zoning and dissolution surfaces on Q1 quartz
Fracture-filling Q2 quartz shows fracture-parallel growth zoning
Sulfides are entirely enclosed in Q2 quartz. Abbreviations
qtz=quartz, sulf=Cu–Fe-sulfide.
4. Results
4.1. Vein petrography and quartz textures from
SEM-CL
All quartz-sulfide stockwork veins in the center of
the high-grade orebody show two distinct phases of
quartz crystallization revealed by contrasting CL light
intensity, recording a two-stage history of vein forma-
tion (Fig. 2). The first generation of quartz (Q1) is
characterized by bright luminescence showing white,
light gray and gray color nuances. It forms 90–99
vol.% of the veins (Table 1) and records the initial
stockwork veining following hydraulic fracturing of
-
-
.
.
:
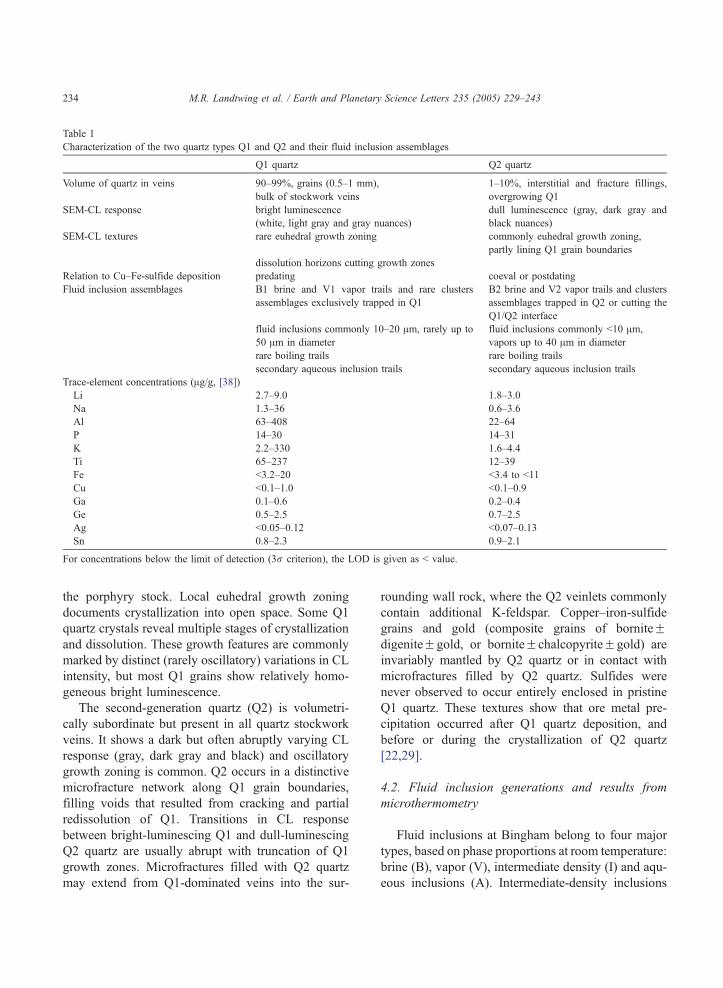
Table 1
Characterization of the two quartz types Q1 and Q2 and their fluid inclusion assemblages
Q1 quartz Q2 quartz
Volume of quartz in veins 90–99%, grains (0.5–1 mm),
bulk of stockwork veins
1–10%, interstitial and fracture fillings,
overgrowing Q1
SEM-CL response bright luminescence
(white, light gray and gray nuances)
dull luminescence (gray, dark gray and
black nuances)
SEM-CL textures rare euhedral growth zoning commonly euhedral growth zoning,
partly lining Q1 grain boundaries
dissolution horizons cutting growth zones
Relation to Cu–Fe-sulfide deposition predating coeval or postdating
Fluid inclusion assemblages B1 brine and V1 vapor trails and rare clusters B2 brine and V2 vapor trails and clusters
assemblages exclusively trapped in Q1 assemblages trapped in Q2 or cutting the
Q1/Q2 interface
fluid inclusions commonly 10–20 Am, rarely up to
50 Am in diameter
fluid inclusions commonly b10 Am,
vapors up to 40 Am in diameter
rare boiling trails rare boiling trails
secondary aqueous inclusion trails secondary aqueous inclusion trails
Trace-element concentrations (Ag/g, [38])Li 2.7–9.0 1.8–3.0
Na 1.3–36 0.6–3.6
Al 63–408 22–64
P 14–30 14–31
K 2.2–330 1.6–4.4
Ti 65–237 12–39
Fe b3.2–20 b3.4 to b11
Cu b0.1–1.0 b0.1–0.9
Ga 0.1–0.6 0.2–0.4
Ge 0.5–2.5 0.7–2.5
Ag b0.05–0.12 b0.07–0.13
Sn 0.8–2.3 0.9–2.1
For concentrations below the limit of detection (3r criterion), the LOD is given as b value.
M.R. Landtwing et al. / Earth and Planetary Science Letters 235 (2005) 229–243234
the porphyry stock. Local euhedral growth zoning
documents crystallization into open space. Some Q1
quartz crystals reveal multiple stages of crystallization
and dissolution. These growth features are commonly
marked by distinct (rarely oscillatory) variations in CL
intensity, but most Q1 grains show relatively homo-
geneous bright luminescence.
The second-generation quartz (Q2) is volumetri-
cally subordinate but present in all quartz stockwork
veins. It shows a dark but often abruptly varying CL
response (gray, dark gray and black) and oscillatory
growth zoning is common. Q2 occurs in a distinctive
microfracture network along Q1 grain boundaries,
filling voids that resulted from cracking and partial
redissolution of Q1. Transitions in CL response
between bright-luminescing Q1 and dull-luminescing
Q2 quartz are usually abrupt with truncation of Q1
growth zones. Microfractures filled with Q2 quartz
may extend from Q1-dominated veins into the sur-
rounding wall rock, where the Q2 veinlets commonly
contain additional K-feldspar. Copper–iron-sulfide
grains and gold (composite grains of borniteFdigeniteFgold, or borniteFchalcopyriteFgold) are
invariably mantled by Q2 quartz or in contact with
microfractures filled by Q2 quartz. Sulfides were
never observed to occur entirely enclosed in pristine
Q1 quartz. These textures show that ore metal pre-
cipitation occurred after Q1 quartz deposition, and
before or during the crystallization of Q2 quartz
[22,29].
4.2. Fluid inclusion generations and results from
microthermometry
Fluid inclusions at Bingham belong to four major
types, based on phase proportions at room temperature:
brine (B), vapor (V), intermediate density (I) and aqu-
eous inclusions (A). Intermediate-density inclusions
M.R. Landtwing et al. / Earth and Planetary Science Letters 235 (2005) 229–243 235
contain a large (30–50 vol.%) bubble with or without
small opaque or highly refractive transparent crystals,
but no halite; they are restricted to the deep part of the
Bingham system, several hundred meters beneath the
high-grade ore zone sampled here (Fig. 1; [22]). Inter-
mediate-density inclusions are not considered further
here, nor the subordinate aqueous inclusions (two
phase, 20–30 vol.% liquid at room temperature, appar-
ent salinity=7.1F1.6 wt.% NaCl eq., total homogeni-
zation temperature Th(tot)=318F5 8C), which postdateore formation (inferred from crosscutting relations with
B, V, and I inclusions). Brine and vapor inclusions are
associated with the process of stockwork veining and
porphyry–Cu–Au mineralization. Their published
apparent salinities and total homogenization tempera-
tures show a wide range (e.g., [14,22,39]) and thus
warrant a more detailed investigation.
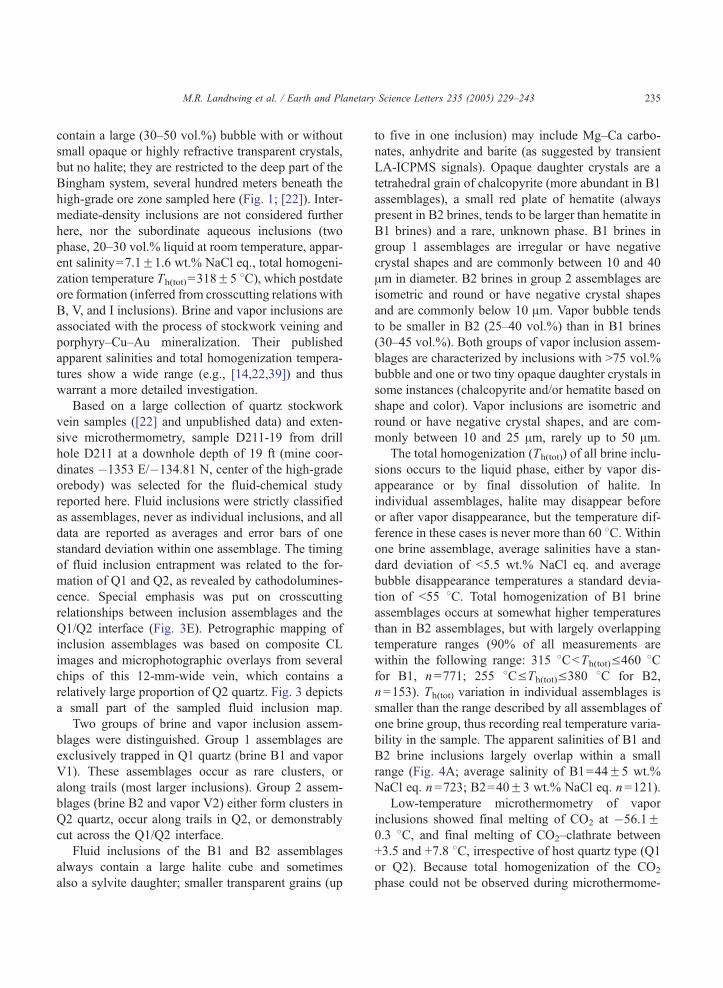
Based on a large collection of quartz stockwork
vein samples ([22] and unpublished data) and exten-
sive microthermometry, sample D211-19 from drill
hole D211 at a downhole depth of 19 ft (mine coor-
dinates �1353 E/�134.81 N, center of the high-grade
orebody) was selected for the fluid-chemical study
reported here. Fluid inclusions were strictly classified
as assemblages, never as individual inclusions, and all
data are reported as averages and error bars of one
standard deviation within one assemblage. The timing
of fluid inclusion entrapment was related to the for-
mation of Q1 and Q2, as revealed by cathodolumines-
cence. Special emphasis was put on crosscutting
relationships between inclusion assemblages and the
Q1/Q2 interface (Fig. 3E). Petrographic mapping of
inclusion assemblages was based on composite CL
images and microphotographic overlays from several
chips of this 12-mm-wide vein, which contains a
relatively large proportion of Q2 quartz. Fig. 3 depicts
a small part of the sampled fluid inclusion map.
Two groups of brine and vapor inclusion assem-
blages were distinguished. Group 1 assemblages are
exclusively trapped in Q1 quartz (brine B1 and vapor
V1). These assemblages occur as rare clusters, or
along trails (most larger inclusions). Group 2 assem-
blages (brine B2 and vapor V2) either form clusters in
Q2 quartz, occur along trails in Q2, or demonstrably
cut across the Q1/Q2 interface.
Fluid inclusions of the B1 and B2 assemblages
always contain a large halite cube and sometimes
also a sylvite daughter; smaller transparent grains (up
to five in one inclusion) may include Mg–Ca carbo-
nates, anhydrite and barite (as suggested by transient
LA-ICPMS signals). Opaque daughter crystals are a
tetrahedral grain of chalcopyrite (more abundant in B1
assemblages), a small red plate of hematite (always
present in B2 brines, tends to be larger than hematite in
B1 brines) and a rare, unknown phase. B1 brines in
group 1 assemblages are irregular or have negative
crystal shapes and are commonly between 10 and 40
Am in diameter. B2 brines in group 2 assemblages are
isometric and round or have negative crystal shapes
and are commonly below 10 Am. Vapor bubble tends
to be smaller in B2 (25–40 vol.%) than in B1 brines
(30–45 vol.%). Both groups of vapor inclusion assem-
blages are characterized by inclusions with N75 vol.%
bubble and one or two tiny opaque daughter crystals in
some instances (chalcopyrite and/or hematite based on
shape and color). Vapor inclusions are isometric and
round or have negative crystal shapes, and are com-
monly between 10 and 25 Am, rarely up to 50 Am.
The total homogenization (Th(tot)) of all brine inclu-
sions occurs to the liquid phase, either by vapor dis-
appearance or by final dissolution of halite. In
individual assemblages, halite may disappear before
or after vapor disappearance, but the temperature dif-
ference in these cases is never more than 60 8C. Within
one brine assemblage, average salinities have a stan-
dard deviation of b5.5 wt.% NaCl eq. and average
bubble disappearance temperatures a standard devia-
tion of b55 8C. Total homogenization of B1 brine
assemblages occurs at somewhat higher temperatures
than in B2 assemblages, but with largely overlapping
temperature ranges (90% of all measurements are
within the following range: 315 8CbTh(tot)V460 8Cfor B1, n=771; 255 8CVTh(tot)V380 8C for B2,
n=153). Th(tot) variation in individual assemblages is
smaller than the range described by all assemblages of
one brine group, thus recording real temperature varia-
bility in the sample. The apparent salinities of B1 and
B2 brine inclusions largely overlap within a small
range (Fig. 4A; average salinity of B1=44F5 wt.%
NaCl eq. n=723; B2=40F3 wt.% NaCl eq. n=121).
Low-temperature microthermometry of vapor
inclusions showed final melting of CO2 at �56.1F0.3 8C, and final melting of CO2–clathrate between
+3.5 and +7.8 8C, irrespective of host quartz type (Q1or Q2). Because total homogenization of the CO2
phase could not be observed during microthermome-
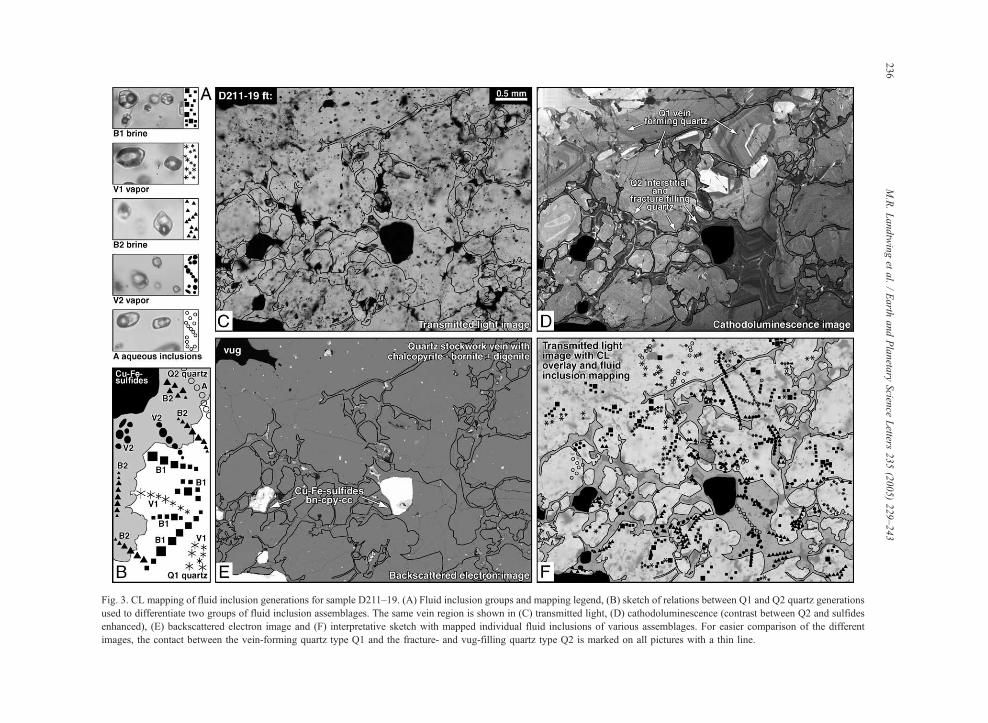
Fig. 3. CL mapping of fluid inclusion generations for sample D211–19. (A) Fluid inclusion groups and mapping legend, (B) sketch of relations between Q1 and Q2 quartz generations
used to differentiate two groups of fluid inclusion assemblages. The same vein region is shown in (C) transmitted light, (D) cathodoluminescence (contrast between Q2 and sulfides
enhanced), (E) backscattered electron image and (F) interpretative sketch with mapped individual fluid inclusions of various assemblages. For easier comparison of the different
images, the contact between the vein-forming quartz type Q1 and the fracture- and vug-filling quartz type Q2 is marked on all pictures with a thin line.
M.R.Landtwinget
al./Earth
andPlaneta
ryScien
ceLetters
235(2005)229–243
236
40
45
wt-%NaCl eq.
X [µg/g]
X / Na
300
350
400Th(tot) [
oC]
10-3
10-2
10-1
1
10-5
10-4
10-3
10-2
10-1
1
10
102
103
104
105
10
102
103
104
NaKFe
Fe
Mg
Mg
Mn
KK
Rb
AgAg
Sr
Cu
Cu
PbPbZn
Zn
Mo Mo
Bi Bi
BiBi
FeFe
Mg
Mg
MnMn
Rb
Rb
Cu
CuPb
Pb
AgAg
ZnZn
Mo
B1 B2
Number of measurements per assemblage5 3 1 1 5 2 2 2 4 25 1 4 3 3 2 1 11 5 5
V1 V2
Number of measurements per assemblage22 3 13 12 110 315 1 6
Ca CaSr
Sr
A - brine assemblages
B - vapor assemblages
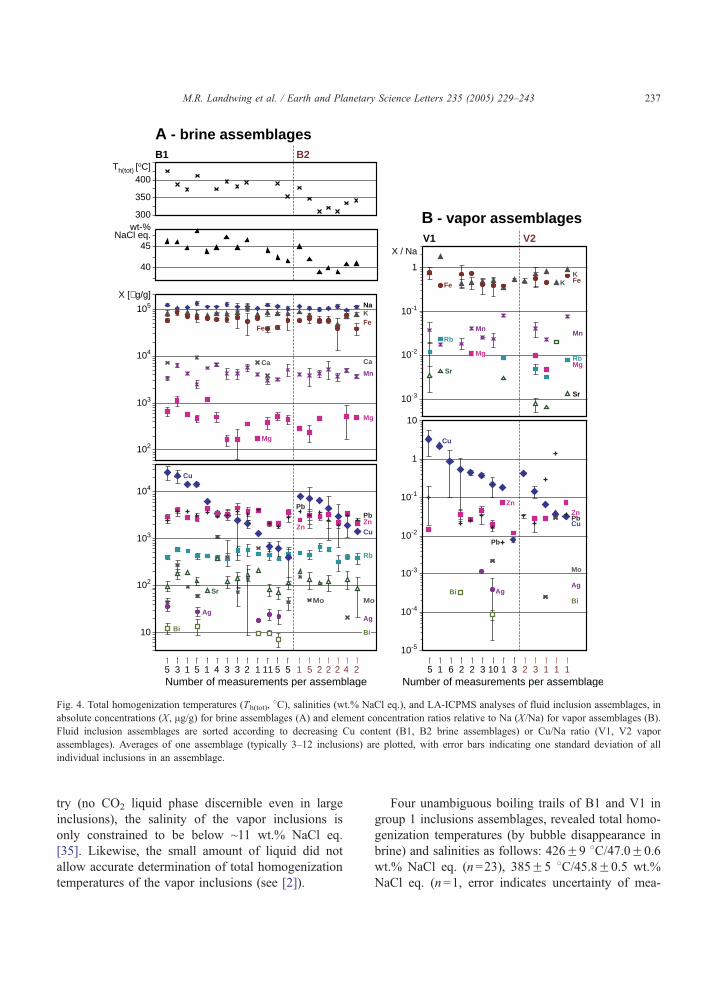
Fig. 4. Total homogenization temperatures (Th(tot), 8C), salinities (wt.% NaCl eq.), and LA-ICPMS analyses of fluid inclusion assemblages, in
absolute concentrations (X, Ag/g) for brine assemblages (A) and element concentration ratios relative to Na (X/Na) for vapor assemblages (B).
Fluid inclusion assemblages are sorted according to decreasing Cu content (B1, B2 brine assemblages) or Cu/Na ratio (V1, V2 vapor
assemblages). Averages of one assemblage (typically 3–12 inclusions) are plotted, with error bars indicating one standard deviation of all
individual inclusions in an assemblage.
M.R. Landtwing et al. / Earth and Planetary Science Letters 235 (2005) 229–243 237
try (no CO2 liquid phase discernible even in large
inclusions), the salinity of the vapor inclusions is
only constrained to be below ~11 wt.% NaCl eq.
[35]. Likewise, the small amount of liquid did not
allow accurate determination of total homogenization
temperatures of the vapor inclusions (see [2]).
Four unambiguous boiling trails of B1 and V1 in
group 1 inclusions assemblages, revealed total homo-
genization temperatures (by bubble disappearance in
brine) and salinities as follows: 426F9 8C/47.0F0.6
wt.% NaCl eq. (n=23), 385F5 8C/45.8F0.5 wt.%
NaCl eq. (n=1, error indicates uncertainty of mea-
2 http: / /www.elsevier.nl/ locate/epsl; mirror site:http: / /www
elsevier.com/locate/epsl.
10
102
103
104
105
100 200 300 400 500 600 700 800 900
Intermediate density inclusions
Input ore fluid
Spent ore fluid
Vapor inclusions
Brine inclusions
B2 brine assemblagesB1 brine assemblages
T, [°C]
Cu,
[µg/
g]
Tem
pera
ture
-tre
nd o
fch
alco
pyri
te s
olub
ility
FLUIDSATURA-TION INMAGMACHAM-
BER
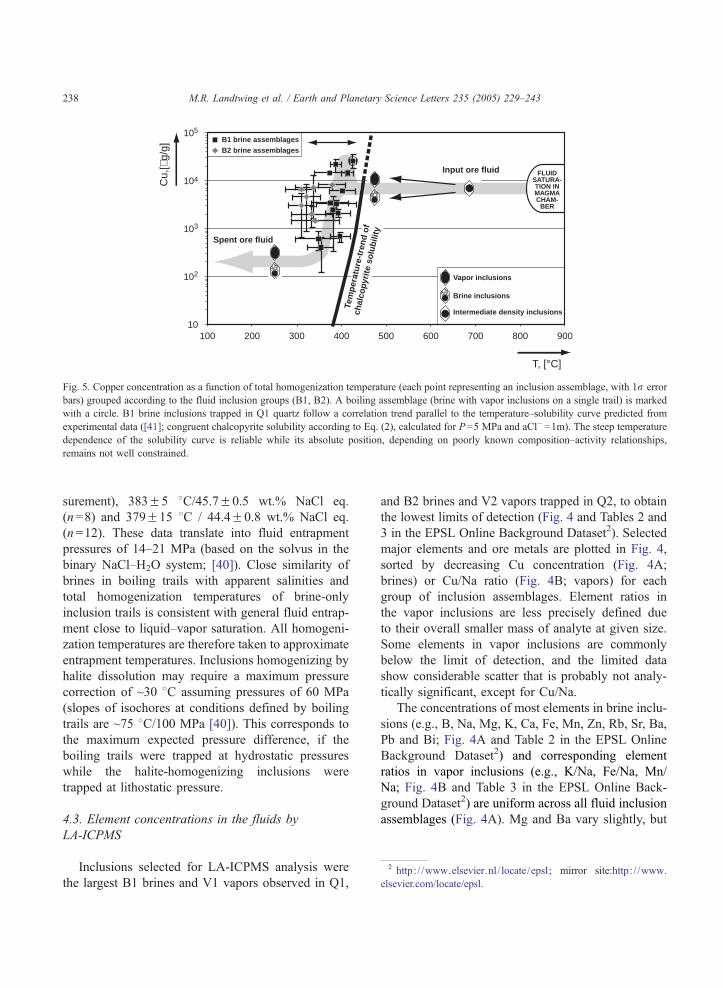
Fig. 5. Copper concentration as a function of total homogenization temperature (each point representing an inclusion assemblage, with 1r error
bars) grouped according to the fluid inclusion groups (B1, B2). A boiling assemblage (brine with vapor inclusions on a single trail) is marked
with a circle. B1 brine inclusions trapped in Q1 quartz follow a correlation trend parallel to the temperature–solubility curve predicted from
experimental data ([41]; congruent chalcopyrite solubility according to Eq. (2), calculated for P=5 MPa and aCl�=1m). The steep temperature
dependence of the solubility curve is reliable while its absolute position, depending on poorly known composition–activity relationships,
remains not well constrained.
M.R. Landtwing et al. / Earth and Planetary Science Letters 235 (2005) 229–243238
surement), 383F5 8C/45.7F0.5 wt.% NaCl eq.
(n=8) and 379F15 8C / 44.4F0.8 wt.% NaCl eq.
(n=12). These data translate into fluid entrapment
pressures of 14–21 MPa (based on the solvus in the
binary NaCl–H2O system; [40]). Close similarity of
brines in boiling trails with apparent salinities and
total homogenization temperatures of brine-only
inclusion trails is consistent with general fluid entrap-
ment close to liquid–vapor saturation. All homogeni-
zation temperatures are therefore taken to approximate
entrapment temperatures. Inclusions homogenizing by
halite dissolution may require a maximum pressure
correction of ~30 8C assuming pressures of 60 MPa
(slopes of isochores at conditions defined by boiling
trails are ~75 8C/100 MPa [40]). This corresponds to
the maximum expected pressure difference, if the
boiling trails were trapped at hydrostatic pressures
while the halite-homogenizing inclusions were
trapped at lithostatic pressure.
4.3. Element concentrations in the fluids by
LA-ICPMS
Inclusions selected for LA-ICPMS analysis were
the largest B1 brines and V1 vapors observed in Q1,
and B2 brines and V2 vapors trapped in Q2, to obtain
the lowest limits of detection (Fig. 4 and Tables 2 and
3 in the EPSL Online Background Dataset2). Selected
major elements and ore metals are plotted in Fig. 4,
sorted by decreasing Cu concentration (Fig. 4A;
brines) or Cu/Na ratio (Fig. 4B; vapors) for each
group of inclusion assemblages. Element ratios in
the vapor inclusions are less precisely defined due
to their overall smaller mass of analyte at given size.
Some elements in vapor inclusions are commonly
below the limit of detection, and the limited data
show considerable scatter that is probably not analy-
tically significant, except for Cu/Na.
The concentrations of most elements in brine inclu-
sions (e.g., B, Na, Mg, K, Ca, Fe, Mn, Zn, Rb, Sr, Ba,
Pb and Bi; Fig. 4A and Table 2 in the EPSL Online
Background Dataset2) and corresponding element
ratios in vapor inclusions (e.g., K/Na, Fe/Na, Mn/
Na; Fig. 4B and Table 3 in the EPSL Online Back-
ground Dataset2) are uniform across all fluid inclusion
assemblages (Fig. 4A). Mg and Ba vary slightly, but
.

M.R. Landtwing et al. / Earth and Planetary Science Letters 235 (2005) 229–243 239
Cu varies by more than two orders of magnitude in
both inclusion groups. The B1 brine inclusions span
the greatest range of Cu contents, with very high
average concentrations of 26,000 Ag/g (2.6 wt.%) in
some assemblages down to 400 Ag/g in others. Spa-
tially associated V1 vapor inclusions have Cu/Na
ratios up to 3.4 in some assemblages, probably corre-
sponding to several wt.% Cu in these low-density
fluids. Brine inclusions of the later B2 group have
intermediate and more constant Cu concentrations,
between 8100 and 1450 Ag/g. V2 inclusions have
Cu/Na ratios ranging from 0.43 to ~0.03.
Fig. 5 correlates the copper content of individual
fluid inclusion assemblages of the two groups, B1 and
B2 assemblages, with total homogenization tempera-
tures, documenting an amazingly systematic trend. B1
fluid inclusions define a distinctive correlation of
copper contents decreasing over two orders of magni-
tude within a small temperature interval (425–350
8C). This inclusion trend is parallel to the chalcopyrite
solubility curve calculated by Hezarkhani et al. [41],
showing the strong temperature dependence of Cu
concentration measured in chloride-bearing liquids.
B2 brines have overall lower temperatures but more
constant Cu concentrations.
5. Interpretation: fluid evolution and
Cu–Fe-sulfide deposition
The Cu–Fe-sulfide mineralized quartz veins in the
high-grade center of the Bingham porphyry–Cu–Au
deposit experienced a complex textural history span-
ning a large temperature range [14,22,39]. However,
fluid compositions documented in this study remained
essentially constant with respect to total salinity and
the concentrations of all major and trace cations,
except for significant and systematic variation in Cu
content. Cu concentrations dropped over more than
two orders of magnitude and correlate within a narrow
temperature interval. We conclude from these and
textural observations in many other samples [22]
that the main phase of ore formation in the quartz
monzonite porphyry was driven by a single source of
magmatic–hydrothermal fluid of essentially constant
input composition, which ascended through the vein
network and precipitated Cu–Fe-sulfide by fluid cool-
ing. Different aliquots of a two-phase mixture of
liquid (brine) and vapor were trapped at slightly dif-
ferent times, temperatures and degrees of Cu depletion
in the B1 and V1 inclusion assemblages.
Our texturally controlled fluid inclusion data indi-
cate that the high-grade Cu–Au orebody at Bingham
formed by bornite and chalcopyrite deposition
between 425 and 350 8C at estimated pressures of
about 21–14 MPa, corresponding to 1.4–2.1 km paleo-
depth at cold hydrostatic conditions. These estimated
P–T conditions are in the region of retrograde tem-
perature dependence of quartz solubility (e.g., [42]),
which explains the textural break in vein evolution by
quartz dissolution between the deposition of Q1 and
Q2 quartz. Conditions are also near the ductile to
brittle transition of quartz–feldspar-rich rocks, where
magmatic fluids are most likely to change from litho-
static to hydrostatic pressure (e.g., [42]) and cool as a
result of adiabatic expansion. On the sample scale,
these P–T changes cause abundant microfracturing
and fluid entrapment in otherwise undisturbed earlier
Q1 quartz, with the result that nearly all inclusions in
the analyzed sample and the great majority of fluid
inclusions in other samples from the center of the
orebody record temperatures in the vicinity of 400
8C. On the larger scale of the entire porphyry system,
steep gradients in temperature, pressure and fluid den-
sity in this P–T region exert a positive feedback of vein
reactivation and the generation of secondary perme-
ability, further enhancing focused fluid flux and metal
advection into the orebody.
The B1 brines are interpreted to postdate Q1
growth and to be trapped during this microfracturing
event. Thus, they record the process of copper deposi-
tion while no quartz was precipitating. The steep drop
in copper concentration by more than two orders of
magnitude (Fig. 5) indicates that more than 99% of
the original Cu in the incoming fluid was deposited
over the small temperature interval between 425 and
350 8C. Incoming fluids may have been a little lower
in Cu concentration than the maximum recorded by
B1 brine inclusions, because slightly hotter input fluid
batches would lead to local dissolution of Cu–Fe-
sulfide grains precipitated by slightly cooler, earlier
fluid batches. This may explain the extreme Cu con-
tents of some B1 inclusion assemblages, which are
higher than in any other ore fluids we analyzed so far.
B2 brines in Q2 quartz formed after the main
mineralizing event. They were trapped during or
M.R. Landtwing et al. / Earth and Planetary Science Letters 235 (2005) 229–243240
after renewed quartz crystallization, at temperatures
about 70 8C cooler on average. Fluids belonging to
this stage may have been trapped as secondary inclu-
sions in Q1 quartz and in this case would have been
classified as B1. However, the clear correlation
between copper concentrations and Th(tot) for B1
fluid inclusion assemblages (Fig. 5) indicates that
such misclassification in the assemblages chosen for
analysis was not significant. The observation that their
copper content is not much lower than that of most B1
brines and shows no correlation with Th(tot), is inter-
preted to reflect local variation in other fluid-chemical
parameters, controlled by fluid-mineral equilibria at
the pore or microcrack scale. Relatively high Cu
concentrations despite low temperatures are expected
in essentially stagnant pore fluids in contact with
quartz and Cu–Fe-sulfide, if they become depleted
in H2S due to sulfide precipitation from ore fluids
with an initial metal excess, or if their pH falls to low
values due to cooling of fluids in isolation from acid-
neutralizing feldspar.
The correlation between the total homogenization
temperature and copper content can be demonstrated
with the brine inclusions but not in the coeval vapor
inclusions, because Th(tot) of the latter cannot be mea-
sured with useful precision. However, the Cu/Na
ratios of vapor inclusions records a similar range
(from initial Cu/Na ratios of 3.4 dropping by more
than two orders of magnitude to 0.03, Fig. 4B and
Table 3 in the EPSL Online Background Dataset2),
despite overall different metal contents governed by
liquid/vapor partitioning [43]. The fluid-composi-
tional data thus imply that both the vapor and the
brine contributed to the precipitation of Cu–Fe-sul-
fides at Bingham.
Temperatures of ore-mineral precipitation defined
by texturally controlled inclusion analyses at Bingham
confirm the tentative conclusion from the first LA-
ICPMS study of fluid compositions from the Bajo de
la Alumbrera porphyry–Cu–Au deposit, Argentina
[8], where ore deposition occurred at temperatures
close to 400 8C, at much lower temperatures than
initial quartz veining and magnetite–K-feldspar–bio-
tite alteration. Hezarkhani et al. [41] predicted from
thermodynamic calculations that the bulk of chalco-
pyrite deposition at the Sungun porphyry Cu deposit
(Iran) occurred at 360F60 8C. These temperatures are
consistent with experimental solubility data (e.g.,
[44,45]), but lower than temperatures inferred for
Au-rich porphyry copper mineralization based on
mineral-compositional arguments [46].
Fluid cooling contributes to the precipitation of
Cu–Fe-sulfides not only through the temperature
dependence of congruent solubility equilibria, such
as (e.g., [44,47])
6CuCl�2 þ 6FeCl2 þ 11H2SðaqÞ þ SO2ðaqÞ¼ 6CuFeS2ðsÞ þ 6Cl� þ 18HCl þ 2H2O ð1Þ
30CuCl�2 þ 6FeCl2 þ 23H2SðaqÞ þ SO2ðaqÞ¼ 6Cu5FeS4ðsÞ þ 30Cl� þ 42HCl þ 2H2O ð2Þ
but also by the generation of H2S by disproportiona-
tion of SO2 upon cooling (e.g., [48]).
4SO2 þ 4H2O ¼ H2S þ 3H2SO4 ð3Þ
Compared with the overall effect of fluid cooling,
other factors were probably of secondary importance
in precipitating Cu–Fe-sulfides at Bingham, and
probably in other porphyry-type deposits containing
bornite and chalcopyrite in ore associated with potas-
sic alteration. K-feldspar–biotite alteration influences
ore fluid chemistry in the larger scale hydrothermal
system, but it is so pervasive that it could not gen-
erate chemical gradients promoting copper deposi-
tion at the sharp base of the high-grade orebody at
Bingham (Fig. 1). Moreover, published mass-balance
estimates [49] indicate that potassic alteration pro-
duces rather than consumes HCl and, therefore, does
not promote sulfide saturation by acid-producing
reactions (Eqs. (1)–(3)). Thus, potassic alteration
and sulfide deposition are a common consequence
of magmatic fluid cooling, rather than alteration
being a chemical driving force for copper deposition.
Fluid phase separation certainly had an effect on the
large-scale thermal structure of the hydrothermal
system, by adiabatic cooling of the ascending ore
fluids. It did not directly control Cu–Fe-sulfide pre-
cipitation, however, because the sharp base of the
high-grade orebody does not coincide with the tran-
sition from intermediate-density inclusions at depth
to the overlying region where brine and vapor inclu-
sions coexist (Fig. 1)). Likewise, there is no evidence
for incursion of meteoric water during or even after
B1 fluid introduction.
M.R. Landtwing et al. / Earth and Planetary Science Letters 235 (2005) 229–243 241
6. Conclusions and implications for porphyry–Cu
ore formation
Quantitative data on the fluid-chemical evolution at
Bingham demonstrate that fluid cooling across a nar-
row temperature interval (425–350 8C) is primarily
responsible for the formation of this giant porphyry-
type ore deposit. This interval is characterized by
steep normal temperature dependence of Cu–Fe-solu-
bility but reverse temperature dependence of quartz
solubility, the main gangue mineral. Quartz dissolu-
tion facilitates advection of metal-bearing fluids along
the existing stockwork vein network, where ore
metals precipitate in response to fluid cooling in a
confined rock volume. The contrasting solubility
behavior of quartz and sulfides thus creates ideal
conditions for metal enrichment in this particular P–
T window.
Our results imply that the total tonnage of Cu
eventually contained in a porphyry deposit is primar-
ily determined by the amount of Cu in the starting
fluid and the total quantity of magmatic fluid available
over the lifetime of the hydrothermal system. Both
parameters are ultimately controlled by the dimension
of, and processes within, the subjacent magma cham-
ber, acting as the source of ore-forming hydrothermal
fluid. Thus, the amount of accumulated ore metal
depends on the Cu content of the magma, the degree
to which Cu partitions into the exsolving fluid, and
the absolute amount of fluid exsolved from a large
magma reservoir.
Ore grade, by contrast, strongly depends on metal
precipitation mechanisms. The results presented here
imply that copper precipitation efficiency is controlled
primarily by the thermal structure of the fluid flow
system. To enhance the enrichment of high Cu con-
centrations in a confined high-grade orebody, a large
amount of metal-bearing fluid must be cooled while it
is flowing through a finite rock mass maintaining an
almost steady-state temperature distribution. It is
probably no coincidence that the exceptionally high-
grade orebody at Bingham also has an exceptionally
sharp lower boundary and well-developed ore metal
zonation (Fig. 1; [22]). The conspicuously sharp base
of the Bingham orebody is likely to represent a copper
sulfide saturation horizon that, according to our fluid
inclusion data, corresponds to a near-isothermal sur-
face kept in place for considerable time while mag-
matic fluids ascended through the quartz monzonite
porphyry. This requires a steady-state balance
between heat advection by the magmatic fluid and
heat loss by adiabatic cooling and conduction into the
adjacent rocks. The physical mechanisms of cooling a
large focused fluid flux is not yet understood but will
be a key to the formation of a high-grade porphyry
copper deposit.
Acknowledgements
This paper would not have been possible without
the logistical support of Kennecott Utah Copper, and
we especially thank Geoff Ballantyne, Charlie Phil-
lips, Ed Harrison, Tracy Smith and Gerry Austin.
Special thanks go to Esra Inan from Stanford Uni-
versity who helped in the field and laboratory at
Stanford and to J. Reynolds who advised us in the
early stages of the fluid inclusion study. Support from
the electron microscopy group at ETH Honggerberg is
gratefully acknowledged. This project was supported
by ETH Project Grant 0-20663-99, the Paul Niggli
Foundation, and the Mudd and Lockey Funds at the
Department of Geological and Environmental
Sciences at Stanford.
Appendix A. Supplementary Data
Supplementary data associated with this article can
be found, in the online version, at doi:10.1016/
j.epsl.2005.02.046.
References
[1] R.H. Sillitoe, Tops and bottoms of porphyry copper deposits,
Econ. Geol. 68 (6) (1973) 799–815.
[2] R.J. Bodnar, Fluid-inclusion evidence for a magmatic source
of metals in porphyry copper deposits, in: J.F.H. Thompson
(Ed.), Magmas, Fluids and Ore Deposits, Mineralogical
Association of Canada Short Course Series, vol. 23, 1995,
pp. 139–152.
[3] A. Audetat, T. Pettke, The magmatic–hydrothermal evolution
of two barren granites: a melt and fluid inclusion study of the
Rito del Medio and Canada Pinabete plutons in northern New
Mexico (USA), Geochim. Cosmochim. Acta 67 (1) (2003)
97–121.
M.R. Landtwing et al. / Earth and Planetary Science Letters 235 (2005) 229–243242
[4] W.E. Halter, T. Pettke, C.A. Heinrich, The origin of Cu/Au
ratios in porphyry-type ore deposits, Science 296 (5574)
(2002) 1844–1846.
[5] W.E. Halter, C.A. Heinrich, T. Pettke, Laser-ablation ICP-
MS analysis of silicate and sulfide melt inclusions in an
andesitic complex II: evidence for magma mixing and
magma chamber evolution, Contrib. Mineral. Petrol. 147
(2004) 397–412.
[6] C.W. Burnham, H. Ohmoto, Late-stage processes of felsic
magmatism, in: S. Ishihara, S. Takenouchi (Eds.), Granitic
Magmatism and Related Mineralization, Society of Resource
Geologists of Japan 8, Tokyo, 1980, pp. 1–11.
[7] J.D. Lowell, J.M. Guilbert, Lateral and vertical alteration–
mineralization zoning in porphyry ore deposits, Econ. Geol.
65 (4) (1970) 373–408.
[8] T. Ulrich, D. Gunther, C.A. Heinrich, The evolution of a
porphyry Cu–Au deposit, based on LA-ICP-MS analysis of
fluid inclusions: Bajo de la Alumbrera, Argentina (corrected
version of Econ. Geol. 96 (8) (2001) 1743–1774), Econ. Geol.
97(8) (2002) 1888–1920.
[9] R.W. Henley, A. McNabb, Magmatic vapor plumes and
groundwater interaction in porphyry copper emplacement,
Econ. Geol. 73 (1) (1978) 1–20.
[10] L.B. Gustafson, J.P. Hunt, Porphyry copper-deposit at El-
Salvador, Chile, Econ. Geol. 70 (5) (1975) 857–912.
[11] J.W. Hedenquist, A. Arribas, T.J. Reynolds, Evolution of an
intrusion-centered hydrothermal system: far Southeast-
Lepanto porphyry and epithermal Cu–Au deposits, Philip-
pines, Econ. Geol. 93 (4) (1998) 373–404.
[12] T.J. Reynolds, R.E. Beane, Evolution of hydrothermal fluid
characteristics at the Santa-Rita, New-Mexico, porphyry cop-
per-deposit, Econ. Geol. 80 (5) (1985) 1328–1347.
[13] A. Hezarkhani, A.E. Williams-Jones, Controls of alteration
and mineralization in the Sungun porphyry copper deposit,
Iran: evidence from fluid inclusions and stable isotopes, Econ.
Geol. 93 (5) (1998) 651–670.
[14] E. Roedder, Fluid inclusion studies on porphyry-type ore
deposits at Bingham, Utah, Butte, Montana, and Climax,
Colorado, Econ. Geol. 66 (1) (1971) 98–120.
[15] C.J. Eastoe, A fluid inclusion study of the Panguna porphyry
copper deposit Bougainville, Papua New Guinea, Econ. Geol.
73 (4) (1978) 721–748.
[16] C.A. Heinrich, T. Pettke, W.E. Halter, M. Aigner-Torres, A.
Audetat, D. Gunther, et al., Quantitative multi-element analy-
sis of minerals, fluid and melt inclusions by laser-ablation
inductively coupled plasma–mass spectrometry, Geochim.
Cosmochim. Acta 67 (18) (2003) 3473–3497.
[17] D. Gunther, A. Audetat, R. Frischknecht, C.A. Heinrich,
Quantitative analysis of major, minor and trace elements in
fluid inclusions using laser ablation inductively coupled
plasma mass spectrometry, J. Anal. At. Spectrom. 13 (4)
(1998) 263–270.
[18] A. Audetat, D. Gunther, C.A. Heinrich, Causes for large-scale
metal zonation around mineralized plutons: fluid inclusion
LA-ICP-MS evidence from the Mole Granite, Australia,
Econ. Geol. 95 (8) (2000) 1563–1581.
[19] A. Audetat, D. Gunther, C.A. Heinrich, Formation of a mag-
matic-hydrothermal ore deposit: insights with LA-ICP-MS
analysis of fluid inclusions, Science 279 (5359) (1998)
2091–2094.
[20] B. Rusk, M. Reed, Scanning electron microscope-cathodolu-
minescence analysis of quartz reveals complex growth his-
tories in veins from the Butte porphyry copper deposit,
Montana, Geology 30 (8) (2002) 727–730.
[21] S.C. Penniston-Dorland, Illumination of vein quartz textures in
a porphyry copper ore deposit using scanned cathodolumines-
cence: Grasberg Igneous Complex, Irian Jaya, Indonesia, Am.
Mineral. 86 (5–6) (2001) 652–666.
[22] P.B. Redmond, M.T. Einaudi, E.E. Inan, M.R. Landtwing,
C.A. Heinrich, Copper ore formation by fluid cooling in
porphyry copper deposits: new insights from cathodolumines-
cence petrography combined with fluid inclusion microther-
mometry, Geology 32 (3) (2004) 217–220.
[23] M.C. Boiron, S. Essarraj, E. Sellier, M. Cathelineau, M.
Lespinasse, B. Poty, Identification of fluid inclusions in rela-
tion to their host microstructural domains in quartz by cath-
odoluminescence, Geochim. Cosmochim. Acta 56 (1) (1992)
175–185.
[24] J. Parnell, G. Earls, J.J. Wilkinson, D.H.W. Hutton, A.J.
Boyce, A.E. Fallick, R.M. Ellam, S.A. Gleeson, N.R. Moles,
P.F. Carey, I. Legg, Regional fluid flow and gold mineraliza-
tion in the Dalradian of the Sperrin Mountains, northern Ire-
land, Econ. Geol. 95 (7) (2000) 1389–1416.
[25] J.J. Wilkinson, A.J. Boyce, G. Earls, A.E. Fallick, Gold remo-
bilization by low-temperature brines: evidence from the Cur-
raghinalt gold deposit, Northern Ireland, Econ. Geol. 94 (2)
(1999) 289–296.
[26] K.A. Krahulec, History and production of the West Mountain
(Bingham) mining district, Utah, in: D.A. John, G.H. Ballan-
tyne (Eds.), Geology and Ore Deposits of the Oquirrh and
Wasatch Mountains, Utah, Guidebook Series of the Society of
Economic Geologists, vol. 29, 1997, pp. 189–217.
[27] W.T. Parry, P.N. Wilson, D. Moser, M.T. Heizler, U–Pb dating
of zircon and 40Ar/39Ar dating of biotite at Bingham, Utah,
Econ. Geol. 96 (7) (2001) 1671–1683.
[28] G. Lanier, E.C. John, A.J. Swensen, J. Reid, C.E. Bard,
S.W. Caddey, J.C. Wilson, General geology of Bingham
Mine, Bingham Canyon, Utah, Econ. Geol. 73 (7) (1978)
1228–1241.
[29] P.B. Redmond, M.R. Landtwing, M.T. Einaudi, Cycles of
porphyry dike emplacement, veining, alteration and minerali-
zation in the Bingham porphyry Cu–Au–Mo deposit, Utah, in:
A. Piestrzynski, et al., (Eds.), Mineral Deposits at the Begin-
ning of the 21th Century, Society for Geology Applied to
Mineral Deposits (SGA), Joint 6th Biennial SGA-SEG Meet-
ing, Krakow, Poland, 2001, pp. 473–476.
[30] J.D. Keith, J.A. Whitney, K.H. Hattori, G.H. Ballantyne, E.H.
Christiansen, D.L. Barr, T.M. Cannan, C.J. Hook, The role of
magmatic sulfides and mafic alkaline magmas in the Bingham
and Tintic mining districts, Utah, J. Petrol. 38 (12) (1997)
1679–1690.
[31] C.H. Phillips, T.W. Smith, E.D. Harrison, Alteration, metal
zoning, and ore controls in the Bingham Canyon porphyry
copper deposits, Utah, in: D.A. John, G.H. Ballantyne (Eds.),
M.R. Landtwing et al. / Earth and Planetary Science Letters 235 (2005) 229–243 243
Geology and Ore Deposits of the Oquirrh and Wasatch Moun-
tains, Utah, Guidebook Series of the Society of Economic
Geologists, vol. 29, 1997, pp. 133–145.
[32] J.T. Chesley, J. Ruiz, Preliminary Re–Os dating on molybde-
nite mineralization from the Bingham Canyon porphyry cop-
per deposit, Utah, in: D.A. John, G.H. Ballantyne (Eds.),
Geology and Ore Deposits of the Oquirrh and Wasatch Moun-
tains, Utah, Guidebook Series of the Society of Economic
Geologists, vol. 29, 1997, pp. 165–169.
[33] R.H. Goldstein, T.J. Reynolds, Systematics of Fluid Inclusions
in Diagenetic Minerals, Society for Sedimentary Geology,
1994, 199 pp.
[34] J.R. Bodnar, M.O. Vityk, Interpretation of microthermo-
metric data for H2O–NaCl fluid inclusions, in: B. De
Vivo, M.L. Frezzotti (Eds.), Fluid Inclusions in Minerals,
1994, pp. 117–130.
[35] L.W. Diamond, Stability of CO2 clathrate hydrate+CO2
liquid+CO2 vapour+aqueous KCl–NaCl solutions—experi-
mental determination and application to salinity estimates of
fluid inclusions, Geochim. Cosmochim. Acta 56 (1) (1992)
273–280.
[36] D. Gunther, R. Frischknecht, C.A. Heinrich, H.J. Kahlert,
Capabilities of an argon fluoride 193 nm excimer laser for
laser ablation inductively coupled plasma mass spectrometry
microanalysis of geological materials, J. Anal. At. Spectrom.
12 (9) (1997) 939–944.
[37] T. Pettke, W.E. Halter, J.D. Webster, A. Aigner-Torres, C.A.
Heinrich, Accurate quantification of melt inclusion chemistry
by LA-ICPMS: a comparison with EMP and SIMS and advan-
tages and possible limitations of these methods, Lithos 78
(2004) 333–361.
[38] M.R. Landtwing, T. Pettke, Trace element concentrations of
hydrothermal vein quartz and its SEM–cathodoluminescence
response, Am. Mineral. 90 (2005) 122–131.
[39] W.J. Moore, J.T. Nash, Alteration and fluid inclusion studies
of the porphyry copper orebody at Bingham, Utah, Econ.
Geol. 69 (5) (1974) 631–645.
[40] T. Driesner, C.A. Heinrich, Accurate P–T–X–V–H correlations
for the system NaCl–H2O from 0 to 800 8C, 0 to 500 MPa and
0 to 1 XNaCl, Ecrofi XVIII Abstract Series 2, Acta Mineral.–
Petrol., Budapest, 2003, p. 55.
[41] A. Hezarkhani, A.E. Williams-Jones, C.H. Gammons, Factors
controlling copper solubility and chalcopyrite deposition in the
Sungun porphyry copper deposit, Iran, Miner. Depos. 34 (8)
(1999) 770–783.
[42] R.O. Fournier, Hydrothermal processes related to movement
of fluid from plastic into brittle rock in the magmatic–epither-
mal environment, Econ. Geol. 94 (8) (1999) 1193–1211.
[43] C.A. Heinrich, D. Gunther, A. Audetat, T. Ulrich, R. Frisch-
knecht, Metal fractionation between magmatic brine and
vapor, determined by microanalysis of fluid inclusions, Geol-
ogy 27 (8) (1999) 755–758.
[44] J.J. Hemley, G.L. Cygan, J.B. Fein, G.R. Robinson, W.M.
Dangelo, Hydrothermal ore-forming processes in the light
of studies in rock-buffered systems: 1. iron–copper–zinc–
lead sulfide solubility relations, Econ. Geol. 87 (1) (1992)
1–22.
[45] S.A. Wood, I.M. Samson, Solubility of ore minerals and
complexation of ore minerals in hydrothermal solutions, in:
J.P. Richards, P.B. Larson (Eds.), Techniques in Hydrother-
mal Ore Deposits Geology, Rev. Econ. Geol., vol. 10, 1998,
pp. 33–80.
[46] S.E. Kesler, S.L. Chryssoulis, G. Simon, Gold in porphyry
copper deposits: its abundance and fate, Ore Geol. Rev. 21 (1–
2) (2002) 103–124.
[47] Z.F. Xiao, C.H. Gammons, A.E. Williams-Jones, Experimental
study of copper(I) chloride complexing in hydrothermal solu-
tions at 40 to 300 8C and saturated water vapor pressure,
Geochim. Cosmochim. Acta 62 (17) (1998) 2949–2964.
[48] W.F. Giggenbach, SEG distinguished lecture–Magma degas-
sing and mineral deposition in hydrothermal systems along
convergent plate boundaries, Econ. Geol. 87 (7) (1992)
1927–1944.
[49] T. Ulrich, C.A. Heinrich, Geology and alteration geochemistry
of the porphyry Cu–Au deposit at Bajo de la Alumbrera,
Argentina (corrected version of Econ. Geol. 96(8) (2001)
1719–1742), Econ. Geol. 97(8) (2002) 1863–1888.