COPING WITH COVID-19 IN DIFFERING WAYS · March - April 2020 June 2020 Second Covid-19 wave with...
56
Allianz Research Global Economic Outlook July 2020 COPING WITH COVID-19 IN DIFFERING WAYS
Transcript of COPING WITH COVID-19 IN DIFFERING WAYS · March - April 2020 June 2020 Second Covid-19 wave with...

© Copyright Allianz
Allianz Research
Global Economic OutlookJuly 2020
COPING WITH
COVID-19 IN
DIFFERING
WAYS

© Copyright Allianz
01GLOBAL OUTLOOK

© Copyright Allianz 3
March - April 2020 June 2020
Second Covid-19 wave with targeted lockdowns by mid-2021 when a vaccine could be in place.
Haphazard opening in several emerging economies (India, Indonesia, Brazil, Mexico, Turkey,
South Africa) put them at high risk of policy mistake.
Confirmed, notably in the US and the weakest emerging markets.
Return to business as usual, beware of false starts: The global economy would operate at 70
to 80% capacity until Q4 2020.
Confirmed as confidence effects will remain impaired for longer.
Confirmed, supply chain disruptions.
A return to pre-crisis GDP levels by mid-2021: For the manufacturing and construction sectors
where social distancing is less of an issue the return was foreseen at the end of 2021 while the
services sector is was not expected until mid-2021.
Revised to Q4 2021 / Q4 2022 depending on the economy. Trade
will take a few more quarters to reach its pre-crisis given the reshoring
and protectionist growing trend.
Policy bazooka during lockdowns avoid a liquidity crisis. Insolvency wave delayed to H2 2020. Confirmed but the changes in the insolvency laws delays even
further the insolvency wave (+33% by end-2021 vs. +20% in 2020)
Policy support during deconfinement (May-July): targeted relief: shifts the focus from liquidity
to solvency support with targeted and increasingly conditional support.
Confirmed. Several European States announced a prolongation of
the relief support, mainly on partial unemployment schemes along
direct loans to most hit sectors
Policy support during recovery phase (until end-2021): from debt to cash and from deflation to
reflation.
Below expectations. Very little has been announced and no global
coordination which bodes for a lower recovery in 2021. More should
be announced in September but no bazooka expected.
Risks to our scenario (L-shape): (i) prolonged high precautionary savings (households,
companies); (ii) rise in the zombification of companies; (iii) rise in NPLs and fragile banks; (iv) rise
in social inequalities and political risk; (v) policy mistakes (sanitary, fiscal, monetary); (vi) rise in
protectionism and shorter supply chains which could structurally dampen companies margins.
Maintained at 30% probability.
Financial markets: it can still get worse before it gets better On track. Still no strong signals of reentry given the divergence
between equity and bond markets. Continue to expect strong volatility.
FROM MARCH TO JUNE: WHERE DO WE STAND?

© Copyright Allianz
COVID-19: THE PHASE 2 MARATHON
• Expand healthcare capacity (treatment, testing, monitoring)
• Fiscal / monetary safety nets to reduce downside risks & cushion economic blow
Stage 1: Full lockdowns to
'flatten the curve'
• Mass testing, tracking & isolation of new cases
• Ongoing targeted confinement measures incl. border restrictions & event bans
• Policy to focus on boosting economic recovery prospects
Stage 2: Gradual opening of national
economies• Bans on large events & border
restrictions to be eased as pandemics around the globe ends
• Ongoing fiscal & monetary policy support aimed at providing tailwind to rebound
Stage 3: Global economy getting
back on track
• Global rollout allows for return to normalcy without border restrictions, testing & bans on large events
• Policy support can be gradually withdrawn
Stage 4: Habemusvaccine!
Remember we are here!
Fresh virus outbreak –
back to stage 1
Sources: OECD, Allianz Research framework from March 20204
© Copyright Allianz
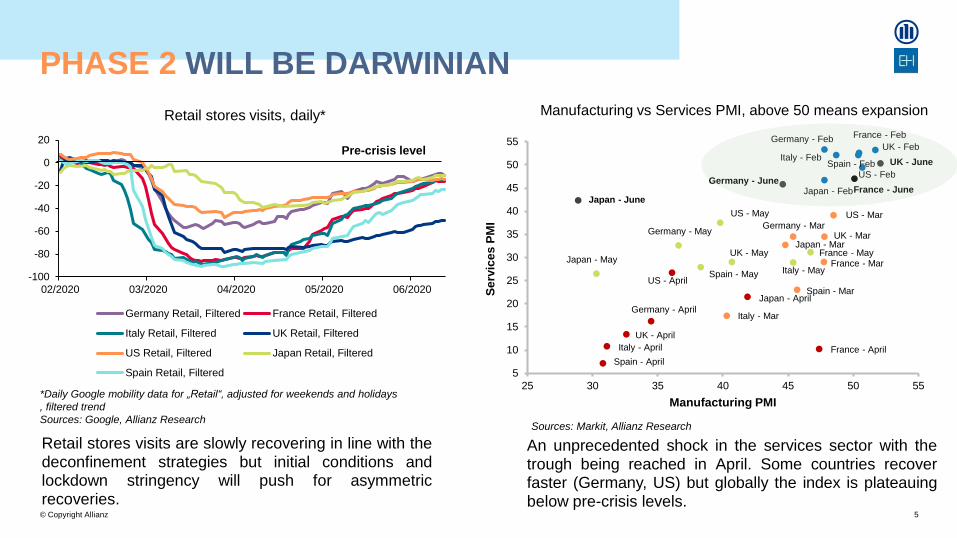
Retail stores visits are slowly recovering in line with thedeconfinement strategies but initial conditions andlockdown stringency will push for asymmetricrecoveries.
PHASE 2 WILL BE DARWINIAN
Retail stores visits, daily*
*Daily Google mobility data for „Retail“, adjusted for weekends and holidays
, filtered trend
Sources: Google, Allianz Research
5
An unprecedented shock in the services sector with thetrough being reached in April. Some countries recoverfaster (Germany, US) but globally the index is plateauingbelow pre-crisis levels.
Manufacturing vs Services PMI, above 50 means expansion
France - Mar
France - Feb
France - May
Germany - Feb
France - April
Germany - Mar
Germany - April
Germany - May
Italy - Feb
Italy - Mar
Italy - April
Spain - Mar
Spain - May
Spain - Feb
UK - Mar
UK - April
UK - May
US - Feb
US - Mar
US - April
US - May
Japan - Feb
Japan - Mar
Japan - April
Italy - May
Spain - April
UK - Feb
Japan - May
Germany - JuneFrance - June
Japan - June
UK - June
5
10
15
20
25
30
35
40
45
50
55
25 30 35 40 45 50 55
Se
rvic
es
PM
I
Manufacturing PMI
Sources: Markit, Allianz Research
-100
-80
-60
-40
-20
0
20
02/2020 03/2020 04/2020 05/2020 06/2020
Germany Retail, Filtered France Retail, Filtered
Italy Retail, Filtered UK Retail, Filtered
US Retail, Filtered Japan Retail, Filtered
Spain Retail, Filtered
Pre-crisis level

© Copyright Allianz
AUT
BEL
BRA
CHN
CZE
DNK
FRA
DEU
INDIDN
ITA
JPNMEXNLD
NOR
POL
RUS
SGP
ZAF
KOR
ESP
TUR
GBRUSA
-40
-30
-20
-10
0
10
20
0.8 0.9 1.0 1.1 1.2 1.3 1.4
Ch
an
ge i
n a
vera
ge s
trin
gen
cy i
nd
ex,
Ju
ne v
s. M
ay
Average effective R0 in June
De-confiningeven though
epidemic may not be clearly under control
0
10,000
20,000
30,000
40,000
50,000
60,000
70,000
1/22/2020 3/22/2020 5/22/2020
Europe AfricaMiddle-East North AmericaLatin America IndiaAPAC excl. India
Many countries still battle with too highR0. Cluster management and physicaldistancing measures could help cap R0for countries with previous lockdowns
It is likely to be long before allcontainment measures are removed.Stringency indices have been faster torise than decline, particularly forinternational travel.
Hot spots include Latin America, theUnited States, United Kingdom and India
NEW WAVELETS: LIGHT AND LOCALIZED LOCKDOWNS
6
Sources: Various, Euler Hermes, Allianz Research Sources: Oxford University, Euler Hermes, Allianz Research Sources: John Hopkins University, Euler Hermes, Allianz Research
De-confining: managing the effective
reproduction rate(bubble size is latest available stringency index)
Stringency indices Daily number of new Covid-19 cases (as of
5 July 2020)
0
10
20
30
40
50
60
70
80
90
0.0
0.5
1.0
1.5
2.0
2.5
3.0
3.5
4.0
01-2020 03-2020 05-2020 07-2020
Internationaltravel restrictions
Overallstringency index(rhs)

© Copyright Allianz
GLOBAL ECONOMY: NO RETURN TO PRE-CRISIS
LEVELS BEFORE END OF 2021Real GDP growth, %
World GDP level, Q4 2019 = 100
Sources: National sources, Euler Hermes, Allianz Research
Sources: National sources, Euler Hermes, Allianz Research
7
85
90
95
100
105
110
2019-01 2019-07 2020-01 2020-07 2021-01 2021-07 2022-01
World GDP, Q1'19 = 100
pre-Covid-19 World GDP path
Q4 2019 World GDP level
2021
World GDP growth 3.3 3.1 2.5 -4.7 4.8
United States 2.4 2.9 2.3 -5.3 3.7
Latin America 1.0 1.0 0.1 -6.8 3.1
Brazil 1.3 1.3 1.1 -7.0 3.0
United Kingdom 1.8 1.3 1.4 -13.3 5.0
Eurozone members 2.7 1.9 1.3 -9.0 6.0
Germany 2.8 1.5 0.6 -7.0 4.5
France 2.4 1.8 1.5 -10.8 7.4
Italy 1.7 0.7 0.3 -11.2 6.6
Spain 2.9 2.4 2.0 -11.0 7.0
Russia 1.8 2.5 1.3 -5.2 3.0
Turkey 7.5 2.8 0.9 -4.7 4.2
Asia-Pacific 5.2 4.7 4.2 -1.3 5.9
China 6.9 6.7 6.1 1.5 7.6
Japan 2.2 0.3 0.7 -5.7 2.2
India 7.0 6.1 4.7 -3.6 7.5
Middle East 1.4 0.9 0.3 -6.3 2.2
Saudi Arabia -0.7 2.4 0.3 -4.0 2.0
Africa 3.1 2.7 1.9 -3.1 4.0
South Africa 1.4 0.8 0.3 -7.8 5.4
* Weights in global GDP at market price, 2019
NB: fiscal year for India
2017 2018 2019 2020
Which economies will drive the global recovery? United
States, Germany and China (although a far cry compared
to GFC). Who are the laggards? United Kingdom, France,
Spain, Italy, vulnerable EM (e.g. Latin America, Turkey,
South Africa, India)
Global GDP growth, index
Radical uncertainty on
epidemiological
development, US election,
policy cliff-edge effect

© Copyright Allianz
SECTOR OUTLOOK: DIVERGENT PATH FOR THE
RECOVERY
A&D – Commercial Aerospace
Retail – Non-essential
Retail – Restaurants
Healthcare – Pharmaceuticals
Retail – Essential/Grocery
A&D – Defence Contractors
• Telecom
• Healthcare –
Equipment
• Paper & Packaging
• Cons Prod – Pack-Food/Pers
& Home Care/Agr&Ingr
• Heathcare – Services
• Utilities
• Cons Prod – Tobacco & Alcoholic Beverage
• Business & Consumer Services
• Real Estate (REITs)
• Technology
• Engineering & Construction
• Capital Goods
• Transportation – Shipping
• Building Materials
• Chemicals
• Metals & Mining
• Transport Infra – Toll Roads
• Homebuilders & Developers
• Oil & Gas
• Media & Entertainment
• Leisure – Gaming
• Transport Infra – Rail
• Leisure – Theme park and other visitor
attractions
• Cons Prod – Luxury & Discretionary
• Automotive
• Leisure – Cruise lines
• Transport Infra – Airports
• Transportation – Airlines
• Leisure – Lodging and hospitality
Return to pre-crisis levels of profitability by sector (EMEA)
As a result of Covid-19 we have downgraded a record number of sectors (325) in Q2 2020. The current crisis has led to a
downgrade of 4 in 10 of our sector risk ratings since Q4 2019. In most cases, they were triggered by two factors: the demand
shock and its direct and indirect impact on either the profitability or the liquidity outlook. The most downgraded sectors are
those in the frontlines facing Covid-19 consequences, namely transportation, automotive and retail
Sources: S&P, Euler Hermes, Allianz Research

© Copyright Allianz
Monetary policy response to the Covid-19 crisiswas strong across the world. Among majoreconomies, we estimate that the monetary impulse isthe largest in the U.S.
MONETARY BAZOOKA: UNPRECEDENTED BALANCE
SHEET EXPANSION, DIFFERENTIATED RETURNS Monetary impulse indices
Sources: National central banks, Euler Hermes, Allianz Research
9
-20
-15
-10
-5
0
5
10
15
20
09 10 11 12 13 14 15 16 17 18 19 20
United States Eurozone
China Japan
United Kingdom
As monetary policy continues to backstop sovereignand corporate bond markets to ensure favorablerefinancing conditions, the balance sheets of allmajor central banks will continue to balloon in2020/21, heading towards 50% of GDP.
Central banks‘ balance sheets (% of GDP)
Sources: Refinitiv, Allianz Research.
0
10
20
30
40
50
60
70
20
05
20
06
20
07
20
08
20
09
20
10
20
11
20
12
20
13
20
14
20
15
20
16
20
17
20
18
20
19
20
20
20
21
ECB (lhs) BoE (lhs)
PBoC (lhs) FED (lhs)
Forecasts

© Copyright Allianz
Fed committed to ultra forward guidance,rates near 0 through 2022: plausible. ECBprovided weak forward guidance (policypause): be aware of zombie banks
LOOKING FORWARD, EUROPE WILL HAVE TO CARE
FOR ITS BANKS10yr yields on UST & Bund vs. Fed funds
rate and ECB deposit rate (%)
Sources: Refinitiv, Allianz Research.
The most vulnerable sectors alreadyfeature elevated levels of non-performing loans and represent ahigh exposure for banks.
Distribution of banks across NPL ratio
in the EU
The Fed has only bought ~$15bn of tradedcorporate debt and provided $30bn ofcommercial paper (~$750Bn total duringthe GFC crisis). Due to the Feds’ forwardguidance, corporate spreads seem to beunderestimating corporates credit risk.
US Federal Reserve – Corporate
Securities Operations
Sources: EBA, Allianz Research
0
200
400
600
800
1000
1200
0
5
10
15
20
25
30
35
12-1
9
01-2
0
02-2
0
03-2
0
04-2
0
05-2
0
06-2
0
bps$ Bn Corporate Credit
Commercial Paper
Investment Grade Spread (RHS)
High Yield Spread (RHS)
0
10
20
30
40
50
60
0.2-1% 1-2% 2-3% 3-4% 4-10% 18-36%
Num
be
r o
f b
an
ks
NPL ratio
Sources: Refinitiv, Allianz Research.
10

© Copyright Allianz
0.0% 5.0% 10.0% 15.0% 20.0%
Spain
Italy
UK
France
China
Germany
USA
Japan
Realized fiscal relief package
Announced fiscal spending
Expected future recovery stimulus
Emergency fiscal spending ranges from 3% of GDP to18%; the recovery stimulus effort will be a key differencingfactor in the countries’ future trajectories. At the global levelUSD10.4tn of fiscal stimulus has been announced.
The size of automatic stabilizers will matter for the sizeof the fiscal stimulus packages.
FISCAL BAZOOKA: PROMPT BUT UNEQUAL IN SIZE
AND MULTIPLIERS. MORE TO COME?
Direct fiscal spending (% of GDP) Effectiveness of automatic stabilizers one year after the shock
Sources: Various, National sources, Euler Hermes, Allianz Research
NB: the degree to which a decline in market income is offset by automatic stabilizers one
year after the shock. A ratio of 100 implies that automatic stabilizers offset the shock to
market income completely, leaving aggregate household disposable income unchanged
Sources: OECD, Euler Hermes, Allianz Research
11
0
20
40
60
80
100
120
140
Neth
erlands
Germ
any
Sw
itzerlan
d
Fin
lan
d
Au
str
ia
Be
lgiu
m
Irela
nd
Fra
nce
Sw
eden
Canada
Slo
venia
UK
Italy
Cze
chia
Au
str
alia
Po
rtuga
l
Hungary
Slo
vakia
US
A
Jap
an
Sp
ain
Gre
ece
Social security contribution
Unemployment, housing and family benefits
Direct taxes

© Copyright Allianz
28%26% 25%
23% 22%21%
22%
17%
24%21% 21%
19% 18%16%
18%
12%
0%
5%
10%
15%
20%
25%
30%
35%
40%
45%
Ge
rma
ny
Ne
the
rlan
ds
Fra
nce
EU
28
Be
lgiu
m
Italy
Sp
ain
UK
Pre-lockdown During lockdown During deconfinement End-2020
In the 5 largest European countries, 9 million workers(20% of those currently partially unemployed) still face anelevated risk of becoming unemployed in 2021 becauseof the muted recovery. These “zombie jobs” require adhoc policies to avoid postponed mass unemployment.
This will continue to feed into precautionary savings. Weestimate savings rate to remain +6pp above pre-crisis levelsat the end of 2020 which represents EUR370bn of excesssavings in the EU, or 2.5% of GDP
THE REAL SECOND WAVE: ZOMBIE JOBS WILL
RESTRAIN CONSUMERS FROM SPENDINGSavings rate, % of gross disposable income
Sources: Eurostat, Allianz Research
Expected loss of employment (% of sectoral employment)
based on expected output loss by end 2021
Source: Allianz Research
-25%
-20%
-15%
-10%
-5%
0%
5%
10%
Tra
nsp
ort
Accom
odation
Constr
uctio
n
En
tert
ain
em
ent
Reta
il and W
hole
sale
Industr
y
Germany France Spain Italy UK
12

© Copyright Allianz
SOCIAL RISK ON THE RISE, FISCAL DILEMMA AHEAD?
Social risk hotspots Taxes – companies vs households (OECD average)
Sources: Euler Hermes, Allianz Research
Sources: OECD, Euler Hermes, Allianz Research
13

© Copyright Allianz
Lockdowns of business courts, temporary policy measuresto support companies and temporary changes in insolvencyregimes are pushing down official registrations ofbankruptcies for the short term – lowering the expectationsfor the full year 2020.
The ending of temporary factors will lead to a massive trendreversal starting in Q3 or Q4 depending on countries. Ourglobal insolvency index would surge by +35% by end of2021 i.e. +by 16% in annual average. Should policy reliefbe withdraw too fast the rises will be +5 to +10pp higher.
THE OTHER REAL SECOND WAVE: A SURGE IN
GLOBAL INSOLVENCIESInsolvency figures and forecasts
(selected countries)
EH Global Insolvency Index (yearly changes in %)
and contribution of regional indices
Sources: Euler Hermes, Allianz Research Sources: Euler Hermes, Allianz Research
14
# of years
with an
increase
CAGR
Changes
over 2007-
2009
Last
pointy/y ytd
2020 vs
2019
2021 vs
2020
2021 vs
2019
U.S. 3 45% 115% March 4% 4% 47% 7% 57%
Canada 0 - -14% April -61% -28% 15% 9% 25%
Brazil 1 25% -8% April -58% -22% 32% 10% 45%
Germany 2 6% 12% March -2% -4% 4% 8% 12%
France 3 11% 27% May -62% -36% 4% 20% 25%
United Kingdom 2 22% 48% March -11% -11% 8% 33% 43%
Italy 2 23% 52% 18% 8% 27%
Spain 3 76% 380% May -57% -57% 20% 17% 41%
The Netherlands 2 32% 74% May 6% 2% 29% 10% 42%
Russia 0 - -62% May -54% -15% 18% 5% 23%
Turkey 2 2% 4% April -1% 4% 22% 7% 31%
South Africa 3 11% 31% March -19% -6% 12% 7% 20%
China 2 12% 2% May 22% 10% 21% 16% 40%
Japan 2 9% 10% May -55% -1% 8% 5% 13%
Australia 2 16% 35% April -42% -18% 5% 5% 11%
South Korea 1 19% -13% May -53% -31% 14% -6% 6%
GLOBAL INDEX 3 16% 46% 17% 16% 35%
2007-2009 crisis 2020 Forecasts

© Copyright Allianz
-40%
-30%
-20%
-10%
0%
10%
20%
03/0
8
11/0
8
07/0
9
03/1
0
11/1
0
07/1
1
03/1
2
11/1
2
07/1
3
03/1
4
11/1
4
07/1
5
03/1
6
11/1
6
07/1
7
03/1
8
11/1
8
07/1
9
03/2
0
11/2
0
07/2
1
UK US China Germany
Companies are in a position to increase theirinvestments during the recovery phase. Increases innet savings in 2020 are the highest in Italy, the UK andFrance. But this will be dependent on renewedconfidence in a lasting restart of growth in Europe.
Public support to reduce companies’ fixed costs (lowersocial contributions, lower corporate taxes and/or fiscalincentives to invest) will be key. Expanding the stateguaranteed loan schemes into 2021 could also besupportive for future company investment.
MIND THE INVESTMENT CYCLE: CONFIDENCE MATTERS
Annual net savings by country, EURbn Total investment, y/y
Sources: Eurostat, Euler Hermes, Allianz Research Sources: National sources, Euler Hermes, Allianz Research
15

© Copyright Allianz
We find that more than 13,000 SMEs & MidCaps (7% of total) in the six biggestEurozone countries were classified zombies before Covid-19 crisis. Low equityratios for some companies has pushed them into high indebtedness since 2009,which will continue to increase thanks to State Guaranteed Loans.
This coupled with already fragile companymargins increases the zombification of thecorporate sector.
ACCELERATING TREND IN ZOMBIFICATION OF
COMPANIES COULD WEIGH ON THE RECOVERY
Sources: Bank of France, Allianz Research Sources: Eurostat, Allianz Research
Equity ratios % of total assets
0%
10%
20%
30%
40%
50%
60%
Be
lgiu
m
Sp
ain
Germ
an
y
Fra
nce
Au
str
ia
Po
rtug
al
Italy
SME Large companies
Sources: BIS, Allianz Research
Non-financial corporations’ debt, % of GDP
0%
20%
40%
60%
80%
100%
120%
140%
160%
180%
Sw
ede
n
Ne
therl
and
s
Fra
nce
Belg
ium
Ch
ina
No
rwa
y
Fin
land
De
nm
ark
Japa
n
Spain
UK
US
Ita
ly
Germ
any
2009 2019
25%
30%
35%
40%
45%
50%
20
07Q
1
20
07Q
3
20
08Q
1
20
08Q
3
20
09Q
1
20
09Q
3
20
15Q
1
20
15Q
3
20
16Q
1
20
16Q
3
20
17Q
1
20
17Q
3
20
18Q
1
20
18Q
3
20
19Q
1
20
19Q
3
EU-27 Germany FranceItaly Belgium
Non-financial corporations’ margins, % of
value added
16

© Copyright Allianz
Trade could plummet by -15% involume terms (-20% in value) due tothe Covid-19 shock on goods and –for the first time – on services.
Assumptions medium-term: reducedUS-China uncertainty but stable tariffs,no immediate threat of massivereshoring, air transport back to pre-crisis in 2023.
The oil and commodity price shock willlead to a negative price effect on tradein 2020. 2021 will see a return to 52.5after an average of 47 in 2020.
TRADE: RETURN TO PRE-CRISIS LEVELS IN 2022/ 2023
17
Sources: Sources: IHS Markit, Allianz Research Sources: International Trade Center, Allianz Research Sources: Bloomberg, Euler Hermes, Allianz Research
Global trade growth, in volume terms and
value (%, y/y)
Medium-term trade in value terms (USDtn) Oil prices and EUR/USD
0.95
1.00
1.05
1.10
1.15
1.20
1.25
1.30
20
30
40
50
60
70
80
90
100
Jun-16 Jun-17 Jun-18 Jun-19 Jun-20 Jun-21
Brent Oil price (lhs) EUR/USD (rhs)
Forecasts
3.3% 4.0%3.0%2.4%
5.5%4.2% 1.3%
-15.0%
8.0%
4.1% 3.2%2.8%
1.9%
-10.8%
-2.0%
10.1%
9.6%
-1.6%
-20%
12.2%
7.5%
5.5%
-25%
-20%
-15%
-10%
-5%
0%
5%
10%
15%
13 14 15 16 17 18 19e 20f 21f 22f 23f
Volume Price Value
18.7
15.417.0
18.7 19.3
2.5
1.1
1.8
2.12.5
0
5
10
15
20
25
30
pre-crisis 2020 2021 2022 2023
Goods Travel and transport services Other services

© Copyright Allianz
Around each recession, supply chains become aconcern. This time around, the concern has peakedamong companies and policy makers. Buildingresilience and reshoring are the new rhetoric.
Arguments in favor of reshoring Arguments against reshoring
Resilience : Reshoring creates
resilience due to lower risks, and
shorter lead times
Social discontent: Growing social
discontent could be incompatible
with reshoring, as it would entail
high labor costs passed down to the
consumer
Strategic sectors: Reshoring
specific supply chains for key
strategic sectors such as the
medical sector, similarly to the
military sector, could make sense
Risk assessment complexity:
Reshoring does not necessarily
mean de-risking: it can also mean
putting all your eggs in the same
basket, leading to excess
concentration
Flexibility: More local supply can
also enhance agility, as companies
can be more responsive to changes
in local demand.
Cost effectiveness and
incentives: Reshoring is hardly
reversible for many sectors, or at a
high cost for companies. Moreover,
Incentives for businesses to reshore
are still lacking
Innovation: Reshoring for cost-
competitiveness reasons is unlikely,
but race for product innovation is
better
Creative destruction: Reshoring is
not only job creation… it’s job
destruction through innovation, for
instance robotization.
TRADE AND RESHORING: TALKING THE TALK BUT
NOT WALKING THE WALK
Number of mentions of “supply chains” in the media
Sources: Bloomberg, Euler Hermes, Allianz Research
18
0
500
1000
1500
2000
2500
92 94 95 97 99 00 02 04 05 07 09 10 12 14 15 17 19

© Copyright Allianz 19
RISKS TO OUR OUTLOOK
H2 2020 2021 Beyond 2021
Upside
risks
Better-than-expected trade flows, tourism receipts
and recovery in the services sector (exports-exposed
economies benefit, e.g. Germany)
Stronger policy support and stimulus (e.g.
European bad bank, UK, China, etc.)
Declining financial risks in domestic financial
system, markets, external financing, etc. (e.g. Italy,
Turkey, China, India, etc.)
Appeased socio-political risks, restoring domestic
and external confidence (e.g. Brazil, Hong Kong,
etc.)
Vaccine available earlier than expected,
tourism returns to pre-crisis levels
Stronger policy stimulus, notably
improving investment and the labour market
(e.g. China, France, United Kingdom, Italy,
etc.)
Oil and commodities prices rebound
(benefitting e.g. Russia, Kazakhstan,
Azerbaijan, the GCC, Latin America, etc.)
Stronger policy stimulus and policy
coordination, resolving structural issues and
supporting potential growth (e.g. EU, Italy, China)
Exports competitiveness improving, notably on
supply chains reshoring (Central Europe, UK,
etc.)
Downside
risks
Strong lockdowns to fight a second Covid-19 wave
Protectionism and slow global trade recovery (e.g.
Germany, UK, trade hubs, etc.)
Sustained risk aversion limiting capital flows to
EMs and pressuring economies with large external
financing needs
Policy mistake (e.g. EU, France, Italy, China, India,
etc.)
Domestic imbalances correction (e.g. German real
estate, Indian financial sector)
Social risks and protests worsen
Protectionism intensifies and global trade
does not recover
Strong lockdowns to fight waves of Covid-
19 outbreaks
Political risk, policy mistakes (e.g. Italy,
EU, UK, India, HK
Sustainably higher unemployment rate,
threatening the consumer-led recovery
(Germany, China
Deteriorating bank asset quality,
sometimes leading to bailouts and feedback
loop (e.g. Italy, France, China, India
Debt distress and currency crises (some
emerging countries, e.g. in Central Europe,
Africa, Latin America)
Protectionism intensifies and calls into question
growth models (Germany, trade hubs, China,
etc.)
Debt sustainability and banking sector
concerns worsen (France, Italy, China, India,
some countries in Africa, etc.)
Lack of structural reforms or missed
opportunities cap productivity (China, India, UK,
Central Europe, etc.)
Fiscal consolidation (U.S., China, etc.)
Socio-political risks heighten

© Copyright Allianz 20
PROTRACTED CRISIS SCENARIO (30%)
1 Extended lockdown and BREXIT uncertainties may worsen outcome for UK. Source: Allianz Research
U-SHAPED RECOVERY PROTRACTED CRISIS
SCENARIO • Drastic confinement measures, taking heavy toll on economy & markets
• Sharp recession in H1 20 across DMs & several large EMs, followed by weak recovery
• Longer health crisis triggers brutal market dive
• Systemic credit event leads to liquidity crisis
• Policymakers unable to restart growth
HEALTH
POLICY• Belated & uncoordinated policies
• Persistent localized containment measures; incl. targeted travel restrictions
• Reinfections with generalized domestic confinement
• Borders closed again until end-2020
ECONOMIC
POLICY• Aggressive fiscal & monetary easing
• Direct support measures
• Even more aggressive fiscal & monetary policy
• Not very effective
ECONOMIC
IMPACT
GDP growth, % 2020 2021
World -4.7 +4.8
US -5.3 +3.7
China +1.5 +7.6
Eurozone -9.0 +6.0
UK¹ - 13.3 +5.0
Global trade
volume
2020
-15%
Insolvencies 2020-21
+33%
GDP growth, % 2020 2021
World -9.4 -0.5
US -12.0 -2.0
China -6.6 +1.8
Eurozone -20.0 -2.5
UK¹ -24.0 -5.0
BA
SE
CA
SE W
OR
ST
CA
SE
Global trade
volume
2020
-30%
Insolvencies 2020-21
+90%

© Copyright Allianz
02CAPITAL MARKETS

© Copyright Allianz
EQUITY MARKETS: A V-SHAPE RECOVERY PRICED IN
The consensus is expecting a V-shape recovery of EPS in 2020, followed by a ‘normal’ rise in 2021. It proves thedetachment between the markets and economic data. The same trend remains across the globe.
Source: DataStream, Allianz Research
S&P 500 REPORTED EPS
10
15
20
25
30
35
40
45
Dec-16 Dec-17 Dec-18 Dec-19 Dec-20 Dec-21 Dec-22
22

© Copyright Allianz 23
INCREASING DIVERGENCE BETWEEN EQUITY
PRICES AND DIVIDEND FUTURES
The path of the dividend futures follows different directions in the US and Europe. The divergence between the S&P 500 andits’ dividend futures hints that the market galloped too fast.
2,100
2,300
2,500
2,700
2,900
3,100
3,300
3,500
45
50
55
60
65
70
Dec-17 Dec-18 Dec-19 Dec-20
S&P 500 DIVIDEND FUTURES
S&P 500 dividend futures (LHS)
S&P 500 (RHS)3,500
4,000
4,500
5,000
5,500
6,000
6,500
40
60
80
100
120
140
160
180
200
Dec-14 Dec-15 Dec-16 Dec-17 Dec-18 Dec-19 Dec-20
CAC 40 DIVIDEND FUTURES
CAC 40 dividendfutures (LHS)
CAC 40 (RHS)
Source: DataStream, Allianz Research Source: DataStream, Allianz Research

© Copyright Allianz
EQUITY MARKETS: US REMAINS EXPENSIVE
Ratio of MSCI Indices in Common Currency Terms
USA / Germany S&P500 & Nominal GDP
40
60
80
100
120
140
160
180
200
196
9
197
4
197
9
198
4
198
9
199
4
199
9
200
4
200
9
201
4
201
9
202
4
Dec 1999 = 100
The overvaluation of the US equity market relative to the German equity market has reached unseen highs. A recent rally in European equity markets has slightly diminished this overvaluation. However, the US market overvaluation remains acute.
Source: DataStream, Allianz Research
100
1,000
10,000
1990 1995 2000 2005 2010 2015 2020 2025 2030
S&P 500
Level consistent withnominal GDP
24

© Copyright Allianz
Several structural leading indicators show that thedownturn market trough has not yet been reached.Looking at our proprietary EQ sector dispersion indexas an example, the current value and trend of theindicator does not show any strong signs ofimprovement and thus it does not warrant shiftingtowards a re-risking strategy.
As another example, institutional inflows into MM Fundshave historically started declining before marketsbottomed. This precondition has not yet been fulfilled.Consequently, this indicator (as it is still increasing or flat)suggests that markets have not yet reached their bottom.At this point in time, daily and weekly indicators (sentimentdriven) are showing that the market trough is alreadybehind us. However, structural indicators (Monthly andQuarterly) have not yet shown any signs of improvement.
RE-ENTERING THE MARKET: NOT YET!US – EQ Sector Dispersion Index US - Institutional Money Markets Funds
Source: Refinitiv, Allianz Research
EQ Dispersion index: Proxy for diverting returns between EQ sectors
Source: Refinitiv, Allianz Research
-60%
-40%
-20%
0%
20%
40%
60%
80%1
98
0
198
5
199
0
199
5
200
0
200
5
201
0
201
5
202
0
Relative performance EQ vs FI Index YoY (%) returnEQ sector dispersion index YoY%
-60%
-40%
-20%
0%
20%
40%
60%
80%-80%
-60%
-40%
-20%
0%
20%
40%
60%
199
0
199
5
200
0
200
5
201
0
201
5
2020
Relative performance EQ vs FI Index YoY (%) returnMMF Inst. AuM YoY (%) return (RHS - Inverted Scale)
25

© Copyright Allianz
GOVERNMENT BONDS: NO INFLATION IN SIGHT?US 10y Treasury yields
Sources: Refinitiv, Allianz Research
Model: central bank rates, smoothed central bank rates
0%
1%
2%
3%
4%
5%
6%
7% 10Y US Gov. Bond
In Sample Estimate
0.0
0.5
1.0
1.5
2.0
2.5
3.0%
10-Year US TIPS breakeveninflation rate
In the context of lower for longer central
bank rates, yields are expected to remain
on fundamental negative sloping trend.
Our proprietary model suggests that 10y
USTs will reach 1.4% by the end of 2021,
inline with our current forecast. For 2020,
we still expect 10y USTs to finish the year
at 1.0%.
-2%
-1%
0%
1%
2%
3%
4%
5%
6%
10Y Bund
In Sample Estimate
At current valuation levels we believe
inflation expectations to play the key role
moving forward, as real yields are
expected to remain subdued. Both US
and EUR inflation expectations are
currently close to the lower range of our
models. At current levels, it is possible
to buy inflation protection at a low
price.
Sources: Refinitiv, Allianz Research
Model: CPI, smoothed CPI
Sources: Refinitiv, Allianz Research
Model: central bank, smoothed central bank rates, 10y JGB, QE
US 10y Inflation Expectations German 10y Bund yields
If the bond market is still a market, it is
currently pricing a global recession and a
prolonged absence of global inflation. In
the case of the bund, we still expect 10y
bunds to finish the current year at -0.5%
and to perform a timid climb by the end of
2021 (-0.3%).
26

© Copyright Allianz
With equity markets ready for a V-shaped scenario, we still
expect 2020 performance to be on the bearish side. We believe
global equity markets will end 2020 with an ~ -20% yearly
performance. With our forecasts in mind, we understand that a
second market correction could be in the pipeline (specially in
the US). Moving forward, we expect the most vulnerable
countries to remain the laggards of the current economic
downturn. (e.g. Brazil)
Even if not all central banks have announced their willingness to take
credit risk in their balance sheets, global corporate IG & HY markets
have enjoyed a period of declining financing costs since the peak in
mid-march. At this point, we expect corporate spreads to finish the
year close to current levels but we acknowledge that corporate
spreads are vulnerable to second wave of strong widening should the
economic and pandemic data further deteriorate .
EM MARKETS: AVOIDING THE LAGGARDSEquities Corporate Debt
Sources: MSCI Indices in $ (*EMU in €), Allianz Research Sources: Bofa Indices, Allianz Research
27
40
50
60
70
80
90
100
110
12-19 01-20 02-20 03-20 04-20 05-20 06-20
100 = 31.12.2019
World United States
Eurozone EM
EM EMEA EM Asia
EM Latam Brazil
0
200
400
600
800
1000bps
World
UnitedStatesEurozone

© Copyright Allianz
While it is true that emerging market sovereign debt has
been gaining weight within the global sovereign market
universe over the past years, its consideration (from an
international investor perspective) remains that of a mid to
high risk asset. Because of that, it is subject to be sold in
high uncertainty environments. As of today, we still expect a
second wave of EM debt and equity sell-off.
The capital outflows experienced in March led to a rapid
depreciation of emerging markets currencies paired with a quick
increase in long-term sovereign yields. Due to this embedded
volatility, we believe that both exchange and long-term interest
rates will keep wandering erratically throughout 2020 remaining an
unwanted casualty of the currently unsettled short-term market
sentiment.
EM DEBT: AT THE MERCY OF SPECULATORS
EM Sovereign Debt EM Debt Flows
Sources: BofA Indices, Allianz Research Sources: IIF, Allianz Research
28
8%
10%
12%
14%
16%
84%
86%
88%
90%
92%
2006 2008 2010 2012 2014 2016 2018 2020
Developed Markets Sovereign…Emerging Markets Sovereign…
0
1
2
3
4
5
6
7
8
-15
-10
-5
0
5
10
2006 2008 2010 2012 2014 2016 2018 2020
EM Debt Flows

© Copyright Allianz
03U.S. – CHINA – EUROZONE

© Copyright Allianz
The termination of helps dedicated to absorbing theshock at a labor market level, will represent a so-called revenue – cliff.
USA: HOUSEHOLDS TO FACE A REVENUE CLIFF
Sources of revenues for households (USD bn)
Sources: Nomura, Allianz Research
30
-200
-100
0
100
200
300
Mars April May June Jul Aug Sep
Proprietors' income with IVA and CCAdjCompensation of employeesUnemployment Insurance BenefitsOther government social benefits inc. One time checksOthersPersonal income
High uncertainty and conviction that public debt willneed to be reimbursed in the future will weigh long-lastingly on households’ savings rate.
US unemployment and saving rates (%)
Philadelphia Fed, Euler Hermes, Allianz Research
0
5
10
15
20
25
30
35
0
5
10
15
20
25
30
35
05 06 07 08 09 10 11 12 13 14 15 16 17 18 19 20 21

© Copyright Allianz
The Fed has absorbed the bulk of debt newly issuedby the US government, even if it not directlyintervenes on the primary market.
We expect the US public deficit to be close to 16% ofGDP in 2020 and close to 10% of GDP in 2021. Overthe long-term, the US public debt is expected tosteadily increase whatever the outcome of theelection.
USA: THE FED WILL REMAIN A DEBT ABSORBER
US debt held by the public and Fed assets US Public debt and deficit (% of GDP)
Sources: Euler Hermes, Allianz Research Sources: Euler Hermes, Allianz Research
31
-250
0
250
500
750
1000
1250
1500
-250
0
250
500
750
1000
1250
1500
05 06 07 08 09 10 11 12 13 14 15 16 17 18 19 20 21
Net debt issued by the Government (USD bn,LHS)
Treasuries held by the Fed (monthly variation,RHS, USD bn)
-16
-14
-12
-10
-8
-6
-4
-2
70
80
90
100
110
120
17 18 19 20 21 22 23 24 25 26 27 28 29 30
Public debt, LHS
Deficit, RHS

© Copyright Allianz
0
1
2
3
4
0
1
2
3
4
90 93 96 99 02 05 08 11 14 17 20 23 26 29
Estimated potential Biden Trump
Taking into account the regime of performance of 10different macroeconomic indicators, our modelsuggests that President Trump has a 22% probabilityonly to win the next election.
Model studying the potential of growth shows thenegative impact of (much higher) public debt. To thisregard, differences between Trump and Biden are notsignificant (higher fiscal support to productivity forTrump versus active population for Biden)
US ELECTIONS: WHAT IS AT STAKE?
Probability to win US elections for incumbent President’s party
(%)
US potential growth rate
(y/y, %)
Sources: Euler Hermes, Allianz Research Sources: Euler Hermes, Allianz Research
32
0.1
0.2
0.3
0.4
0.5
0.6
0.7
0.8
0.9
0.1
0.2
0.3
0.4
0.5
0.6
0.7
0.8
0.9
65 68 71 74 77 80 83 86 89 92 95 98 01 04 07 10 13 16 19

© Copyright Allianz
TRUMP VS BIDEN ECONOMIC PLANInfrastructure Taxes Health care Jobs & wages Student debt Climate change Trade
Donald
Trump
• USD2tn "very
big and bold
plan"
• Extend 2017 tax overhaul
for individuals (USD1.5tn)
• Repeal renewable energy
tax credits
• Tax credits for U.S.
education
• Raise the Internal Revenue
Service (IRS) budget by
about USD15bn
• Deep health care
spending cuts to
Medicaid
(USD900bn) and
Medicare
(USD450bn)
•10% cut from the
2020 enacted level
for the Department
of Health and
Human Services
• Cut in drug prices
• Spur job
creation through
the USD2tn
infrastructure
plan
• USD1tn of cuts
in social,
education and
assistance
spending
• 7.8% budget
decrease for Dpt of
Education in 2021
• Eliminate Public
Service Loan
Forgiveness and
subsidized loans
• Forgive
undergrad loans
after 15 y instead
of 20 y and raise
period for graduate
loans repayment to
30 from 25 y.
• No sizable
government policy
on climate change
• Pursue
“America
First” policy.
Continuity of
current trade
policy
Joe Biden
• 10-year
USD1.3tn
infrastructure
plan
• Plan focuses
on climate
change ($400bn
for clean
energy,
research and
innovation
• Raise top income tax rate
back at 39.6% from 37% and
top corporate income rate to
28% from 21%
• Apply Social Security taxes
to earnings > USD400,000
• Tax capital gains and
dividends at ordinary rates for
those with annual incomes >
USD 1mn
• 15% minimum tax on book
income of large firms
• Double tax rate (to 21%) on
profits earned by foreign
subsidiaries of U.S. firms
• Eliminate the 400%
income cap on tax
credit eligibility and
lower the limit on the
cost of coverage to
8.5% of income
• Create a public
health insurance
• Lower eligibility age
for Medicare to 60
from 65.
• This plan will insure
more than an 97% of
Americans and cost
USD750bn
• Create "millions
of middle-class
jobs" through
infrastructure
plan
• Increase the
federal minimum
wage to $15
• increase
employment-
based green
cards from
140,000 each
year
• Cancel a
minimum of
USD10,000 of
student debt per
person
• Forgive all
undergraduate,
tuition-related
federal student
debt for low-
income and middle
class individuals
(earning up to
USD125,000)
• Achieve 100%
clean energy
economy and reach
net-zero emissions
no later than 2050.
• Join Paris
Agreement + ban
fossil fuel subsidies
• Install 500,000 EV
charging stations
nationwide by 2030
• Ban new permits
for oil and gas
drilling on federal
land and offshore
• Investing in
innovation and
the middle
classes
• Best way to
confront China
on IP + tech
transfers is by
forming a
coalition w/
allies and
partners, not
through tariffs.
33

© Copyright Allianz
0
20
40
60
80
100
120
140
-21 0 21 42 63 84 105 126 147
2016-2019 average 2020
65
70
75
80
85
90
95
100
105
110
115
-21 0 21 42 63 84 105 126
2016-2019 average 2020
40
50
60
70
80
90
100
-21 0 21 42 63 84 105 126 147
2016-2019 average 2020
Industrial activity is now probably c.5% below usual levels. On the consumption and services side, it could take longer forconfidence and households behaviours to return to normal: property transactions remain -34% below usual volumes, diningbills (including take-outs) are c.-40% below pre-outbreak and household disposable income declined by -3.9% y/y in realterms in Q1 2020 (vs. +5.8% in 2019).
CHINA RECOVERY UNEVEN AND CAPPED?
Source: Wind, Allianz Research Source: Wind, Allianz Research Source: Wind, Allianz Research
Daily average coal consumption at major
power generation groups, base 100
Traffic congestion index (across 100
cities), base 100
Property transaction volume (across 30
cities), base 100

© Copyright Allianz
After the slump in GDP growth in Q1 (at-6.8% y/y), we expect a gradualrecovery, becoming more visible in H2.We expect 2020 GDP growth at +1.5%.
Leading indicators point to theunemployment rate remaining atelevated levels (around 1pp above long-term average) for the rest of 2020.
We expect fiscal support amounting to7.1% of GDP (up from 2.7% forecastbefore the COVID-19 crisis). In terms ofmonetary policy, further injections ofliquidity and policy rate cuts are likely.
CHINA GROWTH FORECAST FOR 2020 AT +1.5%
35
Sources: National sources, Euler Hermes, Allianz Research Sources: Wind, Euler Hermes, Allianz Research Sources: PBOC, Euler Hermes, Allianz Research
Unemployment rate and leading indicator Credit impulse & PMIGDP growth (%) and contributions (pp)
-15
-10
-5
0
5
10
15
20
25
48
49
50
51
52
53
54
55
56
09 10 11 12 13 14 15 16 17 18 19 20 21
Official Manufacturing PMI
Credit impulse, 12-monthlead, rhs
45
50
55
60
65
70
75
804.6
4.8
5.0
5.2
5.4
5.6
5.8
6.0
6.2
12 13 14 15 16 17 18 19 20 21
Unemployment rate %
CKGSB survey -Recruitment index,smoothed, 7-month lead(rhs, rev)

© Copyright Allianz 36
Triggers:
• No further sanctions and retaliations between
China and the U.S.
• Mainland China sends clear signals that
business regulatory environment in Hong
Kong will not change, and significantly
increases investment in Hong Kong to help
recovery
Economic impact:
• In the short-term: stronger recovery of Hong
Kong economy, with GDP growth forecasts
in 2020 and 2021 increasing to -4.2% and
+7.9% respectively.
• In the medium-term: back to pre-Covid-19
and pre-2019 protests normal.
Improving environment
(10%)
Triggers:
• Disruption of business environment due to
China’s national security law in Hong Kong,
strong retaliation against U.S. actions (e.g.
on U.S. FDI into Hong Kong), along with long
term trend of developing regional trade and
financial hubs in the mainland.
• The U.S. treats Hong Kong as mainland
China for trade and direct investment, and is
followed by other developed countries
Economic impact:
• In the short-term: damaged business and
consumer sentiment jeopardize the recovery.
GDP growth forecasts in 2020 and 2021
falling to -6.6% and +0.8% respectively.
• In the medium- to long-term: Divestment of
U.S. firms, stock of FDI could decline by
almost half in coming five years (nearly
USD20bn). Not necessarily compensated by
FDI from mainland China, as focus is on
domestic hubs.
Deteriorating environment
(25%)
Scenario:
• China’s national security law theoretically
threatens the independence of Hong Kong’s
legal system, but its implementation does not
disrupt the business environment
• U.S. actions include financial sanctions on
Chinese officials involved in the national
security law, tightening of visa requirements,
exports restrictions to Hong Kong
Economic impact :
• In the short-term: continued small-scale
protests in Hong Kong. Impact of trade
sanctions is limited (less than 1% of Hong
Kong GDP if same tariff hikes as those
applied to mainland China over 2018-19).
Hong Kong’s 2020 and 2021 GDP growth
forecasts revised down to -5.9% and +4.1%
from -4.7% and +4.5% respectively.
• In the medium-term: U.S. FDI to Hong Kong
slows, but without divestment. FDI from
mainland China accelerates.
The ‘New Normal’
(65%)
HONG KONG SCENARIOS AS OF JULY 2020

© Copyright Allianz
Germany France Italy Spain UK
Lockdown lengths
(weeks)
6 8 10 10 12
Lockdown
strictness*
73 89 87 81 73
Lockdown
strictness x length
439 713 866 806 874
Fiscal stimulus
(% of GDP)
7.5% 6.7% 4.5% 2.5% 5%
Services
(% total gross
value added)
69.3% 78.9% 73.9% 74.8% 79.8%
EUROZONE: UNITED THEY FELL, DIVIDED THEY WILL
RISE -9% IN 2020, +6% IN 2021Key factors driving short-term economic performance
Looking at selected key drivers of divergence (policydecisions on lockdown length & strictness, fiscal responseeconomic features such as the size of the service sector)explains which the UK, Spain and Italy will lag the otherEurozone countries and in particular Germany.
The Eurozone economy has passed the trough, but high-frequency indicators are suggesting that the recovery willbe gradual, drawn-out and uneven across countries. OnAverage pre-crisis GDP will not be reached before 2023.
Sources: Allianz Research. *Note: Oxford stringency index
37
Retail Sales
Index: February 2020=100
Sources: Refinitiv, Allianz Research

© Copyright Allianz
EUROZONE: FISCAL POLICY NOW FIRING FROM TWO
CYLINDERS – PLUS 0.4% PER YEAR
Growth shock vs. net transfers from EU recovery fund
Sources: EU Commission , Refinitiv, Allianz Research
National fiscal policy continues to lead the policyresponse in the Eurozone. The Eurozone budget deficitwill rise to 10% in 2020 and still come in at 4% in 2021,with none of the large Eurozone countries complyingwith the Maastricht 3% limit over the forecast horizon.
In addition the economies most affected by the Covid-19 crisis – as well as those with lower GDP per capita –look set to receive some much needed fiscal tailwind forinvestment from the EU recovery fund. We estimate thatGDP levels on average could be boosted by 0.4% peryear over the next 5 years.
AustriaBelgium
Bulgaria
Croatia
Cyprus
Czechia
Denmark
Estonia
Finland
France
Germany
Greece
Hungary
Ireland
Italy
Latvia
Lithuania
Luxembourg
Malta
Netherlands
Poland
PortugalRomaniaSlovakia
Slovenia
Spain
Sweden
0%
2%
4%
6%
8%
10%
12%
14%
-13% -12% -11% -10% -9% -8% -7% -6%
EU
re
co
ve
ry fu
nd
re
ce
ipts
–lo
an
s &
gra
nts
(%
GD
P)
Revision in 2020 GDP growth forecast (ppts)
38
-14
-12
-10
-8
-6
-4
-2
0
2
4
Eurozone Germany France Italy Spain
2019 2020 2021
Government balance (% of GDP)
Sources: Refinitiv, Allianz Research

© Copyright Allianz
Firms‘ appetite for loans has risen dramatically in H1 2020– thanks to governments extending generous stateguarantees. Meanwhile the demand for housing andconsumer loans is hinting at an anemic recovery.
Loan take up is for now driven mostly by imminent liquidityneeds in the face of sharply lower business revenues.Investment for now is not a priority – especially in the moreaffected Southern Eurozone countries.
EUROZONE: FIRMS’ LOAN DEMAND DRIVEN BY
LIQUIDITY NEEDS, INVESTMENT ON THE BACKBURNERECB Q2 Bank Lending Survey: Overall demand for
loans & credit lines by enterprises (Net balance)ECB Q2 Bank Lending Survey: Drivers for
loan demand by enterprises
Sources: ECB, Refinitiv, Allianz Research Sources: ECB, Refinitiv, Allianz Research
-50
-40
-30
-20
-10
0
10
20
30
40
EZ-19 DE FR IT SP
Fixed investment
Inventories & working capital
-80
-60
-40
-20
0
20
40
60
80
100
120
Q1 Q2 Q1 Q2 Q1 Q2 Q1 Q2 Q1 Q2
Eurozone Germany France Italy Spain
NFC Housing Consumption
39
Loans given under State Guarantees
Sources: National sources, Allianz Research
0%
10%
20%
30%
40%
50%
60%
70%
80%
Sp
ain
Fra
nce
UK
Italy
Germ
any
Take-up of loan guarantee schemes(% total)
Loan guarantee schemes (% ofGDP)

© Copyright Allianz
Germany is an early-opener however a subdued growthoutlook for its key trading partners – EU & non-EU – willkeep a lid on the recovery, particularly in manufacturing.The consumer however appears more resilient, andconstruction is a key trump. After a -7% contraction in2020, GDP will grow 4.5% in 2021.
German fiscal policy is playing in a league of its own insize, timing and composition. The latest stimulus packageaimed at providing tailwind to the recovery should addaround 1ppts to GDP growth in 2020 and another 0.5pptsin 2021.
DE FR IT ES UK
Taxes
VAT √ x x x √
Income x x x x x
Corporate √ x √ √ √
Spending
Household cash transfers √ √ x x x
Job rentention scheme √ √ √ √ √
Car scrappage scheme √ √ √ √ √
Vulnerable sector support √ √ √ √ √
Public investment √ √ √ x √
GERMANY: LEADING THE RECOVERY BUT MIND
INDUSTRIAL & TRADE HEADWINDSGermany vs. Eurozone: Economic confidence in May Germany: Strong & timely tailwind for the imminent recovery
(fiscal stimulus: announced, expected, unlikely)
Sources: EU Commission, Refinitiv, Allianz Research. Source: Allianz Research
-50
-40
-30
-20
-10
0
Con
su
me
rs
Ma
nu
factu
rin
g
Se
rvic
es
Con
str
uction
Eurozone
Germany
40

© Copyright Allianz
-60
-40
-20
0
20
40
60
80
100
01-0
4
01-0
5
01-0
6
01-0
7
01-0
8
01-0
9
01-1
0
01-1
1
01-1
2
01-1
3
01-1
4
01-1
5
01-1
6
01-1
7
01-1
8
01-1
9
01-2
0
Consumer prices, next 12 monthsMajor purchases intentions, next 12 monthsUnemployment, next 12 months
41
FRANCE: WILL THE CONSUMER SAVE THE DAY?
Sources: INSEE, Allianz Research
Consumer confidence
Sources: INSEE, Allianz Research
Private consumption (% change vs. Feb 2020)
-7.2
-90
-70
-50
-30
-10
10
30M
arc
h
Ap
ril
Ma
y
Total Food
Manufactured goods Durables
Clothing Energy
Consumer spending is recovering in May, relativelystronger than in other European countries.
However, there are doubts that this would be sustainablegiven rising in unemployment fears

© Copyright Allianz
Major consumption shock in H1, investment still sufferingfrom uncertainty and funding constraints due to bankingvulnerability. Trade balance worsening due to strongdecline in tourism receipts and world trade. Relativemoderate rebound in 2021 due with GDP remaining 3%below pre-crisis level.
Public debt will increase strongly in 2020 due to fiscalmeasures and GDP drop (165% GDP). Debtsustainability is not at risk in the short term as ECBcontains risk of rising yield/spreads. Debt/GDP willremain above 140% for long period of time (~10y).
ITALY: NO REPEAT OF 2012-14, WATCH OUT FOR
POLITICAL AND MARKET HEADWINDSGDP by component, % Public debt in % of GDP (contributions)
Sources: Refinitiv, Allianz Research Sources: Refinitiv, Allianz Research
42
-15.0
-10.0
-5.0
0.0
5.0
10.0
15.0
12 13 14 15 16 17 18 19 20f 21f
Households GFCF GovernmentStocks Net Trade real GDP
Forecast
50
100
150
200
-20.0
0.0
20.0
40.0
07 08 09 10 11 12 13 14 15 16 17 18 19 20f 21f
Stock-flow adj. Impact of real growth on debtImpact of inflation on debt One-offsInterest Primary deficitChg. Debt/GDP ratio Debt/GDP ratio (rhs)
Forecast

© Copyright Allianz
THE UK: SMALL IS THE “NEW DEAL”, BREXIT-
CONSTRAINED*?
0
5
10
15
20
25
30
35
40
45
11 12 13 14 15 16 17 18 19
Thousands
SME LARGE
New loans to corporates, GBPbn
Sources: ONS, Allianz ResearchSources: ONS, Allianz Research
Real GDP during the recession,
100 = pre-recession peak
75
80
85
90
95
100
0 1 2 3 4 5
Early 80s recession (peak = Q4 79)
Early 90s recession (peak = Q2 90)
Late 00s recession (peak = Q1 08)
Current recession (peak = Jan 20)
3 years and
3months5 years and 3
months
6 years
2 years and 9
months
Sources: ONS, Allianz Research
Real wage growth, y/y
-8%
-6%
-4%
-2%
0%
2%
4%
6%
05
06
07
08
09
10
11
12
13
14
15
16
17
18
19
20
43*After 4 long years of Brexit negotiations, we expect a 5th one. Soft Brexit (70%) by Jan 2022

© Copyright Allianz
04EMERGING MARKETS

© Copyright Allianz
4%8%
9%16%
19%
25%
26%
29%
32%
39%
43%
45%60%72%84%
89%
89%
94%110%
113%
126%
132%
144%
161%
169%
18
8%2
18%
229%
356%
39
4%
0%
100%
200%
300%
400%
Net portfolio flows to EM dropped sharply to a record
low of -USD 89 bn in March. But moderate rebound
already in April (+USD23bn), May (+USD2bn) and
June (first estimate +USD33bn).
In Turkey and Argentina, gross external financingrequirements rose further from around 250% at end-2019.
EMERGING MARKETS: CAPITAL FLOWS BOTTOMING
OUT BUT RISKS OF SUDDEN STOPS STILL REMAIN
Emerging Markets: Net portfolio flows by region (USD bn) Emerging Markets: Gross external financing requirement
(% of FX reserves)
Sources: National statistics, IIF, Allianz Research estimates Sources: IHS Markit, Allianz Research
45
-100
-80
-60
-40
-20
0
20
40
60
80
100
Jan 18 Jul 18 Jan 19 Jul 19 Jan 20
Africa & Middle East Emerging Europe
Latin America Emerging Asia ex China
China

© Copyright Allianz
Turkey has by far burned the most FX reserves this
year to defend its currency – albeit with limited
success. Net FX reserves dangerously low now.
Watch out for Brazil, South Africa and Mexico.
Some EMs have begun to purchase government bonds to
ensure smooth functioning of bond markets and sufficient
liquidity for banks to support private sector credit. This is mostly
different from QE in AEs and much smaller in scale. Indonesia,
Turkey, Brazil, Poland and Croatia require monitoring.
EMERGING MARKETS: THE COVID-19 QE PROGRAMS
COULD ENDANGER CENTRAL BANKS’ CREDIBILITY Exchange rate changes vs. FX reserves changes Government bond purchase programs in EMs
Sources: IHS Markit, Allianz Research Sources: National statistics, IHS Markit, Allianz Research
46
Poland
Indonesia
Romania
Hungary
Malaysia
Mexico
-35%
-30%
-25%
-20%
-15%
-10%
-5%
0%
5%
10%
-25% -20% -15% -10% -5% 0% 5%
Chile
South Africa
Russia
Egypt
India
Brazil Saudi Arabia
Turkey
Colombia
FX
res
erv
es
(c
ha
ng
e Y
TD
in
%)
LCU vs. USD (change YTD in %)
Turkey 8,25% 9,4% Secondary 10,1% 63,8%
Indonesia 4,25% 2.8% ** Primary & secondary 38,6% 21,3%
Poland 0,10% 4,2% Secondary 23,4% 49,5%
Croatia 2,50% 3,4% Secondary na na
Thailand 0,50% 2,4% Secondary 17,2% 14,5%
Philippines 3,25% 1,6% Secondary na na
Colombia 3,25% 1,1% Secondary 24,5% 27,9%
India 4,00% 0,8% Secondary 3,6% 12,1%
South Africa 3,80% 0,7% Secondary 37,2% 35,3%
Hungary 0,75% 0,3% Secondary 18,6% 62,1%
Romania 1,75% 0,2% Secondary 19,3% na
Costa Rica 0,75% Has started *** Secondary na na
Brazil 2,25% Announced, not started Secondary 10,4% 29,4%
Chile 0,50% Announced, not started Secondary na 52,6%
Czechia 0,25% Announced, not started Secondary 40,6% 34,5%
Malaysia 2,00% Announced, not started Unspecified 25,3% 32,5%
* Both public and private debt. ** Bank Indonesia already owns about 15% of tradable government bonds.
*** Central Bank of Costa Rica was authorized and approved purchases of up to 0.7% of GDP .
Primary / secondary
market?
Size (% of GDP,
purchased since March)
Inflationary
riskCountry Policy rate
Gov. bond purchases by Central Bank Foreign-
owned local
gov. bonds
(% of total)
Total FX-
denominated
debt (% of
GDP) *

© Copyright Allianz
Easing currency pressures allowed rate cuts.
CBs in PL, TR, HU and RO began to purchase
government bonds to ensure smooth functioning
of bond markets and sufficient liquidity for banks
to support private sector credit. This is different
from QE in AEs and much smaller in scale.
Direct fiscal stimulus is still modest.
Public finances will deteriorate but remain
manageable overall.
EMERGING EUROPE: UNEVEN ROOM FOR POLICY
MANOEUVER
47
Sources: Sources:
Monetary policy accommodation Fiscal stimulus and public debt (% of GDP)
18%
12%
6%5% 5% 4% 3%
2%1%
0%
10%
20%
30%
40%
50%
60%
70%
80%
0%
5%
10%
15%
20%
Czechia
Pola
nd
Turk
ey
Ro
man
ia
Hu
nga
ry
Ru
ssia
Slo
vakia
Bulg
aria
Ukra
ine
Loans/loan guarantees Direct stimulus
Public debt ratio (rhs)
All economies in the region will be in recession.
The depth of recession is influenced by the size
and efficiency of policy measures (lockdowns
and stimulus) and, importantly, the dependence
on export of goods and services.
Sources:
Real GDP growth (%)
2019 2020 2021
Emerging Europe 2.3 -5.3 4.0
Poland 4.1 -4.1 4.2
Czechia 2.6 -7.5 5.9
Romania 4.1 -5.5 3.9
Hungary 4.9 -5.0 4.7
Slovakia 2.3 -8.5 6.4
Croatia 2.9 -7.0 6.0
Bulgaria 3.4 -5.1 5.0
Slovenia 2.4 -7.0 6.0
Lithuania 3.9 -6.4 6.0
Latvia 2.2 -7.1 6.2
Estonia 4.3 -6.8 6.0
Turkey 0.9 -4.7 4.2
Russia 1.3 -5.2 3.0
Ukraine 3.2 -6.9 4.8
-1%0%1%2%3%4%5%6%7%8%9%-900
-800-700-600-500-400-300-200-100
0100
Ukra
ine
Turk
ey
Czechia
Ru
ssia
Pola
nd
Ro
man
ia
Hu
nga
ry
Bulg
aria
Slo
vakia
Rate cuts since March Rate cuts in Jan-Feb
Current policy rate (rhs) Gov. bond purchases(% of GDP; rhs)
47

© Copyright Allianz
Huge net portfolio investment outflows in Jan-Apr
2020. Plus significant net bank debt outflows (which
were already negative in the previous four full years).
.
Net FX reserves dwindled to less than USD20bn in
May 2020 as the CB burned reserves to defend the
lira – with limited success. Expect currency
turbulences in H2 2020.
TURKEY: ANOTHER BOP CRISIS ON THE HORIZON?
Current and capital account (% of GDP) FX reserves (USD bn)
Note: 2020 data refer to January-April 2018.
48
-25%
-20%
-15%
-10%
-5%
0%
5%
10%
00 02 04 06 08 10 12 14 16 18 20
Net external bank borrowing
Net portfolio inv. inflows
Net FDI inflows
Current account balance0
20
40
60
80
100
120
140
160
07 08 09 10 11 12 13 14 15 16 17 18 19 20
Gross FX reserves Net FX reserves Gold

© Copyright Allianz
No country will escape recession, du tothe stringent lockdowns (esp. Argentina,Peru and Chile), exposure tocommodities & global trade integration.
As money supply (M2, a measure ofliquidity) has shot up, so has credit tothe private sector, indicating the pass-through of the stimulus to companies.
The policy focus was on debt financerather than unemployment support. Weexpect significant informal and formaljob losses in Latin America as a result.
LATAM: DEEP RECESSION, STIMULUS AT WORK, BUT
LARGE JOB LOSSES AHEAD
49
Sources: IMF, Euler Hermes, Sources: Macrobond, Euler Hermes Sources: Macrobond, Euler Hermes, Allianz Research
GDP growth, y/y, % Real credit to the private sector (%, y/y) Unemployment rate (%)
-30%
-20%
-10%
0%
10%
20%
30%
40%
08 09 10 11 12 13 14 15 16 17 18 19 20
Argentina Mexico
Brazil Colombia
2016 2017 2018 2019 2020 2021
Argentina -2.1 2.7 -2.5 -2.2 -8.1 5.5
Brazil -3.3 1.3 1.3 1.1 -7.0 3.0
Chile 1.7 1.2 3.9 1.0 -5.2 2.2
Colombia 2.1 1.4 2.5 3.3 -5.3 3.7
Mexico 2.9 2.1 2.1 -0.3 -7.5 2.6
Peru 4.1 2.5 4.0 2.2 -9.0 6.0
Latin
America-0.1 1.8 1.5 0.7 -6.5 3.1

© Copyright Allianz
As of June, despite easing of lockdowns, confidencehas barely recovered; this bodes ill for industrialproduction; overall, activity is still 26% below pre-crisis levels, which signals a sluggish recovery.
The Economic Policy Uncertainty index is at itshighest since early 2017. At the exit of the crisis,further tensions between the central administrationand Congress + local governors could halt reforms.
BRAZIL: CRISIS MISMANAGEMENT AMPLIFIES
RECESSION; POLITICAL RISK HEIGHTENED
Business confidence and industrial production (%y/y) Economic Policy Uncertainty Index
Sources: IHS Markit, Euler Hermes, Allianz Research Sources: Macrobond, EPU, Euler Hermes, Allianz Research
50
-30%
-20%
-10%
0%
10%
20%
30%
25
35
45
55
65
75
10 11 12 13 14 15 16 17 18 19 20
Business confidence
Industrial production, total (volume)

© Copyright Allianz
We have revised down GDP growth forthe Asia-Pacific region from +4.2% priorto the global pandemic to -1.3% in 2020(after 4.3% in 2019).
Global trade should overall remainunder pressure this year, but exposureto China could be comparativelysupportive.
Different initial conditions and economicstructures require varying levels ofpolicy supports. India, Indonesia,Vietnam and Thailand could do more toprotect employment.
ASIA-PACIFIC: PRAGMATICALLY RESYNCHING WITH
CHINA?
51
Source: National Statistics, Euler Hermes, Allianz Research Sources: IMF, Euler Hermes, Allianz Research Source: World Bank, Euler Hermes, Allianz Research
Real GDP growth (%) Exports of main 14 economies in APAC Fiscal stimulus (% of GDP)
2020 2021 2020 2021
Asia-Pacif ic 4.3 -1.3 5.9 -0.6 6.5
Australia 1.8 -4.3 3.3 -5.0 3.5
China 6.2 1.5 7.6 1.8 8.5
Hong Kong -1.3 -5.9 4.1 -4.7 4.5
India 4.2 -3.1 7.3 1.1 7.5
Indonesia 5.0 -1.5 6.2 0.9 6.7
Japan 0.7 -5.7 2.2 -5.7 2.2
Malaysia 4.3 -3.3 5.9 -3.2 6.2
New Zealand 2.2 -4.8 3.9 -5.2 3.0
Philippines 6.1 -2.7 7.6 -2.6 7.7
Singapore 0.7 -5.1 4.5 -4.1 4.9
South Korea 2.0 -1.5 3.6 -2.5 4.5
Taiw an 2.7 -0.3 3.4 -2.0 4.7
Thailand 2.4 -6.0 5.4 -4.1 6.6
Vietnam 6.9 2.3 6.0 3.1 6.7
2019New forecasts Old forecasts JP
SG
MY
HK
AUNZ
CN THVN
IN
ID
KR
PHTW
0
2
4
6
8
10
12
14
16
18
20
0 25 50 75 100
Fis
ca
l su
pp
ort
(%
of G
DP
)
Share of informal employment in total employment (%)
-15
-5
5
15
25
35
12 13 14 15 16 17 18 19 20
Total exports, 3-month %y/y
Exports to U.S.
Exports to EU
Exports to China

© Copyright Allianz
India has started to de-confine, even though datasuggest the epidemic is not yet controlled. Thismeans that activity resumption could be even slowerthan in other economies.
Risks are skewed on the downside. Policy leeway islimited by twin deficits, and a vulnerable financialsystem. In the medium run, we are more concernedabout India’s financing requirements.
INDIA: -3.1% GDP GROWTH IN FY2020-21, WITH
DOWNSIDE RISKS
High frequency indicators Twin deficits (as % of GDP)
Sources: Bloomberg, National statistics, Euler Hermes, Allianz Research Sources: IHS, Euler Hermes, Allianz Research
52
42
39.7%
8.5%
-28%
-7%
75
14,831
39
35.9%
27.1%
-65%
-32%
100
15,403
103
42.8%
7.5%
0%
-4%
10
0
Consumer sentiment index
Labour participation rate
Unemployment rate
Workplace mobility(vs. pre-crisis)
Electricity consumption%y/y
Lockdown stringency index
Daily Covid-19 cases
1 MarchCrisis peakLatest (mid-June)
-14%
-12%
-10%
-8%
-6%
-4%
-2%
0%
2%
4%
90 93 96 99 02 05 08 11 14 17 20
Fiscal balance
Current account balance Forecasts

© Copyright Allianz
Huge export losses to be expected across the regionin 2020, in particular in oil exporting countries. Onlymoderate recovery in 2021 as oil output is unlikely tobe ramped up.
All economies in the region will be in recession in2020, at diverging degrees. The slowdown/recessionwill be much stronger than in 2009.
MIDDLE EAST: TRIPLE SHOCK OF COVID-19, OIL PRICE
SLUMP AND OUTPUT CUTS HITS EXPORTS AND GROWTH
Potential export changes in 2020-21 (goods and services, USD bn) Real GDP growth (%)
Sources: IMF, Celem, IHS Markit, Allianz Research Sources: National statistics, IHS Markit, Allianz Research forecasts
53
2009 2019 2020 2021
Middle East 0.1 -0.2 -6.8 2.2
GCC -1.1 0.7 -4.6 1.8
Saudi A. -2.1 0.3 -4.0 2.0
UAE -5.2 1.7 -6.0 1.5
Qatar 12.0 -0.2 -2.3 2.0
Kuwait -7.1 0.4 -6.2 1.5
Oman 6.1 0.5 -6.5 2.2
Bahrain 2.5 1.8 -4.4 2.0
Non-GCC 1.8 -1.4 -9.9 2.7
Iran 0.0 -7.6 -15.0 3.0
Israel 1.0 3.3 -4.5 3.3
Iraq 3.4 3.9 -10.0 3.0
Lebanon 10.2 -6.5 -13.0 -2.0
Jordan 4.5 2.0 -3.0 2.4
28
25
3
10
7
4
3
5
-1
-105
-101
-39
-31
-14
-13
-8
-5
-4
-120 -100 -80 -60 -40 -20 0 20 40
Saudi Arabia
UAE
Kuwait
Qatar
Israel
Oman
Bahrain
Jordan
Lebanon
2020f 2021f

© Copyright Allianz 54
GCC: FISCAL AND EXTERNAL POSITIONS WILL
MARKEDLY WORSEN AGAIN, AS IN 2015-2016Fiscal and current account breakeven oil prices 2020f (USD/bbl)
The currency pegs limit both monetary and fiscal policy leeway.
The oil price slump translates directly into lower fiscal revenues in local
currencies since the exchange rate does not work as an automatic
stabilizer.
Hence, all GCC economies except the UAE will run twin deficits in 2020.
Sources: IMF, IIF, Allianz Research
95
86
75
6661
51
85
75
53
28
56
50
0
20
40
60
80
100
120
Bahrain Oman SaudiArabia
UAE Kuwait Qatar
Fiscal accountbreakeven oil price
Current accountbreakeven oil price
Average Brent oil price fore-cast for 2020: 47 USD/bbl
Fiscal and external balances in the GCC
Saudi Arabia, the UAE, Qatar and Kuwait have large SWFs, which can
act as buffers against the revenue shocks and softening the risk of non-
payment. But Bahrain and Oman have relatively small SWFs.
Bahrain ran already out of policy buffers in 2017 and has since
“survived” thanks to financial support from Saudi Arabia and UAE.
Oman is likely to follow in the next years. => Downgrade to C3.
Sources: IMF, IHS Markit, Allianz Research
Cu
rren
t acco
un
t b
ala
nce (
% o
f
GD
P)
Fiscal balance (% of GDP)
BahrainKuwait
Oman
QatarSaudi Arabia
UAE
Bahrain
Kuwait
Oman
Qatar
Saudi Arabia
UAE
-25%
-20%
-15%
-10%
-5%
0%
5%
10%
-25% -20% -15% -10% -5% 0% 5% 10%
2019
2020f

© Copyright Allianz
In 2020 we expect the continent to enter into recession -3.1%, for the fist time in 25 years. In 2021, we expect theGDP to rebound by +4%.
AFRICA: -3.1% RECESSION, FIRST IN 25 YEARS
GDP growth (%)
Source: Euler Hermes, Allianz Research, National statistics
55
Government debt and overall budget balance (% GDP)
Angola, Mozambique and Egypt were already strongly indebted
in 2019. On the other hand, Zambia, Egypt, Kenya, Ghana and
Mauritius already had high budget deficits before the COVID-19
outbreak.
Source: Euler Hermes, Allianz Research, IMF
2019 2020 2021
Africa 1.9 -3.1 4.0
Commoditiy exports>75%
Angola -0.5 -4.7 2.5
Algeria 1 -6.7 4.9
Nigeria 2 -3 2.5
Gabon 1.7 -1 3
Mozambique -2 -1.2 5
Services exports>35%
Tunisia 1.2 -3.9 2.7
Namibia -1 -1.5 2.5
Morocco 2.4 -3.9 5
Combined external and
domestic shocks
South Africa 0.3 -7.8 5.4
Cote d'Ivoire 7 -1.1 5.7
Kenya 5.4 1.5 5.4
Ghana 6.5 -2.5 5
Egypt 5.6 -0.5 2.2

© Copyright Allianz
THANK YOU
© Ekaterina Pokrovsky - stock.adobe.com
Allianz Research
Global Economic OutlookJuly 2020