Copenhagen - international.kk.dk · 6 Innovation and business 139 6.1 Green innovation and economic...
89
Green Economy Leader Report Copenhagen A report by the Economics of Green Cities Programme at the London School of Economics and Political Science.
Transcript of Copenhagen - international.kk.dk · 6 Innovation and business 139 6.1 Green innovation and economic...

Green Economy Leader Report
CopenhagenA report by the Economics of Green Cities Programme at the London School of Economics and Political Science.

ExecutiveSummary 71 Introduction 151.1 Objectivesofthereport 161.2 TheEconomicsofGreenCitiesprogramme 171.3 Methodology 181.4 Reportstructure 19
PARTI2 Copenhagen:agreeneconomyleader 232.1 Whatisanurbangreeneconomy? 242.2 Driversofthegreeneconomy 272.3 Copenhagen’sgreeneconomy 28
PARTII 3 GreeneconomydriversinCopenhagen 393.1 Driversofgreengrowth 413.2 Driver1:Urbanform 423.3 Driver2:Innovation 473.4 Driver3:Investment 513.5 Driver4:Skillsandemployment 533.6 Driver5:Enterprise 563.7 Driver6:Energyandresourceeffectiveness 593.8 Driver7:Lowcarbon 693.9 Driver8:Environmentalquality 74
PARTIII 4 Lowcarbon,energyandresources 834.1 Copenhagen’scarbonneutralgoal 864.2 Energy 894.3 Transport 954.4 Water 984.5 Waste 1024.6 Futurechallengesandopportunities 103
5 Urbanform,transportandaccessibility 1135.1 Land-usepolicyprogramme 1155.2 Impacts 1195.3 Futurechallengesandopportunities 136
6 Innovationandbusiness 1396.1 Greeninnovationandeconomicgrowth 1416.2 Policyprogramme 1426.3 Impacts 1536.4 Futurechallengesandopportunities 159
Acknowledgements 163
Bibliography 164
Appendix–Policytoolsandgovernance 169
Contents
LondonSchoolofEconomicsandPoliticalScienceHoughtonStreetLondonWC2A2AEUK
Tel:+44(0)2074057686
Research DirectorsGraham FloaterDirectorofSenecaandPrincipalResearchFellow,LondonSchoolofEconomicsandPoliticalSciencePhilipp RodeExecutiveDirectorofLSECitiesandSeniorResearchFellow,LondonSchoolofEconomicsandPoliticalScienceDimitri ZenghelisPrincipalResearchFellow,GranthamResearchInstitute,LondonSchoolofEconomicsandPoliticalScience
Research TeamMatthew UlterinoResearcher,LSECitiesDuncan SmithResearchOfficer,LSECitiesKarl BakerResearcher,LSECitiesCatarina HeecktResearcher,LSECities
AdvisorsNicky Gavron GreaterLondonAuthority
Production and Graphic DesignAtelier Works www.atelierworks.co.uk
The full report is available for download from: http://www.kk.dk/da/om-kommunen/indsatsomraader-og-politikker/natur-miljoe-og-affald/klima/co2-neutral-hovedstad
ThisReportisintendedasabasisfordiscussion.Whileeveryefforthasbeenmadetoensuretheaccuracyofthematerialinthisreport,theauthorsand/orLSECitieswillnotbeliableforanylossordamageincurredthroughtheuseofthisreport.
PublishedbyLSECities,LondonSchoolofEconomicsandPoliticalScience,2014.ResearchsupportforthisprojectwasprovidedbySenecaConsultantsSPRL.
Coverphotocredit:[email protected]

Figure2.1 Frameworkforassessingurbangreengrowth 27Figure2.2 GDPpercapita(US$),2003-2012 28Figure2.3 GDPpercapita,annualpercentagechange,1993-2011 29Figure2.4 GVAbyregion,1993-2012(2005-prices,chainedvalues,DKKmillion) 30Figure2.5 RegionalandDanishGDPpercapita(DKK1000,2005prices),1993-2011 30Figure2.6 Relationshipbetweennationalcompetitivenessandeconomicoutputofthe country’scapitalcity 31Figure2.7 SelectedOECDcountries,investmentsinknowledge-basedcapitalasa%of businesssector 32Figure2.8 TrendgrowthinrealGDPperhourworked,DenmarkandotherOECDcountries, 1995-2012 32Figure2.9 LabourproductivityinOECDmetropolitanregions 33Figure2.10 SustainablegrowthinCopenhagen 34Figure2.11 RelationshipbetweenenvironmentalperformanceandGVAinEuropeancities 35Figure2.12 MotorisationrateandGDPpercapitaforselectedcountriesandcities 36Figure3.1 ThechangingurbanmorphologyoftheCopenhagenregion,1900–2006 42Figure3.2 Changesinpopulationdensity:continuousurbanareaofGreaterCopenhagen, 1955–2010 43Figure3.3 Populationgrowthininner-cityCopenhagenandthewiderurbanregion, 1993–2013 43Figure3.4 ContainmentindexforselectOECDcities,1995-2005 44Figure3.5 Residentialandjobaccessibilitytorailstations 45Figure3.6 Modeshare,weekdaytripsforCopenhagen,StockholmandLondon 45Figure3.7 Localwalkingaccessibilityforadults 46Figure3.8 PatentapplicationstotheEuropeanPatentOffice(EPO),environmentaland climatechangetechnologiesbyOECDCountry,2011 48Figure3.9 TotalpatentapplicationstotheEPO2000-2009:EuropeanUnionurbanregions 49Figure3.10 Researchanddevelopmentspending:Denmarkcompared,1996-2010 50Figure3.11 Researchanddevelopmentspending:Europeanmetropolitanregionscompared 50Figure3.12 InwardFDIflows,selectedOECDcountries,annualaverage1990-2012 51Figure3.13 InwardFDIstock:1980–2011 52Figure3.14 TertiaryeducationalattainmentinselectedEuropeanurbanregions,2012 53Figure3.15 EmploymentratesinselectedEuropeanurbanregions:averagerate2001-2010 54Figure3.16 AverageGDPandemploymentgrowthinselectedEuropeanurbanregions 55Figure3.17 EU-27generalgovernmentexpenditureoneducation,%ofGDP,2011 56Figure3.18 NewenterprisesinDenmarkandtheCopenhagenurbanregion,2007–2011 57Figure3.19 ParticipationinEntrepreneurialActivity:EarlyStageEntrepreneurialActivity, Copenhagenandselectedworldcities,2001–2006 57Figure3.20 TotalenergyuseperpersoninDenmarkandselectedcountries1960-2010 59Figure3.21 Energyconsumptionbysector,Denmark,1980-2011 59Figure3.22 EnergyefficiencyinDenmarkandselectedcountries,1980–2011Figure3.23 Electricityandheatingenergyconsumption,MunicipalityofCopenhagen, 2005–2012 60Figure3.24 Electricityandheatingconsumptionbysector,2010 60Figure3.25 Totalenergyconsumptionbyfueltype:Denmarkcompared,2010 61Figure3.26 Totalenergyconsumptionbyfueltype,Denmark,2010 61Figure3.27 Fossilfueldependence:Denmarkandselectedcountries,1960–2012 62Figure3.28 Householdwaterconsumption,CityofCopenhagen,1987–2012 62Figure3.29 Householdwaterconsumption:aglobalcomparisonofselectedcities,2004-05 63Figure3.30 WasteGenerationinCopenhagen 63Figure3.31 MunicipalwastegenerationinselectedEuropeancountriesandEU27average, 1995–2011 64Figure3.32 WastecollectionandrecyclinginCopenhagen 64Figure3.33 MunicipalwastetreatmentmethodsintheMunicipalityofCopenhagenand theEU-27average,2010 64Figure3.34 DistrictheatingmarketpenetrationintheMunicipalityofCopenhagen,1970-2008 65Figure3.35 CHPshareofthermalelectricityandheatenergyproduction,Denmark,1990–2011 66Figure3.36 DistrictHeatingandCombinedHeatandPowermarketpenetration:selected countriescompared,2011 66Figure3.37 Energy-relatedtaxcollected,Denmark,1991-2008 67Figure3.38 Averagecostofwater:acomparisonofselectedEuropeancities,2004-05 68Figure3.39 C02emissionsfromtransport,heatandpowerconsumptionintheMunicipalityof Copenhagen,1991–2012 69Figure3.40 C02emissionsfromtransport,heatandpowerconsumptioninthemunicipalityof Copenhagen,1991–2012 69
Figures
Figure3.41 Fueltypesusedfordistrictheating,municipalityofCopenhagen,2010 69Figure3.42 Fueltypesusedfordistrictheating,Denmark,1980-2011 70Figure3.43 EnergysourcesforelectricityconsumptioninCopenhagen,2005–2010 70Figure3.44 Fuelconsumptionforelectricityproduction,Denmark,1980-2011 70Figure3.45 CarbonintensityofElectricityproduction:Denmarkandinternationalcomparisons, 1990-2010 71Figure3.46 CO2emissionspercapita:Denmarkandinternationalcomparisons,1971-2010 71Figure3.47 Percapitacarbonemissionsbyconsumptionsector,2010:Denmarkand internationalcomparisons 72Figure3.48 ComparisonofcurrentreportedCO2emissionsinaselectionofcities 72Figure3.49 Leadairpollution,Copenhagen,1990–2007 74Figure3.50 Sulphurdioxideairpollution,Copenhagen,1990–2000 74Figure3.51 Carbonmonoxideairpollution,Copenhagen,1994–2007 74Figure3.52 Particulateairpollution,Copenhagen,1990–2007 74Figure3.53 Nitrogendioxideairpollution,CopenhagenandDenmark,1983–2010 75Figure3.54 PM10annualmeaninselectedcities.Valuesfor2008or2009 76Figure3.55 RainwaterandwastewaterdischargesintoCopenhagenHarbour,1996–2010 77Figure3.56 NitrogendischargesintoTheSound,Denmark1989–2000 77Figure3.57 PhosphorousdischargesintoTheSound,Denmark,1989–2000 77Figure3.58 Urbangreenspace,CopenhagenandselectedEuropeancities,2006 78Figure4.1 Distributionofemissionsreductionsto2025intheCPH2025ClimatePlan 86Figure4.2 Allocationofreductionsfromenergyproductioninitiatives 90Figure4.3 DistrictCoolinginCentralCopenhagenaroundKongensNytorv 91Figure4.4 Levelsofgovernmentresponsibilityforenergypolicies 94Figure4.5 Allocationofreductionsfrommobilityinitiatives 95Figure4.6 Levelsofgovernmentresponsibilityfortransportpolicies 97Figure4.7 ResourceandextractionlevelsinDenmarkbyregion 98Figure4.8 TheprocessofclimateadaptationintheCityofCopenhagen 99Figure4.9 Levelsofgovernmentresponsibilityforwaterpolicies 101Figure4.10 Levelsofgovernmentresponsibilityforwastepolicies 103Figure5.1 CopenhagenMunicipalPlanØresundRegiondiagramofgrowthareasand transportconnections 116Figure5.2 Importanceofland-usepolicygoalsinCopenhagen 117Figure5.3 ImportanceoftransportpolicygoalsinCopenhagen 118Figure5.4 ResidentialpopulationdensitymapsforCopenhagen,BarcelonaandLondon 120Figure5.5 EmploymentdensitymapsforCopenhagen,StockholmandLondon 121Figure5.6 Copenhagenpopulationandemploymentdensitymix2012 123Figure5.7 Copenhagenjobs-populationbalanceindicator 124Figure5.8 Copenhagenpublictransportnetworksandurbandensity 125Figure5.9 StockholmandLondonpublictransportnetworksandbuilt-uparea 125Figure5.10 Copenhagenchangeinpopulationandworkplaceemployment2004-2012 126Figure5.11 Residentialaccessibilitytopublictransportstations 127Figure5.12 Employmentaccessibilitytopublictransportstations 127Figure5.13 Residentsandjobsinwalkingdistance(500metres)ofpublictransportstations, metropolitanregion 128Figure5.14 CopenhagenPublicTransportModeltraveltimeexamples 129Figure5.15 Copenhagen:totalpopulationwithin30minutespublictransporttripofworkplaces 130Figure5.16 ModalsplitbyweekdaytripsintheCityofCopenhagenandaselectionof internationalcitiesSource:LSECitiesbasedonmultiplesources 133Figure5.17 Passengerkilometresbymode,weekdaytrips,forCopenhagen,Stockholm andLondon 134Figure6.1 Fivekeyindicatorsforinnovation 144Figure6.2 Nordhavnen(left,existinglandarea,outlinedinwhite;right,renderingofrealised planwithadditionalgreenspacefromreclaimedland) 145Figure6.3 NordhavnenGreenLoopFigure6.4 NordhavnenMetro 146Figure6.5 OverviewoflevelofinvestmentresultingfromtheCloudburstManagementPlan 150Figure6.6 CityofCopenhagen,percentageoforganicfoodinallmunicipalinstitutionsand kitchens 151Figure6.7 FrameworkoftheGlobalInnovationIndex 153Figure6.8 GrowthinProductivity–comparisonbetweenGreenGrowth,WelfareTechnology, Manufacturing,andGreaterCopenhagen,2003-2009 157Figure6.9 Ecoindustriesfirmperformance2010-2013,CopenhagenCapitalRegion 158Figure6.10 Compositeindicatorscoresforregionalbusinessenvironmentcomparedtochange inannualrevenuesandchangeinoutput2010-2013 158

Tables
Table3.1 LeadingregionsforinnovationinEurope. 47Table4.1 Energysupplyanddemand:strategicpolicypathways 104Table4.2 Transportandmobility:strategicpolicypathways 107Table4.3 Wastemanagementandwaterefficiency:strategicpolicypathways 109Table5.1 CopenhagenCityandMetroRegionPopulation,2004and2012 122Table5.2 Publictransport&walkingmodelmeanaccessibilitytime&distancetoalljobs, StockholmandCopenhagen 131Table5.3 Travelsurveyjourney-to-worktimesforStockholm,CopenhagenandLondon 132Table5.4 Travelsurveytimesforallweekdaytrips,Stockholm,CopenhagenandLondon 132Table5.5 Totalannualvalueoftimecosts,journey-to-work 132Table5.6 TransportCO2emissionspercapita,municipalresidents 135Table6.1 GreenGrowth,WelfareTechnology,andManufacturing:KeyEconomicFigures2009 156
EXECUTIVESUMMARY
9ExecutiveSummary8
Objectives
This independent report has been prepared by the Economics of Green Cities Programme at the London School of Economics and Political Science in partnership with the City of Copenhagen. The overarching aim of the report is to provide an overview of Copenhagen’s green economy and assess some of the major challenges.
Copenhagen: a green economy leader
Copenhagen is widely recognised as a green economy leader. The wider Copenhagen region accounts for 39% of Denmark’s output and has enjoyed stable growth over the long term. Copenhagen’s growth has been delivered at the same time as improving environmental performance and transitioning to a low-carbon economy.
At the national level, Danish GDP per capita ranks in the top 10 countries in the world and the country is one of the 15 most competitive economies globally. Denmark’s small, open economy is characterised by innovative, hi-tech services and manufacturing for export; and a large, effective public sector.
Copenhagen remains one of the most productive cities in Europe, with gross value added exceeding US $83,000 per worker in 2010. However, productivity and income in other OECD countries and cities have been catching up with Denmark over the last decade. Relatively slower employment and productivity gains over recent years have been identified as an area of concern by Copenhagen policy makers.
Drivers of Copenhagen’s green economy
Copenhagen’s high levels of income and environmental performance are underpinned by a strong combination of the city’s eight green economy drivers. A number of these drivers rank among the best in Europe and the world, including urban form, innovation, skills and employment, low carbon, and environmental quality.
Energy and resource effectiveness and low carbon drivers are central to Copenhagen’s goal to be carbon neutral by 2025, and have potential for substantial additional policy support, in particular with regard to the district heating system, energy efficiency, waste management and decarbonisation of the transport sector.
While Copenhagen’s drivers of investment and enterprise perform strongly at an international level, other high performing cities and countries are closing the gap and, in some cases, overtaking. National rates of Foreign Direct Investment compared to other high performing countries represent a particular risk to Copenhagen’s growth.
Driver 1: Urban form. Copenhagen’s relatively compact urban form is a result of its 1947 Finger Plan, which has largely concentrated development along the city’s main public transport corridors. Growth over the past decade has been stronger in inner city areas compared to the suburbs, reversing a post-war trend.
Driver 2: Innovation. Denmark is one of the leading countries on innovation, and the Copenhagen Capital Region is a globally important centre for innovation development. Copenhagen’s range of high quality tertiary education and research institutions, with their linkages to private business, is likely to contribute to its innovation excellence. Research and development (R&D) spending in Denmark, at 3.1% of GDP, is one of the highest in the OECD. However, further research is required to assess how these input factors are translating into growth.
ExecutiveSummary Driver 3: Investment. Copenhagen’s levels of Foreign Direct Investment (FDI) are relatively high, and the Copenhagen Capital Region has been particularly attractive to businesses in the ICT and life sciences sectors. However, national FDI levels have remained largely unchanged between 2000 and 2011, with FDI stock ranging between 45 and 52% of GDP. Over the same period, FDI in other European countries has grown more rapidly, and Denmark is now close to the EU-27 average. This could be a risk to Copenhagen’s growth and competitiveness.
Driver 4: Skills and employment. Copenhagen has a highly-skilled workforce and low unemployment. Copenhagen has the European Union’s fifth-highest rate of adults with a university degree at 46% - a rate that exceeds Denmark’s four other regions by a large margin. The city’s 7.7% unemployment rate in 2012 is also 2.5 points lower than the EU average.
Driver 5: Enterprise. Copenhagen is a city of entrepreneurship. Around one-third of Denmark’s enterprises are registered in the Copenhagen Capital Region, accounting for almost half of Danish business exports and, at US $175 billion, 44% of the country’s total business turnover. The number of adults reported as involved in ‘early-stage entrepreneurial activity’ is well above levels in many wealthy East Asian and European cities, although below several cities in the UK, Germany, Australia, and North America. However, SMEs report more difficulties in securing access to finance in Denmark compared to some other OECD countries.
Driver 6: Energy and resource effectiveness. While Copenhagen’s economy continues to grow, total energy consumption has been reasonably stable. Per capita consumption of household district heating energy and electricity fell by around 10% between 2005 and 2011. Water efficiency in the city is also high, with 108 litres consumed per capita per day in 2010 – 36% lower than in 1989. Municipal waste production in Copenhagen has fallen by 19% between 2006 and 2010. In 2010, 71% of waste was incinerated, 27% was recycled, and only 2% was sent to landfill.
Driver 7: Low carbon. Copenhagen is already a low carbon city by international standards. Carbon emissions have dropped consistently between 1991 and 2012, from 7.9 to 3.2 tonnes per person. This is largely due to district heating expansion and national wind energy deployment. However, continued policy support and business innovation will be needed to meet Copenhagen’s ambitious carbon-neutral target by 2025. Achieving net-zero transport sector emissions will be particularly challenging.
Driver 8: Environmental quality. Air quality in Copenhagen has improved substantially over the past 20 years due to energy and transport policies. SO2 pollution fell by 83% between 1990 and 2000, while carbon monoxide fell by 72% between 1994 and 2007. However, PM10 levels remain above the World Health Organisation guideline of 20ug/m3, while NO2 levels remain high in the city centre. Water quality has improved significantly over the last 20 years. Swimming in Copenhagen’s harbour has become an iconic symbol of Copenhagen’s recent pollution remediation efforts and broader economic restructuring away from locally polluting industries.
Copenhagen’s policy programmes
If Copenhagen is to maintain its international competitiveness along with high levels of environmental performance and long-term sustainable growth, integrated policy programmes will be required that are effective and efficient. Three broad strategic areas are of particular importance to Copenhagen’s future as a green economy leader:
• Low carbon, energy and resources. Meeting Copenhagen’s highly ambitious goal to be carbon neutral by 2025 will require a number of major strategic policy and infrastructure investment decisions. Policy decisions taken in the next few years may lock in pathways that are challenging and costly to reverse.
• Urban form, transport and accessibility. Maintaining Copenhagen’s relatively compact urban form, continuing to increase cycling rates, and increasing efficiencies in the public transport system will play important roles in meeting the city’s green growth objectives.
• Innovation and business. Maintaining Copenhagen’s leading position as a cleantech cluster and in public private partnerships, and providing effective support for growth in innovation, inward investment and enterprise will influence the growth of the city’s green economy.

11ExecutiveSummary10
Low carbon, energy and resources
Copenhagen is a global leader in a range of low-carbon policies, including extensive district heating, combined heat and power generation, and high rates of cycling. Furthermore, the 2025 Climate Plan, created in 2012, proposes to make Copenhagen the world’s first carbon-neutral capital city. The plan aims to complement and coordinate the objectives of several other existing policy frameworks in energy, transportation, development planning, and waste. While Copenhagen is starting from a very strong base, this highly ambitious carbon-neutral target will require rapid and sustained policy action in order to deliver a transformative agenda. Other Copenhagen policy initiatives for water supply and wastewater management support Copenhagen’s already strong performance in resource efficiency.
Under Copenhagen’s carbon-neutral target, two strategic areas emerge as particular challenges (and economic opportunities): (a) energy supply and demand, (b) transport and mobility. At the same time, reducing emissions from electricity supply will require strong national policies for decarbonisation of the national electricity grid.
Eliminating fossil fuels from energy supply will require an integrated approach based on fuel substitution, integration of distributed energy resources to the energy network, and improved efficiency. Existing generation technologies and waste management practices may need to evolve and could require substantial investments in infrastructure as well as changes in management and institutional arrangements.
In the near term, strong momentum exists to replace coal with biomass as the primary fuel for the city’s combined heat and power generation plants. This makes effective use of existing assets and allows near-term carbon reductions to scale quickly. At the same time, implementation of management practices to ensure the sustainability of the biomass supply is needed. Reducing energy demand, principally in buildings, will also be important.
Although fuel substitution will continue in the near term, other energy supply and management options are available in the medium term and should be examined further by the City of Copenhagen. These are linked to initiatives for energy efficiency. Potential pathways include:
(1) increasing investment in gas / biogas generation for district heating and in integrated grid energy storage to increase system flexibility and allow for more seamless integration of intermittent renewable energy such as wind and solar;
(2) reducing the proportion of waste (including plastics) in the district energy fuel mix;
(3) increasing the amount of distributed generation controlled through micro-grids, and scaling down or replacing the district heating system with a combination of electric heating (such as air source heat pumps) and micro-renewable generation and storage within buildings; and
(4) removing barriers to energy efficiency improvements and significantly scaling up energy efficiency retrofits in buildings, which is particularly important for increasing the effectiveness of micro-generation and micro-grids.
Eliminating fossil fuels from transport will require an integrated approach to policies on public transport, non-motorised mobility, and electric / hydrogen vehicles. The Copenhagen carbon-neutral plan recognises that direct decarbonisation by 2025 is not feasible and that carbon offsets will deliver a majority share of the sector’s carbon-neutral total. Of the 544,000 tonnes of CO2 emissions attributed to the transport sector, 409,000 tonnes will be reduced via offsets. Nonetheless, Copenhagen has a number of policy options to meet its direct 2025 reduction of 135,000 tonnes, with further decarbonisation of the sector in the longer term.
At the strategic level, the city will face choices over the policy priority given to promoting clean vehicles in relation to other transport and land-use policy programmes, and managing potential conflicts in how infrastructure is allocated to various modes. Choices made in the transport sector can also influence how carbon emissions are driven down in the energy sector generally, for example in the case of electric vehicles also providing distributed energy storage services.
A range of alternative pathways for eliminating carbon from Copenhagen’s transport sector, and the policy instruments required for shaping these pathways, should be investigated further by the City of Copenhagen. Alternatives include:
(1) investing further in cycling infrastructure;
(2) improving the efficiency and integration of the mass transit network, partly through deployment of ‘smart’ mobility ICT infrastructure; and
(3) providing infrastructure for, and actively incentivising, electric or hydrogen vehicles.
The City of Copenhagen has a high degree of control over policy levers in the two areas of heating energy and transport, though both will require policy coordination with the national government.
Urban form, transport and accessibility
Copenhagen has a long history of effective land use and spatial planning that strongly influences its environmental performance and has supported low-carbon growth. Its development largely along defined transit corridors means that transport accessibility in Copenhagen compares favourably to large world cities such as London and New York, and substantially outperforms low density car dominated cities such as Los Angeles and Sao Paulo.
Copenhagen’s population is expected to grow by 100,000 people in the period to 2025. To accommodate this, policy and investment frameworks for land and infrastructure development are prioritising mixed-use, inner-urban / brownfield development areas. Copenhagen’s Municipal Plan identifies major transport connections, employment centres, and the main development locations or ‘Action Plan Areas’ to which growth will be directed. Provisions under the Danish Planning Act also include the ‘Station Proximity Principle’, which generally requires new large offices of more than 1,500m2 to be located within 600m of a railway station.
Transport policy is focused on reducing carbon emissions, reducing congestion and private vehicle use, increasing multi-modal integration, and increasing cycling, walking and use of public transport. These policies underpin Copenhagen’s objectives to be the “world’s best bicycle city” and for a minimum of 50% of journey-to-work and school trips to be made by bicycle by 2015. At present, cycling is used for 20% of all trips in Copenhagen - one of the highest rates in the world.
Central Copenhagen has a dense urban core with a high degree of land-use diversity and integration of living and working environments. Its city centre peaks at 25,340 residents per km2. London, though a much larger city, has a similar peak residential density. Copenhagen’s high inner-urban employment density and the clear dominance of central Copenhagen as an employment node are both similar to Stockholm.
Investments in its relatively new light rail ‘Metro’ network will improve access for people in Copenhagen, particularly with station proximity being within 500 metres. Travel times across different modes are also low in Copenhagen. This translates into significant economic benefits compared to Stockholm and London, where transport costs account for 5.8% and 8.36% of gross value added respectively, compared to a figure of 3.4% in Copenhagen. However, public transport journey times are considerably longer than car journeys in Copenhagen. This adds to the challenge of shifting transport away from private vehicles, which currently account for roughly 40% of mode share.
Carbon emissions have been reduced effectively from the transport sector over the period 2000 to 2010, reversing the trend in the previous decade. However, sustained policy efforts will be required to shift further away from private vehicles to other modes. Mass transit ridership shows scope for improvement. Addressing regional fragmentation in bus route planning can assist in this, along with better coordination to achieve operational efficiencies. Delivering the supporting infrastructure for low-carbon mode choices will require collaboration between multiple actors: Copenhagen and the Danish government for light and heavy rail, and multiple local municipalities for bus services.

13ExecutiveSummary12
Support from national and regional government is also needed to ensure that areas with significant growth pressures, e.g. in the vicinity of Copenhagen Airport and ring-road locations, have the infrastructure in place to minimise trips by private vehicles.
The City of Copenhagen has set highly ambitious goals to extend cycle use further. It is unclear whether the positive feedbacks, in terms of infrastructure and the existing cycle culture in Copenhagen, can continue to raise cycling substantially, or whether certain demographics will resist making a modal shift. Consequently, the City of Copenhagen’s broader approach to sustainable travel, including promoting use of public transport, walking and multi-modal trips - alongside cycling - should continue.
Innovation and business
Evidence suggests that the cleantech industry in Copenhagen and Denmark has strong growth and is highly productive. The 2013 European Cluster Excellence Scoreboard ranked the cleantech industry in Copenhagen first for growth in annual revenues; and second for growth in output and profit between 2010 and 2013. Other analysis on the cleantech sector nationally has shown that productivity rates were substantially higher between 2003 and 2009 in cleantech than in manufacturing and welfare technology, two nationally important industries. Turnover in Danish cleantech in 2010 was over DKK 250 billion (US$46 billion), representing 9.2% of the national total. Cleantech also accounted for 10.4% of total Danish exports and more than 8.5% of employees in Danish enterprises in 2010.
Clustering is also a key strategy for drawing the Copenhagen business community, research sector, and government organisations into partnerships. The Copenhagen Cleantech Cluster (CCC) is one of the world’s leading organisations for building networks and for promoting commercialisation of goods and services that contribute to green economic growth.
Local and national policies on climate change and urban environmental quality have created business opportunities for local firms to apply their technologies and services. Experiences gained in Copenhagen become part of these firms’ brand for export. Integrated strategies for large urban development projects such as Nordhavnen will help Copenhagen continue to act as a test bed for urban green growth.
At the same time, Danish policy support for innovation is focused on education, supporting business growth, and investment in research and development. Denmark ranks third in the EU-27 2013 EU Innovation Scorecard, and had the highest average growth rate (2.8%) in innovation performance between 2008 and 2012 of the top performing four countries.
Although Copenhagen’s cleantech sector is very strong both nationally and internationally, areas exist for potential improvement. Challenges facing innovation and green business in Copenhagen include: barriers to attracting private investment at scale for low-carbon technology and resilient infrastructure; insufficient information for investors, entrepreneurs and the city government to make effective investment and business decisions; and the growth in competition in international markets.
These challenges have come at a time of continued low to moderate growth in the EU and wider global economy. Furthermore, the Danish economy has witnessed lower growth in productivity, employment and GDP compared to some comparable countries in the OECD over the past decade. Consequently, policy coordination between the City of Copenhagen and the national government will be important for overcoming the barriers to growth in the cleantech sector.
In terms of finance barriers, investors in low-carbon solutions typically trade higher upfront costs for longer term savings, whether in the form of reduced energy consumption through efficiency upgrades, or in low marginal cost energy supply sources such as wind and solar. Facilitating a match of finance sources to these longer return horizons, and shifting upfront costs into long, steady returns, will be important.
The City of Copenhagen, in collaboration with the national government, could pursue a number of options to address finance barriers in the cleantech sector, and create opportunities through public-private collaboration, including:
(1) scaling the market for energy efficiency retrofits by leading or facilitating activities for bundling small retrofit projects into larger more bankable projects, backstopping energy savings guarantees, or tying energy efficiency loan obligations to the property rather than the occupant;
(2) establishing an institutional mandate by seeding investment in a public-private ‘Green Bank’;
(3) increasing participation in the green bond market; and
(4) exploring models of public-private partnership for delivering goods and services, including those traditionally delivered by the public sector.
In terms of information barriers, governments at all levels have a role to play in collecting and disseminating information to help investors and entrepreneurs make effective decisions for business growth. Transparent and targeted information can motivate and inform entrepreneurs and investors of the scale of the opportunity, facilitate information symmetry for more realistic pricing of risk and confidence between counterparties (including public-private finance and innovation collaborations), and support policy decision-making and validate policy choices for green economic growth.
The City of Copenhagen could pursue a number of options to overcome information barriers so that investors and entrepreneurs can make more effective investment and business decisions. These include:
(1) working closely with the national government to create standardised accounting and reporting tools for the cleantech sector and for setting up natural capital accounts; and
(2) working with researchers, insurers, utilities and regulators, to develop risk-sharing metrics for low carbon and adaptation programmes, which can also be used in policy formulation.
In terms of capturing opportunities in larger markets - both regionally and internationally - the City of Copenhagen could examine subsectors of green products and services where Copenhagen and Denmark have a comparative advantage globally. Identifying and developing niche sectors will become increasingly important as competition in the global low carbon market intensifies.
The City of Copenhagen should also promote greater cross-border collaboration with the research community and other partners in energy services to help create a larger, stronger regional market for low-carbon energy and other cleantech goods and services. This would reflect the shared regional ambition for a transition to low carbon (though with differing timeframes) and increase integration of renewable energy into the regional energy grid. As the last incremental steps towards carbon neutrality in the years closest to 2025 will be the most challenging and costly to achieve, this regional focus may provide greater flexibility.

15Introduction14
Copenhagen city centre seen from above.Credit:CityofCopenhagen
1
INTRODUCTION

17Introduction16
Key messages
TheobjectivesofthisReportareto:
lExaminethestrengthofCopenhagen’sgreeneconomycomparedtoothercitiesin Europeandworldwide.
lAssesstheeightdriversofCopenhagen’sgreengrowth:urbanform,innovation, investment,skillsandemployment,enterprise,energyandresourceeffectiveness, lowcarbon,andenvironmentalquality.
lExaminemajorintegratedpolicyinitiativesinCopenhagenaimedatstrengthening thegreeneconomy.ThesepolicyprogrammescanprovidelessonsforCopenhagen’s futurepolicydirectionaswellasforothercitiesthatcanlearnfromCopenhagen’s experience.
lIdentifyalternativestrategicpathwaysforCopenhagen’sfuturegreengrowth,and areasofpolicyandeconomicresearchthatthecitycouldprioritisetoanalysethese pathways.
Threebroadstrategicareasforthecity’sgreeneconomywereexamined:
lDeliveringCopenhagen’sgoaltobecomecarbon-neutralby2025.Ambitiouspolicy decisionstakeninthenextfewyearswillhaveacriticalimpactonmeetingthegoal.
lMaintainingCopenhagen’scompacturbanformanditsleadershipincyclingmode share,andstrengtheningitspublictransportsystem.
lMaintainingCopenhagen’scompetitivebusinessenvironmentandproviding effectivesupportforthegrowthofcleantechnologyinnovation,inwardinvestment andenterprise.
1Introduction
1.1 Objectives of this Report
The overall aim of this Report is to assess the early action policies that have led Copenhagen to emerge as a green economy leader today, and to examine the long term strategic options facing the city if Copenhagen is to maintain its leading position in the future. In particular, the Report has the following objectives:
1. Examine the strength of Copenhagen’s green economy compared to other cities in Europe and worldwide.
2. Assess the eight drivers of Copenhagen’s green growth: urban form, innovation, investment, skills and employment, enterprise, energy and resource effectiveness, low carbon, and environmental quality.
3. Examine major integrated policy initiatives in Copenhagen aimed at strengthening the green economy. These policy programmes can provide lessons for Copenhagen’s future policy direction, as well as for other cities to learn from Copenhagen’s experience.
4. Identify alternative strategic pathways for Copenhagen’s future green growth, and areas of policy and economic research that the city could prioritise to analyse these pathways.
The Report examines the strength of Copenhagen’s drivers of the urban green economy, reviews past and current green policy programmes to determine their potential impact on these drivers, and recommends areas for further research in particular strategic areas.
The aim of this Report is not to undertake a detailed economic cost-benefit analysis of Copenhagen’s policy programmes – a task that would require substantial time and resources. Furthermore, such an undertaking would not be able to capture the considerable diversity of direct and indirect channels through which economic and environmental policies impact on the wider economy.
Narrow cost-benefit analyses on the impact of green policies on economic growth often fail to provide the whole economic picture: both the socio-economic costs of negative externalities (e.g. from climate change and local pollution); and the wider benefits that green cities can foster (e.g. attracting young entrepreneurs and skilled professionals through a green, high-tech urban environment) which can be underestimated or entirely ignored. Indirect costs of green policies on the wider economy are also challenging to measure quantitatively.
Three broad strategic areas for the city’s green economy are worth mentioning here. The first is Copenhagen’s goal for carbon neutrality by 2025. While Copenhagen has done very well to position itself in relation to this goal, it is a big challenge that will require significant short-term action. Ambitious policy decisions taken in the next few years will have a critical impact on meeting the objective, but run the risk of creating system- or technology lock-ins that are less optimal in the longer term and difficult to reverse. For this reason, the Report reviews potential policy pathways that will impact on the City of Copenhagen’s ability to meet its carbon target effectively, efficiently and equitably, as well as indicating economic opportunities that well-designed policy frameworks for meeting the target could create and support.
The second broad strategic area is maintaining Copenhagen’s relatively compact urban form and its position as a world leader in cycling mobility; and strengthening its public transport system. As a result of early strategic planning which began in the 1940s, the city’s development is focused along several linear corridors that are well served by mass transit. This provides very high levels of accessibility. Building on this success, the Report reviews potential opportunities for land-use strategies and infrastructure decisions that could reduce overall travel demand in the future, as well as strengthening alternatives to car travel.
The third strategic area is Copenhagen’s objective to maintain its competitive business environment and provide effective support for the growth of clean technology innovation, inward investment and enterprise. Green innovation can be stimulated both through targeted support for clean technology companies and through support to more generic technology companies that may have a branch in the clean technology business or could be supported to move into new green growth markets created by national, regional and city policy frameworks.
One important part of Copenhagen’s carbon footprint that is not included in the scope of this Report is its consumption patterns. Clearly, the consumption of imported, energy intensive goods such as plastics, steel, aluminium and a large range of manufactured products fosters growth in emissions from other parts of the world (e.g. China and India). Furthermore, while Copenhagen itself represents a knowledge economy, it also relies on the products of heavy industry in the greater metropolitan region and in other parts of Denmark. While consumption impacts are not within the scope of this Report, it is an area that the City of Copenhagen may wish to explore in the future.
1.2 The Economics of Green Cities Programme
This Report forms part of a wider research programme at the London School of Economics and Political Science (LSE): the Economics of Green Cities (EGC). The EGC is a global collaborative programme chaired by Lord Stern at the LSE. The Programme was set up with the aim of examining the risk-adjusted costs and benefits of green policy frameworks on the sustainable economic growth of cities in different parts of the world. The purpose is to provide robust, evidence-based recommendations for city and national policy leaders and other stakeholders.In particular, the two key areas that the Programme focuses on are:
• theeconomicrationaleforcitiestoundertakeearly-actiongreenpoliciesindevelopedand developing countries; and
• thepolicyprogrammes,institutionsandtoolsthataremostpromisingforpolicymakersto implement, measure and monitor green city policies.
The EGC Programme focuses on the effects of early action versus delayed action green policies. Currently, there is a lack of rigorous analysis of early mover advantage in the transition to green city economies. While narrow economic studies have been carried out on the costs of green infrastructure, these rarely take account of the longer term and indirect economic impacts,

19Introduction18
including the negative externalities of pollution, climate change and reductions in green space. The Programme examines the economic impacts of innovation, new technologies and new markets that are created by early versus delayed action.
The Programme also takes an integrated approach to the green economy. While discrete sectoral approaches are useful for national and international policy making, city policy strategies require a particularly strong integrated approach. For example, planning decisions that lock in urban form, such as the layout of buildings, transport routes and green space, affect the policy options available, or required, for reducing carbon emissions and air pollution, promoting innovation clusters and attracting professional workers and companies to the city. The Programme uses integrated methods to examine the most promising policy instruments, financing models and partnerships that can maximise the net benefits of investing in green infrastructure and technology.
The LSE collaborates with a wide range of other public research institutes and private sector research groups under the EGC Programme. Working with international organisations such as the World Bank and OECD, the Programme draws on a wide range of expertise and data. Considerable research support for this Report was provided by The Climate Centre (TCC Seneca) in Brussels.
1.3 Methodology
The overall research approach aims to position Copenhagen in a global context, as well as providing a detailed examination of specific policy programmes within the City of Copenhagen, the Copenhagen Capital Region (Hovedstaden), and Denmark. A range of methods were used in the review, drawing on data and information from a diversity of sources. Methods included desktop reviews of policy documents and academic literature; interviews with policymakers and business sector representatives; roundtables held with participants from the public, private, and research sectors; analysis of statistical data; and geographic mapping and spatial analysis of Copenhagen. In addition, the review drew on the LSE Cities global research on urban green economies, including the LSE Cities/ICLEI global cities survey undertaken in 2012, and specific research on other leading green economy cities such as London, Stockholm, Hong Kong, Barcelona, Portland Oregon and Berlin.
The drivers and policy instruments of Copenhagen’s green economy are benchmarked using a range of comparators. Time series are used to examine Copenhagen’s growth and changes in key variables over time. Time series data ranges from several decades to less than 5 years, depending on the availability of data. Copenhagen’s green economic drivers are also compared to other regions in Denmark in order to examine the strength of its growth relative to the national average and to other leading regions in Denmark. As a capital city and a green economy leader, Copenhagen’s performance is also compared to other capital cities and leading green economies around the world. Where impacts on Copenhagen’s green economy are closely linked to national policies, and where comparable data across world cities is not sufficiently robust, international comparisons of indicators are made between Denmark and other countries.
Part II of this Report makes extensive use of internationally comparable quantitative indicators to assess Copenhagen’s green economy and growth, along with the underlying eight drivers of the green economy.
Part III of the Report uses sectoral analyses to investigate city-level policy programmes more closely. The sectors were selected to include the range of Copenhagen’s most important green economy policy programmes; and to enable examination of how municipal-level public policy is supporting all eight green economy drivers identified by the Economics of Green Cities Programme’s framework for green economy leaders.
Statistical data was used to examine time series and comparisons between Copenhagen and other cities and regions. Data was sourced from the Danish government, the City of Copenhagen, international organisations such as the World Economic Forum (WEF), Eurostat, United Nations, World Bank, Organisation for Economic Cooperation and Development (OECD), World Health Organisation (WHO), and the global database held by LSE Cities. The majority of data is publically available. The review also drew on additional data held by the City of Copenhagen.
In undertaking global comparisons, comparative analysis of cities was undertaken where data was available. In many cases, however, city-level data for comparison was not available and in some cases illustrative comparisons at the national level were used.
A further important element of the research methodology involved spatial analysis of urban areas. Combining spatially-defined demographic data with information on transport infrastructure and land-use patterns was particularly important for the land-use and transport case studies.
This Report drew on the LSE Cities global survey of city governments conducted in 2012 (for a summary of results previously published see (Rode, Floater et al. 2012). The survey targeted elected representatives and city government officials and was conducted as an online survey available in English, Chinese and Spanish. A total of 90 cities responded to the survey, including Copenhagen. The cities represented a diverse range of city types and sizes located across different geographic regions (Europe, Americas, Asia and Africa).
The survey included an overall questionnaire of 40 questions, with sections on green policies, green economy, smart city technology, green policy assessment and roles, actors and governance. In addition, six shorter sector-specific surveys provided more detailed information about green economy progress in the following sectors: buildings, energy, land use, transport, waste and water. Responses to questions from the global sector-based survey were collated, averaged and given quantitative weightings to produce results that could be compared to those from the Copenhagen survey.
One-to-one interviews were also conducted with a mix of public-sector policy makers and representatives from private-sector businesses involved in each of the policy programmes. The interviews were designed to reveal different perspectives and attitudes on the challenges and opportunities of establishing a policy environment conducive to green growth. Similarly, group roundtables were held in Copenhagen – one focused on broad, strategy setting, and a second on policy implementation – to generate perspectives on the key challenges facing Copenhagen in meeting its carbon and climate change objectives, and opportunities for creating new policy pathways and solutions around green growth.
1.4 Report structure
This Report is structured in three parts. Part I defines what is an urban green economy and presents the framework used to assess the drivers of the urban green economy. The framework focuses on eight key drivers: 1. urban form; 2. innovation; 3. investment; 4. skills and employment; 5. enterprise; 6. energy and resource effectiveness; 7. low carbon; and 8. environmental quality. The market failures hindering these drivers are discussed, along with the main policy instruments available to overcome the barriers. This section also examines Copenhagen’s green economy through the city’s current economic performance in terms of competitiveness, labour productivity and output.
Part II explores the eight drivers of Copenhagen’s green economy in more detail and compares each against national and global benchmarks. The development of each driver is also examined over the long term to provide a more comprehensive understanding of how the driver has strengthened or weakened over time.
Part III examines the city’s integrated policy programmes in place today and their potential impact on the eight drivers of the green economy. Areas of further research are recommended in particular strategic policy areas. Chapter 4 examines the city’s policies for supporting energy and resource effectiveness, the low carbon transition, and environmental quality (including reduced air pollution). The chapter covers five key sectors in this area: energy, buildings (including energy efficiency), transport (including low carbon vehicles), water and waste. The chapter concludes by identifying cross-cutting strategic areas for particular policy attention that will be central in defining the long-term pathways to Copenhagen’s future green economy.

21Introduction20
Copenhagen’s compact urban form is a key driver of the city’s green economy, impacting through agglomeration economies, more efficient energy use and lower carbon emissions. Chapter 5 analyses employment accessibility, travel time efficiency and transport sustainability and benchmarks Copenhagen’s performance against relevant comparator cities, principally in Europe. The chapter also discusses future challenges and opportunities for the development of Copenhagen’s urban form.
Finally, Chapter 6 examines the role of the private sector, public research, and the effectiveness of Copenhagen’s collaboration with the business and research sectors in stimulating green innovation and clean technology. The chapter concludes by discussing future challenges and economic opportunities for maintaining and growing the city’s position as a leading knowledge-led economy.
An appendix is included of the full survey results for Copenhagen from the LSE Cities Going Green study.

23Copenhagen:agreeneconomyleader22
At an international level, Copenhagen consistently ranks very highly for quality of life, innovation, and competitiveness.Credit:Tiberio Frascari
2
COPENhAGEN:AGREENECONOMYLEADER

25Copenhagen:agreeneconomyleader24
Key messages
Agreeneconomyleaderisacitythatdisplayshighproductivityandeconomiccompetitiveadvantageintheshortterm,aswellashighandgrowinglevelsofenvironmentalperformanceandlong-termsustainablegrowth.
Thereareeightkeydriversoftheurbangreeneconomy:1.urbanform;2.innovation;3.investment;4.skillsandemployment;5.enterprise;6.energyandresourceeffectiveness;7.lowcarbon;and8.environmentalquality.
Thesedriversareexposedtoanumberofmarketfailuresandinstitutionalbarriersthatreducetheirimpactoneconomicgrowth.City,regionalandnationalgovernmentscanusearangeofpolicyinstrumentstoovercomemarketfailuresandstrengtheneconomicgrowth,including:urbanplanningandregulation;pricing;publicfinance;publicprocurement;andinformation.
Ifthesepolicyinstrumentsaretobesuccessful,citiesalsoneedstronginstitutionalfundamentals,includingcityleadership;governanceatnational,stateandcitylevels;andcollaborationandpartnershipsbetweenthepublicandprivatesectors.
Atthenationallevel,DanishGDPpercapitaisrankedinthetop10countriesintheworldandisoneofthe15mostcompetitiveeconomiesglobally.Thesmall,openeconomyischaracterisedbyinnovative,hi-techservicesandmanufacturingforexport.ThewiderCopenhagenregionaccountsfor39%ofDenmark’soutputandhasenjoyedstablegrowthoverthelongterm.Between1993and2011,GDPpercapitagrowthintheCopenhagenregionaveraged2%peryear.ThismoderategrowthreflectslevelsofproductivitythatarelowerthanthehighestperformingcitiesinEurope.However,wealthlevelsremainhigh.
Copenhagen’sgrowth-at25%overthelast20years-hasbeendeliveredwhilereducinggreenhousegasemissionsby40%andincreasingoverallenvironmentalperformance.
2 Copenhagen:agreeneconomyleader
This chapter examines Copenhagen’s long-term economic growth and the city’s current economic performance in terms of competitiveness, labour productivity and output. Included in this is an overall picture of Denmark’s high levels of GDP per capita, innovation and labour market performance. Copenhagen is Denmark’s capital city, national and international business hub, and core of the region that contributes most substantially to Denmark’s economic output.
2.1 What is an urban green economy?
2.1.1 Cities as engines of green growth
More than half the world’s population now lives in urban areas. The World Bank estimates that over 90% of urban growth is in the developing world, adding around 70 million new residents to urban areas each year (World Bank 2010). Over the next 20 years, the urban population of South Asia and Sub-Saharan Africa, which includes some of the poorest people in the world, is expected to double. At the same time, cities in Europe, North America and other countries in the rich world continue to expand as urbanisation spreads. As a consequence, the importance of cities in powering economic growth, development and prosperity worldwide continues to grow.
Furthermore, cities are not only important geographic units of economic activity in their own right, they are also anchors of regional economies and are often key drivers of national growth. Today, 150 of the world’s largest metropolitan economies produce 46% of global GDP with only 12% of the global population (Brookings Institution, LSE Cities et al. 2010).
While cities are often engines of growth and prosperity in the short term, in the longer term they can have negative economic impacts. As centres of energy demand and industrial production, urban areas are responsible for up to 80% of anthropogenic greenhouse gas emissions. This not only has consequences for the environment, but also creates negative impacts on long-term economic growth (Stern 2006). Furthermore in the short term, poor resource efficiency can increase economic and social costs substantially, while pollution and reduced biodiversity can potentially act as negative externalities, affecting productivity through, for example, reduced health of the population and reductions in natural resources.
For many cities, these costs are likely to increase substantially over the coming years as resource constraints (including energy, water, raw materials and food commodities) continue to deepen in the face of growing demand from rapidly industrialising countries. In the last 10 years alone, global food prices have more than doubled (FAO 2013; Lee, Preston et al. 2012).
This then raises the question: is there an economic rationale for early-action policies that foster green growth in cities? This will depend on the economic benefits of green policy programmes (both locally and globally) weighed against their associated costs. Even where a clear case for public intervention can be made, care must be taken in its design and execution in order to limit the scope for market failures to be replaced by policy failures. Policies need to be non-discriminatory and where possible use market instruments to avoid inefficiencies and prevent rent-capture by wasteful vested interests.
Cities are natural units for driving innovative policy solutions for green growth. They combine a mix of specialisation and diversity derived from a concentration of people and economic activity that generate a fertile environment for innovation in ideas, technologies and processes. As hubs of regional economic activity, they produce and distribute the resources that provide better livelihoods for urban and rural residents alike.
At the same time, cities have a degree of self-governance and city policymakers are often able to deliver integrated policy programmes that have a more direct, systemic impact on citizens. City authorities are closer both geographically and culturally to their citizens than national governments. City-specific issues such as congestion, clean water, waste, energy, education and crime require considered city-specific public interventions. Examples include energy efficient buildings, renewable energy, efficient distribution of clean water and waste, green transport schemes, congestion charging and clean air zones. For these reasons, cities may have more potential to have a significant impact on green growth relatively rapidly.
In addition, their high population density and relatively compact form can allow for economies of scale, efficiency gains and collaboration. Although per capita emissions are generally higher in cities than in rural areas, much of this reflects higher incomes in urban areas. By contrast, emissions per unit of output are usually lower in dense cities than in surrounding rural or suburban areas.
2.1.2 Definition of a green economy leader
Drawing on the definitions of green growth and green economy discussed in this chapter, we categorise a city as being a green economy leader using three key attributes: competitive advantage in the short term and medium term, strong levels of environmental performance and long-term sustainable growth.
First, a green economy leader should display competitive advantage in the short and medium term, with levels and/or growth of productivity and income of the city performing strongly relative to other cities of comparable size and development. Productivity and growth are underpinned by competitiveness. (World Economic Forum 2012)) The World Economic Forum defines competitiveness as:
“the set of institutions, policies, and factors that determine the level of productivity of a country. The level of productivity, in turn, sets the level of prosperity that can be earned by an economy. The productivity level also determines the rates of return obtained by investments in an economy, which in turn are the fundamental drivers of its growth rates”.
27Copenhagen:agreeneconomyleader26
Second, a green economy leader should display high and growing levels of environmental performance, with low environmental impacts relative to other cities. Environmental performance includes low carbon emissions, high levels of air and water quality (termed “environmental quality” in this report), high levels of green space and biodiversity, and low impacts on stocks of natural resources.
Third, a city with a leading green economy is one that promotes sustainable growth in output and welfare over the longer term through strategic policy decisions that lock in low-carbon, high-growth pathways. As discussed in previous sections, long-term growth and high environmental performance are not simply compatible. Policies that lead to higher environmental performance, if well designed, raise growth through various channels including innovation, efficiency in the use of the factors of production, and increased private investment. To the extent that other large cities act accordingly, it can also be expected to ease pressure on resource prices, as well as ameliorating the negative externalities of climate change and pollution that reduce global and local growth in the longer term.
Box 2.1 International definitions of green growth
TheimportanceofpoliciesfordrivinggreengrowthhasbeenrecognisedanddiscussedbyarangeofinternationalorganisationsincludingtheWorldBank,UNEPandtheOECD:
World BankTheWorldBankdefinesgreengrowthas“growththatisenvironmentallysustainable.Itisefficientinitsuseofnaturalresources,cleaninthatitminimizespollutionandenvironmentalimpacts,andresilientinthatitaccountsfornaturalhazardsandtheroleofenvironmentalmanagementinpreventingphysicalhazardsandexcessivecommoditypricevolatility.”Agreeneconomyleaderisacitythatdisplayshighproductivityandeconomiccompetitiveadvantageintheshortterm,highandgrowinglevelsofenvironmentalperformanceandlong-termsustainablegrowth.
UNEPTheUnitedNationsEnvironmentProgramme(UNEP)definesagreeneconomyas“onethatresultsinimprovedhumanwell-beingandsocialequity,whilesignificantlyreducingenvironmentalrisksandecologicalscarcities.”
OECDTheOrganisationforEconomicCooperationandDevelopment(OECD)definesgreengrowthas“fosteringeconomicgrowthanddevelopment,whileensuringthatnaturalassetscontinuetoprovidetheresourcesandenvironmentalservicesonwhichourwell-beingrelies.”
Inallthesedefinitions,greengrowthiscompatiblewithsustainabledevelopmentbutgoesfurthertorecognisethatgreenpoliciescan,ifwell-designed,raiseproductivityandgrowth.Inthisway,greengrowthintegratestheeconomicandenvironmentalpillarsofsustainabledevelopment.
Sources:OECD2011b;UNEP2013;WorldBank2012b
2.2 Drivers of the green economy
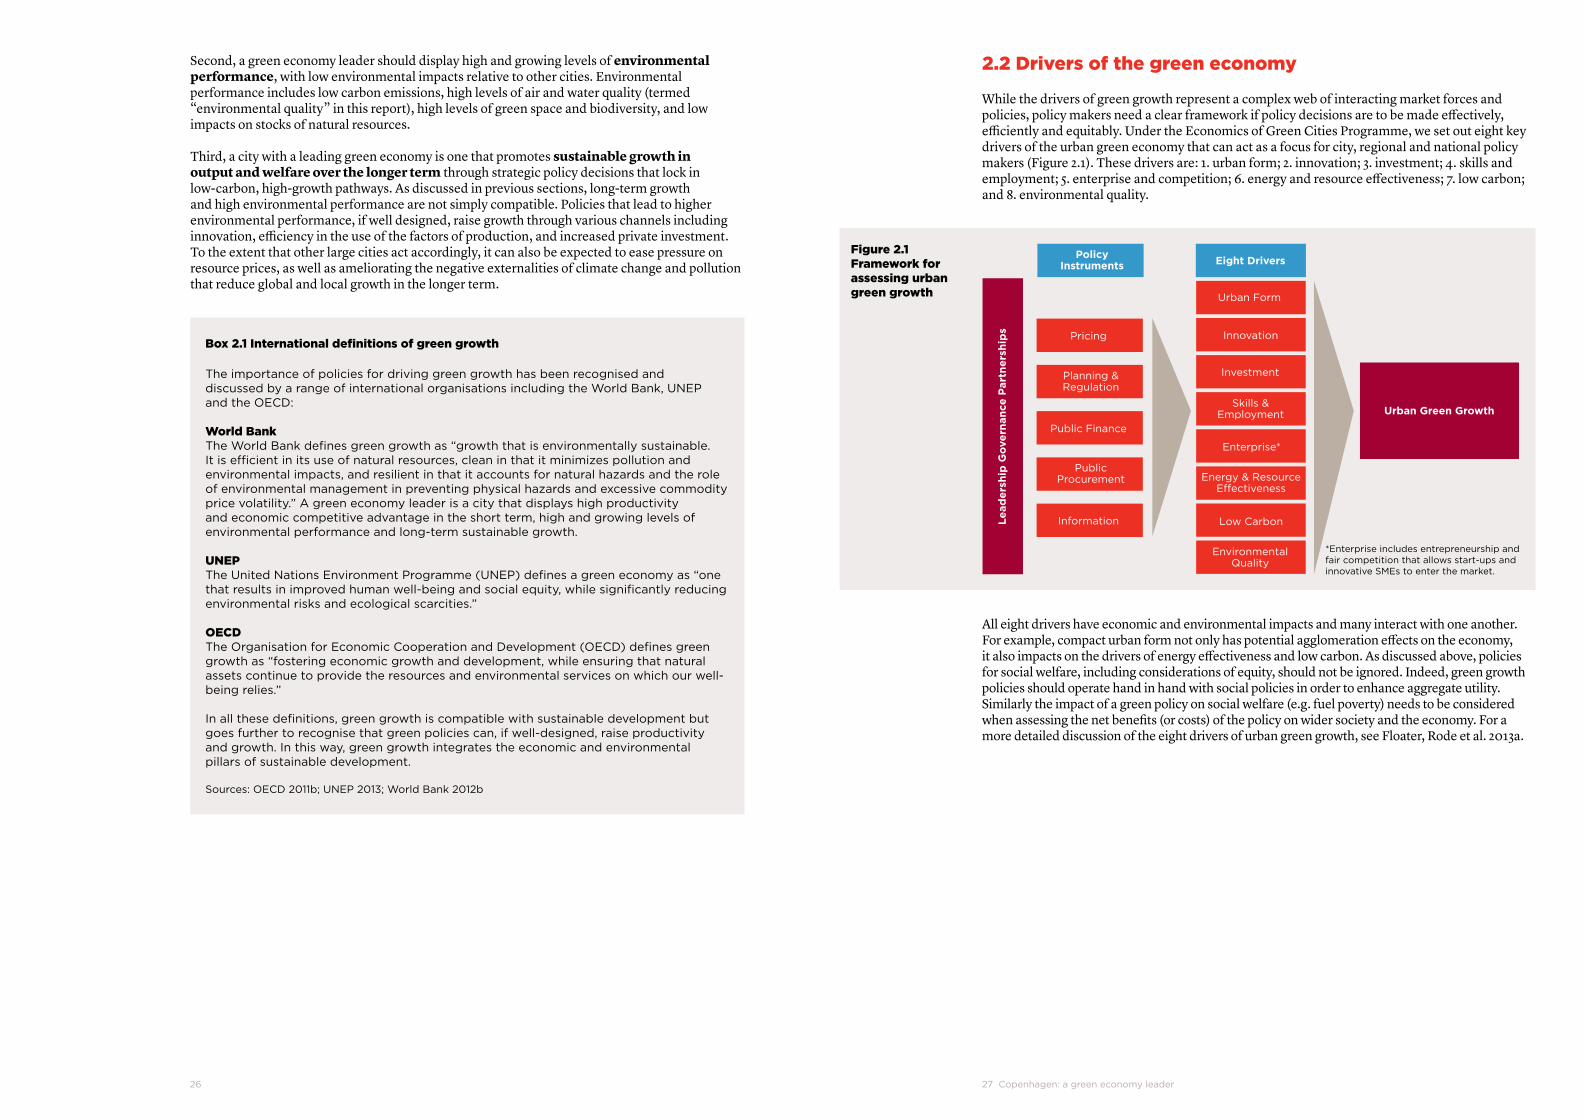
While the drivers of green growth represent a complex web of interacting market forces and policies, policy makers need a clear framework if policy decisions are to be made effectively, efficiently and equitably. Under the Economics of Green Cities Programme, we set out eight key drivers of the urban green economy that can act as a focus for city, regional and national policy makers (Figure 2.1). These drivers are: 1. urban form; 2. innovation; 3. investment; 4. skills and employment; 5. enterprise and competition; 6. energy and resource effectiveness; 7. low carbon; and 8. environmental quality.
PolicyInstruments
Planning &Regulation
PublicProcurement
Pricing
Public Finance
Information
Eight Drivers
Urban Form
Innovation
Investment
Low Carbon
Enterprise*
Skills &Employment
EnvironmentalQuality
Energy & ResourceEffectiveness
Urban Green Growth
Figure 2.1 Framework for assessing urban green growth
*Enterpriseincludesentrepreneurshipandfaircompetitionthatallowsstart-upsandinnovativeSMEstoenterthemarket.
All eight drivers have economic and environmental impacts and many interact with one another. For example, compact urban form not only has potential agglomeration effects on the economy, it also impacts on the drivers of energy effectiveness and low carbon. As discussed above, policies for social welfare, including considerations of equity, should not be ignored. Indeed, green growth policies should operate hand in hand with social policies in order to enhance aggregate utility. Similarly the impact of a green policy on social welfare (e.g. fuel poverty) needs to be considered when assessing the net benefits (or costs) of the policy on wider society and the economy. For a more detailed discussion of the eight drivers of urban green growth, see Floater, Rode et al. 2013a.

29Copenhagen:agreeneconomyleader28
2.3 Copenhagen’s green economy
2.3.1 National economy
Copenhagen is a wealthy city with an advanced and diversified economy. At an international level, the city consistently ranks very highly for quality of life, innovation, and competitiveness. As the capital, largest city and business centre of the country, Copenhagen plays a central role in Denmark’s policy-making environment.
Copenhagen’s economic success is related to the strength of the Danish national economy. Denmark is characterised by its combination of innovative, hi-tech industry and a large, effective public sector. Furthermore, the country is very well integrated with the global economy, with internationally competitive industries contributing to growth over decades that has allowed for a continued high level of welfare and extensive public service provision.
Denmark’s export economy, which has ranged between 45 and 55% of GDP from 2004 to 2012 (World Bank 2012a), is geared towards agricultural products, manufactured equipment and machinery, and business services. As a small country with a small domestic market, international integration has been important. Though a member of the European Union since 1975, Denmark has maintained its own currency. The Danish Krone has been pegged to the Euro since 1999, which has increased regional economic integration and export-led growth through the 2000s. Its primary export markets are in the Baltic region and Scandinavia. The country is an overall net-exporter (OECD 2014).
Denmark’s stable and effective national political and economic framework has helped shape a country with low inequality, strong labour participation rates, and high levels of civic engagement and trust in institutions (OECD 2014). Denmark is widely admired as a global model for economic growth and innovation. At the national level, Danish GDP per capita was among the top ten countries globally in 2012 (World Bank 2012c), and remains higher than many of its neighbours and that of the United States.
Figure 2.2 GDP per capita (US$), 2003-2012
Source:WorldBank2012c
Danish GDP has increased in real terms over the past two decades, allowing it to maintain its position near the top of GDP figures globally. Since 1998, however, Denmark has lost ground in terms of GDP per capita and GDP per hour worked to the highest 17 OECD countries (OECD 2014).
GDP gains in greater Copenhagen have generally tracked those in Denmark overall, with the capital region posting slightly higher average gains than the national economy as a whole from the period 1993 to 2011. The annual growth rate of GDP per capita averaged 2.0% for greater Copenhagen, compared to the average of 1.3% per annum for Denmark as a whole. While the recession that began in 2008 was significant for the regional and national economy, negative growth was slightly less severe in Copenhagen than in the rest of Denmark (Statistics Denmark 2014c).
0
10,000
20,000
30,000
40,000
50,000
60,000
70,000
OECD members
United KingdomGermany
United States
Sweden
GD
P p
er c
apit
a (c
urre
nt U
S$)
2003 2005 2007 2009 2011
Denmark
Euro area
Figure 2.3 GDP per capita, annual percentage change, 1993-2011
Source:StatisticsDenmark2014c
The country’s strong levels of spending on research and development, its well-educated labour force and other strong framework conditions for innovation and low unemployment rates have all been contributing factors to its economic success. There are also high rates of new business formation and low barriers to entrepreneurship in Denmark (OECD 2014). However, concerns about weak competition in parts of the economy have been raised. For instance, prices corrected for taxes and levels of prosperity are 7% higher for goods and 14% higher for services compared to the average in OECD countries (Ministry of Business and Growth Report on Growth and Competitiveness, 2013, as referenced by (OECD 2014). A series of competition policies were initiated in 2012, producing changes in competition law; better analyses of competition in various sectors, especially non-tradeable services; and improved effectiveness of public procurement.
Box 2.2 Denmark: a highly competitive economy
Denmarkranked15thintheWorldEconomicForum’sGlobalCompetitivenessIndexfor2013/14.Althoughthisisdownthreeplacesfromthepreviousyear’sranking,itstillplacesDenmarkintheuppertierofnationsintermsofeconomiccompetitiveness.ThefollowingisashortextractfromtheWEFReport:
“Similar to its Nordic neighbors, the country continues to benefit from one of the best functioning and most transparent institutional frameworks in the world (18th). Denmark also continues to receive a first-rate assessment for its higher education and training system (14th), which has provided the Danish workforce with the skills needed to adapt rapidly to a changing environment and has laid the ground for high levels of technological adoption and innovation. . . A marked difference from the other Nordic countries relates to labor market flexibility, where Denmark (13th) continues to distinguish itself as having one of the most efficient labor markets internationally, with more flexibility in setting wages, firing, and therefore hiring, along with a greater number of workers than seen in the other Nordics and most European countries more generally.”
Source:WorldEconomicForum2013
1994 1996 1998 2000 2002 2004 2006 2008 2010
-8
-6
-4
-2
0
2
4
6
8
GD
P p
er c
apit
a g
row
th r
ate
Greater Copenhagen
All Denmark

31Copenhagen:agreeneconomyleader30
2.3.2 Long-term growth
Copenhagen’s economic output Copenhagen is at the heart of the Danish economy, the seat of national government, and the base for many of the country’s large multinational companies. Copenhagen’s Capital Region (formally known as Hovedstaden) generates the highest output of all five regions in Denmark: in 2012, it produced 39% of Danish output with 31% of the national population (Statistics Denmark 2014a). Hovedstaden’s share of the national output has been increasing over the past 20 years, as well as the gross value added (GVA) to economic output, demonstrating the growing importance of Copenhagen to the Danish economy (Figure 2.4).
Copenhagen has a service-led economy, with a high concentration of corporate headquarters and financial services companies based here. It is also the country’s major centre for research, with many universities and corporate research headquarters. It has one of Europe’s largest health science/biomedical clusters, with additional strengths in creative industries and welfare technology. It also has strong cross-border integration with Sweden as part of the Øresund region that links Copenhagen to Malmö.
The economic performance of Copenhagen and Denmark has been consistent over the past twenty years. Since the early 1990s, Hovedstaden has experienced somewhat stronger economic growth than the four other Danish regions (Figure 2.5). Between 1993 and 2012, GDP per capita grew at a compound annual growth rate (CAGR) of 1.7%. This slightly exceeded the overall Danish rate of 1.3%, and was more than a full basis point higher than the lowest growth region.
Figure 2.4 GVA by region, 1993-2012 (2005-prices, chained values, DKK million)
Figure 2.5 Regional and Danish GDP per capita (DKK 1000, 2005 prices), 1993-2011 2011figureforHovedstadenofDKK391,000=US$68,400.
Source:StatisticsDenmark2014a
Source:StatisticsDenmark2014b
1993 1995 1997 1999 2001 2003 2005 2007 2009 2011
0
100,000
200,000
300,000
400,000
500,000
600,000
GVA
by
reg
ion
(20
05
pri
ces,
DK
K m
illio
n) Region Hovedstaden
Region Sjælland
Region Syddanmark
Region Midtjylland
Region Nordjylland
0
50
100
150
200
250
300
350
400
GD
P p
er c
apit
a (2
00
5 p
rice
s, D
KK
tho
usan
d)
Region Hovedstaden
Region Sjælland
Region Midtjylland
Region Nordjylland
All Denmark
Region Syddanmark
1993 1995 1997 1999 2001 2003 2005 2007 2009 2011
Copenhagen’s leading growth rate compared to other parts of Denmark has reinforced Copenhagen’s higher economic output levels compared with other Danish metropolitan regions. In 2011, Hovedstaden’s Gross Value Added (GVA) per capita was over DKK 300,000 (US$52,700), 45% higher than in Sjælland (Zealand), the Danish region with the lowest per capita figure (DKK 163,641 / US$ 28,600). The next closest region is Midtjylland (Central Jutland, which includes Århus, Denmark’s second largest city), with a per capita GVA that is 73% that of Hovedstaden (Statistics Denmark 2014a). All the Danish regions suffered a downturn during the recession beginning in 2008, although Hovedstaden’s growth has been more significant during the upturn.
As the largest city in Denmark, Copenhagen enjoys agglomeration economies arising from its large and concentrated labour market and the opportunities for extensive linkages betweennetworks of proximate and diverse firms, government organisations and research institutions. Copenhagen also benefits from Denmark’s high levels of national competitiveness (see Figure 2.6).
Figure 2.6 Relationship between national competitiveness and economic output of the country’s capital city CompetitivenessisbasedontheWorldEconomicForum’scompetitivenessindex.OutputismeasuredasGrossValueAddedpercapita.
Sources:BrookingsInstitution,LSECitiesetal.2010;WorldEconomicForum2012
Copenhagen
GVA
per
cap
ita
in c
apit
al c
ity
(20
10, U
S$)
National competitiveness index (2010/11)
0
10,000
20,000
30,000
40,000
50,000
60,000
3.5 4 4.5 5 5.5 6

33Copenhagen:agreeneconomyleader32
Figure 2.7 Selected OECD countries in percentage of value added of the business sectorFiguresare2010orlatestdataavailable.
Figure 2.8 Trend growth in real GDP per hour worked, Denmark and other OECD countries, 1995-2012
Source:OECD2013c
Source:OECD2013b
While these knowledge-based capital figures highlight some of the key factors that contribute to Denmark’s economic strength, other factors must also be considered. Labour productivity provides a measure of the efficiency with which inputs are used in an economy to produce goods and services, and is particularly important in the economic and statistical analysis of a country. Labour productivity is a revealing indicator of several economic indicators, as it offers a dynamic measure of economic growth, competitiveness and living standards within an economy and shows a strong correlation to GDP (OECD 2008). While labour productivity is still high compared with many countries, since the mid-1990s it has increased less than in leading OECD economies and at a rate lower than most of Denmark’s geographic neighbours (OECD 2014).
ESPITAKOR
PRTAUS
LUXIR
LCZE
AUTJP
NDEU
SVN
NLDFINCAN
GBRBEL
DNKFRA
SWE
USA0%
2%
4%
6%
8%
10%
12%
14%
16%
0%
2%
4%
6%
8%
10%
12%
14%
16%
Software and databases
R&D and other intellectual property products
Brand equity, firm-specific human capital, organisational capital
0
1
2
3
4
5
0
1
2
3
4
5
Ann
ual p
erce
ntag
e ch
ang
e
1995-2012
1995-2007
2.3.3 Productivity
Denmark has maintained strong levels of GDP growth and GDP per capita as a result of its above OECD average employment levels and labour participation rates, and its high levels of investment in research and development and in other areas of knowledge-based capital. Investment in knowledge-based capital is important for supporting higher capabilities in production processes, technology, or knowledge-intensive activities. The impact of this investment (which on a national basis is skewed towards Copenhagen due to the make-up of its economy) is shown in percentages of select business sector value added when compared to other OECD countries (Figure 2.7).
Figure 2.8 shows the growth in GDP output per hour of labour input. Positive values equate to greater production per unit of labour and are an important indicator for economic efficiency. While the countries with the most significant gains are those generally starting from a lower economic base than Denmark, the pace is lower than might be expected given the overall strength of the Danish economy. The low figures for GDP per hour worked stand in contrast to the values shown in Figure 2.7 above, suggesting a lower return on knowledge-based capital invested than in other OECD countries.
Comparing labour productivity across a global selection of OECD metropolitan regions, measured as GVA per worker in 2010, Copenhagen is in the top 15 cities in Europe (see Figure 2.9). Copenhagen’s gross value added figure of more than US$ 83,000 exceeds other European capitals such as Helsinki (81,300), Vienna (78,500), Rome (62,700), Berlin (55,700), Madrid (51,600) and Lisbon (41,300). However, many North American cities have higher labour productivity rates.
The analysis of slower labour productivity gains in Denmark has attracted the attention of national, regional, and municipal government leaders. There is concern that if the weak productivity trend continues, Denmark could begin falling behind other wealthy countries and its GDP position begin to erode. To address this, the Danish government created a Productivity Commission in early 2013 to:
• Identifythereasonsfortherelativelyweakproductivitygrowthsincethemid-1990s in Denmark.
• Identifythemaindriversandbarriersforproductivitygrowth,includingfirms’useof knowledge and education, as well as the allocation of these resources in the economy.
• Clarifythelinkbetweenbusinessproductivity,costsandcompetitiveness.
• Makeconcreterecommendationstostrengthenproductivityintheprivatesector,includingin the manufacturing, construction and service sectors.
• Providenewknowledgeaboutproductivityinthepublicsector1 and make specific recommendations on how to strengthen it (Danish Productivity Commission 2013).
Figure 2.9 Labour productivity in OECD metropolitan regions
Source:BrookingsInstitution,LSECitiesetal.2010
0 40,000 80,000 120,000
Vienna
Helsinki
Marseille
Hamburg
Copenhagen
Brussels
Lyon
Munich
London
Amsterdam
Rotterdam
Dublin
Stockholm
Paris
Oslo
Top 15 European cities
1TheTermsofReferencefortheProductivityCommissionnotethatalthoughthepublicsectorworkforcerepresentsabout1/3rdofDanishworkers,“thereiscurrentlyonlylimitedknowledgeaboutproductivityinthissector.Thelackofknowledgeisasignificantbarrierinensuringtheefficiencyandqualityofproductioninthepublicsector.”

35Copenhagen:agreeneconomyleader34
2.3.4 Green growth
As described in the sections above, Denmark and Copenhagen’s levels of GDP and GVA are among the highest in the OECD. At the same time, the growth in the city’s population and economy has been delivered whilst simultaneously improving the city’s environmental performance and transitioning to a low carbon economy, as shown below (Figure 2.10). This has resulted in Copenhagen being one of the greenest and most economically productive metropolitan regions in the world.
Figure 2.10 Sustainable growth in Copenhagen Copenhagen’smetropolitaneconomy,measuredasGrossValueAdded(GVA)percapitagrewbynearly25%from1994to2010.Overthesameperiod,greenhousegas(GHG)emissionspercapitaintheCityofCopenhagendecreasedby40%from7.31tCO2eto4.38tCO2e.(GHGemissionsarefortransport,heat,andelectricityonly.ComparableGHGdataforthemetropolitanscalewerenotavailable.Variablesareindexed:1993=100.
Sources:BrookingsInstitution,LSECitiesetal.2010;CityofCopenhagen2013b;COWI2013
60
80
100
120
140
1994
1996
1998
2000
2002
2004
2006
2008
2010
Ind
exed
gro
wth
GVA per capita
GHG emissions per capita
The long term trend is compelling and demonstrates that sustainable growth – the decoupling of economic growth and negative environmental impacts – can be delivered effectively in the long term. Part of Copenhagen’s success in reducing environmental impacts is likely to be due to its high levels of wealth, which have driven environmental improvements. However, as Copenhagen’s urban environment continues to become greener, the economic benefits should also increase. As the city’s ‘green appeal’ grows, it should attract more international students, skilled professionals and innovative businesses that help maintain Copenhagen’s high level of human capital, productivity growth and inward investment in a virtuous cycle of green growth. This green appeal nests within Copenhagen’s broad strategy of using quality of life as a driver for economic growth, as many features of the two are synonymous.
Other indicators suggest Copenhagen’s green economic success relative to other cities. In 2009, the Siemens European Green City Index assessed and compared European cities based on their environmental performance. Copenhagen ranked first due to its particularly strong record on CO2 emissions, air quality, buildings, transport and overall environmental governance. Coupled with one of the highest levels of GVA per capita, Copenhagen is indeed a green economy leader (Figure 2.11).
Using indicators for comparing the ‘greenness’ of an economy comes with a number of caveats. Data availability varies among cities, as do the assumptions underlying the statistics collected and calculated. The different ways in which a country’s territory is administratively organised also plays a crucial role in the availability of sub-national indicators. This is a particular challenge when comparing data for cities given (1) the physical expansion of built-up land which outgrows the administrative boundary, (2) the lack of a universal definition of the functional urban region, and (3) the interconnectedness of a global economic network and ecosystem.
One proxy for environmental performance that can be used to address these challenges is the number of cars per 1,000 inhabitants. The advantage of car ownership data is that it is widely available at the local level and generally comparable - rare characteristics for environmental data. Alternative transport indicators such as modal share are less easily comparable between cities due to variations in the precise methodologies used to calculate modal split – for example whether the indicator refers to journey to work trips or all transport trips. While car ownership data does not directly measure car use (for instance in some wealthy societies, cars may be used only infrequently for weekend leisure travel), levels of use and ownership are strongly associated. The indicator is also useful in providing information about the wider infrastructure requirements associated with car ownership such as parking and road space that in themselves have significant environmental and economic impacts. The indicator provides a useful way to grasp the sustainability of cities’ urban form, the sustainability of inhabitants’ lifestyles and levels of resource consumption.
Figure 2.11 Relationship between environmental performance and GVA in European citiesThegreenindexisbasedonSiemensEuropeanGreenCityIndex2009,andGrossValueAdded(GVA)percapitain2009.
0 10,000 20,000 30,000 40,000 50,000 60,000 70,00030
40
50
60
70
80
90
ParisLondon
Madrid
Rome
Athens
Berlin
Budapest Lisbon
Stockholm
Bucharest
Warsaw
Vienna
Copenhagen
Brussels
Sofia
Helsinki
Amsterdam
Dublin
Prague
Oslo
Vilnius
Riga
BratislavaTallinn
Ljubljana
Zurich
Istanbul
GVA per capita (2009, US$)
Gre
en C
ity
Ind
ex
Sources:BrookingsInstitution,LSECitiesetal.2010;Siemens2009

37Copenhagen:agreeneconomyleader36
Figure 2.12 Motorisation rate and wealth for selected countries and cities
GDP PPP per capita in USD (2005)
100,00090,00080,00070,00060,00050,00040,00030,00020,00010,000
Countries
Cities
Africa
Western and Central Asia
0
Mos
t rec
ent m
otor
isat
ion
rate
(car
s pe
r 1,0
00 in
habi
tant
s) 800
700
600
500
400
300
200
100
East Asia
Oceania
North America
South America
Western Europe
Eastern and Southeastern Europe
Denmark
Copenhagen
Source:LSECitiesanalysisbasedonmultipledatasources
Figure 2.12 below confirms that there is a strong positive correlation between the income of countries and car ownership levels, with North American and Western European countries displaying high levels of car ownership - on average more than 300 cars/1,000 people. For cities, the correlation is less clear. Indeed, city GDP is not a good predictor of high car ownership. For cities with a GDP per capita above US$25,000, there is no correlation between car ownership and income for this sample of world cities. Comparing car ownership between Denmark and Copenhagen confirms a degree of de-coupling of environmental impact and economic prosperity. While featuring a higher income per capita compared to the national context, Copenhagen has lower car ownership levels, with 234 cars/1,000 people in 2013, versus 399 per 1,000 people for Denmark. In fact, the passenger car ownership percentage differential between Copenhagen and Denmark has been increasing recently: in 2007, the ownership rate in Copenhagen was 63% as large per capita as the national rate, whereas in 2013, it was only 59% as large (Statistics Denmark 2013a).

39GreeneconomydriversinCopenhagen38
The City of Copenhagen has modernised the former industrial harbour area making way for new housing and recreational areas.Credit:CityofCopenhagen
3
GREENECONOMYDRIVERSINCOPENhAGEN
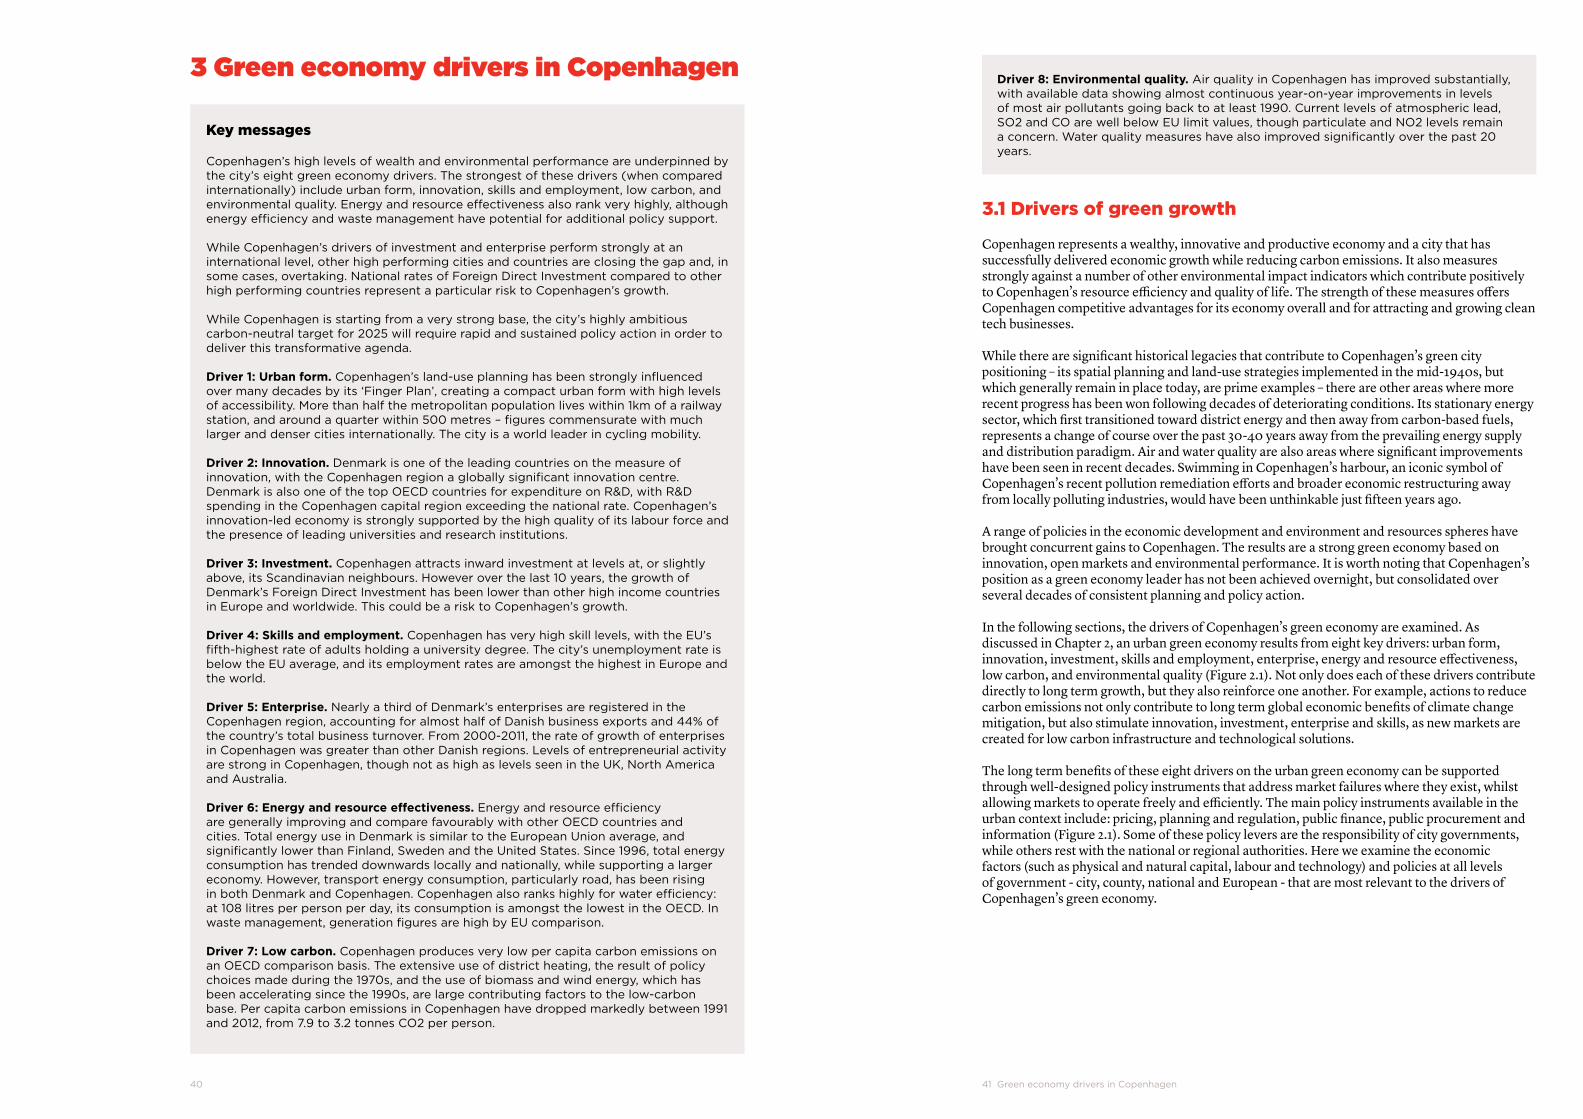
41GreeneconomydriversinCopenhagen40
Key messages
Copenhagen’shighlevelsofwealthandenvironmentalperformanceareunderpinnedbythecity’seightgreeneconomydrivers.Thestrongestofthesedrivers(whencomparedinternationally)includeurbanform,innovation,skillsandemployment,lowcarbon,andenvironmentalquality.Energyandresourceeffectivenessalsorankveryhighly,althoughenergyefficiencyandwastemanagementhavepotentialforadditionalpolicysupport.
WhileCopenhagen’sdriversofinvestmentandenterpriseperformstronglyataninternationallevel,otherhighperformingcitiesandcountriesareclosingthegapand,insomecases,overtaking.NationalratesofForeignDirectInvestmentcomparedtootherhighperformingcountriesrepresentaparticularrisktoCopenhagen’sgrowth.
WhileCopenhagenisstartingfromaverystrongbase,thecity’shighlyambitiouscarbon-neutraltargetfor2025willrequirerapidandsustainedpolicyactioninordertodeliverthistransformativeagenda.
Driver 1: Urban form. Copenhagen’sland-useplanninghasbeenstronglyinfluencedovermanydecadesbyits‘FingerPlan’,creatingacompacturbanformwithhighlevelsofaccessibility.Morethanhalfthemetropolitanpopulationliveswithin1kmofarailwaystation,andaroundaquarterwithin500metres–figurescommensuratewithmuchlargeranddensercitiesinternationally.Thecityisaworldleaderincyclingmobility.
Driver 2: Innovation.Denmarkisoneoftheleadingcountriesonthemeasureofinnovation,withtheCopenhagenregionagloballysignificantinnovationcentre.DenmarkisalsooneofthetopOECDcountriesforexpenditureonR&D,withR&DspendingintheCopenhagencapitalregionexceedingthenationalrate.Copenhagen’sinnovation-ledeconomyisstronglysupportedbythehighqualityofitslabourforceandthepresenceofleadinguniversitiesandresearchinstitutions.
Driver 3: Investment.Copenhagenattractsinwardinvestmentatlevelsat,orslightlyabove,itsScandinavianneighbours.Howeveroverthelast10years,thegrowthofDenmark’sForeignDirectInvestmenthasbeenlowerthanotherhighincomecountriesinEuropeandworldwide.ThiscouldbearisktoCopenhagen’sgrowth.
Driver 4: Skills and employment. Copenhagenhasveryhighskilllevels,withtheEU’sfifth-highestrateofadultsholdingauniversitydegree.Thecity’sunemploymentrateisbelowtheEUaverage,anditsemploymentratesareamongstthehighestinEuropeandtheworld.
Driver 5: Enterprise. NearlyathirdofDenmark’senterprisesareregisteredintheCopenhagenregion,accountingforalmosthalfofDanishbusinessexportsand44%ofthecountry’stotalbusinessturnover.From2000-2011,therateofgrowthofenterprisesinCopenhagenwasgreaterthanotherDanishregions.LevelsofentrepreneurialactivityarestronginCopenhagen,thoughnotashighaslevelsseenintheUK,NorthAmericaandAustralia.
Driver 6: Energy and resource effectiveness.EnergyandresourceefficiencyaregenerallyimprovingandcomparefavourablywithotherOECDcountriesandcities.TotalenergyuseinDenmarkissimilartotheEuropeanUnionaverage,andsignificantlylowerthanFinland,SwedenandtheUnitedStates.Since1996,totalenergyconsumptionhastrendeddownwardslocallyandnationally,whilesupportingalargereconomy.However,transportenergyconsumption,particularlyroad,hasbeenrisinginbothDenmarkandCopenhagen.Copenhagenalsorankshighlyforwaterefficiency:at108litresperpersonperday,itsconsumptionisamongstthelowestintheOECD.Inwastemanagement,generationfiguresarehighbyEUcomparison.
Driver 7: Low carbon.CopenhagenproducesverylowpercapitacarbonemissionsonanOECDcomparisonbasis.Theextensiveuseofdistrictheating,theresultofpolicychoicesmadeduringthe1970s,andtheuseofbiomassandwindenergy,whichhasbeenacceleratingsincethe1990s,arelargecontributingfactorstothelow-carbonbase.PercapitacarbonemissionsinCopenhagenhavedroppedmarkedlybetween1991and2012,from7.9to3.2tonnesCO2perperson.
3GreeneconomydriversinCopenhagen Driver 8: Environmental quality. AirqualityinCopenhagenhasimprovedsubstantially,withavailabledatashowingalmostcontinuousyear-on-yearimprovementsinlevelsofmostairpollutantsgoingbacktoatleast1990.Currentlevelsofatmosphericlead,SO2andCOarewellbelowEUlimitvalues,thoughparticulateandNO2levelsremainaconcern.Waterqualitymeasureshavealsoimprovedsignificantlyoverthepast20years.
3.1 Drivers of green growth
Copenhagen represents a wealthy, innovative and productive economy and a city that has successfully delivered economic growth while reducing carbon emissions. It also measures strongly against a number of other environmental impact indicators which contribute positively to Copenhagen’s resource efficiency and quality of life. The strength of these measures offers Copenhagen competitive advantages for its economy overall and for attracting and growing clean tech businesses.
While there are significant historical legacies that contribute to Copenhagen’s green city positioning – its spatial planning and land-use strategies implemented in the mid-1940s, but which generally remain in place today, are prime examples – there are other areas where more recent progress has been won following decades of deteriorating conditions. Its stationary energy sector, which first transitioned toward district energy and then away from carbon-based fuels, represents a change of course over the past 30-40 years away from the prevailing energy supply and distribution paradigm. Air and water quality are also areas where significant improvements have been seen in recent decades. Swimming in Copenhagen’s harbour, an iconic symbol of Copenhagen’s recent pollution remediation efforts and broader economic restructuring away from locally polluting industries, would have been unthinkable just fifteen years ago.
A range of policies in the economic development and environment and resources spheres have brought concurrent gains to Copenhagen. The results are a strong green economy based on innovation, open markets and environmental performance. It is worth noting that Copenhagen’s position as a green economy leader has not been achieved overnight, but consolidated over several decades of consistent planning and policy action.
In the following sections, the drivers of Copenhagen’s green economy are examined. As discussed in Chapter 2, an urban green economy results from eight key drivers: urban form, innovation, investment, skills and employment, enterprise, energy and resource effectiveness, low carbon, and environmental quality (Figure 2.1). Not only does each of these drivers contribute directly to long term growth, but they also reinforce one another. For example, actions to reduce carbon emissions not only contribute to long term global economic benefits of climate change mitigation, but also stimulate innovation, investment, enterprise and skills, as new markets are created for low carbon infrastructure and technological solutions.
The long term benefits of these eight drivers on the urban green economy can be supported through well-designed policy instruments that address market failures where they exist, whilst allowing markets to operate freely and efficiently. The main policy instruments available in the urban context include: pricing, planning and regulation, public finance, public procurement and information (Figure 2.1). Some of these policy levers are the responsibility of city governments, while others rest with the national or regional authorities. Here we examine the economic factors (such as physical and natural capital, labour and technology) and policies at all levels of government - city, county, national and European - that are most relevant to the drivers of Copenhagen’s green economy.

43GreeneconomydriversinCopenhagen42
3.2 Driver 1: Urban form
Urban form in Copenhagen has been strongly influenced by its core spatial strategy, the ‘Finger Plan,’ which has largely concentrated growth along transit-served corridors separated by substantial green areas. In spite of a medium to low population density by European capital city standards, more than half the metropolitan population lives within 1km of a railway station, and around a quarter within 500 metres. These rates compare favourably to denser cities such as London and New York. Mass transit ridership and cycling mobility are high in Copenhagen, particularly the latter where it is a global leader. Recent development trends are showing growth increasing at higher rate increases in inner urban areas, reversing decades of higher growth rates in suburban areas.
3.2.1 Trends and current performance
Copenhagen region’s built-up area expanded substantially during the twentieth century, growing most rapidly from the 1950s to the 1980s (Figure 3.1). As in many other European and North American cities, the suburbanisation process transformed the spatial form of the city during a period of strong economic growth and the rise of motorisation. In Copenhagen, urban development in peripheral areas was to some extent concentrated along railway corridors, in line with the ‘Finger Plan’ (Fertner 2012). This supported a more energy efficient rail-oriented urban form compared with many North American and some European cities.
Figure 3.1 The changing urban morphology of the Copenhagen region, 1900 – 2006
Source:Fertner2012
During the 1980s the process of suburbanisation slowed in line with a slowing of population growth throughout the region. Since the 1990s population and economic growth has again accelerated, but following different spatial patterns, with the bulk of growth occurring within more central areas (Fertner 2012).The shift in urban growth back towards more central areas of the Copenhagen region has been particularly evident in recent years, with more than 80% of the region’s population growth occurring within 20km of the city centre between 2006-2012 (Fertner 2012; Næss, Strand et al. 2011). These trends are reflected in the stabilisation of metropolitan population density levels from the mid-1980s, after a steep decline since the 1950s (Figure 3.2). Average population density within the continuous urban area of Greater Copenhagen declined from around 4,800 people/km2 in 1955 to 3,100 people/km2 in 1985. Between 2000 and 2010, average population density in Greater Copenhagen increased very slightly to around 3,150 people/km2.
Recent population data suggests that the process of inner-city intensification may have accelerated in the past five years. Between 1993 and 2013, the population of the inner city municipalities of Copenhagen and Frederiksberg increased by 20%, but by 12% in the broader Capital Region (Figure 3.3). Since 2007 growth rates have diverged, with the central municipalities of Copenhagen and Frederiksberg growing at a higher rate than the wider region.
Trends towards a more centralised and compact urban form in Copenhagen compare reasonably favourably with wider European and global trends. Data comparing population growth in core and peripheral areas of a selection of OECD metropolitan regions shows that alongside Copenhagen, the core areas of London, Tokyo, Stockholm, Helsinki and Zurich also grew faster than their suburban areas during the period 1995-2005 (Kamal-Chaoui and Sanchez-Reaza
Figure 3.2 Changes in population density: continuous urban area of Greater Copenhagen, 1955 – 2010
Figure 3.3 Population growth in inner-city Copenhagen and the wider urban region, 1993 – 2013
Source:Næss,Strandetal.2011
Source:StatisticsDenmark2013f
1955 1965 1975 1985 1995 20050
1000
2000
3000
4000
5000
Peo
ple/k
m2
Region Hovedstaden
Copenhagen + Frederiksberg
Po
pul
atio
n in
dex
ed g
row
th (
1993
=10
0)
1993 1995 1997 1999 2001 2003 2005 2007 2009 2011 20130
90
100
110
120

45GreeneconomydriversinCopenhagen44
2012). Compared with Copenhagen, intensification rates were notably higher in London, Helsinki and Stockholm. In contrast, growth in other well-established European cities including Vienna, Milan, Paris and Hamburg remained higher in peripheral areas compared to Copenhagen. In the fastest growing OECD cities, including Dallas, Atlanta, Dublin and Seoul, significant suburban expansion continued to be the norm (Kamal-Chaoui and Sanchez-Reaza 2012).
The high degree of urban intensification in Copenhagen is reflected in the graphic beside. This containment index compares the growth in the population of the core area with that of the hinterland area for the period 1995 to 2005. As expected for Copenhagen, this creates a positive value and is well in excess of other large OECD cities. The containment figures were then compared to GHG emissions for the cities for which this figure was available. On this simple measure at least, there was a correlation between the positive containment value and GHG reductions for the cities investigated.
Current average population density on built-up land in the Copenhagen metropolitan region (based on the OECD definition for urban areas for purposes of international comparisons) is less than 2,000 people/km2, similar to other low-density European cities including Vienna, Stockholm and Hamburg (OECD 2012a). Higher-density European capital cities including Rome, Paris, Madrid and Athens average 4,000-7,000 people/km2.
Copenhagen’s average population density is relatively low by European standards, and lower than in major Japanese centres (3,000 – 6,000 people/km2) and Canadian cities (around 3,000 people/km2). It is higher, however, than most US cities where densities can be below 1,000 people/km2; e.g. in Portland, Seattle, Atlanta and Minneapolis. Among North American centres, Copenhagen’s average density is similar to Boston, San Francisco and Miami (OECD 2012a).
Despite having a low average population density, housing and employment areas in Copenhagen have been generally well planned, with good access to public transport. Even with significant low-density residential development, more than half the metropolitan population lives within 1km of a railway station, and around a quarter within 500 metres (Figure 3.5). This measure of residential accessibility compares well with much larger centres including London and New York. However, both Stockholm and Hong Kong have even higher proportions of their population within walking distance of a rail station (Floater, Rode et al. 2013b). Copenhagen compares less favourably when measuring the proximity of jobs to public transport, although it still performs significantly better than Sao Paulo and Los Angeles.
Figure 3.4 Population growth in inner-city Copenhagen and the wider urban region, 1993 – 2013
Source:A.Paccoud,2011
-1.2 -1.0 -0.8 -0.6 -0.4 -0.2 0.0 0.2 0.4 0.6
Washington
Chicago
Containment index %
Vienna
Paris
Berlin
Oslo
Zürich
Portland
Tokyo
Copenhagen
Brussels
Stockholm
London
The generally good integration of Copenhagen’s living and working spaces with public transport infrastructure helps explain its reasonably high levels of rail, metro and bus use. In 2012, 22% of trips and 34% of trip kilometres were made using these modes (Figure 3.6). Although this is a lower rate than in some European and many East Asian cities, this is far higher than in most North American cities (OECD 2012a). Distinct to Copenhagen is the very high level of bicycle use, accounting for 20% of trips and 14% of distance travelled.
Figure 3.5 Residential and job accessibility to rail stations, percentage within 500 metres: multiple city comparison
Figure 3.6 Mode share, weekday trips for Copenhagen, Stockholm and London
Source:LSECities
Source:LSECities
Copenhagen
Stockholm London
0 10 20 30 40 50 60
Los Angeles
Sao Paulo
Bogota
Stockholm
Copenhagen
Hong Kong
New York
London Residents
Jobs
22%
40% 38%
Bus5.3%
Metro3.5%
Rail13.6%
Car39.9%
Walking18.2%
Bicycle19.6%
30%
31%39%
Bus8.1%
Metro17.2%
Train3%
Car29.4%
Walking33.5%
Bicycle5.6%
Tram0.6%
Taxi1.2%
Motorcycle1.3%
34%
41%
26%
Motorcycle0.8%
Taxi1.2% Bus
14.9%
Metro8.4%
Rail9.2%
Car39.8%
Walking23.7%
Bicycle2%

47GreeneconomydriversinCopenhagen46
Walking is also a well utilised mode of transport in Copenhagen, attributable to a combination of suitable infrastructure for walking, destinations within close proximity to journey starting points, and perceptions of security. An analysis of the ‘Making Walking Count’ survey (part of a broader ‘Measuring Walking’ project developed by a group of walking experts) shows that Copenhagen performs consistently well in comparison with London, Barcelona, and Canberra. Total daily minutes walked as reported by survey respondents is highest in Copenhagen at 52 minutes, double that of Canberra. The survey results also demonstrate the link between accessibility and form, noting the relationship between the purpose of the journey and local facilities.
3.2.2 Policy supporting compact urban form
Copenhagen’s famous ‘Finger Plan’, initiated in 1947, has promoted urban growth along rail corridors radiating out from the city centre, while protecting ‘green wedges’ from development. It remains a powerful spatial concept and has been given renewed regulatory support at the national level through the 2007 Danish Planning Act (Danish Ministry of the Environment 2007b; OECD 2009). This includes the ‘Station Proximity Principle’, which generally requires new large offices of more than 1500m2 to be located within 600 metres of a railway station (Danish Ministry of the Environment 2007b; Interview Tue Rex 2012). Regulation of retail developments promotes the location of shops in town centres by restricting the size of shops and specifying the location of town centres where retail development is permitted. In addition, city-level land-use planning stimulates mixed-use, high-density development around stations and limits parking provisions (Interview Tue Rex 2012).
Investment-driven policies focus on public transport, cycling and urban design. In addition to the historic S-train rail network which forms the backbone of the Finger Plan’s linear corridors, a smaller metro system has been built over the last decade. It has established a public transport spine for Copenhagen’s latest ‘development finger’, Orestad New Town, and improved public transport provision in the urban core. Costing approximately DKK 12.3bn (US$2.1bn), the first two metro lines were partially financed by capturing increased land-values adjacent to the line (Knowles 2012; Majoor 2008). Cycling has been promoted since the 1980s and the city now has almost 370 km of dedicated cycle lanes (City of Copenhagen 2011b). Cycling is integrated with the public transport network and the city has implemented various information, training and safety initiatives (City of Copenhagen 2011b). Furthermore, broader urban development investments cut across urban regeneration and city centre densification, alongside significant investments in public realm improvements.
Figure 3.7 Local walking accessibility for adults (5.0 = strongly agree)
NotethatCopenhagenmayinfactlagbehindsomeothercitiesinlocaltripsmadebyfootduetothehighproportionofjourneysmadebybicycle,amodesubstitutionthatismoreprevalentthanelsewhere.
Source:Thornton2013
2.50
3.00
3.50
4.00
4.50
5.00
I have a local shopwithin comfortablewalking distance where I can buyfresh vegetables
There are green spaces within
comfortable walkingdistance of where
I live
There are sportsfacilities within
comfortablewalking distance
of where I live
There is a café orrestaurant within
comfortablewalking distance
of where I live
I have goodaccess to public
transport
Barcelona Canberra Copenhagen London
3.3 Driver 2: Innovation
Denmark is one of the leading countries in measures of innovation, and the Copenhagen Capital Region is a globally significant centre for innovation. Denmark ranks as one of the top OECD countries for expenditure on R&D, with the percentage of R&D spending in the Copenhagen Capital Region exceeding the national rate. Copenhagen’s innovation-led economy is strongly supported by the quality of its labour force and the presence of several universities and research institutions, whose output in applied research, science and engineering has benefitted the commercialisation of new technologies and services.
3.3.1 Trends and current performance
The Copenhagen Capital Region is a globally significant innovation centre. It is the leading region for innovation within Denmark, with the country as a whole ranked ninth in the world in the Global Innovation Index; a composite index of indicators on innovation capacity and outputs (Cornell University, INSEAD et al. 2013). The Danish innovation system benefits from an excellent institutional framework, strong human capital and market sophistication that supports a high level of creative output. Denmark’s core research and development competencies within the private sector are dominated by life science-related research fields and engineering (DAMVAD 2013).
With its universities, research institutes and corporate research and development facilities, Copenhagen Capital Region’s innovation performance is considerably higher than other Danish regions. The strength of the Capital Region (Hovedstaden) relative to other parts of the country follows a pattern generally evident across Europe. Hovedstaden is one of thirteen across 190 European regions achieving the highest ranking in the European Regional Innovation Scoreboard (Table 3.1). Indicators comparing performance across a wider global range of urban regions are more limited.
RegionCountry
Denmark
Finland
Switzerland
Sweden
Germany
Major city
Hovedstaden
Etelä-Suomi
RégionLémanique
Nordwestschweiz
Zürich
Stockholm
ÖstraMellansverige
Sydsverige
Bayern
Berlin
Hamburg
Hessen
Baden-Württemberg
Geneva
Basel
Zurich
Stockholm
Uppsala
Malmo
Munich
Berlin
Hamburg
Frankfurt
Stuttgart
Copenhagen
Helsinki
Table 3.1 Leading regions for innovation in EuropeSource:Regionsranked‘leaderhigh’intheRegionalInnovationScoreboard2013(EuropeanCommission2013e)

49GreeneconomydriversinCopenhagen48
The Copenhagen Capital Region - and Denmark as a whole - perform most strongly on measures of framework conditions supporting innovation (e.g. education and political institutions) and innovation ‘inputs’ (e.g. R&D spending) rather than ‘output’ measures such as patent applications (Cornell University, INSEAD et al. 2013; European Commission 2013e; Primi 2013). The Copenhagen Capital Region does not stand out in global comparisons of regional patenting performance, with the world’s top regions for patent applications during 2008-2010 being Southern Kanto (major city - Tokyo), Japan, followed by California (Los Angeles/ Bay Area), USA, the capital region of South Korea (Seoul), Kinki (Osaka), Japan and Guangdong (Guangzhou/ Shenzhen), China (Primi 2013). Patent applications are highly concentrated in a few regions, with applications from these five regions alone accounting for over 25% of total global applications. Though the number of patents filed by Denmark with the European Patent Office places the country in the upper third of European countries, it sits behind peers such as Switzerland, Sweden, Netherlands, Austria, and Belgium. For patent applications filed in 2011 for technologies relating to environmental management and climate change mitigation, Denmark has the fifth highest total of all OECD countries, with Germany and Japan leading the way in this category (Figure 3.8).
Other regions in the top twenty for patent applications include major urban areas in Germany, the USA, Japan, France and the Netherlands. This global comparison of patent applications matches European data, which also shows relatively weak performance for Copenhagen, particularly when considering its excellent institutional and research conditions for innovation. Between 2000 – 2011, firms and individuals from the Copenhagen made just over 1,700 patent applications, compared with more than 6,000 applications over the same period in leading European urban regions around Munich, Paris, Milan and Stockholm (Figure 3.9).
Trends in innovation performance over recent years suggest that the Copenhagen is retaining its leadership position, at least within a European context. Most innovation indicators for Copenhagen showed improvement between 2007 and 2011 (European Commission 2013e). At the national level, Denmark’s growth in innovation performance between 2008 and 2012 has been particularly strong compared with other European innovation leaders. At the national level, Denmark’s position in the Global Innovation Index was 7th place in 2012 and 9th place in 2013 (Cornell University, INSEAD et al. 2013). While Copenhagen is certainly a global centre for innovation, its performance on some measures of innovation outputs such as patents, together with the strengthening performance of regions in the USA, Japan, Korea and China, mean that Copenhagen faces strong competition to retain its leadership position.
Figure 3.8 Patent applications to the European Patent Office (EPO), environmental and climate change technologies by OECD Country, 2011Thebottom12countries,eachwithatotaloffiveorfewerapplications,areexcludedfromthegraphic.
Source:OECD2011a
Tota
l pat
ent
app
licat
ions
, env
iro
nmen
tal
and
clim
ate
chan
ge
tech
nolo
gie
s
0
100
200
300
400
500
600
700
800
900
1000Energy e�ciency, buildings/lighting
GHG abatement, transport
GHG mitigation
GHG mitigation, combustion
Energy gen, renewable/non-fossil.
General environmental management
Figure 3.9 Total patent applications to the EPO 2000-2009: European Union urban regions
Source:EuroStat2013e
Tota
l pat
ent
app
licat
ions
: 20
00
– 2
00
9
0
1000
2000
3000
4000
5000
6000
7000
8000
Lisbon
Prague
Dublin
Brussels
Amsterdam
Rome
Copenhagen
Madrid
Vienna
Hamburg
Turin
Barcelo
na
Stuttgart
London
Helsinki
Berlin
Stockholm
Milan
Paris
Munich
3.3.2 Policy supporting innovation
Copenhagen’s strengths in innovation can partly be attributed to supportive public policy across national, regional and local levels of government. As a nation, Denmark has a long history of policy measures that have supported the development of a knowledge-based economy. An excellent public education system and strong infrastructural, social and institutional framework conditions have all supported today’s high innovation performance (Lundvall 2009). Public policies aimed deliberately at encouraging innovation emerged globally in the 1980s and, since then, Denmark has developed a comprehensive package of policies for innovation. City and regional-level policies have complemented a policy agenda primarily driven by national-level government.
A range of policy measures have been used to encourage research and development activities. The Danish government invests directly in research through university funding and research grants, as well as using various tools to incentivise business-led research. Important government funding bodies for research include:
• TheDanishNationalResearchFoundation(establishedin1991anddistributed€65min2012)
• TheDanishCouncilforIndependentResearch(distributed€164min2012)
• TheDanishCouncilforStrategicResearch(establishedin2003anddistributed€114min2012)
• TheDanishNationalAdvancedTechnologyFoundation(establishedin2005anddistributed €86min2012) • TheDanishCouncilforTechnologyandInnovation(establishedin2002anddistributed €137min2012)(Christensen2011;DanishMinistryofScience2012).
In late 2013, the Danish political parties reached agreement on creating one large Innovation Foundation,tobelaunchedin2014withanannualbudgetof€200m.ThiswillamalgamatetheDanish Council for Strategic Research, the Danish National Advanced Technology Foundation and the Danish Council for Technology and Innovation.
While direct government funding for research is an important component of the Danish innovation system, most research and development expenditure is business led. In 2011, 60% of R&D expenditure came from the business sector, 28% from the government sector and most of the remainder from foreign sources (EuroStat 2013b). This split in sources of funding remained reasonably stable between 2001 and 2010, demonstrating that government funding for research has kept pace with increased investment from the private sector.

51GreeneconomydriversinCopenhagen50
Total R&D spending from business and government was 3.06% of Danish GDP in 2010, a substantial increase from 1.83% of GDP in 1996 (Figure 3.10). Danish R&D spending is now well above the OECD average, having been below average until 2001. Increases have been more substantial in Denmark than in selected comparator countries and R&D spending is now at a level similar to other innovation leaders, including Japan and the United States, but still below Sweden and Finland.
At the regional scale, Copenhagen has very high levels of R&D spending, showing that the region concentrates innovation activity within Denmark and represents an important research centre within Europe. R&D spending in the Capital Region (Hovedstaden) was 5.3%, one of the highest of all European urban regions (Figure 3.11). Broader global comparisons suggest that the Copenhagen Capital Region’s rate of spending is among the highest in the world, surpassed only by the states of New Mexico and Massachusetts in the USA (data at smaller spatial scales for the USA was not available) and a few European regions (Primi 2013).
Figure 3.10 Research and development spending: Denmark and other OECD countries 1996-2010 Publicandprivatesectorspending.
Figure 3.11 Research and development spending: European metropolitan regions compared
Source:WorldBank2013d
Source:EuroStat2013g
0
1
2
3
4Sweden
19981996 2000 2002 2004 2006 2008 2010
Finland
Denmark
United States
OECD members
Japan
United Kingdom
0
1
2
3
4
5
6
7
Inne
r Lond
on
Noord-H
olland
(Am
ster
dam)
Hambur
g
Berlin
Etelä-
Suom
i (Hels
inki)
Stock
holm
Wien
Hoved
stad
en
Stut
tgar
t
R&
D s
pen
din
g: %
of
GD
P
Figure 3.12 Inward FDI flows, selected OECD countries, annual average 1990-2012
Source:UNCTAD2013b
0
1
2
3
4
5
6
7
Inw
ard
FD
I: %
of
GD
P
Ja
pan
Sout
h Kore
a
It
aly
U
nite
d Sta
tes
G
erm
any
A
ustri
a
F
ranc
e
N
orway
B
razil
F
inlan
d
A
ustra
lia
C
anad
a
N
ew Z
ealan
d
EU27 A
vera
ge
S
pain
D
enm
ark
S
witzer
land
C
hina
U
nite
d Kin
gdom
S
weden
N
ethe
rland
s
Ir
eland
3.4 Driver 3: Investment
Copenhagen’s economy benefits from high levels of inward investment, providing capital for growing businesses and supporting integration with the global economy. Denmark’s most important foreign investment partners are other European countries, driven by closer economic integration of the European Union.
3.4.1 Trends and current performance
The Copenhagen Capital Region has been successful in attracting significant inward foreign direct investment (FDI). One estimate suggests that around $US5.45bn was invested in the region between 2003 and 2011, contributing to the creation of over 16,000 jobs (FDI Intelligence 2011). This level is slightly higher than the other Scandinavian cities of Stockholm, Helsinki, Oslo, but Stockholm had the largest number of FDI projects.
For 2012, Copenhagen does not feature in the top ten European cities drawing in foreign investment (Ernst and Young 2013). These ten cities attracted 30% of all FDI projects and included urban regions with a similarly small population to Copenhagen such as Stuttgart, Dublin, Freiburg, Lyon and Amsterdam, as well as the major centres of London, Paris and Madrid. Neither did Copenhagen show up as Europe’s most favoured FDI destination in an ‘attractiveness survey’ – although small numbers of respondents identified other intermediate-sized European centres such as Munich, Amsterdam, Stockholm and Hamburg as the most attractive destinations in Europe (Ernst and Young 2013).
Danish government statistics show that nearly 4,000 foreign-owned enterprises were operating in Denmark in 2011, employing about 270,000 people. Collectively, these firms employ more than 20% of private sector workers nationally. The Copenhagen Capital Region particularly attracts businesses in the IT and life sciences sectors, its strong framework for research and development activities and business clusters such as the ‘Medicon Valley’ making it a favoured location for research in pharmaceutical and biotech industries.
As the capital and economic centre of Denmark, the Copenhagen Capital Region has benefited from reasonably strong investment inflows during the past two decades, measured at the national level. Inward FDI flows vary substantially from year to year but averaged 2.9% of Danish GDP during the period 1990-2012 (Figure 3.12). (The latest annual FDI flows to Denmark for 2012 were just 0.9% of GDP.) This was slightly above the EU27 average of 2.7% and well above levels in Germany, the United States, South Korea and Japan. However, average inward FDI flows were below a number of other small advanced European economies including Ireland, the Netherlands and Sweden, where average rates were above 4% of GDP.

53GreeneconomydriversinCopenhagen52
Inward FDI increased sharply in the mid-1990s, in parallel with increases in other European economies. FDI flows peaked in 2000 at 21% of GDP. Since then, there has been little growth in overall FDI stock, which has remained at around 45% of GDP, similar to average EU27 levels in 2012 (Figure 3.13). Total FDI stock in Denmark is below that in Sweden and the Netherlands; both these countries experienced strong inflows during the 2000s. The countries with the largest holdings of foreign investment stock in Denmark are currently Sweden, the Netherlands and the United States (UNCTAD 2013a).
3.4.2 Policy supporting investment
Promotion of inward foreign investment has been a policy goal for both Denmark and the Copenhagen Capital Region since the 1980s. Current Danish trade and investment policies are liberal and encourage inward investment and an open economy. The attractiveness of both Denmark and Copenhagen to foreign investment is built on the country’s strong macroeconomic framework, excellent infrastructure and skilled labour market. As such, investment attractiveness is not only influenced by specific trade and investment initiatives discussed below, but by a broader range of public policies.
Changes to trade and investment policies during the 1980s and 1990s supported strong growth in FDI from a relatively low base. The total stock of FDI doubled from less than 5% of GDP in 1988 to over 10% of GDP in 1991, having been relatively stable during the early 1980s (Figure 3.13). This followed economic liberalisation under Denmark’s adoption of the European Economic Community’s Single Market programme (OECD 1995). With Denmark’s most important foreign investment partners being other European countries, closer economic integration of the European Union has played an important role in increasing FDI, with strong growth during the late 1990s also occurring in The Netherlands and Sweden (Figure 3.13).
At the regional level Copenhagen Capacity, an inward investment promotion agency, was established in 1994 through a collaboration of local governments including the City of Copenhagen and Copenhagen Capital Region. Today Copenhagen Capacity is primarily funded by the Capital Region government. It markets the region’s business environment to global companies and provides a range of services to support their location and expansion in the region (Copenhagen Capacity 2013). Copenhagen Capacity also supports business cluster organisations, including the Copenhagen Cleantech Cluster and Medicon Vally which promote inward investment to particular industry sectors.
Figure 3.13 Inward FDI stock: 1980 – 2011
Source:UNCTAD2013c
Inw
ard
FD
I sto
ck: %
of
GD
P
0
20
40
60
80
100
Sweden
Denmark
UK
Europe
United States
Netherlands
1980 1985 1990 1995 2000 2005 2010
Robust comparisons of higher education levels across a broader range of cities beyond Europe are not readily available. However, national-level data suggests that Copenhagen’s strong performance against European benchmarks also holds for global comparisons. For Denmark as a whole, 33% of the adult population has a tertiary-level education, only slightly above the OECD average of 30% (OECD 2012b). While this does not represent a particularly high level of education at the national level, the concentration of highly educated Danes in Copenhagen suggests that in global comparisons of metropolitan regions, Copenhagen will perform well. On the other hand, six other OECD countries have very high rates of tertiary educational attainment - above 40% at the national level (Canada, Israel, Japan, South Korea, USA and New Zealand) (OECD 2012b) – suggesting that leading metropolitan centres in these countries will have significantly higher tertiary education levels than Copenhagen.
Copenhagen clearly has a well-educated workforce and attracts talented people. However, recent trends in the growth of the tertiary-educated population suggest that some other leading European centres have been somewhat more successful than Copenhagen in building education levels among residents and attracting new well-educated migrants. During the five-year period 2007-2012, London’s tertiary education rate jumped 12 percentage points from 42% to 54% of the adult population (Eurostat) and Zurich’s by 7 points from 37% to 44%. Over the same period, Copenhagen’s rate increased by 5 percentage points to 46%, albeit from a high base and in line with regions including Stuttgart, Vienna and Stockholm and above growth rates experienced in Amsterdam, Berlin, Barcelona and Oslo. The Economic Council of the Labour Movement, a Danish economic policy institute and think-tank, estimates that this lower attraction rate for
Figure 3.14 Tertiary educational attainment in selected European urban regions, 2012
Source:EuroStat2013f
0
10
20
30
40
50
60
Vienna
Hamburg
Stuttgart
Barcelo
na
Berlin
Amsterdam
Zürich
Stockholm
Copenhagen
Helsinki
Oslo
London
% a
dul
ts a
ge
25-6
4 w
ith
univ
ersi
ty d
egre
e
3.5 Driver 4: Skills and employment
Copenhagen’s high employment rate and the its highly educated workforce contribute to its strong economic growth. High levels of employment allow for high utilisation of human resources, while high education levels contribute to labour productivity and innovation. Copenhagen’s skilled workforce allows it to specialise in high productivity, globally competitive knowledge-economy industries.
3.5.1 Trends and current performance
Copenhagen has a highly skilled workforce, with the rate of tertiary educational attainment among the highest in Europe (Figure 3.14). With 46% of the region’s adult population holding a university degree, only London, Oslo, Helsinki and Bilbao have higher rates. Copenhagen also stands out significantly from other Danish regions, with the country’s four other regions having much lower rates of tertiary educational attainment, ranging between 27 and 30% (EuroStat 2013f ).

55GreeneconomydriversinCopenhagen54
highly skilled talent, coupled with a surplus of unskilled labour for the number of unskilled positions available, could reduce economic growth by as much as DKK 29 billion (US$ 5.4 billion) by 2019. (The Economic Council of the Labour Movement 2010).
The Copenhagen regional economy also performs well in relation to employment indicators. A very high proportion of the working age population are employed, with an average employment rate during the years 2001 - 2010 of 79% - in line with Helsinki, Stuttgart and Amsterdam, and well above rates in Berlin, Barcelona and London (Figure 3.15). At 7.7%, the 2012 unemployment rate for the Copenhagen Capital Region is also 2.5 points lower than the EU average. Copenhagen does, however, have the highest unemployment rate in Denmark where the national average is 7.0%. Wider global comparisons of employment rates at the city-scale are not available. However, at the national level, Denmark’s employment rate of 73% (average for 2010 – 2013) is the fifth highest of any country in the world (behind Switzerland, Iceland, Norway and the Netherlands) (OECD 2013a). Leading global economies all have lower average employment rates at the national level, including the USA (70%), Canada (72%), Australia (72%), Japan (71%) and South Korea (64%) (OECD 2013a).
While levels of employment remain high in Copenhagen, rates did fall during the recent global recession. Between 2007 and 2012, the city’s employment rate dropped by 3.3%. In contrast, other some other comparable European cities witnessed increases in employment. Employment growth over the period was particularly strong in the German urban regions, with minor falls in Amsterdam (0.3%) and Oslo (1.2%) and a substantial fall in Barcelona (11.2%) (EuroStat 2013a).
The recovery in the Copenhagen metropolitan region is proving slower than in several othermetropolitan regions. Figure 3.16 compares the average annual changes in employment and GDP for the period 2010-2012, where improvement rates are higher in the Stockholm, Hamburg, Berlin and Munich metropolitan regions.
Figure 3.15 Employment rates in selected European urban regions: average rate 2001-2010
Source:EuroStat2013a
Em
plo
ymen
t ra
te: %
ad
ults
ag
e 20
-64
0
20
40
60
80
100
Berlin
Barce
lona
Vienna
Lond
on
Hambur
g
Amst
erdam
Copenha
gen
Stut
tgar
t
Helsin
ki
Oslo
Stock
holm
Zürich
Figure 3.16 Average annual GDP and employment growth in selected European urban regions
Source:BrookingsInstitution2012
Average annual % change GDP 2010-2012
Average annual % change employment 2010-2012
-1.0%
-0.5%
0.0%
0.5%
1.0%
1.5%
2.0%
2.5%
3.5.2 Policy supporting skills and employment
Labour market reforms beginning in the 1990s in Denmark have created a model with greater flexibility in hiring and dismissing of workers than is typically seen in European countries; coupled with an unemployment safety net that remains generally consistent with Nordic social security tradition, and a significant emphasis on skills upgrading and job seeking assistance (referred to as ‘activation’). Labour market literature refers to the Danish system as ‘flexisecurity.’ The system is credited with creating a degree of labour mobility in Denmark that generally exceeds peer Northern European economies. As positions are eliminated due to any number of market factors, statistical evidence shows that Danes remain unemployed for short periods of time and find new employment opportunities with relative ease. This is consistent with Danish attitudes toward the possibilities of changing positions. In Eurobarometer surveys, close to 70% respond that they are fairly or very confident that they can find a job if they are laid off. This is the highest rate for any EU country (Andersen 2011).
Denmark has also recognised the importance of having a well-educated workforce to meet the needs of the knowledge-based economy in decades to come. The government sees this as a clear trend coming from an increasingly globalised economy, one in which Denmark can be a leader in innovation and technology. In 2006, the Danish government published its national globalisation strategy, “Progress, innovation and cohesion –Strategy for Denmark in the global economy”, comprising 350 specific initiatives aimed at extensive reforms of education and research programmes and substantial improvements in the framework for growth and innovation in all areas of Danish society. Amongst its goals are that 95 % of all young people shall complete a general or vocational upper secondary education by 2015; 50% of all young people shall complete a higher education programme by 2015; and everyone shall engage in lifelong learning (Danish Government 2006). Following on from this strategy, a 2007 Ministry of Education policy report entitled “Lifelong skills upgrading for all” outlined a range of initiatives and supportive funding (DKK 1 billion / US$ 186 million) to strengthen vocational adult education and continuing training, delivered in collaboration with labour groups, employers, and civil society partners (Danish Ministry of Science 2012). Denmark’s overall emphasis on skills is also revealed in its national expenditure on education, which is the second highest figure in the EU-27 at 7.8% of GDP (EuroStat 2013c).

57GreeneconomydriversinCopenhagen56
Figure 3.17 EU-27 general government expenditure on education, % of GDP, 2011
Source:EuroStat2013c
EU
-27
EA
-17
BE
BG
CZ
DK
DE
EE IE EL
ES
(20
10)
FR IT CY LV LT LU HU
MT
NL
AT
PL
PT
RO SI
SK FI
SE
UK IS
NO
CH
0
1
2
3
4
5
6
7
8
% o
f G
DP
Pre-primary and primary education Tertiary education
Education not definable by level
Subsidiary service to education
R&D education
Education n.e.c.
Education (whole division)
Secondary education
Post-secondary non-tertiary education
3.6 Driver 5: Enterprise
Copenhagen’s economy benefits from a favourable business climate that supports enterprise, a driver of economic growth. Based on research conducted on US cities, evidence suggests that higher levels of entrepreneurial activity are correlated with higher growth rates (Zoltan and Armington 2003). Furthermore, a competitive business environment that is enhanced by the entry of new firms can enhance total factor productivity (see Chapter 2). As well as being a driver of productivity growth, successful enterprises are part of the foundation of thriving local communities, contributing to economic prosperity and social cohesion. Consequently, enterprise plays a role in delivering sustainable regeneration and higher living standards.
3.6.1 Trends and current performance
Copenhagen is the largest business centre in Denmark, with 31% of the country’s enterprises registered in the region (Statistics Denmark 2013d). Enterprises in the Copenhagen Capital Region account for almost half of Danish business exports and 44% of the country’s total business turnover (Statistics Denmark 2013d). Copenhagen hosts headquarters for many of Denmark’s large companies and branches of global corporations, but it is also home to thousands of small and medium-sized enterprises (SMEs). Across Denmark, SMEs comprise 99% of the total number of enterprises, accounting for 66% of employment and 64% of total business turnover (European Commission 2013a). In the Copenhagen Capital Region during 2011, there were around 95,000 enterprises operating, up from 81,000 in 2000. This growth contrasts with other Danish regions, which have experienced more modest growth in enterprise numbers and in some cases small contractions during the 2000 – 2011 period (Statistics Denmark 2013d).
Figure 3.18 New enterprises in Denmark and the Copenhagen urban region, 2007–2011
Source:StatisticsDenmark2013b
Num
ber
of
new
ent
erp
rise
s re
gis
tere
d
0
5,000
2007 2008 2009 2010 2011
10,000
15,000
20,000
25,000
30,000
35,000
40,000 Rest of Denmark
Region Hovedstaden
Copenhagen is a hub for new enterprise formation within Denmark. In 2011, the Copenhagen Capital Region was home to 38% of new enterprises registered across Denmark, while having 31% of the country’s population (Statistics Denmark 2013b). Almost 13,000 new enterprises were registered in the region during 2011, growing from 2009 to return to pre-recession levels (Figure 3.18). New business formation in Copenhagen has recovered more strongly from the recession than across Denmark as a whole, where the number of enterprises registered in 2011 was still 8% lower than in 2007. There are ongoing challenges for ensuring that start-ups grow strongly and survive their initial years. Around 67% of new enterprises survive their first two years in the region, against the European average of 72% (Growth Forum for the Capital Region 2011).
While Copenhagen is the leading centre for entrepreneurship within Denmark, its performance within a global context is less clear. In general, Copenhagen appears to perform well compared with continental European and wealthy East Asian centres, but it has lower levels of entrepreneurship compared with some cities in Germany, the United Kingdom, North America and Australasia.
A comparison of participation in entrepreneurial activity among metropolitan areas based on surveys during 2001-2006 found that around 6% of the adult population (age 18-64) in Copenhagen were engaged in ‘early-stage entrepreneurial activity’ (Figure 3.19). While this is well above levels in wealthy East Asian cities, including Tokyo and Hong Kong, and many key European economic centres including Milan, Paris and Brussels, participation was lower than in all surveyed Australasian and North American cities. Participation rates were also lower than in London, Dublin and the German centres of Munich, Frankfurt, Berlin and Hamburg.
Figure 3.19 Participation in Entrepreneurial Activity: Early Stage Entrepreneurial Activity, Copenhagen and selected world cities, 2001 – 2006
Source:Acs,Bosmaetal.2008

59GreeneconomydriversinCopenhagen58
This survey data for Copenhagen is consistent with more recent national-level indicators, which show lower levels of entrepreneurial participation by Danes than the EU average (9% of Danes versus 12% of EU adults have started a business) (European Commission 2013a). Low participation rates may, however, reflect relatively strong opportunities in other parts of the labour market, with Denmark having the highest rate in Europe of ‘opportunity driven entrepreneurship’ (as opposed to entrepreneurial activity driven by lack of other economic and employment alternatives) (European Commission 2013a). Furthermore, Denmark has high levels of new firm formation relative to most European countries. During the period 2004-2011, the number of new firms established each year in Denmark averaged 5.4 firms for every 1000 working age (15-65) people. This was higher than in Germany (1.2), South Korea (1.6), The Netherlands (3.0) and Sweden (4.6), but below rates in the United Kingdom (8.9), Canada (8.0) and Australia (6.2) (International Finance Commission and World Bank 2013). OECD comparisons of European countries also show Denmark to have a high start-up rate (OECD 2008).
3.6.2 Policy supporting enterprise
Denmark’s 2006 globalisation strategy addresses the role of start-ups and new businesses in strengthening the country’s economic performance. It states the government’s objective that Denmark should continue to be among the leading European countries in terms of number of new companies launched each year, and by 2015 should be among the leaders in the number of high-growth start-ups (Danish Government 2006). Since that time, a number of policy reforms and measures have been introduced to facilitate new business formation and growth. Many of these create an explicit link between the green economy and new enterprises and services. For example, the Danish Enterprise and Construction Authority (part of the Ministry of Economic and Business Affairs) manages an innovation fund with priority emphasis on innovation of green solutions and market maturation of green solutions. It provides grants and guarantees to small businesses,withanannualallocationof€20mfor2013,2014and2015.
Research by the European Commission has highlighted the difficulties SMEs face in Denmark in securing bank financing and the generally higher costs of capital offered to SMEs compared to other EU countries (European Commission 2013a). To address this, the Danish government has led the establishment of a public-private capital fund, the Danish Growth Capital. This initiative is an agreement between the Danish Ministry of Business and Growth and various Danish pension funds where the latter take on the role of venture capitalists, providing funding for new and small businesses with growth potential.
At the regional level, Copenhagen Capacity, a non-profit organisation for investment promotion, business development and cluster growth, provides a range of services targeted toward new enterprises seeking to establish themselves in the capital region. This includes business start-up services related to tax and accountancy matters; assistance with land and property searches; business and enterprise matchmaking; and market benchmarking. Copenhagen city and regional government officials are represented on the Copenhagen Capacity Board.
Copenhagen has been recognised as a leader in policies and activities related to clean technology clustering. The Copenhagen Cleantech Cluster has been in existence since 2009 as a partnership between Danish cleantech companies, research institutions, and regional, national and European public organisations. The Cluster is helping to build an ecosystem whereby large and small companies, public and private R&D, and public policy intersect to help grow green economy products and services. Copenhagen Cleantech Cluster is also co-founder of the International Cleantech Network.
3.7 Driver 6: Energy and resource effectiveness
Trends in Copenhagen and Denmark show a growing population and economy being supported by a declining percentage of energy and resource inputs. This resource efficiency has positive impacts for economic development and is a leading indicator for green growth.
Energy efficiencyTotal energy use in Denmark is similar to the European Union average at around 3,100kg oil equivalent per person per year (Figure 3.20). However, Denmark has significantly lower energy consumption than Finland and Sweden, other Nordic countries with high winter heating energy demands, and consumption here is less than half the average per person in the United States. Since 1960, changes in energy use have followed similar trends to the EU average. While energy use increased consistently between 1960 and 1970, between 1970 and the mid-1990s it stabilised, with fluctuations from year to year. Since 1996, Denmark has seen a general downward trend in energy consumption, with average per capita levels in 2011 25% below that of the 1996 peak.
Figure 3.20 Total energy use per person in Denmark and selected countries, 1960 - 2010
Source:WorldBank2013a 1960 1965 1970 1975 1980 1985 1990 1995 2000 2005 2010
Ene
rgy
use:
kg
of
oil
equi
vale
nt p
er c
apit
a
0
2,000
4,000
6,000
8,000
10,000
Sweden
Finland
DenmarkUK
Italy
China
Japan
Germany France
European Union
United States
Trends in Danish energy consumption by sector have followed significantly different trajectories since 1980 (Figure 3.21). In the household sector consumption remained relatively constant between 1980 and 2011, falling by 4%. The transport sector by contrast has almost doubled energy consumption over the same period. Transport sector energy use grew most rapidly between 1980 and 2005, driven mostly by increases in the road transport sector (Danish Energy Agency 2012b). Commercial and public service sector energy use grew by a modest 8% between 1980 and 2011, while agricultural and industrial consumption declined by 19% over the same three decades. Most of this decline can be attributed to the manufacturing sub-sector (Danish Energy Agency 2012b).
Figure 3.21 Energy consumption by sector, Denmark, 1980 - 2011
Source:DanishEnergyAgency2012b 1980 1990 2000 2011
Fina
l ene
rgy
cons
ump
tio
n, c
limat
e ad
just
ed (
1,0
00
TJ)
0
100
200
300
400
500
600
700
800
Households
Transport
Agriculture & industry
Commercial & public services
In 2011, the largest sector for energy consumption in Denmark was transport (34% of total), followed by households (31%), agriculture and industry (22%) and commercial and public services (13%).

61GreeneconomydriversinCopenhagen60
Although overall energy use per person has declined during the past 15 years and is now at its lowest level since 1967, the Danish economy has continued to grow. Measuring the level of economic output for each unit of energy consumed shows that the Danish economy is considerably more energy efficient today than it was in 1980 (Figure 3.22). Danish energy efficiency increased at a faster rate than the world and European Union average, but in 2011 still sits slightly below the world’s most energy efficient economies – amongst them, Switzerland and the United Kingdom.
Data on long-term energy consumption trends is not available within the City of Copenhagen. Data for recent years shows that total energy use for heating and electricity has been reasonably stable since 2005, although heating energy use has fluctuated depending on weather (Figure 3.23). Separate climate-adjusted figures for heating energy use show that per capita consumption of household (not total) district heating energy fell by 11% between 2005 and 2011 (City of Copenhagen 2012g). Household electricity consumption on a per capita basis also fell by 9% between 2005 and 2012 (City of Copenhagen 2013b).
Heating is a major source of energy demand within the City of Copenhagen, with heating consumption double that of electricity (Figure 3.24). Heating demand is dominated by household use, whereas more significant proportions of electricity demand are from retail and service enterprises and municipal and public institutions. Households are responsible for 51% of electricity and heating energy consumption combined, retail and service enterprises for 28%, municipal and other public institutions, 15% and industry 5%.
Figure 3.22 Energy efficiency in Denmark and selected countries, 1980 - 2011
Figure 3.23 Electricity and heating energy consumption, Municipality of Copenhagen, 2005 – 2012
Figure 3.24 Electricity and heating consumption in Copenhagen by sector, 2010Note:Electricityconsumptiondoesnotincludeconsumptionforelectrictrains(80GWh)orelectricheatingofprivatehouseholds(14GWh).
Source:WorldBank2013b
Source:CityofCopenhagen2013b
Sources:CityofCopenhagen2012b;CityofCopenhagen2012i
GD
P p
er u
nit
of
ener
gy
use:
co
nsta
nt 2
00
5 P
PP
$ p
er k
g o
f o
il eq
uiva
lent
1980 1985 1990 1995 2000 2005 2010
Sweden
Switzerland
Denmark
UK
World
Japan
China
European Union
United States
0
3
6
9
12
2005
2008
2009
2010
2011
2012
Electricity
District heating
Town gas
0
1000
2000
3000
4000
5000
6000
7000
8000
Ene
rgy
cons
ump
tio
n (G
Wh)
Ene
rgy
cons
ump
tio
n (G
Wh)
0
1000
Electri
city
Heatin
g
2000
3000
4000
5000
6000
Building and construction
Industries (excl. agriculture)
Retail and service enterprises
Private households
Municipal and other public institutions
Figure 3.25 Total energy consumption by fuel type: Denmark and selected countries, 2010
Figure 3.26 Total energy consumption by fuel type, Denmark, 2010
Source:LSEanalysisbasedonDanishEnergyAgency2012b,populationdatafromWorldBank2013candEuroStat
Source:DanishEnergyAgency2012b
Gro
ss e
nerg
y co
nsum
pti
on:
to
nnes
of
oil
equi
vale
nt p
er c
apit
a, 2
010
USA
Sweden
Japan
EU27
Denm
ark UK
0
1
2
3
4
5
6
7
8Other
Coal
Oil
Gas
Nuclear
Renewables
Oil35%
Renewables20%
Gas23%
Coal20%
Other2%
Energy securityDenmark is currently the only country in the EU that is a net energy exporter, exporting 6% more energy than total consumption in 2012 (Danish Energy Agency 2013b). Significant production of oil and gas since the mid-1990s, together with stabilising energy use and a shift towards renewable energy sources, has contributed to strengthening the country’s security of energy supply. While indigenous oil and gas reserves are expected to meet Denmark’s consumption needs in the short to medium term (Danish Energy Agency 2013a), in the longer term continued reliance on fossil-fuels will threaten energy security.
Denmark’s average per capita energy consumption is well below the most energy-intensive economies such as the USA (Figure 3.25). The energy fuel mix for Denmark is similar to the EU27 average, although renewables are more significant, nuclear generation is absent and coal use is slightly higher. Denmark continues to rely on fossil fuels for around three quarters of energy needs, with oil (35% of total consumption) the single largest fuel component (Figure 3.25 and 3.26). Gas, coal and renewables each account for around 20% of Danish energy consumption.
Fossil fuel dependence has declined sharply since 1996 with the growth of renewable generation. The country’s level of fossil-fuel dependence is now below the global and EU average, though still well above countries with more extensive hydropower options and nuclear programmes such as Sweden and Switzerland (Figure 3.27). The growth in renewable production – particularly locally produced wind power - has been positive for energy security. However, since 2000 a significant proportion of renewables growth has been enabled through imported wood, mostly in the form of pellets and wood chips used for both district heating and combined heat and power plants (see also Figure 3.43 in low carbon section that follows). This trend towards increased imports of biomass fuels has implications for energy security, as well as potentially negative environmental impacts from unsustainable logging and transport emissions.

63GreeneconomydriversinCopenhagen62
Figure 3.27 Fossil fuel dependence: Denmark and selected countries, 1960 – 2012
Figure 3.28 Household water consumption, City of Copenhagen, 1987 – 2012
Source:WorldBank2013a
Sources:CityofCopenhagen2013c;EuropeanAcademyoftheUrbanEnvironment2001;Ejskjaer2013
Denmark
UK
China
Sweden
Switzerland
WorldEuropean Union
United States
0
40
60
80
100
20
1960 1965 1970 1975 1980 1985 1990 1995 2000 2005 2010
Foss
il fu
el e
nerg
y co
nsum
pti
on:
% o
f to
tal
1987 1992 1997 2002 2007 2012
Litr
es p
er c
apit
a p
er d
ay
0
20
40
60
80
100
120
140
160
180
Water consumptionIn 2010, the Copenhagen water utility supplied almost 32 million cubic metres of water to the municipality’s households and businesses (City of Copenhagen 2013c). Across Greater Copenhagen, household demand comprises around 70% of total supply, industry 25% and loss in water pipes around 5% (Statistics Denmark 2005).
Water consumption in Copenhagen has declined steadily since the late 1980s, reflecting trends across Denmark as a whole where total water supply declined by 29% between 1982 and 2005. Reductions have been particularly significant in industry and for pipe leakages: losses from pipes declined by 61% across Denmark and 67% for Copenhagen between 1982 and 2005 (Statistics Denmark 2005). Household water consumption in the City of Copenhagen has also declined substantially, from an average of 168 litres per person per day in 1989 to 108 litres in 2010 – a drop of 36% (Figure 3.28).
The decline in water consumption over the last 20 years has resulted in Copenhagen having one of the strongest levels of water efficiency among comparable wealthy cities in the United States, Australia, Sweden, Finland and the United Kingdom (Figure 3.29). In 2004, at an average of 123 litres per person per day, consumption in Copenhagen was over 40% lower than in Sydney and Melbourne and less than a third of average consumption in San Francisco. Even taking account of the cooler climate in Copenhagen, consumption was also lower than in other Scandinavian capitals and almost 35% lower than in Stockholm.
Figure 3.29 Household water consumption: a global comparison of selected cities, 2004-05
Figure 3.30 Waste Generation in Copenhagen
Sources:OFWAT2007forallcitiesexceptLondon;UKEnvironmentAgency2013andCopenhagenCityofCopenhagen2013c
Source:CityofCopenhagenDepartmentforWasteManagement2013
Litr
es p
er c
apit
a p
er d
ay
0
100
200
300
400
500
Copenha
gen
Helsin
ki
Lond
on
Gothen
burg
Malmö
Stock
holm
Melbour
ne
Sydne
y
San F
ranc
isco
Tonn
es
0
50,000
100,000
150,000
200,000
250,000
300,000
350,000
400,000Special treatment
Landfill
Recycling
Incineration
Househ
old
Comm
ercia
lC&D
Waste generation and treatmentTotal waste generation in the City of Copenhagen was 821,000 tonnes in 2010. Around a quarter of this total was household waste, 30% commercial waste and around 40% from construction and demolition (C&D). Most construction and demolition waste is recycled and virtually all commercial waste is either incinerated or recycled (Figure 3.30).
Trends in total waste generation between 1988 and 2010 show no clear patterns and significant fluctuation in waste levels from year to year. Recent waste generation levels are slightly higher than in 1988. However in the household (municipal waste2) sector, waste generation has fallen in recent years, with average levels declining by 19% between 2006 and 2010 to 380kg per person (City of Copenhagen 2013a).
Waste generation in the City of Copenhagen, at 380kg per person in 2011, is significantly lower than the average level for Denmark. At a national level, waste generation has increased consistently over the past 15 years and is now 38% higher than in 1995 (Figure 3.31). Waste generation per person is higher in Denmark than in Germany, the United Kingdom and Sweden and is 44% higher than the EU-27 average.
2“Municipalwasteconsiststoalargeextentofwastegeneratedbyhouseholds,butmayalsoincludesimilarwastesgeneratedbysmallbusinessesandpublicinstitutionsandcollectedbythemunicipality;thispartofmunicipalwastemayvaryfrommunicipalitytomunicipalityandfromcountrytocountry,dependingonthelocalwastemanagementsystem.“(EuroStat)

65GreeneconomydriversinCopenhagen64
Figure 3.31 Municipal waste generation in selected European countries and EU27 average, 1995 – 2011
Source:EuroStat2013d
Denmark
UK
Sweden
Germany
European Union
0
200
300
400
500
600
700
800
100
1995 2000 2005 2010
Mun
icip
al w
aste
gen
erat
ion:
kg
per
cap
ita
Figure 3.32 Waste collection and recycling, Municipality of Copenhagen
Figure 3.33 Municipal waste treatment methods in the Municipality of Copenhagen and the EU-27 average, 2010
Source:CityofCopenhagenDepartmentforWasteManagement2013
Source:CityofCopenhagen2013a;EuroStat2013d
‘00
0 t
onn
es
0
200
400
600
800
1000
1200
1988
1992
1994
1999
2004
2006
Recycling
Incineration
Landfill
Mun
icip
al w
aste
tre
ated
: kg
per
cap
ita
per
yea
r
0
100
EU-27
Avera
ge
Munici
pality
of
Copenha
gen
200
300
400
500
600
Other
Recycled/composted
Incineration
Landfill
Waste treatment methods have shifted substantially, starting in the 1990s when Copenhagen oversaw a major change from landfill to incineration, using waste as a key fuel for local heat and electricity production. In 1988, over 40% of waste was landfilled while today the amount is less than 2% (Green Growth Leaders, Monday Morning et al. 2011).Total waste figures for Copenhagen for 2010 show that only 2% went to landfill, 58% was recycled and 39% incinerated.
For household waste, treatment methodsare even more skewed towardsincineration as a result of the early 1990spolicy changes. Between 2006 and 2010, the proportion of waste recycled has increased from 23% to 27%, while the proportion incinerated has declined slightly from 73% to 71% (City of Copenhagen 2013a). In comparison with generation and treatment methods in other European countries, the City of Copenhagen generates less, and incinerates and diverts from landfill a far higher proportion of its municipal waste than the EU-27 average (Figure 3.33). However, the reliance on incineration has resulted in a lack of composting/digesting in Copenhagen.
Figure 3.34 District heating market penetration in the Municipality of Copenhagen, 1970-2008
Source:CityofCopenhagen2009 1970 1975 1980 1985 19951990 2005 2008 20102000
Connection to district heating
0%
10%
100%
20%
30%
40%
50%
60%
70%
80%
90%Full connection equals 100%
98.3%
3.7.2 Policy supporting energy and resource effectiveness
EnergyRecent trends towards increased energy efficiency and security of supply in Denmark and the Copenhagen region are due to active public policy initiatives combined with the global diffusion of market-led technologies and shifts in economic structure away from energy-intensive industrial activities.
The expansion of the district heating system and accompanying combined heat and power (CHP) plants have been key to the improvements in energy and resource efficiency in Copenhagen over the past 30 years. According to the City of Copenhagen, by using waste heat from thermal electricity production, CHP can have efficiency levels of up to 94%, compared with around 40% for electricity-only thermal generation (City of Copenhagen 2012f ). The rapid adoption of these highly efficient energy and heat technologies has led to lower energy use. At the same time, the shift in fuel from imported oil to waste and renewable biofuels for thermal energy generation has improved security of supply. Currently over 98% of heat demand in Copenhagen is met by district heating, up from around 30% in 1970 (Figure 3.34).
This shift towards district heating and CHP has been supported by a regulatory environment established by both national and local-level government since the 1970s. Following the oil shocks of the 1970s, the Danish government adopted a series of policy measures aimed at reducing the country’s dependence on imported oil by promoting energy efficiency and switching to indigenous supply sources (Danish Energy Agency 2012a). The 1976 Electricity Supply Plan required thermal electricity generating stations to recover and reuse waste heat, thus establishing CHP as the standard technology for electricity production (International District Energy Association and Thornton 2009). From the mid-1980s, national government tax incentives encouraged electricity generators to use CHP systems (International District Energy Association and Thornton 2009). These policies resulted in a sharp growth in the use of CHP technologies (Figure 3.35).

67GreeneconomydriversinCopenhagen66
Figure 3.35 CHP share of thermal electricity and heat energy production, Denmark, 1990 - 2011
Figure 3.36 District heating and combined heat and power market penetration: Denmark and selected countries, 2011
Source:DanishEnergyAgency2012b
Source:EuroHeatandPower2011
0%
10%
100%
20%
30%
40%
50%
60%
70%
80%
90%
Electricity
District heating
UKUSA
Korea
Germ
any
Poland
Swed
en
% of combined heat and power in national electricity production
% of citizens served by district heating
Finlan
d
Denm
ark
0%
10%
20%
30%
40%
50%
60%
70%
Denmark now has one of the world’s highest levels of market penetration for CHP technology, with 63% of electricity produced through the re-use of ‘waste’ heat, compared with less than 10% in South Korea, the USA and the UK (Figure 3.36). The share of CHP electricity production in Denmark has increased from less than 20% in 1980 to over 60% in 2011.
Denmark also has one of the world’s highest levels of market penetration for district heating technologies, with 60% of citizens served by district heating networks (Figure 3.36). The regulatory framework that enabled this included The Danish Heat Supply Law of 1979, which encouraged local governments to develop district heating networks by allowing municipalities to make district heating connections mandatory for property owners within particular geographic areas (Copenhagen Energy 2008; Danish Energy Agency 2012a). In 1984 the City of Copenhagen, together with four other municipalities within the urban region, set up the ‘Metropolitan Copenhagen Heating Transmission Company’. This company is responsible for coordinating a large-scale district heating network, first developed in the 1920s but now expanded to include four CHP stations, three waste incinerators and over 1,500km of pipes distributing heat to homes and businesses (Copenhagen Energy 2008).
Figure 3.37 Energy-related tax collected, Denmark, 1991 - 2008
Source:StatisticsDenmark2013c
Taxe
s co
llect
ed (
DK
K m
illio
ns)
0
5,000
1992 1994 1996 1998 2000 2002 2004 2006 2008
10,000
15,000
20,000
25,000
30,000
35,000
40,000
Natural gas
Electricity
Coal
Petrol
Gas
CO2
Oil products
Sulphur
While the shift to CHP and district heating was initially driven by policies to address security of energy supply, from the 1990s onwards environmental objectives have also influenced the growth of the local energy network. Switching generating stations from coal to gas and more recently to biofuels has responded to concerns about local air quality and, more recently, reducing carbon emissions (Copenhagen Energy 2008).
Although the energy production sector – and particularly the local CHP and district heating systems - has been central to Copenhagen’s history of improved energy and resource efficiency since the 1970s, other sectors have also played important roles. In the building sector, energy efficiency on the production side has been complemented by effective building regulations that have reduced demand for heat energy. The Danish government introduced the first energy requirements for new buildings in 1961, and since then – particularly after the 1970s oil shocks - standards have been tightened several times. Today, the heat demand of new buildings in Denmark is around 75% lower than it was before 1977 (Danish Energy Agency 2012a). In addition, between 1978 and 1984 a state subsidy programme incentivised energy improvements to existing buildings (Danish Energy Agency 2012a). The current Danish building code includes energy performance requirements for heating, cooling, ventilation, hot water and lighting.
In the transport sector, Copenhagen’s investments in public transport and cycling infrastructure have supported less energy and resource intensive transport options. At the national level, taxes on transport fuels were first introduced in 1977 and are now higher than the global average. Tax incentives for energy efficiency exist for vehicle ownership. These transport-sector taxes represent part of a package of taxation measures on energy use that support efficiency. Rising taxation rates, together with increasing consumption, have meant total energy-related tax collection in Denmark has more than doubled between 1991 and 2001, with over DKK35bn (US$6.5bn) of taxes on fossil fuels collected in 2008 (Figure 3.37).
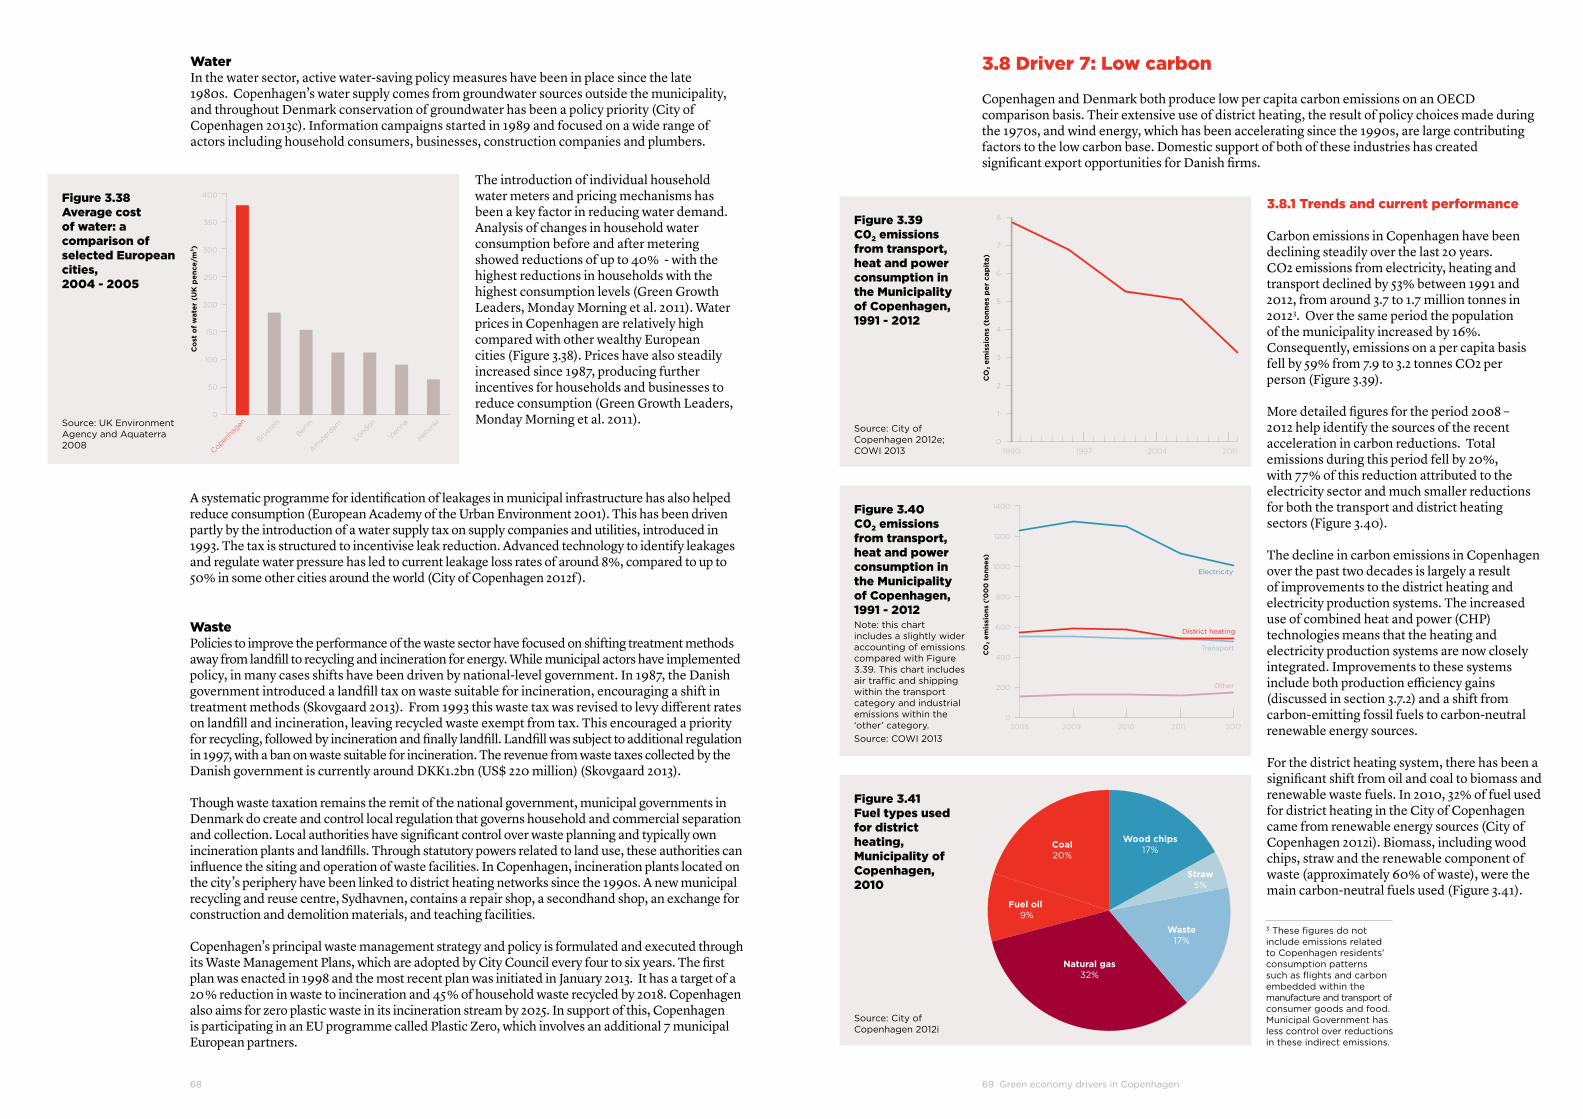
69GreeneconomydriversinCopenhagen68
WaterIn the water sector, active water-saving policy measures have been in place since the late 1980s. Copenhagen’s water supply comes from groundwater sources outside the municipality, and throughout Denmark conservation of groundwater has been a policy priority (City of Copenhagen 2013c). Information campaigns started in 1989 and focused on a wide range of actors including household consumers, businesses, construction companies and plumbers.
A systematic programme for identification of leakages in municipal infrastructure has also helped reduce consumption (European Academy of the Urban Environment 2001). This has been driven partly by the introduction of a water supply tax on supply companies and utilities, introduced in 1993. The tax is structured to incentivise leak reduction. Advanced technology to identify leakages and regulate water pressure has led to current leakage loss rates of around 8%, compared to up to 50% in some other cities around the world (City of Copenhagen 2012f ).
WastePolicies to improve the performance of the waste sector have focused on shifting treatment methods away from landfill to recycling and incineration for energy. While municipal actors have implemented policy, in many cases shifts have been driven by national-level government. In 1987, the Danish government introduced a landfill tax on waste suitable for incineration, encouraging a shift in treatment methods (Skovgaard 2013). From 1993 this waste tax was revised to levy different rates on landfill and incineration, leaving recycled waste exempt from tax. This encouraged a priority for recycling, followed by incineration and finally landfill. Landfill was subject to additional regulation in 1997, with a ban on waste suitable for incineration. The revenue from waste taxes collected by the Danish government is currently around DKK1.2bn (US$ 220 million) (Skovgaard 2013).
Though waste taxation remains the remit of the national government, municipal governments in Denmark do create and control local regulation that governs household and commercial separation and collection. Local authorities have significant control over waste planning and typically own incineration plants and landfills. Through statutory powers related to land use, these authorities can influence the siting and operation of waste facilities. In Copenhagen, incineration plants located on the city’s periphery have been linked to district heating networks since the 1990s. A new municipal recycling and reuse centre, Sydhavnen, contains a repair shop, a secondhand shop, an exchange for construction and demolition materials, and teaching facilities.
Copenhagen’s principal waste management strategy and policy is formulated and executed through its Waste Management Plans, which are adopted by City Council every four to six years. The first plan was enacted in 1998 and the most recent plan was initiated in January 2013. It has a target of a 20 % reduction in waste to incineration and 45 % of household waste recycled by 2018. Copenhagen also aims for zero plastic waste in its incineration stream by 2025. In support of this, Copenhagen is participating in an EU programme called Plastic Zero, which involves an additional 7 municipal European partners.
The introduction of individual household water meters and pricing mechanisms has been a key factor in reducing water demand. Analysis of changes in household water consumption before and after metering showed reductions of up to 40% - with the highest reductions in households with the highest consumption levels (Green Growth Leaders, Monday Morning et al. 2011). Water prices in Copenhagen are relatively high compared with other wealthy European cities (Figure 3.38). Prices have also steadily increased since 1987, producing further incentives for households and businesses to reduce consumption (Green Growth Leaders, Monday Morning et al. 2011).
Figure 3.38 Average cost of water: a comparison of selected European cities, 2004 - 2005
Source:UKEnvironmentAgencyandAquaterra2008
0
50
100
150
200
250
300
350
400
Helsinki
Vienna
London
Amsterdam
Berlin
Brussels
Copenhagen
Co
st o
f w
ater
(U
K p
ence
/m3)
Figure 3.39 C02 emissions from transport, heat and power consumption in the Municipality of Copenhagen, 1991 - 2012
Figure 3.40 C02 emissions from transport, heat and power consumption in the Municipality of Copenhagen, 1991 - 2012
Figure 3.41 Fuel types used for district heating, Municipality of Copenhagen, 2010
Source:CityofCopenhagen2012e;COWI2013
Source:COWI2013
Source:CityofCopenhagen2012i
Note:thischartincludesaslightlywideraccountingofemissionscomparedwithFigure3.39.Thischartincludesairtrafficandshippingwithinthetransportcategoryandindustrialemissionswithinthe‘other’category.
CO
2 em
issi
ons
(to
nnes
per
cap
ita)
3
2
1
0
4
5
6
7
8
1990 1997 2004 2011
CO
2 em
issi
ons
('0
00
to
nnes
)
200
0
400
600
800
1000
1200
1400
2008 2009 2010 2011 2012
District heating
Electricity
Transport
Other
Coal20%
Fuel oil 9%
Natural gas32%
Waste17%
Straw5%
Wood chips17%
3.8 Driver 7: Low carbon
Copenhagen and Denmark both produce low per capita carbon emissions on an OECD comparison basis. Their extensive use of district heating, the result of policy choices made during the 1970s, and wind energy, which has been accelerating since the 1990s, are large contributing factors to the low carbon base. Domestic support of both of these industries has created significant export opportunities for Danish firms.
3ThesefiguresdonotincludeemissionsrelatedtoCopenhagenresidents’consumptionpatternssuchasflightsandcarbonembeddedwithinthemanufactureandtransportofconsumergoodsandfood.MunicipalGovernmenthaslesscontroloverreductionsintheseindirectemissions.
3.8.1 Trends and current performance
Carbon emissions in Copenhagen have been declining steadily over the last 20 years. CO2 emissions from electricity, heating and transport declined by 53% between 1991 and 2012, from around 3.7 to 1.7 million tonnes in 20123. Over the same period the population of the municipality increased by 16%. Consequently, emissions on a per capita basis fell by 59% from 7.9 to 3.2 tonnes CO2 per person (Figure 3.39).
More detailed figures for the period 2008 – 2012 help identify the sources of the recent acceleration in carbon reductions. Total emissions during this period fell by 20%, with 77% of this reduction attributed to the electricity sector and much smaller reductions for both the transport and district heating sectors (Figure 3.40).
The decline in carbon emissions in Copenhagen over the past two decades is largely a result of improvements to the district heating and electricity production systems. The increased use of combined heat and power (CHP) technologies means that the heating and electricity production systems are now closely integrated. Improvements to these systems include both production efficiency gains (discussed in section 3.7.2) and a shift from carbon-emitting fossil fuels to carbon-neutral renewable energy sources.
For the district heating system, there has been a significant shift from oil and coal to biomass and renewable waste fuels. In 2010, 32% of fuel used for district heating in the City of Copenhagen came from renewable energy sources (City of Copenhagen 2012i). Biomass, including wood chips, straw and the renewable component of waste (approximately 60% of waste), were the main carbon-neutral fuels used (Figure 3.41).

71GreeneconomydriversinCopenhagen70
Recent measurements show that carbon emissions per KWh from the Copenhagen system have declined by 16% between 2005 and 2010 (City of Copenhagen 2012i). Longer-term trends for the carbon performance of Copenhagen’s district heating system are harder to source for successive years, but the data available shows the scale of the impact since the district network in use today took shape in 1984. For example CO2 emissions have dropped by 187,600 tonnes annually, from 3,460,000 tons in 1995 to 2,522,000 in 2000. Sulphur dioxide emissions have also been reduced by one third (C40 Cities for Climate Leadership 2011). In 1980, less than 10% of energy produced for district heating across Denmark was from renewable sources. By 2011, renewables made up over 40% of fuel (Figure 3.42). This growth in renewable sources is mainly due to the increased use of biomass, including wood and straw. Between 1980 and 1990 oil was rapidly replaced by coal and natural gas, but since 1990 coal use has declined in favour of natural gas and renewable sources. National level data shows that the renewable fuel component of the Copenhagen district heating system, at 32% of total fuel, is not as high as the national average at 44% across all Danish district heating systems.
Carbon emissions have also reduced for electricity consumption in Copenhagen. This is partly due to the same efficiency improvements from increased use of CHP technologies that improved the carbon performance of heat energy. In addition, as with district heating, there has been a significant shift to renewable energy sources. In 2010, renewable sources made up almost 40% of the Copenhagen’s electricity supply (Figure 3.43). However, carbon emissions data from 2010-2012 show that in the past two years, Copenhagen’s emissions from electricity consumption have fallen substantially (Figure 3.40), suggesting a recent increase in the renewable component of electricity supply since 2010.
Longer term trends for the electricity sector at a national level show growth in renewable generation starting in the 1980s, but with more substantial increases in the 1990s and 2000s (Figure 3.44). The use of wind and biomass energy grew from a very low base in 1980 to make up 14% and 16% respectively of total energy consumption for electricity production by 2011. In 2011, renewable sources accounted for 31% of energy consumed for electricity production. This growth in renewables combined with increased natural gas consumption to replace more carbon-intensive coal and oil.
Figure 3.42 Fuel types used for district heating in Denmark, 1980 - 2011
Figure 3.43 Energy sources for electricity consumption in Copenhagen, 2005 - 2010Notethatnuclearportionistheresultofcross-borderenergygridconnections.ThereisnonuclearenergyproductioninDenmark.
Figure 3.44 Fuel consumption for electricity production in Denmark, 1980 - 2011
Source:DanishEnergyAgency2012b
Source:CityofCopenhagen2012b
Source:DanishEnergyAgency2012b
% o
f fu
el c
ons
ump
tio
n (e
nerg
y co
nten
t)
1980
1990
2000
2011
Biomass
Waste, renewable
Waste, non-renewable
Coal
Natural gas
Oil
0%
10%
20%
30%
40%
50%
60%
70%
80%
90%
100%
% o
f el
ectr
icit
y co
nsum
pti
on
0%
10%
100%
2005 2006 2007 2008 2009 2010
20%
30%
40%
50%
60%
70%
80%
90%
Wind, hydro and solar
Waste, biomass and biogas
Nuclear
Natural gas and oil
Coal
1980
1990
2000
2011
Fuel
co
nsum
pti
on:
dir
ect
ener
gy
cont
ents
(TJ
)
Coal
0
50,000
100,000
150,000
200,000
250,000
300,000Wind
Biomass, incl. waste
Renewables, other
Oil
Waste, non-renewable
Natural gas
Despite improvements to the national electricity system, the carbon intensity of electricity consumed in Copenhagen remains far higher than for heat energy. The differential is due, partly, to the conversion efficiencies of the technologies in use to create electric and thermal energy respectively. Cutting electricity consumption thus has a more significant impact on reducing CO2 emissions than reducing heating demand, based on current supply. Note that the carbon intensity of electricity supplied to Copenhagen is higher than the national average, which has reduced by around 50% since 1990 (Figure 3.45).
Global comparisons of low-carbon performance are most robust at the national rather than city-level. Carbon emissions for Denmark were around 8.5 tonnes per person in 2010, a level above the OECD Europe average of 7 tonnes per person and close to double the global average of 4.4 tonnes – but around half the levels in the United States (Figure 3.46). Since the mid-1990s, Danish emissions levels have declined reasonably consistently and are now almost 25% lower than average per capita levels of around 11 tonnes per person during the period 1971 – 1996. Denmark’s per capita carbon emissions now sit below Germany’s but well above Europe’s leading low-carbon countries for example Sweden, which has access to extensive renewable energy resources and nuclear electricity generation. The recent decline in Denmark’s emissions is a trend shared by many other wealthy countries but contrasts with a continuing growth in recently industrialised countries including Korea and China.
Figure 3.45 Carbon intensity of Electricity production: Denmark and international comparisons, 1990 - 2010
Figure 3.46 CO2 emissions per capita: Denmark and international comparisons, 1971 -2010
Source:InternationalEnergyAgency2013
Source:InternationalEnergyAgency2013
CO
2 em
issi
ons
per
kW
h
19921990 1994 1996 1998 2000 2002 2004 2006 2008 20100
200
300
100
400
500
600
700
800
900
1000
Denmark
UK
China
Sweden
World
OECD Europe
United States
Japan
Car
bo
n em
issi
ons
per
cap
ita
(tC
O2)
19761971 1981 1986 1991 1996 2001 2006 2011
China
World
0
5
10
15
20
25
Sweden
Denmark
UK
Germany
OECD European
Korea
United States

73GreeneconomydriversinCopenhagen72
International comparisons of carbon emissions by consumption sector show that emissions are relatively high in the residential, commercial and transport sectors (Figure 3.47). This can be explained by high heating energy demands that still rely largely on fossil fuels. In the transport sector, Danish emissions are 2.3 tonnes of carbon per capita, 33% higher than the average for OECD European countries – although still less than half the level in the United States. Danish industrial emissions are relatively low compared to economies that are more orientated to manufacturing sectors, including China and Japan.
International comparisons of carbon emissions at the city level are more challenging, as calculation methods and assumptions vary between cities. However, as an indication of Copenhagen’s relative performance, self-reported emissions from a selection of large global cities are shown (Figure 3.48). At an average of 3.2 tonnes per person, Copenhagen’s emissions are lower than cities in North America, East Asia and Europe with comparable advanced economies.
Figure 3.47 Per capita carbon emissions by consumption sector, 2010: Denmark and other countries
Figure 3.48 Comparison of current reported CO2 emissions in a selection of cities
Source:InternationalEnergyAgency2013
Source:LSECitiesbasedonmultiplesources.InsomecasesonlycarbonemissionsarereportedandinothersCO2e
Car
bo
n em
issi
ons
per
cap
ita
(tC
O2/
year
)
0
USABra
zil
World
Swed
en
China
Franc
e
OECD Eur
opeUK
Denm
ark
Japan
Germ
any
Commercial
Transport
Industry
Residential
5
10
15
20
Car
bo
n em
issi
ons
per
cap
ita
(tC
O2/
year
)
0
6
4
2
8
10
12
Mumbai
São P
aulo
Bogotá
Istan
bul
Copenha
gen
Stock
holm
Berlin
Hong K
ong
Lond
on
New Y
ork
Singap
ore
Portlan
d
3.8.2 Policy supporting low carbon
Policies supporting carbon reductions in the City of Copenhagen have included measures in three broad areas:
• incentivisingmoreenergyefficientthermalproduction,includingdistrictheatingandCHP;
• incentivisingenergyefficientconsumption,includingbuildingandtransportsectorefficiency measures; and
• incentivisingtheswitchingofenergysourcestowardslower-carbonfuels.
Policies related to the first two areas are detailed in Section 3.7.2 in a discussion of energy efficiency and security. These efficiency measures have obvious co-benefits for carbon emissions through the reduction in total energy used. This section focuses on policies incentivising fuel switching.
Policies to encourage the use of biofuels for the district heating and CHP system in Copenhagen first emerged in the 1990s, following national-level directives. While policies from the 1970s incentivising efficient district heating and CHP systems were initially introduced predominantly for energy security and cost efficiency reasons, from the 1990s onwards climate change and local environmental concerns became additional drivers prompting fuel switching (City of Copenhagen 2009).
In 1993, the Danish government introduced a target to use 1.4 million tonnes of straw and woodchips for electricity production. Two CHP plants in Copenhagen participated in the programme (Copenhagen Energy 2008). Carbon taxes and subsidies for biomass fuels have made it cost effective for Copenhagen’s utilities to shift away from fossil fuels (Copenhagen Energy 2008). In 1977 a tax was introduced on oil, prompting a shift away from this fuel. Later, taxes were also placed on coal and natural gas while renewable fuels have remained tax exempt (Danish Energy Agency 2012a). Denmark introduced a carbon tax in 1992, with the tax rate increasing several times since (Danish Energy Agency 2012a; Statistics Denmark 2013c). Between 1981 and 2001, government subsidies for renewable individual heat sources were also provided, including for heat pumps and solar heating (Danish Energy Agency 2012a).
Renewable electricity production has also been incentivised through a range of policy instruments to promote wind power. The Danish government has used subsidies, feed-in tariffs, direct orders to energy utilities, and requirements for municipalities to provide space for wind turbines (Danish Energy Agency 2012a). At the municipal level, the City of Copenhagen facilitated the establishment of a wind turbine cooperative in 1996, half owned by the city-owned utility, with remaining shares owned by 10,000 members of the local community. In 2000 the co-operative opened the Middelgrunden offshore wind farm, offshore from the City of Copenhagen. The co-operative has plans to build 100 more turbines by 2025 (City of Copenhagen 2012f; Copenhagen Environment and Energy Office CEEO 2003).
In the transport sector, policy measures to encourage fuel switching have been introduced more recently. A new policy introduced in 2012 requires all petrol and diesel sold to contain on average 5.75% biofuel. Electric car sales have been incentivised through exemption from purchase and annual owner’s tax (Danish Energy Agency 2012a). These measures complement other transport sector policies supporting more energy efficient forms of travel including walking, cycling and public transport; land-use planning that reduces the need to travel; and taxation that encourages fuel-efficient vehicles (as described in Section 3.6.2).

75GreeneconomydriversinCopenhagen74
3.9 Driver 8: Environmental quality
Environmental quality – air quality, water quality and the attractiveness of the cityscape - is a driver of the green economy through a range of channels. Levels of air and water pollution can have substantial impacts on the health of residents and workers, with associated socio-economic impacts on labour productivity. At the same time, a high quality urban environment with green spaces and attractive aspects also contributes to a city’s attractiveness to international students, highly skilled professionals and young entrepreneurs. In this way, environmental quality can support other drivers of the green economy such as skills and enterprise.
3.9.1 Trends and current performance
Top left: Figure 3.49 Lead air pollution, Copenhagen, 1990 – 2007Top right: Figure 3.50 Sulphur dioxide air pollution, Copenhagen, 1990 – 2000Bottom left: Figure 3.51 Carbon monoxide air pollution, Copenhagen, 1994 - 2007Bottom right: Figure 3.52 Particulate air pollution, Copenhagen, 1990 - 2007Note:From2001particlesarechangedfromtotalsuspendedparticlestoPM10,contributingtoreductions.
Source:StatisticsDenmark2013g
0
50
100
150
200
250
300
ng/m
3 le
ad
1994
1992
1990
1996
1998
2000
2002
2004
2006
30
20
10
0
40
50
60
70
80
90
µg/m
3 p
arti
cula
tes
1994
1996
1998
2000
2002
2004
2006
0
5
10
15
20
µg/m
3 su
lphu
r d
ioxi
de
1990
1992
1994
1996
1998
2000
0
1,000
2,000
3,000
4,000
5,000
6,000
7,000
8,000
9,000
10,000
µg/m
3 ca
rbo
n m
ono
xid
e
1994
1996
1998
2000
2002
2004
2006
Air qualityAir quality in Copenhagen has improved substantially, with available data showing almost continuous year on year improvements in levels of most air pollutants going back to at least 1990. Reductions in some air pollutants have been dramatic, with levels of lead (mostly from the road transport sector) falling by 84% over just three years between 1991 and 1994 (Figure 3.49). Sulphur dioxide pollution (mostly from energy production) fell by 83% over the ten years from 1990 to 2000 (Figure 3.50) and carbon monoxide (from energy production and road transport) fell by 72% between 1994 and 2007 (Figure 3.51). Current levels of atmospheric lead, sulphur dioxide and carbon monoxide are now well below EU limit values.
Figure 3.53 Nitrogen dioxide air pollution, Copenhagen and Denmark, 1983 – 2010
Source:Ellermann,Nordstrømetal.2011
Particulate pollution has also declined over the past two decades. The main sources in Copenhagen include a substantial share from regional and international ‘background’ sources, as well as local road transport (mostly passenger cars) and household wood burners (Jensen, Brandt et al. 2013). Measurements of Total Suspended Particulate (TSP, equivalent to PM25) fell 33% from about 75ug/m3 in 1990 to around 50ug/m3 in 2000. From 2001, PM10 replaced TSP measurement, with PM10 levels falling from 34ug/m3 in 2001 to 30ug/ m3 in 2007 (Figure 3.52). PM10 levels at the central city monitoring station on Hans Christian Andersen Boulevard fell from around 45ug/m3 in 2002 to just over 30ug/m3 in 2011 (City of Copenhagen 2012c; City of Copenhagen 2013b).
Despite PM10 levels being below the EU limit value of 40ug/m3 today, they remain well above the WHO guideline of 20ug/m3 (World Health Organization 2006). This is a challenge faced by many other cities in Europe and globally. Finer PM2.5 particles have not been measured consistently over long periods of time. Records between 2007 and 2012 for Hans Christian Andersen Boulevard show a decline in annual average values from around 22ug/m3 to around 15ug/m3 (City of Copenhagen 2012c). As with PM10, these levels are within EU limit values (a level of 25ug/m3 comes into force from 2015), but above WHO guidelines (10ug/m3).
Like particulate pollution, nitrogen dioxide (NO2) pollution remains problematic and exceeds EU and WHO guideline levels for this pollutant. Unlike particulate pollution, most NO2 is from local sources, primarily from road transport, and secondarily from combined heat and power, district heating and waste incinerator plants (Jensen, Brandt et al. 2013). Declines in levels of NO2 during the past two decades have been less marked compared with most other air pollutants. Annual average NO2 levels at the Jagtvej monitoring station declined by around a third, from approximately 60ug/m3 in 1989 to 40ug/ m3 in 2010, with most of these reductions occurring during the 1990s.
At the Hans Christian Andersen Boulevard monitoring station there has been no reduction in NO2 since records began in 2001. At this station, the average annual level of NO2 was 55ug/m3 in 2012, more than 35% higher than the EU limit level and WHO guideline of 40ug/ m3 (City of Copenhagen 2013b). Modelling for 2010 showed that average annual NO2 levels were likely to exceed limits on 29 out of 138 Copenhagen roads carrying heavy traffic. As with most other air pollutants, levels remain highest in central Copenhagen compared with other locations in Denmark.

77GreeneconomydriversinCopenhagen76
Levels of other nitrogen oxides (NOx) have declined more substantially than NO2. As with NO2, NOx sources in Copenhagen are mostly local and primarily from the road transport sector (Jensen, Brandt et al. 2013). Average annual levels roughly halved between 1989 and 2010, from around 200ug/m3 to around100ug/m3.
Global comparisons of wealthy cities show that Copenhagen’s air quality is broadly in line with a number of other European cities of similar population size including Stockholm, Berlin and Amsterdam (Figure 3.54). PM10 levels are lower than in Europe’s biggest centres of Paris and London, but higher than in large North American, Australian and East Asian cities including Sydney, Chicago and Tokyo.
Poor air quality remains a threat to the health of the city’s residents, with a recent study attributing 1,500 premature deaths each year to air pollution within the Capital Region and 540 deaths within the municipalities of Copenhagen and Frederiksberg alone (Brandt, Jensen et al. 2013). The monetised costs of this pollution (mostly related to premature deaths) are estimated at DKK12 billion annually (US$2.1 billion) for the Region and DKK 4 billion (US$500 million) for the municipalities of Copenhagen and Frederiksberg (Brandt, Jensen et al. 2013).
Figure 3.54 PM10 annual mean in selected cities. Values for 2008 or 2009
Source:WorldHealthOrganization2010
0 5 10 15 20 25 30 35 40
Level of PM10 air pollutants (μg/m3)
WHO standard: 20μg/m3
Water qualityWater quality in the Copenhagen Harbour has improved significantly over the past two decades. For much of the twentieth century the harbour was polluted with wastewater from sewers and industry, but recent improvements in wastewater management now means that people can now swim safely in it. The construction of wastewater and stormwater retention reservoirs and improved wastewater treatment plants from the mid-1990s has led to a significant decline in the amount of contaminated rainwater and wastewater being discharged into the harbour (City of Copenhagen 2012f). In 2010, wastewater and rainwater discharges were around one quarter of levels in 1996 (Figure 3.55).
In 2002, the City of Copenhagen opened a swimming-pool in the harbour (earlier baths were closed in 1952 due to increasing pollution) (Sorensen, Petersen et al. 2006). Safe swimming is now once again possible throughout the bathing season, except following heavy rain events when overflows from the waste- and stormwater systems cause swimming pool closures. Since 2002, there have been between 1 and 15 occasions each season when the city’s sea swimming pools have had to be closed due to pollution following heavy rain events (City of Copenhagen 2012n).
Across the wider urban region, water pollutant discharges to the sea have also declined. Measures of nitrogen and phosphorous discharges into The Sound (Oresund - the body of water between the Copenhagen Capital Region and Sweden) show significant decline between 1989-2000 (Figure 3.56 and Figure 3.57). The most dramatic decline has been in discharges of phosphorous from point sources, which suggests improvements to sewage and wastewater treatment plants and industrial discharges. Nitrogen discharges from point sources have also declined. Discharges of nitrogen from non-point sources, for example fertiliser run-off from agriculture, have not declined as much as from point sources.
Figure 3.55 Rainwater and wastewater discharges into Copenhagen Harbour, 1996 – 2010
Left: Figure 3.56 Nitrogen discharges into the Sound, 1989 - 2000
Right: Figure 3.57 Phosphorous discharges into the Sound, 1989 – 2000
Source:CityofCopenhagen2012n
Source:StatisticsDenmark2013e
Cal
cula
ted
am
oun
t o
f ra
inw
ater
and
was
tew
ater
le
d o
ut in
to t
he h
arb
our
('0
00
m3)
Ann
ual d
isch
arg
e o
f ni
tro
gen
(to
nnes
)
Di�use sources
Point sources
0
2,000
1989 19
9119
9319
9519
9719
99
4,000
6,000
8,000
10,000
12,000
Ann
ual d
isch
arg
e o
f p
hosp
horo
us (
tonn
es) Di�use sources
Point sources
0
500
1989 19
9119
9319
9519
9719
99
1000
1500
2000
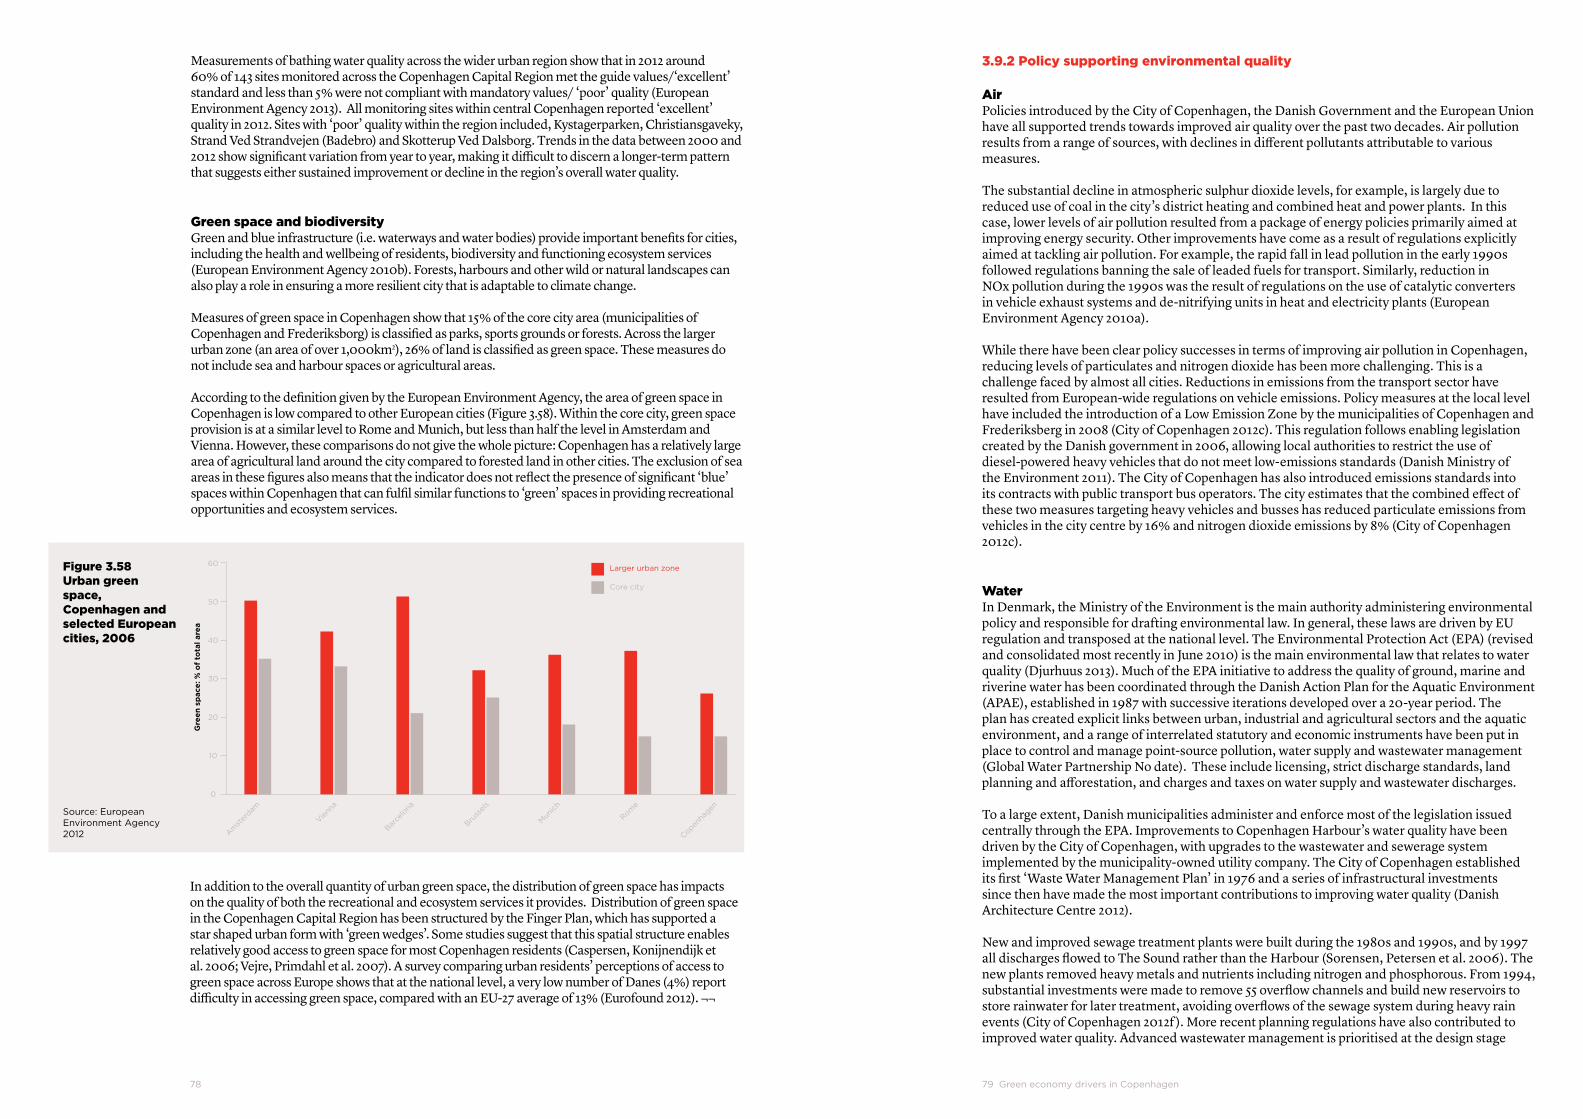
79GreeneconomydriversinCopenhagen78
Measurements of bathing water quality across the wider urban region show that in 2012 around 60% of 143 sites monitored across the Copenhagen Capital Region met the guide values/‘excellent’ standard and less than 5% were not compliant with mandatory values/ ‘poor’ quality (European Environment Agency 2013). All monitoring sites within central Copenhagen reported ‘excellent’ quality in 2012. Sites with ‘poor’ quality within the region included, Kystagerparken, Christiansgaveky, Strand Ved Strandvejen (Badebro) and Skotterup Ved Dalsborg. Trends in the data between 2000 and 2012 show significant variation from year to year, making it difficult to discern a longer-term pattern that suggests either sustained improvement or decline in the region’s overall water quality.
Green space and biodiversityGreen and blue infrastructure (i.e. waterways and water bodies) provide important benefits for cities, including the health and wellbeing of residents, biodiversity and functioning ecosystem services (European Environment Agency 2010b). Forests, harbours and other wild or natural landscapes can also play a role in ensuring a more resilient city that is adaptable to climate change.
Measures of green space in Copenhagen show that 15% of the core city area (municipalities of Copenhagen and Frederiksborg) is classified as parks, sports grounds or forests. Across the larger urban zone (an area of over 1,000km2), 26% of land is classified as green space. These measures do not include sea and harbour spaces or agricultural areas.
According to the definition given by the European Environment Agency, the area of green space in Copenhagen is low compared to other European cities (Figure 3.58). Within the core city, green space provision is at a similar level to Rome and Munich, but less than half the level in Amsterdam and Vienna. However, these comparisons do not give the whole picture: Copenhagen has a relatively large area of agricultural land around the city compared to forested land in other cities. The exclusion of sea areas in these figures also means that the indicator does not reflect the presence of significant ‘blue’ spaces within Copenhagen that can fulfil similar functions to ‘green’ spaces in providing recreational opportunities and ecosystem services.
In addition to the overall quantity of urban green space, the distribution of green space has impacts on the quality of both the recreational and ecosystem services it provides. Distribution of green space in the Copenhagen Capital Region has been structured by the Finger Plan, which has supported a star shaped urban form with ‘green wedges’. Some studies suggest that this spatial structure enables relatively good access to green space for most Copenhagen residents (Caspersen, Konijnendijk et al. 2006; Vejre, Primdahl et al. 2007). A survey comparing urban residents’ perceptions of access to green space across Europe shows that at the national level, a very low number of Danes (4%) report difficulty in accessing green space, compared with an EU-27 average of 13% (Eurofound 2012). ¬¬
Figure 3.58 Urban green space, Copenhagen and selected European cities, 2006
Source:EuropeanEnvironmentAgency2012
Core city
Larger urban zone
0
10
20
30
40
50
60
Gre
en s
pac
e: %
of
tota
l are
a
Copenha
gen
Rome
Munich
Bruss
els
Barce
lona
Vienna
Amste
rdam
3.9.2 Policy supporting environmental quality
AirPolicies introduced by the City of Copenhagen, the Danish Government and the European Union have all supported trends towards improved air quality over the past two decades. Air pollution results from a range of sources, with declines in different pollutants attributable to various measures.
The substantial decline in atmospheric sulphur dioxide levels, for example, is largely due to reduced use of coal in the city’s district heating and combined heat and power plants. In this case, lower levels of air pollution resulted from a package of energy policies primarily aimed at improving energy security. Other improvements have come as a result of regulations explicitly aimed at tackling air pollution. For example, the rapid fall in lead pollution in the early 1990s followed regulations banning the sale of leaded fuels for transport. Similarly, reduction in NOx pollution during the 1990s was the result of regulations on the use of catalytic converters in vehicle exhaust systems and de-nitrifying units in heat and electricity plants (European Environment Agency 2010a).
While there have been clear policy successes in terms of improving air pollution in Copenhagen, reducing levels of particulates and nitrogen dioxide has been more challenging. This is a challenge faced by almost all cities. Reductions in emissions from the transport sector have resulted from European-wide regulations on vehicle emissions. Policy measures at the local level have included the introduction of a Low Emission Zone by the municipalities of Copenhagen and Frederiksberg in 2008 (City of Copenhagen 2012c). This regulation follows enabling legislation created by the Danish government in 2006, allowing local authorities to restrict the use of diesel-powered heavy vehicles that do not meet low-emissions standards (Danish Ministry of the Environment 2011). The City of Copenhagen has also introduced emissions standards into its contracts with public transport bus operators. The city estimates that the combined effect of these two measures targeting heavy vehicles and busses has reduced particulate emissions from vehicles in the city centre by 16% and nitrogen dioxide emissions by 8% (City of Copenhagen 2012c).
WaterIn Denmark, the Ministry of the Environment is the main authority administering environmental policy and responsible for drafting environmental law. In general, these laws are driven by EU regulation and transposed at the national level. The Environmental Protection Act (EPA) (revised and consolidated most recently in June 2010) is the main environmental law that relates to water quality (Djurhuus 2013). Much of the EPA initiative to address the quality of ground, marine and riverine water has been coordinated through the Danish Action Plan for the Aquatic Environment (APAE), established in 1987 with successive iterations developed over a 20-year period. The plan has created explicit links between urban, industrial and agricultural sectors and the aquatic environment, and a range of interrelated statutory and economic instruments have been put in place to control and manage point-source pollution, water supply and wastewater management (Global Water Partnership No date). These include licensing, strict discharge standards, land planning and afforestation, and charges and taxes on water supply and wastewater discharges.
To a large extent, Danish municipalities administer and enforce most of the legislation issued centrally through the EPA. Improvements to Copenhagen Harbour’s water quality have been driven by the City of Copenhagen, with upgrades to the wastewater and sewerage system implemented by the municipality-owned utility company. The City of Copenhagen established its first ‘Waste Water Management Plan’ in 1976 and a series of infrastructural investments since then have made the most important contributions to improving water quality (Danish Architecture Centre 2012).
New and improved sewage treatment plants were built during the 1980s and 1990s, and by 1997 all discharges flowed to The Sound rather than the Harbour (Sorensen, Petersen et al. 2006). The new plants removed heavy metals and nutrients including nitrogen and phosphorous. From 1994, substantial investments were made to remove 55 overflow channels and build new reservoirs to store rainwater for later treatment, avoiding overflows of the sewage system during heavy rain events (City of Copenhagen 2012f ). More recent planning regulations have also contributed to improved water quality. Advanced wastewater management is prioritised at the design stage

81GreeneconomydriversinCopenhagen80
when planning for new urban districts such as Orestad, and includes a three-tier sewage system separating roof water, rainwater and road water (City of Copenhagen 2012f; Sorensen, Petersen et al. 2006)
Green space and biodiversityThe Ministry of Environment principally controls the statutory levers for green space and biodiversity, with the Danish Nature Agency acting as the national implementation body. The Nature Conservation Act provides Denmark’s main legislative framework for nature conservation and covers four key themes: general protection for habitats; coastal zone protection; land acquisition; and specific regulatory powers for the protection of nature (Danish Ministry of the Enviroment 2010). Copenhagen’s major urban parks and natural areas are covered under the Act.
Land management and planning follows a hierarchy that extends from national statutory legislation down to planning and implementation at the regional and the local level. A reform of the national Planning Act in 2007 altered the administration of the overarching national frameworks, reducing the number of regional authorities from 14 down to 5 (which includes Hovedstaden, the Danish Capital Region), and the number of municipal plans from 271 down to 98. Smaller local area plans are also part of this framework.
In Copenhagen, spatial and land-use planning have for decades been guided by the Copenhagen Finger Plan, originally formulated in 1947. This strategy concentrated development along transit-served ‘fingers’ emanating from the ‘palm’ of central Copenhagen, with green wedges filing in the spaces between these developed spines. As a result of the 2007 changes to the Planning Act, the Finger Plan strategy was updated for the Copenhagen Capital Region, along with 34 local municipal plans that sit within this regional context. This 2007 update reaffirmed that the green wedges may not be converted to urban zones or used for urban recreational facilities.
In 2011, Copenhagen prepared a strategy for biodiversity entitled ’Room for Nature - A Strategy for Biodiversity’. The aim of the strategy is to draw attention to the value of urban biodiversity and to provide a greater focus on biodiversity in municipal operations and management. In support of this, the City of Copenhagen has classified parks and nature areas into two categories: urban nature and urban areas close to nature. The category designated as ‘urban nature’ recognises that, due to priorities for active recreation and as a result of ecosystem fragmentation, biodiversity value is generally low. While opportunities to significantly improve biodiversity are limited, the strategy does explicitly recognise biodiversity enhancement as integral to urban green space management. The category designated as ‘urban areas close to nature’ (mainly the large nature areas in the outskirts of the city) are generally larger, more coherent and less managed. They have a greater potential for high levels of biodiversity which can be improved through interventions such as fauna passages and developing green corridors.
In 2010, in order to further improve urban biodiversity whilst also managing storm water and reducing the heat island effect, the City of Copenhagen mandated that provisions for green roofs were to be included in local plans and applied to new or retrofitted buildings with flat or low-pitched roofs. Local plans that have been approved since this provision was enacted should yield in excess of 200,000 m2 of green roof space once they are fully implemented (City of Copenhagen 2012k). A green roof mandate is also in place for public buildings, through approved municipal guidelines such as ‘Sustainability in Constructions and Civil Works’.

83Lowcarbon,energyandresources82
4
LOwCARBON,ENERGYANDRESOURCES
District cooling is a low carbon system based on free cooling from seawater abstraction. The project is expected to save 30,000 tonnes of CO2 emissions per year.Credit:CityofCopenhagen
85Lowcarbon,energyandresources84
Key messages
Copenhagenisrecognisedforitsworld-leadinglow-carbonpolicies.Inenergy,extensivedistrictheatingsystemsaresupportedbycombinedheatandpower(CHP)generation.Intransport,cyclingratesareamongthehighestintheworld.
TheCityofCopenhageniscontinuingitsleadershiprolethroughitsambitiousgoaltobecarbonneutralby2025.Createdin2012,theClimatePlanproposestomakeCopenhagentheworld’sfirstcarbon-neutralcapitalcity.
TheClimatePlancomplementsandcoordinatesseveralotherexistingpolicyframeworksinenergy,transportation,developmentplanning,andwaste.Waterandwastepoliciesaimtosupportresourceefficiency.
Thecarbon-neutraltargetishighlyambitious,requiring1.2milliontonnesofcarbonreductionsover14years:74%inenergyproduction(includingoffsets),7%inenergyconsumption,11%inthetransportsector,and8%inothersectors.
Inenergyproduction,Copenhagenaimstodelivercarbonreductionsthroughfuelswitchingfromfossilfuelstobiomassforthecity’sCHPnetwork(43%ofreductions),increasedwindpower(42%),separatingplasticsfromwasteforincineration(12%),andbiomassforpeakelectricityproduction(3%).
KeychallengesthatCopenhagenwillneedtoaddressindeliveringthesemeasuresinclude:
• Establishingasolidbiomassenergysupplychainrapidlyfromnationaland internationalsupplierstoensuresufficientvolume,pricesecurity,andsustainable landandforestrymanagementpractices.
• Securingwindenergydevelopmentcontractsinacompetitivemarketplacewhere multiplebiddersareactive.
• Aligningwastereductionandrecyclinggoalswiththeincreaseddemandforwasteas anenergysource.
• Creatingthecapacitytoseparateplasticfromthewastestream(eitheratpointof collectionorpointoftreatment).
Inenergyconsumption,theaimistoreduceemissionsfromcommercialbuildings(67%ofreductions)andresidentialbuildings(12%),andtoincreasetheuseofsolarpanels(21%).
KeychallengesforCopenhagentoconsiderindeliveringthesemeasuresinclude:
• Thepaceofenergyefficiencyretrofitsintheexistingbuildingstock,whichremains asmallmarketinspiteofthefinancialpotential.
• MarketuncertaintyoverpreviouslyestablishednationaltargetsandincentivesforPV solarpanels,andincumbentutilitymodelswhichfavourcentralisedgeneration.
Intransport,theCityofCopenhagenneedstoreduceemissionsby544,000tonnes.Thecityaimstoreduce135,000tonnesdirectly,withtheremaining409,000tonnesrequiringoffsetsintheenergyproductionsector.Directemissionsreductionsareplannedthroughfourpathways:(1)increasedcycling(30%ofdirectreductions),(2)intelligentmobility(30%),(3)increasedmasstransit(22%),and(4)vehiclefuelswitching(18%).
KeychallengesforCopenhagentoconsiderindeliveringthesemeasuresinclude:
• Theprovisionofelectricvehiclecharginginfrastructuretoallowconsumeruptakeof electricvehicles,andthecoordinationofpoliciesaroundelectricchargingpoints, smartgrids,andbalancingenergydemandfrombuildingsandtransport.
• Increasingtheavailableroadspaceforcyclingandmasstransitvehicles.
4 Lowcarbon,energyandresources Inthewatersector,resourceefficiency,carbonreductions,andclimateresiliencerepresentinteractingchallenges.Forexample,waterextractionandwastewatertreatmentareenergyintensiveoperations,whilestormwatermanagementhasadirectimpactonsurfacefloodingfromextremeweatherevents.
Keychallengeshereincludeincreasingtheuseofdecentralisedwatersupplyandwatermanagementstrategiessuchasstormwaterretention,andre-useatthebuildinganddistrictscale.
Meetingthe2025carbon-neutraltargetwillbechallengingandrequiresustainedpolicyleadershipbytheCityofCopenhagen.Duetohighlevelsofmunicipalcontrolinenergy,localtransport,water,andwaste,Copenhagenhasagreaterrangeofpolicyleversformeetingitsobjectivesthansomeothercities.However,supportiveandwell-coordinatednationalpolicieswillalsobeessential.
This chapter outlines Copenhagen’s green vision and policies for low carbon, energy and resource effectiveness. The chapter examines four key sectors: transport, energy (including energy efficiency and energy supply), water, and waste. These sectors are central to delivering Copenhagen’s low carbon, energy and resource goals – all drivers of the green economy. The chapter draws on Chapter 3 to identify key challenges emerging from trends in each sector. Policy approaches are investigated through an analysis of both official policy documents and through a survey of city policymakers. The survey allows for global comparison of Copenhagen’s green policy approach with a selection of 90 cities worldwide. The survey also captures self-assessments of progress in green policy.
The chapter concludes by identifying several cross-cutting strategic areas for Copenhagen to consider in order to reach its carbon-neutral and other resource efficiency targets. The interrelationships between low-carbon energy supply and mobility, building energy performance, waste management, and water efficiency will require assessments around benefits and trade-offs between shorter term carbon gains and longer term low- / no-carbon lock-in, and other environmental and green growth attributes.

87Lowcarbon,energyandresources86
4.1 Copenhagen’s carbon-neutral goal
The City of Copenhagen and the Copenhagen Capital Region are clear in their aspiration to be a world-leading region for urban environmental initiatives. Policy setting for the city and region’s development has prioritised green growth, coupling urban economic development with environmental improvement. Copenhagen’s intent to be carbon neutral by 20254 lies at the heart of this aspiration and drives the municipal development and management agenda.
The CPH 2025 Climate Plan – a green, smart and carbon-neutral city outlines how the City of Copenhagen will achieve its goal of ‘carbon neutrality by 2025’ (City of Copenhagen 2012h). The CPH 2025 document, published in 2012, builds on the earlier 2009 Climate Plan for Copenhagen which established the carbon neutrality goal.
In 2025, Copenhagen will be the world’s first carbon-neutral capital and the city ’s businesses and universities will be spearheading the development of green solutions generating employment and green growth (City of Copenhagen 2012h).
The plan considers goals and initiatives in four main areas:
• Energyconsumption• Energyproduction• Mobility• Cityadministration
It recognises the interrelationships inherent in reaching carbon neutrality. For example, driving down energy consumption allows more base load demand to be met through local, low-carbon supplies; vehicle electrification can reduce transport emissions and support energy storage; and land use and infrastructure development planning can minimise travel distances and influence mode share. The plan identifies green growth and innovation as a key part of the strategy, with goals to reduce carbon emissions, establish new research and attract new businesses. It also uses green development to achieve economic goals. The plan is well ahead of Denmark’s aggressive national strategies to reduce carbon emissions by 40% by 2020 (1990 baseline), and for all electric power and heat production to be fossil fuel-free by 2035 (Danish Government 2011).
4ThisappliestoCityofCopenhagenmunicipalboundaries,andScope1and2emissionsonly(thatis,energydirectlyproducedorpurchased/consumedbybuildings,infrastructure,vehicles,operations,etc.withinthesemunicipalboundaries).Note,however,thatthereisanelementof‘offsetting’withinthecalculations.Inpractice,municipalutilitiescaninvestinandcontrolrenewableenergygenerationoutsideofthemunicipalboundariesasameanstoreducethecarbonfootprintoftheiractivitiesthatarenotyetcarbonfree.
Figure 4.1 Distribution of emissions reductions to 2025 in the CPH2025 Climate Plan
Source:CityofCopenhagen2012h
Green mobility
11%
Energy production74%
Energy consumption
7%
New initiatives6%City
administration initiatives
2%
In setting out a roadmap to carbon neutrality, the plan forecasts emissions reductions from existing initiatives and calculates additional emissions reductions necessary. Baseline emissions in 2011 were 1.9million tonnes CO2 for the City of Copenhagen; existing initiatives are forecast to reduce this to 1.2million tonnes by 2025. The Climate Plan introduces new measures to reduce net carbon emissions to zero (i.e. the remaining 1.2 million tonnes), and allocates reductions across sectors (Figure 4.1). The majority of emissions reductions (74%) are expected to come from energy production, followed by the transport sector (11%), energy consumption (7%), new initiatives (6%), and municipal operations (2%).
The Climate Plan acknowledges that a staged approach to implementation will be a practical necessity and that it is reliant upon certain internal and external conditions. Thus some initiatives will be linked to planned equipment replacement cycles or infrastructure upgrades, whereas others require additional technical or financial innovation in order to be viable. Executing the Climate Plan requires action in three areas concurrently:
1. Analysis – further work is required on strategy development, on determining the future initiatives, on evaluation, and on influencing national policy and legislation.
2. Demonstration – utilising demonstration projects that will deliver knowledge and experience of individual solutions in order to scale their implementation across Copenhagen.
3. Implementation – delivering individual initiatives at a time when the balance between climate, economy and the city’s development can be optimised.
Given the prominence of the ambition and the cross-cutting nature of delivering it, the CPH 2025 Climate Plan is clearly connected to and will exert significant influence over the delivery and refinement of many other of the City of Copenhagen’s existing plans and strategies. Though not an exhaustive list, this is seen most clearly in the following.
• Eco-Metropolis‘OurVisionforCopenhagen2015’–astatementofintentandphysical planning objectives that aim by 2015 to make Copenhagen the world’s best city for bicycles; a climate capital; a green and blue capital city; and a clean and healthy big city (City of Copenhagen 2007).
• TheMunicipalMasterPlan2011’GreenGrowthandQualityofLife’–asocial,economic,and physical strategic framework document for planning Copenhagen as a green growth metropolis over the next decade, with strong emphasis on Øresund regional integration(City of Copenhagen 2011d).
• CityofCopenhagenResourcesandWastePlan–astatutorymanagementdocumentwhichis produced every four years for initiatives covering households, businesses and public institutions. Its main objectives are to reduce waste arisings, increase recycling rates, and remove plastic waste from the City of Copenhagen’s incineration stream (City of Copenhagen 2012o).
• LocalAgenda21planforCopenhagen2012-2015‘AGreenerandBetterEverydayLife’–a mandatory action plan for sustainable development that all Danish municipalities must make. The Copenhagen plan contains 17 specific city-wide initiatives and citizen actions to embed sustainability in the lives of Copenhageners. These actions are grouped thematically into: At Home; Resources; Urban Spaces; Transport; and Interdisciplinary (City of Copenhagen 2012l).
• TheCityofCopenhagen’sBicycleStrategy2011-2025‘Good,Better,Best’–aplanningand investment strategy to improve cycling travel time, access, convenience, and safety, with the aim that 50% of trips to work and educational institutions in the City of Copenhagen are made by bicycle in 2015 (City of Copenhagen 2011c).
• TheActionPlanforGreenMobility-25selectedinitiativestosupportthegoalsforefficient and green mobility in Copenhagen in line with the city’s ongoing growth and development. The initiatives are grouped into different categories: Urban development (land and development planning that enables green transport choices); Green means of transport (extending cycling and mass transit networks); Transport system (optimising traffic flow); Incentives (providing better information and resources to support decision-making for green modes); and Innovation (developing new technology and green mobility concepts)(City of Copenhagen 2012a).

89Lowcarbon,energyandresources88
Box 4.1 Eco-Metropolis 2015: targets
World’s best city for bicycles• Atleast50%ofpeoplewillgototheirworkplaceoreducationalinstitutionin Copenhagenbybike.
• ThenumberofseriouslyinjuredcyclistsinCopenhagentobehalvedcomparedto today.
• Atleast80%ofcyclistsinCopenhagentofeelsafeandsecureintraffic.
Climate Capital• AreductionofCopenhagen’sCO2emissionsofatleast20%comparedtotoday.
A green and blue capital city• 90%ofCopenhagenersshouldbeabletowalktoapark,abeach,anaturalarea,or seaswimmingpoolinlessthan15minutes.
• About60%ofCopenhagenerswillbevisitingthecity’sparks,naturalareas,sea swimmingpools,andbeachestwiceasoftenastoday.
A clean and healthy big city• Copenhagenersshouldbeabletosleeppeacefully,freefromnoiseharmfultohealth fromstreettraffic.Allschoolsandinstitutionsshouldbesubjecttoonlylowlevelsof traffic-noise.
• TheairshouldbesocleanthatCopenhageners’healthwillnotbedamaged.
• Organicfoodshouldcomprise20%ofthecity’sfoodconsumption.
• CopenhagenshouldbeEurope’scleanestcapitalandoneofthecleanestcapitalsin theworld.Rubbishshouldbeclearedfrompublicstreetswithineighthours.
Source:CityofCopenhagen2007
4.2 Energy
4.2.1 Key challenges
Stationary energy production is tasked with delivering approximately three-quarters of the emissions reductions required towards Copenhagen’s goal of carbon neutrality by 2025, and is thus critical to its success. Maintaining supply security and system performance while reducing the currently high levels of fossil fuel dependence will need to rely on a mixture of intermittent energy sources (solar and wind); waste incineration (with a simultaneous and somewhat conflicting goal to increase recycling rates); and biomass (balancing concerns on supply distances and sustainable forestry practices) . Energy efficiency of the building stock must play a role as well. Improving building energy performance is generally easier in new builds than retrofitting the existing stock, yet the slow turnover of the building stock means that most gains must come from retrofits and behavioural changes.
4.2.2 Strategy and goals
Overall, 75% of carbon emissions in Copenhagen are attributable to the building stock, and thermal demand for heating exceeds electrical demand by a factor of 2 to 1 (City of Copenhagen 2012h). Seeing the necessity for new and existing buildings to become more efficient, the 2025 Climate Plan has set targets for:
• 20%reductioninbuildingheatconsumptioncomparedto2010;
• 20%reductionofelectricityconsumptionincommercialandservicecompaniescompared to 2010;
• 10%reductionofelectricityconsumptioninhouseholdscomparedto2010;and
• theinstallationofsolarcellscorrespondingto1%ofelectricityconsumption.
To meet these targets, a mix of programmes structured around incentives for energy efficiency products and renovations, information services, and energy performance contracting will be subject to further consideration and development. These programmes will need to deliver an increase in the rate of building retrofits. The City of Copenhagen calculates that a 0.5 percentage point per annum improvement in the pace of retrofits will result in 33% of the existing housing stock and 46% of commercial properties retrofitted in the period up to 2025 (City of Copenhagen 2012h). A Greener and Better Everyday Life, Local Agenda 21 plan for Copenhagen 2012-2015 additionally includes a number of energy-saving initiatives for the residential building stock, particularly focused on efficient use of heating energy in homes and quick payback retrofit actions.
In order for Copenhagen to meet its carbon-neutral goal, significant focus is being applied to the energy generation / supply and distribution network. Present connection rates to the extensive combined heat and power (CHP) district heating networks exceed 95% in Copenhagen, and almost all local heat demand is met in this way (City of Copenhagen 2009). While these networks deliver carbon efficiencies when compared to centralised grid energy from thermal power plants, the CHP generators still rely significantly on fossil fuels. In addition waste incineration, which also contributes to energy production for the district heating networks, has an associated carbon footprint due to the methane produced during incineration and the presence of plastics in the waste stream, which are fossil fuel derived. Thus fuel switching (substituting bio-based fuels for carbon-based ones), and improved waste management practices (removing compostable and plastics from the waste stream, discussed further in Section 4.6.3) are priorities.

91Lowcarbon,energyandresources90
Figure 4.2 Allocation of reductions from energy production initiatives
Source:CityofCopenhagen2012h
New biomass-fired combined heat and
power plant43%
Wind turbines42%
855,000Tons CO2
Separation of plastic from
incinerable waste12%
Conversion to biomass-fired
peak production3%
The Eco Metropolis 2015 document delivered a shorter term target of 20% carbon reductions by 2015 (City of Copenhagen 2007). This target remains, and has been subsumed by the more prominent CPH 2025 Carbon Neutral Plan. This is the key policy document and it outlines a clear roadmap in energy generation and distribution toward carbon neutrality, with mitigation potential in excess of 850,000 tons of CO2 (Figure 4.2).
Wind energy production and biomass-fired CHP are the main contributors to this initiative, the use of which will lead to emission reduction shares of 42% and 43%, respectively. Defined initiatives through 2025 include:
• deploymentof100land-andsea-basedwindturbines(360MWcapacityintotal)insideand outside municipal borders; and
• conversiontobiomassatthecombinedheatandpowerplantsatAmagerandAvedøre(Cityof Copenhagen 2012h)
To meet the 2025 target, more cost and technical feasibility planning and delivery frameworks are needed for additional base- and reserve-load fuel switching from fossil fuel to biofuels; use of bio-gasification of organic waste; local energy storage; and use of large-scale geothermal and electric heat pump systems for base-load demand. An increase in energy production from wind will add to the number of large turbines that presently dot the city’s watersides and landscapes. Deployment of additional wind energy will partly rely upon community ownership schemes which have a proven track-record in Copenhagen, allowing citizens to invest in shares of locally-owned wind generating assets.
Copenhagen seeks to create a surplus of low-carbon electricity that can be exported to the grid and thus create an offset to other carbon emissions in other sectors, namely transport, where zero emissions are not possible within the timeframe. This will be through electricity production from its biomass CHP network, and wind turbines outside Copenhagen which will be brought into production via municipality financing and production agreements. Both will be subject to competitive energy market conditions and thus cannot be ensured through policy prescriptions alone.
District cooling may also become a more prominent solution in the local low-carbon energy mix, substituting energy for space cooling currently delivered via less efficient chillers in individual buildings. Copenhagen’s first district cooling network became operational in 2010, and a second network in 2013 (Figure 4.3). These connect to a number of large properties in central Copenhagen, with the capacity to serve 1.9 million square metres of floor area (Danish Board of District Heating 2013). The networks take advantage of seawater as well as excess heat for absorption chillers from the combined heat and power network. Additional sites in the City of Copenhagen have been assessed and are currently considered feasible for future cooling networks. High-density commercial areas with a concentration of large load buildings will be needed to make the system economic, so uptake will be more limited than district heating as a matter of course.
Figure 4.3 District cooling in central Copenhagen around Kongens Nytorv
Source:CopenhagenEnergy2009
Through its district heating networks, Copenhagen is largely self-reliant in meeting its thermal energy demand. Note that CHP operations are heat-led, which means generation systems are scaled to meet the thermal demand rather than electric demand. In other words, the electricity produced is a useful by-product rather than the plant’s primary operating objective. The electricity it generates is delivered to the national grid, but only meets a portion of the local demand. Meeting local electrical needs will continue to rely on the rest of the national network. This makes Denmark’s long-term strategic goal of carbon-free electricity by 2035 material to Copenhagen’s aspirations. For the period 2010-20, the key targets for Denmark are:
• morethan35%renewableenergyinfinalenergyconsumption,and
• approximately50%ofelectricityconsumptiontobesuppliedbywindpower(DanishMinistry of Climate Energy and Building 2012).

93Lowcarbon,energyandresources92
Box 4.2 Heat Plan Greater Copenhagen
HeatPlanGreaterCopenhagen(Varmeplan Hovedstaden)wasinitiatedbythemajordistrictheatingcompaniesinGreaterCopenhagen-CTR,HOFORandVEKS–andcarriedoutinthreestagesfrom2008to2012.Itanalysedarangeoftechnical,financial,andinstitutionalissuesfordeliveringa70%renewableand100%carbon-neutraldistrictheatingsupplytoCopenhagenby2015and2025respectively.Italsofocusedonwaystobettermanageincreasingsharesofwindgenerationintheenergynetwork.
Theanalysisnotedthatcarbonneutralitywillrelyheavilyontheuseofbiomassintheneartomiddleterm,thesourceofwhichispredominatelywoodpelletsimportedfromoutsideDenmark.Inthemiddletolongerterm,geothermal,heatpump,andenergystoragesystems,currentlyuneconomiconadistrictscale,willbecomefarmoreprominent.Aspartoftheanalysis,scenariosweredevelopedtodemonstratetherangeofactionspossibleandtheircarbonimpact.Thesescenarioswere:• Referencescenario:thestatusquo
• Distributedandsavingsscenario:ambitiousheatsavingsinbuildings(25%by 2025),useofheatpumpsandsolarheatfordistrictheating,anddistrictcooling
• Increasedheatmarketscenario:conversionfromindividualnaturalgas-based heatingtodistrictheating,geothermalenergy,surplusindustrialheat,and additionaldistrictcooling
• Renewableenergysavingsandconversion:heatsavings(25%by2025),conversion fromindividualnaturalgastodistrictheating,geothermalenergy(3largeplants), andadditionaldistrictcooling
• Perspectivescenario–2050:increasedheatsavings,and100percentrenewable energyby2050fromgeothermalenergyandheatpumpsandnewhighefficient CHPplantswithpre-treatmentofbiomassandwaste
Thegraphicshowsthataggressivecarbonreductionscanbedeliveredby2025,butthatarangeofreductionswillresultdependingontheoptionschosen.
District heating network in Greater Copenhagen
Thenetwork,oneofthelargestintheworld,stretchesacross18municipalitiesandreaches50,000end-users.Itaccommodatesapproximately20%ofthetotalheatdemandinDenmark.
CO2 emissions in 2025 compared with the 2010 reference
Fullcarbonneutralityforthedistrictenergynetworkwasprojectedby2050.
Source:CTRHOFORandVEKS2009
4.2.3 Policy instruments
There is strong local control over the district energy system. This includes statutory powers over district network planning and siting of generation facilities, and connection obligations on building owners. Land use regulatory planning further extends to the placement of wind turbines in certain locations. At the national level, taxation of fossil fuels, and subsidies and tax exemptions for biomass fuels are deployed to propel the energy system towards a lower carbon footprint.
Objectives for the overall levels of carbon emissions reductions, percentage of renewable energy supply, and the performance of new and substantially renovated buildings are formulated at the European level and then transcribed nationally (Denmark’s targets for renewable energy supply exceed EU requirements). The nature of the Danish energy system is such that most heat energy is generated locally and municipal control over district heating networks is substantial. For building performance matters, most standards and subsidies are driven by national rather than local action, although the City of Copenhagen does exert control over the building stock it owns and occupies through its procurement rules. It is also active in putting together information campaigns to make citizens more aware of their energy consumption and thus spur behavioural changes to reduce demand.
The appendix provides additional detail on policy levers for low-carbon energy and energy demand reductions.

95Lowcarbon,energyandresources94
4.2.4 Governance and policy coordination
Figure 4.4 Levels of government responsibility for energy policies
ResultsfromtheLSECitiesGoingGreenglobalsurvey
0%
10%
20%
30%
40%
50%
60%
70%
80%
90%
100%
Surve
y av
erag
e
Copenha
gen
Regional
National
Supra-national
Supra-national
Pro
po
rtio
n o
f p
olic
y in
stru
men
ts
The Danish government sets the enabling regulatory and strategy frameworks for energy in Denmark, although the widespread adoption of district heating across Denmark means the execution of the frameworks is supported by local-level action (Figure 4.4). District supply networks in Copenhagen (and throughout Denmark) are controlled by public or corporatised utilities which are wholly or substantially owned by the City of Copenhagen. This clearly helps align government policy objectives with the operations of the energy system. For example, demand reduction does not conflict with the profit and operational mandate to sell more energy which countless utilities globally are subject to. In fact, Danish framework agreements for energy put an obligation on energy utilities to achieve yearly reductions
in energy consumption in households and businesses. This has a net societal value in the form of reduced fossil fuel expenditure, which is far in excess of the costs needed to achieve the reductions (Danish Ministry of Climate Energy and Building 2012).
The regional nature of the district energy network compels cooperation between municipalities in order to optimise the efficiency of the network. Most of the generation assets are privately held as a result of EU policy decisions to liberalise energy markets, and future investment in lower carbon and renewable energy generating assets will be driven by private capital.
4.3 Transport
4.3.1 Key challenges
By 2025, Copenhagen is expected to add another 100,000 people to its population as well as 20,000 new jobs (City of Copenhagen 2011d). Accommodating these new people and jobs, and enhancing mobility and mode choice in an already built-up region, needs to be done without exacerbating congestion and negative air quality impacts from current traffic and vehicles.
The transport sector accounts for 22% of CO2 emissions in Copenhagen, 70% of which are attributed to road traffic alone (City of Copenhagen 2012h). Vehicles are overwhelmingly powered by fossil fuels at present. Even though shares of electric, hydrogen and biofuel will rise by 2025, they will still represent only a small minority of vehicles. The past decade has also seen an increase in the number of cars owned by Copenhageners (Statistics Denmark 2012), though the fact many are small and fuel efficient has muted the impact on transport CO2 emissions. Trends across Europe suggest that many urban areas have reached ‘peak’ car ownership and usage as a result of growing reliance on mass transit, car clubs / car sharing, walking and cycling. This encouraging trend will assist in Copenhagen meeting its carbon-neutral goals, although it is already starting from a lower car ownership and higher bike share base than many European cities.
4.3.2 Strategy and goals
Figure 4.5 Allocation of reductions from mobility initiatives
Source:CityofCopenhagen2012h
135,000Tons CO2
City of cyclists30%
New fuels18%
Public transport22%
Intelligent tra�c systems and
mobility planning30%
Copenhagen’s Climate Plan 2025 estimates that, based on initiatives already underway, transport emissions are trending downwards, falling from 544,000 to 503,000 tons of CO2 between 2010 and 2025. Obviously, greater reductions are needed to support the carbon-neutral goal and the plan identifies reductions of 135,000 tons per annum (Figure 4.5). It is not possible to reduce transport emissions to zero, so excess emissions reductions will need to be found in other sectors (namely energy production) to balance the impact of transport emissions.
Figure 4.5 illustrates that the largest emissions reduction shares (30% each) are expected to come from cycling and intelligent mobility planning. New fuels will make the smallest contribution to the carbon reduction goal.
Transport mode share targets in the Climate Plan 2025 are that 50% of work and school journeys will be made by bicycle or walking, and 25% each by public transit and private vehicles (City of Copenhagen 2012h). Some system expansion investments are currently planned for the primary public transit networks that operate in the region: area buses, the S-Train, and Copenhagen Metro. For example, the Metro ‘Cityringen’ will comprise 15.5 kilometres of underground metro tracks serving 17 stations when completed in 2018 (Copenhagen Metro No date). Investment will also take place in Bus Rapid Transit (BRT). Additional operational efficiencies to increase capacity, e.g. traffic and signalling coordination, will also be in place to meet the goals. For cycling, investments in the bicycle network, particularly adding higher capacity bike lanes in inner urban areas and long-distance network lanes to connect the centre to adjoining suburbs and allow for higher speeds (e.g. with uptake of electric bicycles), are planned. Fuel switching and emerging vehicle technologies will also be relied upon to deliver further emissions reductions. This will require a commensurate investment in the infrastructure to support these vehicles, such as electric car charging and hydrogen fuelling points.

97Lowcarbon,energyandresources96
These interrelated mobility network and vehicle goals are summarised in the Copenhagen Action Plan for Green Mobility and include the following:
• TheshareofthePLUSnetwork(cycling),whichhasthreelanes,willbe40%by2015and60% by 2020.
• Thetraveltimeofbuseswillbereducedby10%between2011and2025.
• Theregularityofbuseswillbeimprovedby20%between2011and2025.
• In2025publictransportwillbecarbonneutral(throughelectrificationorbiofuels).
• Therewillbe5,000electricchargingpointsandfourhydrogenfillingstationsby2020.
• Therewillbedoublethenumberofsharedcarsin2020comparedto2012.Electriccarswill make up at least 10% of these.
• Citybikeswillbepartofthepublictransportsystem.
• ITsolutionswillimprovetrafficmanagementbyfavouringgreenmobilityandprovidinga smooth traffic flow.
• 5%ofcarcommuterswillusecar-poolingtotraveltoworkby2020(CityofCopenhagen 2012a).
Other plans to meet the transport target include increasing the regional cycling network by constructing 26 cycle superhighways totalling 300km (Supercykelstier No date). Businesses and schools will also be asked to collaborate with municipal authorities in drafting mode share plans; in providing bicycle parking, shared bicycles, and electric bicycle facilities; and in providing information resources to spur behavioural changes.
4.3.3 Policy instruments
Authority for land-use planning in Copenhagen extends from the provision of local municipal plans (of which there are more than 30 in the Copenhagen region, including the City of Copenhagen) to a regional plan for Hovedstaden. Planning in the Copenhagen Capital Region has remained sympathetic to the ‘Finger Plan,’ first introduced in 1947 and still a defining framework for city and regional growth. While not a high-density city by European or Asian standards, the Finger Plan has produced a built form in Copenhagen that encourages high levels of mobility and access by foot, bicycle, and mass transit.
The City of Copenhagen is able to influence mode share and has significant leverage through the provision of cycling infrastructure, in which it has invested heavily over the past decades. Municipal planning functions can also exert statutory influence to affect the number of bicycle and car-parking spaces in new developments, and in parking provision and regulations generally. The City of Copenhagen has other statutory powers in development planning that influence density, land-use mix, and provision of pedestrian zones. These, combined with the powers over parking provision, exert a noticeable influence on transport emissions. Municipal powers further extend to the siting of electrical vehicle charging and alternative fuel points, as well as procurement of the municipal vehicle fleet.
The appendix provides a summary of policy instruments related to transport as deployed by city, regional and national actors.
4.3.4 Governance and policy coordination
Regional coordination on strategic land-use planning has historically been effective in Copenhagen, and in fact has been strengthened by revisions to the Danish Planning Act in 2007. This has resulted in land-use practices that are broadly consistent in the region and sympathetic to low-carbon mobility. National-level taxation of petrol and vehicles has also influenced the modest growth in vehicle miles travelled.
Cycling is an area where local statutory and programmatic control will continue to directly influence mode share. The electrification and / or use of low-carbon alternative fuels for the vehicle fleet, particularly private vehicles, will involve a mix of actors from the local to the supra-national for standards-setting and emissions regulations. Private partners will be relevant collaborators on alternative fuel and charging networks.
Figure 4.6 Levels of government responsibility for transport policies
ResultsfromtheLSECitiesGoingGreenglobalsurvey
National
Regional
City
Supra-national
Pro
po
rtio
n o
f p
olic
y in
stru
men
ts
0%
10%
20%
30%
40%
50%
60%
70%
80%
90%
100%
Surve
y av
erag
e
Copenha
gen
In the planning and provisioning of mass transit networks, the level of city control is more mixed. The regional S-train and the national rail systems, which serve Copenhagen and its surrounding communities, are a national level concern. The costs of investing in local light rail are split between the municipalities (typically Copenhagen and Frederiksberg) and the national government. In growth areas of Copenhagen, such as Nordøstamager,ØrestadandNordhavnen,these costs can be financed through the increase in land values from new development (European Commission 2009). Bus services are controlled more locally at the level of individual municipalities, and lack the same level of regional coordination and coherence as the light and regional rail system (Figure 4.6).

99Lowcarbon,energyandresources98
4.4 Water
4.4.1 Key challenges
Environmental quality in the water bodies surrounding Copenhagen has improved dramatically over the past decades (Section 3.9.1), and per capita water consumption in Copenhagen is already low by OECD standards (Section 3.7.1). Challenges for Copenhagen include maintaining and improving on the successes already achieved in pollution management and water efficiency. In the case of pollution management, additional investment in infrastructure to manage flows from combined wastewater and stormwater conveyance networks, particularly during peak flow events related to heavy rainfall, is needed to prevent sewage overflow into Copenhagen’s receiving waters. However, infrastructural changes to existing systems, or installing new networks and retention and treatment facilities, can be complex and costly in dense urban environments. As regards water efficiency, emphasis will remain on reducing system leakage and compelling additional user behavioural changes to further reduce losses and consumption rates.
In support of its carbon goals, Copenhagen will need to address energy consumption in the water extraction and wastewater treatment sectors. According to DANVA (Danish Water and Waste Water Association), Denmark’s water supply and sewage services have an annual power consumption of approximately 800 GWh. Studies show that there is potential to make significant savings of approximately 200 GWh (PSO 2006).
The projected impacts of climate change will create additional challenges for the sector. Groundwater extraction rates currently exceed recharge rates in regional areas that supply Copenhagen (Figure 4.7). Greater rainfall variability could negatively impact these recharge rates and add to this system stress, particularly when coupled with the growing population projected for the region. This rainfall variability – particularly peak rain events - is also expected to make the stormwater system more susceptible to flooding and sewage overflows.
Figure 4.7 Resource and extraction levels in Denmark by region
Source:J.StockmarrandR.Thomsen2008
Some groundwater extraction zones struggle to maintain quality standards due to higher pollutant loads from rainwater run-off e.g. agricultural sector pesticides and fertilizer nitrates, and industrial chemicals. There has also been concern about saltwater intrusion in some groundwater sources. The result has been abandonment of some groundwater fields and a need to replace these with new extraction zones (J. Stockmarr and R.Thomsen 2008).
4.4.2 Strategy and goals
Across Denmark, groundwater extraction is the sole or nearly exclusive source of potable water supplies. Providing it requires considerable energy for pumping (though commensurately little energy for treatment before consumption). In Copenhagen’s case, extraction fields are located at distances of up to 55 km from the city, which adds to the energy balance for conveyance (Copenhagen Cleantech Cluster 2012b). Energy for pumping can be made more carbon-efficient through equipment optimisation and by shifting operations to off-peak times. To address energy needed for wastewater treatment, efficiencies can be realised through process improvements and recovery of bioenergy and waste heat from the treatment system. As a first principle, reducing water demand and thus treatment volumes lessen energy requirements for both extraction and management.
The primary policy document relating to water consumption is the Copenhagen Water Supply Plan. Most recently issued in 2012 and covering the period up to 2017, it lays out the following goals:
• ThepercentageofwateranalysesthatexceedanyoftheDanishwaterqualityguideline values cannot rise above a 2% maximum.
• By2017,householdconsumptionshallbereducedto100l/p/d.Thisistobeachievedthrough further development of water saving technologies and water conservation campaigns (projected future targets are 90 l/p/d by 2025).
• Inordertosecuresupply,HOFOR(theCopenhagenenergyandwaterutility)shallcontinue to have abstraction permits and production facilities that allow supply of at least 25 % more than is consumed annually.
• HOFORwillretainresponsibilityforthedistributionnetwork,andtheunaccounted consumption (i.e. leakages) shall not exceed 10 %.
• Reuseofwateranduseoflowqualitygroundwatershallconstitute4%ofwaterconsumption. This will be used for secondary purposes that do not require potable quality (Copenhagen Cleantech Cluster 2012b).
The City of Copenhagen has two principal strategy documents relating to future stormwater management: the 2011 Climate Adaptation Plan and the 2012 Cloudburst Management Plan. The Climate Adaptation Plan is the broader of the two, including sections on sea level rise and urban heat islands. Both, however, largely focus on the risks from increased volume and intensity of rainfall in Copenhagen based on accepted climate change projections. These are high-level strategic documents rather than detailed action plans. Progress in this area will be dependent on future actions delivered through existing municipal planning and management functions (Figure 4.8).
Figure 4.8 The process of climate adaptation in the City of Copenhagen
Source:CityofCopenhagen2011a

101Lowcarbon,energyandresources100
The Climate Adaptation Plan sets the objective that rainwater should be managed locally throughout the whole municipality. This can be accomplished, for example, through use of green roofs and other green infrastructure to slow stormwater flows, and by identifying local areas where excessive water can be channelled so that it causes no damage. In the Cloudburst Management Plan, a revised standard was issued to apply to all future sewage works investments: sewer discharges will be allowed to reach ground level once every 10 years, and average water levels will be allowed to exceed ground level by 10 cm once every 100 years, excepting areas specifically designated for flood control storage (City of Copenhagen 2012d). Both plans anticipate continued upgrades to Copenhagen’s combined stormwater and sewage network to improve diversion and retention capacity.
Box 4.3 Embedding Intelligence in Copenhagen’s Wastewater Network
Combinedsewersystemsrequirespecialoperationalrulesduringheavyrainfall.Intelligentwastewatermanagementiscontributingtopracticesthatavoidoverloadsandtheresultingdischargeofuntreatedwastewater.Deployingtechnologiessuchassensors,flowmetersandintelligentsoftwareensurethatthecapacitiesofsewerpipesaremaximised,andthatcontrolmechanismsarebetterlinkedwithadvanceddrainagemodels.ThishasbeenputinplaceatLynetten,alargeCopenhagentreatmentfacilitythatannuallyprocesses80to110billioncubicmetresofwastewater.Itwasoneofthefirstapplicationsgloballytolinktechnologieswithimprovedmanagementpractices.
AtLynetten,theintelligentmanagementframeworkiscombinedwithweatherradarwhichsuppliesthesystemwiththelatestmeteorologicalforecastdata.WhenheavyrainfallisonitswaytoonepartofCopenhagen,themanagercandirecttheeffluentintheoppositedirectiontomakeroominthedrainagesystemfortheincreasedrunoff.Thebenefitofthisisareducedriskoffloodingandbetterwaterqualityintheharbourandalongthebeaches.
Source:RethinkWaterNetwork2013
4.4.3 Policy instruments
The City of Copenhagen has been very active for many years, directly or through the utility HOFOR, in leading educational campaigns for water efficiency; in mandatory metering; and in providing subsidies for water efficient appliances and fixtures. The City of Copenhagen also has areas of control in wastewater management and improvement of water quality. Included in this are regulatory powers over siting and operation of wastewater treatment facilities; and strategic planning and regulatory land-use powers for various ‘green and blue’ infrastructure solutions designed to address stormwater flows and quality (e.g. green roofs, natural buffers along watercourses, retention zones, etc). Additionally, there are local powers over water pricing relating to both supply and wastewater rates, although set within a national government framework.
Permitting for groundwater extraction is a local power in Denmark. For Copenhagen supplies, groundwater extraction occurs outside the city boundaries. This necessitates collaboration between Copenhagen and the surrounding municipalities to secure sufficient resources for their needs, particularly as groundwater extraction areas require significant local area management (afforestation, buffering for pollution prevention, coordination with agricultural users) to maintain water quality. The water quality frameworks that govern supply in Denmark have resulted in groundwater extraction sites being shut down and new sources secured, rather than implementing treatment of extracted water from wells that have been subject to unacceptable pollution levels.
More information on policy instruments relating to water can be found in the appendix.
Box 4.4 Demand management policies in Singapore and Copenhagen
SingaporeandCopenhagenaretwoexamplesofcitiesthathavesuccessfullyinvestedineducationcampaignstoencourageresidentstoreducetheirwaterconsumptionbyinstallingmorewaterefficientappliancesandchangingtheirwaterusehabits.Additionally,bothcitieshavesuccessfullyintroducedindividualwatermetersandconsumption-basedwatertariffs,whichprovideafinancialincentivetofurtherreducewateruse.Asaresult,Singaporehasmanagedtoreduceitsconsumptionfrom165litresperpersonperday(lpd)in2003to150lpdin2012.
Afterintroducingindividualmetering,Copenhagenexperiencedareductioninwaterconsumptionofupto40%overasixyearperiodforthosehomesthathadpreviouslyhadthehighestusage.ForCopenhagenasawhole,percapitaconsumptionhasdroppedfrom171lpdin1987to108lpdin2010,oneofthelowestratesinthedevelopedworld.
Sources:GreenGrowthLeaders2011;SingaporeMinistryoftheEnvironmentandWaterResources2012
4.4.4 Governance and policy coordination
Municipal utilities, most of which have been corporatised in line with EU trends for the liberalisation of energy and water services, are regulated as non-profit businesses. In 2012 the City of Copenhagen and 7 other municipalities merged their water and sewage companies into HOFOR, creating joint ownership between 8 municipalities now covering around one fifth of the population in Denmark.
Strategic planning for water supply and quality control in Copenhagen is the responsibility of the City of Copenhagen, with planning documents approved by the City Council (Figure 4.9). The City Council approves the water fees on an annual basis and approves the delivery terms. HOFOR is responsible for providing the water under the conditions given by the City Council. However, as HOFOR is abstracting water far outside Copenhagen’s boundaries, the abstraction permits for well fields are granted from a number of area municipalities. HOFOR is further obliged by law to conduct an intensive surveillance of water quality throughout the supply chain, from the well fields through to the waterworks and distribution networks.
EU directives relating to water quality and water supply have been transposed nationally through various legislative instruments. At the national level, the Danish Ministry of the
Figure 4.9 Levels of government responsibility for water policies
ResultsfromtheLSECitiesGoingGreenglobalsurvey
National
State
City
Supra-national
Pro
po
rtio
n o
f p
olic
y in
stru
men
ts
0%
10%
20%
30%
40%
50%
60%
70%
80%
90%
100%
Surve
y av
erag
e
Copenha
gen
Environment, operating through regional environmental administrative centres, governs the details of the directives. Local plans for water use and wastewater management are drafted every five to ten years, and it is municipal governments that are responsible for the administration of water abstraction permits and protection of water resources against pollution.
Groundwater modelling is an important tool used to estimate resource levels and the health of catchment areas. The Geological Survey of Denmark has established a national model covering all of Denmark, with refined ‘sub models’ for the catchment areas. Besides providing information for optimising groundwater protection, the models can be used in the planning of groundwater abstraction. The ‘sub models’ are typically built by Danish consulting engineering companies, who operate them for the municipalities and water utilities.

103Lowcarbon,energyandresources102
4.5 Waste
4.4.1 Key challenges
Copenhageners generate considerably less waste than the average Dane, and significant volumes of the waste that is generated is incinerated to feed the city’s district energy networks. Challenges for Copenhagen will include reducing waste volumes from a populace that, whilst generally resource-conscious, is unaccustomed to waste diversion mandates; and balancing goals for recycling and composting with the prevailing waste-as-fuel ethos. There are additional challenges in reducing the carbon content of the incinerated waste, mainly related to the removal of oil-derived plastics from the waste stream. This will need to be accomplished within a waste collection system that has recently been contracted out to private providers and that is no longer directly part of municipal operations.
4.5.2 Strategy and goals
Under Danish law, municipalities create waste management plans every four to six years. Copenhagen’s current plan took effect in early 2013 and applies to the period through to 2018. This is the principal policy document governing the sector. Goals contained within it include:
• A20%reductioninhouseholdwastesenttoincineration.
• 45%ofhouseholdwastesenttorecycling.
• 25,000tonnesoffoodwasteusedforbiogasproduction.
• 15.000tonnesofplasticdivertedfromincineration(withalongertermtargetofzeroplastic waste incinerated by 2025) (City of Copenhagen 2012o; City of Copenhagen 2014).
Copenhagen’s Agenda 21 plan for sustainability, ‘A Greener and Better Everyday Life’ also emphasises waste reduction in the home. The City of Copenhagen further targets waste reduction programmes at individual commercial sectors, for example in building demolition and construction, where strategies to remove hazardous substances and thus increase the volume of waste suitable for recycling have been implemented.
4.5.3 Policy instruments
The Danish government has banned waste going to landfill that could otherwise be incinerated. It has also instituted a high tax on waste to landfill, a low tax for waste to incineration, and exempts waste going for recycling.
At the local level, in addition to the municipal waste management plan set by a national waste framework, there is considerable control over waste collection, waste to energy infrastructure (in Copenhagen, incineration plants are owned by the city), educational and behavioural change programmes to influence recycling rates, and provision and siting of recycling centres. The appendix contains additional detail on policy instruments used in the waste sector.
Figure 4.10 Levels of government responsibility for waste policies
ResultsfromtheLSECitiesGoingGreenglobalsurvey
National
Regional
City
Supra-national
Pro
po
rtio
n o
f p
olic
y in
stru
men
ts
0%
10%
20%
30%
40%
50%
60%
70%
80%
90%
100%
Surve
y av
erag
e
Copenha
gen
4.5.4 Governance and policy coordination
As is typical in many OECD cities, commercial waste collection is organised by the waste producer and there are many private companies that offer waste management services to businesses (all of whom are governed by local and national regulatory and taxation regimes). The City of Copenhagen has recently tendered for the collection of household waste, which in principal will drive more recycling due to the tax exemption for this waste stream and the market value for recyclable materials.
Copenhagen has also piloted new technologies with private partners that contribute to both its waste and energy objectives. REnescience, an advanced technology subsidiary of DONG Energy, has been producing biogas at one
Copenhagen waste incineration facility. The gas can either be incinerated at the facility or further processed to natural gas which is then fed into the grid (see Section 4.6.3 for more detail).
Regulations and standards on hazardous waste collection, transport and disposal remain the remit of the national government. Levies (fees) for waste collection and treatment placed on householders and businesses are set locally (Figure 4.10).
4.6 Future challenges and opportunities
As the preceding sections make clear, Copenhagen has set ambitious targets in carbon, energy, and resource efficiency, most notably its aspiration to be carbon neutral by 2025. This target setting, if underpinned by consistent policy formation and application, has the potential to be a major economic driver for Copenhagen and a growth opportunity for its cleantech businesses. It will also create momentum (and exert positive pressure) within the Danish energy supply sector towards meeting, or perhaps accelerating, the national target for a carbon-free heat and electricity supply by 2035.
Meeting the Copenhagen targets will require a number of major strategic policy and infrastructure investment decisions over the coming years. Many decisions made in the near term will have consequences far beyond the 2025 deadline and could contribute to technology ‘lock-in’ – both positive and negative – that should be considered when meeting and maintaining carbon neutrality post 2025.
The following sections outline possible strategic pathways for Copenhagen, in order to inform debate and decision-making in carbon, energy, and resource reductions. Further research can indicate which options offer the most promise for Copenhagen in the areas of energy supply and demand, transport and mobility, and waste management and water efficiency. In many cases, the solutions are cross-cutting and / or create interdependencies which need to be acknowledged. There will be areas where the City of Copenhagen has:
• directcontrolthroughitsoperationsorthatofutilitieswhereitisamajorityshareholder;
• influenceoverbusinessandcitizenpracticesandbehaviours;
• collaborativeagencywiththeprivatesector;and
• channelsfordialoguewithnationalandinternationalinstitutionsforpolicy-setting.

105Lowcarbon,energyandresources104
4.6.1 Energy supply and demand
To meet the carbon reduction targets, Copenhagen needs to consider both supply and demand. The current energy supply system can be improved through fuel supply and technology diversity to drive down emissions. Or alternatively, the use of very local generation coupled with significant reductions in energy demand could potentially disrupt the primacy of the district system. For energy demand, a significant scale-up of efficiency retrofits will be needed.
Various pathways to address supply and demand are examined in the following paragraphs and summarised in Table 4.1. As many of these points relate to initiatives already underway in Copenhagen, the challenges in executing them will be noted. Others offer a point of departure from current policy measures and thus could be areas for further research and consideration. As will be the case with most policy decisions related to green growth, there will be interrelationships and dependencies between policy areas that require balancing.
Pathway 1 is a district system with greater use of biogas generation and integrated grid energy storage. This would increase the system flexibility and allow for a more seamless integration of intermittent renewable energy such as wind and solar. This pathway may be in conflict with investments being made now in solid biomass in order to meet the 2025 carbon goal, but that may work against near-term adoption of a broader range of generation technologies.
At present, a substitution is underway whereby coal is being replaced with solid biomass (straw and wood pellets) to reduce the district CHP carbon footprint. The fact that this shift can be made using the existing generating fleet and does not require substantial technology changeover or plant retrofits is advantageous. However, these generators are best suited to delivering baseload power and are unable to ramp output up or down rapidly outside narrow operational bands, as would be demanded when solar or wind energy is fed into the grid at significant volumes. This steady baseload operation could also act as a disincentive to demand reduction, as plant efficiency is optimised at full loads.
Alternatively, gas turbines modulate more quickly and over a greater range. This generation technology, coupled with grid energy storage, is better suited to integrating intermittent supply sources into the network and can shift system operations to prioritise demand reduction. In order for this to become viable, challenges such as higher cost and sustainable supply need to be overcome, as well as carbon balance challenges with liquid biofuels and cost and integration challenges with energy storage.
Table 4.1 Energy supply and demand: strategic policy pathways
Green challengesStrategic policy area
Thermal and electric power generation
Energy for transport
Long-term pathways Interdependencies
Low-carbonfuelandtechnologysubstitution
Resourceeffectiveness:maximisingresourceopportunitiesofwastemanagement
Improvingbuildingenergyperformance
Increasingvolumeofbuildingretrofits
Bioenergysupplychain/sustainablebioenergypractices
Wastemanagementpractices
Building-levelenergygenerationandmanagement
Vehicleelectrification
Intelligentenergygrids
Buildingdesignandproductstandards
1.Increaseuseofbiogas, thermalenergystorage
2.Reduceshareofenergy fromwaste
3.Reduceuseofdistrict heatingandcooling,and increaseuseofdistributed micro-generationand mini-grids
4.Substantialbuildingenergy demandreduction
Pathway 2 is for reducing overall waste in the district energy fuel mix. Copenhagen, at present, incinerates a very high proportion of its municipal waste stream6 . Reducing the volume of waste incinerated aligns with other City of Copenhagen and business objectives to shift towards a more circular economy where greater volumes of waste are reused and recycled (see Section 4.6.3 for more information on waste separation and recycling). Yet doing so may change the economic rationale of incineration plant operations, and require a commensurate sourcing of no-carbon fuel to substitute the energy loss.
Box 4.5 Waste incineration
Thereisdebateoverwhetherincinerationofmunicipalsolidwasteisasustainablewastemanagementdisposaloption.RecentadvancesinenergyrecoveryhaveincreaseditsacceptanceandcountriessuchastheUKandUSAthathadpreviouslyavoidedincinerationarenowbeginningtoexploreitspotential.
Arguments in favour of incineration• Newincinerationfacilitieswithenergyrecoveryhavedramaticallylowerlevelsof harmfulairemissionsandassociatedhealthimpactsthanoldertechnologies.
• Incinerationreducestheamountofwastegoingtolandfillbyupto90%,avoiding methaneemissionsthattraditionallyrepresentthelargestshareofgreenhousegas emissionsproducedbythewastesector.
• Energyrecoveryfromincinerationreducestheneedtogenerateenergyinother ways,whichcanhelpreducedependenceonfossilfuels.
• Highcostsofconstructionandoperationcanbeoffsetthroughthesaleofthe energyproducedandbyoptimisingthesizeandlocationofincinerationfacilities.
Arguments against incineration• Althoughnewairemissionscontroltechnologiesandmorestringentemissions regulationshavereducedthehealthrisksfromincineration,therearestillconcerns aboutpotentiallong-termhealtheffectsfromfineparticleemissionsofdioxidesand heavymetals.
• Theconstructionandoperationofstate-of-the-artincineratorswithwaste-to-energy capabilityiscostlyandmaycompetewithinvestmentsinotherwastemanagement optionssuchasrecyclingandcomposting,whichshouldbeprioritisedaccordingto thewastehierarchy.
• Waste-to-energyplantsmayalsounderminerecyclingeffortsduetotheneedfor sustainedvolumesofwastetomaintainelectricitysupply.Lowrecyclingrates increasetheneedtomanufacturenewgoods,whichleadstoincreasedenergyand resourceuse.
• Ifplasticsareamajorcomponentofwasteenergy,thiscouldriskanincreased dependenceonfossilfuelstoproducemoreplastic,leadingtoincreasedgreenhouse gasemissions.Thismeansthatincinerationcouldpreventtheachievementofzero carbongoals.
Sources:Consonni,Giuglianoetal.2005;GlobalAllianceforIncineratorAlternatives2012;Grosso,Mottaetal.2010;HealthProtectionScotland2009;Morris2005;WorldHealthOrganization2007
6ThefactthatexpandedwasteincinerationfacilitiesareunderconstructionatAmagercouldcreateanevengreaterdemandforwastetobeincinerated.Thusthelikelihoodofsignificantlyphasingdownwastetoenergyoperationsinthecomingdecadeislow.

107Lowcarbon,energyandresources106
Pathway 3: reducing district heating use and increasing distributed generation controlled through micro-grids posits a fundamentally different approach to Copenhagen’s energy generation. For this, Copenhagen could dramatically scale down or replace the district heating system entirely with a combination of electric heating (such as air source heat pumps) and micro-renewable generation and storage within buildings. This could be matched with substantial vehicle electrification (see Section 4.6.2 below) to increase the overall energy storage capacity, linked through local intelligent micro-grids7.
There are many barriers to realising this pathway, given the amount of investment that has taken place in the existing infrastructure (which has been beneficial for Copenhagen as a low carbon strategy and to raise the city’s green profile internationally) and vested interests in its maintenance. It would be necessary then to reconsider institutional arrangements and financing options in order to make this realisable. For example, there would need to be a different customer service model for incumbent energy utilities that would no longer generate most of the energy consumed by customers. A system integrator and manager role would be required, alongside a new business model that is not predicated on generation and transmission. Creating the financing environment that allows energy consumers to trade high upfront costs with low or no ongoing costs for energy services also requires innovation.
Pathway 4: substantial building energy demand reduction should be viewed as a contributor to all the energy pathways, but to 1 and 3 in particular. In Copenhagen, retrofitting existing buildings will be particularly important, with potential for substantial efficiency gains8. Reducing baseload heat demand and / or switching to electric heat, and making the most effective use of micro-generation and micro-grids, needs to coincide with significant building performance improvements. In residential buildings, this could be achieved through increased thermal efficiency of the building stock so as to minimise space heating requirements; improved daylight of buildings; and increased deployment of high efficiency lighting to reduce electricity consumption. In commercial and industrial buildings, efficiencies could be made through pumps, drives, motors, chillers and other devices.
Local regulations over building and streetscape design and historic preservation would need to balance changes to the building fabric and fenestration to improve efficiency. Overall, the market for energy efficiency reduction is weak and access to finance remains a barrier in spite of sound economic rationale for retrofits. Reducing market failures such as split incentives between landlords and tenants, and lack of upfront financing for installing energy efficiency measures such as insulation, would require policy coordination with the national government.
7Whilethisconceptisnotmutuallyexclusive–local,intelligentmicro-gridsarenotincompatiblewithdistrictheatingperse–thispathwayispredicatedonafarmoredecentralisedenergysupplymodelthanwhatiscurrentlyinplace.8Thiscanrangefrom‘conventional’or‘simple’retrofitswheregainsof10-30%canbeeasilyrealised,to‘deep’retrofitsthattargetreductionsof70-80%(GlobalBuildingsPerformanceNetwork2012)Significantcasestudyliteraturesexistsontheopportunityandcost-effectivenessofbothapproaches,thoughtheapproacheswilldifferintermsofcreatingincentives,securingfinancing,andmatchingagainstpropertyinvestmentandlife-cycleprofiles.
Box 4.5 Dagslys Renovering: Daylight Renovation
In2012,astudyledbyHenningLarsenArchitectsentitled‘DaylightRenovation’waspublished,offeringitsfindingsonthepotentialfordaylightingandpassivesolarheatgaintosubstantiallyreduceenergyconsumptioninbuildingswhilstimprovingoccupantcomfortandqualityoflife.Doingsowouldgenerateaestheticchangestotheexistingbuildingstock,whichwouldrequiremunicipalsupportthroughflexibleregulationsforbuildingfacadesandstreetscapes.ThestudyfocusedprincipallyonCopenhagen’s20thcenturybuildingstockandassessedthelargepotentialcarbonsavingsfromlargerglazedareasthatcouldbeachievedthroughfaçadeandinteriorcourtyardrenovations.
Source:www.dagslysrenovering.dk
9Asopposedtosubstantialnewsystemcapacity,forwhichtherearenoadditionalnear-termplans.NotethatthecurrentcapacityinvestmentprogrammefortheMetroCityRingandNordhavnenspurwillbeimplementedoverthenextfouryears,andadditionalfutureexpansionwillneedtobereviewedagainstridershipandperformanceinformationoncethelineisoperational.
4.6.2 Transport and mobility
Copenhagen is a world leader in cycling. The extensive cycling infrastructure means that this mode can effectively compete on an equal basis with other mobility options, a rarity in most cities. Land use planning and investments in infrastructure have made mass transit widely accessible and convenient for many throughout the city and surrounding municipalities.
Carbon emissions are on a downward trajectory for Copenhagen, but progress has been most difficult in the transport sector. CO2 emissions from road transport were rising throughout most of the 1990s and 2000s (see Section 3.8.1). It is only recently that these emissions have dropped below 1991 levels. This highlights both the challenge and the need to take effective action so that this sector delivers its share of carbon savings toward the overall Copenhagen target. Meeting the target will rely on some offsetting, as full decarbonisation is not deemed possible by 2025. Strategic decisions made now can address both the 2025 goal and build towards fuller decarbonisation in the years that follow.
Table 4.2 Transport and mobility: strategic policy pathways
Green challengesStrategic policy area
Non-motorised mobility
Mass transit
Low-carbon vehicles
Long-term pathways Interdependencies
Increasingtripnumbers(journeysanddistances)bybicycle
Increasingridershiponbuses,trains,andmetros
Reducingemissionsfromvehicles
Integratingelectricmobility,distributedenergystorage,andintelligentlocalenergynetworks
Trafficmanagement/allocationofroadwayspace
Trafficmanagement/allocationofroadwayspace
Vehicleelectrification
Intelligentenergygrids/electricitystorage
1.Increasecycling infrastructure
2. Improvemasstransit serviceprovisionand infrastructure
3.Infrastructureforelectric andhydrogenvehicles
Pathway 1: increasing cycling infrastructure. This pathway is a continuation of trends already present and reflects Copenhagen’s commitment to cycling. Increasing the road space and infrastructure dedicated to cycling will make the goal for 50% of journeys to be made by bicycle by 2025 more realisable. This will include delivering planned long-distance bicycling ‘highways’ in the region, which will facilitate more and faster cycling trips over longer distances. Within the denser areas of central Copenhagen and the neighbouring municipalities, decisions will be required on the space allocation between cyclist and vehicles. Currently in parts of Copenhagen, the cycling network faces congestion and capacity constraints which may only be solved by taking away roadway space from other modes. These infrastructure investments will need careful consideration for their impact on drawing mode share away from private vehicles. Comparisons to other cities in Chapter 3 (Figure 3.6 and Figure 3.7) indicate cycling could be substituting for trips that otherwise would have been made by foot.
Pathway 2 focuses on mass transit service quality and infrastructure, for example improved frequency of service and journey time and fewer transfers are viewed as necessary for increasing ridership9 . For this, intelligent mobility and transit management ICT networks can control signalling and vehicle spacing, and provide riders with better journey information. Collaborative partnerships with technology firms for these ‘smart city’ activities have begun in Copenhagen and in many other cities, and it is a market that promises significant change over the coming decade. As such, caution is required in order to avoid costly lock-ins with less optimal system configurations or inflexible data protocols.

109Lowcarbon,energyandresources108
Ceding private vehicle roadway space to dedicated transit rights of way can also play a role, though experience in many cities shows that pushback from motorists and commercial building owners can create difficulty in implementing this strategy. Another option is congestion pricing10, which has been shown internationally to reduce private vehicle use in the busiest parts of the city, thus freeing road space for alternative high efficiency uses. Importantly, revenue generated can also support investments in vehicles and systems that improve frequency and service.
Finally, for Pathway 3: electric and hydrogen vehicle infrastructure provision, government has a role to create the essential pre-conditions for consumer demand and confidence in these emerging mobility technologies. This has already been initiated via collaborations with large fleet owners and in and changing over vehicle fleets where the city has direct control over them. This should continue, as well as considering incentives for private vehicle owners to switch, in order to increase scale.
This pathway requires consideration of co-benefits and trade-offs. For example, vehicle electrification can be part of an intelligent energy strategy for distributed storage, allowing for load-shifting to off-peak times in order to smooth out renewable generation intermittency. However, policies to promote clean vehicles may conflict with goals for shifting travel away from private vehicles and towards public transport, walking and cycling. This is a potential conflict that needs to be considered in allocating public resources to a mix of transport sector measures.
10CreatingtheenablinglegislationforcongestionpricingwaspursuedinCopenhagenin2013butwasnotsuccessful.Whilethisisnotanear-termoptionforCopenhagen,conditionsmaychangesothatitreceivesfutureconsideration.
Box 4.7 German Leadership in Hydrogen and Electric Mobility
InitiativesinGermanyforreducingemissionsfromvehicleshavebeendesignedaroundarangeoftechnologies-hydrogen,fuelcellsandbatteryelectricdrives–andhowthesetechnologiescanintegratewithdistributedheat,power,andenergystorage.Berlin-basedNOWGmbH(NationalOrganisationHydrogenandFuelCellTechnology)isacollaborativepartnershiporganisationinvolvinggovernment,researchinstitutionsandtheprivatesector,andisresponsibleforthecoordinationandmanagementoftheNationalInnovationProgrammeforHydrogenandFuelCellTechnology(NIP)andtheElectromobilityModelRegionsprogrammeoftheFederalMinistryofTransportandDigitalInfrastructure(BMVI).Forthelattereightmodelregions,capturingcitiessuchasBremen,Berlin,Hamburg,Stuttgart,Frankfurt,andMunich,receivedfundingtocarryoutanumberofinnovationpartnershipandmarketdevelopmentprojectsthrough2015.Someofthehighlightsandachievementsofthecitiesinvolvedinclude:
Berlin• Morethan500electricvehiclesregisteredinthecityand220publiccharging stationsinstalled.
• Introductionoffullyelectriccarsharingprogramme,runbyCitroënincollaboration withDeutscheBahn.
Frankfurt• Thee-portinitiativehasledtotheelectrificationofmanygroundvehiclesat FrankfurtAirport,suchasthoseforbaggagehandling,airplanetaxiing,and movementofgroundstaff.
• Aplanned22vehicleelectriccarsharingfleethasbeeninitiatedinwesternFrankfurt.
Frankfurt• Thereareover600institutionalandfleetelectricvehiclesinHamburg,160ofwhich arepartofthemunicipalfleet.Theyaresupportedbyadensenetworkof250 chargingpoints.
Withrespecttohydrogenfuel,anannouncementwasmadeinlate2013bythesixpartnersinthe“H2Mobility”initiative-AirLiquide,Daimler,Linde,OMV,ShellandTotal-ofplanstoconstructanationwidehydrogenrefuellingnetworkforfuelcellpoweredelectricvehicles.Bytheyear2023thecurrentnetworkof15fillingstationsinGermany’spublichydrogeninfrastructurewillbeexpandedtoaround400H2fillingstations.ThegoalistoofferanH2stationatleastevery90kilometresofmotorwaybetweendenselypopulatedareas.
Sources:BerlinGovernment2012,nodate;GermanGovernment2009;GermanNationalOrganisationofHydrogenandFuelCellTechnology,nodate;ElectromobilitymodelregionRhineMain,nodate.
Pathway 1: water recycling and non-potable use would utilise rainwater and greywater as potable water substitutes in areas such as landscape watering, car washing, clothes washing, and toilet flushing. The capture of these water flows can happen at the individual building / lot scale or at the street or neighbourhood level. And depending on the source (rain or grey), and the end use (for example, clothes washing versus toilet flushing), a level of treatment may be required before the recycled water is fit for use. As with the capture, this treatment regime can be done at different scales – ranging from building to neighbourhood. This pathway creates design and planning issues from the building level up to the neighbourhood, and may require changes in building and health and safety codes.
Beyond the potable water savings, utilising these water sources offers important co-benefits. Rainwater harvesting can help manage stormwater flows during peak rainfall events, which are problematic for Copenhagen presently and are likely to be exacerbated in future decades due to climate change. Recycling greywater can reduce wastewater flows, again reducing stresses on the wastewater management system and potentially reducing energy consumption for water treatment. Both reduce the reliance on groundwater sources which are already shown to be under stress, a condition that may be exacerbated by climate variability.
Pathway 2 is for waste separation at source or management facilities and is related to energy system decisions described in Section 4.6.1. Improving diversion rates, including removing plastic from the incineration waste stream, will require support in the social realm, as the prevailing waste to incineration arrangement means that sorting waste is not required and has not been embedded in the civic ethos. Behaviour change programmes led by the municipality could be developed to address this. Changes to the physical and management infrastructure would also be needed. Options include deploying a wider array of waste collection bins for sorting various waste streams; centralised sorting and collection points (which could rely on vacuum chute technology being trialled in other cities, including Malmö); changes in municipal arrangements and contracting for waste collection services to handle multiple waste streams; and the introduction of technology to sort waste at centralised handling facilities rather than at source (see Box 4.8).
4.6.3 Water efficiency and waste management
In water efficiency, an area where Copenhagen already performs well, greater utilisation of non-potable water sources can address both resource efficiency and stormwater management concerns. As stated previously, the reliance on waste incineration for Copenhagen’s district heating network means that very little waste is sent to landfill and recycling rates are commensurately low as well. Changing the patterns around disposal and recycling will require better infrastructure for separating waste and behavioural changes to influence everyday practices. Table 4.3 summarises the pathways available to deal with waste and water efficiency.
Table 4.3 Waste management and water efficiency: strategic policy pathways
Green challengesStrategic policy area
Potable water use reduction
Recycling and composting
Long-term pathways Interdependencies
Reducingwaterconsumptionrates
Useofrecycledwater
Wastediversionandrecycling
Buildingdesignandwaterconsumingproductsstandards
Streetscapedesignandwastewatermanagement
Publichealthregulations
Energysupplyinfrastructure
1. Waterrecyclingand non-potablewateruse
2.Wasteseparationatsource oratmanagementfacilities

111Lowcarbon,energyandresources110
Box 4.8 Technology for centralised waste sorting in Copenhagen
AnewtechnologydevelopedbyDONGenergycreatesmultiplewasteoutputstreamsfromunsortedmunicipalsolidwaste.Itdoesnotrelyonindividualstosortwastebeforeitiscollected.
Intheprocess,thewholeofthewastestreamissubjectedtoaninitialprocessinvolvingwater,enzymes,andlow-temperatureheat.Thisresultsinbiodegradablematerialsbeingliquefied,whichpermitseasyseparationofnon-degradablesolids.Theresultingbioliquidissuitableasfeedstockforbiogasproductionorfeedstockinotherchemicals.Theremainingsolidscontainlargeportionsofplasticsandmetalswhichhavevalueforrecyclingoperations.Theremainingelementscanbeincineratedwithoutthecarbonemissionsassociatedwithburningplastics.
Thediagrambelowdescribestheprocessandtheresultantwastestreams.
Amulti-yearpilotprojecthasbeenrunningattheAmagerwastetreatmentplant,butafull-scaledeploymentthereisunlikelyduetoaplannedexpansioninthefacility’sincinerationcapacity.Otherfull-scaleprojectsarebeingconsideredincentralDenmark,withcapacitytohandlethewastecomingfromupto170,000Danishhouseholds,andtheNetherlands.
Source:DONGEnergyNodate

113Urbanform,transportandaccessibility112
Copenhagen has well-developed public transport systems, with relatively low energy use and low overall costs to the community.Credit:Kontraframe
5
URBANFORM,TRANSPORTANDACCESSIBILITY

115Urbanform,transportandaccessibility114
Key messages
Copenhagen’seffectivelanduseandspatialplanningstronglyinfluenceitsenvironmentalperformanceandsupportlow-carbongreengrowth.BothcityandnationalgovernmentsshowcommitmenttomaintainingCopenhagen’scompactandtransit-accessibleurbanform.Atapeakresidentsperkm²of25,340CopenhagenisamoderatelyhighdensitycitycomparedtootherEuropeancities.
Atthemetropolitanlevel,Copenhagen’sdistinctive‘FingerPlan’developmentisevident,withthepopulationclusteredalonglinearpublictransportcorridorsthatextendupto40kmfromthecitycentre.TheStationProximityPrincipleoftheDanishPlanningActalsorequireslargeofficestolocatewithin600mofarailwaystation.
TheCityofCopenhagenMunicipalPlansetsoutaspatialstrategyforland-useandtransportcoordinationthatwillplayanimportantroleinaddressingthecity’seconomicandenvironmentalchallenges.Thisincludespolicyandinvestmentframeworksforlandandinfrastructuredevelopmentthatprioritisemixed-use,inner-urbanandbrownfielddevelopment.Theplanalsoemphasisestheimportanceofthecross-borderØresundregionwithMalmöinSwedeninthecity’swiderregionalstrategy.
Themetropolitanregiongained100,000residentsand27,000jobsbetween2004and2012,andtheCityofCopenhagen’sshareofmetropolitanpopulationandjobsmarginallyincreased.TherelativelyfastergrowthintheCityofCopenhagenisgenerallyapositivesignforsustainabletravelpotential,asaccessibilityforpublictransport,walkingandcyclingwillbehigherintheurbancore.
Inner-urbangrowthisalsosuggestiveofagglomerationeconomieswhichdelivercompetitiveadvantagestoclustersoffirmsthroughsharingknowledge,labourmarketsandcustomers.Copenhagen’speakemploymentdensityof40,100jobs/km²indicatesamoderatelyhighcentralemploymentagglomeration.
TransportaccessibilityinCopenhagencomparesfavourablytolargeworldcitiessuchasLondonandNewYork,andsubstantiallyoutperformslowdensitycardominatedcitiessuchasLosAngelesandSaoPaulo.Investmentsinitsrelativelynew‘Metro’networkwillimproveaccessforCopenhageners,particularlywithstationproximitywithin500metresoncethenewcircularline,Cityringen,opensin2018.
Asaresultofthecity’seffectiveurbanformandaccessibility,traveltimeefficiencyisveryhighinCopenhagen.Analysisforthisreportestimatesjourney-to-workcostsat3.4%ofGVA,comparedto5.8%inStockholmand8.4%inLondon,bothofwhicharerelativelyefficientcitiesglobally.
Currently,cyclingisusedfor20%ofalltripsinCopenhagen-oneofthehighestratesintheworld.Thiscompareswith12%inHamburg,6%inStockholm,2%inLondonandBarcelona,andcloseto0%inIstanbul.Copenhagenaimstosupportcontinuedgrowthincycling,withaminimumof50%ofjourney-to-workandschooltripsmadebybicycleby2015,anincreasefrom36%asmeasuredin2010.
WhiletravelpatternswithintheCityofCopenhagenaregenerallyhighlysustainable,caruseinthewidermetropolitanregionismuchmoreextensiveandlikelytobedifficulttochange,asalternativetransportismorelimitedbeyondthemunicipality’sboundary.40%ofjourneysaremadebycarintheCopenhagenmetropolitanregion,comparedwith12%inBarcelona,14%inIstanbul,29%inStockholm,40%inLondonand42%inHamburg.TheaveragetraveltimeforpublictransitjourneysinCopenhagenisaroundtwicethetimeofcarjourneys.Thissubstantialdifferenceislikelytoreducetheimpactofpoliciestoshiftmorepeoplefromprivatetopublictransportinthefuture.
Copenhagenaimstomeetits2025carbon-neutralgoalwhilethecity’spopulationisexpectedtogrowby100,000people.Thereisalsopressureforperipheralgrowthlinkedtogreaterlandavailabilityandsubstantialmotorwayinfrastructureinthewiderregion.
Sustainedeffortwillbenecessarytoshiftmodalshareawayfromprivatevehiclestoothermodes.Masstransitridershiphasscopeforimprovement.Addressingregionalfragmentationinbusrouteplanningcouldassist,alongwithmoreeffectivecoordinationtoachieveoperationalefficiencies.
5 Urbanform,transportand accessibility
The spatial configuration of land use has a significant impact on the economy of city regions and their sustainability. It can be an important driver in agglomeration economies and improved transport accessibility, which is linked to more efficient energy use and lower carbon emissions. Copenhagen’s compact urban form is one important driver of the city’s green economy. This chapter analyses Copenhagen’s urban form in more detail and describes the impacts this has across a range of measures that impact mode share, land use, and economic growth.
Spatial planning directly affects the supply of new housing, services and commercial development; the accessibility of residents and businesses to employment and service locations; the potential for travel by multiple transport modes; and the preservation of rural land and natural habitats from urban development. In this respect, Copenhagen benefits greatly from its ‘Finger Plan’ which has effectively channelled growth into transit-accessible corridors and limited low-density expansion away from the urban core. Strategic decisions to maintain this overall land-use planning framework over many decades has made policy refinements possible in areas such as transit proximity, local mobility, regional integration, and open space preservation.
The analyses in the following sections show the effects of land use and transport in terms of travel opportunities for residents, employment accessibility for businesses, travel times for typical journeys and overall city transport CO2 emissions. Empirical GIS-based analysis techniques are employed alongside evidence from city surveys. To provide an international context for Copenhagen’s performance, comparisons are made with similar cities in the European Union.
5.1 Land-use policy programme
5.1.1 Key Challenges
Copenhagen is a growing city. The municipal population expanded by 18% between 1990 and 2011 (City of Copenhagen 2012d), and an estimated 100,000 additional residents are expected by 2025 (City of Copenhagen 2011b). This projected increase would see the municipal population rise to 640,000. Copenhagen also has significant plans for business growth, with strategic plans for a stronger and more integrated cross-border Øresund region, which would have Copenhagen at its centre and would capitalise on existing business clusters in clean-tech, life sciences and business services (City of Copenhagen 2011b). Copenhagen’s carbon neutrality goal must be achieved in parallel with these population and employment growth aims.
Copenhagen’s land-use planning framework will play an important role if the city and wider metropolitan region is to achieve its economic and environmental targets. There are, however, several ongoing land -use and transport challenges for Copenhagen in the coming decades. While travel patterns within the City of Copenhagen are generally highly sustainable, car use in the wider metropolitan region is much more extensive and likely to be difficult to change as alternative transport is more limited beyond the municipality’s boundary. There is also pressure for peripheral growth, linked to greater land availability and substantial motorway infrastructure in the wider region. To counter this, there will need to be sufficient brownfield sites available in the inner city to meet growth demands, and new developments that are closely coordinated with public transport, cycling and pedestrian infrastructure. These land-use challenges are set within the context of pressure to increase growth and innovation, with recent economic performance identified as “average” compared to competitor cities (City of Copenhagen 2011b).
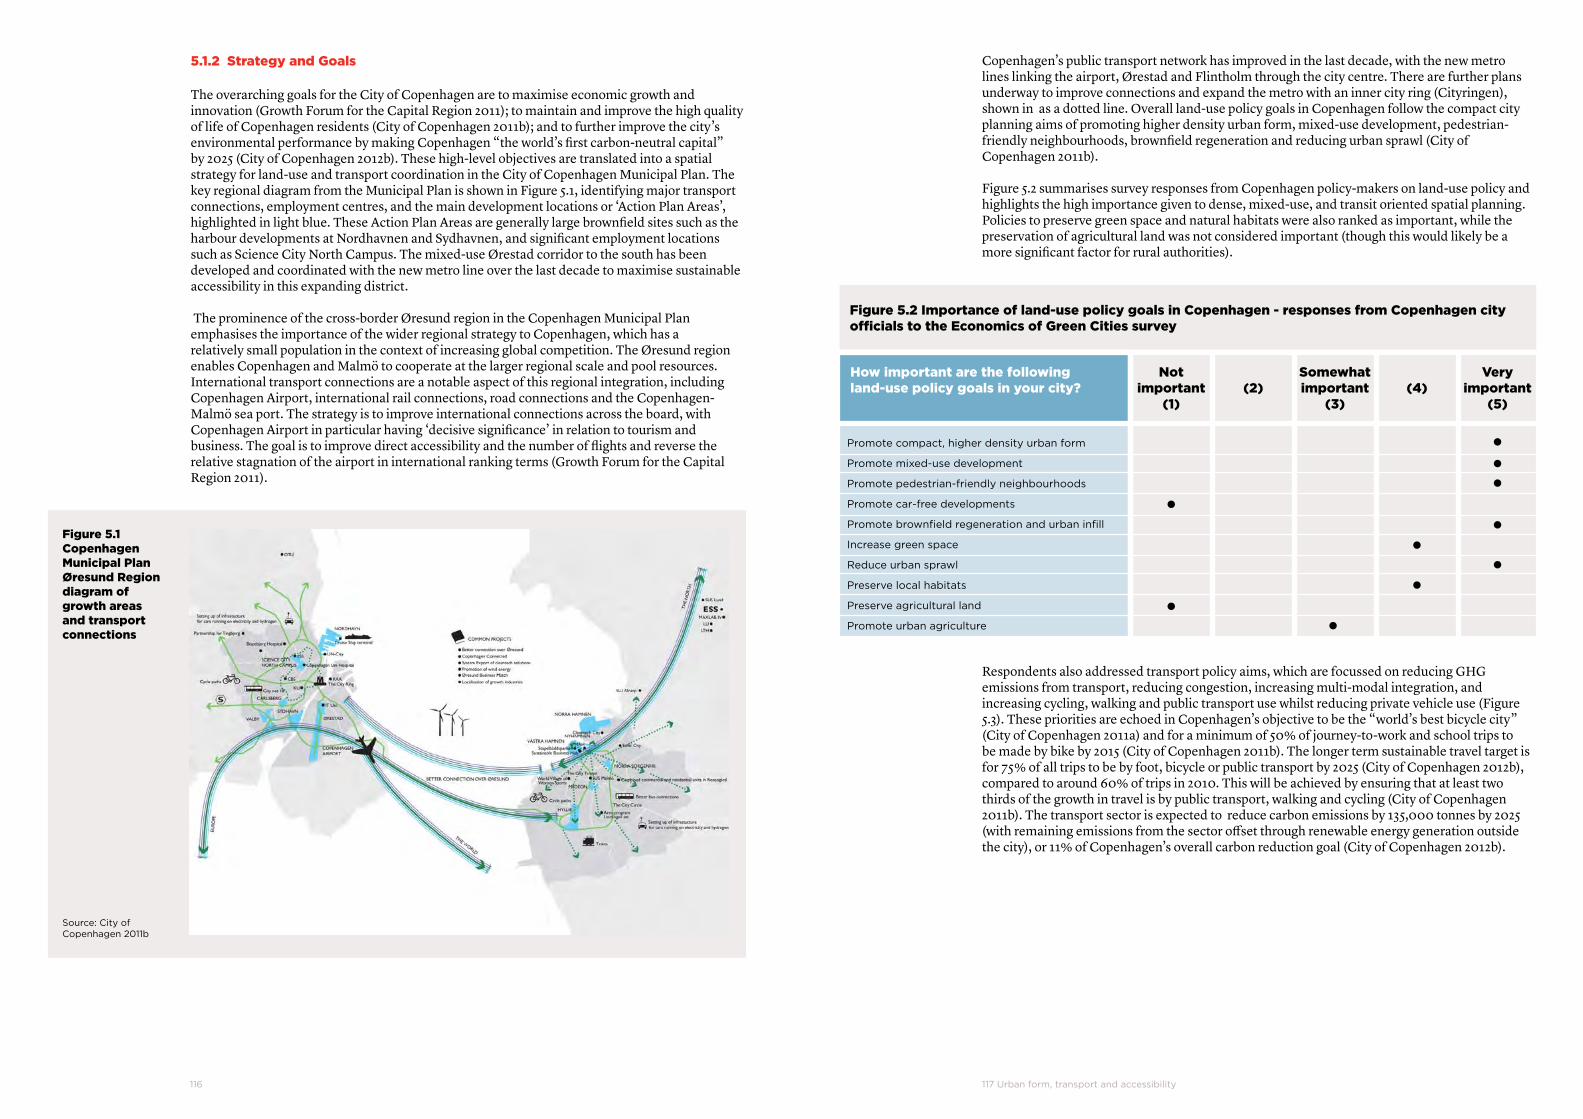
117Urbanform,transportandaccessibility116
5.1.2 Strategy and Goals
The overarching goals for the City of Copenhagen are to maximise economic growth and innovation (Growth Forum for the Capital Region 2011); to maintain and improve the high quality of life of Copenhagen residents (City of Copenhagen 2011b); and to further improve the city’s environmental performance by making Copenhagen “the world’s first carbon-neutral capital” by 2025 (City of Copenhagen 2012b). These high-level objectives are translated into a spatial strategy for land-use and transport coordination in the City of Copenhagen Municipal Plan. The key regional diagram from the Municipal Plan is shown in Figure 5.1, identifying major transport connections, employment centres, and the main development locations or ‘Action Plan Areas’, highlighted in light blue. These Action Plan Areas are generally large brownfield sites such as the harbour developments at Nordhavnen and Sydhavnen, and significant employment locations such as Science City North Campus. The mixed-use Ørestad corridor to the south has been developed and coordinated with the new metro line over the last decade to maximise sustainable accessibility in this expanding district.
The prominence of the cross-border Øresund region in the Copenhagen Municipal Plan emphasises the importance of the wider regional strategy to Copenhagen, which has a relatively small population in the context of increasing global competition. The Øresund region enables Copenhagen and Malmö to cooperate at the larger regional scale and pool resources. International transport connections are a notable aspect of this regional integration, including Copenhagen Airport, international rail connections, road connections and the Copenhagen- Malmö sea port. The strategy is to improve international connections across the board, with Copenhagen Airport in particular having ‘decisive significance’ in relation to tourism and business. The goal is to improve direct accessibility and the number of flights and reverse the relative stagnation of the airport in international ranking terms (Growth Forum for the Capital Region 2011).
Figure 5.1 Copenhagen Municipal Plan Øresund Region diagram of growth areas and transport connections
Source:CityofCopenhagen2011b
Copenhagen’s public transport network has improved in the last decade, with the new metro lines linking the airport, Ørestad and Flintholm through the city centre. There are further plans underway to improve connections and expand the metro with an inner city ring (Cityringen), shown in as a dotted line. Overall land-use policy goals in Copenhagen follow the compact city planning aims of promoting higher density urban form, mixed-use development, pedestrian-friendly neighbourhoods, brownfield regeneration and reducing urban sprawl (City of Copenhagen 2011b).
Figure 5.2 summarises survey responses from Copenhagen policy-makers on land-use policy and highlights the high importance given to dense, mixed-use, and transit oriented spatial planning. Policies to preserve green space and natural habitats were also ranked as important, while the preservation of agricultural land was not considered important (though this would likely be a more significant factor for rural authorities).
Respondents also addressed transport policy aims, which are focussed on reducing GHG emissions from transport, reducing congestion, increasing multi-modal integration, and increasing cycling, walking and public transport use whilst reducing private vehicle use (Figure 5.3). These priorities are echoed in Copenhagen’s objective to be the “world’s best bicycle city” (City of Copenhagen 2011a) and for a minimum of 50% of journey-to-work and school trips to be made by bike by 2015 (City of Copenhagen 2011b). The longer term sustainable travel target is for 75% of all trips to be by foot, bicycle or public transport by 2025 (City of Copenhagen 2012b), compared to around 60% of trips in 2010. This will be achieved by ensuring that at least two thirds of the growth in travel is by public transport, walking and cycling (City of Copenhagen 2011b). The transport sector is expected to reduce carbon emissions by 135,000 tonnes by 2025 (with remaining emissions from the sector offset through renewable energy generation outside the city), or 11% of Copenhagen’s overall carbon reduction goal (City of Copenhagen 2012b).
Figure 5.2 Importance of land-use policy goals in Copenhagen - responses from Copenhagen city officials to the Economics of Green Cities survey
How important are the following land-use policy goals in your city?
Not important
(1)
Very important
(5)
Somewhat important
(3)
(2)
(4)
Promotecompact,higherdensityurbanform
Promotemixed-usedevelopment
Promotepedestrian-friendlyneighbourhoods
Promotecar-freedevelopments
Promotebrownfieldregenerationandurbaninfill
Increasegreenspace
Reduceurbansprawl
Preservelocalhabitats
Preserveagriculturalland
Promoteurbanagriculture

119Urbanform,transportandaccessibility118
Figure 5.3 Importance of transport policy goals in Copenhagen - Responses from Copenhagen city officials to the Economics of Green Cities survey
How important are the following transport policy goals in your city?
Not important
(1)
Very important
(5)
Somewhat important
(3)
(2)
(4)
Reducetransport-relatedgreenhousegasemissions
ReducePrivateVehicleUse
ReducePrivateVehicleOwnership
ReduceRoadCongestion
Encouragepublictransportuse
Encouragebicycling
Encouragewalking
EncourageLowEmissionVehicles
Increasemulti-modalintegration
Other*
*Mobilitymanagementthroughbusinessandpublicservicetravelplans.Freighttransportreduction
The survey results show that Copenhagen has a comprehensive set of strategies for green growth in the land-use planning and transport sectors. They also show that reducing private vehicle ownership is a lesser priority, though policy action in this area could help reduce transport GHG emissions and congestion.
5.1.3 Policy Instruments
Copenhagen’s compact urban structure has primarily relied on effective land-use regulations and extensive transport infrastructure investments, underpinned by a clear regional spatial strategy. Policies relate to two main scales of governance, the national level and the municipal level. Since the 2007 Danish Planning Act, regional planning has been the responsibility of national level government.
Copenhagen’s ‘Finger Plan’ model of public transport corridors separated by green wedges was first proposed in 1947. This legacy of strong land-use planning in Copenhagen has guided development in the Copenhagen metropolitan region throughout the latter half of the 20th century, right up to the most recent iteration in the 2007 Danish Planning Act (Danish Ministry of the Environment 2007b). To support the aim of integrating land-use with transport, the Danish Planning Act also includes the ‘Station Proximity Principle’, which generally requires new large offices of more than 1,500m2 to be located within 600m of a railway station (Danish Ministry of the Environment 2007a). Regulation of retail developments promotes the location of shops in town centres by restricting the size of shops and specifying the location of town centres where retail development is permitted.
Under Danish planning law, each municipality is required to have its own municipal plan. The most recent City of Copenhagen Municipal Plan is from 2011 (City of Copenhagen 2011b). Municipal plans determine many aspects of land-use and transport policy, including density standards, mixed-use standards, parking regulations, local road investment and cycling infrastructure. The City of Copenhagen Plan is based on the compact city goals outlined in Section 5.1.2.
5.1.4 Governance and Policy Coordination
The Danish national government has been the most significant actor for both strategic metropolitan-wide land-use planning (particularly with the 2007 re-assignment of regional planning powers to the national level) and investment in public transport infrastructure. National transport policy and investments are led by the Ministry of Transport, which has responsibility for the regional highway network and has full ownership of the DSB railway company. The DSB includes all regional rail (e.g. Copenhagen’s metropolitan S-Train network), where it is the operator and controls the infrastructure (Danish Ministry of Transport 2011).
In addition, over 30 individual municipal governments across the metropolitan region influence detailed land-use policy such as parking, building density regulations and investment in local roads and bicycle infrastructure. The City of Copenhagen is the most important municipal government in the region and, as a partner with national government in the recent construction of the Metro, it has played an increasingly significant role in influencing urban development (Majoor 2008).
The appendix provides additional detail on national, regional and city responsibilities.
5.2 Impacts
This section considers the contemporary physical structure and distribution of land uses in Copenhagen. The relationships between land uses, public transport infrastructure and outcomes for access and density are analysed. The land-use and accessibility outcomes discussed are a result of long term interactions between planning policy and market forces.
5.2.1 Urban form: the distribution of living and working
Density is a fundamental measure of urban structure. Higher urban density districts with mixed-use functions can create more efficient travel patterns, and this translates into both productivity and environmental advantages as discussed in Chapter 3. Higher densities are associated with economic agglomeration benefits, with improved access to labour markets and close proximity between businesses and customers. The advantages of higher densities depend on high-quality urban design and effective city management to minimise the negative impacts of overcrowding and pollution.
The residential population density of the City of Copenhagen is mapped on a 1 kilometre square grid in Figure 5.4. The compact city structure is clearly evident, with the high density city centre peaking at 25,340 residents per km2. The medium density inner city surrounds the city centre, both on the mainland to the west and north, and on the island of Amager to the south east where much recent expansion has taken place. In the wider metropolitan Region the distinct ‘Finger Plan’ development pattern is clearly shown, with the population clustered along linear public transport corridors that extend up to 40km from Copenhagen city centre.
Figure 5.4 also includes some comparison cities to provide an international context for density levels in Copenhagen. Barcelona is one of the highest density cities in the EU, peaking at over twice the density of Copenhagen at 56,800 residents per km2. Though London is a much larger city than Copenhagen, its peak residential density levels are similar, at 27,100 residents per km2. These comparisons indicate that Copenhagen is a moderately high density city in the European context, with a strong history of regional land-use planning integration.

121Urbanform,transportandaccessibility120
Figure 5.4 Residential population density maps for Copenhagen, Barcelona and London
Copenhagen residential pop. densityPeak:25,340people/km2
Metro.average:2,814people/km2
Barcelona residential population densityPeak:56,800people/km2
Metro.average:11,250people/km2
London residential population densityPeak:27,100people/km2
Metro.average:4,275people/km2
In addition to residential densities, employment densities provide a complementary perspective linking urban form to business location patterns. Though influenced by historic urban form and land-use policies, employment densities result where there is demand from particular types of businesses to cluster together. Agglomeration benefits can accrue from business clustering through knowledge spill-overs, labour mobility, and shared customers. Commercial agglomeration creates an employment geography where density is generally much higher than residential figures.
Copenhagen’s city centre peaks at an employment density of 40,100 jobs/km2, as shown in Figure 5.5. There are also a number of lower density employment nodes on the outskirts of the city, located around secondary centres and orbital motorway links (mostly outside the City of Copenhagen’s boundary). The graphic suggests there is no dominant secondary centre in the Copenhagen Capital Region.
Figure 5.5 includes maps of employment density in Stockholm and London for comparison. Patterns in Stockholm are broadly similar, with a moderately higher peak density in the city centre and more clustered secondary centres. The London comparison is very different, highlighting how extreme employment density levels can become in very large high-rise business centres.
Source:LSEcitiesgraphicbasedonthefollowingsources:StatisticsDenmark2009,OfficeforNationalStatistics2012
Figure 5.5 Employment density maps for Copenhagen, Stockholm and London
Copenhagen employment densityPeak:40,100people/km2
Metro.average:1,555jobs/km2
Stockholm employment densityPeak:51,950jobs/km2
Metro.average:1,177jobs/km2
London employment densityPeak:141,600people/km2
Metro.average:2,125jobs/km2
Source:LSEcitiesgraphicbasedonthefollowingsources:StatisticsDenmark2009,StatisticsSweden2011,OfficeofNationalStatistics2012

123Urbanform,transportandaccessibility122
5.2.2 Mix-of-uses and local accessibility
Shorter distance travel suited to many different travel modes can be facilitated through local mixed-use urban forms that integrate homes, workplaces, shops and other services in close proximity. These land-use patterns can greatly improve opportunities for walking, cycling and shorter distance public transport trips. This section focusses in particular on the integration of residential areas with centres of employment.
The aggregate totals for population and jobs in the City of Copenhagen and the metropolitan region are summarised in Table 5.1 for the years 2004 and 2012. The jobs-population ratio for the City of Copenhagen is 0.61, indicating that there is a fairly typical aggregate balance between jobs and residents in Copenhagen. The table also outlines how population and employment totals have changed over time. The metropolitan region gained 100,000 residents and 27,000 jobs over this eight year period. Of these totals, the City of Copenhagen’s share of metropolitan population and jobs marginally increased at a greater rate than the metropolitan region. The relatively faster growth in the City of Copenhagen is generally a positive sign for sustainable travel potential, as accessibility for public transport, walking and cycling will be higher in the urban core.
Table 5.1 Copenhagen City and Metro Region Population, 2004 and 2012Source:StatisticsDenmark,2012
Metropolitan Region City of Copenhagen (incld. Frederiksberg)
2004
2012
Population (millions)
Population (millions)
Pop. share of metro
Jobs (millions)
Jobs share of metro
Jobs-pop. ratio
Jobs (millions)
1.82
1.92
0.977
1.04
0.593
0.649
32.6%
33.8%
0.365
0.393
37.4%
37.8%
0.616
0.606
Opportunities for local travel can be examined in more detail by mapping mix-of-uses at the scale of census tracts, allowing districts and neighbourhoods to be compared across the city region. In Figure 5.6 residential population densities and employment densities are mapped together for Copenhagen. More intense green colours represent high density mixed-use areas combining residents and jobs. Intense blue areas indicate employment activities with few residents, while yellow areas are residential in character with few jobs. Copenhagen’s inner city shows a high degree of diversity and integration of living and working environments, with green colours dominating the map. Only in the central business district around Vesterport is there a large area of high density employment activities that outweighs residential activities. Overall, the high degree of local mix-of-uses in the inner city of Copenhagen creates potential for walking and cycling trips.
Beyond the inner city towards the edges of the municipal boundary, Copenhagen becomes more suburban and residential. Employment activities are lower density and generally integrated in these areas. Further out beyond the City of Copenhagen boundary, land uses become more fragmented with large employment areas more isolated from residential activities. This office-park type land-use pattern is likely to reflect higher levels of car use. Private car accessibility will be high in these areas due to orbital motorway infrastructure. The spatial pattern of large isolated employment centres also relates to particular large-scale activities such as airports and seaports that are generally less amenable to residential integration.
Figure 5.6 Copenhagen population and employment density mix 2012
Legend
Municipal Bnd (incl. Friedsbg.)
0 2.5 5km
Population and Jobs Density Mix
ResidentialDensity
20,000+
10-20,000
5-10,000
2-5,000
0-2,000
per km2
Municipal Boundary (incld. Freidksbg.)
0-1,
000
1-5,
000
5-10
,000
10-3
0,00
0
30,0
00+ Jobs
Density
A complementary method for considering residential and workplace integration is to calculate a local jobs-population balance indicator. This measure describes the degree to which jobs can be met through local walking and public transport trips from nearby residents. For instance, an area with a jobs-population balance of 3 means that the total number of jobs in this area is three times higher than the number of local residents who can access those jobs. Higher jobs-population balance results are closely linked to longer distance travel patterns. The indicator is mapped for Copenhagen in Figure 5.7, where red colours show areas where jobs exceed the number of local residents. Often city centre areas produce very high jobs-population balance results due to high concentrations of employment activities pushing out residential uses. In Copenhagen the city centre and inner-city are well balanced in this regard, with city centre zones having a jobs-population ratio between 1 and 2. This is an ideal pattern to enable common local travel patterns such as journey-to-work, education and shopping.
Source:LSEcitiesgraphicbasedonStatisticsDenmark

125Urbanform,transportandaccessibility124
Figure 5.7 Copenhagen jobs-population balance indicator
Legend
Local Jobs/Population Balance
0.15 - 0.50
0.51 - 0.75
0.76 - 1.00
1.01 - 1.25
1.26 - 1.50
1.51 - 2.00
2.01 - 3.00
3.01 - 3.57
Municipal Bnd (incl. Friedsbg.)
0 2.5 5km
In the wider metropolitan region beyond the City of Copenhagen boundary, a different jobs-population balance pattern can be seen. Larger peripheral employment centres, such as the airport, former port area and the office park area around Lautrupparken, have much higher jobs-population balance results. These centres are moderately large employment centres in low density residential areas. They will inevitably attract longer distance travel patterns, and are likely to have higher levels of car use due to their edge-of-centre locations.
5.2.3 Metropolitan public transport accessibility
This section analyses the relationship between land use and transport networks. The integration between urban land uses and public transport has been a guiding principle for planning in the Copenhagen region for many decades. The results of this planning policy approach can be seen in Figure 5.8, where urban density, measured as the total number of residents and jobs per hectare, is mapped in relation to the railway and metro public transport networks. There is a very high degree of spatial integration, with higher density areas following radial rail links in the wider region. Strong land-use to transport integration is also evident in the more recent metro developments to the south east of the city centre in Amager and the Ørestad corridor. While Copenhagen regional rail links have been in place for many decades, the metro development was completed only relatively recently in 2002. At present the Copenhagen metro does not cover the entire inner city but it is being expanded as part of the city ring development (outlined in Figure 5.8). Compared to cities with longer periods of metro development, such as London and Stockholm as shown in Figure 5.9, inner city residents will, on average, have a longer travel distance to reach their closest metro station.
Source:LSEcitiesgraphicbasedonStatisticsDenmark2009
Figure 5.8 Copenhagen public transport networks and urban density
Figure 5.9 Stockholm and London public transport networks and urban density
0 5 10km
LegendPublic Transport Network
Mainline Rail
Metro
Local Rail
Population & Jobs Density
Residents & Jobs per hect.
0 - 10
11 - 25
26 - 50
51 - 100
101 - 200
201 - 400
401 - 600
601 - 850
Municipal boundary
5 10km
0 5 10km
LSEcitiesgraphicbasedonCityofCopenhagen,2012p;CountyofStockholm2011;OrdnanceSurvey2011

127Urbanform,transportandaccessibility126
To complement the static analysis in Figure 5.8, the dynamics of urban form can be observed by mapping recent patterns of population change in the Copenhagen region. This provides a spatial indicator of how effective current planning policy has been in guiding new development. In Figure 5.10 the change in residential population and workplace employment in Copenhagen is mapped between 2004 and 2012, with areas of intensification highlighted in red. It is clear that the majority of growth in population and employment is concentrated in the inner city, matching the Action Plan Areas identified in the Copenhagen Municipal Plan (City of Copenhagen 2011b). The areas of greatest population growth are to the south and west of the city centre, including Sydhavnen, Ørestad and Frederiksberg. Employment growth is also evident in Sydhavnen and Ørestad, as well as across the city centre more widely and to the north, including the areas near Nordhavnen and Nordvest. All these locations are in close proximity to good public transport services, and this indicates a strong integration between land-use and transport planning.
Figure 5.10 also identifies growth areas in the wider metropolitan region. These are largely clustered around rail stations, maintaining the radial corridor form of the Finger Plan. Growth areas are particularly clustered around Vallensbaek and Albertslund stations to the west and south west. One of the largest areas of employment growth is the Lautrupparken area near Malmparken station to the northwest. This area was identified as having a high jobs-population balance ratio in the previous section. There are, however, a few growth areas less directly connected to public transport stations. In particular, areas near the airport to the south are attracting population and employment growth beyond the end of the metro lines. Extending the Metro lines in this area of south Amager could thus be considered to reinforce the successful corridor approach seen elsewhere.
The geography of population and employment in combination with public transport network data can be used to produce accessibility indicators describing the ease with which residents and employees can access public transport services. A threshold approach is utilised to show the proportion of metropolitan populations within specific distances to rail and metro stations. Figure 5.11 shows the proportion of metropolitan residents within 500 metres, 0.5-1km, 1-2km, and over 2km of a public transport station for Copenhagen, Stockholm and London. Due to its more limited metro system, there are fewer residents living within 500m of a rail or metro station in Copenhagen (25%) compared to Stockholm (43%), although London (25%) has similar results to Copenhagen despite its extensive metro development. Copenhagen also performs better than London in terms of the proportion of residents within 1km (58%) and 2km (85%) of stations, while Stockholm substantially outperforms both cities.
Figure 5.10 Copenhagen change in population and workplace employment 2004-2012
0 5 10km
Legend
Employment Change2004-2012, by workplace
-1249 - -500
-499 - 0
1 - 200
201 - 350
351 - 500
501 - 1000
1001 - 2522
Mainline Rail
Metro
Regional Rail
City of Copenhagen
0 5 10km
Legend
Population Change2004-2012, by residence
-1217 - -200
-199 - 50
51 - 200
201 - 500
501 - 800
801 - 2000
2001 - 3826
Mainline Rail
Metro
Regional Rail
City of Copenhagen
Source:LSEcitiesgraphicbasedonmultiplesources
The accessibility indicator can be repeated using employment data by workplace to investigate how closely business locations are integrated with public transport networks, as shown in Figure 5.12. Again Copenhagen’s relative performance is better over the 1km and 2km distances rather than 500m. This is likely to mean that multi-modal public transport trips involving longer walks, or in combination with cycling or bus trips, are common in Copenhagen, as trips can involve longer distances to reach rail stations. Note that the higher levels of employment density in London and Stockholm, discussed earlier in Section 5.2.1, boost the employment accessibility results as shown in Figure 5.12.
The accessibility indicators for distance to public transport stations will improve when the Cityringen line opens as expected in December 2018. Following this, 85% of housing, workplaces and studyplaces in central Copenhagen will have a rail or train station within 600 metres (Danish Ministry of Transport/Lars Barfoed 2009)
By drawing on LSE Cities research, Copenhagen’s accessibility levels can also be compared to a selection of global cities as shown in Figure 5.13. Copenhagen compares favourably to large world cities such as London and New York, and substantially outperforms low density car dominated cities such as Los Angeles and Sao Paulo.
Figure 5.11 Residential accessibility to public transport stations
Figure 5.12 Employment accessibility to public transport stations
0 20 40 60 80 100
Copenhagen
Stockholm
London
0.5-1km
1-2km
> 2km
0-500m
Metropolitan population %
Distance to rail and metro stations
Copenhagen
Stockholm
London
0.5-1km
1-2km
> 2km
0-500m
0 20 40 60 80 100
Metropolitan employment by workplace %
Distance to rail and metro stations
Source:LSEcitiesgraphicbasedonthefollowingsources:OfficeforNationalStatistics,2012,StatisticsDenmark2009,StatisticsSweden2011
Source:LSEcitiesgraphicbasedonthefollowingsources:OfficeforNationalStatistics,2012,StatisticsDenmark2009,StatisticsSweden2011

129Urbanform,transportandaccessibility128
Figure 5.13 Residents and jobs in walking distance (500 metres) of public transport stations, metropolitan region
0% 10% 20% 30% 40% 50% 60%
Los Angeles
Sao Paulo
Bogota
Stockholm
Copenhagen
Hong Kong
New York
London Residents
Jobs
5.2.4 Agglomeration and labour accessibility
Agglomeration economies deliver competitive advantages to clusters of firms through sharing knowledge, labour markets and customers. Many indicators can be used to assess agglomeration. For example, demand for space in areas of strong agglomeration economies is revealed through increasing property rents. This incentivises developers to construct new buildings, acting as a positive feedback loop to drive increasing employment densities. Copenhagen’s peak employment density of 40,100 jobs/km2 indicates a moderately high central employment agglomeration.
High density clusters of knowledge economy firms need to draw on large pools of skilled labour from across metropolitan regions in order to function effectively, and efficient public transport networks can enable this. To analyse labour accessibility in the Copenhagen metropolitan region a public transport network model has been produced for this report. The GIS model uses the demographic and transport data presented in preceding sections, and is based on average rail, metro and walking speeds at the scale of census zones. Note that the model does not fully include service interchange delay times and will give a marginally faster time than reality for trips involving multiple public transport services.
Examples of the output from the model are shown in Figure 5.14, with travel times to three prominent employment locations in Copenhagen. Dark red colours represent locations with short journey times of less than 30 minutes, light red and grey colours are locations with 30 minutes to 1 hour journey times, while blue locations exceed 1 hour. Copenhagen’s central station Vesterport predictably offers excellent public transport accessibility across the region. The two further employment locations, Copenhagen Airport and Malmparken, are more peripheral and would be expected to have more limited public transport access. In fact these locations still manage acceptable commuting times of around 30 minutes across much of the inner city. This reflects the combination of radial and orbital public transport services available in the Copenhagen network, and indicates that more peripheral employment centre locations in Copenhagen can still have acceptable public transport commuting times.
Source:Smith2012
Figure 5.14 Copenhagen Public Transport Model travel time examples: one-way travel time to Vesterport (above), Copenhagen Airport (below-left) and Malmparken (below-right)
VesterportVesterport
0 4 82km
Legend
Vesterport Travel Time
Minutes by Pub. Trans.
0 - 20
21 - 30
31 - 40
41 - 50
51 - 60
61 - 80
81 - 100
101 - 160
Public Transport Network
Mainline Rail
Metro
Local Rail
Municipal boundary
MalmparkenMalmparken
0 4 82km
Legend
Malmparken Travel Time
Minutes by Pub. Trans.
0 - 20
21 - 30
31 - 40
41 - 50
51 - 60
61 - 80
81 - 100
101 - 160
Public Transport Network
Mainline Rail
Metro
Local Rail
Municipal boundary
AirportAirport
0 4 82km
Legend
Airport Travel Time
Minutes by Pub. Trans.
0 - 20
21 - 30
31 - 40
41 - 50
51 - 60
61 - 80
81 - 100
101 - 160
Public Transport Network
Mainline Rail
Metro
Local Rail
Municipal boundary
Source:LSEcitiesgraphicbasedonmultiplesources

131Urbanform,transportandaccessibility130
The public transport model can also be used to estimate travel times from all origins to all destinations within the metropolitan region and to calculate overall accessibility indicators. As labour accessibility is a key part of agglomeration economies, it is useful to measure the number of potential employees accessible to workplaces within typical commute times. In Figure 5.15 the total population within 30 minutes travel time by public transport, foot, or a combination of both is mapped. There is clearly very strong labour accessibility in the city centre at Vesterport and Norreport, and also at the points where radial rail links meet orbital rail links at the edges of the inner city, particularly to the west and north. The peak value of 780,000 indicates that there is a large potential labour market across the inner city of Copenhagen.
Figure 5.15 Copenhagen: total population within 30 minutes public transport trip of workplaces
0 4 8km
Legend
Workplace PT Access.Population within 30mins
363 - 25,000
25,100 - 50,000
50,100 - 100,000
101,000 - 200,000
201,000 - 300,000
301,000 - 400,000
401,000 - 600,000
601,000 - 782,000
Mainline Rail
Metro
Local Rail
Municipality
Source:LSEcitiesgraphicbasedonmultiplesources
5.2.5 Travel time efficiency
Drawing on the understanding of land use, public transport networks and accessibility developed previously, this section investigates travel times for typical journeys in Copenhagen, with Stockholm and London used as comparison cities. In the first instance potential travel times are estimated using the public transport model described in Section 5.2.4. These potential travel results are then compared to actual travel times from city travel surveys. Finally, the travel survey trip times are used to estimate financial costs based on average value of time coefficients for commuters.
In Table 5.2, the mean public transport and walking accessibility time and distance calculated by the model to all jobs within a standardised metropolitan region of 1000 km2 is shown for Copenhagen and Stockholm. The model estimates distances and times to be lower for Copenhagen, indicating that better local mix-of-uses is likely to translate into shorter average travel times for public transport, walking and cycling compared to Stockholm.
The results of the public transport model can also be compared to actual travel survey data recording average commuting times in Copenhagen. Note that there are several methodological issues with directly comparing travel survey results from different cities, and the values below should be interpreted with care1. Average travel times for trips in the metropolitan region and trips within municipal cores are shown in Table 5.3. In line with the public transport and walking model results, Copenhagen has substantially quicker journey times than Stockholm and London. Compared to Stockholm, the differences are marginal for public transport trips, but are high for walking, cycling and for car travel. Similar travel time differences can be seen in the average times for all weekday trips in Table 5.4. The time advantages for walking and cycling trips in Copenhagen reflect the benefits of the high local mix-of-uses and jobs-population balance factors described earlier in this chapter.
Time advantages for car trips are noteworthy and are likely to reflect the generous infrastructure for car travel in Copenhagen (there are four major orbital roads). It appears that Copenhagen has lower levels of congestion compared to London and Stockholm. Lower congestion brings benefits in terms of reduced travel times and – potentially - pollution levels. But these fast car travel times do reduce the relative competitiveness of public transport travel times. This can be seen in the tables below, where public transport travel times are on average twice as long as car trips. This substantial difference will generally make efforts to shift commuters from their car to public transport more difficult. Note however that average cycling journey times are faster than car trips, highlighting the competitiveness of this mode, at least for inner-city trips.
Table 5.2 Public transport & walking model mean accessibility time & distance to all jobs, Stockholm and CopenhagenSource:LSECitiesmodelbasedonmultiplesources
Standardised Metropolitan-Region
Copenhagen
Stockholm
Jobs Pop. Area (km²)Time (mins) Distance (km) Speed (km/h)
Mean Accessibility to All Employment
852,696
858,972
1,467,916
1,595,380
1,004
999
42.7
49.2
13.3
18.3
18.7
22.3
1CopenhagenhasasmallermunicipalareathanStockholmorLondon,whichislikelytoreducerecordedtraveltimesforCopenhagenerswhencomparingthem.Furthermore,metropolitantripsaredefinedasthosetripswhichbeginand/orendinthemunicipalarea,thereforethemunicipaldefinitionwillalsoaffectmetropolitanresults.Finallytraveltimeresultscanalsobeaffectedbyminordifferencesinhowtravelsurveysareconducted,forexampleintheminimumcut-offdistanceforwalktrips.

133Urbanform,transportandaccessibility132
Table 5.3 Travel survey journey-to-work times for Stockholm, Copenhagen and London (minutes)Source:CityofCopenhagen2012p;ONS2012:StatisticsSweden2012
Table 5.4 Travel survey times for all weekday trips, Stockholm, Copenhagen and London (minutes)Source:CityofCopenhagen2012p;ONS2012;StatisticsSweden2012
Metropolitan Region
Metropolitan Region
Municipal Region
Municipal Region
Copenhagen
Copenhagen
Stockholm
Stockholm
London
London
Public.Trans.
Public.Trans.
Public.Trans.
Public.Trans.
Car
Car
Car
Car
Walk
Walk
Walk
Walk
Bike
Bike
Bike
Bike
All
All
All
All
44.8
46.2
-
41
43.6
-
36.2
38.4
-
28
35.7
-
20
35
-
17
32
-
15
33
-
12
26
-
11
16
-
12
16
-
9
16
-
12
17
-
15
25
-
13
19
-
12
20
-
13
17
-
20
37
48
17
29
32
17
31
43
15
24
30
By using a value-of-time approach, journey-to-work travel times can be translated into estimated financial costs for the metropolitan economy and as a percentage of Gross Value Added for the metropolitan region. This calculation is presented in Table 5.5 using a commuting value-of-time coefficient standard from the UK Department for Transport (Department for Transport, 2012). It is estimated that journey-to-work comprises 3.41% of GVA in Copenhagen. Copenhagen’s efficient travel times translate into significant economic benefits compared to Stockholm and London, where commuting is estimated to comprise 5.8% and 8.36% of GVA respectively.
Table 5.5 Total annual value of time costs, journey-to-work (2010 prices)Source:CityofCopenhagen2012p;ONS2012;StatisticsSweden2012
Metropolitan Region
Copenhagen
Stockholm
London
Cost Per Commute € Annual Cost Per Capita €
Metro Total Annual Cost (€millions) % of GVA
2.49
4.62
6.00
1,224
2,264
2,937
1,027
1,945
23,712
3.41
5.84
8.36
5.2.6 Environmental efficiency
This section analyses modal split and distance travelled from travel survey results, and analyses the resulting environmental impacts. In Figure 5.16 the modal split for weekday journeys in Copenhagen is compared to a selection of European cities. Note that the modal split data records only the main mode used in a trip; as a result multi-modal trips are simplified.
A major trend that stands out for Copenhagen is the very high proportion of cycling taking place, recorded at nearly 20% of all trips. This is the highest of all the comparison cities included and is ten times higher than some aspiring cycling cities such as London and Barcelona. Note, however, that the total volume of active travel trips (walking and cycling together) is broadly comparable in the other cities. Copenhagen’s 38% of active travel trips compares to 48% in Barcelona, 40% in Hamburg, 45% in Istanbul, 26% in London and 39% in Stockholm. It is likely therefore that a significant proportion of the cycling trips in Copenhagen are a replacement for walking trips.
The proportion of trips by car is broadly similar in Copenhagen (40%), Hamburg (42%), London (41%) and Stockholm (31%). These cities have broadly similar density levels, as was indicated earlier in Section 5.1.1. Barcelona and Istanbul are on a different density scale altogether, at twice and three times the peak residential density of Copenhagen, and this translates into substantially lower car use in these two cities.
Figure 5.16 Modal split by weekday trips in the City of Copenhagen and a selection of international cities
Copenhagen
Hamburg
London
Barcelona
Istanbul
Stockholm
33%
18%
48%
Motorcycle6.1%
Taxi3.5%
Bus11.9%
Metro14.8%
Rail3.1%
Car12.2%
Walking45.5%
Bicycle2%
22%
40% 38%
Bus5.3%
Metro3.5%
Rail13.6%
Car39.9%
Walking18.2%
Bicycle19.6%
18%
42%40%
Car &private
42%
Public transport18%
Walking28%
Bicycle12%
41%
13%
45%
Ferry1.6%
Minibus /dolmus /
taxi9.3%
Bus14.8%
Private bus11.5%
Car13.7%
Walking45%
Rail3.8%
34%
41%
26%
Motorcycle0.8%
Taxi1.2%
Bus14.9%
Metro8.4%
Rail9.2%
Car39.8%
Walking23.7%
Bicycle2%
30%
31%39%
Bus8.1%
Metro17.2%
Train3%
Car29.4%
Walking33.5%
Bicycle5.6%
Tram0.6%
Taxi1.2%
Motorcycle1.3%
Source:LSECitiesbasedon:CityofCopenhagen2012p;ONS2012,StatisticsSweden2012

135Urbanform,transportandaccessibility134
In environmental impact terms, the modal split of travel patterns needs to be considered in relation to average distances travelled. Travel survey data indicates that average distances in the Copenhagen metropolitan region for weekday trips are around 17km, compared to around 22km in Stockholm. Distances in London are likely to be greater still, though incompatible data standards prevent a direct comparison here. The proportion of total passenger kilometres travelled by different modes for Copenhagen, Stockholm and London is shown in Figure 5.17. These figures are for residents of the city municipalities on typical weekdays, similar to Figure 5.16. The proportion of passenger kilometres by car is very similar in all three cities. By comparing the modal split of trips (Figure 5.16) to the proportion of passenger kilometres in Copenhagen (Figure 5.17) we can see that public transport is being used for relatively longer distance travel, increasing from 22% of trips to 34% of trip miles when these two factors (trips/passenger km) are combined. Both rail and the metro are used for longer distance travel. Generally walking and cycling trips are over much shorter distances, but we can see that the passenger kilometres by bike in Copenhagen holds up well at 13.6% of passenger kilometres. This indicates that some cycling trips are of relatively longer distance in Copenhagen, and this compares favourably to shorter distance bike trips in Stockholm and London.
Figure 5.17 Passenger kilometres by mode, weekday trips, for Copenhagen, Stockholm and London
Copenhagen
Stockholm London
34%50%
15%
Bus5.4%
Metro8.1%
Rail20.8%
Car50.3%
Walking*1.8%
Bicycle13.6%
44%51%
6%
Bus6.5%
Metro16.9%
Train14.2%
Car51%
Walking3.3%
Bicycle2.2%
Tram0.4%
Taxi5.4%
43%52%
5%
Motorcycle0.7%
Taxi1.4%
Bus11%
Metro13.1%
Rail17.9%
Car51.2%
Walking3.4% Bicycle
1.4%
The transport modal split and distances travelled directly relate to CO2 emissions for the example cities. Data on per capita transport emissions from residents of the cities of Copenhagen, Stockholm and London are shown in Table 5.6. Again this data needs to be interpreted with care due to large differences in municipal areas and further differences in how transport emissions are modelled.
Previous sections have identified a number of factors that contribute to relatively lower transport emissions in Copenhagen, including shorter average trip distances and high levels of cycling. Estimated levels of per capita CO2 emissions in Copenhagen were 0.76 tonnes in 2010, compared to 1.1 tonnes in Stockholm and 1.29 tonnes in London. Note Copenhagen’s results will be affected by its smaller municipal area.
The change in CO2 emissions over time is also important to consider. Emissions increased in Copenhagen between 1991 and 2000, probably due to increasing levels of car use. This trend was reversed between 2000 and 2010, which is a significant achievement given the changes in wealth over this period. Emissions in London marginally increased between 2000 and 2010. Stockholm made significant reductions in transport CO2 emissions between 2000 and 2010, attributed to the rise of low emission vehicles, the introduction of the city congestion tax, and increases in public transport use and active travel.
Table 5.6 Transport CO2 emissions per capita, municipal residentsSources:CityofCopenhagen2012e;CityofStockholm2012;GreaterLondonAuthority2012
Transport CO2 emissions, tonnes per capita
Copenhagen
Stockholm
London
1991 2000 2010 Change 1991-2010
% Change 1991-2010
0.82
1.581
1.40
0.88
1.41
1.20
0.76
1.11/1.42
1.29
-0.14
-0.481
-0.11
-7.3
-30.41
-7.9
1Valuefrompre-2010CityofStockholmemissionscalculationmethodology.2Valuefrom2010CityofStockholmemissionscalculationmethodology
137Innovationandbusiness136
5.3 Future challenges and opportunities
The preceding analysis has identified many aspects of how land-use and transport planning in the City of Copenhagen and the wider region are contributing to green growth and urban sustainability.
Overall, the compact city approach is strongly embedded in Copenhagen’s economic geography and land-use planning. It is particularly evident in the very high level of mix-of-uses and local integration between residential and workplace activities in the City of Copenhagen. This integration helps to reduce travel times, with average journey-to-work times significantly quicker in Copenhagen relative to other European cities such as Stockholm and London. These travel time gains produce significant cost savings, with journey-to-work time costs in Copenhagen estimated at 3.4% of GDP, compared to 5.8% of GDP in Stockholm and 8.4% of GDP in London. The ongoing land-use challenge for the City of Copenhagen is to ensure that future developments maintain and enhance this high level of integration and mix-of-uses in brownfield development sites.
Mapping analysis of the change in population and employment over the last decade in Copenhagen indicates that integrated and mixed-use growth is generally being achieved in brownfield locations identified in the Municipal Plan. There is, however, significant pressure for growth in the wider region, either for reasons of personal choice, economics, or space constraints. Where these growth pressures are emerging, strong efforts will be needed to deliver the supporting infrastructure for low-carbon mode choices, namely cycling and mass transit. This may require collaboration between multiple actors: the Copenhagen and Danish governments for light and heavy rail, and multiple local municipalities for bus services. Steering growth to take advantage of existing or planned regional infrastructure links should also be prioritised.
Copenhagen’s compact and mixed-use urban form also produces significant environmental benefits. Shorter average journey times as well as high levels of cycling translate into low per capita transport CO2 emissions, at 0.76 tonnes in 2010. Copenhagen is a global leader in terms of levels of cycling and quality of infrastructure. And certainly, the benefits of widespread cycle use extend beyond sustainable transport to the health and quality of life of residents. The City of Copenhagen has set highly ambitious goals to further extend cycle use so that, for example, more than 50% of trips to work and school are by bike in 2015. There is very little in the way of precedent for such high levels of cycle use in European cities, and these targets are very challenging. It is not clear whether the positive feedbacks, in terms of the infrastructure and culture of cycle use in Copenhagen, can raise cycle use to even higher levels, or whether certain demographics will resist making a modal shift. It makes sense therefore to support Copenhagen’s broad approach to sustainable travel alongside the cycling strategy, including public transport, walking and multi-modal trips.
The Copenhagen Capital Region has developed an integrated public transport network that builds on the long heritage of the Finger Plan. The network has been extended with the metro development of the last decade, successfully linking new developments around Copenhagen Airport and the Ørestad corridor. The most accessible locations within the inner city of Copenhagen are able to draw on large labour markets within short commuting times. There is, however, an accessibility gap when comparing Copenhagen with competitor cities where metro development has been pursued over a longer period of time. A lower proportion of the Copenhagen population currently lives within 500 metres of a metro station compared to Stockholm. This gap will be narrowed by the current extension of the Copenhagen metro to include the city ring line. Future metro or bus / BRT investments should prioritise the 500 metre access principle in order to bring Copenhagen in line with peer cities in Europe.
A further challenge for integrated transport development in the Copenhagen region is the multiple levels of governance involved. The metropolitan rail network is at the national level, the metro is controlled by the City of Copenhagen and Frederiksberg, and bus networks are controlled by the many local authorities across the Copenhagen Capital Region. These multiple layers of responsibility make integrated transport development more challenging, particularly in locations beyond the City of Copenhagen boundary. This transport challenge is part of the wider issue of the extent to which sustainable land-use and transport patterns seen in the City of Copenhagen are replicable in more suburban and rural locations in the wider region. In these locations, car accessibility is generally strong while public transport is limited to the radial network. National planning policy ensures that new development is focussed around public transport stations, but even so car use is still relatively high in the wider region. Greater integration between planning authorities will be needed, particularly in areas with significant growth pressures such as in the vicinity of Copenhagen Airport and ring-road locations.

139Innovationandbusiness138
Cycling has been promoted since the 1980s and the city now has almost 370 km of dedicated cycling lanes.Credit:Kontraframe
6
INNOVATIONANDBUSINESS

141Innovationandbusiness140
Key messages
Inanurbangreeneconomy,policiesforsupportingalltypesofinnovationshouldbeencouraged.InDenmarkpolicysupportforinnovationisfocusedoneducation,improvingthephysicalframeworkforbusinessgrowth,andinvestinginresearchanddevelopment.
DenmarkranksthirdintheEU-272013EUInnovationScorecard,withthehighestaveragegrowthrateininnovationperformance(2.8%)ofthetopfourcountriesbetween2008and2012.
MeetingCopenhagen’sgreeneconomyobjectivesisabusinessopportunityforDanishfirms.Nordhavnenisamajorurbandevelopmentwhichwillcreate3-4millionsquaremetresofresidentialandcommercialspaceoverthenext50years.Itintendstobealeadingmodelofintegratedurbandesignandatestbedofgreeninnovation,includingenergystorage,smartgrids,andenergyefficiencytechnologiesforbuildings.
DevelopingclimateresilientinfrastructureinCopenhagenisanopportunityforinvestmentrequiringpublic-privatepartnerships.
TheCopenhagenCleantechCluster(CCC)isoneoftheworld’sleadingorganisationsforbuildingnetworksandpromotingcommercialisationofgreengoodsandservices.TheCopenhagencleantechbrandisusedbybusinessandgovernmentintheirexportandinternationalisationactivities.
Despitetheglobaldownturn,Copenhagen’scleantechsectorhasperformedstronglyoverthepastdecade.Greenexportsfromthecapitalregionincreasedby77%between2004and2009,withanaverageannualgrowthofaround12%.Productivityratesinthecleantechsectorweresubstantiallyhigherthaninmanufacturingandwelfaretechnologybetween2003and2009.
Accordingtothe2013EuropeanClusterExcellenceScoreboard,thecleantechindustryinCopenhagenhadthehighestrevenuegrowthof10industryclustersacrossEurope,andwassecondhighestforoutputandprofitgrowth.
Atthenationallevel,2010turnoverincleantechwasoverDKK250billion(US$46billion),representing9.2%ofthenationaltotal;accountingfor10.4%oftotalDanishexports;andemployingmorethan105,000peopleor8.5%ofemployeesinDanishenterprises.
AlthoughCopenhagen’scleantechsectorisstronginternationally,areasforpotentialimprovementexist.Comparedagainst10Europeanindustryclusters,growthinemploymenthasbeenaveragewhilethegrowthinnewproductsandserviceswaslowerthanalltheothers.Furtherresearchinthisareaisrecommended.
ChallengesfacinginnovationandgreenbusinessinCopenhageninclude:barrierstoattractingprivateinvestmentatscaleforlow-carbontechnologyandresilientinfrastructure;insufficientinformationforinvestors,entrepreneursandthecitygovernmenttomakeeffectiveinvestmentandbusinessdecisions;andthegrowthincompetitionininternationalmarkets.
TheCityofCopenhagenwillneedtodevelopstrategicresponsestothesechallenges.Potentialstrategiesincludemechanismstoaggregatesmallandfragmentedprojectsthatcanattractprivatefinanceatscale;moreeffectivedatacollection;andafocusongreenproductsandserviceswhereCopenhagenandDenmarkhaveacomparativeadvantageinternationally.
TotalspendintheCityofCopenhagenisaroundDKK9billion(US$1.6billion)annually,andgreenprocurementisattheheartofitspurchasingstrategy.ThecityhasaninnovativeDKK595million(US$110million)contractforsmartstreetlampmanagement,whichcouldreduceenergyconsumptionby57%.Thepotentialforgreenprocurementtosupportinnovationandgrowthshouldbeexploredfurther.
6 Innovationandbusiness Innovation is one of the eight drivers of an urban green economy (Chapter 2). Chapter 3 showed that Copenhagen has high levels of overall innovation against global benchmarks, making the city a knowledge-led economy. Chapters 4 and 5 went on to discuss the potential for Copenhagen’s policy programmes to foster green innovation in particular sectors, for example in decarbonising the energy supply and shifting mode share towards low-carbon mobility options. In this chapter, we examine the role of the private sector, public research, and the efforts in Copenhagen to increase public private collaborations for stimulating green innovation and contributing to the city’s position as a leading green growth economy. This includes targeted policies for green growth R&D and skills development; the role of clustering and knowledge platforms for creating networks and internationalising Copenhagen’s green business successes ; and leveraging large urban development projects, investment in climate resilient infrastructure, and public procurement to create cleantech business opportunities and public-private partnerships.
The chapter examines Copenhagen’s policy environment for green innovation and evidence of the strength of Denmark’s and Copenhagen’s economy in terms of turnover, export and employment growth in the cleantech sector over the past decade. It concludes by identifying opportunities and barriers related to finance, information and knowledge sharing, and procurement which can lead to greater levels of innovation and a more dynamic market for cleantech goods and services.
6.1 Green innovation and economic growth
Innovation of all types and across all sectors raises productivity levels through advances in technology, leading to higher growth and consequently higher wealth levels. In an urban green economy, policies for stimulating all types of innovation – whether or not they have positive or neutral environmental outcomes - should be encouraged in order to drive economic growth.In addition to providing policy support for overall innovation growth, governments have a role in supporting green innovation specifically. Green innovation is a particularly powerful driver of growth. As well as contributing, like all innovation, to total factor productivity in the short to medium term, green innovation is also necessary for the transition to a low-carbon, resource efficient economy – one that delivers higher rates of growth over the long term.
The transition to a green economy requires a comprehensive global shift to new and improved technologies in key sectors such as power generation and distribution, energy use and transport (Stern 2006). In cities, examples of this include the development of smart electricity grids, energy efficient heating for buildings, clean vehicles and electro-mobility. While the private sector plays a leading role in technology development, a range of market failures reduces the rate of innovation in the absence of targeted policy measures.
A major barrier affecting innovation in green city infrastructure is that new technologies may not become cost effective until a substantial investment has been made and experience developed. The upfront capital and learning time required, together with uncertainties over future costs, product prices and competing technological developments, may result in firms waiting until a new technology has already been deployed and proven in the market. This can lead to ‘lock-in’ of existing technologies even if the effectiveness and cost efficiency of new, green technologies would be greater in the long run.
Free-riding is another barrier to innovation. Information is a public good, and once an idea has been created, the cost of spreading it (‘knowledge spillovers’) is very low. This means that an individual company may be unable to capture the full economic benefit of its investment in innovation. Although intellectual property rights (IPR) reduce an individual firm’s risk-to-return ratio, IPR is not always straightforward to enforce.
Innovation may also be hindered when the long-term returns are greater socio-economically than for individual firms. Individual firms tend to focus on private costs and benefits and private discount rates to maximise short-term profits for their shareholders. Unless consumer demand through, for example, environmental awareness, is sufficiently strong to impact on these short-term decisions, companies have little incentive to factor climate change or environmental costs into their investment decisions. Policy intervention in this case is justified because of the increased socio-economic benefits resulting from higher long-term sustainable growth.

143Innovationandbusiness142
National, regional and city governments can boost innovation using a range of policy instruments, including planning and regulation, carbon pricing, public funding and public procurement. In particular, city policy programmes can be used to support R&D and demonstration projects, as well as funding and leveraging early stage commercialisation investment. Governments can also address institutional barriers to innovation, particularly by fostering public-private partnerships that share knowledge, ideas, skills and financial risk.
6.2 Policy programme
6.2.1 Strategic policy for innovation
Innovation is a central part of the City of Copenhagen’s Municipal Master Plan 2011, ’Green Growth andQualityofLife.’ThePlan’svisionincludesafocusonbusiness,innovation,andknowledgewhich prioritises knowledge and research-intensive economic sectors:
Copenhagen-Malmö should be Scandinavia’s business hub …The main focus is on enterprises in growth sectors, such as the cleantech, life science, and creative, maritime and business service trades and information and communications technologies. The Øresund Region is Europe’s largest university region and it should be known for its good study environments, high research quality and fruitful collaboration with the business sector (City of Copenhagen 2011b).
The Plan identifies challenges related to innovation such as retaining and increasing levels of highly educated labour, and collaboration between businesses and universities. Key policy responses include a focus on education and improving the physical framework for business growth.
Copenhagen’s active promotion of its green growth agenda, and engagement in international networks and forums, are also viewed by the city as effective tools for attracting and developing knowledge and resources. For example, Copenhagen chairs the Green Growth Network of the C40 Cities for Climate Leadership, a collaborative platform of large cities globally to address urban-based carbon reductions and climate resiliency (see Box 6.1 below). It is also host to the Secretariat of the Global Green Growth Forum (3GF). This is an initiative of international governments (Denmark,Korea,Mexico,China,Kenya,andQatar),sectorexperts,andbusinesseswhosemissionis to bring parties together in order to intensify large-scale public-private action to accelerate the transition to a green economy (Global Green Growth Forum No date). Lastly, Copenhagen is the 2014 European Green Capital, an initiative of the European Commission to recognise leadership in transitioning towards a green economy. In choosing Copenhagen, the selection panel concluded that:
“Copenhagen is a highly successful role model for the green economy, with an efficient communication strategy and the commitment required to develop its role as a model for Europe and beyond” (European Commission 2013b).
Box 6.1: C40 Cities for Climate Leadership - Finance and Economic Development Initiative
TheC40isaglobalnetworkof67largecitieswhoseprincipleaimistosharebestpracticesandideasamongstcitygovernmentsinordertoaddressclimate,carbon,andresourcesissues.C40citiesaregloballeadersinmeasuringthebroaderenvironmental,health,andsocialimpactsofclimateaction,andinapplyingthisinformationtoestablishtheeconomicrationaletoundertakegreenpolicies,drivegrowth,andmakeasignificantimpactinreducingglobalgreenhousegasemissionsandclimaterisks.Launchedin2012,C40’sGreenGrowthNetwork(oneoftwonetworksunderitsFinanceandEconomicDevelopmentInitiative)has,asoneofitskeyareasoffocus,howGreenEnterpriseDistrictsorGreenClusterInitiativescanbeusedastestbedsforinnovationandgreeninvestment.
The Hovedstaden (Capital Region) government also places innovation at the centre of its economic strategy, with its overall vision being:
‘The Capital Region is the most global and competitive metropolis of Northern Europe where people and enterprises in innovative partnerships convert knowledge, welfare and sustainability into growth’ (Growth Forum for the Capital Region 2011).
Innovation is seen as important for both technology-led private businesses and also for improving public sector service and welfare provision. The Copenhagen Capital Region focuses specifically on raising education levels even further, commercialising knowledge, and strengthening the life sciences and pharmaceutical sectors in the context of growing global competition. In order to improve its ‘outcome’ measures of innovation, the Capital region has set quantitative targets for increasing the number of patent applications; the share of enterprises collaborating with educational and research institutions; and share of employees in private sector enterprises with at least medium-term further education (Growth Forum for the Capital Region 2011).
At the national level, the Danish Ministry of Higher Education and Science is the lead agency for innovation and research. Development of strategy and implementation of programmes and grants is supported by a network of councils and commissions, for example Council for Research Policy, Council for Strategic Research, Industrial PhD Programme Committee, and more. Additionally, the Danish Agency for Science, Technology and Innovation manages programmes which promote cooperation and interaction between companies and knowledge institutions.
The Danish Government’s latest innovation strategy - ‘Denmark - a Nation of Solutions’ - aims to “ensure that the substantial public investments in research, innovation, and education will translate to more growth and job creation.” The government sees innovation as a key strategy for responding to the challenges of raising economic productivity, growing global competition and low growth since the 2009 economic crisis. The strategy has three main areas of focus:
1) Innovation driven by societal challenges
2) More knowledge translated to value
3) Education as a means to increase innovation capacity
(Danish Ministry of Science Innovation and Higher Education 2012a)
It includes a number of targets and specific actions and forecasts through to 2020. Fulfilling them will require the number of innovative enterprises to increase by 15%, and the number of employees in the private sector with a higher education degree to increase by 28%. It aims for Denmark to be among the top 5 OECD countries on a number of key innovation indicators (Danish Ministry of Science Innovation and Higher Education 2012a). Figure 6.2 shows these indicators and the gap from current performance.
ParticipantsintheGreenGrowthNetworkrecognisethattheprojectsandpoliciesthatwillmakecitiesmoresustainablealsohavemanyadditionalbenefits,includingeconomic,social,andquality-of-lifeenhancements.Methodologiestomeasurethesebenefitsarepartoftheetwork’sactivityandCopenhagenisChairofthenetwork.
“We all need to become more strategic in our work with private companies and green clusters in order to determine and highlight the economic rationale for green policies. This is one of the main purposes of the C40 Green Growth Network: To show that economic growth and environmental sustainability can go hand in hand...It is my belief that the C40 constitutes the ideal platform for megacities of the world to demonstrate that cities are in fact the main engines in the global transition to a green economy.”
— Lord Mayor of Copenhagen, Frank Jensen
Inearly2014,CopenhagenLordMayorFrankJensenwaselectedtotheSteeringCommitteeofC40.Hewillrepresentthe19C40Innovatorcities,whichhaveshownclearleadershipinenvironmentalandclimatechangework.
Source:C40CitiesforClimateLeadership(Nodate)

145Innovationandbusiness144
Figure 6.1 Five key indicators for innovation
Source:DanishMinistryofScienceInnovationandHigherEducation2012a
To meet the innovation challenge, the Danish research agenda has been formulated through an extensive stakeholder process, led by the Ministry of Science, Innovation and Higher Education and involving other government ministries, research councils, universities, industry, and interested organisations. This stakeholder process involves presenting a list of research priorities to the Danish Parliament every four years. Starting in 2011, all stakeholders then contribute suggestions on important research themes to 2020 that will encourage business formation, productivity, and economic growth and at the same time address societal challenges.
The result of this exercise was the RESEARCH2020 catalogue, which established various research priorities, including:
1) Future energy technologies and systems – energy efficiency and renewable energy technologies and systems which may contribute to meeting rising global energy demands, contribute to security of supply and limit the negative environmental consequences associated with the production and consumption of energy.
2) Environmental management, and water and resource management - technologies and solutions to reduce resource consumption, promote a cleaner environment and improve health, both globally to create export opportunities for Danish businesses and nationally to further deliver a cleaner and healthier environment in Denmark.
3) Future climate change and adaptation - create new knowledge about, and reduce uncertainty regarding, climate change and its effects and strengthen the decision-support capacity for climate adaptation.
4) Bio-resources, food, and other biological products – research to promote the use of, and develop resources for, safe and healthy food and bio-based materials production (as substitutes for fossil fuel derived ones) to meet growing global population projections.
(Danish Ministry of Science Innovation and Higher Education 2012b)
6.2.2 Green Urban Development: Plan for Nordhavnen
Alongside local and national policies for green growth, changes to Copenhagen’s physical fabric are an opportunity to use public-private partnerships to realise innovation in green urban development. Nordhavnen (North Harbour district) is an industrial waterfront area to the northeast of central Copenhagen (Figure 6.3) where a new city district providing housing for 40,000 people and an equal number of workplaces will be built over a 50 year period (CPH City & Port Development No date). This is the largest urban redevelopment project in Scandinavia with the potential to accommodate a significant portion of Copenhagen’s planned growth over the period. As such its success in delivering integrated sustainable design will be closely scrutinised.
Figure 6.2 Nordhavnen (left, existing land area, outlined in white; right, rendering of realised plan with additional green space from reclaimed land)
Source:COBENodate
The master developer for the area is CPH City and Port, of which the City of Copenhagen owns 55 percent and the Danish government (through the Ministry of Transport) 45 percent (CPH City Port & Development 2012b). CPH City and Port operates as a business and generates revenue from maritime activities in Nordhavnen and elsewhere in Copenhagen, and from land sales. Sales and construction commenced in Nordhavnen in 2011.
Following a design competition, the master planning for Nordhavnen was awarded to the firms COBE, Sleth, Polyform, and Ramboll in 2009.The overall master plan is built on six core principles:
• isletsandcanals–Nordhavnenwillbeawatersidedistrictcharacterisedbyitsaccesstothesea and small waterways bisecting the district;
• identityandhistory–maintainingarangeofexistingbuildingswhichcanbere-purposedand tell the story of Nordhavnen’s past uses;
• five–minutecity–amixed-usedistrictwithlocalamenitiesandtransporthubswithinafive- minute walk for residents and visitors;
• blueandgreencity–extensiveecologicalandrecreationalspacestocreatealiveableand climate-resilient district;
• CO2friendlycity–theuseofbuildingstandardsandlow-carbonenergysupplynetworksto achieve carbon neutrality; and
• intelligentgriddesignconditionsthatareflexibleovertimeandthatemphasiseopenspace, liveable densities, mixed-sized parcels and permeability and short distances between blocks.
Source: COBE No date
The scale of the project, and its ambition to serve as a laboratory for testing green city solutions, requires collaboration between the local and national government, utilities and private businesses. For example, in addition to the use of district heating, applications for district cooling, distributed solar energy, electric vehicle charging, and district-scale heat storage and geothermal energy are all expected. Agreements between the City of Copenhagen, the publicly-owned utilities, and DONG Energy are in place to deliver these.
The transport priorities for Nordhavnen reflect goals for the city as a whole: trips will be equally divided between public transport, bicycles, and cars. Nordhavnen will be connected to the Copenhagen Metro by two stations initially. The master plan calls for the main traffic artery within Nordhavnen to be a ‘green loop’ – a combination of super-bicycle path and public transport right of way, starting and ending in Århusgade (Figure 6.4). This loop will cover the entire district so that there will never be more than a 400-metre walk to public transport (the ‘5-minute city’ principle).

147Innovationandbusiness146
Figure 6.3 Nordhavnen Green Loop – in plan on left, with image of proposed elevated public transport right-of-way on right
Figure 6.4 Nordhavnen Metro extension – City Ring line in blue, Nordhavnen spur and planned stations in dark green, and potential future extension to the ‘Green Loop’ in light green
Source:CPHCityPort&Development2012b
Source:CPHCityPort&Development2012b
The extension of the Copenhagen ‘City Ring’ Metro via a spur to Nordhavnen was agreed at the end of 2012 (Figure 6.5). The cost of the extension is DKK 2.3 billion (US$0.4 billion). The stakeholder agreement is between the City of Copenhagen, Department of Transport and Frederiksberg. It requires Metroselskabet (the Copenhagen metro operator) to contribute DKK 1.1 billion (US$0.2 billion) through fare revenue, while the master developer CPH City & Port Development contributes DKK 900 million (US$165 million). The remaining DKK 300 million (US$55 million) is shared between the City of Copenhagen and the Danish Government (CPH City Port & Development 2012a). The contribution from CPH City & Port Development is being financed through its land sales.
6.2.3 Enterprise: Copenhagen Cleantech Cluster
Clustering is another priority area for Copenhagen to foster green innovation and economic growth. Copenhagen is a world-leading business hub for the cleantech sector. Its strong base of skills base, level of investment in research, collaborative institutions, and export-oriented companies have contributed to this positioning.
Research has shown that firms that are part of a cluster are more likely to make investments in skill upgrading and research, despite the ‘slippage’ of benefits this creates through a deeper local knowledge base and knowledge spill-overs that benefit other companies as well. They are more likely to collaborate with suppliers, service providers, and research institutions to upgrade overall processes along the value chain and develop new products and services. Within the industries of a cluster, new entrants are more likely to pursue niche or related products and services rather than competing head-on with incumbent rivals, which holds certain advantages for dynamic innovation for all cluster participants (C. Ketels and S. Protsiv 2013).
Nurturing these ‘industrial ecosystems’ and knitting together ideas, technology, and services is the aim of the Copenhagen Cleantech Cluster (CCC), which began in 2009. The CCC was launched by Danish cleantech companies, research institutions, and public organizations. Its seed funding of DKK 142 million (US$26 million) came from Capital Region of Denmark, Region Zealand, and the European Union Structural and Cohesion Funds (Copenhagen Cleantech Cluster No date). At its launch it established a number of goals, including the creation of 1,000 new jobs in the cleantech sector; attracting 25 foreign companies to the cluster; and facilitating
the growth of 25 cleantech entrepreneurs. It also works to promote collaboration between public, research and private partners, and foster innovation in procurement.
The seed funding expires in 2014 but CCC will continue as an independent NGO, supported by its private, research, and public-sector members (Copenhagen Cleantech Cluster 2014b)2.
The CCC’s operations are organised around three principle activities:
1) The management of innovation platforms, which are demand-driven forums aimed at generating business opportunities to address societal challenges.
2) Gateway services for internationalisation, to help Danish companies reach global markets.
3) Linking firms, entrepreneurs, and investors through events and matchmaking activities.
Given the relatively small local and national market available to Danish firms, exports are critical to both firm and national growth, particularly in high capital and emerging industries. To support its internationalisation focus, the CCC has co-founded and manages the International Cleantech Network. This is an international collaborative platform involving 13 cleantech cluster organisations in Europe, North America, and Asia. Its mission is to create direct value for stakeholders located in the clusters (e.g companies, knowledge institutions and local authorities) through international collaboration in order to enhance their competitive advantage in global competition (International Cleantech Network No date).
Another internationalisation initiative of the CCC is Complex Cleantech Solutions (CCS), a special project financed by the Danish Industry Foundation. CCS’ mission is to support Danish companies in bringing their clean technology solutions to city projects around the world. Its approach is to look at integrated solutions to problems associated with urbanisation and high population growth, particularly in emerging economies. Thus it seeks to leverage Danish competencies and technologies in areas such as water systems, wind energy, smart grids, smart city solutions, and waste disposal systems and to promote collaboration in these areas. Projects are structured to involve local stakeholders in order to obtain co-creation and a bridge into emerging green markets. CCS has initiated water quality projects in India for Mumbai’s Mithi River, eco mobility in Milan and clean and efficient power for public buildings in Dakar.
Lastly, CCC is seeking to bring innovation to public-private sector collaboration and procurement, which will be necessary if cities are to meet policy goals for green economic growth during a period of public sector austerity. An example of this is a project currently being led by the CCC for developing a ‘big data’ platform, with identified public and private benefits. The aim of this initiative is to help develop new markets for sale of big data and big data-based end-user applications in order to facilitate new and independent cleantech solutions that, at least partly, serve the public interest by providing savings, efficiency, and environmentally beneficial solutions for cities.
CCC is procuring a data platform through a competitive tendering process. Funding for the scoping and procurement exercise, the data platform itself, and contractor management is being provided by the City of Copenhagen, the Capital Region of Denmark, and the private foundation Realdania. ThetotalallocationisapproximatelyDKK14million(US$2.6million)(BrianValbjørnSørensenHead of Secretariat - Copenhagen Cleantech Cluster 2014). In exchange for their funding, both the city and regional governments require pilot applications in areas such as electricity consumption, mobility and traffic. They will also work with the contractor to provide data sets that will be managed and analysed through the platform (Copenhagen Cleantech Cluster 2013; Copenhagen Cleantech Cluster 2014a).
The initiative is being structured as a two-stage tendering process. It is consistent with EU procurement rules, though utilises a less commonly applied dialogue process with the individual shortlisted bidders. During this dialogue, prospective solutions can be explored in a structured framework of presentations and workshops involving the public and institutional stakeholders and the technology solution providers. The ideas generated from this dialogue are then fed into a final RFP for the shortlisted parties to respond to.
The final contract is due to be awarded in mid-2014. Platform development will take place over the following year, within a five-year total contract for ongoing development, application, and management of the platform. At the end of the contract, the data platform needs to be sufficiently
2InMay2014,amergerwasannouncedbetweenCCCandtheDenmarkLeanEnergyCluster,acollaborativeorganisationofbusiness,researchinstitutionsandgovernmentfocusedonmoreefficientuseofenergy

149Innovationandbusiness148
advanced so it can be maintained as a ‘stand-alone,’ (i.e. not requiring ongoing public funding) solution - one that contributes to building the market for data applications, and where the data is publicly available to all interested parties on fair, reasonable and non-discriminatory terms and conditions.
The collaborative process used to design the big data platform project and to procure the solution offers several advantages as compared to typical public tendering exercises. Firstly, it creates a platform for bringing together research ideas, public policy objectives, and commercial innovations, allowing concepts to be shared and refined prior to issuing a full project brief. This helps align the public’s objectives with the commercial sectors’ appetite for risk. Using a non-political organisation like the CCC offers a ‘neutral-ground’ for problems and approaches to be discussed, and utilises technical and management resources which may not be freely available within government organisations for this type of tendering process. Moreover, the cost sharing and resource commitment from multiple sources reduces the financial risk to any one party while creating leverage for a more substantial end-product. The pilot initiatives required by these funders in exchange for their financial support in effect creates a minimum product development brief for the solution provider, but leaves room for greater functionality to meet the needs of a wider market.
Box 6.2: Smart City Solutions
Copenhagenisaleaderinpursuingsmartcitysolutionstosolvemunicipalmanagementproblems,improvequalityoflife,andmeetitscarbonandclimatetargets.(SeeBox4.3.andSection6.2.5forexamplesofsmartcitysolutionsinwastewaterandstreetlightingrespectively).Infact,thecountryishometo22%ofallEuropeansmartgridtestanddemonstrationprojects.
Theexceptbelowfroma2012reportDanishSmartCities:sustainablelivinginanurbanworld,publishedbytheCopenhagenCleantechCluster,showstherangeoforganisationsandinstitutionsbasedinDenmarkwithastrategicfocusonsmartcitysolutions.(Thelistisnotexhaustive).
Source:CopenhagenCleantechCluster2012

151Innovationandbusiness150
6.2.4 Adaptation and resilient infrastructure
As the risks from extreme weather events in Copenhagen are becoming increasingly clear, another area where innovation in municipal planning and budgeting, and effective public and private collaboration is required, is stormwater management. Major flooding events in the summer of 2010 and 2011 were a stark reminder to citizens of the costs and inconveniences associated with these events, which are projected to increase and become more severe as a result of climate change. City attention has in fact been shifting for several years in this direction: the Copenhagen Climate Adaptation Plan approved in 2011 (with its primary focus on stormwater and sea level rise and secondary focus on the urban heat island effect and groundwater resources), and the 2012 Cloudburst Management Plan both provide detail on how costs and available resources can be spread amongst multiple parties to address these challenges.
The plans recognise that the responses required – principally increasing ‘green’ and ‘blue’ infrastructure to manage and retain stormwater flows - will mean more surface conveyance and retention of water in the future, and less reliance on subsurface systems. This creates challenges in governance and responsibility for the infrastructure, together with shifts in who pays and how investments are financed. Some examples of these challenges are given below:
• Roadwayswillneedtobedesignedtoplayagreaterroleinwatermanagement,whichcreates jurisdictional / operational issues between utility companies that have overall responsibility for stormwater management through their operational charters (which in Copenhagen is across the wider metropolitan region); and municipalities that are responsible for road design and maintenance (but only within their boundaries, which water flows could cross). To make the necessary investments, changes in city operating and capital budget setting are required, as is the need for cross-border collaboration.
• Forutilitycompanies,whicharepublicly-ownedbutoperateascorporations,investmentscanbe recaptured through charges set by regulators and paid by ratepayers. This repayment mechanism ensures a dedicated income stream to fund long-term borrowing (up to 40 years) at attractive rates. The regulatory environment is enabling a shift away from ‘grey’ towards ‘blue and green’ infrastructure, but it is a shift that has only just begun and one that will require better tools for risk and cost / benefit assessments.
• Lastly,privatepropertyownerswillneedtotakeactiontomakeindividuallot-levelchanges such as backflow valves and stormwater resilient roof and ground vegetation. Incentives from government, utilities, or insurers may accelerate these much-needed investments, but costs are presently borne in full by owners.
The Copenhagen Cloudburst Management plan offers an estimate of the investment required and cost-sharing to meet the plan’s objectives over a 20-year timeframe (Figure 6.6).
Figure 6.5 Overview of level of investment resulting from the Cloudburst Management Plan during three periods: up to 2016, up to 2025, and overall up to 2033Allpricesare2012figures,withoutdiscountingandexclusiveoffinancingchargesandVAT.(DKK3.8billion=US$0.7billion)
Source:CityofCopenhagen2012a
As most adaptation expenditure is inherently about creating defensive measures in the hope of avoiding losses, it is very difficult to know how to price these measures. Tools that can help define the optimum time of investment, the level of investment, the size and frequency of the damage, and how investments are funded and managed are of great value. For this, the City of Copenhagen is partner to a project called ‘RiskChange’ being led by the Danish Strategic Research Council. Other partners include several academic / research institutions, the Danish Meteorological Institute, and the risk and assurance consultant DNV GL.
A second initiative to address cost and risk is an EU funded project called ‘Aqua-Add’. This partnership project involving several local and regional governments and research institutes focuses on the ways in which adaptation measures influence the built environment. The overall aim is to improve participating governments’ strategies and instruments for better implementation of water management in spatial planning and to raise stakeholders’ awareness of the added value of water. One outcome for Copenhagen is the development of a GIS-based decision support tool. Using one Copenhagen neighbourhood as a case-study area (Sct Kjelds Kvarter), the tool will provide spatially explicit information (bound within a cost / benefit assessment) on the added value derived by citizens and the municipality from investments in ‘blue and green’ infrastructure. The premise is that these infrastructure assets, whether publicly or privately funded and located, can positively impact property and quality of life values, and be quantified as part of the financial benefits from mitigating climate impact risks.
6.2.5 Green procurement
With more than 40,000 employees, the City of Copenhagen is Denmark’s largest enterprise. Annually, the city spends roughly DKK 9 billion (US$1.6 billion) (European Commission 2013c). Thus its operational footprint can shift the market toward goods and services that meet environmental and sustainability objectives. In fact, in 2011 Copenhagen City Council adopted a new procurement policy for 2011 to 2014, which includes the EU definition of green public procurement. Environmental considerations are now used as a parameter for all tendering procedures for products and services (European Commission 2013c).
One example of this is in food supply, where the City of Copenhagen set an initial goal of procuring at least 75 percent organic food in 2012. This target was met and it now aims to procure 90 percent organic food by 2015 (Figure 6.7) (City of Copenhagen 2012c).
This organic purchasing objective is seen as an important source of creating food literacy among children and young people, and for promoting healthier eating amongst the population in general. Increasing the demand for organic food is also viewed as a tool in maintaining groundwater quality in areas adjoining Copenhagen, as the organic goal is coupled with initiatives to source locally.
Figure 6.6 City of Copenhagen, percentage of organic food in all municipal institutions and kitchens
Source:CityofCopenhagen2012c

153Innovationandbusiness152
To meet Copenhagen’s 2025 carbon-neutral plan, 2% of total carbon savings will come from municipal initiatives. Procurement related actions to meet this are principally directed at Copenhagen’s vehicle fleet and the buildings it owns and occupies. Targets for 2025 include:
• Energyconsumptionincityadministrationbuildingswillbereducedby40%compared to 2010
• Municipalnewbuildsupto2015willmeettherequirementsforthe2015buildingenergy classification, and new builds up to 2020 the 2020 classification
• Allcityadministrationvehicleswillrunonelectricity,hydrogen,orbiofuels
• Energyconsumptionforstreetlightingwillbereducedbyhalfcomparedto2010
• 60,000squaremetresofsolarcellpanelswillbeinstalledonneworexistingmunicipal buildings (City of Copenhagen 2012b).
For the street lighting target, Copenhagen has created an innovative public-private partnership agreement designed to reduce lighting energy consumption and promote ‘smart city’ solutions for the municipality. In late 2013, a DKK 595 million (US$ 110 million) contract was signed with the French urban lighting and electrical company Citelum, its Danish subsidiary, the Danish energy group SEAS NVE, and ICT network solutions provider Silver Spring Networks. The contract period is for 12 years, with a potential three year extension (Danish Ministry of Foreign Affairs 2013). It requires the consortium to replace half of Copenhagen’s existing street lights with high-efficiency LEDs and provide maintenance services throughout the life of the contract.
The replacement will be rolled out over an initial 26 month period beginning in early 2014. In total, 20,000 lights and 8,000 lamp posts will be affected (Citelum No date). Silver Spring Networks will use the physical lighting infrastructure as a host for hardware to support a wireless network. The network’s primary function is to create better controllability and diagnostics for the lighting network, e.g. time of day dimming, knowing when a lamp needs replacing or has been subject to power failure or damage, etc. Coupling this level of information with the new lamps will help save on operation and maintenance costs. Copenhagen projects a 57% energy saving compared to 2010 as a result of this contract (Citelum No date). The contract also presents the opportunity in the future to scale the wireless network off this infrastructure to handle other municipal functions that could be incorporated into a smart grid. While nothing has been confirmed, future options may include traffic signal controls, parking meters, or water, gas, and electricity meters (Greentech Media 2013).
In a similar assessment undertaken by the European Commission and presented in its 2013 Innovation Scoreboard, Denmark ranks third out of the EU 27 countries (European Commission 2013d). The framework is slightly different from the GII and is based on:
• Enablers–humanresources;open,excellent,andattractiveresearchsystems;andfinance and support
• Firmactivities–firminvestments;linkagesandentrepreneurship;andintellectualassets
• Outputs–innovators;andeconomiceffects
In its summary of Denmark, the European Commission writes:
‘Relative strengths are in Open, excellent and attractive research systems, Linkages and entrepreneurship and Intellectual assets. Relative weaknesses are in Human resources and Firm investments. For sales of new-to-market and new-to-firm innovations growth has been highest for all Member States and growth was also high for New doctorate graduates.’ (European Commission 2013d)
Of the four countries that this assessment lists as EU Innovation Leaders (including Sweden (1st) Germany (2nd), and Finland (4th), Denmark shows the strongest growth in innovation performance between 2008 and 2012. Its rate of 2.8% is one point higher than the four-country average.
6.3 Impacts
6.3.1 Research and Innovation
Denmark and Copenhagen rank consistently highly on research and development and innovation rankings and matrices. This is a testament to the advanced skills and knowledge base, high investment levels, effective policy setting and governance, and sustained business performance factors present. For example, Denmark ranks ninth out of 142 countries assessed in the 2013 Global Innovation Index (GII)3. This assessment is based on a range of input and output indicators – 84 in total – and shows the breadth of factors that contribute to firm and product innovation across the economy (Figure 6.8).
Figure 6.7 Framework of the Global Innovation Index
Source:S.DuttaandB.Lanvin2013
3TheGIIisproducedthroughcollaborationbetweenCornellUniversity,INSEAD,andtheWorldIntellectualPropertyOrganization(WIPO).TheoverallGIIscoreisthesimpleaverageoftheInputandOutputSub-Indices.TheInnovationEfficiencyRatioistheratiooftheOutputtotheInput-ineffect,ameasureofhowmuchinnovationoutputisbeingdeliveredperinput.

155Innovationandbusiness154
The strength of Copenhagen’s institutional and research factors can be seen in both the city and region’s higher education sector, which is contributing significantly in the field of energy and climate. Examples include:
• TheTechnicalUniversityofDenmark(DTU):theDTURisøNationalLaboratoryfor Sustainable Energy undertakes highly specialised research in fields such as renewable energy, biofuel, electrical vehicles, smart grids, energy technology, energy planning and energy systems of the future. The university’s Green Entrepreneur House at DTU’s Scion campus offers physical facilities for start-ups such as incubation spaces, access to the prototype workshop, and to testing and demonstration facilities at the various DTU campuses. Working with the Copenhagen Cleantech Cluster, plans have been formulated for a ‘CleantechDemonstratorium’atDTURisøcampustosupportthedevelopmentofDanish cleantech businesses; and to help attract the R&D units of international cleantech businesses to the proposed Science Park on the campus.
• TheUniversityofCopenhagen:theUniversityofCopenhagenisthehighest-rankeduniversity in Scandinavia according to the 2008 Academic Ranking of World Universities. The university undertakes climate research within Earth System Science, global warming and agriculture, and environmental and food safety, amongst other subjects.
• UniversityofRoskilde(RUC):amongitsspecialitiesRUCundertakessignificantresearchin algae for biofuels, in collaboration with the Municipality of Lolland. RUC is also a partner in the Danish incubation institute, CAPNOVA.
• CopenhagenBusinessSchool(CBS):CopenhagenBusinessSchoolisoneofthethreelargest business schools in Europe. In 2009, it launched the CBS ‘Climate Strategies for Business’ initiative to produce valuable research and business students in order to meet the climate challenge.
Additionally (though located outside the region), Aalborg University is host to the Sustainable Energy Planning and Management Research Group. It has a long standing record of policy research and design of Danish energy policy (production and conservation) at both local and national levels. It provides energy system analysis, as well as feasibility studies and public regulation in the face of technological change.
Box 6.3: Climate-KIC Nordic Centre at Technical University of Denmark (DTU)
Climate-KICisoneofthreeKnowledgeandInnovationCommunities(KICs)createdin2010bytheEuropeanInstituteofInnovationandTechnology(EIT).TheCommunitiesbringtogetheracademicinstitutions,thepublicsector,andinnovativecompaniestogenerateeconomicallyviableproductsandservicesoutofresearchknowledge.TheClimate-KICseekstodevelopsolutionsaroundeightclimatechangethemes:
DTU’sLyngbycampus(15kilometresnorthofCopenhagen)isthehostofthisnewestKICregionalcentre,inauguratedinFebruary2014.AdditionalpartnersintheKICinclude:
• UniversityofCopenhagen
• ChalmersUniversityofTechnology(Gothenburg,Sweden)
• CityofCopenhagen
• Grundfos(Pumps)
• VELUXGroup(Windowsandskylights)
• COWI(Consulting)
• Novozymes(Biotechnology)
• Realdania(Philanthropicorganisationfocussingonthebuiltenvironment)
• ROCKWOOL(Insulation)
Sources:(Climate-KICNodate;DTU(TechnicalUniversityofDenmark)Nodate)
• Greenhousegasmonitoring • Adaptationservices
• Makingtransitionshappen • Sustainablecities
• Thebuiltenvironment • Landandwater
• Resourceefficiency • Developingabio-economy
6.3.2 Green Business
The global cleantech sector is growing. In its Global Cleantech Report 2012, the Copenhagen Cleantech Cluster estimates the total value of the global market will grow from a 2010 base of US$47 billion to $160 billion by 2015, with a compound annual growth rate (CAGR) of 28% (Complex Cleantech Solutions 2012). The report defines the sector as goods and services in:
• Buildingefficiencymaterials
• Smartgrids
• Cleanwater
• Solidwaste
• Cleanroadtransport(electricvehiclesandplug-inhybridelectricvehicles)
• Onshoreandoffshorewind
• Solarphotovoltaics
• Geothermalenergy
• Biomassenergy(electricityproductionandbiofuel)
Of these, building efficiency materials, smart grids, and offshore wind will be the largest sub-markets.
Other studies take a narrower view of the market and its value. For example, a 2011 report from the European Commission entitled A Roadmap for moving to a competitive low carbon economy in 2050 estimates the additional investment required in energy supply, distribution, end-use efficiency, and vehicle electrification to meet the continent’s 80% CO2 reduction by 2050 at roughly

157Innovationandbusiness156
€3billion(US$4.1billion)peryearforthenext40years.Thiswilladdcostsof1.5%ofEUGDPto current expenditure in these sectors (presently at 19% of GDP). According to the European Commission, the costs will be more than offset by the value of the fuel savings and resultant net job creation (European Commission 2011).
Attempts have been made to quantify the local green growth impacts in terms of jobs and business performance in Copenhagen. In 2011, the Green Growth Council (a Copenhagen NGO comprising of industry and government partners) commissioned the research and economics consultancy DAMVAD to prepare a report, Green Growth in Copenhagen. In its quantification, DAMVAD captured company and turnover data based on industrial classification reporting figures. It defined green growth companies as those active in:
• EnvironmentalProtection-technologies,productsandservicesforpreventingimpactsfromor improving emissions, waste and sewage, soil- and groundwater pollution, noise and vibration, soil erosion, salinity, and biodiversity and landscapes.
• ResourceManagement-technologiesandproductstocontroltheuseofand/orprotectnatural resources against exploitation, both through preventive and regenerating activities as well as through surveillance and control.
The report recognises that firms derive varying degrees of their turnover from green growth goods and services. Thus nearly 18,000 firms were identified as having some level of green activity, with roughly 600 firms having green growth as core to their operations (i.e. more than 33% of their total activity within the green growth market) (DAMVAD 2011). Furthermore, the green growth sector was compared with performances in the manufacturing and welfare technology sectors. The former is noted for being a high value-added and export-oriented sector, and the latter a growth industry that can address societal challenges facing Denmark and other OECD countries. The review quantified the number of green growth jobs in the Copenhagen Capital Region to be approximately 25,000 in 2009 (of which nearly 11.000 were in the City of Copenhagen), as shown in Figure 6.9.
Export figures from the green growth sector demonstrate the success of Danish firms in reaching international markets: there was a 77% increase in green exports from the Capital Region between 2004 and 2009, averaged to an annual growth rate of around 12% (Green Growth Leaders, from data supplied by (DAMVAD 2011)). The research also demonstrated that the green growth sector showed higher productivity rates than the manufacturing and welfare technology sectors between 2003 and 2009 (Figure 6.10).
Table 6.1 Green growth, welfare technology, and manufacturing: key economic figures for Greater Copenhagen 2009 Source:DAMVAD2011
Turnover (in million DKK)
Employment
Export Intensity (%)
Exports (in million DKK)
GreenGrowth
WelfareTechnology
GreaterCopenhagen
Green Growthin DenmarkManufacturing
50,992
24,674
18,565
36
15,590
9,798
7,049
45
113,613
64,137
77,508
68
1,459,708
987,870
361,421
25
153,745
76,076
76,998
50
Figures on turnover and export growth for green production in Denmark4 show similar growth trajectories. Sales, exports, and share of turnover within firms (green production versus non-green production) were all higher in 2010 than 2005. Specifically, in 2010, green production in Denmark:
• hadaturnoverofmorethanDKK250billion(US$46billion),whichis9.2%oftotalturnoverof Danish enterprises with at least one full-time employee;
• accountedforDKK80billion(US$15billion)inexports,whichis10.4%oftotalDanishexports; and
• employedmorethan105,000people,or8.5%ofemployeesinDanishenterprises.
(Danish Energy Agency, Ministry of Climate Energy and Building et al. 2012)
More recent figures from the Danish Ministry of Climate, Energy and Building showed exports of green energy technology and services grew by 17.6% in 2013, and delivered the highest ever export figure for the sector. By comparison, growth in total merchandise exports was 2 per cent (Danish Ministry of Climate Energy and Building 2014).
Work undertaken in support of Copenhagen’s plan for carbon neutrality by 2025 also demonstrates the employment gains that result from meeting this policy target. An approximate DKK 200-250 billion (US$37-46 billion) of private investment is expected in the broad categories of energy production, energy consumption, and mobility up to 2025, irrespective of Copenhagen’s policy choices. Yet the carbon-neutral plan is expected to yield an additional DKK 20-25 billion (US$3.7-4.6 billion) and 2.7 billion (US$0.5) respectively from the private sector and municipal government (City of Copenhagen 2012b). This added investment in areas such as energy efficiency retrofits and increased efficiency in new builds, low-carbon energy supply and infrastructure, and municipal investments in low-carbon mobility is expected to support an additional 30,000 jobs (City of Copenhagen 2012b), from analysis by 3F and the Ecological Council, 2005). Net positive financial benefits are expected from this added investment on account of this employment boost, coupled with longer-term energy expenditure savings from fossil fuel substitution.
Copenhagen scores highly in research conducted by the European Union on the effectiveness and impacts of clusters as a measure of regional strength and firm performance in emerging industries. The 2013 European Cluster Excellence Scoreboard was based on survey and interview findings from more than 700 firm, investor, research, governmental, and non-governmental organisations active in products, services, and policy-setting in three key industrial clusters – creative industries, eco-industries, and mobile services – considered growth sectors within Europe (European Commission 2013a). For the eco-industries cluster, the assessment was undertaken in three leading EU regions: the Copenhagen Capital Region, Lombardy (Milan), and Provence-Alpes-Côte d’Azur (Marseille). (10 regions in total were assessed across the three industry clusters.)
The findings on individual firm growth and performance from 2010-2013 show that the creative industries experienced the least growth in terms of employment, annual revenues, and output, while eco industries performed best overall for these performance indicators. Annual revenues increased for 60% of firms in the eco industries and mobile services, and for 50% of firms in
Figure 6.8 Growth in productivity (GVA per full-time worker) - comparison between green growth, welfare technology, and manufacturing, Greater Copenhagen, 2003-2009
Source:DAMVAD2011
DAMVAD.COM 7
Green Growth is driving growth in the economy
in Copenhagen and Denmark in general.
The productivity growth seen in the Green Sector
has been significant in recent years. Despite the
financial crisis, productivity in the sector amounts
to 8 per cent per year, clearly exceeding the Dan-
ish average in productivity growth of 1.1 per cent
over the last 20 years. The figure below shows the
development in labour productivity since 2004.
Labour productivity is a measure for the value
added per full time equivalent contributes with.
The growth stems from an ever increasing turnover
and export and a more restrained and moderate
increase in employment. In other words the com-
panies are able to increase their sales with a mod-
erate increase in employment.
The municipality of Copenhagen is an epicen-
tre for green growth.
With almost half of all activities of the Green Sector
in the Greater Copenhagen Area taking place in
the City of Copenhagen, the city must be charac-
terised as a crucial player in determining the per-
formance of the Green Sector in the capital region.
The table below shows almost half of the turnover
in Green Growth in Greater Copenhagen Area is
generated from activities taking place in the City of
Copenhagen. Furthermore, 43 per cent of the em-
FIGURE 1.1
Productivity growth in key sectors compared to the Capital Region as a whole
Source: DAMVAD 2011, own calculation based on Statistics Denmark.
The table below shows key figures for Green Growth in the City of Copenhagen as well as the Greater
Copenhagen Area. Almost half of the turnover in Green Growth in Greater Copenhagen Area is gener-
ated from activities taking place the Municipality of Copenhagen. Furthermore, 43 per cent of the em-
ployment and 56 per cent of exports are concentrated in Copenhagen. The export intensity of the Green
Growth in Copenhagen is also well above the intensity in the Capital Region as a whole.
TABLE1.2
Green Growth in the City of Copenhagen the Greater Copenhagen Area and in Denmark, year 2009
City of Copenhagen Greater Copenhagen
Area
Denmark
Turnover (in million DKK) 23,803 50,992 153,745
Employment 10,677 24,674 76,076
Exports (in million DKK) 10,475 18,565 76,998
Export Intensity (%) 44 % 36 % 50 %
Source: DAMVAD 2011, own calculation based on Statistics Denmark.
100105110115120125130135140145150
2004 2005 2006 2007 2008 2009
Green Growth Welfare Technology Manufacturing Total, Greater Copenhagen Area
4ThisisbasedonworkbytheDanishEnergyAgency/MinistryofClimate,EnergyandBuilding,DanishBusinessAuthority/MinistryofBusinessandGrowth,andDanishEPA/MinistryoftheEnvironment,withstatisticalanalysisprovidedbyDAMVAD.Statisticalcategoriesforgreenproductionarenotyetfullyestablishedinnationaleconomicaccountfigures.Thisworkcontributestodevelopingthemethodandbasisforongoingreportingonthissector,andfollowsEurostatguidelinesforquantifyinggreenproductionwhichitdefinesasthedemandforproductsincludetechnologies,goodsandservicesfortheprevention,reduction,eliminationandtreatmentofairemissions,wasteandwastewater,soilandgroundwatercontamination,noiseandvibrationaswellasradiation.

159Innovationandbusiness158
the creative industries. Output in terms of the number of new products and services developed increased for firms in all three industries (European Commission 2013a).
For responding firms in the Copenhagen eco-industries cluster (29 in total), growth in annual revenues was the indicator showing the strongest increase, with changes in output, profits, and innovation measures closely behind. Results for changes in number of employees showed the least improvement (Figure 6.11).
In assessing firm performance indicators across all the regions from 2010-2013, the scorecard shows that Copenhagen scored first in terms of its cluster’s businesses growth in annual revenues and second in terms of growth in output and profits.
Note, however, that Copenhagen’s cluster scored lower in terms of growth of number of employees (fifth of 10) and in new products and services (tenth of 10). However, in compiling the composite assessment of all indicators, Copenhagen does emerge as the leading regional cluster of the 10 surveyed (Figure 6.12).
Figure 6.9 Eco industries firm performance 2010-2013, Copenhagen Capital Region
Figure 6.10 Composite indicator scores for regional business environment compared to change in annual revenues and change in output 2010-2013
Source:EuropeanCommission2013a
Source:EuropeanCommission2013a
6.4 Future challenges and opportunities
Copenhagen’s carbon neutral goal is highly ambitious. However while challenging, it provides an opportunity to create long-term economic and quality of life benefits. Solutions deployed in the coming years could ultimately address risks from climate change impacts, ease congestion, improve air and water quality, and reduce long-term expenditure on energy services. At the same time, green innovation offers a business opportunity for firms in Copenhagen and Denmark as a whole.
Accelerating the low-carbon and green growth transition comes at a time of continued low to moderate growth in the EU and wider global economy. Furthermore, the Danish economy has witnessed lower growth in productivity, employment and GDP compared to some comparable countries in the OECD over the past decade. Consequently, policy coordination between the City of Copenhagen and the national government will be important for overcoming the barriers to growth in the cleantech sector.
The ability to quantify the green sector’s economic performance – turnover, productivity, jobs, exports, etc. - is improving, but is still subject to some uncertainty and difficulty in producing solid, empirical data. That the sector has grown over the past decade is clear. However, it has done so from a low base and its value in the wider Copenhagen and Danish economy is difficult to quantify. Green economic development policies will need to be supported by better information.
Clustering and collaboration between government, researchers and businesses has been successful in Copenhagen to date and should continue. This can help retain the technology and market advantages won by Copenhagen cleantech businesses in what is expected to be an increasingly crowded and competitive global market, and one where Danish market potential will be very small in a global context. Moreover, sustaining the transition towards a green economy to meet the carbon-neutral goal should be implemented as cost-effectively as possible. The following sections describe some of the main opportunities and challenges in this transition.
6.4.1 Finance
The transition toward new (low-carbon) technologies will require significant investment from both public and private sources. In general, investments in carbon emissions reductions trade higher upfront expenditure for longer term savings – whether in the form of reduced energy consumption through efficiency upgrades, or low marginal cost energy supply sources such as wind and solar. Finding ways to match finance sources to these longer return horizons, and shifting upfront costs into long, steady returns, will be critical. Lowering the cost of capital needs to be a goal in any financing innovation to make low-carbon projects cost effective against incumbent technologies and systems.
For energy efficiency, shared savings or performance contracting is one approach to financing energy efficiency investments. In simple terms, a party other than the building owner / user makes an investment in energy efficiency systems or building fabric improvements and is repaid through the resulting energy savings. However shared savings projects, both nationally and internationally, have typically found success in a narrow range of projects, e.g. in government or institutional buildings and / or where the retrofit contract value is very large.
This focus on large projects excludes a substantial proportion of the potential energy efficiency market. Consequently, finance solutions are needed for shared savings arrangements for smaller projects and agents across a range of commercial and tenancy arrangements. International examples exist of approaches for unlocking this market potential. Applying them locally requires action from policy and finance agents to create market rules, standards or supporting products and services. Options for Copenhagen include:
• Aggregation or bundling of small projects into larger, single-transaction finance packages or for secondary market securitisation. For this, industry effort to produce standardised assessment and contract protocols5 is key, and an area where government can play a stakeholder role. Government can also act as, or facilitate the formation of, ‘project aggregators’ who group and source finance for multiple projects.
5TheInvestorConfidenceProjectintheUnitedStatesisastakeholderdrivenprocessbetweenindustryandpolicy-settingorganisationstocreatethesestandardisedpractices.Seehttp://www.eeperformance.org/fordetails.

161Innovationandbusiness160
• Insuranceproductsthatbackstopenergy savings performance guarantees. These can also increase capital / market interest in efficiency projects and can take the form of private-market insurance policies or public-sector loan guarantees.
• Tyingtheenergy efficiency loan obligation to the property, rather than the energy consumer, can help circumvent the tenant / landlord split or short-term outlook of some building lessees or owners. PACE financing in the U.S. and the Green Deal in the U.K. are examples. Local changes in building regulations and / or property taxation will be required to implement this.
Another option for scaling the available capital for green technology and infrastructure investments is the creation of a public-private ‘Green Bank.’ Creating this type of institution can leverage public funds with private sources that are attracted to the long-term returns of infrastructure projects from investors motivated by a low-carbon or green innovation ethos. Pension and insurance funds are often cited as ideal investor candidates. The public sector can facilitate a bank’s development by creating the institutional framework and rules by which the bank will operate, e.g. ensuring independence from direct public operations or management, allocating board and director seats, setting guidelines for risk and liquidity, and so forth. Seeding the institution with public capital can then attract greater shares of private funds.
Lastly, the market for Green Bonds is showing significant international growth and may offer a wider pool of investors in low-carbon, green innovation projects. The World Bank has been a leader in the market, and has issued over $USD 5.3 billion in Green Bonds through 61 transactions and 17 currencies since initiating activity in 2008 (World Bank No date). The Climate Bonds Initiative, an international NGO, reports that issuances grew by 25% between 2011 and 2012 globally; that the market is overwhelmingly populated by investment grade bonds; and that issuers come from both the municipal, corporate, and institutional sectors (Climate Bonds Initiative 2013). Danish firms or local / regional government organisations may find these financial instruments valuable, provided sufficient scale can be reached to justify bond origination costs.
6.4.2 Information and knowledge sharing
To support green innovation and growth of the green economy, governments at all levels have a role to play in collecting and disseminating information to help investors and entrepreneurs make effective decisions for business growth. Transparent and targeted information can motivate and inform entrepreneurs and investors of the scale of the opportunity, facilitate information symmetry for more realistic pricing of risk and confidence between counterparties (including public-private finance and innovation collaborations), and support policy decision-making and validate policy choices for green economic growth.
Standardised accounting and reporting tools for the cleantech sector can assist in quantifying the size of the green economy and its impact. Section 6.3.2 highlights some of the information available on this market, but these are not yet produced on a systematic basis. The City of Copenhagen, Copenhagen’s research sector, and private companies (or proxies such as the Copenhagen Cleantech Cluster or State of Green) should influence and collaborate with the relevant national authorities on embedding definitions and publishing figures within national accounts on the green economy.
An exercise to create the accounting categories and implement measurement and reporting functions is realistically a multi-year process. It can benefit from dialogue with, and research into, other international activities for setting definitions and creating collection standards such as the OECD, World Bank, and European Commission. In the short term, an update on the previous work prepared by DAMVAD in 2011 could be commissioned to derive current figures for Copenhagen and Hovedstaden.
Natural capital accounts can also contribute to market and policy transparency. This relates more (though not exclusively) to matters of ecosystem and natural environment goods and services. Just as built assets are capitalised and accounted for in balance sheets and provide indicators of economic progress and wealth, so too can natural assets by which economic activity is supported. Having this information set would enumerate the asset base and thus allow tracking of changes in the capital balance over time. This could be particularly meaningful for understanding risks from climate change impacts in the natural environment (often difficult to quantify or subject
to competing methodologies) and setting adaptation priorities in relation to them. Working in collaboration with other government, private, and institutional stakeholders, as well as drawing on international practices, would improve the outcome.
Further information initiatives that could be considered include policy support tools on the costs and benefits of carbon mitigation and climate change adaptation. Options here include:
• Dedicatingresourcesforclimate-model‘downscaling’tocreaterelevantdatasetson Copenhagen’s local exposure and sensitivity to temperature and precipitation changes, sea level rise, and weather extremes.
• Structuredengagementwithinsurerstoshareinformationonriskprofiles;toexploreregulatory measures for climate proofing (e.g. building design standards); and create incentives around voluntary anticipatory measures to be taken by asset owners.
• Undertakeregularreviewsofprocurementrulesandframeworksinareassuchasdiscountrates to make present action on adaptation and mitigation more financially attractive on a discounted basis; and cost-transfer / repayment mechanisms for ‘hard’ and ‘soft’ infrastructure solutions such as metered rates, user fees, special charges, and joint administrative / operations and maintenance agreements of assets between departments and organisations.
6.4.3 Partnerships and international markets
Regional cooperation in energy innovation research can be used to create synergies across systems and build market momentum. International grid connections already ensure a level of cooperation between countries in the region. The ongoing reliance of Copenhagen on the Danish (and by extension, regionally interconnected) electricity grid and the various decarbonisation targets at these other levels makes greater alignment desirable. This will be particularly meaningful to help bridge electricity demand variables that may eventuate and complicate progress toward Copenhagen’s carbon-neutral target, for example if electric vehicles were to achieve higher than expected take-up rates, if building cooling demand increases, or electric heat and / or use of air-source heat pumps are deployed more extensively.
The City of Copenhagen should promote greater cross-border collaboration with the research community and other partners in energy services to help create a larger, stronger regional market for low-carbon energy and other cleantech goods and services. This would reflect the shared regional ambition for a transition to low carbon (though with differing timeframes) and increase integration of renewable energy into the regional energy grid.
Existing partnerships such as Nordic Energy Research6 currently undertake jointly funded activities. In 2010, the value of this Nordic-level fund equalled 4% of total national public funding for low-carbon energy technologies in the Nordic countries. Overall, R&D spending on energy averages about 6% of total R&D spend in Denmark, Finland, Norway and Sweden, though spending levels were higher in the 1980s (OECD/IEA 2013). Present spending is arguably insufficient given the carbon policy ambitions of Denmark and other Nordic countries, and could be increased.
Increasing energy innovation spending on a regional basis, through Nordic Energy Research or some other institutional setting (e.g. Climate-KIC Nordic Centre) would contribute scale to the low-carbon energy market (where the industry in all countries is somewhat hindered by market size); leverage resources; enhance industry / research / government collaboration; and promote cost-effective cross-border solutions to decarbonising the region’s energy supply. It is assumed that the last incremental steps toward carbon neutrality in the years closest to 2025 will be the most difficult and costliest to achieve. Thus this focus on regional grid issues and synergies may provide greater flexibility in lieu of purely local efforts.
Effective public-private partnerships will become increasing important as mechanisms for delivering low carbon innovation and growth. Section 6.2.3 described an innovation in procurement led by the Copenhagen Cleantech Cluster for the delivery of a ‘big data’ platform. This multi-step tendering approach, involving a bidders’ dialogue, highlights how engaging with multiple public and private stakeholders can be used for scoping and defining the solution, leveraging technical expertise, and pooling financial resources. The replicability of this approach
6NordicEnergyResearchisaninstitutionfundedbyseveralmembergovernmentswithamissiontopromoteNordicco-operationwithinenergyresearchandpolicymaking.Ithasbeeninexistencesince1985.

163Acknowledgements162
should be assessed once the final award to the selected vendor is made and sufficient time has passed to monitor the vendor’s and the managing agent’s performance in delivering the contract.
In terms of capturing opportunities in larger markets - both regionally and internationally - the City of Copenhagen could examine subsectors of green products and services where Copenhagen and Denmark have a comparative advantage globally. Identifying and developing niche sectors will become increasingly important as competition in the global low carbon market intensifies.
Acknowledgements
WeareverygratefultotheCityofCopenhagenfortheiradviceandaccesstoinformationthroughouttheproject.InparticularwewouldliketothankMortenHøjer,SpecialAdvisoronClimateandGreenGrowthintheTechnicalandEnvironmentalAdministration;SamanthaHoffman,HeadofSectionintheFinanceAdministration;TineAneNielsen,HeadofSectionintheFinanceAdministration;andEmilieSofieHvidtfeldt,HeadofSectionintheFinanceAdministrationfortheirmanyhoursspentasprojectmanagersandprincipalcontactsforthisreport.ExecutiveleadershipfromtheCityofCopenhagenforthisprojectwasprovidedbyClausBjørnBillehøj,formerHeadofGrowth,PartnershipsandInternationalRelations;andCharlotteKorsgaard,HeadofMunicipalPlanningatTechnicalandEnvironmentalDepartment.
WewouldalsoliketothankthefollowingpeoplefromtheCityofCopenhagenwhoprovideddetailsonthemanystrategies,policiesanddatasetsnecessaryforthisresearch:AndersBrixThomsen,AnnetteEgetoft,AnnetteKayser,BeritHaahrHansen,BirteBuschThomsen,CasperMarott,DorteRømø,GretaNedergaard,HanneChristensen,HelgaEjskjær,IngeNilsson,JanRasmussen,JensSperling,JørgenAbildgaard,KarenForsting,KimStannovSøvsø,LonePedersen,MariannAnderson,MarieKåstrup,MetteSkovgaard,SørenNørgaardMadsen,StineBalslev,ThomasChapelle,TineAneNielsen,TueRex,andUlrikDjupdræt.
ThisprojectdrewontheadviceofawiderangeofexpertswhoservedasintervieweestoLSECitiesandlenttheirknowledgeandanalysisofCopenhagen’sgreeneconomyandlow-carbontransition:MadsGrønvall,HeadofCenterforEconomy,CityofCopenhagen;AnneSkovbro,DirectorofPlanningandDevelopment,CityofCopenhagenFinanceAdministration;JensElmelund,formerDirector,TechnicalandEnvironmentalAdministration,CityofCopenhagen;HenrikWegener,Professor,ExecutiveVicePresident,TechnicalUniversityofDenmark(DTU);MarinaBergenJensen,Professor,UniversityofCopenhagen,KU-Life;NielsTørslev,HeadofCenterforTraffic,TechnicalandEnvironmentalDepartment,CityofCopenhagen;PerAls,HeadofTransportPolicyPlanning,CityofCopenhagenFinanceAdministration;KristineGarde,HeadofCleantechInnovation,TechnicalUniversityofDenmark(ScionDTUScienceandTechnologyPark);BrianVadMathiesen,ProfessorDepartmentofDevelopmentandPlanningAalborgUniversity;SigneKongebro,Architect,PartnerandSustainabilityManager,HenningLarsenArchitects;andHenrikKryger,formerExecutiveDirector,GaiaSolar.
TwoworkshopswereheldinCopenhageninFebruaryof2014toelicitexpertopinionfromarangeofgovernmentofficials,researchers,andbusinesspeopleonkeystrategicandimplementationissuesformeetingCityofCopenhagen’sgreengrowthobjectives,principallycarbonneutralityby2025.Wearethankfulthatthefollowingofferedtheirtimeandadvicetotheseevents:AnneSkovbro,DirectorofPlanningandDevelopment,CityofCopenhagenFinanceAdministration;KarolineAmalieSteen,HeadofGreenGrowthandBusiness,CityofCopenhagenFinanceAdministration;PerAls,HeadofTransportPolicyPlanning,CityofCopenhagenFinanceAdministration;CarstenRiis,ExecutiveDirector,CityofCopenhagenTechnicalandEnvironmentalAdministration;SimonKjærHansen,DeputyDirector,CityofCopenhagenTechnicalandEnvironmentalAdministration;LykkeLeonardsen,HeadofClimateUnit,CityofCopenhagenTechnicalandEnvironmentalAdministration;CamillaLønborg-Jensen,HeadofUnit,ClimateandResources,TheCapitalRegionofDenmark;BrianValbjørnSørensen,HeadofSecretariat,CopenhagenCleantechCluster;MariannaLubanski,DirectorofInvestmentPromotion,CopenhagenCapacity;PeterPetersen,CEO,GaiaSolarA/S;JörgenEdström,HeadofStrategyandBusinessDevelopment,HOFOR;PeterThomsen,VicePresidentThermalPower,DongEnergy;BrianVadMathiesen,ProfessorDepartmentofDevelopmentandPlanningAalborgUniversity;ChristianGrøn,DirectorofConsultancy,DHIDenmark;AndersG.Christiansen,Director,SmarterCitiesLeader,IBM;MetteSøsLassesen,GroupDirector,Rambøll;PerRømerKofod,VicePresident,SmartGrids,ABBA/S;BirteBuschThomsen,CityofCopenhagenTechnicalandEnvironmentalAdministration;HelgaEjskjaer,CityofCopenhagenTechnicalandEnvironmentalAdministration;LonePederson,CityofCopenhagenTechnicalandEnvironmentalAdministration;PeterJeppeTolstrup,CityofCopenhagenTechnicalandEnvironmentalAdministration;AndersEdstrand,FinanceDepartment,CityofCopenhagen;andPeterBønløkke,Advisor,FinanceDepartment,CityofCopenhagen.
165Bibliography164
BibliographyAcs,Z.,N.BosmaandR.Sternberg(2008).“TheEntrepreneurialAdvantageofWorldCities:EvidencefromGlobalEntrepeneurshipMonitorData.”JenaEconomicResearchPapers63.
Andersen,T.(2011).Aflexicuritylabourmarketinthegreatrecession-thecaseofDenmark.,SchoolofEconomicsandManagement,AarhusUniversity.
BerlinGovernment(2012).BewerbungfuereininternationalesSchaufensterderElektromobilitaetBerlin-Brandenburg.
Brandt,J.,S.S.JensenandM.Plejdrup(2013).SundhedseffekterOgRelateredeEksterneOmkostningerAfLuftforureningIKøbenhavnnitrogen(HealthEffectsandRelatedExternalCostsofAirPollutioninCopenhagen),AarhusUniversity,DCE-NationalCentreforEnvironmentandEnergy.
BrianValbjørnSørensen(HeadofSecretariat-CopenhagenCleantechCluster)(2014).PersonalCommunication,21February2014.
BrookingsInstitution(2012).TheEconomicPerformanceIndex,RecoveryStatus,andOtherEconomicDatafortheLargest300MetropolitanEconomies.GlobalMetroMonitor2012:Slowdown,Recovery,andInterdependence.Washington,D.C.
BrookingsInstitution,LSECitiesandDeutscheBankResearch(2010).GlobalMetroMonitor:thepathtoeconomicrecovery(underlyingdatasuppliedbysubscription).WashingtonD.C.andLondon,BrookingsInstitution,LSECities-LondonSchoolofEconomicsandPoliticalScience,DeutscheBankResearch.
C40CitiesforClimateLeadership(2011).98%ofCopenhagenCityHeatingSuppliedbyWasteHeat.CaseStudy,November2011.
C40CitiesforClimateLeadership.(Nodate).“GreenGrowth,FinanceandEconomicDevelopmentInitiative.”Retrieved3December2013,fromhttp://c40.org/networks/green_growth.
C.KetelsandS.Protsiv(2013).“ClustersandtheNewGrowthPathforEurope.”WWWforEuropeWorkingPaperno14.
Caspersen,O.H.,C.C.KonijnendijkandA.S.Olafsson(2006).“Greenspaceplanningandlanduse:AnassessmentofurbanregionalandgreenstructureplanninginGreaterCopenhagen.”DanishJournalofGeography106(2):7-20.
Christensen,T.(2011).BusinessResearchDevelopmentandInnovationinDenmark-policiesandeffects,DanishMinistryofScience,InnovationandHigherEducation.
Citelum.(Nodate).“Copenhagen-ontracktoacarbonneutralfuture.”Retrieved21February2013,fromhttp://www.citelum.com/en/references/copenhagen.
CityofCopenhagen(2007).Eco-Metropolis-OurVisionforCopenhagen2015TechnicalandEnvironmentalAdministration.
CityofCopenhagen(2009).Applicationforthe‘GlobalDistrictEnergyClimateAward’-CopenhagenDistrictHeatingSystem.http://www.copenhagenenergysummit.org/applications/Copenhagen,%20Denmark-District%20Energy%20Climate%20Award.pdf
CityofCopenhagen(2011a).CopenhagenClimateAdaptationPlan.
CityofCopenhagen(2011b).Copenhagen:SolutionsforSustainableCities.Copenhagen,CityofCopenhagen,CityHall.http://www.kk.dk/sitecore/content/Subsites/CityOfCopenhagen/SubsiteFrontpage/Business/~/media/9933EE8E38A547C7B3A3C52BC4CAD89D.ashx
CityofCopenhagen(2011c).Good,Better,Best:TheCityofCopenhagen’sBicycleStrategy2011-2025.Copenhagen,CityofCopenhagen.
CityofCopenhagen(2011d).MunicipalPlan2011.Copenhagen,CityofCopenhagen,FinanceAdministration,CenterforUrbanDevelopment.
CityofCopenhagen(2012a).ActionPlanforGreenMobility,CityofCopenhagenTechnicalandEnvironmentalAdministration.
CityofCopenhagen.(2012b).“Businesscommunityusesmostelectricity.”fromhttp://subsite.kk.dk/sitecore/content/Subsites/CityOfCopenhagen/SubsiteFrontpage/LivingInCopenhagen/ClimateAndEnvironment/CopenhagensGreenAccounts/EnergyAndCO2/Electricity.aspx.
CityofCopenhagen.(2012c).“Cleanair-stillachallenge.”fromhttp://subsite.kk.dk/sitecore/content/Subsites/CityOfCopenhagen/SubsiteFrontpage/LivingInCopenhagen/ClimateAndEnvironment/CopenhagensGreenAccounts/AirPollution.aspx.
CityofCopenhagen(2012d).CloudburstManagementPlan2012,CityofCopenhagenTechnicalandEnvironmentalAdministration.
CityofCopenhagen(2012e).CO2emissionsfromtransport,heatandpowerconsumptioninCopenhagen-providedthroughpersonalcommunication.
CityofCopenhagen(2012f).Copenhagen:solutionsforsustainablecities.Copenhagen,CityofCopenhagen.
CityofCopenhagen.(2012g).“Copenhagener’senergyconsumption.”fromhttp://subsite.kk.dk/sitecore/content/Subsites/CityOfCopenhagen/SubsiteFrontpage/LivingInCopenhagen/ClimateAndEnvironment/CopenhagensGreenAccounts/EnergyAndCO2/Consumption.aspx.
CityofCopenhagen(2012h).CPH2025ClimatePlan-agreen,smartandcarbonneutralcity.
CityofCopenhagen.(2012i).“Districtheatingmoreclimate-friendly.”fromhttp://subsite.kk.dk/sitecore/content/Subsites/CityOfCopenhagen/SubsiteFrontpage/LivingInCopenhagen/ClimateAndEnvironment/CopenhagensGreenAccounts/EnergyAndCO2/Heating.aspx.
CityofCopenhagen(2012j).GreenAccounts-OrganicFood.CityofCopenhagenTechnicalandEnvironmentalAdministration.
CityofCopenhagen(2012k).GreenRoofsCopenhagen.CityofCopenhagenTechnicalandEnvironmentalAdministration.
CityofCopenhagen(2012l).AGreenerandBetterEverydayLife-LocalAgenda21planforCopenhagen2012-2015.
CityofCopenhagen(2012m).Populationbyageanddensity.Copenhagen.
CityofCopenhagen.(2012n).“Stillgoodbathingwaterintheport.”fromhttp://subsite.kk.dk/sitecore/content/Subsites/CityOfCopenhagen/SubsiteFrontpage/LivingInCopenhagen/ClimateAndEnvironment/CopenhagensGreenAccounts/Water/BathingWater.aspx.
CityofCopenhagen(2012o).WasteManagementPlan2012,CityofCopenhagenTechnicalandEnvironmentalAdministration.
CityofCopenhagen(2012p).“TransportNetworksSpatialData.”CopenhagenPlanningDepartment.Datasetsuppliedthroughpersonalcommunication.
CityofCopenhagen.(2013a).“Theamountofhouseholdwasteisfalling.”fromhttp://subsite.kk.dk/sitecore/content/Subsites/CityOfCopenhagen/SubsiteFrontpage/LivingInCopenhagen/ClimateAndEnvironment/CopenhagensGreenAccounts/Waste.aspx.
CityofCopenhagen(2013b).CopenhagenGreenAcounts2013.CityofCopenhagenTechnicalandEnvironmentalAdministration.
CityofCopenhagen.(2013c).“Towardssustainablewaterconsumption.”fromhttp://subsite.kk.dk/sitecore/content/Subsites/CityOfCopenhagen/SubsiteFrontpage/LivingInCopenhagen/ClimateAndEnvironment/CopenhagensGreenAccounts/Water.aspx.
CityofCopenhagen(2014).TheResourceandWasteManagementPlan2018,CityofCopenhagenTechnicalandEnvironmentalAdministration.
CityofCopenhagenDepartmentforWasteManagement(2013).WasteManagementinCopenhagen(Unpublished).
CityofStockholm(2012).TheStockholmEnvironmentProgramme2012-2015.
Climate-KIC.(Nodate).“Partners.”Retrieved21February2014,fromhttp://www.climate-kic.org/national-centres/nordic/partners/.
ClimateBondsInitiative(2013).BondsandClimateChange:theStateoftheMarket2013.
COBE.(Nodate).“Projects,Nordhavnen.”Retrieved3December2013,fromhttp://www.cobe.dk/project/nordhavnen
ComplexCleantechSolutions(2012).TheGlobalCleantechReport2012Copenhagen,CopenhagenCleantechCluster.
Consonni,S.,M.GiuglianoandM.Grosso(2005).“Alternativestrategiesforenergyrecoveryfrommunicipalsolidwaste.PartA:Massandenergybalances..”WasteManagement25:123-135.
CopenhagenCapacity.(2013).“AboutUs.”fromhttp://www.copcap.com/About%20us.
CopenhagenCleantechCluster(2012a).DanishSmartCities:sustainablelivinginanurbanworld.
CopenhagenCleantechCluster(2012b).Watersupply-Meetingtherisingdemandforwater.
CopenhagenCleantechCluster(2013).Prequalificationtenderdocument,CompetitivedialogueconcerningabigdatainfrastructureforsmartcitiesforCopenhagenCleantechCluster.EUreference2013/S184-318071,October2013.
CopenhagenCleantechCluster(2014a).BiddersQ&A(final)-CompetitivedialogueconcerningabigdatainfrastructureforsmartcitiesforCopenhagenCleantechCluster.January,2014.
CopenhagenCleantechCluster(2014b)“Thecombinedorganisationofmorethan170memberswillnowbeknownasCLEAN(PressreleaseinDanish).”9May2014http://www.cphcleantech.com/media/2987474/fusion.pdf
CopenhagenCleantechCluster.(Nodate).“About.”Retrieved3December2013,fromhttp://www.cphcleantech.com/about-ccc.
CopenhagenEnergy(2008).DistrictHeatinginCopenhagen:anenergyefficient,lowcarbonandcosteffectiveenergysystem.http://siteresources.worldbank.org/ECAEXT/rces/258598-1279117170185/7247167-1279119399516/7247361-1279119430793/districtheating.pdf
CopenhagenEnergy(2009).Applicationforthe‘GlobalDistrictEnergyClimateAward’,CopenhagenDistrictHeatingSystem.
CopenhagenEnvironmentandEnergyOfficeCEEO(2003).“TheMiddelgrundenOffshoreWindFarm-apopularinitiative.”
CopenhagenMetro.(Nodate).“AboutCityringen.”Retrieved9January2014,fromhttp://intl.m.dk/#!/about+the+metro/cityringen/about.
CornellUniversity,INSEADandWIPO(2013).TheGlobalInnovationIndex2013:TheLocalDynamicsofInnovation.Geneva,Ithaca,andFontainebleau.
CountyofStockhom(2011).Publictransportnetworkspatialdata.Datasetsuppliedthroughpersonalcommunication.
COWI(2013).CO2Accountsfor2012-MunicipalityofCopenhagen(inDanish).
CPHCity&PortDevelopment.(Nodate).“CityDevelopment,Nordhavnen.”Retrieved3December2013,fromhttp://www.byoghavn.dk/english/development/districts-uk/district-nordhavnen-uk.aspx.
CPHCityPort&Development(2012a).“MetrowillputNordhavnenonRails“Pressrelease22June2012http://byhavnweb01.dedicated.surftown.com/presse/nyheder/2012/metro+vil+satte+nordhavnen+pa+skinner.aspx
CPHCityPort&Development(2012b).Nordhavnen:fromideatoproject.Copenhagen.
CTRHOFORandVEKS(2009).VarmeplanHovedstaden(HeatPlanforGreaterCopenhagen).
DAMVAD(2011).GreenGrowthinCopenhagen.
DAMVAD(2013).CorecompetencesinDanishprivatesectorR&Dandtheireconomicimportance.Copenhagen,DAMVAD.
DanishArchitectureCentre.(2012).“Copenhagen:fromsewertoharbourbath.”fromhttp://www.dac.dk/en/dac-cities/sustainable-cities/all-cases/water/copenhagen-from-sewer-to-harbour-bath/?bbredirect=true.
DanishBoardofDistrictHeating(2013).”NewdistrictcoolingplantmakesCopenhagengreener.”21June2013.http://dbdh.dk/new-district-cooling-plant-makes-copenhagen-greener/
DanishEnergyAgency(2012a).EnergyPolicyinDenmark.Copenhagen,DanishEnergyAgency.
DanishEnergyAgency(2012b).EnergyStatistics2011.Copenhagen,DanishEnergyAgency.
DanishEnergyAgency(2013a).OilandGasProductioninDenmark2012.Copenhagen,DanishEnergyAgency.
DanishEnergyAgency(2013b).ProvisionalEnergyStatistics2012.Copenhagen,DanishEnergyAgency.
DanishEnergyAgency,MinistryofClimateEnergyandBuilding,DanishBusinessAuthority,MinistryofBusinessandGrowth,DanishEPAandMinistryoftheEnvironment(2012).GreenproductioninDenmarkanditssignificancefortheDanisheconomy.
DanishGovernment(2006).Progress,InnovationandCohesion:StrategyforDenmarkintheGlobalEconomy-Summary.
DanishGovernment(2011).OurEnergyFuture.TheDanishMinistryofClimate,EnergyandBuildings.
DanishMinistryofClimateEnergyandBuilding(2012).“AcceleratingGreenEnergyTowards2020-TheDanishEnergyAgreementofMarch2012.”
DanishMinistryofClimateEnergyandBuilding(2014)“Stronggrowthinexportsofenergytechnology.”29April2014http://www.kebmin.dk/nyheder/stor-vaekst-danmarks-eksport-energiteknologi
DanishMinistryofForeignAffairs.(2013).“FrenchCitelumWins80MillionEuroContracttoInstallEnergyEfficientLightinginCopenhagen.23October2013.”,fromhttp://www.investindk.com/News-and-events/News/2013/French-Citelum-Wins-80-Million-Euro-Contract-to-Install-Energy-Efficient-Lighting-in-Copenhagen.
DanishMinistryofScienceInnovationandHigherEducation(2012).DanishScienceInnovationandHigherEducation—aGlobalPerspective.
DanishMinistryofScienceInnovationandHigherEducation(2012a).Denmark-anationofsolutions.Copenhagen.
DanishMinistryofScienceInnovationandHigherEducation(2012b).Research2020:StrategicResearchHorizons.Copenhagen.
DanishMinistryoftheEnviroment(2010).FourthCountryReporttoCBD,TheAgencyforSpatialandEnvironmentalPlanning,NatureDivision.
DanishMinistryoftheEnvironment(2007a).TheCopenhagenFingerPlanaftertheAdministrativeReform2007.Copenhagen,MinistryoftheEnvironment.
DanishMinistryoftheEnvironment(2007b).SpatialPlanninginDenmark.Copenhagen,MinistryoftheEnvironment.
DanishMinistryoftheEnvironment(2011).“Danishlowemissionzones.”fromhttp://www.mst.dk/English/Air/reducing_traffic_emissions/LEZs_in_Denmark/default.htm.

167Bibliography166
DanishMinistryofTransport(2011).TheMinistryofTransport:Abrieforganisationaloverview.Copenhagen,DanishMinistryofTransport.
DanishMinistryofTransport/LarsBarfoed(2009)“Citycircleiswortheverypenny.”April24,2009http://www.trm.dk/da/ministeren/taler+og+artikler/2009/cityringen+er+alle+pengene+v%C3%A6rd/
DanishProductivityCommission(2013).TermsofReference.http://produktivitetskommissionen.dk/english
Djurhuus,H.etal(2013).EnvironmentallawandpracticeinDenmark:overview.EnvironmentalMulti-jurisdictionalGuide2013/14.
DONGEnergy.(Nodate).“REnescience:wasterefinery,enzymaticseparationofmixedmunicipalsolidwaste“Retrieved21February2014,fromhttp://www.dongenergy.com/Renescience/Pages/index.aspx.
DTU(TechnicalUniversityofDenmark)(Nodate).“ClimateinnovationcentrelaunchatDTU.”Retrieved21February2014,fromhttp://www.dtu.dk/english/news/2014/02/climate-kic.
DuttaS.andB.Lanvin(2013).TheGlobalInnovationIndex2013:TheLocalDynamicsofInnovation.,CornellUniversity,INSEAD,WorldIntellectualPropertyOrganisation.
Ejskjaer,H.(2013).PersonalCommunicationCityofCopenhagen.
ElectromobilityHamburg.(Nodate).Retrieved9January2014,fromhttp://www.elektromobilitaethamburg.de/
Ellermann,T.,C.Nordstrøm,J.Brandt,J.Christensen,M.KetzelandS.S.Jensen(2011).TheDanishAirQualityMonitoringProgramme.AnnualSummaryfor2010.NERITechnicalReportNo.836.Aarhus,NationalEnvironmentalResearchInstitute,AarhusUniversityhttp://www.dmu.dk/Pub/FR836.pdf
ErnstandYoung(2013).Ernst&Young’sattractivenesssurvey:Europe2013.ErnstandYoung.
Eurofound(2012).ThirdEuropeanQualityofLifeSurvey-QualityoflifeinEurope:Impactsofthecrisis.Luxembourg,PublicationsOfficeoftheEuropeanUnion
EuroHeatandPower(2011).DistrictheatingandCooling-2011Statistics.
EuropeanAcademyoftheUrbanEnvironment.(2001).“Copenhagen:watersavingstrategies.”fromhttp://www.eaue.de/winuwd/80.htm.
EuropeanCommission(2009).Ørestad,CopenhageninDenmark-FundingaMetrothroughlanddevelopment,SPUTNIC(StrategiesforPublicTransportinCities).
EuropeanCommission(2011).ARoadmapformovingtoacompetitivelowcarboneconomyin2050.
EuropeanCommission(2013a).EnterpriseandIndustrySBAFactsheet2013:Denmark.
EuropeanCommission(2013b).EuropeanClusterExcellenceScoreboardPilotVersion,EuropeanClusterObservatory.
EuropeanCommission.(2013c).“EuropeanGreenCapital.2014-Copenhagen.”Retrieved3December2013,fromhttp://ec.europa.eu/environment/europeangreencapital/winning-cities/2014-copenhagen/.
EuropeanCommission.(2013d).“EuropeanGreenCapital.2014-Copenhagen.Application-Environmentalmanagementofthelocalauthority.”Retrieved3December2014,fromhttp://ec.europa.eu/environment/europeangreencapital/winning-cities/2014-copenhagen/copenhagen-application/index.html.
EuropeanCommission(2013e).InnovationUnionScoreboard.Brussels.
EuropeanEnvironmentAgency.(2010a).“TheEuropeanEnvironment-StateandOutlook-Denmark,AirPollution.”fromhttp://www.eea.europa.eu/soer/countries/dk/soertopic_view?topic=air%20pollution.
EuropeanEnvironmentAgency(2010b).TheEuropeanEnvironment:StateandOutlook2010-UrbanEnvironment.Copenhagen,EuropeanEnvironmentAgency.
EuropeanEnvironmentAgency(2012).Percentageofgreenurbanareasincorecities.
EuropeanEnvironmentAgency(2013).BathingWaterQuality-dataviewer:Denmark,RegionHovedstaden.
EuroStat(2013a).Employmentrateoftheagegroup20-64byNUTS2regions.
EuroStat(2013b).GrossdomesticexpenditureonR&D(GERD)bysourceoffunds.EuroStat.
EuroStat(2013c)“Thelevelofgovernmentexpenditureoneducationvariesbetweenmemberstates.”StatisticsinFocus12/2013http://epp.eurostat.ec.europa.eu/portal/page/portal/product_details/publication?p_product_code=KS-SF-13-012
EuroStat(2013d).Municipalwastegenerationandtreatment,bytypeoftreatmentmethod.
EuroStat(2013e).PatentapplicationstotheEPObypriorityyearbyNUTS2regions.
EuroStat(2013f).Tertiaryeducationalattainmentbysex,agegroup25-64andNUTS2regions.
EuroStat(2013g).TotalintramuralR&Dexpenditure(GERD)byNUTS2regions.EuroStat.
FAO.(2013).“FAOFoodPriceIndex.”Retrieved25February,2013.
FDIIntelligence.(2011).“SwedenmaindestinationforFDIInScandinavia.”fromhttp://www.fdiintelligence.com/Locations/Europe/Sweden-main-destination-for-FDI-In-Scandinavia?ct=true.
Fertner,C.(2012).“Urbanisation,urbangrowthandplanningintheCopenhagenMetropolitanRegionwithreferencestudiesfromEuropeandtheUSA.”Forest&LandscapeResearch,No.54.
Floater,G.,P.RodeandD.Zenghelis(2013a).Urbangreengrowth:aframeworkforpolicymakers,LSECities,LondonSchoolofEconomicsandPoliticalScience.
Floater,G,P.Rode,D.Zenghelis,M.MonteroCarrero,D.Smith,K.Baker,C.Heeckt(2013b).StockholmGreenEconomyLeaderReport,LSECities,LondonSchoolofEconomicsandPoliticalScience
GermanGovernment(2009).NationalerEntwicklungsplanElektromobilitaetderBundesregierung.
GermanNationalOrganisationHydrogenandFuelCellTechnology.(Nodate).Retrieved9January2014,fromhttp://www.now-gmbh.de/en/mobility/mobility-of-tomorrow.html.
GlobalAllianceforIncineratorAlternatives(2012).Incinerators:Mythsvs.Factsabout“WastetoEnergy”.
GlobalBuildingsPerformanceNetwork(2012).BuildingsforourFuture:TheDeepPathforClosingtheEmissionsGapintheBuildingSector.PolicyPaper.
GlobalGreenGrowthForum.(Nodate).“About.”Retrieved3December2013,fromhttp://3gf.dk/en/about-3gf/.
GlobalWaterPartnership(Nodate).TheDanishActionPlanfortheAquaticEnvironment,Denmark,Case#267.
GreaterLondonAuthority(2012).“London’sCo2emissionsfrom1990.”Datasetsuppliedthroughpersonalcommunication.
GreenGrowthLeaders(2011).Copenhagen-BeyondGreen:thesocioeconomicbenefitsofbeingagreencity.
GreenGrowthLeaders,MondayMorningandDAMVAD(2011).“Copenhagen-BeyondGreen:thesocio-economicbenefitsofbeingagreencity.”fromhttp://greengrowthleaders.org/uncategorized/copenhagen-beyond-green-2/attachment/cph-beyond-green-3/.
GreentechMedia(2013).“SilverSpringtoNetwork20,000SmartCityStreetLights.”28October2013.Retrieved21February2014fromhttp://www.greentechmedia.com/articles/read/Silver-Spring-to-Network-20000-Smart-City-Street-Lights.
Grosso,M.,A.MottaandL.Rigamonti(2010).“Efficiencyofenergyrecoveryfromwasteincineration,inthelightofthenewWasteFrameworkDirective.”WasteManagement30(7):1238-1243.
GrowthForumfortheCapitalRegion(2011).TheCapitalRegionofDenmark:TheGreen,InnovativeGrowthEngineofNorthernEurope-BusinessDevelopmentStrategyfortheCapitalRegion2011-2013.
HealthProtectionScotland(2009).IncinerationofWasteandReportedHumanHealthEffects.Glasgow,ScottishEnvironmentalProtectionAgency.
InternationalCleantechNetwork(Nodate).“About.”Retrieved3December2013,fromhttp://internationalcleantechnetwork.com/about-icn/vision-and-mission.aspx.
InternationalDistrictEnergyAssociationandR.P.Thornton(2009).Copenhagen’sDistrictHeatingSystem.
InternationalEnergyAgency(2013).CO2EmissionsfromFuelCombustion.
InternationalFinanceCommissionandWorldBank(2013).Entrepeneurship.
InterviewTueRex(2012).InterviewwithTueRex,PlanningConsultant,CityofCopenhagen,18July2012.Copenhagen:CityofCopenhagen.
J.StockmarrandR.Thomsen(2008).WaterSupplyinDenmark-theDanishactionplanforpromotionofeco-efficienttechnologies-DanishLessons,DanishMinistryoftheEnvironment.
Jensen,S.S.,J.Brandt,M.KetzelandM.Plejdrup(2013).KildebidragTilSundhedsskadeligLuftforureningIKøbenhavn(SourceApportionmentofAirPollutioninCopenhagen),AarhusUniversity:NationalCentreforEnvironmentandEnergy.
Kamal-Chaoui,L.andJ.e.Sanchez-Reaza(2012).UrbanTrendsandPoliciesinOECDCountries.OECDRegionalDevelopmentWorkingPapers2012/01,OECDPublishing.
Knowles,R.D.(2012).“TransitOrientedDevelopmentinCopenhagen,Denmark:fromtheFingerPlantoØrestad.”JournalofTransportGeography22:251-261.
Lee,B.,F.Preston,J.Kooroshy,R.BaileyandG.Lahn(2012).ResourcesFutures,ChathamHouse.http://www.chathamhouse.org/sites/default/files/public/Research/Energy,%20Environment%20and%20Development/1212r_resourcesfutures.pdf
Lundvall,B.-A.(2009).TheDanishModelandtheGlobalizingLearningEconomy:LessonsforDevelopingCountries.ResearchPaperNo.2009/18,UnitedNationsUniversity.
Majoor,S.(2008).“ProgressivePlanningIdealsinaNeo-liberalContext,theCaseofØrestadCopenhagen.”InternationalPlanningStudies13(2):101-117.
Morris,J.(2005).“ComparativeLCAsforCurbsideRecyclingVersusEitherLandfillingorIncinerationwithEnergyRecovery(12pp).”TheInternationalJournalofLifeCycleAssessment10(4):273-284.
Næss,P.,A.Strand,T.NæssandM.Nicolaisen(2011).“Ontheirroadtosustainability?:ThechallengeofsustainablemobilityinurbanplanninganddevelopmentintwoScandinaviancapitalregions.”TownPlanningReview82(3):285-316.
OECD.(1995).“OECDReviewsofForeignDirectInvestment-Denmark.”
OECD(2008).EntrepreneurshipReviewofDenmark.Paris:OECDDirectorateforScience,TechnologyandIndustry.
OECD(2009).OECDTerritorialReviews:Copenhagen,Denmark.Paris,OECD.
OECD(2011a).“Patentsbytechnology:Patentsinenvironment-relatedtechnologies”Retrievedon4December2013fromhttp://stats.oecd.org/index.aspx?queryid=29068#).
OECD(2011b).TowardsGreenGrowth.
OECD(2012a).CompactCityPolicies:AComparativeAssessment.OECDGreenGrowthStudies,OECDPublishing.
OECD(2012b).EducationataGlance2012:OECDIndicators.Paris,OECDPublishing.
OECD(2013a).Employmentrate,Aged15-64,Allpersons.Paris,OECDStatistics.
OECD(2013b).“ProductivityDatabase”Retrievedon15December2013fromhttp://dx.doi.org/10.1787/888932980127.
OECD(2013c).Science,TechnologyandIndustryScoreboard.Retrievedon15December2013fromhttp://dx.doi.org/10.1787/888932980336
OECD(2014).OECDEconomicSurveys:Denmark2013,OECDPublishing.http://dx.doi.org/10.1787/eco-surveys-dnk-2013-en
OECD/IEA(2013).NordicEnergyTechnologyPerspectives:PathwaystoaCarbonNeutralEnergyFuture.
OfficeforNationalStatistics(2012).LabourForceSurvey.London:ONS.
OFWAT(2007).Internationalcomparisonofwaterandsewerageservice2007report.Birmingham,OFWAT.
OrdnanceSurvey(2011).Meridien2,Urbanareaandtransportnetworkdata.Digimap.Edinburgh.
Paccoud,A.(2011).ContainmentIndexcreatedusingOECDMetropolitanPopulationData,LSECities.
Primi,A.(2013).Chapter2:TheEvolvingGeographyofInnovation:ATerritorialPerspective.TheGlobalInnovationIndex2013,CornellUniversity,INSEAD,WIPO.
PSO(2006).HandbookofEnergyConservationforwastewaterpumpsystems.TheWorkingGroupundertheResearchandDevelopmentProject336-055:ConservingEnergybyOptimisingPressurisedWasteWaterSystems.
RethinkWaterNetwork(2013).Incontrolofwastewatertoprotectpeopleandecosystems-Efficientsolutionsfortreatmentofwastewater
Rode,P.,G.Floater,J.Kandt,K.Baker,M.MonteroCarrero,C.Heeckt,D.Smith,M.DelfsandR.PérezOchoa(2012).GoingGreen:howcitiesareleadingthenexteconomy.London,LSECities,LondonSchoolofEconomicsandPoliticalScience.
Siemens(2009).EuropeanGreenCityIndex.Munich,EconomistIntelligenceUnit,sponsoredbySiemens.http://w3.siemens.dk/home/dk/dk/presse/Documents/Green_City_Index_report.pdf
SingaporeMinistryoftheEnvironmentandWaterResources(2012).“WaterResourceManagement.”Retrieved14January2013fromhttp://app.mewr.gov.sg/web/Contents/contents.aspx?ContId=682.
Skovgaard,M.(2013).Wastepolicy.PersonalCommunicationwiththeCityofCopenhagen.
Smith,D.(2012).“MappingAccessibility.”InTheElectricCity:UrbanAgeConferenceNewspaper.London,UrbanAgeProgramme.
Sorensen,S.,B.Petersen,N.KofodandP.Jacobsen(2006).“HistoricaloverviewoftheCopenhagenseweragesystem.”WaterPracticeandTechnology1(1).
StatisticsDenmark(2005).Consumptionofdrinkingwaterbyuse,regionandtime.
StatisticsDenmark(2009).DanishCensusPopulationandEmploymentData.Datasetsuppliedthroughpersonalcommunication.
StatisticsDenmark(2012).“BIL600:Familiespurchaseofvehiclesbyregionandpatternofpurchase,2006-2012”Retrievedon10December2013fromhttp://www.statbank.dk/statbank5a/SelectVarVal/Define.asp?MainTable=BIL600&PLanguage=1&PXSId=0&wsid=cftree.
StatisticsDenmark(2013a).“BIL707:Stockofvehiclesper1Januarybyregionandtypeofvehicle.“Retrievedon10December2013fromhttp://www.statbank.dk/statbank5a/default.asp?w=1280.
StatisticsDenmark(2013b).BusinessDemographybyunit,region,industry(DB0710-grouping)andtime.

169Appendix168
StatisticsDenmark(2013c).Environmentallyrelatedtaxes1990-2008(discontinued).
StatisticsDenmark(2013d).Generalenterprisestatisticsbyunit,region,industry(DB07).
StatisticsDenmark(2013e).Nutrientstocoastalwatersbysource,parameter,waterareasandtime.
StatisticsDenmark(2013f).PopulationinDenmark.
StatisticsDenmark(2013g).Qualityofairincitiesbyregion,typeofsubstanceandtime(discontinued).
StatisticsDenmark(2014a).“Regionalaccounts,totaleconomy/GVAperRegion”Retrievedon3March2014fromhttp://www.dst.dk/en/Statistik/emner/regionale-regnskaber/regionale-regnskaber-hele-oekonomien.aspx.
StatisticsDenmark(2014b).“RNAT11:GDP(DKKmillion)andGDPpercapita(DKK1000)byregion,typeandpriceunit,regions”Retrievedon3March2014fromhttp://www.statbank.dk/statbank5a/default.asp?w=1280.
StatisticsDenmark(2014c).“RNAT11:GDP(DKKmillion)andGDPpercapita(DKK1000)byregion,typeandpriceunit,regions“Retrievedon3March2014fromhttp://www.statbank.dk/RNAT11.
Stern,N.(2006).TheEconomicsofClimateChange:TheSternReview.Cambridge,CambridgeUniversityPress.
Supercykelstier.(Nodate).“CycleSuperHighways-theconcept.”Retrieved9January2014,fromhttp://www.supercykelstier.dk/concept.
TheEconomicCounciloftheLabourMovement(2010).Largeimbalancesonthelabourmarketofthefuture.
TheelectromobilitymodelregionRhine-Main(Nodate).Retrieved9January2014,fromhttp://www.offenbach.de/stadtwerke-offenbach-holding/holding/leitstelle-elektromobilitaet-der-modellregion-rhein-main/.
Thornton,B.,Sauter,D.,Wedderburn,M.(2013).“MakingWalkingCount:aninternationalsurveytooltounderstandwalkers’needsintheirlocalneighbourhoods.”StudiesonMobilityandTransportResearch(2013):65-84.
UKEnvironmentAgency.(2013).“HouseholdwateruseinLondon.”fromhttp://www.environment-agency.gov.uk/research/library/publications/41051.aspx.
UKEnvironmentAgencyandAquaterra(2008).Waterandtheenvironment:Internationalcomparisonsofdomesticpercapitaconsumption.
UNCTAD(2013a).“InvestmentCountryProfiles-Denmark.”
UNCTAD(2013b).Inwardandoutwardforeigndirectinvestmentflows,annual,1970-2012.
UNCTAD(2013c).“Inwardandoutwardforeigndirectinvestmentstock.”
UNEP.(2013).“Whatisthe“GreenEconomy”?”Retrieved25February2013fromhttp://www.unep.org/greeneconomy/AboutGEI/WhatisGEI/tabid/29784/Default.aspx.
Vejre,H.,J.PrimdahlandJ.Brandt(2007).TheCopenhagenFingerPlan.Europe’slivinglandscapes.Essaysonexploringouridentityinthecountryside.B.Pedroli,LandscapeEurope/KNNV.
WorldBank(2010).CitiesandClimateChange:anurgentagenda.UrbanDevelopmentSeriesKnowledgePapers.
WorldBank(2012a).“Globalresearchanddevelopmentexpenditure(%ofGDP)”TheWorldBank.
WorldBank(2012b).InclusiveGreenGrowth.ThePathwaytoSustainableDevelopment.http://siteresources.worldbank.org/EXTSDNET/Resources/Inclusive_Green_Growth_May_2012.pdf
WorldBank(2012c).“WorldDevelopmentIndicators:GDPpercapita(currentUS$)”WorldBankRetrievedon25February2014fromhttp://data.worldbank.org/indicator/NY.GDP.PCAP.CD/countries.
WorldBank(2013a).Fossilfuelenergyconsumption(%oftotal).
WorldBank(2013b).GDPperunitofenergyuse(constant2005PPP$perkgofoilequivalent).
WorldBank(2013c).Population,total,2010.
WorldBank(2013d).Researchanddevelopmentexpenditure(%ofGDP).UNESCOInstituteforStatistics.
WorldBank.(Nodate).“WorldBankGreenBonds.”fromhttp://treasury.worldbank.org/cmd/htm/WorldBankGreenBonds.html.
WorldEconomicForum(2012).TheGlobalCompetitivenessReport2012–2013.InsightReport.K.Schwab.Geneva,WorldEconomicForum.
WorldEconomicForum(2013).TheGlobalCompetitivenessReport2013–2014.InsightReport.K.Schwab.Geneva,WorldEconomicForum.
WorldHealthOrganization(2006).WHOAirqualityguidelinesforparticulatematter,ozone,nitrogendioxideandsulfrdioxide,Globalupdate2005.
WorldHealthOrganization(2007).PopulationHealthandWasteManagement:ScientificDataandPolicyOptions(ReportofaWHOWorkshop29-30March2007).Rome.
WorldHealthOrganization(2010).Database:outdoorairpollutionincities2003-2010.Geneva.
Zoltan,J.andC.Armington(2003).Endogenousgrowthandentrepreneurialactivityincities.Baltimore/WashingtonD.C.,UniversityofBaltimore/USBureauoftheCensus.
APPENDIX-POLICYTOOLSANDGOVERNANCE

171Appendix170
Appendix-Policytoolsandgovernance
City Region National Supra- national
Increaseddevelopmentdensitystandardsorregulations x x
Regulationssupportingincreaseddensity x
Publicsubsidiesforenvironmentalremediationofbrownfieldsites
Otherpoliciespromotingdensity(describebelow)
Regulationssupportingmixed-usedevelopment x
Supportofurbanmanufacturing
Supportofindependent,smallscaleretailers
Otherpoliciespromotingmixedlanduse(describebelow) x
Urbangrowthboundaries/greenbelt x x
Plotsizerestrictions x
Investmentinparksandgreenspaces x
Greenspacerequirementsindevelopmentstandardsandregulations
x
Pricingecosystemservices
Investinginhabitatcreation
Otherlandprotectionorgreenspacepolicies(describebelow) x x
Metropolitan-wideintegratedtransportandland-useplan x
Zero-carbon/lowemissiondevelopmentzoning
Publicinvestmentineco-citydemonstrationprojects x
Densification(e.g.in-filldevelopment,loftconversion,additionofstories)
x
Otherintegratedschemes(describebelow)
Others(pleasespecify):
Land-use
Which of the following land use-related policies exist in your city? (Please tick all that apply and indicate at which level the policy was implemented)
Transport
Which of the following transport-related policies exist in your city? (Please tick all that apply and indicate at which level the policy was implemented)
City Region National Supra- national
Regulationspromotingdensity x
Regulationspromotingmixed-usedevelopment x
Supportforteleworking
Othertravelavoidancepolicies(describebelow)
Introduction/expansionofBusRapidTransit
Introduction/expansionofTram/LightRail
Introduction/expansionofHeavyRail
Introduction/expansionofdedicatedlanesforbuses x
FuelTaxes x
CongestionCharging
RoadUserCharges
ParkingCharges x
Cyclehireschemes x
Cyclenetworkandbikepaths x x x
CarFreeDays
StreetClosures x
Wideningofpavements/pedestrianspace x
Pedestrianisation x
PromotingCarFreeNeighbourhoods
LicensePlateRestriction/Auctioning
RestrictingRoadUsageforCars
ParkingSpaceReduction
Providingsafefacilitiesforpedestriansandcyclists x x
Othertravelmodeshiftingpolicies(describebelow)
x x
ElectrifyRoadTransport x x x
SmartTransportSystems
ElectricVehicleChargingInfrastructure x
MinimumEmissionStandards x
TrafficCalming/Physicaldrivingrestrictions x
ImproveRoadSafety x x
LimitingVehicleSpeeds x x
HighOccupancyLanes
HighOccupancyTollLanes
ZeroEmissionZones x
Procurementpolicies
Introductionofdedicatedroutes/lanesforfastecomobility(e.g.fastbicycles,lightelectricvehicles)
x x
Othertravelmodeimprovementpolicies x x

173Appendix172
Energy
Which of the following energy supply-related policies exist in your city? (Please tick all that apply and indicate at which level the policy was implemented)
City Region National Supra- national
Governmentloansorsubsidiesforenergyefficiencymeasures
x
Taxationonenergyconsumption x
Formalizingelectricityaccessininformalcommunities
Otherenergyefficiencypolicies(describebelow) x
Subsidiesforlarge-scalesolarenergyprojects
Subsidiesforhomeandbuilding-scalesolarenergygeneration x
Subsidiesforlarge-scalewindenergyprojects x
Subsidiesforhomeandbuilding-scalewindenergygeneration x
Subsidiesforlarge-scalehydroenergyprojects
Subsidiesforlarge-scalewave/tidalenergyprojects
Subsidiesforlarge-scalebiofuelenergyprojects x
Subsidiesforlarge-scalegeothermalenergyprojects x
Subsidiesforhomeandbuilding-scalefuelcellenergygeneration
Renewableenergysourcingminimumsforutilities
Feed-intariffsfordistributedelectricitygeneration
Otherrenewableenergypromotionpolicies(describebelow)
x
Mandatorysmartmeterinstallation
Enablingdynamictime-of-useenergypricing
Subsidiesfordistrictheatingprojects
Subsidiesforcombinedheatandpower(CHP)
Planningpoliciesencouragingdistrictheating x
Planningpoliciesencouragingcombinedheatandpower(CHP) x
Otherenergydistributionnetworkpolicies(describebelow)
Subsidiesand/orplanningpoliciesforcarboncaptureandstorage
Othergreenfossilfuelgenerationpolicies x
Buildings
Which of the following building-related policies exist in your city? (Please tick all that apply and indicate at which level the policy was implemented)
City Region National Supra- national
Reduceenergydemand x x
Subsidiesforloft/cavitywallinsulation
Subsidiesforsolidwallinsulation
Subsidiesforfloorinsulation
Subsidiesfordoubleglazing
Energysupplierobligationsforincreasinguptakeofenergyefficiencymeasures
x
Subsidiesfortheinstallationofheatingcontrols
Mandatoryinstallationofsmartmeters
Informationcampaignstoreduceenergyconsumptionthroughbehaviourchange
x x
Lowcarbonbuildingregulations,codesorstandards x
Subsidiesforgreenbuildingdevelopment
Disclosureofbuildingenvironmentalperformance
Procurementpolicies x
Stampdutyonbuildingssoldwithinefficientenergyuse
Otherenergydemandreductionpolicies(describebelow)
Subsidiesforrenewableheatinstallations(e.g.solarthermal,heatpumps)
x
Energysupplierobligationsforrenewableheatinstallations(e.g.solarthermal,heatpumps)
Renewablecoolingsystems(e.g.deepwatercooling) x
Feed-intariffsforelectricitygenerationatthescaleofbuildings
Renewableenergysourcingminimumsfornewdevelopments
Otherrenewableheat/coolingpolicies(describebelow)
Subsidiesforupgradingtomoreefficientgasboilers
Otherfossilfuelheatefficiencypolicies(describebelow)
Others(pleasespecify):

175Appendix174
Waste
Which of the following waste-related policies exist in your city? (Please tick all that apply and indicate at which level the policy was implemented)
City Region National Supra- national
Pricing(e.g.usercharges,volumetricwastecharging) x
Taxonunsustainablewasteproduction x
Formalizingwastecollectionininformalcommunities
Procurementpoliciesforquantity/toxicityreductionandrecyclability
x
Ensuringorsupportingwastecollection(e.g.clearingtrashfromareas,bins)
x
Ensuringorsupportingcommunityrecyclingdrop-offsites,especiallyatthelocallandfill
Regulationonquantity/toxicityofwaste x x
Regulationontrans-boundarymovementsofwastesanddisposal(solid)
x
Otherwastereductionpolicies(describebelow)
Taxbreakstocompaniesthatrecyclewastesoruserecycledproducts
Providingcompostingfacilitieswithincounciloperations(e.g.aroundcanteenorkitchens)
Feed-intariffsonrecycling
Feed-intariffsoncomposting
Ensuringorsupportingcollectionofrecyclablematerial(glass,paper,aluminium,steelcans,plastic,etc.)
Ensuringorsupportingorganicwastecomposting(garden,beachcleaning,streetsweeping,parktreepruning/felling,festivals,lawnclipping,mealsonwheels,foodwastesfrommarkets,littercollection,officepaper,zoowastes,mulching)
x x
Ensuringorsupportingestablishmentofreusableandsalvageablegoodsexchange
x
Ensuringorsupportingwastetoenergy x x x
Siteplanningforwastedisposal x x
Otherwastereusepolicies(describebelow)
Ensuringorsupportingseparationofresidentialwastes x x
Ensuringorsupportingseparationofindustrialwastes x
Supportingeducationprograms(e.g.homecompositing)
Regulationonseparationofwastesatsite
Otherwasteseparationpolicies(describebelow) x
Others(pleasespecify):localregulation
Water
Which of the following water-related policies exist in your city? (Please tick all that apply and indicate at which level the policy was implemented)
City Region National Supra- national
Pricing(e.g.usercharges,volumetricwatercharging) x
Taxonunsustainablewaterresources x
Buildingstandardsforwateruse x
Procurementpolicies
Otherdemandreductionpolicies x
Shifttoalternative/protectwatersources x
Feed-intariffsonlocal/sustainablesources x
Enabledemandresponsethroughwatermarketregulation
Feed-intariffsfordistributedwatersupply
Siteplanningforwaterpollutingindustries x x
Maximaonwaste-wateremissionsfromindustries
Planningcodesforwaste-waterseparationandrecycling x
Planningcodesfortheprotectionofpollutionofotherstreamflowsintoreservoirs,lakesandgroundwater(e.g.fromwildfiresthatreducecatchmentyields;Protectionfromsaltwaterintrusion)
x
Subsidiesforrainwaterharvesting x
Subsidiesfornaturalwatertreatment(e.g.wastestabilisationponds,soilaquifertreatment)
x
Otherwatersourceprotectionpolicies x
Mandatorywatermeterinstallation x
Formalizingwateraccessininformalcommunities x
Enabledynamictimeofusewaterpricing
Subsidiesforconstructingstorageanddetention(wetlands,aquifer,recovers,ponds,basins)
Subsidiesfornewtechnologiesofwaterefficiencymeasures
Subsidiesforresidentialwaterefficiencymechanisms(e.g.flushsavings,urinediversiontoilets)
x
Subsidiesforcommercialwaterefficiencymechanisms
Subsidiesforwaste-waterseparationandrecycling(e.g.reuseoftreatedwastewatereffluent,greywaterreuse,sludgereuse)
x
Subsidiesforactiveleakagemanagement
Subsidiesforresourceefficientdemonstrationsandcampaigns x
Subsidiesforbiogasproductionfromsludge
Creditforlocalrainwaterinfiltration x
Otherwatermanagementefficiencypromotionpolicies