COOS BAY, OREGON GEOGRAPHIC RESPONSE PLAN … · COOS BAY, OREGON GEOGRAPHIC RESPONSE PLAN (GRP)...
64
Northwest Area Committee _________________________________________________________________ COOS BAY, OREGON GEOGRAPHIC RESPONSE PLAN (GRP) PACIFIC OCEAN AREA OF COVERAGE
Transcript of COOS BAY, OREGON GEOGRAPHIC RESPONSE PLAN … · COOS BAY, OREGON GEOGRAPHIC RESPONSE PLAN (GRP)...

Northwest Area Committee
_________________________________________________________________
COOS BAY, OREGON
GEOGRAPHIC RESPONSE PLAN (GRP)
PACIFICOCEAN
AREA OF COVERAGE


Spill Response Contact Sheet
Required Notifications for Hazardous Substance or Oil Spills USCG National Response Center (800) 424-8802 In Oregon:
Department of Emergency Management (800) 452-0311 In Washington:
Emergency Management Division (800) 258-5990 Department of Ecology (360) 407-6300
U.S. Coast Guard National Response Center (800)424-8802 Marine Safety Office Puget Sound:
Watchstander (206) 217-6232 Safety Office (206) 217-6232
Marine Safety Office Portland Watchstander (503) 240-9301 Safety Office (503) 240-9379
Pacific Strike Team (415)883-3311 District 13:
MEP/drat (206) 220-7210 Command Center (206) 220-7021 Safety Officer (206) 220-7242 Public Affairs (206) 220-7235 Vessel Traffic Service (VTS) (206) 217-6050
Environmental Protection Agency (EPA) Region 10 Spill Response (206)553-1263 Washington Ops Office (206) 753-9083 Oregon Ops Office (503) 326-3250 Idaho Ops Office (208) 334-1450 RCRA/CERCLA Hotline (800) 424-9346 Public Affairs (206) 553-1203 National Oceanic Atmosphere Administration Scientific Support Coordination (206) 526-6829 Weather (206) 526-6087 Canadian Marine Emergency Ops (604) 666-6011 Environmental Protection (604) 666-6100 B.C. Environment (604) 356-7721 Department Of Interior Environmental Affairs (503) 231-6157 U.S. Navy Naval Shipyard (206) 476-3466 Naval Base Seattle (206) 526-3225 Supervisor of Salvage (202) 695-0231 Army Corps Of Engineers Hazards to Navigation (206) 764-3754
Response Contractors Fred Devine (503) 283-5285 Global Diving (206) 623-0621 NRC Environmental (503) 283-1150 US Environmental Services (866) 876-7745 Washington State Department of Ecology:
Headquarters (360) 407-6900 SW Regional (360) 407-6300 NW Regional (425) 649-7000 Central Regional (509) 575-2490 Eastern Regional (509) 456-2926
Department of Emergency Management (253) 512-7000 (800) 258-5990 Oregon State Department of Environmental Quality Headquarters (Portland) (503) 229-5153 Northwest Region (Portland) (503) 229-5263 Eastern Region (Bend) (541) 388-6146 Eastern Region (Pendleton) (541) 276-4063 Western Region (Coos Bay Branch) (541) 269-2721 Western Region (Eugene) (541) 686-7838 Western Region (Medford) (541) 776-6010 Western Region (Salem) (503) 378-8240 Emergency Management (503) 378-6377 (In State) (800) 452-0311 (In State) (800) OILS911 Stop Oregon Litter & Vandalism (503) 647-9855 Boldface type are 24-hour numbers

Coos Bay Geographic Response Plan
1 December 2004 Change 5
2
This Page Left Blank

Coos Bay Geographic Response Plan
1 December 2004 Change 5
3
HOW TO USE THIS GEOGRAPHIC RESPONSE PLAN
Purpose of Geographic Response Plan (GRP) This plan prioritizes resources to be protected and allows for immediate and proper action. By using this plan, the first responders to a spill can avoid the initial confusion that generally accompanies any spill. Geographic Response Plans are used during the emergent phase of a spill which lasts from the time a spill occurs until the Unified Command is operating and/or the spill has been contained and cleaned up. Generally this lasts no more than 24 hours. The GRPs constitute the federal on-scene coordinators’ and state on-scene coordinators’ “orders” during the emergent phase of the spill. During the project phase the GRP will continue to be used, but with input from natural resource trustees. Strategy Selection Chapter 4.2 of the GRP contains complete strategy descriptions in matrix form and accompanying maps. The strategies depicted in Chapter 4.2 will be implemented after reviewing on scene information including tides, currents, weather conditions, oil type, initial trajectories, etc. Response priorities for specific scenarios are provided in Chapter 4.3. It is important to note that strategies rely on the trajectory of the spill. A booming strategy listed as a high priority would not necessarily be implemented if the spill trajectory and location did not warrant action in that area. Chapter 6 outlines the sensitive resources requiring protection and the seasonality of their sensitivity. This information must be consulted before strategies are implemented, as there may be flight restrictions associated with a resource. Flight restriction information is also found in chapter 6. Standardized Response Language In order to avoid confusion in response terminology, this GRP uses strategy names defined in Appendix A (e.g. diversion booming, exclusion booming). Response Equipment A table outlining equipment availability and response times is being developed for this geographic response plan. In the interim, strategies will be deployed in the order equipment arrives on scene and as directed/selected by the on-scene coordinator.

Coos Bay Geographic Response Plan
1 December 2004 Change 5
4
This Page Left Blank

Coos Bay Geographic Response Plan
1 December 2004 Change 5
5
Record of Changes
Date Change Number Summary of Changes
1 August 1995 Original Release
1 June 1996 1 (Complete reprint) Editing changes. Revised strategies. Data added to chapter six.
1 November 1997 2 (Page changes) Editing changes. Corrected telephone numbers. Added text to section 6.4.
1 December 1999 3 (Page changes) Updated Contact Sheet and Risk Assessment (2.6). Renumbered strategies (Ch 4). Added Archeological sites (6.6), Commercial Aquaculture (6.9), and Shellfish (Fig. 6-6).
1 April 2000 4 (Page changes) Created new chapter four maps. Added Lat/Lon to Ch 4 Table Locations.
1 December 2004 5 (Page changes) Deleted “GRPs only address protection of sensitive public resources.” Updated DEQ logo and contact sheet.
Coos Bay Geographic Response Plan
1 April 2000 Change 4
6
This Page Left Blank
Coos Bay Geographic Response Plan
1 April 2000 Change 4
7
Coos Bay Geographic Response Plan
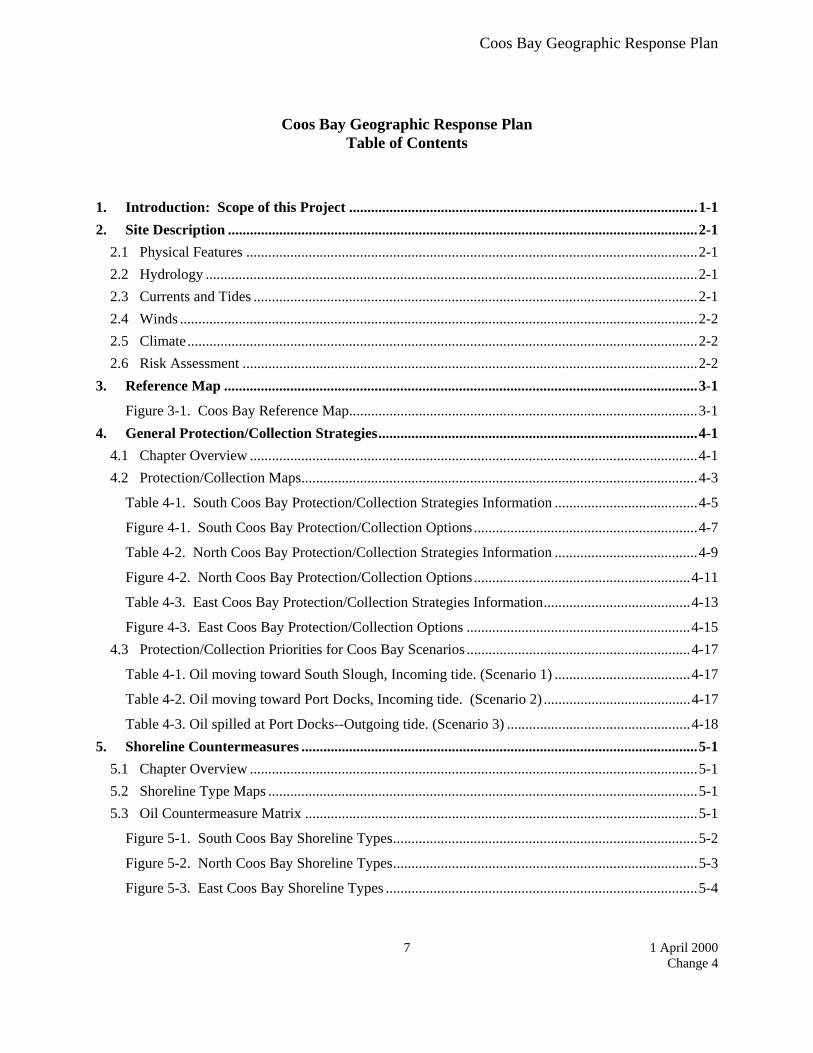
Table of Contents
1. Introduction: Scope of this Project ...............................................................................................1-1 2. Site Description ................................................................................................................................2-1
2.1 Physical Features ...........................................................................................................................2-1 2.2 Hydrology ......................................................................................................................................2-1 2.3 Currents and Tides .........................................................................................................................2-1 2.4 Winds .............................................................................................................................................2-2 2.5 Climate...........................................................................................................................................2-2 2.6 Risk Assessment ............................................................................................................................2-2
3. Reference Map .................................................................................................................................3-1
Figure 3-1. Coos Bay Reference Map...............................................................................................3-1 4. General Protection/Collection Strategies.......................................................................................4-1
4.1 Chapter Overview ..........................................................................................................................4-1 4.2 Protection/Collection Maps............................................................................................................4-3
Table 4-1. South Coos Bay Protection/Collection Strategies Information .......................................4-5
Figure 4-1. South Coos Bay Protection/Collection Options.............................................................4-7
Table 4-2. North Coos Bay Protection/Collection Strategies Information .......................................4-9
Figure 4-2. North Coos Bay Protection/Collection Options ...........................................................4-11
Table 4-3. East Coos Bay Protection/Collection Strategies Information........................................4-13
Figure 4-3. East Coos Bay Protection/Collection Options .............................................................4-15 4.3 Protection/Collection Priorities for Coos Bay Scenarios .............................................................4-17
Table 4-1. Oil moving toward South Slough, Incoming tide. (Scenario 1) .....................................4-17
Table 4-2. Oil moving toward Port Docks, Incoming tide. (Scenario 2) ........................................4-17
Table 4-3. Oil spilled at Port Docks--Outgoing tide. (Scenario 3) ..................................................4-18 5. Shoreline Countermeasures ............................................................................................................5-1
5.1 Chapter Overview ..........................................................................................................................5-1 5.2 Shoreline Type Maps .....................................................................................................................5-1 5.3 Oil Countermeasure Matrix ...........................................................................................................5-1
Figure 5-1. South Coos Bay Shoreline Types...................................................................................5-2
Figure 5-2. North Coos Bay Shoreline Types...................................................................................5-3
Figure 5-3. East Coos Bay Shoreline Types .....................................................................................5-4

Coos Bay Geographic Response Plan
1 April 2000 Change 4
8
6. Sensitive Resource/Wildlife Flight Restriction Information ........................................................6-1 6.1 Chapter Overview/Sensitive Resource Description .......................................................................6-1 6.2 Fisheries .........................................................................................................................................6-1 6.3 Wildlife ..........................................................................................................................................6-1 6.4 Marine Mammals ...........................................................................................................................6-1 6.5 Shorebirds, Waterfowl, and Raptors ..............................................................................................6-1 6.6 Archeological Sites ........................................................................................................................6-1 6.7 Flight Restriction Maps..................................................................................................................6-2 6.8 Wildlife Resource/Flight Restriction Tables..................................................................................6-2 6.9 Commercial Aquaculture ...............................................................................................................6-3
Table 6-1 Wildlife Resource/Flight Restriction Table.......................................................................6-4
Table 6-2 Wildlife Resource/Flight Restriction Table.......................................................................6-5
Table 6-3 Wildlife Resource/Flight Restriction Table.......................................................................6-6
Figure 6-1. Seabirds..........................................................................................................................6-7
Figure 6-2. Waterfowl.......................................................................................................................6-8
Figure 6-3. Mammals........................................................................................................................6-9
Figure 6-4. Nests.............................................................................................................................6-10
Figure 6-5. Shorebirds ....................................................................................................................6-11
Figure 6-6. Shellfish .......................................................................................................................6-12 7. Logistical Information.....................................................................................................................7-1
Table 7-1, Logistical Information ......................................................................................................7-1 Appendices...............................................................................................................................................A-1
Appendix A: Summary of Protection Techniques ...............................................................................A-1 Appendix B: Geographic Response Plan Contributors ......................................................................... B-1 Appendix C: Geographic Response Plan Comments/Corrections/Suggestions.................................... C-1

Coos Bay Geographic Response Plan
1 April 2000 Change 4
9
Coos Bay Geographic Response Plan Table of Figures
Figure 3-1. Coos Bay Reference Map....................................................................................................3-1
Figure 4-1. South Coos Bay Protection/Collection Options ................................................................4-7
Figure 4-2. North Coos Bay Protection/Collection Options ..............................................................4-11
Figure 4-3. East Coos Bay Protection/Collection Options.................................................................4-15
Figure 5-1. South Coos Bay Shoreline Types .......................................................................................5-2
Figure 5-2. North Coos Bay Shoreline Types .......................................................................................5-3
Figure 5-3. East Coos Bay Shoreline Types..........................................................................................5-4
Figure 6-1. Seabirds ................................................................................................................................6-7
Figure 6-2. Waterfowl.............................................................................................................................6-8
Figure 6-3. Mammals..............................................................................................................................6-9
Figure 6-4. Nests....................................................................................................................................6-10
Figure 6-5. Shorebirds ..........................................................................................................................6-11
Figure 6-6. Shellfish ..............................................................................................................................6-12

Coos Bay Geographic Response Plan
1 April 2000 Change 4
10
This Page Left Blank

Coos Bay Geographic Response Plan
1 June 1996
1-1
Coos Bay, Oregon
GEOGRAPHIC RESPONSE PLAN 1. Introduction: Scope of this Project Geographic Response Plans are intended to help the first responders to a spill avoid the initial confusion that generally accompanies any spill. They prioritize resources to be protected and allow for immediate and proper action. GRPs are developed for marine waters of Washington and Oregon State, the Columbia River, and the inland areas of Washington, Oregon and Idaho. They are prepared through the efforts of the Washington Department of Ecology, Oregon Department of Environmental Quality, Idaho State Emergency Response Commission, the U.S. Coast Guard, and the Environmental Protection Agency. GRPs are developed through workshops involving federal, state, and local oil spill emergency response experts, representatives from tribes, industry, ports, environmental organizations, pilots and response contractors. Workshop participants identify resources which require protection, develop operational strategies, and pinpoint logistical support. The first goal of a GRP is to identify resources, physical features, hydrology, currents and tides, winds and climate that may affect response strategies. After compiling this information, sensitive resources are identified. Secondly, response strategies are developed based on the sensitive resources noted, hydrology, and climatic considerations. Individual response strategies identify the amount and type of equipment necessary for implementation. The response strategies are then applied to likely spill scenarios for oil movement, taking into account factors such as wind and tidal conditions. Finally, additional logistical support is identified, including: Location of operations center for the central response organization; Local equipment and trained personnel; Local facilities and services and appropriate contacts for each; Response times for bringing equipment in from other areas. By using this plan as a guideline, the first responders to a spill can avoid the initial confusion that generally accompanies any spill. This plan prioritizes resources to be protected and allows for immediate and proper action.

Coos Bay Geographic Response Plan
1 June 1996
1-2
This Page Left Blank

Coos Bay Geographic Response Plan
1 December 1999 Change 3
2-1
2. Site Description The Coos Bay Estuary is located on the southern Oregon coast approximately 212 miles south of the Columbia River and about 124 miles north of the California border.
2.1 Physical Features Coos Bay is the second largest estuary in Oregon accounting for about 27 percent of the state's total estuarine resources. Its surface area is 10,973 acres at high tide and 5,810 acres at low tide. Tidelands cover approximately 4,569 acres including 2,738 acres of tidal marsh and 1,400 acres of eelgrass beds. The natural environment of the estuary supports a tremendous diversity of flora and fauna. The extensive shallow tidal flats provide excellent habitat for a variety of shellfish and important feeding and spawning areas for some 65 species of fish. The large beds of eelgrass and the shallow protected bays attract tremendous numbers of waterfowl providing the best resting area in the southern Oregon portion of the Pacific Coast flyway. Of particular biological importance is the South Slough National Estuarine Research Reserve, a pristine area of undisturbed tidal marshes and tide flats which furnishes essential habitat for a multitude of organisms. Commercially important activities such as clam harvesting, oyster culture, salmon aquaculture, fisheries and the fish processing industry are directly dependent on a natural productivity of the bay. In addition, natural resources support extensive recreational activities such as fishing, boating, sightseeing, clamming, crabbing, and nature viewing which enhance the local quality of life and attract tourists to the area.
2.2 Hydrology Coos Bay is a highly complex system composed of numerous sloughs and bays and some thirty tributaries, the major one being the Coos River. The bay drains a total area of 605 square miles and yields 2.2 million acre feet of fresh water annually.
2.3 Currents and Tides The tides of Coos Bay are of the mixed semi-diurnal type with paired highs and lows of unequal duration and amplitude. The mean tidal range at the entrance is 6.7 feet, the extreme high is 10.5 feet and the extreme low minus 3 feet. The tidal range increases upstream to the city of Coos Bay where the mean range is 6.9 feet. The time difference between peak tides at the entrance and Coos Bay is about 40-90 minutes. Currents resulting from tidal action range up to a predicted 6.0 feet per second at the entrance. In the shipping channel, currents range from 1 to 4 feet per second with the strongest currents occurring in the lower bay. Maximum ebb current velocities are somewhat greater than maximum flood current velocities particularly during the winter months when river runoff is high. Strong tidal flows are found at the entrances to all the bays and sloughs in the estuary particularly South Slough, North Slough, and Haynes Inlet where currents typically range from 1 to 3 feet per second.

Coos Bay Geographic Response Plan
1 December 1999 Change 3
2-1
2.4 Winds Coos Bay experiences strong northwest and southeast winds during the winter months and moderate to strong north to northwesterly winds in the summer. The strongest winds occur during the winter months from ocean storms generated primarily in the south. Wind generated waves will be highest when the fetch is longest. Consequently, southwest and southeast winds can be expected to produce significant wave activity in the northern ends of the bay, the northeast side of North Spit, Jordon Cove, North Slough, Haynes Inlet, Glasgow and Kentuck Inlet. Northerly winds can be expected to produce significant waves along the Coos Bay harbor, North Bay shore, Empire, Pigeon Point, and Charleston areas. Winds of 30 miles per hour will produce wave heights of over 2 feet in the lower bay in the more exposed areas.
2.5 Climate Rather mild and fairly uniform air temperatures mark the climate of the Coos Bay area. The average temperature in January is 45°F while in August it is 59°F. Water temperatures are fairly constant, except in the upper bay in late summer.
2.6 Risk Assessment The risk of oil spills within Coos Bay emanates from oil facilities, tank barges, cargo vessels, tugs, fishing vessels, and pleasure craft. One small tank barge (capacity 15,000 bbls) operates within the bay and provides bunker fuel to ships calling on the various terminals. Other oceangoing tank barges with capacities up to 84,000 bbls periodically enter to service the waterfront tank farms. No self-propelled tank vessels have called on Coos Bay since 1993. Approximately 220 cargo vessels enter Coos Bay annually, exporting forest products from the lumber docks. No oil pipelines exist in the area; however, one fixed marine oil facility and various mobile facilities do operate. A Coos Bay Response Cooperative was formed in Summer 1994 to provide immediate spill response to the cargo vessels over 300 GT in accordance with Oregon Revised Statute 468B.300-500. This cooperative offers response personnel, oil containment boom, skimmers, interim storage, and sorbents to provide immediate response to oil spills. The Oil spill contingency Plan for the Cooperative is still in draft form. The oceangoing tank barges entering Coos Bay are not covered by this plan, but by the Marine Spill Response Corporation, which has positioned its nearest equipment in Astoria.

Coos Bay Geographic Response Plan
1 June 1996
3-1
3. Reference Map
Figure 3-1. Coos Bay Reference Map

Coos Bay Geographic Response Plan
1 June 1996
3-2
This Page Left Blank

Coos Bay Geographic Response Plan
1 November 1997 Change 2
4-1
4. General Protection/Collection Strategies
4.1 Chapter Overview This chapter details the specific response strategies and resources to protect as outlined by the participants of the GRP workshops for each Geographical Response Area. It describes, amongst other things, the strategies determined for each area. Other pertinent information necessary for proper implementation of scenarios is found in chapters five and six. This information includes shoreline types, wildlife areas, economic areas, sensitive marine areas, archeological sites, and flight restriction zones which may be implemented by the OSCs if necessary. Sectors Each geographic region is divided into smaller sectors as shown by the reference map in chapter three. Maps The maps in this chapter provide information on the specific location of strategy points. They are designed to help the responder visualize response strategies in relation to valuable wildlife and archeological locations, economic areas, and sensitive marine areas. Maps are grouped in their respective subject matter areas. For a complete list of all maps contained in this GRP refer to the Table of Figures on page 9. • Protection/Collection maps provide information on the specific location of strategy points. These
maps are designed to help the responder visualize response strategies in relation to valuable wildlife and archeological locations, economic areas, and sensitive marine areas.
Tables This chapter contains tables that are placed in their respective subject matter areas. • Scenario Response Priority Strategies details the order in which strategies will be implemented
based on various local scenarios. • Response Strategy Table describes amongst other things, the details of the response strategies,
indicates the purpose of the strategy and lists special considerations that may be needed to carry out the strategies.
Coos Bay Geographic Response Plan
1 November 1997 Change 2
4-2
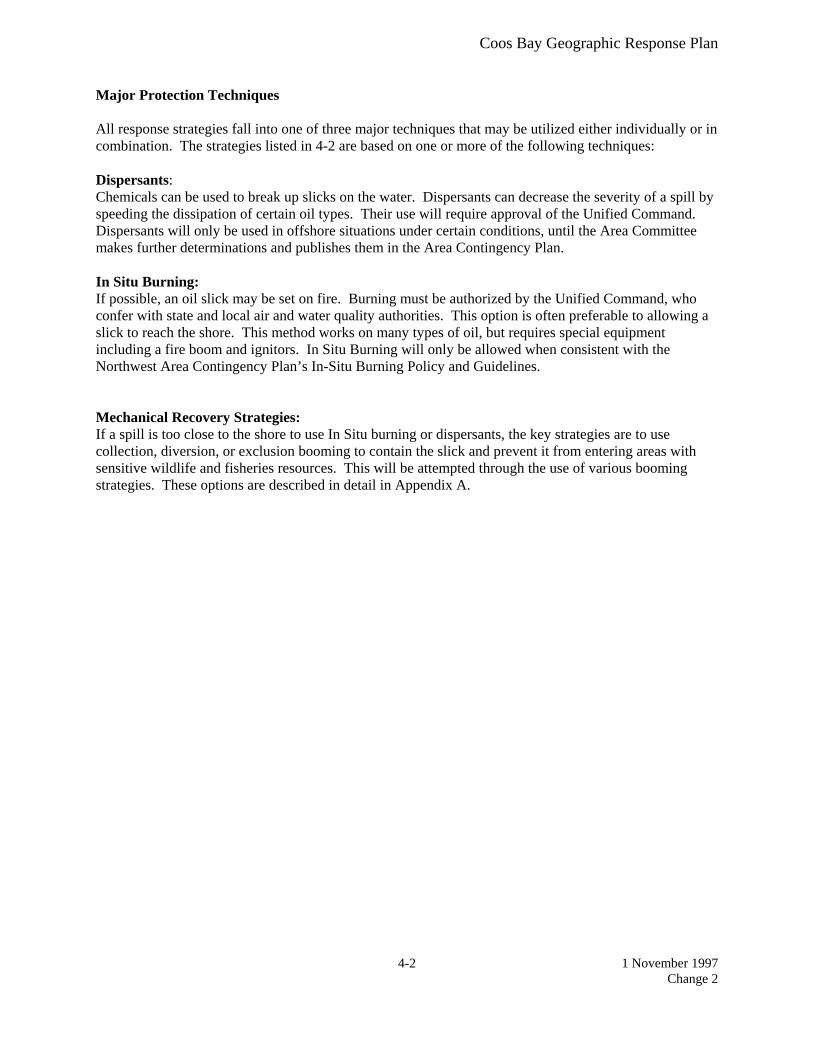
Major Protection Techniques All response strategies fall into one of three major techniques that may be utilized either individually or in combination. The strategies listed in 4-2 are based on one or more of the following techniques: Dispersants: Chemicals can be used to break up slicks on the water. Dispersants can decrease the severity of a spill by speeding the dissipation of certain oil types. Their use will require approval of the Unified Command. Dispersants will only be used in offshore situations under certain conditions, until the Area Committee makes further determinations and publishes them in the Area Contingency Plan. In Situ Burning: If possible, an oil slick may be set on fire. Burning must be authorized by the Unified Command, who confer with state and local air and water quality authorities. This option is often preferable to allowing a slick to reach the shore. This method works on many types of oil, but requires special equipment including a fire boom and ignitors. In Situ Burning will only be allowed when consistent with the Northwest Area Contingency Plan’s In-Situ Burning Policy and Guidelines. Mechanical Recovery Strategies: If a spill is too close to the shore to use In Situ burning or dispersants, the key strategies are to use collection, diversion, or exclusion booming to contain the slick and prevent it from entering areas with sensitive wildlife and fisheries resources. This will be attempted through the use of various booming strategies. These options are described in detail in Appendix A.
Coos Bay Geographic Response Plan
1 April 2000 Change 4
4-3
4.2 Protection/Collection Maps

Coos Bay Geographic Response Plan
1 April 2000 Change 4
4-4
This Page Left Blank

Coos Bay Geographic Response Plan
1 April 2000 Change 4
4-5
Table 4-1. South Coos Bay Protection/Collection Strategies Information Strategy Number
Status Location Response Strategy
Length & Type of Boom
Strategy Implementation/Feasibility Staging Area Site Access Resources Protected (Items marked with * see Flight Restriction Zone)
SCB-2 North Spit to Clam Island 43°23’20”N 124°17’44”W
Protection 1000’ hard Use 1000’ boom to boom from N. spit to Clam Isl to protect. 75%
Empire boat ramp
SCB-3 Clam Island North 43°23’5”N 124°17’48”W
Protection & Deflection
1000’ hard Use 1000’ boom in V configuration to deflect oil around Clam Island. 50%
Empire Boat Ramp (This strategy will require a lot of tending, support boats)
SCB-4 South clam Island into Channel 43°22’56”N 124°18’1”W
Protection & Deflection
500’ hard Use deflection booming to keep oil off shoreline and in main channel. 75%
Empire boat ramp, and road along North Spit
SCB-5 North Spit south of Clam Island into Channel 43°21’55”N 124°19’4”W
Collection--ebb; Deflection--flood
500’ hard Protect Clam Island during Flood tides. 75%
activities confined to beach, may need helicopter support
SCB-6 Sitka dock/Old Pulp Mill 43°22’39”N 124°17’43”W
Collection--ebb; Deflection--flood
1000’ hard Collect oil on ebb tide; deflect oil off shore on flood tide. 75%
Use main road out of Empire, anchor booms to end of dock, vac trucks will find this accessible
SCB-7 Fossil Point--North End 43°21’30”N 124°18’37”W
Collection--ebb; Deflection--flood
700’ hard Use ebb tide and natural formation of Fossil Point to collect. 75%
Use main access road, vac truck and boat accessible. Empire boat ramp is nearest ramp
SCB-8 Field visit 8/95 (1)
West of Pt Adams Jetty 43°21’9”N 124°19’8”W
Deflection to enhance Collection - Protect shoreline and South Slough
500’ hard; 2000’ sorbents
Use hard boom to deflect oil to natural collection anea west of jetty. Use sorbents in collection area. 25%
Charleston Marina
Charleston Marina South Slough Resources; Boom may not be feasible due to strong currents, but may still be able to collect oil west of Pt Adams Jetty
SCB-9 Field visit 8/95 (1) New Carissa 2/99 (3)
Charleston Triangle & Boat Basin 43°20’43”N 124°19’15”W
Protection 1200’ filter fence; 1500’ curtain
Run curtain boom from end of fishing dock to fish plant. 18” minimum. 50%
Charleston Marina
Charleston Marina Protect high public use clam beds
SCB-10 Field visit 8/95 (1)
Charleston Flat 43°20’13”N 124°19’23”W
Protection 2500’ hard Anchor boom to bridge pilings, may use rebar stakes and cement blocks as anchors. 50%
Charleston Marina
Charleston Marina; strategy may require boat and/or helo deployment
Protect high public use clam beds
SCB-11 Field visit 8/95 (1)
Entrance to Joe Ney Slough 43°20’2”N 124°18’58”W
Protection & Collection
(2) 900’ 20” boom with 100lb anchors on each end. Also need 10 40lb anchors
Two parallel booms with sorbent between. 75%
International Port of Coos Bay Dock
International Port of Coos Bay shipyard or Charleston Marina
Fish, shrimp and marsh in Joe Ney Slough
SCB-12 Collver Point 43°19’45”N 124°19’24”W
Collection -flood; Deflection-ebb
700’ hard Use physical shape of Collver Pt. to collect oil on flood, use trees as anchors. 75%
Charleston Marina; may require boat deployment
Boat--Charleston Marina; Vehicle--private road
SCB-13 Hayward Creek 43°19’29”N 124°19’32”W
Protection 200’ hard Boom off mouth to protect marsh area during flood tide; use trees as anchors. 75%
Charleston Marina
Charleston Marina--will probably require only boat deployment
Coos Bay Geographic Response Plan
1 April 2000 Change 4
4-6
Strategy Number
Status Location Response Strategy
Length & Type of Boom
Strategy Implementation/Feasibility Staging Area Site Access Resources Protected (Items marked with * see Flight Restriction Zone)
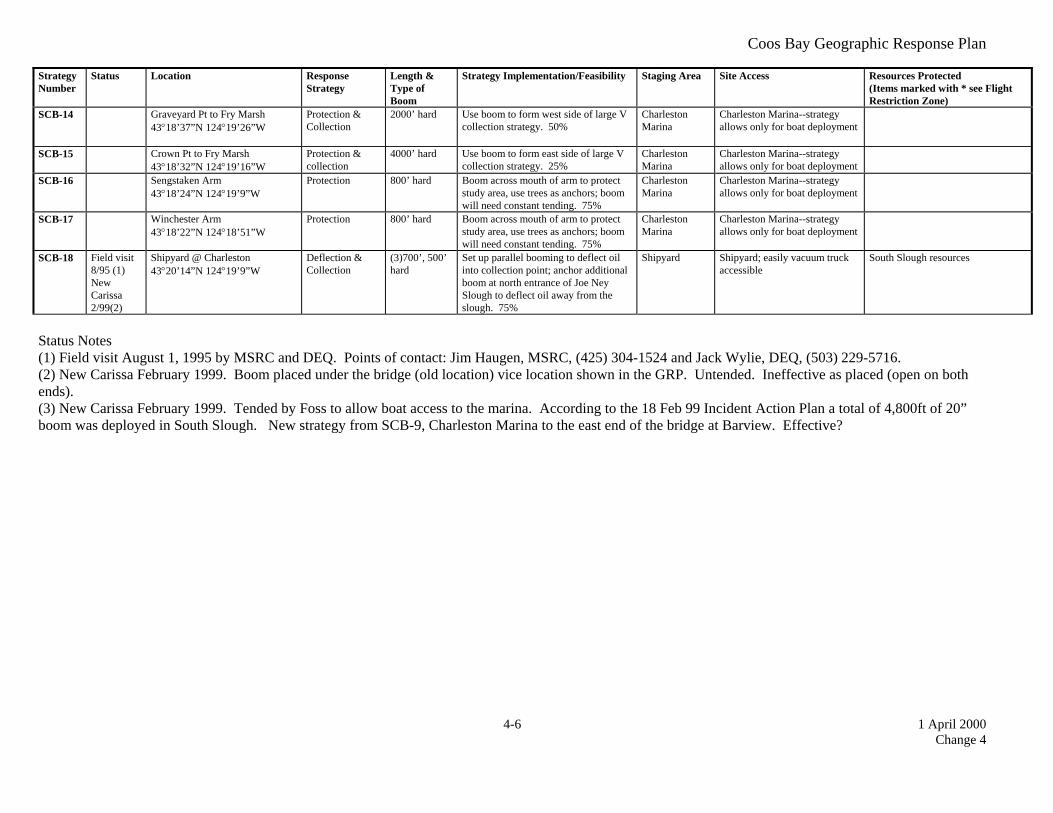
SCB-14 Graveyard Pt to Fry Marsh 43°18’37”N 124°19’26”W
Protection & Collection
2000’ hard Use boom to form west side of large V collection strategy. 50%
Charleston Marina
Charleston Marina--strategy allows only for boat deployment
SCB-15 Crown Pt to Fry Marsh 43°18’32”N 124°19’16”W
Protection & collection
4000’ hard Use boom to form east side of large V collection strategy. 25%
Charleston Marina
Charleston Marina--strategy allows only for boat deployment
SCB-16 Sengstaken Arm 43°18’24”N 124°19’9”W
Protection 800’ hard Boom across mouth of arm to protect study area, use trees as anchors; boom will need constant tending. 75%
Charleston Marina
Charleston Marina--strategy allows only for boat deployment
SCB-17 Winchester Arm 43°18’22”N 124°18’51”W
Protection 800’ hard Boom across mouth of arm to protect study area, use trees as anchors; boom will need constant tending. 75%
Charleston Marina
Charleston Marina--strategy allows only for boat deployment
SCB-18 Field visit 8/95 (1) New Carissa 2/99(2)
Shipyard @ Charleston 43°20’14”N 124°19’9”W
Deflection & Collection
(3)700’, 500’ hard
Set up parallel booming to deflect oil into collection point; anchor additional boom at north entrance of Joe Ney Slough to deflect oil away from the slough. 75%
Shipyard Shipyard; easily vacuum truck accessible
South Slough resources
Status Notes (1) Field visit August 1, 1995 by MSRC and DEQ. Points of contact: Jim Haugen, MSRC, (425) 304-1524 and Jack Wylie, DEQ, (503) 229-5716. (2) New Carissa February 1999. Boom placed under the bridge (old location) vice location shown in the GRP. Untended. Ineffective as placed (open on both ends). (3) New Carissa February 1999. Tended by Foss to allow boat access to the marina. According to the 18 Feb 99 Incident Action Plan a total of 4,800ft of 20” boom was deployed in South Slough. New strategy from SCB-9, Charleston Marina to the east end of the bridge at Barview. Effective?
Coos Bay Geographic Response Plan
1 April 2000 Change 4
4-7
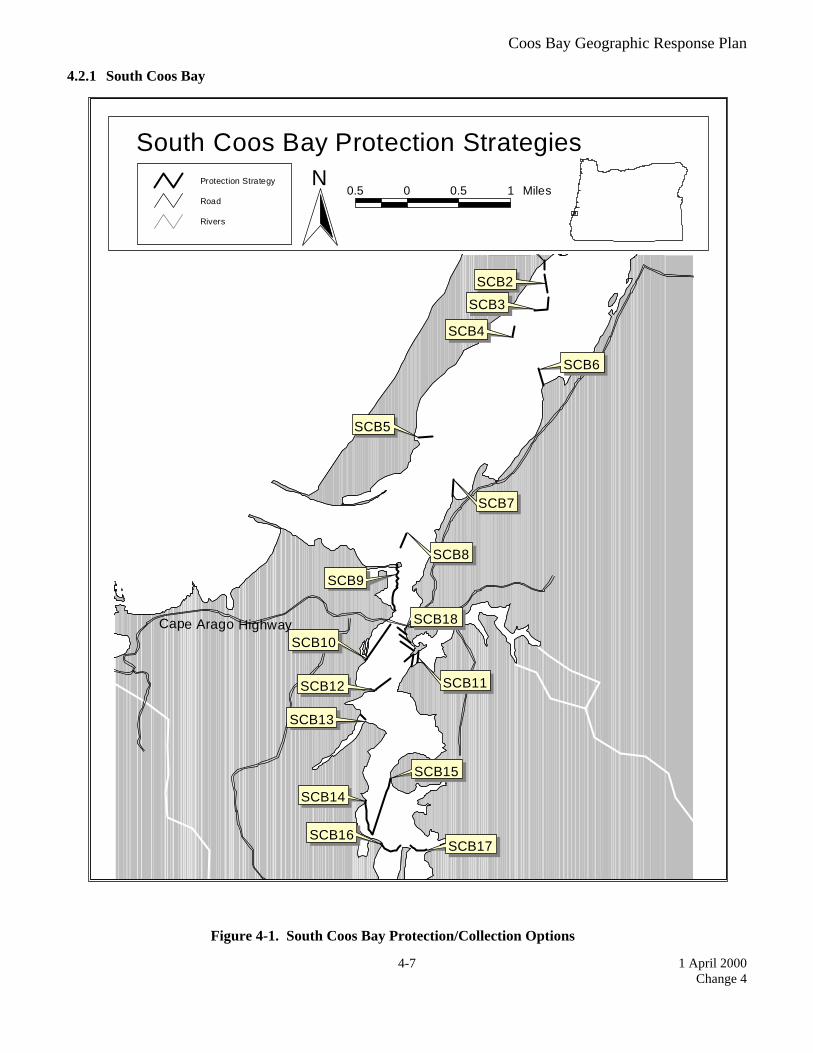
4.2.1 South Coos Bay
SCB2
SCB3
SCB4
SCB6
SCB5
SCB7
SCB8
SCB9
SCB10
SCB18
SCB11SCB12
SCB13
SCB14
SCB15
SCB17SCB16
Cape Arago Highway
Protection Strategy
Road
Rivers
N0.5 0 0.5 1 Miles
South Coos Bay Protection Strategies
Figure 4-1. South Coos Bay Protection/Collection Options

Coos Bay Geographic Response Plan
1 April 2000 Change 4
4-8
This Page Left Blank

Coos Bay Geographic Response Plan
1 April 2000 Change 4
4-9
Table 4-2. North Coos Bay Protection/Collection Strategies Information Strategy Number
Status Location Response Strategy Length & Type of Boom
Strategy Implementation/Feasibility
Staging Area Site Access Resources Protected (Items marked with * see Flight Restriction Zone)
SCB-1 Small Inlet at Mushroom Pt across fm Treatment Plant #2 43°23’20N 124°17’44”W
Protection 500’ hard Using hard boom anchored w/ ecology blocks protect threatened plants. 75%
Helicopter deployment only, Empire boat ramp is nearest water deployment area
SCB-2 North Spit to Clam Island 43°23’20”N 124°17’44”W
Protection 1000’ hard Use 1000’ boom to boom from N. spit to Clam Isl to protect. 75%
Empire boat ramp
SCB-3 Clam Island North 43°23’5”N 124°17’48”W
Protection & Deflection
1000’ hard Use 1000’ boom in V configuration to deflect oil around Clam Island. 50%
Empire Boat Ramp (This strategy will require a lot of tending, support boats)
SCB-4 South clam Island into Channel 43°22’56”N 124°18’1”W
Protection & Deflection
500’ hard Use deflection booming to keep oil off shoreline and in main channel. 75%
Empire boat ramp, and road along North Spit
SCB-6 Sitka dock/Old Pulp Mill 43°22’39”N 124°17’43”W
Collection--ebb; Deflection--flood
1000’ hard Collect oil on ebb tide; deflect oil off shore on flood tide. 75%
Use main road out of Empire, anchor booms to end of dock, vac trucks will find this accessible
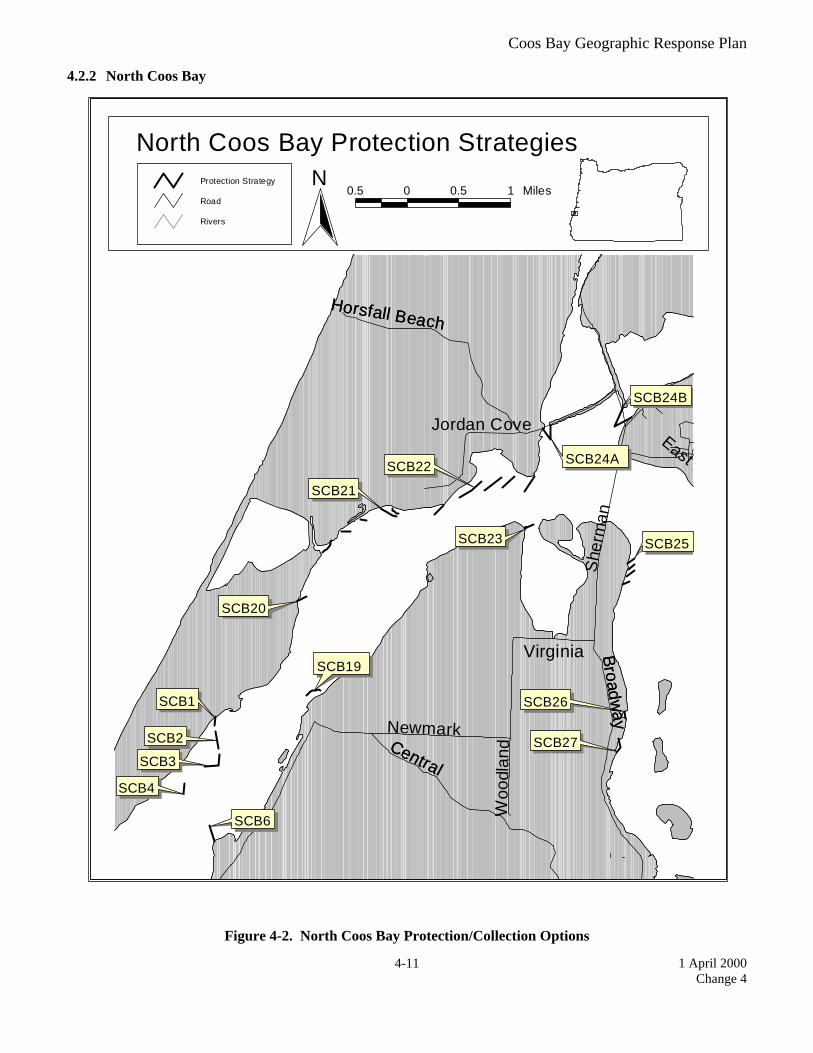
SCB-19 Empire Docks 43°23’50”N 124°16’40”W
Collection 500’ hard Anchor boom to docks to enhance already existing natural collection area along sandy shoreline. 75%
Empire Boat Ramp Empire Boat ramp; vacuum truck accessible
SCB-20 Barge Landing 43°24’24”N 124°16’49”W
Collection 300’ hard Anchor boom to barge landing and out into flow to enhance natural collection already occurring along riprap shoreline. 75%
Barge Landing Access from barge landing, vacuum truck accessible
SCB-21 Henderson Marsh on North Spit 43°25’7”N 124°16’30”W
Collection 2000’ hard in stepdown configuration
Use step down booming to enhance natural collection in marsh; substrate is riprap & coarse sand. 50%
Barge Landing Barge Landing; access from road & beach; vacuum trucks may be able to access
SCB-22 Jordan Cove 43°25’47”N 124°14’37”W
Deflection 2000’ in step down configuration
Use marsh boom (if available) to deflect oil from vegetated mud flat area; sorbent boom may be useful to collect. 50%
North Bend Airport Good vehicle access from boat ramp
SCB-23 Field visit 8/95 (1) New Carissa 2/99 (2)
Pony Slough 43°25’23”N 124°14’12”W
Collection & Deflection
800’ hard boom Deflect oil @ mouth to natural collection area, need to boom this on the flood tide. 50%
North Bend Airport Boat ramp at Pony Point Pony Slough Resources
SCB-24A Field visit 8/95 (1) North Slough Entrance 43°26’17”N 124°14’1”W
Protection and Collection
1600’ hard; 1000’ sorbent
Form a large V with 2 800’ sections of hard boom to enhance natural collection along riprap causeway. 25%
Conde McCullough State Wayside
Good causeway road; may need very large anchor at tip of V, mudflats may make deployment difficult
North Slough Resources; Located over oyster beds
Coos Bay Geographic Response Plan
1 April 2000 Change 4
4-10
Strategy Number
Status Location Response Strategy Length & Type of Boom
Strategy Implementation/Feasibility
Staging Area Site Access Resources Protected (Items marked with * see Flight Restriction Zone)
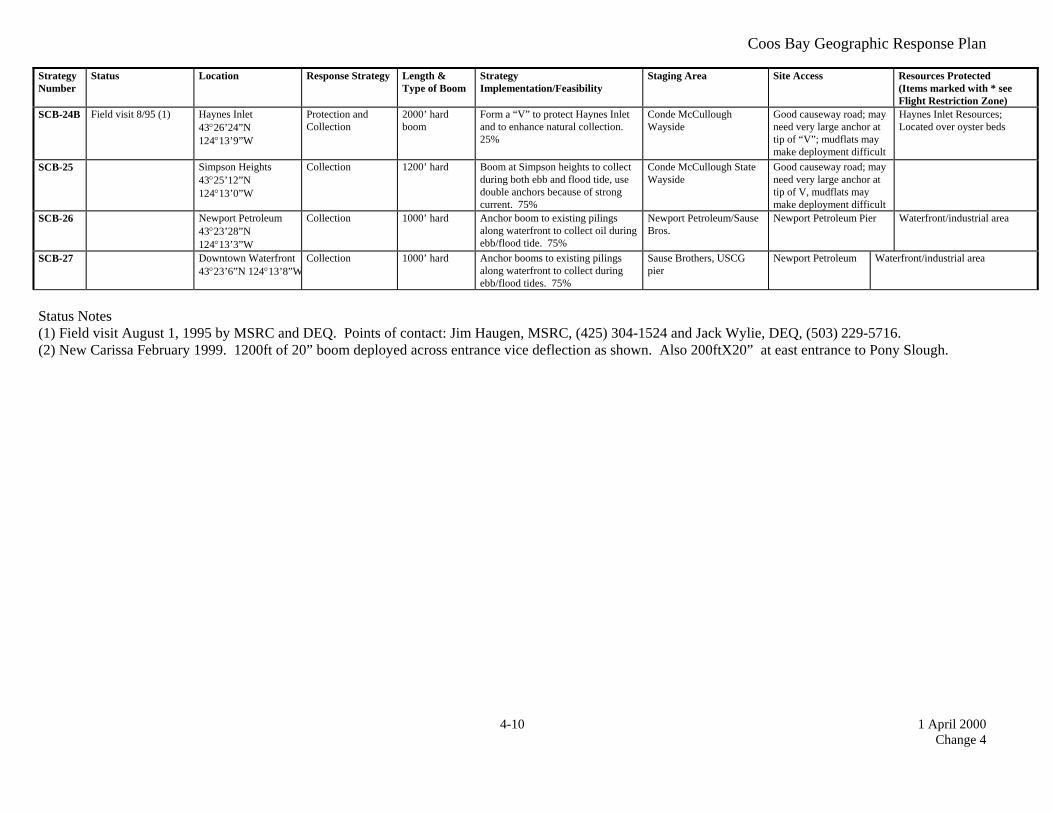
SCB-24B Field visit 8/95 (1) Haynes Inlet 43°26’24”N 124°13’9”W
Protection and Collection
2000’ hard boom
Form a “V” to protect Haynes Inlet and to enhance natural collection. 25%
Conde McCullough Wayside
Good causeway road; may need very large anchor at tip of “V”; mudflats may make deployment difficult
Haynes Inlet Resources; Located over oyster beds
SCB-25 Simpson Heights 43°25’12”N 124°13’0”W
Collection 1200’ hard Boom at Simpson heights to collect during both ebb and flood tide, use double anchors because of strong current. 75%
Conde McCullough State Wayside
Good causeway road; may need very large anchor at tip of V, mudflats may make deployment difficult
SCB-26 Newport Petroleum 43°23’28”N 124°13’3”W
Collection 1000’ hard Anchor boom to existing pilings along waterfront to collect oil during ebb/flood tide. 75%
Newport Petroleum/Sause Bros.
Newport Petroleum Pier Waterfront/industrial area
SCB-27 Downtown Waterfront 43°23’6”N 124°13’8”W
Collection 1000’ hard Anchor booms to existing pilings along waterfront to collect during ebb/flood tides. 75%
Sause Brothers, USCG pier
Newport Petroleum Waterfront/industrial area
Status Notes (1) Field visit August 1, 1995 by MSRC and DEQ. Points of contact: Jim Haugen, MSRC, (425) 304-1524 and Jack Wylie, DEQ, (503) 229-5716. (2) New Carissa February 1999. 1200ft of 20” boom deployed across entrance vice deflection as shown. Also 200ftX20” at east entrance to Pony Slough.
Coos Bay Geographic Response Plan
1 April 2000 Change 4
4-11
4.2.2 North Coos Bay
SCB24B
SCB22
SCB21
SCB20
SCB23 SCB25
SCB27
SCB26SCB1
SCB2
SCB3
SCB4
SCB6
Newmark
Broadway
Horsfall Beach
Woo
dlan
dCentral
Broadway
She
rman
Horsfall Beach
Jordan CoveEast B
Central
VirginiaSCB19
SCB24A
Protection Strategy
Road
Rivers
N0.5 0 0.5 1 Miles
North Coos Bay Protection Strategies
Figure 4-2. North Coos Bay Protection/Collection Options

Coos Bay Geographic Response Plan
1 April 2000 Change 4
4-12
This Page Left Blank
Coos Bay Geographic Response Plan
1 April 2000 Change 4
4-13
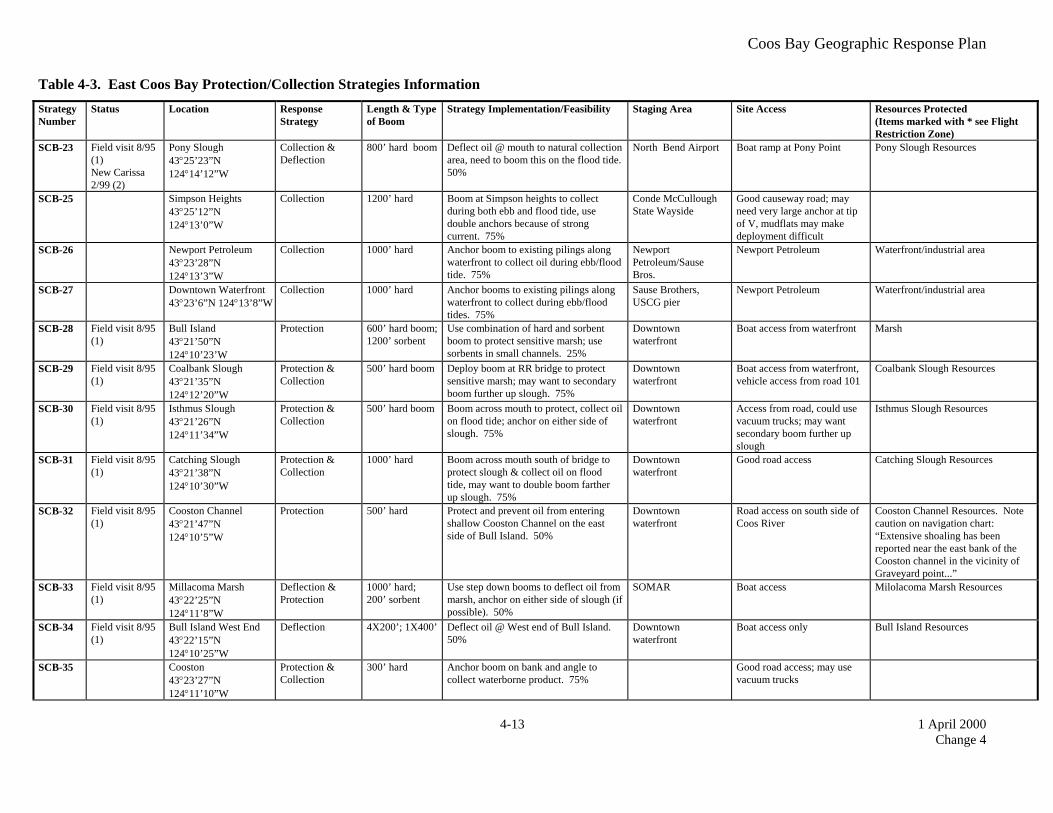
Table 4-3. East Coos Bay Protection/Collection Strategies Information Strategy Number
Status Location Response Strategy
Length & Type of Boom
Strategy Implementation/Feasibility Staging Area Site Access Resources Protected (Items marked with * see Flight Restriction Zone)
SCB-23 Field visit 8/95 (1) New Carissa 2/99 (2)
Pony Slough 43°25’23”N 124°14’12”W
Collection & Deflection
800’ hard boom Deflect oil @ mouth to natural collection area, need to boom this on the flood tide. 50%
North Bend Airport Boat ramp at Pony Point Pony Slough Resources
SCB-25 Simpson Heights 43°25’12”N 124°13’0”W
Collection 1200’ hard Boom at Simpson heights to collect during both ebb and flood tide, use double anchors because of strong current. 75%
Conde McCullough State Wayside
Good causeway road; may need very large anchor at tip of V, mudflats may make deployment difficult
SCB-26 Newport Petroleum 43°23’28”N 124°13’3”W
Collection 1000’ hard Anchor boom to existing pilings along waterfront to collect oil during ebb/flood tide. 75%
Newport Petroleum/Sause Bros.
Newport Petroleum Waterfront/industrial area
SCB-27 Downtown Waterfront 43°23’6”N 124°13’8”W
Collection 1000’ hard Anchor booms to existing pilings along waterfront to collect during ebb/flood tides. 75%
Sause Brothers, USCG pier
Newport Petroleum Waterfront/industrial area
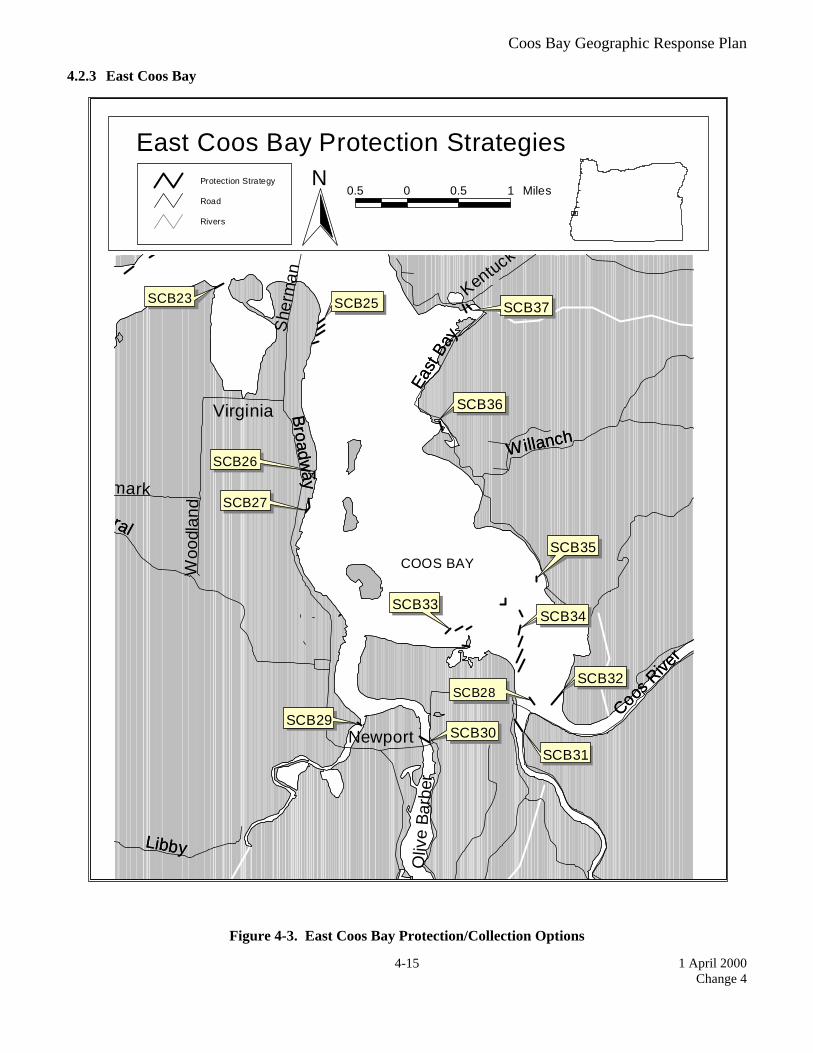
SCB-28 Field visit 8/95 (1)
Bull Island 43°21’50”N 124°10’23’W
Protection 600’ hard boom; 1200’ sorbent
Use combination of hard and sorbent boom to protect sensitive marsh; use sorbents in small channels. 25%
Downtown waterfront
Boat access from waterfront Marsh
SCB-29 Field visit 8/95 (1)
Coalbank Slough 43°21’35”N 124°12’20”W
Protection & Collection
500’ hard boom Deploy boom at RR bridge to protect sensitive marsh; may want to secondary boom further up slough. 75%
Downtown waterfront
Boat access from waterfront, vehicle access from road 101
Coalbank Slough Resources
SCB-30 Field visit 8/95 (1)
Isthmus Slough 43°21’26”N 124°11’34”W
Protection & Collection
500’ hard boom Boom across mouth to protect, collect oil on flood tide; anchor on either side of slough. 75%
Downtown waterfront
Access from road, could use vacuum trucks; may want secondary boom further up slough
Isthmus Slough Resources
SCB-31 Field visit 8/95 (1)
Catching Slough 43°21’38”N 124°10’30”W
Protection & Collection
1000’ hard Boom across mouth south of bridge to protect slough & collect oil on flood tide, may want to double boom farther up slough. 75%
Downtown waterfront
Good road access Catching Slough Resources
SCB-32 Field visit 8/95 (1)
Cooston Channel 43°21’47”N 124°10’5”W
Protection 500’ hard Protect and prevent oil from entering shallow Cooston Channel on the east side of Bull Island. 50%
Downtown waterfront
Road access on south side of Coos River
Cooston Channel Resources. Note caution on navigation chart: “Extensive shoaling has been reported near the east bank of the Cooston channel in the vicinity of Graveyard point...”
SCB-33 Field visit 8/95 (1)
Millacoma Marsh 43°22’25”N 124°11’8”W
Deflection & Protection
1000’ hard; 200’ sorbent
Use step down booms to deflect oil from marsh, anchor on either side of slough (if possible). 50%
SOMAR Boat access Milolacoma Marsh Resources
SCB-34 Field visit 8/95 (1)
Bull Island West End 43°22’15”N 124°10’25”W
Deflection 4X200’; 1X400’ Deflect oil @ West end of Bull Island. 50%
Downtown waterfront
Boat access only Bull Island Resources
SCB-35 Cooston 43°23’27”N 124°11’10”W
Protection & Collection
300’ hard Anchor boom on bank and angle to collect waterborne product. 75%
Good road access; may use vacuum trucks
Coos Bay Geographic Response Plan
1 April 2000 Change 4
4-14
Strategy Number
Status Location Response Strategy
Length & Type of Boom
Strategy Implementation/Feasibility Staging Area Site Access Resources Protected (Items marked with * see Flight Restriction Zone)
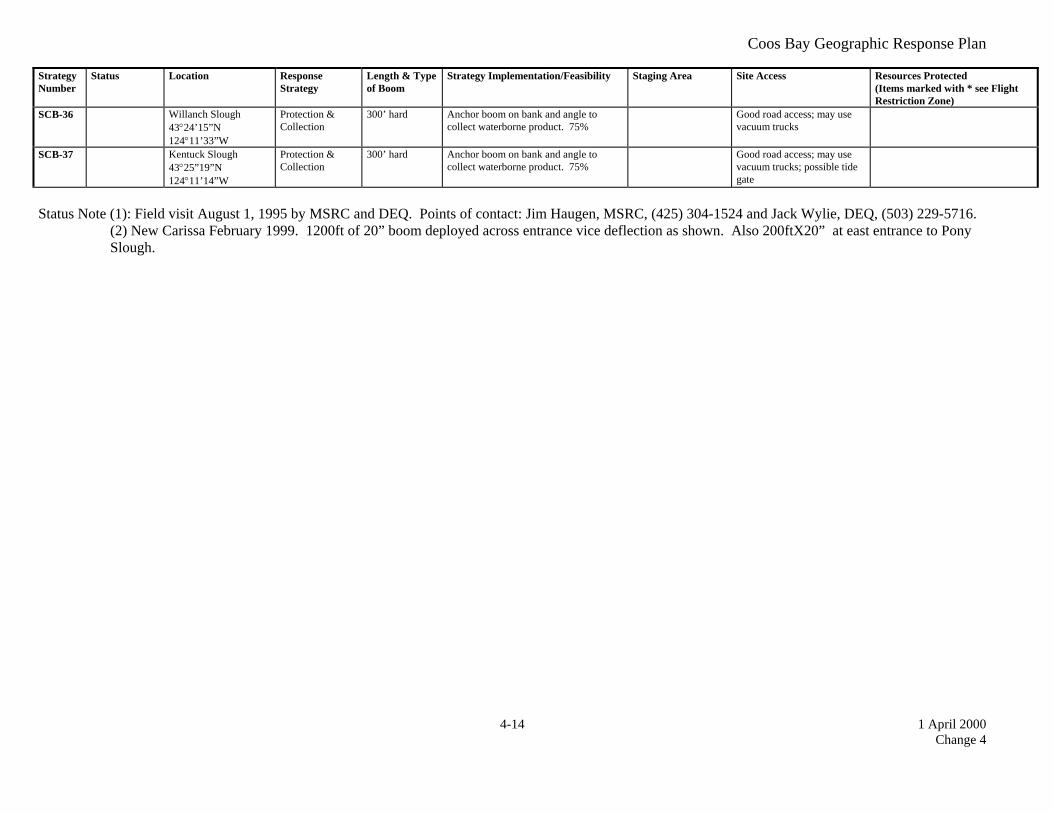
SCB-36 Willanch Slough 43°24’15”N 124°11’33”W
Protection & Collection
300’ hard Anchor boom on bank and angle to collect waterborne product. 75%
Good road access; may use vacuum trucks
SCB-37 Kentuck Slough 43°25”19”N 124°11’14”W
Protection & Collection
300’ hard Anchor boom on bank and angle to collect waterborne product. 75%
Good road access; may use vacuum trucks; possible tide gate
Status Note (1): Field visit August 1, 1995 by MSRC and DEQ. Points of contact: Jim Haugen, MSRC, (425) 304-1524 and Jack Wylie, DEQ, (503) 229-5716.
(2) New Carissa February 1999. 1200ft of 20” boom deployed across entrance vice deflection as shown. Also 200ftX20” at east entrance to Pony Slough.
Coos Bay Geographic Response Plan
1 April 2000 Change 4
4-15
4.2.3 East Coos Bay
SCB23 SCB25
SCB36
SCB35
SCB34SCB33
SCB32
SCB30SCB29
SCB31
SCB27
SCB26
mark
Coos R
iver
East
Bay
Willanch
Broadway
Libby
Woo
dlan
d
tral
Coos R
iver
East
Bay
Willanch
Broadway
Libby
Oliv
e B a
rber
She
rman
Newport
Kentuck
tral
SCB37
COOS BAY
Virginia
SCB28
Protection Strategy
Road
Rivers
N0.5 0 0.5 1 Miles
East Coos Bay Protection Strategies
Figure 4-3. East Coos Bay Protection/Collection Options

Coos Bay Geographic Response Plan
1 April 2000 Change 4
4-16
This Page Left Blank
Coos Bay Geographic Response Plan
1 April 2000 Change 4
4-17
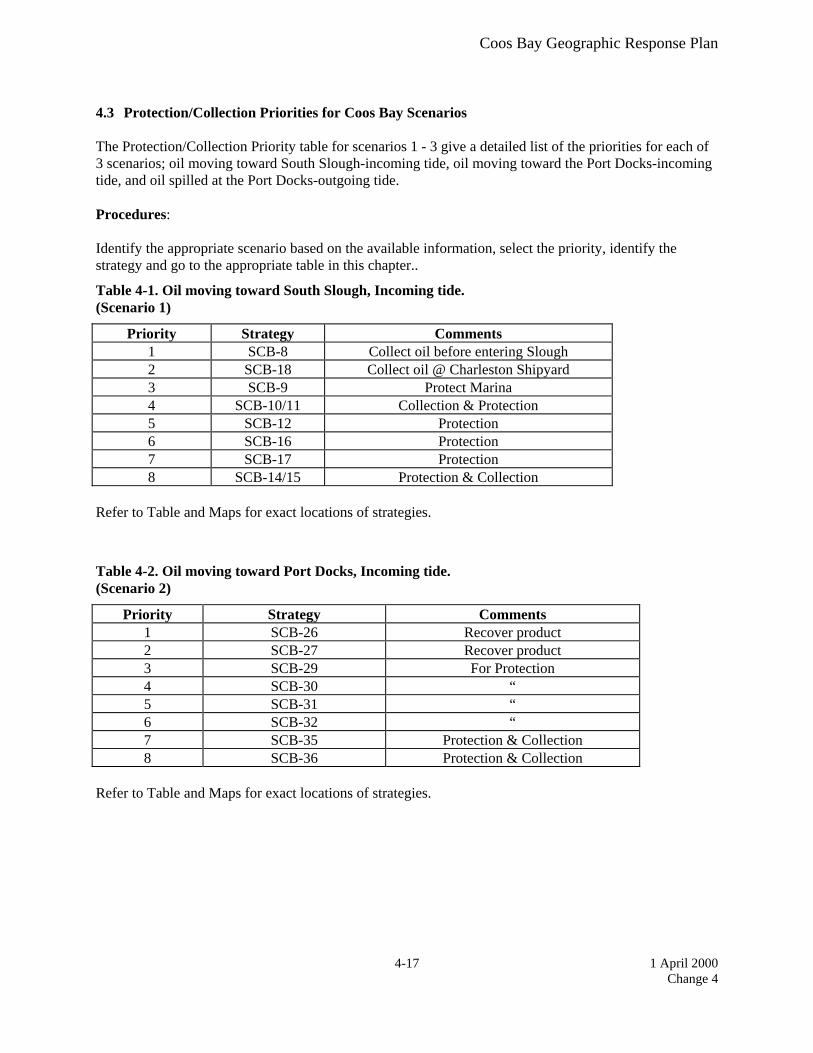
4.3 Protection/Collection Priorities for Coos Bay Scenarios The Protection/Collection Priority table for scenarios 1 - 3 give a detailed list of the priorities for each of 3 scenarios; oil moving toward South Slough-incoming tide, oil moving toward the Port Docks-incoming tide, and oil spilled at the Port Docks-outgoing tide. Procedures: Identify the appropriate scenario based on the available information, select the priority, identify the strategy and go to the appropriate table in this chapter..
Table 4-1. Oil moving toward South Slough, Incoming tide. (Scenario 1)
Priority Strategy Comments 1 SCB-8 Collect oil before entering Slough 2 SCB-18 Collect oil @ Charleston Shipyard 3 SCB-9 Protect Marina 4 SCB-10/11 Collection & Protection 5 SCB-12 Protection 6 SCB-16 Protection 7 SCB-17 Protection 8 SCB-14/15 Protection & Collection
Refer to Table and Maps for exact locations of strategies.
Table 4-2. Oil moving toward Port Docks, Incoming tide. (Scenario 2)
Priority Strategy Comments 1 SCB-26 Recover product 2 SCB-27 Recover product 3 SCB-29 For Protection 4 SCB-30 “ 5 SCB-31 “ 6 SCB-32 “ 7 SCB-35 Protection & Collection 8 SCB-36 Protection & Collection
Refer to Table and Maps for exact locations of strategies.

Coos Bay Geographic Response Plan
1 April 2000 Change 4
4-18
Protection/Collection Priorities Tables for Coos Bay (Continued)
Table 4-3. Oil spilled at Port Docks--Outgoing tide. (Scenario 3)
Priorities Strategy Comments 1 SCB-26 Recover oil 2 SCB-27 Recover oil 3 SCB-36 Protection & Collection 4 SCB-37 Protection & Collection 5 SCB-35 Protection & Collection 6 SCB-25 Collect oil @ Simpson Heights 7 SCB-24A&24B Natural collection area 8 SCB-23 Pony Slough
Refer to Table and Maps for exact locations of strategies.

Coos Bay Geographic Response Plan
1 December 1999 Change 3
5-1
5. Shoreline Countermeasures
5.1 Chapter Overview The following text and maps are in draft form, and are intended to serve as a training tool for countermeasure contingency planning and implementation for shoreline areas in Federal Region X. Shoreline countermeasure processes evolve to reflect increasingly efficient treatment techniques. Accordingly, the following information will be altered as new information is added.
5.2 Shoreline Type Maps The shoreline types in the following maps are a modified version of the environmental sensitivity index types for the Oregon coast and estuaries. The shoreline types were regrouped into five levels of sensitivity from the original ten shoreline types. The modified types are: 1. Open water, banks, or cliffs 2. Sand or gravel beaches 3. Riprap, sandy flats, or organic debris 4. Vegetated banks or tidal mud flats/aquatic beds 5. Marsh, swamp, or rocky intertidal
5.3 Oil Countermeasure Matrix The Northwest Area Committee has developed a manual and a series of matrices as a tool for shoreline countermeasure response. The Northwest Shoreline Countermeasures Assessment Manual is included in the Northwest Area Contingency Plan (Section 9640). Shoreline countermeasures following an oil spill are a critical element in determining the ultimate environmental impact and cost resulting from a spill. Local response organizations and agencies have developed mechanisms for identifying shorelines requiring treatment, establishing treatment priorities, monitoring the effectiveness and impacts of treatment, and for resolving problems as the treatment progresses. Each section of the manual has been adapted to the specific environments, priorities, and treatment methods appropriate to the planning area. These elements provide the information needed to select cleanup methods for specific combinations of shoreline and oil types. Local information on shoreline types (Discussed in chapter 2) can be obtained from Environmental Sensitivity Index (ESI) atlases prepared by NOAA for northern and southern Puget Sound, the Washington and Oregon coast, and the Columbia River.

Coos Bay Geographic Response Plan
1 June 1996 5-2
Shoreline TypeOpen water, banks, or cliffsSand or gravel beachesRiprap, sandy flats, or organic debrisVegetated banks or tidal mud flats/aquatic bedsMarsh, swamp, or rocky intertidal
South Coos Bay
Figure 5-1. South Coos Bay Shoreline Types

Coos Bay Geographic Response Plan
1 June 1996 5-3
Shoreline TypeOpen water, banks, or cliffsSand or gravel beachesRiprap, sandy flats, or organic debrisVegetated banks or tidal mud flats/aquatic bedsMarsh, swamp, or rocky intertidal
North Coos Bay
Figure 5-2. North Coos Bay Shoreline Types

Coos Bay Geographic Response Plan
1 June 1996 5-4
East Coos Bay
Shoreline TypeOpen water, banks, or cliffsSand or gravel beachesRiprap, sandy flats, or organic debrisVegetated banks or tidal mud flats/aquatic bedsMarsh, swamp, or rocky intertidal
Figure 5-3. East Coos Bay Shoreline Types

Coos Bay Geographic Response Plan
1 December 1999 Change 3
6-1
6. Sensitive Resource/Wildlife Flight Restriction Information Text to be provided by Oregon Department of Fish and Wildlife
6.1 Chapter Overview/Sensitive Resource Description
6.2 Fisheries
6.3 Wildlife
6.4 Marine Mammals Disturbance to marine mammals during oil spill response actions should be avoided at all times. Harassment of mammals by aircraft, boat and land activities causes animals to become agitated and engage in abnormal “avoidance” behaviors that are likely to increase the risk of exposure to oil contaminated areas. Of particular importance is to avoid disturbance of pinnipeds (seals and sea lions) on land haul-out areas. The more time these animals are allowed to rest on land, out of the water, the less chance for oil contamination. Overflights of the entire Cape Arago should be avoided at all times. Disturbance of the thousands of pinnipeds using this site as a resting area would greatly increase the numbers of animals in the water nearby that may come in contact with spilled oil.
6.5 Shorebirds, Waterfowl, and Raptors
6.6 Archeological Sites Archeological, Cultural and Tribal Religious Sites Archeological research in Coos Bay is incomplete. However, there are several archeological sites recorded in or near the intertidal zone, the areas that face the greatest threat from oil spills. The intertidal zones can contain ancient materials preserved by the anaerobic mud. Activities associated with oil spill response such as mechanical cleanup of contaminated areas could physically disturb artifacts and their historical context. Oil could also contaminate materials making carbon dating, restoration, and preservation extremely difficult or impossible. Tribes to be contacted in Coos County In the event of an oil spill within the aboriginal territory of the Confederated Tribes of Coos, Lower Umpqua, and Siuslaw Indians (CTCLUS), the Tribes should be contacted immediately. Coos tribal territory extends from Whisky Run north to Tenmile Creek and includes all of Coos Bay. The Coquille Indian Tribe owns some trust land on or near Coos Bay, and should also be contacted in the event of an oil spill. Immediate Response for the Confederated Tribes of Coos, Lower Umpqua, and Siuslaw Indians. • During business hours (8:00AM to 5:00PM), the Tribal Offices can be reached at (541) 267-5454. • Emergency after-hours contacts are as follows:
• First contact: Patty Whereat (541) 756-7073 or (541) 756-7318 • Second contact: Bob Polasky (541) • Third contact: Dick Clarkson (541)
During spill cleanup operations, in addition to the CTCLUS, the Bureau of Indian Affairs Portland Area Office, (503) 231-6749, and the Oregon State Historic Preservation Office, (503) 378-6508, should be notified.

Coos Bay Geographic Response Plan
1 December 1999 Change 3
6-2
Spill Cleanup Operations CTLUS keeps records of locations of tribal cultural sites. If a site or sites appear threatened by an oil spill or cleanup response, a professional archeologist approved by CTCLUS, familiar with the area should be included in the response effort. The archeologist, with the assistance of the Tribes, could identify site locations, assess the damage, and decide whether or not cleanup techniques would impact the cultural sites. Tribal members and the archeologist would monitor any recommended cleanup and associated land disturbance to ensure that minimal destruction occurs wherever possible. An archeologist should be assigned to the response team to conduct surveys for pre-cleanup, access roads, pits, and any other activities that would cause ground distrubance.
6.7 Flight Restriction Maps Wildlife Resource/Flight Restriction zones are designed to protect shorebirds and marine mammals from aerial disturbances common during a spill response.
6.8 Wildlife Resource/Flight Restriction Tables The Wildlife Resource/Flight Restriction Tables detail the location, protected resources, and applicable season for each flight restriction zone.
Coos Bay Geographic Response Plan
1 December 1999 Change 3
6-3
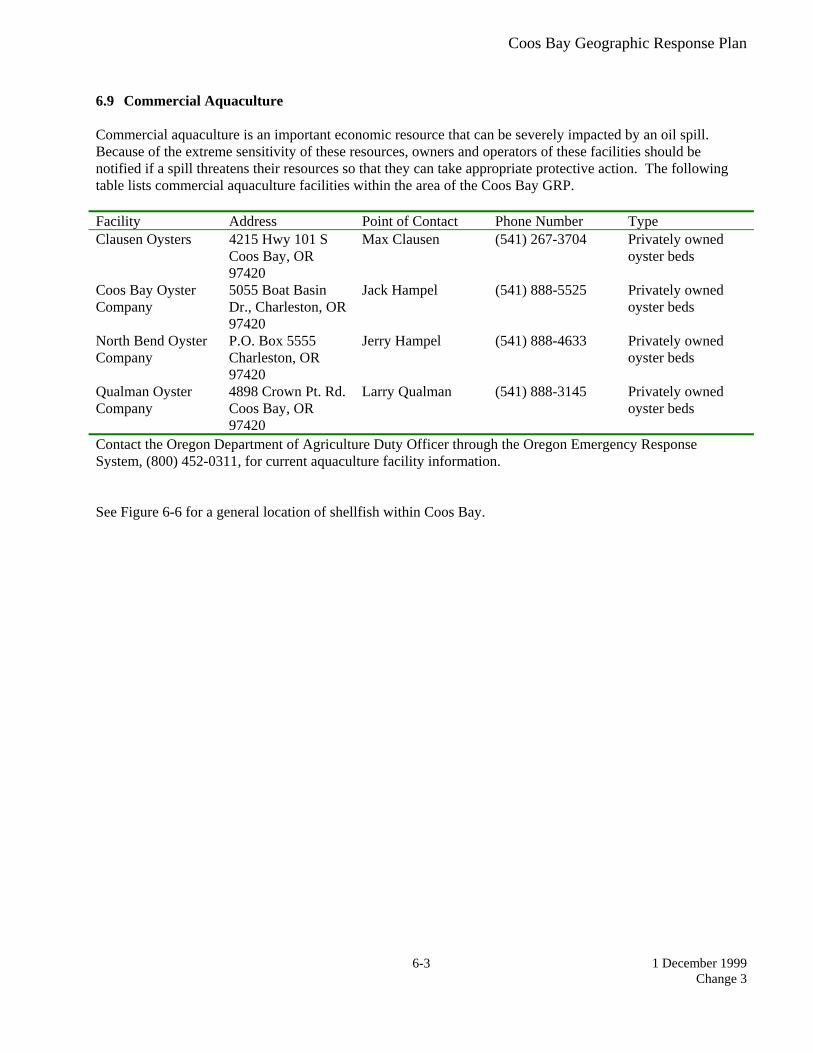
6.9 Commercial Aquaculture Commercial aquaculture is an important economic resource that can be severely impacted by an oil spill. Because of the extreme sensitivity of these resources, owners and operators of these facilities should be notified if a spill threatens their resources so that they can take appropriate protective action. The following table lists commercial aquaculture facilities within the area of the Coos Bay GRP. Facility Address Point of Contact Phone Number Type Clausen Oysters 4215 Hwy 101 S
Coos Bay, OR 97420
Max Clausen (541) 267-3704 Privately owned oyster beds
Coos Bay Oyster Company
5055 Boat Basin Dr., Charleston, OR 97420
Jack Hampel (541) 888-5525 Privately owned oyster beds
North Bend Oyster Company
P.O. Box 5555 Charleston, OR 97420
Jerry Hampel (541) 888-4633 Privately owned oyster beds
Qualman Oyster Company
4898 Crown Pt. Rd. Coos Bay, OR 97420
Larry Qualman (541) 888-3145 Privately owned oyster beds
Contact the Oregon Department of Agriculture Duty Officer through the Oregon Emergency Response System, (800) 452-0311, for current aquaculture facility information. See Figure 6-6 for a general location of shellfish within Coos Bay.

Coos Bay Geographic Response Plan
1 June 1996 6-4
Table 6-1 Wildlife Resource/Flight Restriction Table
A list of wildlife resources and any corresponding flight restriction zones is found below. Flight restriction zones are designed to protect shorebirds and marine mammals from aerial and terrestrial disturbances common during a spill response.
Code Location Seabird
Colony Seabird Conc.
Waterfowl Conc.
Mammal Haulout
Sensitive Nesting Species
Shorebird Conc.
Seasonality of Resource
Flight Restriction
Jan Feb Mar Apr May Jun Jul Aug Sep Oct Nov Dec W-1 North Slough Heron W-2 Haynes Inlet Yes W-3 North Slough Yes W-4 North Slough Yes Yes W-5 North Slough Yes W-6 Jordon Cove Yes Heron W-7 Kentuck Inlet Yes W-8 McCullough Bridge Yes W-9 Pony Slough Yes Heron W-10 Kentuck Inlet/Upper Coos Bay Yes Yes W-11 North Spit Yes W-12 Kentuck Inlet Yes W-13 Kentuck Inlet/UpperCoos
Bay/Simpson Heights Yes Yes Yes
W-14 S of Runway Yes W-15 North Spit Yes W-16 Spoil Island off Airport Yes W-17 Spoil Island off Airport/S of
Runway Yes Yes
W-18 Upper Coos Bay Yes W-19 North Spit Yes W-20 North Spit Yes Heron W-21 Upper Coos Bay Yes W-22 Barview Yes W-23 North Spit Yes Yes Heron W-24 North Spit Yes W-25 North Spit/Clam Island Yes Yes Yes Heron W-26 Upper Coos Bay/Marshfield
Channel Yes Yes
Months that resource is present in this location All zones include a 1200 foot flight restriction and a 1000-1500 foot ground access restriction. Contact the Oregon Department of Fish and Wildlife before entering restriction zones.

Coos Bay Geographic Response Plan
1 June 1996 6-5
Table 6-2 Wildlife Resource/Flight Restriction Table
A list of wildlife resources and any corresponding flight restriction zones is found below. Flight restriction zones are designed to protect shorebirds and marine mammals from aerial and terrestrial disturbances common during a spill response. Code Location Seabird
Colony Seabird Conc.
Waterfowl Conc.
Mammal Haulout
Sensitive Nesting Species
Shorebird Conc.
Seasonality of Resource
Flight Restriction
Jan Feb Mar Apr May Jun Jul Aug Sep Oct Nov Dec
W-27 Marshfield Channel Yes W-28 North Spit Heron Yes W-29 North Spit Yes W-30 Lower Bay Yes Yes W-31 T-25, R-T3, Sec 13 Heron W-32 Barview / Pigeon Pt. Yes Heron W-33 Sitka Dock Yes W-34 Barview / Sitka Dock Yes Yes W-35 Marshfield Channel / Coosten
Channel Yes Raptor
W-36 Coosten Channel Raptor W-37 Upper Coos Bay / Marshfield
Channel Yes Yes
W-38 Millacoma Marsh Raptor W-39 Pigeon Pt. / Barview Yes Yes Heron W-40 Bull Island / Marshfield
Channel Yes Heron
W-41 Tarheel Reservoir Feeding Site / Lower Bay
Yes Yes Raptor feeding
W-42 Lower Bay / Barview / Tarheel Reservoir Feeding Site
Yes Yes Yes Raptor feeding
W-43 East side Heron W-44 Tarheel Reservoir Raptor W-45 Coos Head Seabird W-46 Gregory Pt. Seabird W-47 Lower Bay / South Slough Yes Yes Yes W-48 South Slough Yes W-49 Charelston Marina Yes W-50 Charelston Marina / South
Slough Yes Yes
W-51 Charelston Marina / South Slough
Yes Yes
W-52 Charelston Marina/ Boat Basin Yes Yes Months that resource is present in this location All zones include a 1200 foot flight restriction and a 1000-1500 foot ground access restriction. Contact the Oregon Department of Fish and Wildlife before entering restriction zones.

Coos Bay Geographic Response Plan
1 June 1996 6-6
Table 6-3 Wildlife Resource/Flight Restriction Table
A list of wildlife resources and any corresponding flight restriction zones is found below. Flight restriction zones are designed to protect shorebirds and marine mammals from aerial and terrestrial disturbances common during a spill response. Code Location Seabird
Colony Seabird Conc.
Waterfowl Conc.
Mammal Haulout
Sensitive Nesting Species
Shorebird Conc.
Seasonality of Resource
Flight Restriction
Jan Feb Mar Apr May Jun Jul Aug Sep Oct Nov Dec W-53 South Slough Yes W-54 Joe Ney Slough Yes W-55 South Slough/Hayward Creek
Rppst Site Yes Raptor
W-56 South Slough/Charleston Boat Basin
Yes Yes
W-57 Charleston Boat Basin Yes W-58 Lower Bay Souith Slough Yes Yes Yes W-59 Charleston Marina/South
Slough/Charleston Boat Basin Yes Yes Yes
W-60 Charleston Marina/South Slough
Yes Yes
W-61 Charleston Marina/South Slough
Yes Yes
W-62 South Slough Wader W-63 Charleston Boat Basin/South
Slough Yes Yes
W-64 South Slough Yes W-65 South Slough Yes Wader W-69 Roosevelt & Blvd Nest Wader W-70 Roosevel & Blvd Nest/South
Slough Yes Wader
W-71 Hayward Creek Roost Site Raptor W-72 South Slough/ Cullver Point Yes Yes Wader W-73 Hayward Creek Roost Site Raptor W-74 Hayward Creek Roost Site Raptor W-75 Hayward Creek Nest Raptor W-76 South Slough/Cullver Point Yes W-77 South Slough/Cullver Point Yes W-78 Elliot Creek Yes W-79 Talbot Creek Yes Months that resource is present in this locationAll zones include a 1200 foot flight restriction and a 1000-1500 foot ground access restriction. Contact the Oregon Department of Fish and Wildlife before entering restriction zones.

Coos Bay Geographic Response Plan
1 December 1999 Change 3
6-7
Coos Bay Seabirds
45
8
1617
2324
25
30
41
42
47,49,50,51,52,58,59,60,61
Figure 6-1. Seabirds

Coos Bay Geographic Response Plan
1 December 1999 Change 3
6-8
Coos Bay Waterfowl
6 7
9 10 12131417
19
20
222325
262729
32
34 353739
4042
5470
72
76
7778
79
65
Figure 6-2. Waterfowl
Coos Bay Geographic Response Plan
1 December 1999 Change 3
6-9
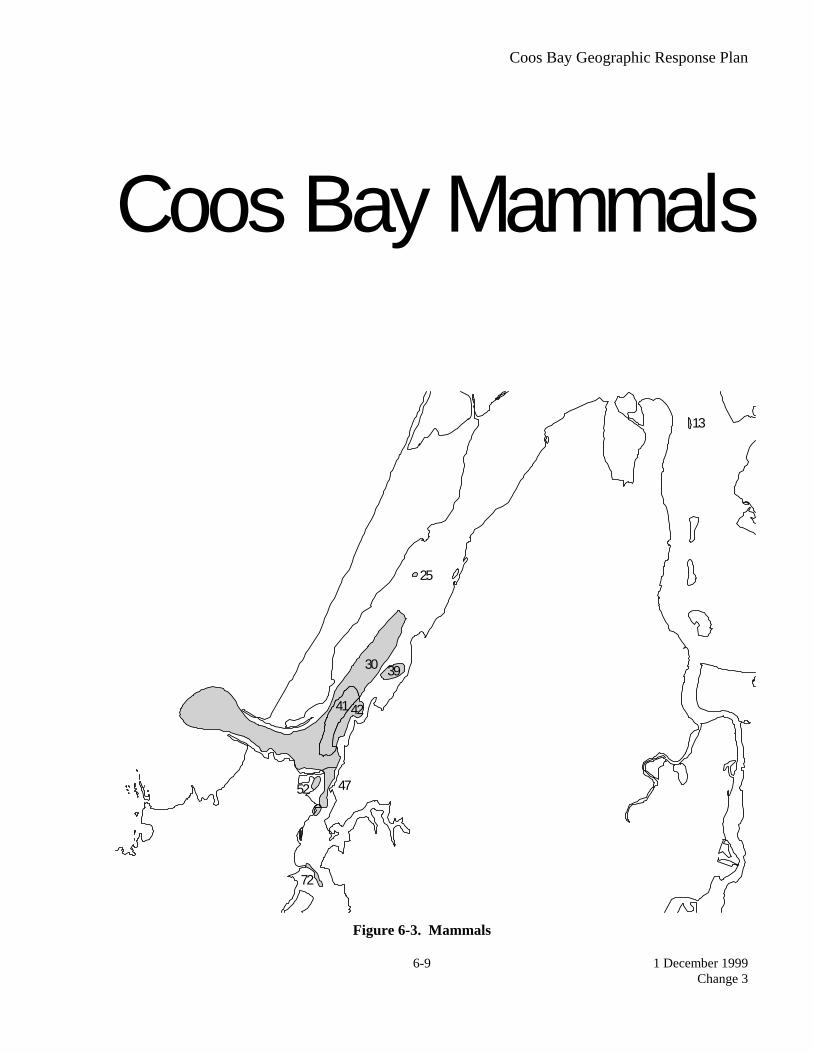
Coos Bay Mammals
13
25
30 39
4142
4752
72
Figure 6-3. Mammals

Coos Bay Geographic Response Plan
1 December 1999 Change 3
6-10
Coos Bay Nests
1
283133 34
35 3638
434445
4655
71
737475
Figure 6-4. Nests
Coos Bay Geographic Response Plan
1 December 1999 Change 3
6-11
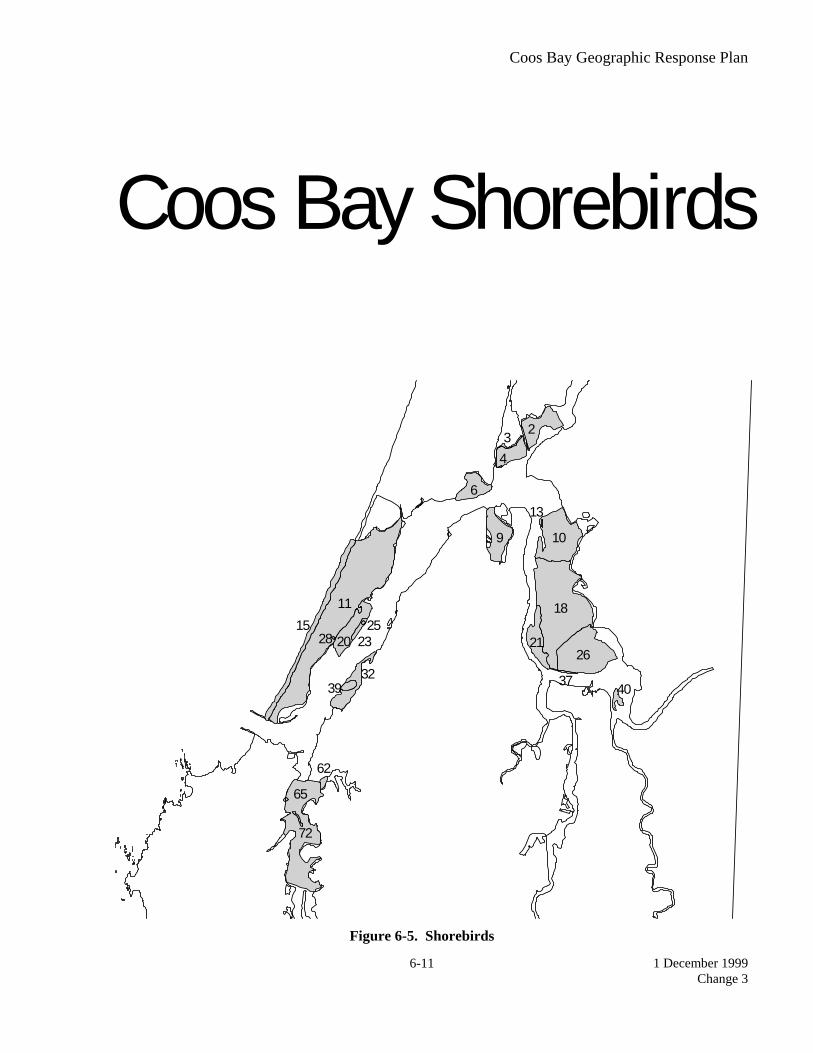
Coos Bay Shorebirds
234
6
9 10
11
13
1518
20 212325
2628
32 3739 40
62
72
65
Figure 6-5. Shorebirds

Coos Bay Geographic Response Plan
1 December 1999 Change 3
6-12
Coos BayShellfish
CoastShrimpRclamClamOyster
Figure 6-6. Shellfish

Coos Bay Geographic Response Plan
1 December 1999 Change3
7-1
7. Logistical Information The following list was compiled at the Coos Bay Geographic Response Plan Workshop held in Coos Bay on February 18, 1993 and updated May 1996. Areas of information include command posts; communications; equipment cache locations; inventory of local support equipment; air support; access points to the bay; and other pertinent logistical support.
Table 7-1, Logistical Information
Subject Name Characteristics Contact Phone # Command Posts Coos Bay Sause Brothers
Training Facility Meeting Rooms, training equipment
Dick Lauer (541) 269-5841 (800) 234-5841
Coos Bay National Guard Armory
(541) 888-5132
Coos Bay Air National Guard Facility
(541) 888-7514
Coos Bay Coos Forest Protective Association
Gene Brach (541) 267-3161
Coos Bay Port Offices Meeting Room, some Communications
Allan Rumbaugh (541) 267-7678
Coos Bay Red Lion Inn Meeting Rooms, Lodging
(541) 267-4141
Communications Bureau of Land Management
12 four wheel drive vehicles w/ communications to BLM dispatch center, North Bend
Tim Votaw (541) 756-0100
Coos Bay Fire Dept. Empire Fire Station HAZMAT mobile command post w/ radio, fax, phone
(541) 888-2116
Coos County Sheriff’s Dept. Vehicles w/ comms to center
(541) 396-2106
State Police Mobile Comms to Center
911 or thru OERS
Coos Bay Response Co-op
Mobile Comms Van
Dick Lauer (541) 269-5841
MSRC Mobile Comms Van
(206) 252-1300
OERS Oregon Emergency Management
Mobile Comms Van
Dan Malin (800) 452-0311 (800) OILS-911

Coos Bay Geographic Response Plan
1 December 1999 Change3
7-2
Subject Name Characteristics Contact Phone # Equipment Cache Locations
Coos Bay Bayshore Dock-Sause Brothers
1200’ hard boom Dick Lauer (541) 269-5841 (800) 234-5841
Coos Bay TOSCO 1200’ hard boom (541) 269-9600
Coos Bay Sause Brothers Ocean Towing Corporation
3600’ hard boom Dick Lauer (541) 269-5841 (800) 234-5841
Coos Bay Newport Petroleum 2400’ hard boom Jim Hurd (541) 756-0481
Coast Guard Air Station
U. S. Coast Guard Group North Bend
Response Trailer Duty Officer (541) 756-9211
Inventory of Local Support Equipment
Helicopter Support/Air Support
Coos Bay Bay City Ambulance 2 fixed wing (541) 347-3973
Coos Bay Sause Brothers 1 fixed wing Dick Lauer (541) 269-5841
North Bend Coos Aviation Aircraft Charters (541) 756-5181
North Bend Pegasus Air Aircraft Rental North Bend Airport (541) 756-5727
Access Points to Harbor/Boat Ramps
Charleston Charleston Boat Basin Concrete, parking, restrooms
Coos Bay Conde McCulloch Gravel Coos Bay Empire Boat Ramp Concrete, parking,
restrooms
Coos Bay Pony Point Concrete, parking, restrooms
Port of Coos Bay, Allan Rumbaugh
(541) 267-7678
Coos Bay Myrtle Tree Boat Ramp
Concrete, parking, restrooms

Coos Bay Geographic Response Plan
1 December 1999 Change3
7-3
Staging Areas NOTE: For most staging areas, contact local county emergency manager or sheriff’s department.
Coos Bay BLM North Spit Boat Ramp
Paved parking, restrooms
Tim Votaw (541) 756-0100
Coos Bay Pony Point Boat Ramp near airport
concrete, parking, restrooms
Port of Coos Bay, Allan Rumbaugh
(541) 267-7678
Coos Bay Port of Coos Bay Barge slip dock Port of Coos Bay, Allan Rumbaugh
(541) 267-7678
Coos Bay SOMAR Extensive staging and equipment areas
Dick Lauer (541) 269-5841 (800) 234-5841
Coos Bay Port Boat Ramp Large, Paved staging area
Port of Coos Bay, Allan Rumbaugh
(541) 267-7678
Recreational Activities which could interfere
Tribal Resources Coquille Tribe Ed Metcalf (541)
267-4587 Confederated Tribes
of Coos and Lower Umpqua
Howard Kubli—Administration Office
(541) 267-5454
Key Local Elected Officials
Coos Bay Mayor Joseph Benetti (541) 269-8912
Coquille City Manager Joseph Wolf (541) 396-2116
North Bend Mayor John Brigg (541) 756-8534
Fire Department Coos Bay City Fire Dept. Business phone (541)
269-1191 Coquille City Fire Dept. Business phone (541)
396-2232 North Bend City Fire Dept. Business phone (541)
756-3135 Local Personnel Support
Oregon State Parks All beach areas south of Florence
(541) 269-9412
Coos Bay Geographic Response Plan
1 December 1999 Change3
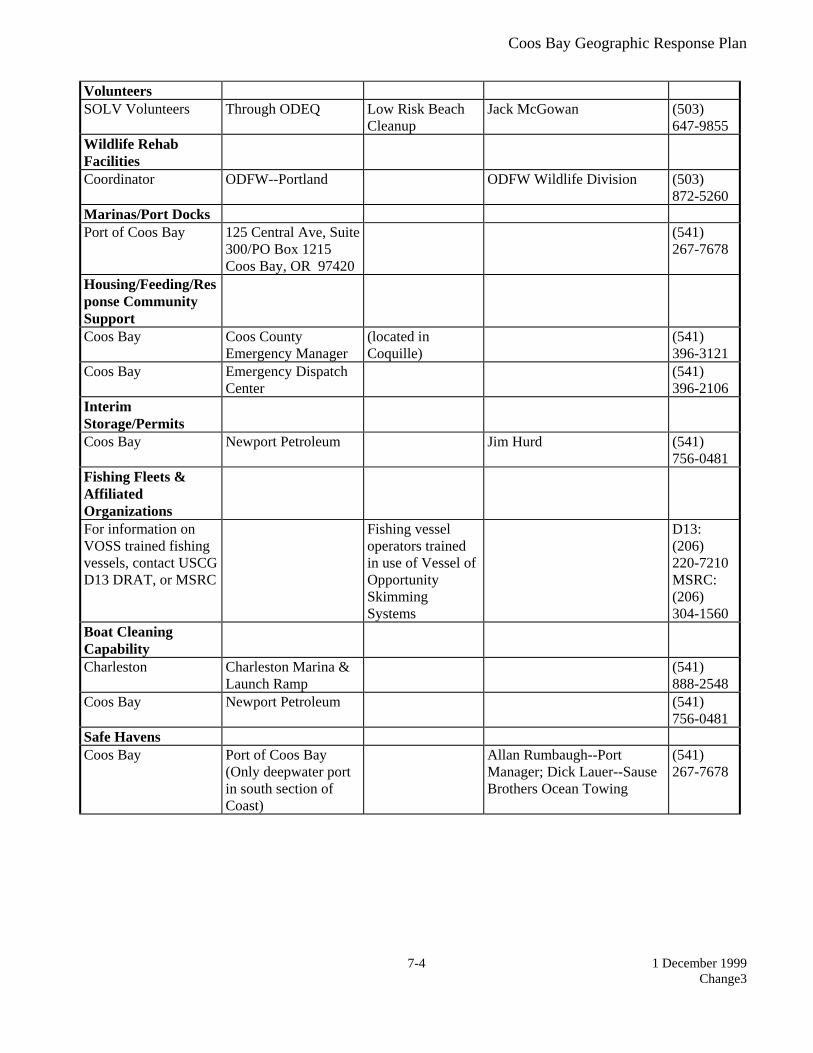
7-4
Volunteers SOLV Volunteers Through ODEQ Low Risk Beach
Cleanup Jack McGowan (503)
647-9855 Wildlife Rehab Facilities
Coordinator ODFW--Portland ODFW Wildlife Division (503) 872-5260
Marinas/Port Docks Port of Coos Bay 125 Central Ave, Suite
300/PO Box 1215 Coos Bay, OR 97420
(541) 267-7678
Housing/Feeding/Response Community Support
Coos Bay Coos County Emergency Manager
(located in Coquille)
(541) 396-3121
Coos Bay Emergency Dispatch Center
(541) 396-2106
Interim Storage/Permits
Coos Bay Newport Petroleum Jim Hurd (541) 756-0481
Fishing Fleets & Affiliated Organizations
For information on VOSS trained fishing vessels, contact USCG D13 DRAT, or MSRC
Fishing vessel operators trained in use of Vessel of Opportunity Skimming Systems
D13: (206) 220-7210 MSRC: (206) 304-1560
Boat Cleaning Capability
Charleston Charleston Marina & Launch Ramp
(541) 888-2548
Coos Bay Newport Petroleum (541) 756-0481
Safe Havens Coos Bay Port of Coos Bay
(Only deepwater port in south section of Coast)
Allan Rumbaugh--Port Manager; Dick Lauer--Sause Brothers Ocean Towing
(541) 267-7678

Coos Bay Geographic Response Plan .
1 June 1996 1
Appendices Appendix A: Summary of Protection Techniques
Protection Techniques
Description Primary Logistical Requirements Limitations
ONSHORE Beach Berms A berm is constructed along the top of the mid-
inter tidal zone from sediments excavated along the downgradient side. The berm should be covered with plastic or geo-textile sheeting to minimize wave erosion.
• Bulldozer/Motor grader -1 • Personnel - equipment operator & 1 worker • Misc. - plastic or geotextile sheeting
• High wave energy • Large tidal range • Strong along shore currents
Geotextiles A roll of geotextile, plastic sheeting, or other impermeable material is spread along the bottom of the supra-tidal zone & fastened to the underlying logs or stakes placed in the ground.
• Geotextile - 3 m wide rolls • Personnel - 5 • Misc. - stakes or tie-down cord
• Low sloped shoreline • High spring tides • Large storms
Sorbent Barriers A barrier is constructed by installing two parallel lines of stakes across a channel, fastening wire mesh to the stakes & filling the space between with loose sorbents.
Per 30 meters of barrier • Wire mesh - 70 m x 2 m • Stakes - 20 • Sorbents - 30 m2 • Personnel - 2 • Misc. - fasteners, support lines, additional stakes, etc.
• Waves > 25 cm • Currents > 0.5 m/s • Tidal range > 2 m
Inlet Dams A dam is constructed across the channel using local soil or beach sediments to exclude oil from entering channel.
• Loader - 1 • Personnel - equipment operator & 1 worker or several
workers w/shovels
• Waves > 25 cm • Tidal range exceeding dam
height • Freshwater outflow
NEARSHORE Containment Booming
Boom is deployed in a "U" shape in front of the oncoming slick. The ends of the booms are anchored by work boats or drogues. The oil is contained within the "U" & prevented from reaching the shore.
For 150 meters Slick: • Boom - 280 m • Boats - 2 • Personnel - boat crews & 4 boom tenders • Misc. - tow lines, drogues, connectors, etc.
• High winds • Swells > 2 m • Breaking waves > 50 cm • Currents > 1.0 m/s
Exclusion Booming Boom is deployed across or around sensitive areas & anchored in place. Approaching oil is deflected or contained by boom.
Per 300 meters of Boom • Boats - 1 • Personnel - boat crew & 3 boom tenders • Misc.- 6 anchors, anchor line, buoys, etc.
• Currents > 0.5 m/s • Breaking waves > 50 cm • Water depth > 20 m

Coos Bay Geographic Response Plan .
1 June 1996 2
Protection Techniques
Description Primary Logistical Requirements Limitations
Deflection Booming Boom is deployed from the shoreline away from the approaching slick & anchored or held in place with a work boat. Oil is deflected away from shoreline.
Single Boom, 0.75 m/s knot current • Boom - 60 m • Boats - 1 • Personnel - boat crew + 3 • Misc. - 3 anchors, line, buoys, recovery unit
• Currents > 1.0 m/s • Breaking waves > 50 cm
Diversion Booming Boom is deployed from the shoreline at an angle towards the approaching slick & anchored or held in place with a work boat. Oil is diverted towards the shoreline for recovery.
Single Boom, 0.75 m/s knot current • Boom - 60 m • boats - 1 • Personnel - boat crew + 3 • Misc. - 3 anchors, line, buoys, recovery unit
• Currents > 1.0 m/s • Breaking waves > 50 cm
Skimming Self-propelled skimmers work back & forth along the leading edge of a windrow to recover the oil. Booms may be deployed from the front of a skimmer in a "V" configuration to increase sweep width. Portable skimmers are placed within containment booms in the area of heaviest oil concentration.
Self-propelled (None) Towed • Boom - 200 m • Boats - 2 • Personnel - boat crews & 4 boom tenders • Misc. - tow lines, bridles, connectors, etc. Portable • Hoses - 30 m discharge • Oil storage - 2000 liters
• High winds • Swells > 2 m • Breaking waves > 50 cm • Currents > 1.0 m/s
Source is R. Miller of Clean Sound Cooperative.

Coos Bay Geographic Response Plan
1 December 1999 Change 3
B-1
Appendix B: Geographic Response Plan Contributors
Local Representatives Port of Coos Bay Mr. Mike Gaul Industry and Response Contractors Global Environmental Mr. Thom Davis Marine Spill Response Corporation Mr. Mike LaTorrre Mr. Jim Haugen Sause Brothers Mr. Dick Lauer Federal Representatives NOAA Dr. Sharon Christopherson Mr. Gary May Department of Interior Mr. Chuck Polityka Mr. Preston Sleeger USFWS Ms. Colleen Henson Mr. Roy Lowe United States Coast Guard LTJG Robert Myles State Representatives Oregon Department of Environmental Quality Mrs. Elizabeth Dimmick Mr. Ruben Kretzschmar Mr. Paul Slyman Mr. Jack Wylie
Oregon Department of Fish and Wildlife Mr. Dave Fox Mr. Dale Nelson Mr. Greg Robart Mr. John Toman Mr. Dan Van Dyke Oregon State Service Center for Geographic Information Systems Mr. Richard Crucchiola Mrs. Patti Haggerty Mr. Lee Row Mr. Mark Kinslow South Slough National Estuarine Reserve Mr. Mike Graybill Other

Coos Bay Geographic Response Plan
1 June 1996 B-2

Coos Bay Geographic Response Plan
C-1 1 December 1999 Change 3
Appendix C: Geographic Response Plan Comments/Corrections/Suggestions
If you have any questions regarding this document or find any errors with this document please notify one of the following agencies: • USCG Marine Safety Office Puget Sound, Planning Department • USCG Marine Safety Office Portland, Planning Department • Washington Department of Ecology, Central Programs Branch • Oregon Department of Environmental Quality, Land Quality Division • Idaho Emergency Response Commission • Environmental Protection Agency Region 10 You can use the tear out suggestion form or contact an agency using one of the following: Phone Numbers: USCG MSO Puget Sound (206) 217-6213 USCG MSO Portland (503) 247-4015 Washington DOE (360) 407-6971 Oregon DEQ (503) 229-5716 Idaho ERC (208) 334-3263 EPA (206) 553-6901 E-mail Address: USCG [email protected] Oregon DEQ [email protected] Address: Commanding Officer United States Coast Guard MSO Puget Sound Planning Department 1519 Alaskan Way South Seattle, WA 98134-1192 Commanding Officer United States Coast Guard MSO Portland Planning Department 6767 North Basin Ave Portland, OR 97217-3992
Washington Department of Ecology Central Programs Branch Policy and Planning Section P.O. Box 47600 Olympia, WA 98504 Oregon Department of Environmental Quality Land Quality Division 811 SW Sixth Avenue Portland, OR 97204
Office of The Governor Idaho Emergency Response Commission 1109 Main Statehouse Boise, ID 83720-7000 Environmental Protection Agency Emergency Response Branch 1200 Sixth Avenue Seattle, WA 98101

Coos Bay Geographic Response Plan
C-2 1 December 1999 Change 3
This Page Left Blank

Coos Bay Geographic Response Plan
C-3 1 December 1999 Change 3
Geographic Response Plan
Comments/Corrections/Suggestions Directions: (Make a copy of this before you fill in so you have extra forms.) Fill in your name, address, agency, and phone number. Fill in the blanks regarding the location of information in the plan being commented on. Make comments in the space provided. Add extra sheets as necessary. Fold in thirds so the address label is visible and tape closed (don't staple). Name:______________________ Title:____________ Agency: __________________________ Address: ________________________________________________________________________ City: _______________________ State/Province:______ Zip/Postal Code: __________________ Phone: (____) _______________ Page Number: _______________ Location on page (chapter, section, paragraph) (e.g. 2.1, paragraph 3): _______________________ Comments:______________________________________________________________________ _______________________________________________________________________________ _______________________________________________________________________________ _______________________________________________________________________________ _______________________________________________________________________________ _______________________________________________________________________________ _______________________________________________________________________________ _______________________________________________________________________________ _______________________________________________________________________________ _______________________________________________________________________________