Coordination Chemistry of Siderophores: The …...Coordination Chemistry of Siderophores: The...
113
Coordination Chemistry of Siderophores: The Intersection of Bacterial Iron Acquisition and Host Defense By Benjamin Earl Allred A dissertation submitted in partial satisfaction of the requirements for the degree of Doctor of Philosophy in Chemistry in the Graduate Division of the University of California, Berkeley Committee in charge: Professor Kenneth N. Raymond, Chair Professor Christopher J. Chang Professor Daniel A. Portnoy Fall 2013
Transcript of Coordination Chemistry of Siderophores: The …...Coordination Chemistry of Siderophores: The...

Coordination Chemistry of Siderophores: The Intersection of Bacterial Iron Acquisition and Host Defense
By
Benjamin Earl Allred
A dissertation submitted in partial satisfaction of the
requirements for the degree of
Doctor of Philosophy
in
Chemistry
in the
Graduate Division
of the
University of California, Berkeley
Committee in charge:
Professor Kenneth N. Raymond, Chair Professor Christopher J. Chang
Professor Daniel A. Portnoy
Fall 2013


Abstract
Coordination Chemistry of Siderophores: The Intersection of
Bacterial Iron Acquisition and Host Defense
by
Benjamin Earl Allred
Doctor of Philosophy in Chemistry
University of California, Berkeley
Professor Kenneth N. Raymond, Chair
Bacterial pathogens acquire the iron they need for survival and growth in a host by using siderophores. The structures of siderophores are specialized for binding ferric ion with high affinity. Siderophore structures are also specialized to specifically interact with the proteins that mediate siderophore function. These proteins include the bacterial proteins involved in siderophore uptake and utilization, as well as host proteins that inhibit bacterial iron acquisition by intercepting siderophores.
The interactions between siderophores and iron underlie biological function. The fundamental coordination chemistry of catecholate and hydroxamate siderophores affects protein interactions during siderophore uptake and host defense. Chapter 1 reviews previous studies on siderophore coordination chemistry and the effects it has on protein interactions and biology with emphasis on research from the Raymond laboratory.
The human protein siderocalin defends against siderophore-mediated iron acquisition. Human siderocalin recognizes the metal center of catecholate siderophores, including enterobactin, with high affinity. Several pathogens modify the catecholate metal binding units to make stealth siderophores that are not recognized by human siderocalin. As presented in Chapter 2, the pathogens Vibrio fluvialis and Vibrio cholerae use the siderophores fluvibactin and vibriobactin, respectively, which have catechol-oxazoline metal-binding units. The catechol-oxazoline had been proposed to be a stealth mechanism, but the results herein presented clearly demonstrate that it is not a stealth mechanism. Catechol-oxazoline coordinates iron in either a catecholate mode or a phenolate-oxazoline mode. The phenolate-oxazoline mode is not recognized by siderocalin while the catecholate mode is. Siderocalin stabilizes the catecholate mode sufficiently to cause a shift from the phenolate-oxazoline mode at physiological pH. The high affinity recognition of the ferric triscatecholate metal center allows siderocalin to defend against iron acquisition by a large number of bacterial siderophores.
Siderocalin defense has been identified in hosts other than humans. Ex-FABP is a protein found in chickens that has high structural homology to human siderocalin. Chapter 3 reports that Ex-FABP binds many of the same siderophores that are bound by human siderocalin. Unlike human siderocalin, the binding pocket of Ex-FABP is expanded to allow it to bind glucosylated
1

enterobactin. Many of the pathogens specific to chickens use glucosylated enterobactin siderophores known as salmochelins. Salmochelins are stealth siderophores in humans. The siderophore recognition of Ex-FABP demonstrates that siderophore binding proteins may be a general host defense mechanism, and that siderocalins have adapted to the pathogens most frequently encountered by the host. Siderocalin defense and stealth siderophores are at the edge of the arms race for iron.
Siderophores carry iron into a bacterial cell through specific transport systems. Once inside the cell, the iron must be removed from the siderophore. Bacteria that use ferric enterobactin remove the iron by hydrolyzing the backbone with an esterase followed by reduction of the ferric ion. Hydrolysis is necessary because the high stability of intact ferric enterobactin prevents biological reduction and iron release. V. cholerae had been reported to use ferric enterobactin, but it does not have an esterase to hydrolyze the backbone. Chapter 4 reports that V. cholerae does not use intact ferric enterobactin, but that it most likely uses ferric complexes of enterobactin hydrolysis products.
Uptake of ferric siderophores relies on specific cell membrane receptors. Many siderophore receptors recognize the apo-siderophores as well as the ferric complexes. Binding apo-siderophores does not directly deliver iron to the bacteria, but it plays a role in the uptake mechanism. Chapter 5 describes YxeB, the ferrichrome/ferrioxamine receptor of Bacillus cereus. YxeB transports the siderophores using a Gram-positive siderophore-shuttle in which metal exchange between a ferric siderophore and the bound apo-siderophore is facilitated by the receptor. Metal exchange is not required for uptake, but the siderophore-shuttle is faster than transport without metal exchange.
Metal exchange, iron release, and the sterics and electronics of the metal center are coordination chemistry principles that influence the interactions between siderophores and proteins. Proteins usher siderophores through the biological functions of removing iron from the host, passing through the bacterial membrane, and releasing iron to the cell. Therefore, siderophores act as the intermediaries between ferric ion and the biology of bacterial iron uptake.
2

Table of Contents
Chapter 1. Coordination Chemistry of Microbial Iron Transport ...........................................1 Iron and Bacterial Siderophores.......................................................................................................1 Siderophore Stability .......................................................................................................................2 Siderophores Remove Iron from Host Proteins ...............................................................................6 Host Defense against Siderophores .................................................................................................7 Removing Iron from Siderophores ..................................................................................................8 Metal Substitution ............................................................................................................................8 Configuration of Metal Siderophore Complexes .............................................................................9 Conclusion .....................................................................................................................................11 References ......................................................................................................................................11 Chapter 2. Siderocalin Outwits the Coordination Chemistry of Vibriobactin, a Siderophore of Vibrio cholerae..........................................................................................................................14 Siderocalin and Stealth Siderophores ............................................................................................14 Synthesis of the Siderophore Library ............................................................................................15 Scn Binding Assays .......................................................................................................................19 Fe-Fluvibactin:Scn Structure .........................................................................................................21 Solution Thermodynamics .............................................................................................................22 Absorbance Measurements of Scn and Fe-Vibriobactin ...............................................................26 Readjustment of the Fe-Vibriobactin Dissociation Constant.........................................................27 Conclusions ....................................................................................................................................29 Methods..........................................................................................................................................30
i

Permission ......................................................................................................................................39 References ......................................................................................................................................39 Chapter 3. Galline Ex-FABP is a Siderocalin that Binds Mono-Glucosylated Enterobactin ........................................................................................................................................................42 Ex-FABP is a Siderocalin ..............................................................................................................42 Salmochelins ..................................................................................................................................43 Synthesis of MGE and DGE ..........................................................................................................43 Ex-FABP Binding Assays..............................................................................................................45 Ex-FABP Structure ........................................................................................................................46 Discussion ......................................................................................................................................48 Methods..........................................................................................................................................49 Permission ......................................................................................................................................51 References ......................................................................................................................................51 Chapter 4. Vibrio cholerae Does Not Use Intact Ferric Enterobactin .....................................53 Vibrio cholerae and Iron Uptake ...................................................................................................53 Siderophore Utilization in V. cholerae ..........................................................................................54 Enterobactin Hydrolysis.................................................................................................................56 Synthesis of Enterobactin ..............................................................................................................58 Synthesis of Enterobactin Hydrolysis Products .............................................................................59 V. cholerae Enterobactin Utilization..............................................................................................64 Methods..........................................................................................................................................66
ii

References ......................................................................................................................................71 Chapter 5. Gram-Positive Siderophore-Shuttle Mechanism of Bacillus cereus YxeB ..........74 Bacterial Siderophore Transport ....................................................................................................74 Results ............................................................................................................................................77 YxeB Binds DFO, FO, dFch, and Fch ...............................................................................77 YxeB is the Sole FO/Fch-Binding Protein.........................................................................79 Cr-DFO and Ga-DFO are FO Analogs ..............................................................................80 Cr-DFO/DFO Growth Assay .............................................................................................81 In Vivo Cr-DFO/FO Uptake Assay ...................................................................................83 In Vitro Cr-DFO/FO Competition Assay ..........................................................................84 Discussion ......................................................................................................................................86 YxeB Possesses a Gram-Positive Siderophore-Shuttle System.........................................86 Siderophore Recognition by YxeB ....................................................................................87 Comparison between the Siderophore-Shuttle Systems ....................................................87 Methods..........................................................................................................................................89 Permission ......................................................................................................................................91 References ......................................................................................................................................92 Chapter 5 Appendix .......................................................................................................................94
iii

List of Figures, Tables, and Schemes
Chapter 1 Figure 1-1. Siderophore function ....................................................................................................2 Figure 1-2. Chemical structures of several catecholate siderophores and analogs .........................3 Table 1-1. Comparison of pM values ..............................................................................................4 Figure 1-3. Salicylate shift of catecholate siderophores .................................................................5 Figure 1-4. Chemical structures of several hydroxamate siderophores ..........................................5 Figure 1-5. Metal center chirality of metal siderophore complexes .............................................10 Chapter 2 Figure 2-1. Chemical structures of fluvibactin (2-1) and vibriobactin (2-2) ................................14 Figure 2-2. Ferric coordination modes of the catechol and catechol-oxazoline units of siderophores ...................................................................................................................................15 Figure 2-3. Chemical structures of the natural siderophores fluvibactin and vibriobactin and the respective oxazoline-substituted analogs .......................................................................................16 Scheme 2-1. Synthesis of fluvibactin (2-1) using the catechol-amide building block (2-11) .......17 Scheme 2-2. Synthesis of the oxazoline-substituted analogs of fluvibactin .................................18 Scheme 2-3. Synthesis of vibriobactin (2-2) .................................................................................18 Scheme 2-4. Synthesis of the oxazoline-substituted analogs of vibriobactin ...............................19 Figure 2-4. Fluorescence quenching curves of Scn at pH 7.4 .......................................................20 Table 2-1. Dissociation constants of Scn and siderophores at pH 7.4 ..........................................20 Figure 2-5. The coordination mode of Fe-fluvibactin when bound by Scn ..................................22 Figure 2-6. Spectrophotometric titration of apo-fluvibactin A .....................................................23
iv

Table 2-2. Log values of the cumulative (β) and stepwise (K) protonation constants of apo-fluvibactin A (FluvA) ....................................................................................................................23 Figure 2-7. Spectrophotometric titration of apo-vibriobactin .......................................................24 Table 2-3. Log values of the cumulative (β) and stepwise (K) protonation constants of apo-vibriobactin (Vib)...........................................................................................................................24 Figure 2-8. Spectrophotometric titration of Fe-vibriobactin showing the transition from catecholate mode at pH 10 to phenolate-oxazoline mode at pH 7 .................................................25 Figure 2-9. Plot of Fe-vibriobactin speciation versus pH .............................................................26 Figure 2-10. Spectrophotometric titration of Fe-fluvibactin .........................................................26 Figure 2-11. Absorbance spectra of Fe-vibriobactin alone and with Scn .....................................27 Scheme 2-5. Equations used to fit the fluorescence quenching data of Fe-vibriobactin and Scn to a model that includes the protonation equilibrium of Fe-vibriobactin ..........................................27 Figure 2-12. Fluorescence quenching curves of Scn at pH 8.6 .....................................................28 Table 2-4. Comparison of the dissociation constants of Scn and siderophores at pH 7.4 and 8.6 ........................................................................................................................................................28 Figure 2-13. The coordination mode of Fe-vibriobactin is affected by pH and by Scn binding ........................................................................................................................................................29 Chapter 3 Figure 3-1. Chemical structures of glucosylated enterobactin derivatives ...................................43 Figure 3-2. Analytical chromatogram of MGE reaction ...............................................................44 Figure 3-3. Fluorescence quenching titrations of ExFABP with bacterial siderophores ..............45 Table 3-1. Dissociation constants of ExFABP for ferric and apo-siderophores ...........................46 Figure 3-4. Structure of Ex-FABP bound to Fe-enterobactin .......................................................47 Figure 3-5. MGE modeled in the binding pocket of Ex-FABP ....................................................48
v

Chapter 4 Figure 4-1. V. cholerae receptors and transport systems for ferric siderophores .........................54 Figure 4-2. Energy diagram of ferric enterobactin reduction by YqjH ........................................55 Figure 4-3. Chemical structures of enterobactin and the hydrolysis products of enterobactin .....57 Scheme 4-1. Synthesis of enterobactin ..........................................................................................59 Scheme 4-2. Synthesis of DHB-Ser monomer following the procedure of Rastetter et al. ..........59 Scheme 4-3. Racemization of DHB-Ser through azlactonization of the activated ester ...............60 Scheme 4-4. Attempted synthesis of protected DHB-Ser dimer ...................................................60 Scheme 4-5. Synthesis of protected serine dimer and trimer esters ..............................................61 Scheme 4-6. Attempted steps in the synthesis of DHB-Ser dimer ................................................62 Scheme 4-7. Synthesis of DHB-Ser dimer informed by Yu et al. .................................................63 Scheme 4-8. Syntheis of DHB-Ser trimer informed by Yu et al. ..................................................64 Table 4-1. Siderophore utilization assay .......................................................................................65 Chapter 5 Figure 5-1. Siderophore uptake machineries in Gram-negative bacteria and Gram-positive bacteria ...........................................................................................................................................74 Figure 5-2. Possible Fe-siderophore uptake mechanisms in Gram-positive bacteria ...................76 Figure 5-3. Chemical structures of desferrioxamine B (DFO), acetyl-desferrioxamine (AcDFO) and desferriferrichrome (dFch) ......................................................................................................77 Figure 5-4. Fluorescence quenching assay of YxeB-L142 and YxeB-S142 ................................78 Table 5-1. Dissociation constants (Kd’s) of YxeB-L142-6×His and YxeB-S142-6×His ..............79 Figure 5-5. Cr-DFO uptake in B. cereus strains ...........................................................................81 Figure 5-6. Cr-/apo-DFO growth assay of TC129 and TC128 .....................................................82
vi

Figure 5-7. Theory of mechanism discrimination in the Cr-/apo-DFO growth assay ..................82 Figure 5-8. Cr-DFO/FO uptake assay in vivo ...............................................................................83 Figure 5-9. Theory of the in vivo Cr/FO competition assay .........................................................84 Figure 5-10. In vitro Cr-DFO/FO competition assay using YxeB-L142-6×His and YxeB-S142-6×His ..............................................................................................................................................85 Figure 5-11. In vitro Ga-/Cr-DFO/FO competition assay using YxeB-L142-6×His and YxeB-S142-6×His ....................................................................................................................................86 Fig. 5-12. Model of the Gram-positive siderophore-shuttle mechanism of YxeB ........................88 Chapter 5 Appendix Figure A5-1. Nano ESI-MS analysis of the YxeB-L142 protein alone and bound to dFch or Fch ........................................................................................................................................................94 Table A5-1. Calculated molecular weights of YxeB-L142-6×His and its apo- and Fch complexes derived from nano ESI-MS analysis ..............................................................................................95 Figure A5-2. YxeB-L142-6×His and YxeB-S142-6×His binding assays using RP-HPLC .........96 Figure A5-3. Fluorescence quenching assay of predicted siderophore-binding proteins .............97 Figure A5-4. Growth assay of TC129, TC128, and yxeB markerless mutant strains with and without DFO ..................................................................................................................................98 Figure A5-5. Cr-DFO/FO uptake assay in vivo ............................................................................99 Figure A5-6. Growth assay of TC129 in iron-limited minimum medium with different amounts of DFO .........................................................................................................................................100
vii

Acknowledgements
When I drove my ’93 Cadillac across the Nevada desert from my hometown of Burley, Idaho, to start graduate school there was no way that I could have know what the next five and one half years would bring. Writing this dissertation has allowed me to review my time as a graduate student and better realize how much help and support I have received from many people. Ken Raymond accepted me into his laboratory to work on the siderophore project. He has provided experience, knowledge, and patience. I have had all the supplies and research support that I could want. He has also provided perspective and motivation for my work. If I was to make the decision again of what research group to join, I would undoubtedly join the Raymond group. Xu Jide has been an invaluable resource for the synthesis of all of the compounds that I have made. I frequently visit his lab to ask questions and get ideas of how to make the molecules I want to make. Susan Meux helped me stay on top of the university requirements and lab responsibilities.
Trisha Hoette, Rebecca Abergel, and Anna Zawadzka helped me in the first year to get used to the day-to-day work in the lab. My work with vibriobactin and fluvibactin began with suggestions from Trisha. Allyson Sia has been an excellent lab mate for the last five years. We joined the siderophore project together and went through a lot of graduate school together. We have had many discussions about our research, future plans, dancing, and Bay Area sports. Thanks to her kindness, our lab was a comfortable, friendly, and enjoyable place to work. Tatsuya Fukushima has provided the biological expertise that the siderophore project needed. His research is the major driver of the siderophore shuttle work presented in Chapter 5. I had wanted to work on the siderophore shuttle for a couple of years, but I could not carry it with my limited experience in biology. He has also been very helpful in the many discussions that we have had about experiments, future plans, becoming parents, and soccer. I have mentored two undergraduate students, Derrick Tao and Christian Villanueva, and this experience has been very beneficial for me. Teaching these students has made me learn better how to carry out synthesis and articulate research questions. These two students also provided a type of a mirror for me to judge the way I go about doing experiments. Christian has been working with me the most time, and his enthusiasm for science is infectious. I have also benefitted from several excellent collaborators. Roland Strong and Colin Correnti from the Fred Hutchinson Cancer Research Center provided protein for many of my experiments. They also grew crystals and solved structures that supported, and in some cases, drove my research. Elizabeth Wyckoff from Shelley Payne’s lab at University of Texas, Austin, really supported my efforts to work out some details of siderophore utilization by Vibrio cholerae covered in Chapter 4. She already had or made many strains to unravel the enterobactin utilization pathway. Without her help this project could not have been carried out. Several people outside of the university have given much to help me succeed. Samantha, my wife, has been invaluable to any success that I have had. She has listened, encouraged, cooked meals, given rides, and edited papers and letters. She motivates me to keep pursuing research and science. She takes care of our sons, Joel and Henry. Graduate school has been a shared effort for us.
viii

My parents did a lot to prepare me for graduate school. They provided an example by going to college and always learning. With my grandparents, uncles, and aunts, they created a culture of curiosity, critical thinking, reading, and believing that with effort just about anything can be accomplished. My in-laws have been incredibly helpful, especially in helping take care of our children. I acknowledge that God has been a sustaining and guiding influence while carrying out this research effort. I believe that human kindness, collaboration, and the discovery of truth are manifestations of God from which I have benefitted greatly. To all of these people, and more, thank you!
ix
Chapter 1
Coordination Chemistry of Microbial Iron Transport Iron and Bacterial Siderophores
Iron is at the same time essential and dangerous for living organisms. On the one hand, iron is an abundant element with tuneable redox properties. In an aqueous, aerobic environment the most common oxidation state is +3 (ferric), and +2 (ferrous) and +4 states are readily available. Organisms exploit the multiple accessible oxidation states for electron transfer reactions, catalysis, and binding of small molecules. However, iron bioavailability is limited because of the low solubility of iron hydroxide, and the same redox properties that are advantageous to organisms can be destructive. Iron participates in Fenton chemistry to produce reactive oxygen species including the hydroxide and peroxide radicals.1 Fenton chemistry within an organism damages biomolecules.2
Although iron can both assist and damage living systems, it is evident that organisms have generally tamed the destructive effects and overcome the limited availability in order to take advantage of the properties of the element. To use iron without risking damage, specialized proteins and small molecules bind the metal to chaperone its movement through a cell or organism. Other biomolecules that use iron as a cofactor organize the immediate environment of the metal to control and tune the redox properties. Binding and controlling the immediate environment of iron is vitally important in biology to make use of the metal while protecting against damage.3,4
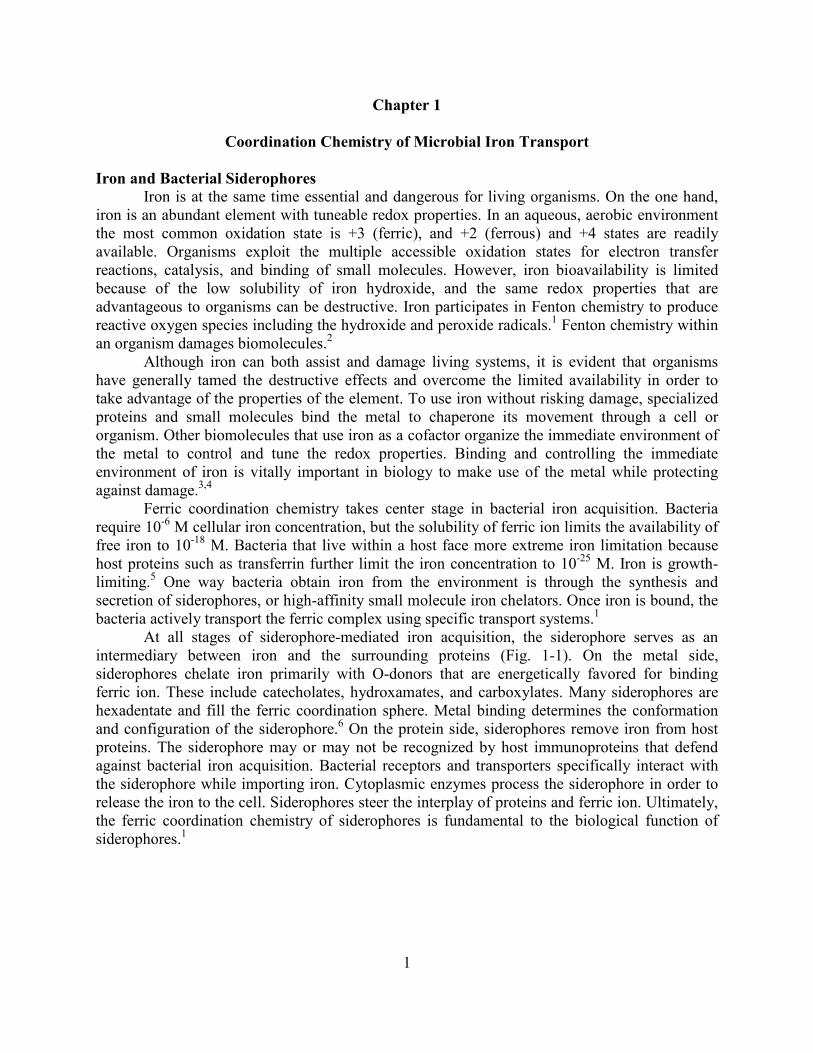
Ferric coordination chemistry takes center stage in bacterial iron acquisition. Bacteria require 10-6 M cellular iron concentration, but the solubility of ferric ion limits the availability of free iron to 10-18 M. Bacteria that live within a host face more extreme iron limitation because host proteins such as transferrin further limit the iron concentration to 10-25 M. Iron is growth-limiting.5 One way bacteria obtain iron from the environment is through the synthesis and secretion of siderophores, or high-affinity small molecule iron chelators. Once iron is bound, the bacteria actively transport the ferric complex using specific transport systems.1
At all stages of siderophore-mediated iron acquisition, the siderophore serves as an intermediary between iron and the surrounding proteins (Fig. 1-1). On the metal side, siderophores chelate iron primarily with O-donors that are energetically favored for binding ferric ion. These include catecholates, hydroxamates, and carboxylates. Many siderophores are hexadentate and fill the ferric coordination sphere. Metal binding determines the conformation and configuration of the siderophore.6 On the protein side, siderophores remove iron from host proteins. The siderophore may or may not be recognized by host immunoproteins that defend against bacterial iron acquisition. Bacterial receptors and transporters specifically interact with the siderophore while importing iron. Cytoplasmic enzymes process the siderophore in order to release the iron to the cell. Siderophores steer the interplay of proteins and ferric ion. Ultimately, the ferric coordination chemistry of siderophores is fundamental to the biological function of siderophores.1
1

Figure 1-1. Siderophore function. Siderophores (black octahedra) are secreted bacterial products. The siderophore interacts with proteins in the environment. It may chelate iron (red sphere) from host iron-binding proteins such as transferrin or ferritin. The human protein siderocalin (ribbon model) may bind the siderophore and prevent it from returning iron to the bacteria as a way to defend against infection. Specific receptors at the bacterial cell surface bind ferric siderophores and actively transport them across the membrane where the iron is released to the cell. The coordination chemistry of the siderophores has a fundamental influence on every interaction and process in this pathway. Siderophore Stability
Siderophore function depends on the ability to bind iron with sufficient affinity to remove it from the available iron resources, including host proteins or minerals. Enterobactin (Fig. 1-2) is a siderophore used by many Gram-negative, enteric bacteria. Up to the present time, it has the highest known ferric stability constant of siderophores. Enterobactin chelates iron with three catechol-amide units that distort the metal coordination geometry from octahedral to near D3 symmetry. The catecholate ligand field splitting is less than electron-electron repulsion resulting in a high spin (S = 5/2) electronic configuration. Interaction between metal and catecholate is dominated by π bonding between the out of plane lone pairs and the corresponding metal orbitals derived from the t2g set in octahedral symmetry. The high amount of π bonding contributes to the high stability of the ferric catecholate complexes.7 Ferric catecholates have high stability constants compared to other ferric chelators, including hydroxamates and carboxylates, because the catecholate orbitals have more overlap with the metal orbitals.8
SiderophoreSecretion
SiderocalinDefense
Fe(III) Chelation
SiderocalinDefense
Receptor Binding
Transport
2

Figure 1-2. Chemical structures of several catecholate siderophores and analogs.
Each catechol-amide of enterobactin is a bidentate chelator that loses two protons upon metal binding. Originally, the formation constant of ferric enterobactin was calculated to be 1052. This constant was based on the protonation constants of N,N-dimethyl-2,3-dihydroxybenzamide (Fig. 1-2) for which the protonation constant (logK) of the ortho phenol is 8.4 and of the meta phenol is 12.1.9,10 The ortho phenols of enterobactin were later found to be more acidic with logK values of 6.0, 7.5, and 8.5. With these constants, the revised ferric formation constant of enterobactin is 1049.11 The difference in protonation constant between the model compound and enterobactin demonstrates that hydrogen bonding between the amide and the ortho phenol has a large effect on metal binding. This difference is also observed in MECAMS and Me3MECAMS (Fig. 1-2) where alkylating the amide raised the protonation constant by 0.6 log units. The increased basicity of the ortho phenols may be accounted by for by electron donation of the methyl group to the ortho hydroxyl.12 However, the lower protonation constant does not imply that the hydrogen bonded phenol is a weaker base and weaker σ donor. First, metal binding and protonation involve Lewis acids with different energy and overlap. Second, protonation constants only describe the stability of the anion in water. The ortho phenolate anions of enterobactin are stabilized by hydrogen bonds from the adjacent secondary amides, and these hydrogen bonds are observed in the vanadium(IV), silicon(IV), titanium(IV), and germanium(IV) enterobactin crystal structures.7,13,14
O O
O
O
O
O
HN
NHNH
O
O
O
Enterobactin
HO
HO
OHOH
OHOH
N
O
OHOH
N,N-Dimethyl-2,3-dihydroxybenzamide
O O
O
O
O
O
NH
OHNO
NH
HN
OHN
O
O
NH
HO
HO
OHOH
O
OHOH
RN
O
OHHO
RN
O
HOOH
NRO
OH
OH
Bacillibactin
R = H, MECAMSR = CH3, Me3MECAMS
SO3-
SO3-
-O3S
NH
HN
HN
OO
HNO
NH
NH
OOH
OHOH
OH
OH
CO2H
Petrobactin
3

Hydrogen bonding between the amide and ortho phenol forms a planar, 6-membered ring. The enterobactin backbone positions the planar metal binding arms so that the catecholates effectively span the coordination sphere and each metal-O bond distance is nearly identical. The conformation of the enterobactin backbone is unperturbed upon metal binding indicating that it is ideally sized and preorganized for metal chelation. Siderophore preorganization contributes entropically to the high formation constant of ferric enterobactin.13 Bacillibactin (Fig. 1-2) is structurally related to enterobactin. The two differences between the siderophores are that bacillibactin has a trithreonine backbone making a methylated trilactone, and a glycine spacer connects the backbone to the catechol-amide groups. These changes in the structure slightly reduce the ferric formation constant to 1047.6.15
Metal coordination by siderophores is proton dependent, and the stability of the ferric complexes depends on the pH of the solution. Different siderophores have different proton dependence and complex stoichiometry making it difficult to compare iron binding ability directly with stability constants. Measurement of the “free,” or hexaaqua, iron in solution at physiological pH (7.4), 10-5 M total siderophore concentration, and 10-6 M total iron concentration gives a value by which to compare siderophores and take into account proton-dependence and stoichiometry.10 A larger pM indicates greater iron binding ability, and the pM values of a number of siderophores are compared in Table 1-1.
Table 1-1. Comparison of the pM values of hydroxamate siderophores, catecholate siderophores, transferrin and several synthetic chelators.
Iron Chelator pMa
Aerobactin16 23.3 Rhodotorulic Acidb 21.8 Alcaligin 17 23.0 Desferrioxamine B16 26.6 Desferrichrome16 25.2 N,N-dimethyl-2,3-dihydroxybenzamide10 ~15 Ethyl-2,3-dihydroxybenzoate6 19.7 MECAM10 29.1 Enterobactin15 34.3 Bacillibactin15 33.1 Petrobactin18 23.0 Ethylendiaminetetraacetic Acid18 23.42 Diethylenetriaminepentaacetic Acid10 24.7 Transferrin10 23.6
a pM = -log[Fe3+], 10-6 total Fe, 10-5 total chelator, pH 7.4.
Below physiological pH, ferric enterobactin has three discrete protonation steps. The protonation constants (logK) of the metal complex are 4.95, 3.52, and 2.5.11 The meta phenolates are the most basic sites of ferric enterobactin, and the protonation constants correspond to adding a proton at these three sites. Protonation precludes iron coordination at the meta phenolates and induces a change from the catecholate mode to a salicylate mode involving an amide carbonyl
4

and the ortho phenolate (Fig. 1-3). To adopt this conformation the amide must rotate. The change in coordination mode was confirmed by IR, NMR, EXAFS and the crystal structure of analogs, and it allows the all three binding units to remain coordinated to the metal even after three protonations.10,19–21 The metal-oxygen bond strengths are similar for both catecholate and salicylate complexes, but the ferric salicylate complexes are less stable than the catecholate complexes. The difference in stability is likely due to increase strain in the carbon network of the siderophore while in the salicylate coordination.21
Figure 1-3. Salicylate shift of catecholate siderophores. Protonation of a catecholate-amide coordinated to a metal induces a rotation about the amide bond to allow chelation by the amide carbonyl and the ortho phenolate.
In addition to catecholate siderophores, many siderophores bind iron with hydroxamate chelating groups including desferrioxamine B and desferriferrichrome (Fig. 1-4). Hydroxamate chelates ferric ion through adjacent N-O and carbonyl donors. As with the catecholates, the basic, anionic O-donors form strong interactions with the hard ferric ion resulting in high formation constants and pM values (Table 1-1). However, the energy of the hydroxamate orbitals does not match the metal orbitals as well as for the catecholates,8 and the formation constants are 10 orders of magnitude lower than the catecholate siderophores with the same denticity.
Figure 1-4. Chemical structures of several hydroxamate siderophores.
O
NR
H
O FeIIIO O
FeIIIO
OH
HNR
H+
NOH
OO
HN
NHO
OOHN
NHO
O
HNNHNH
NH HN
HN
OO
N O
R3
OHO
NHO
R3
O
OO
N
O
HO
O R3
R1
R2
Desferrioxamine B Desferriferrichrome
NH
NO
HNO
N
OH
CO2H
CO2H
CO2H
OH
OH
O
O
Aerobactin
NHN
NHN
O OHHO O
O
HO
OH
O
Alcaligin
NH
HNO
O
N ONO OHOH
Rhodotorulic Acid
NH3
5

Protonation of a ferric hydroxamate complex represents dissociation of one of the chelating group. Hydroxamates do not have an alternative binding mode like the salicylate mode of catechol-amides when protonated. But, the protonation constant of the ferric hydroxamates only occurs below pH 2, much lower than for the ferric catecholates.16
Hydroxamate siderophores have the same formation constant whether or not three hydroxamates are linked together. This means that hydroxamate siderophores do not benefit from the chelate effect.22 This may be because the polydentate hydroxamate siderophores form very large chelate rings that do not provide additional stability.16 Although the stability constants are not enhanced, trihydroxamate siderophores provide an advantage over mono- and dihydroxamate cheltors through the concentration effect. The formation constants of mono- and dihydroxamate siderophores have increased concentration dependence, so these siderophores must be at much higher concentration than trihydroxamate siderophores to chelate the same amount of iron. The concentration effect means that much more dihydroxamate siderophore must be produced to provide the same amount of iron or to compete with a trihydroxamate siderophore.16,22
Although a dihydroxamate, the macrocyclic siderophore alcaligin (Fig. 1-4) forms unusually high stability iron complexes. It is the first siderophore identified that demonstrated preorganization for iron binding. The conformation of the siderophore with or without iron is nearly the same, and this contributes to a 1:1 metal:siderophore formation constant that is 32 times greater than the same formation constant for rhodotorulic acid, a linear dihydroxamate siderophore (Fig. 1-4). For the 2:3 complex in which the siderophores fill the two metal coordination spheres, the cyclic shape of alcaligin favors a monobrigded complex. The bridging siderophore is distorted to make this complex. In contrast, linear rhodotorulic acid forms a 2:3 metal:siderophore tribridged complex, or helicate. The preorganization advantage of alcaligin compared to rhodotorulic acid, and other hydroxamate siderophores, is erased in the 2:3 complex by the distortion of the bridging siderophore because the formation constants of the 2:3 complexes of the two siderophores are nearly the same.17
Many organisms rely on the chelating properties of hydroxamate siderophores to acquire iron. The catecholate siderophores as a rule have higher stability constants than the hydroxamate siderophores but it is not always true that the thermodynamic advantage translates into biological advantage. Both catecholate and hydroxamate siderophores have high ferric formation constants compared to other natural and synthetic iron chelators (Table 1-1). Siderophores Remove Iron from Host Proteins
The high stability constants of both hydroxamate and catecholate siderophore allow them to chelate iron from the surroundings. Within a host, the main bacterial iron sources exploited by siderophores are the iron binding proteins transferrin and ferritin. Transferrin is used by organisms to transport iron and limit free iron concentrations. The protein has two lobes that can each bind a ferric ion. The metal coordinating residues include two tyrosines, one aspartate, one histidine, and a synergistic carbonate anion. The hexadentate coordination site has five O-donors that has high affinity for ferric ion (K = 10-20).1 Iron removal from transferrin is cooperative at the two lobes. The C-lobe must be closed for iron to be removed from the N-lobe.23,24
Comparison of the stability constant and pM value of transferrin and siderophores (Table 1-1) shows that all siderophores are thermodynamically capable of removing iron from transferrin. The E. coli siderophores aerobactin, a hydroxamate siderophore (Fig. 1-4) and
6

enterobactin (Fig. 1-2) can remove iron from transferrin. Pyrophosphate accelerates removal of iron from transferrin.25,26 In serum, aerobactin transfers iron faster than enterobactin, desferrioxamine B, and desferriferrichrome A even though the other siderophores have much higher ferric formation constants.26 Petrobactin is a catecholate siderophore with 3,4 placement of the hydroxyls relative to the amide instead of the 2,3 arrangement in enterobactin (Fig 1-2). Petrobactin has low iron affinity compared to other catechol siderophores but similar to hydroxamate siderophores (Table 1-1). Petrobactin removes iron from transferrin nearly two-fold faster than enterobactin or aerobactin.18 Catecholate chelators efficiently remove iron from transferrin. The mechanism includes a ternary complex of the siderophore and ferric transferrin. The rate of removal by catechol siderophores is significantly higher than for desferrioxamine.27,28 Apparently, catechol alleviates a kinetic barrier to removing iron from transferrin because a catechoyl derivative of desferrioxamine is kinetically capable of removing iron from transferrin.29
Ferritin is an iron storage protein consisting of 24 subunits forming an octahedral shell. Ferrous ions pass through the protein shell to the inner core and are oxidized by ferroxidase sites. The ferric ions then form polynuclear iron clusters at nucleation sites on the inner side of the protein shell. Nucleation continues at one of the clusters forming a ferrihydrite mineral core. One ferritin may contain more than 4000 metal ions in the mineral core.1 Enterobactin and desferrioxamine are able to quickly remove iron from ferritin. They access the iron by entering the protein shell. The iron loading status of the ferritin and the siderophore concentration affect the rate of iron removal.30
The battle for iron between the host iron-binding proteins and siderophores depends on both thermodynamics and kinetics of iron coordination. While some siderophores are kinetically ineffective in removing iron, many are not, and, almost as a rule, siderophores are thermodynamically superior to the host proteins. The circulating iron binding proteins are a vulnerability for the host and a windfall for the pathogen. Unsurprisingly, the battle extends beyond transferrin and ferritin to other fronts. Host Defense against Siderophores In addition to protecting iron stores in transferrin and ferritin, several host systems work together to limit iron availability and protect against pathogen iron accumulation. These additional systems include the hepcidin signal to decrease iron export and increase iron storage in cells, increased concentration of apo iron-binding proteins, disrupting microbial iron metabolism, antibodies, and synthesizing the protein siderocalin.1,5,31,32 Siderocalin limits bacterial iron uptake by binding siderophores (Fig. 1-1). This defense strategy is effective in protecting against many infections.33 The siderophore binding pocket rests within the calyx of an eight-stranded anti-parallel β-barrel. Three basic residues project into the binding pocket giving it a positive charge. Siderocalin binds ferric enterobactin with high affinity through Coulombic and cation-π interactions.34 The three positive residues define three subpockets into each of which fits a catecholate unit of enterobactin. By complementing the metal center of enterobactin, the pseudo three-fold symmetry and cationic interaction provided by the binding pocket also recognizes many other triscatecholate siderophores with high affinity. In addition to enterobactin, siderocalin binds bacillibactin, parabactin, carboxymycobactin, fluvibactin, and vibriobactin.32,35–37 The binding pocket degeneracy enables siderocalin to defend against siderophore mediated iron acquisition from a variety of siderophores and pathogens. Several
7

pathogens have responded to the siderocalin defense by modifying the catecholate siderophores near the metal center to avoid binding to the host protein. These “stealth” siderophores include petrobactin and the salmochelins.18,38 The interplay between “stealth” siderophores and the host immune system is further reviewed and developed in Chapters 2 and 3. Removing Iron from Siderophores Iron-laden siderophores that avoid the host defense are transported by bacteria as the intact ferric complexes. The ferric siderophore is recognized by a cell surface receptor and then transported to the cytoplasm. Once in the cytoplasm, the advantage of high stability ferric complex becomes a challenge. No ferric chelators have higher affinity than the siderophores so the iron cannot be directly removed. The generally accepted iron removal mechanism used by bacteria takes advantage of another aspect of iron coordination chemistry. Reducing ferric ion changes it from a hard acid to a softer acid, and siderophores do not form stable complexes with ferrous ion. Bacteria reduce ferric siderophores and release the iron so that it can be used by the cell. The reduction potential of ferric hydroxamate siderophores is around -0.3 to -0.4 V. These siderophores can be reduced by biological reductants, including flavoproteins, iron-sulfur proteins and NADH which have formal reduction potentials near -0.3 to -0.4 V.39,40 Ferric siderophore reduction can be facilitated if ferrous chelators are present.41 The hexadentate catecholate siderophores strongly stabilize the ferric state as can be seen by the formation constants. Stabilizing the ferric state also increases the energy required to reduce the complexes. Ferric enterobactin has a reduction potential of -0.75 V which is far below the biological range.10,42 The bacteria that use enterobactin employ another tactic to get around the high stability constants and release the iron. The trilactone backbone can be hydrolyzed three times by a specific enzyme to yield three bidendate chelators instead of a hexadentate chelator. The stability constant changes dramatically as the denticity of the ligand is reduced and ligand preorganization is diminished. Hydrolyzing just one ester in enterobactin to give a linear hexadentate siderophore reduces the ferric stability constant by 6 orders of magnitude.43 The reduction potential simultaneously decreases in energy to biological range allowing the iron to be released by reduction. Chapter 4 focuses on the utilization of ferric enterobactin and enterobactin hydrolysis products in Vibrio cholerae.
An alternative mechanism of iron removal from enterobactin relies on the salicylate shift described above. As the pH is lowered, the protonation of ferric enterobactin changes the coordination environment to the less stable salicylate mode. The reduction potential of ferric salicylate complexes, raised relative to the respective catecholate complexes, is within biological range.21 Release of iron from enterobactin is a biological application of the coordination chemistry principles of hard-soft acid-base theory and the chelate effect. Metal Substitution
Measuring the effect of iron on the siderophore and on the biological function of the siderophore is accomplished by substituting the metal. High-spin ferric ion has no crystal field stabilization and is kinetically labile, meaning that the water exchange rate of the aqua complex is very high. Chromic ion is kinetically inert because it has significant crystal field stabilization and the water exchange rate is 108 slower than for ferric ion.44 Relative inertness and lability affect the metal exchange rate between siderophores, metal dissociation, and configuration
8

changes within the complex. By comparing ferric and chromic siderophores the effect of optical isomerism, exchange, and dissociation can be identified. Hydroxamate siderophores form stable chromic complexes. The chromic complex of desferriferrichrome (Fig 1-4), a cyclic trihydroxamate siderophore, forms the same coordination isomer, Λ-cis, as ferrichrome.45 The chromic complex of desferriferrichrome was transported by Ustilago sphaerogena showing that isomerization or dissociation are not necessary steps in uptake in this system. It also showed that the Λ-cis optical isomer is biologically active and that uptake does not require isomerization from the low energy configuration.46 Desferrioxamine B is a linear trihydroxamate siderophore for which the chromic complex has been synthesized and the geometrical isomers partially separated. The half-life of isomerization is several days.47 Chromic desferrioxamine B is used in Chapter 5 to identify if ligand exchange takes place during siderophore uptake in Bacillus cereus.
Chromium(III) enterobactin was prepared to identify that the ferric siderophore has Δ configuration of the siderophore metal complex. Air oxidation prevents it from being used in biological experiments.48 Also, the first crystal structure of enterobactin was determined with the vanadium(IV) complex. Since all subsequent small-molecule structures of enterobactin are with 4+ metals, the charge of the metal likely facilitates crystal growth. These structures, especially the first, have been instrumental in understanding the how the structure contributes to the high stability constants of ferric enterobactin.13,14
Gallium(III) has an ionic radius similar to iron(III) and is kinetically labile. Catecholate and hydroxamate gallium(III) siderophore are structurally similar to the ferric complexes, but unlike the ferric siderophores they are not capable of single electron reduction.49 Gallium(III) desferrioxamine B and chromic desferrioxamine B were used in Streptomyces pilosus uptake experiments. The uptake rates of both metal-substituted siderophores was comparable to the uptake of ferrioxamine B showing that decomplexation, metal exchange, and reduction are not necessary for uptake in this system.50 Metal-substituted siderophores, especially with gallium(III) and chromium(III), have yielded much information about the metal-specific properties of the ferric siderophore that are critical to biological function. Configuration of Metal Siderophore Complexes
The biological function of siderophores is mediated by many proteins. Proteins are chiral molecules, so it is not surprising that the siderophore chirality affects biological function. Six-coordinate metal centers with 3 bidentate ligands are inherently chiral. Hydroxamate siderophores have many possible isomers because of the chelating group is not symmetric and because the alkyl chains between the hydroxamate groups are flexible. For this discussion we will focus on the chirality of the metal center. Octahedral metal centers with three bidentate chelators can take on two different configurations. The difference between the two optical isomers is easily viewed looking down the three-fold axis. A Δ configuration makes a right-handed propeller, and the Λ configuration is left-handed. Metal siderophore complexes adopt one of the two configurations or a mixture of both.
9

Figure 1-5. Metal center chirality of metal siderophore complexes. Δ configuration makes a right-handed screw. Λ configuration makes a left-handed screw. At neutral pH rhodotorulic acid forms a 2:3 metal:siderophore complex. Each ferric ion predominately adopts Δ configuration.51 This is opposite the other hydroxamate siderophores, such as ferrichrome, that predominantly form Λ isomers. The enantiomer of rhodotorulic acid supplies iron to Streptomyces pilosus twice as fast as the natural isomer. It is likely that the ferric hydroxamate uptake system of S. pilosus recognizes the chirality of the metal center.52 The same isomer specificity was not observed in Rhodotorula pilimanae, where the natural isomer, and specifically the Δ isomers delivered iron more rapidly than the Λ isomer of enantio-rhodotorulic acid.53 The E. coli non-ferrichrome hydroxamic acid receptor is FhuE. It recognizes the chirality of the metal center and transports the Δ isomer as shown by transport of ferric rhodotorulate and ferric enantio-rhodotorulate.54 E. coli also distinguishes between ferrichrome and enantio-ferrichrome.55
Metal enterobactin complexes in solution and in the solid state adopt Δ configuration.48 Enterobactin supports growth of E. coli K12, but enantio-enterobactin does not. At first it was assumed that this was because the receptor recognition depended on the metal center, and the Δ configuration preferred over the Λ of the unnatural enantiomer.56 However, it was later shown that FepA binds enantio-enterobactin with similar affinity as enterobactin.57 The periplasmic binding protein FepB also binds both enterobactin and enantio-enterobactin with high affinity.58 The preference observed for the natural isomer does not take place at the outer membrane or the periplasm.
Although structurally similar to enterobactin, the metal complexes of bacillibactin form the Λ configuration.59 The opposite chirality results from the methylated trilactone ring and the glycine spacer between the backbone and catechol-amides. Even though Λ configuration is lower in energy, the nearest Δ isomer is only 3.6 kcal/mol higher in energy. A synthetic derivative of bacillibactin which does not have a methylated backbone has a smaller preference for the Λ isomer of only 1.5 kcal/mol.60 The configuration of ferric enterobactin and bacillibactin becomes important in the iron release mechanism. As explained above, these siderophore must be hydrolyzed before they can be reduced and release iron. The enzyme Fes in E. coli and BesA in Bacillus subtilis hydrolyze ferric enterobactin and ferric bacillibactin, respectively. Fes can hydrolyze only ferric enterobactin and an L-serine trilactone bacillibactin analog with which has Λ configuration suggesting that the chirality of the backbone, not the metal center, is a prerequisite for this process. BesA can hydrolyze all siderophore that use an L-serine trilactone independent of the metal center configuration including enterobactin, bacillibactin, and the bacillibactin analog. Neither BesA or Fes can hydrolyze catecholate siderophore analogs that have a D-serine lactone.61 The chiral recognition of Fes explains why enantio-enterobactin did not support
∆ Λ
10

growth of E. coli even though the receptor and periplasmic binding protein recognize it. Both metal binding and siderophore chirality influence the conformation and configuration of the ferric siderophore complexes. These shape features determine protein-siderophore interactions and recognition, thus influencing the biological effect of the inorganic complexes. Conclusion Iron is built into life, and siderophores provide a biological handle for bacteria to acquire the essential element from the surroundings. The following chapters present recent findings regarding the interaction between siderophore coordination chemistry and biology. Chapter 2 focuses on how the coordination mode of siderophore from Vibrio spp pathogens influences recognition by siderocalin. Chapter 3 compares the siderophore recognition of siderocalin to a galline siderocalin, Ex-FABP. Chapter 4 presents progress in characterizing catecholate siderophore utilization by Vibrio cholerae. Chapter 5 develops a Gram-positive siderophore uptake model in which the metal exchange is facilitated by the receptor YxeB. The specialized coordination chemistry of siderophores plays a fundamental role in biological function of these molecules. References (1) R R Crichton Iron Metabolism-From Molecular Mechanisms to Clinical Consequences;
3rd ed.; John Wiley & Sons Ltd: West Sussex, United Kingdom, 2009. (2) Jomova, K.; Valko, M. Toxicology 2011, 283, 65–87. (3) Finney, L. A.; O’Halloran, T. V. Science 2003, 300, 931–936. (4) Lee, J.-W.; Helmann, J. D. BioMetals 2007, 20, 485–499. (5) Weinberg, E. D. Biochim. Biophys. Acta 2009, 1790, 600–605. (6) Raymond, K. N.; Dertz, E. A. In Iron Transport in Bacteria; Crosa, J. H.; Mey, A. R.;
Payne, S. M., Eds.; ASM Press: Washington, DC, 2004; pp. 3–17. (7) Karpishin, T. B.; Gebhard, M. S.; Solomon, E. I.; Raymond, K. N. J. Am. Chem. Soc.
1991, 113, 2977–2984. (8) Hocking, R. K.; DeBeer George, S.; Raymond, K. N.; Hodgson, K. O.; Hedman, B.;
Solomon, E. I. J. Am. Chem. Soc. 2010, 132, 4006–4015. (9) Harris, W. R.; Carrano, C. J.; Raymond, K. N. J. Am. Chem. Soc. 1979, 101, 2213–2214. (10) Harris, W. R.; Carrano, C. J.; Cooper, S. R.; Sofen, S. R.; Avdeef, A. E.; McArdle, J. V.;
Raymond, K. N. J. Am. Chem. Soc. 1979, 101, 6097–6104. (11) Loomis, L. D.; Raymond, K. N. Inorg. Chem. 1991, 30, 906–911. (12) Loomis, L. D.; Raymond, K. N. J. Coord. Chem. 1991, 23, 361–387. (13) Karpishin, T. B.; Dewey, T. M.; Raymond, K. N. J. Am. Chem. Soc. 1993, 115, 1842–
1851. (14) Baramov, T.; Keijzer, K.; Irran, E.; Mösker, E.; Baik, M.-H.; Süssmuth, R. Chem. – Eur.
J. 2013, 19, 10536–10542. (15) Dertz, E. A.; Xu, J.; Stintzi, A.; Raymond, K. N. J. Am. Chem. Soc. 2006, 128, 22–23. (16) Crumbliss, A. L. In CRC Handbook of Microbial Iron Chelates; Winkelmann, G., Ed.;
CRC Press: Boca Raton, Florida, 1991; pp. 177–233. (17) Hou, Z.; Raymond, K. N.; O’Sullivan, B.; Esker, T. W.; Nishio, T. Inorg. Chem. 1998, 37,
6630–6637.
11

(18) Abergel, R. J.; Zawadzka, A. M.; Raymond, K. N. J. Am. Chem. Soc. 2008, 130, 2124–2125.
(19) Cass, M. E.; Garrett, T. M.; Raymond, K. N. J. Am. Chem. Soc. 1989, 111, 1677–1682. (20) Cohen, S. M.; Meyer, M.; Raymond, K. N. J. Am. Chem. Soc. 1998, 120, 6277–6286. (21) Abergel, R. J.; Warner, J. A.; Shuh, D. K.; Raymond, K. N. J. Am. Chem. Soc. 2006, 128,
8920–8931. (22) Carrano, C. J.; Cooper, S. R.; Raymond, K. N. J. Am. Chem. Soc. 1979, 101, 599–604. (23) Hamilton, D. H.; Turcot, I.; Stintzi, A.; Raymond, K. N. J. Biol. Inorg. Chem. 2004, 9,
936–944. (24) Stintzi, A.; Raymond, K. N. J. Biol. Inorg. Chem. 2000, 5, 57–66. (25) Pollack, S.; Vanderhoff, G.; Lasky, F. Biochim. Biophys. Acta 1977, 497, 481–487. (26) Konopka, K.; Bindereif, A.; Neilands, J. B. Biochemistry 1982, 21, 6503–6508. (27) Carrano, C. J.; Raymond, K. N. J. Am. Chem. Soc. 1979, 101, 5401–5404. (28) Pecoraro, V. L.; Weit, F. L.; Raymond, K. N. J. Am. Chem. Soc. 1981, 103, 5133–5140. (29) Rodgers, S. J.; Raymond, K. N. J. Med. Chem. 1983, 26, 439–442. (30) Tidmarsh, G. F.; Klebba, P. E.; Rosenberg, L. T. J. Inorg. Biochem. 1983, 18, 161–168. (31) Drakesmith, H.; Prentice, A. M. Science 2012, 338, 768–772. (32) Goetz, D. H.; Holmes, M. A.; Borregaard, N.; Bluhm, M. E.; Raymond, K. N.; Strong, R.
K. Mol. Cell 2002, 10, 1033–1043. (33) Flo, T. H.; Smith, K. D.; Sato, S.; Rodriguez, D. J.; Holmes, M. A.; Strong, R. K.; Akira,
S.; Aderem, A. Nature 2004, 432, 917–921. (34) Hoette, T. M.; Abergel, R. J.; Xu, J.; Strong, R. K.; Raymond, K. N. J. Am. Chem. Soc.
2008, 130, 17584–17592. (35) Holmes, M. A.; Paulsene, W.; Jide, X.; Ratledge, C.; Strong, R. K. Structure 2005, 13,
29–41. (36) Hoette, T. M.; Clifton, M. C.; Zawadzka, A. M.; Holmes, M. A.; Strong, R. K.; Raymond,
K. N. ACS Chem. Biol. 2011, 6, 1327–1331. (37) Allred, B. E.; Correnti, C.; Clifton, M. C.; Strong, R. K.; Raymond, K. N. ACS Chem.
Biol. 2013, 8, 1882–1887. (38) Fischbach, M. A.; Lin, H.; Zhou, L.; Yu, Y.; Abergel, R. J.; Liu, D. R.; Raymond, K. N.;
Wanner, B. L.; Strong, R. K.; Walsh, C. T.; Aderem, A.; Smith, K. D. Proc. Natl. Acad. Sci. U.S.A. 2006, 103, 16502 –16507.
(39) Miethke, M.; Hou, J.; Marahiel, M. A. Biochemistry 2011, 50, 10951–10964. (40) Matzanke, B. F.; Anemüller, S.; Schünemann, V.; Trautwein, A. X.; Hantke, K.
Biochemistry 2004, 43, 1386–1392. (41) Mies, K. A.; Wirgau, J. I.; Crumbliss, A. L. BioMetals 2006, 19, 115–126. (42) Cooper, S. R.; McArdle, J. V.; Raymond, K. N. Proc. Natl. Acad. Sci. U.S.A. 1978, 75,
3551–3554. (43) Scarrow, R. C.; Ecker, D. J.; Ng, C.; Liu, S.; Raymond, K. N. Inorg. Chem. 1991, 30,
900–906. (44) Cotton, F. A.; Wilkinson, G. Advanced Inorganic Chemistry: A Comprehensive Text; John
Wiley & Sons: New York, 1988. (45) Leong, J.; Raymond, K. N. J. Am. Chem. Soc. 1974, 96, 6628–6630. (46) Leong, J.; Neilands, J. B.; Raymond, K. N. Biochem. Biophys. Res. Commun. 1974, 60,
1066–1071.
12

(47) Leong, J.; Raymond, K. N. J. Am. Chem. Soc. 1975, 97, 293–296. (48) Isied, S. S.; Kuo, G.; Raymond, K. N. J. Am. Chem. Soc. 1976, 98, 1763–1767. (49) Borgias, B. A.; Barclay, S. J.; Raymond, K. N. J. Coord. Chem. 1986, 15, 109–123. (50) Müller, G.; Raymond, K. N. J. Bacteriol. 1984, 160, 304–312. (51) Carrano, C. J.; Raymond, K. N. J. Am. Chem. Soc. 1978, 100, 5371–5374. (52) Muller, G.; Matzanke, B. F.; Raymond, K. N. J. Bacteriol. 1984, 160, 313–318. (53) Müller, G.; Isowa, Y.; Raymond, K. N. J. Biol. Chem. 1985, 260, 13921–13926. (54) Matzanke, B. F.; Müller, G. I.; Raymond, K. N. Biochem. Biophys. Res. Commun. 1984,
121, 922–930. (55) Winkelmann, G.; Braun, V. FEMS Microbiol. Lett. 1981, 11, 237–241. (56) Neilands, J. B.; Erickson, T. J.; Rastetter, W. H. J. Biol. Chem. 1981, 256, 3831–3832. (57) Thulasiraman, P.; Newton, S. M.; Xu, J.; Raymond, K. N.; Mai, C.; Hall, A.; Montague,
M. A.; Klebba, P. E. J. Bacteriol. 1998, 180, 6689–6696. (58) Sprencel, C.; Cao, Z.; Qi, Z.; Scott, D. C.; Montague, M. A.; Ivanoff, N.; Xu, J.;
Raymond, K. M.; Newton, S. M.; Klebba, P. E. J. Bacteriol. 2000, 182, 5359–5364. (59) Bluhm, M. E.; Kim, S. S.; Dertz, E. A.; Raymond, K. N. J. Am. Chem. Soc. 2002, 124,
2436–2437. (60) Bluhm, M. E.; Hay, B. P.; Kim, S. S.; Dertz, E. A.; Raymond, K. N. Inorg. Chem. 2002,
41, 5475–5478. (61) Abergel, R. J.; Zawadzka, A. M.; Hoette, T. M.; Raymond, K. N. J. Am. Chem. Soc. 2009,
131, 12682–12692.
13

Chapter 2
Siderocalin Outwits the Coordination Chemistry of Vibriobactin, a Siderophore of Vibrio cholerae
Siderocalin and Stealth Siderophores
A bacterial pathogen and the host engage in a battle for iron. The host restricts iron levels to inhibit infection, and the pathogen steals iron from the host to support growth.1 Bacteria use several strategies to acquire iron, especially the secretion of siderophores. The human immune system defends against siderophore-mediated iron acquisition by expressing the protein siderocalin (Scn).2
Scn is a member of the lipocalin family of proteins that displays an evolutionarily conserved fold consisting of an eight stranded, anti-parallel β-barrel which forms a broad, positively charged binding pocket. The binding pocket of Scn contains the basic residues R81, K125, and K134 which define three subpockets. Scn predominately recognizes catechol siderophores including Fe-enterobactin (Fig. 1-2) for which it has a subnanomolar dissociation constant (Kd).3,4 Scn has high affinity for Fe-enterobactin because each of the three catecholate groups rest within a subpocket to maximize cation-π and Coulombic interactions.5
By primarily recognizing the catecholate groups of siderophores, Scn is able to bind many different siderophores that use catecholate metal-binding units. It has been shown to bind enterobactin, parabactin, bacillibactin, and even the phenolate siderophore carboxymycobactin (Fig. 1-2).3,4,6 This broad, degenerate recognition mechanism enables Scn to defend against many bacterial pathogens.
Bacterial pathogens have responded to the Scn defense by using stealth siderophores that are not bound by Scn.6 Three stealth strategies have been observed. The first is to use siderophores with no aromatic groups such as aerobactin produced by pathogenic strains of Escherichia coli.4 The second is to add sugars or lipids to the siderophore for increased bulk as observed with the salmochelins of Salmonella enterica7 and the carboxymycobactins of Mycobacterium tuberculosis.8 The third is for metal coordination to change the shape of the siderophore as observed with petrobactin of Bacillus anthracis.6
The last two stealth strategies allow a pathogen to use catechol siderophores and avoid Scn recognition. Masking catechol siderophores is advantageous because they have the highest affinity for iron and fast kinetics of iron removal from transferrin.9,10 This prompted me to look further into how other catechol siderophores avoid Scn recognition.
Figure 2-1. Chemical structures of fluvibactin (2-1) and vibriobactin (2-2).
HN N NH
O
NO
OH
OH
O O
OHOH HO
OH
Fluvibactin2-1
O
HOOH
HN N NH
O ONO NO
OH
OH
OH
OH
Vibriobactin2-2
14

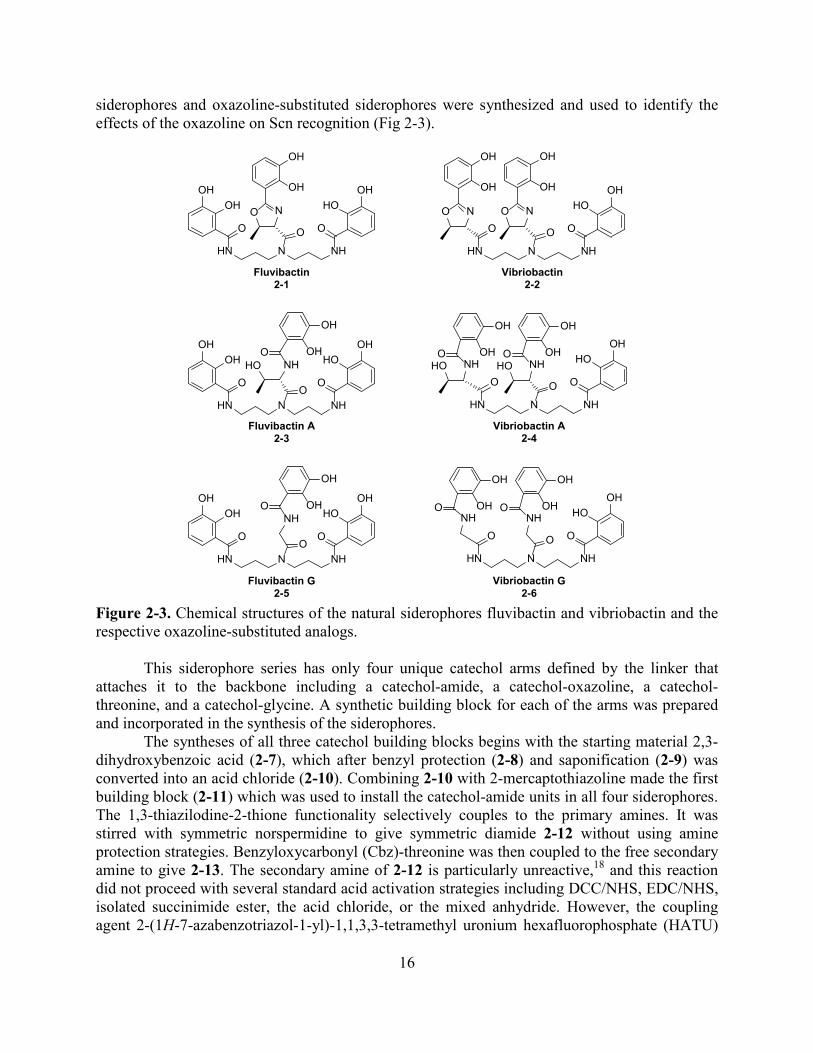
Vibrio fluvialis and Vibrio cholerae each synthesize and use triscatechol siderophores that have at least one catechol attached to a five-membered heterocycle oxazoline. V. fluvialis makes fluvibactin (1) with one catechol-oxazoline unit.11 V. cholerae makes vibriobactin (2) with two oxazoline-catechol units (Fig. 2-1).12 The catechol-oxazoline units are capable of coordinating iron either in a catecholate mode or a phenolate-oxazoline mode, and the two modes resemble the catecholate and salicylate modes of catechol units (Fig. 2-2).13 Siderophores in a salicylate mode are not recognized by Scn,14 and, by analogy, the Vibrio siderophores may avoid Scn recognition by coordinating iron in a phenolate-oxazoline mode.
Figure 2-2. Ferric coordination modes of the catechol and catechol-oxazoline units of siderophores. Catechol units may coordinate iron in either a catecholate mode or a salicylate mode. Catechol-oxazoline units may coordinate iron in either a catecholate mode or a phenolate-oxazoline mode. Both transitions are proton dependent.
Li et al. reported that Fe-vibriobactin is a stealth siderophore, and they used indirect evidence from a crystal structure of a periplasmic protein bound to Fe-vibriobactin to suggest that the phenolate-oxazoline coordination mode provides the stealth character.15 However, the Fe-vibriobactin coordination mode when bound to Scn was not identified. Previous to the publication by Li et al. I had performed Scn binding studies that disagreed with their report. By using a small siderophore library, binding studies, protein crystallography, and solution thermodynamics, I characterized the effect of the oxazolines of fluvibactin and vibriobactin on Scn recognition with particular focus on the phenolate-oxazoline iron coordination mode. The catecholate-oxazoline unit does not give fluvibactin or vibriobactin stealth character. Synthesis of the Siderophore Library
The oxazolines in fluvibactin and vibriobactin are cyclized threonine residues.16 Substituting linear threonine residues for each oxazoline gives fluvibactin A (2-3) or vibriobactin A (2-4), named by following the convention previously used to distinguish the oxazoline siderophore agrobactin from the ring-opened agrobactin A.17 Substituting glycine residues for each oxazoline gives fluvibactin G (2-5) and vibriobactin G (2-6). The complete series of natural
OFeIII
O
O NHR
OH
OFeIIIO
HNR
O N O NFeIIIOO
FeIIIO OH
H+
Catecholate Salicylate
CatecholatePhenolate-Oxazoline
H+
R R
15
siderophores and oxazoline-substituted siderophores were synthesized and used to identify the effects of the oxazoline on Scn recognition (Fig 2-3).
Figure 2-3. Chemical structures of the natural siderophores fluvibactin and vibriobactin and the respective oxazoline-substituted analogs.
This siderophore series has only four unique catechol arms defined by the linker that attaches it to the backbone including a catechol-amide, a catechol-oxazoline, a catechol-threonine, and a catechol-glycine. A synthetic building block for each of the arms was prepared and incorporated in the synthesis of the siderophores.
The syntheses of all three catechol building blocks begins with the starting material 2,3-dihydroxybenzoic acid (2-7), which after benzyl protection (2-8) and saponification (2-9) was converted into an acid chloride (2-10). Combining 2-10 with 2-mercaptothiazoline made the first building block (2-11) which was used to install the catechol-amide units in all four siderophores. The 1,3-thiazilodine-2-thione functionality selectively couples to the primary amines. It was stirred with symmetric norspermidine to give symmetric diamide 2-12 without using amine protection strategies. Benzyloxycarbonyl (Cbz)-threonine was then coupled to the free secondary amine to give 2-13. The secondary amine of 2-12 is particularly unreactive,18 and this reaction did not proceed with several standard acid activation strategies including DCC/NHS, EDC/NHS, isolated succinimide ester, the acid chloride, or the mixed anhydride. However, the coupling agent 2-(1H-7-azabenzotriazol-1-yl)-1,1,3,3-tetramethyl uronium hexafluorophosphate (HATU)
HN N NH
O
NO
OH
OH
O O
OHOH HO
OH
Fluvibactin2-1
HN N NHO
O O
OHOH HO
OH
NHO
HOOH
OH
Fluvibactin A2-3
HN N NHO
O O
OHOH HO
OH
NHO OH
OH
Fluvibactin G2-5
O
HOOH
HN N NH
O ONO NO
OH
OH
OH
OH
Vibriobactin2-2
O
HOOH
HN N NH
O O
NHHO NHHOO O OH
OH
OH
OH
Vibriobactin A2-4
O
HOOH
HN N NH
O O
NH NHO O OH
OH
OH
OH
Vibriobactin G2-6
16

permitted the reaction to proceed. The HATU coupling was later used to form the tertiary amide in each of the siderophores. All of the protecting groups present in 2-13 are easily removed by hydrogenolysis to yield 2-14. Finally, the catechol-oxazoline building block (2-15) was condensed with 2-14 as reported by Bergeron et al. to produce fluvibactin (2-1) (Scheme 2-1).19 Scheme 2-1. Synthesis of fluvibactin (2-1) using the catechol-amide building block (2-11).
The synthesis of both oxazoline-substituted analogs makes use of the symmetric amine 2-
12 from the fluvibactin synthesis (Scheme 2-2). For the threonine analog, the secondary amine of 2-12 was condensed with the catechol-threonine synthetic building block (2-16) using HATU to give 2-17, which was then deprotected to give fluvibactin A (2-3). For the glycine analog, the catechol-glycine building block (2-18) was used instead to give 2-19, which was then deprotected to make fluvibactin G (2-5).
OH
OH
NHEtO
HN N NH
O
NO
OH
OH
O O
OHOH HO
OH
MeOH60 oC
HN N NH
O
NHCbzHOO O
OBnOBn BnO
OBn
2-13
2-14 Fluvibactin2-1
2-15
HATUDIEA, DMF0 oC to r.t.
Cbz-Thr
HN NH
O
OBnOBn
22-12
OH
O
OHOH
OBn
O
OBnOBn
OH
O
OBnOBn
Cl
O
OBnOBn
N
O
OBnOBn
S
S
2-11
acetone65 oC
NaOHMeOHCH2Cl2
oxalylchloridecat. DMFbenzene NEt3,THF
0 oC
N S
SH
2-8 2-9 2-10
CH2Cl2
norspermidine
BnClK2CO3KI
2-7
HN N NH
O
NH2HOO O
OHOH HO
OH
H2/Pd-CEtOH
17

Scheme 2-2. Synthesis of the oxazoline-substituted analogs of fluvibactin.
For the vibriobactin series, desymmetrizing norspermidine was achieved by mono-Boc
protection to give 2-20,20 using 2-11 to form the catechol-amide 2-21, and deprotection to give 2-22. Monoamide 2-22 was combined with two equivalents of Cbz-threonine using HATU (2-23), deprotected (2-24), and condensed with 2-15 to yield vibriobactin (2-2) (Scheme 2-3).21 Scheme 2-3. Synthesis of vibriobactin (2-2).
HATUDIEATHF
NHO
HOO
HO
HN N NHO
O O
OBnOBn BnO
OBn
NHO
HO
2-172-16
H2/Pd-C
HN N NHO
O O
OHOH HO
OH
NHO
HOOH
OH
Fluvibactin A2-3
MeOH
2-12BnO
BnO
BnO
BnO
HATUDIEADMF
NHO
HOO
HN N NHO
O O
OBnOBn BnO
OBn
NHO
2-192-18
H2/Pd-C
HN N NHO
O O
OHOH HO
OH
NHO OH
OH
Fluvibactin G2-5
MeOH
2-12BnO
BnO
BnO
BnO
MeOH60 oC
HATUDIEA, CH2Cl20 oC to r.t.
O
HOOH
HN N NH
O ONO NO
OH
OH
OH
OH
O
BnOOBn
HN N NH
O ONHZHO NHCbzHO
Cbz-Thr
2-15
Vibriobactin2-2
H2/Pd-C
2-23 2-24
HN NH
O
OBnOBn
2-22
NH2
HN NH
O
OBnBoc-norspermidine2-20
2-21
CH2Cl2 CH2Cl20 0C
20% TFA2-11
OBnNHBoc
O
HOOH
HN N NH
O ONH2HO NH2HO
MeOH
18

The oxazoline-substituted analogs of vibriobactin were synthesized using the same
building blocks and reactions used for the fluvibactin analogs. Two equivalents of the catechol threonine building block 2-16 were combined with 2-22 to give 2-25 which was deprotected to make vibriobactin A (2-4). Lastly, two equivalents of 2-18 were combined with 2-22 to give 2-26 which was deprotected to give vibriobactin G (2-6) (Scheme 2-4). This modular and convergent synthetic design produced six different siderophores while using the same building blocks, reagents, and minimally modified reactions.
Scheme 2-4. Synthesis of the oxazoline-substituted analogs of vibriobactin.
Scn Binding Assays
The synthesized siderophores were used as metal free ligands (apo-) or ferric complexes in fluorescence quenching titrations with Scn at physiological pH (7.4) to quantify the affinity of the protein for the siderophores. Non-linear regression analysis, using the program DYNAFIT, fit the data to a one-to-one binding model, as shown in Fig. 2-4 to give the Kds listed in Table 2-1.22 All of the apo- and Fe-siderophores have submicromolar Kds with Scn, and the high affinity of Fe-fluvibactin and Fe-vibriobactin shows that incorporation of catechol-oxazoline units in a siderophore structure is not a stealth strategy. The three catechol units of fluvibactin and vibriobactin provide the key interactions for binding with Scn. The Scn binding pocket recognizes the catechol units of a siderophore despite large variations in the backbone, and this recognition strategy allows it to bind many siderophores with catechol as the only common feature, now including fluvibactin and vibriobactin.4
O
HOOH
HN N NH
O O
NHHO NHHOO O OH
OH
OH
OH
Vibriobactin A2-4
O
BnOOBn
HN N NH
O O
NHHO NHHOO O OBn
OBn
OBn
OBn
2-25
2-16
HATUDIEACH2Cl20 oC to r.t.
H2/Pd-CMeOH
2-22
O
HOOH
HN N NH
O O
NH NHO O OH
OH
OH
OH
Vibriobactin G2-6
O
BnOOBn
HN N NH
O O
NH NHO O OBn
OBn
OBn
OBn
2-26
2-18
HATUDIEACH2Cl20 oC to r.t.
H2/Pd-CMeOH
2-22
19

Figure 2-4. Fluorescence quenching curves of Scn at pH 7.4. The titration data (points) are the average of three independent titrations. The lines represent the one-to-one binding model fit by DYNAFIT to the compiled (not averaged) titration data.22 The Kd for each Fe- or apo-siderophore is listed in Table 2-1. Table 2-1. Dissociation constants of Scn and siderophores at pH 7.4
Siderophore Apo- Kd (nM)
Fe- Kd (nM)
Fluvibactin 34(4) 4.4(8) Fluvibactin A 12(2) 1.0(3) Vibriobactin 56(6) 18(3) Vibriobactin A 18(2) 8(1)
Although each of the four siderophores is bound by Scn, the affinity varies. Three major
trends reveal the effect of catechol-oxazoline on Scn recognition. The first trend is that Scn has higher affinity for Fe-siderophores than apo-siderophores. The Fe-siderophores are more negatively charged and thus have greater Coulombic interactions with the positive binding pocket. This trend has been observed in all siderophores bound by Scn,5,14 and the shape constraints of the catechol-oxazoline units do not reverse it.
0 0.1 0.2 0.3 0.4 0.5 0.6 0.7 0.8 0.9
1
0 200 400 600
Nor
m. F
luor
. (AU
)
[Siderophore] (nM)
Fe-Fluvibactin
Fe-Fluvibactin A
0 0.1 0.2 0.3 0.4 0.5 0.6 0.7 0.8 0.9
1
0 200 400 600
Nor
m. F
luor
. (AU
)
[Siderophore] (nM)
Fe-Vibriobactin
Fe-Vibriobactin A
0 0.1 0.2 0.3 0.4 0.5 0.6 0.7 0.8 0.9
1
0 200 400 600 800
Nor
m. F
luor
. (AU
)
[Siderophore] (nM)
Apo-Fluvibactin
Apo-Fluvibactin A
0 0.1 0.2 0.3 0.4 0.5 0.6 0.7 0.8 0.9
1
0 200 400 600 800
Nor
m. F
luor
. (AU
)
[Siderophore] (nM)
Apo-Vibriobactin
Apo-Vibriobactin A
20

The second trend is that Scn has lower affinity for the vibriobactin series than for the fluvibactin series. Two linkers between the backbone and catechol, whether oxazoline or threonine, fit less well in the protein binding pocket, and the effect is more pronounced for the Fe-siderophores than for the apo-siderophores.
The third trend is that Scn has higher affinity for the catechol-threonine siderophores than for the catechol-oxazoline siderophores in both apo- and Fe-siderophores. For apo- and Fe-siderophores the trend arises because the catechol-threonine may rotate and fold to fit in the binding pocket, but the catechol-oxazoline has relatively limited flexibility because of the rigidity of the heterocycle. Notably, the Kd for Fe-vibriobactin is significantly larger than the Kd for the other Fe-siderophores and infers the contribution of another factor beyond the sterics of the oxazoline linker.
It is possible that the additional factor affecting Scn affinity is the way in which the coordination mode influences the shape of the Fe-siderophores. The catechol-threonine siderophores fluvibactin A and vibriobactin A only coordinate iron in the catecholate mode because the salicylate mode only occurs below pH 5.9 As expected, the Kd for each is close to the Kd for triscatecholate Fe-enterobactin. The identification of the coordination mode of Fe-fluvibactin and Fe-vibriobactin is not possible from FQ titrations, and the change from catecholate to phenolate-oxazoline modes had not been previously characterized. Therefore, other methods were used to identify the coordination mode at physiological conditions and when bound by Scn. Fe-Fluvibactin:Scn Structure
In collaboration with Prof. Roland Strong’s research group at the Fred Hutchinson Cancer Research Center, we have extensively used structural characterization of Scn with Fe-siderophores to elucidate protein-ligand interactions. Initially Dr. Matthew Clifton, and then Dr. Colin Correnti crystallized Scn bound to Fe-fluvibactin. The crystal structure of the protein-siderophore complex shows that the protein interacts with the siderophore similar to other catecholate Fe-siderophores such as enterobactin (Fig. 2-5A).3 The three catechols fit into three subpockets formed by the positive residues (R81, K125, and K134) of the binding pocket. Although Fe-fluvibactin was only modeled in a single conformation, it is clear from the electron density that the catechol-oxazoline unit is never seen in pocket 1, consistent with it being the key pocket for recognition. The catechol-oxazoline unit of Fe-fluvibactin is in a catecholate coordination mode (Fig. 2-5B). The catechol oxygen atoms average about 2 Å from the iron center, which is an expected Fe-O bond distance.23 The oxazoline nitrogen is over 4 Å from the metal which is much larger than a Fe-N bonding interaction. This coordination mode is observed inside Scn even when the crystals were grown at pH 4.5, and at such low pH it is more likely that protonation of Fe-fluvibactin would increase the stability of the phenolate-oxazoline mode. If Fe-fluvibactin were to adopt the phenolate-oxazoline mode, then it appears that one of the catechols would clash with the protein wall and prevent binding as was observed while docking salicylate models of enterobactin into the Scn binding pocket.14 The lowered affinity for Fe-fluvibactin relative to Fe-fluvibactin A observed in the fluorescence quenching titrations is due to the steric constraints of the oxazoline but not due to a phenolate-oxazoline iron coordination.
21

Figure 2-5. The coordination mode of Fe-fluvibactin when bound by Scn. A) Crystal structure of Fe-fluvibactin in the binding pocket of Scn. Insert shows complex crystals of Scn:Fe-fluvibactin. B) Another view of Fe-fluvibactin from the Scn binding pocket. The atom-atom distances show that three catechols are coordinated to iron with Fe-O distances near 2.0 Å (only two shown for clarity). The oxazoline has a N-Fe distance greater than 4.4 Å, and it is not coordinated to the metal.
We were unable to obtain diffraction quality crystals of Fe-vibriobactin with Scn, so solution thermodynamics were used to identify the coordination mode of the siderophore during protein binding.
Solution Thermodynamics
Catechol siderophores have absorption spectra that change based on the protonation state of the siderophore which allows for the use of spectrophotometric titrations to measure the equilibrium constants for protonating and deprotonating the siderophores. To perform this measurement, the pH of a solution containing the siderophore is adjusted while measuring the absorbance of the siderophore. The protonation constants of apo-fluvibactin A were measured first.
A typical titration of apo-fluvibactin A from high to low pH is shown in Fig. 2-6. At high pH large absorbances are observed at 340 nm and 250 nm. As the pH is lowered, the peak at 340 nm is blue shifted and decreases in intensity. The peak at 250 nm experiences little change. The reverse titration from low to high pH mirrors the displayed titration, showing that the protonation equilibria are reversible.
A B
22

Figure 2-6. Spectrophotometric titration of apo-fluvibactin A. The absorbance of fluvibactin A was measured as the pH was lowered from pH 11.5-2.4. Every other measurement is displayed to simplify the graph. The arrows indicate the change in the spectra as the pH of the solution was lowered.
The spectra recorded during the titration were fit with an appropriate protonation model
using factor analysis in the program pHab to give the cumulative protonation constants (β).24 The stepwise constants (K) are easily derived from the β values. The averaged constants from more than three complete titrations (forward and reverse) were used to determine the log values listed in Table 2-2. Table 2-2. Log values of the cumulative (β) and stepwise (K) protonation constants of apo-fluvibactin A (FluvA).
Protonated Species β K
FluvAH1 (meta) 12.5 12.5
FluvAH2 (meta) 24.3 11.8
FluvAH3 (meta) 35.2 10.9(3)
FluvAH4 (ortho) 45.1 9.8(2)
FluvAH5 (ortho) 53.3 8.2(1)
FluvAH6 (ortho) 60.2 7.00(8)
FluvAH6 63.0 2.7(5)
The three catechol units of fluvibactin A each have two ionizable protons, giving six protonation constants total. The phenols meta to the amide are more basic than the ortho phenols. The two largest protonation constants, belonging to meta phenols, are above the pH range measured in these titrations. As done in previous publications, these protonation constants were
0
5000
10000
15000
20000
25000
250 275 300 325 350 375 400
Abso
rban
ce (M
-1cm
-1)
Wavelength (nm)
23

estimated by adding 0.8 to the constant just below it.25 The constants were determined for one meta hydroxyl, three ortho hydroxyls. An additional equilibrium that gave a small absorbance change was observed at low pH which was likely some precipitation and is approaching the detection limit of a titration using 0.1 M acid.
The methodology used to determine the protonation constants of apo-fluvibactin A was then applied to apo-vibriobactin A. A typical spectrum is shown in Fig. 2-7, and the respective constants are listed in Table 2-3.
Figure 2-7. Spectrophotometric titration of apo-vibriobactin. The absorbance of vibriobactin was measured as the pH was lowered from pH 10.8-3.0. Every other measurement is displayed to simplify the graph. The arrows indicate the change in the spectra as the pH of the solution was lowered. Table 2-3. Log values of the cumulative (β) and stepwise (K) protonation constants of apo-vibriobactin (Vib).
Protonated Species β K
VibH1 (meta) 12.9 12.9
VibH2 (meta) 25.0 12.1
VibH3 (meta) 36.3 11.3
VibH4 (ortho) 46.18 9.88(3)
VibH5 (ortho) 54.3 8.1(16)
VibH6 (ortho) 61.4 7.1(16) Like fluvibactin A, vibriobactin has three meta phenols and three ortho phenols. These titrations did not determine the lowest meta protonation constant. Harris et al. used an average logK value of 12.1 for the three meta phenols of enterobactin.25 By using this average value, the
0
5000
10000
15000
20000
25000
30000
250 275 300 325 350 375 400
Abso
rban
ce (M
-1cm
-1)
Wavelength (nm)
24

meta phenol protonation constants were spaced 0.8 log units apart to estimate the cumulative protonation constants.
The change in coordination mode from catecholate to phenolate-oxazoline is proton-dependent. Addition of a proton to a Fe-catecholate complex blocks metal coordination through the meta oxygen, the most basic site while the ortho oxygen remains coordinated to the metal, and the oxazoline nitrogen becomes the new coordination site (Fig. 2-2). Spectrophotometric pH titrations of Fe-vibriobactin were performed to measure this protonation constant. The electronic spectra of the complex were recorded as the solution was changed from pH 10 to pH 7 (Fig. 2-8). At high pH a major absorbance is observed at 336 nm. It decreases in intensity while moving to 330 nm as the pH was lowered, and a new peak grows in at 284 nm. The changes in the spectra were fit to give a protonation constant (logK) of 8.21. The first protonation of Fe-vibriobactin occurs well above physiological pH, and a speciation calculation shows that 87% of the Fe-vibriobactin is protonated at the pH of the Scn binding assay (Fig. 2-9). Thus, one of the catechol-oxazoline units of Fe-vibriobactin is predominately in a phenolate-oxazoline coordination mode during the Scn binding assays. The spectral change from 336 to 330 nm is similar to that observed for the salicylate shift in enterobactin.9,14 The first protonation of Fe-fluvibactin occurs at a much lower pH than Fe-vibriobactin meaning that the phenolate-oxazoline coordination mode of this siderophore does not affect Scn binding at physiological pH (Fig 2-10).
Figure 2-8. Spectrophotometric titration of Fe-vibriobactin showing the transition from catecholate mode at pH 10 to phenolate-oxazoline mode at pH 7. Every other measurement is displayed to simplify the graph. The arrows indicate the change in the spectra as the pH of the solution was lowered.
0
5000
10000
15000
20000
25000
30000
35000
250 275 300 325 350 375 400
Abso
rban
ce (M
-1cm
-1)
Wavelength (nm)
25

Figure 2-9. Plot of Fe-vibriobactin speciation versus pH. The calculation was made using measured protonation constant in the program HySS,26 and it shows that at physiological pH (7.4) 87% of the complex is in the phenolate-oxazoline coordination mode.
Figure 2-10. Spectrophotometric titration of Fe-fluvibactin. No change in the absorbance from pH 10 to pH 6 indicates that the first protonation of Fe-fluvibactin occurs far below physiological pH, and the resulting phenolate-oxazoline coordination mode is not present at the conditions of the Scn binding assays. Absorbance Measurements of Scn and Fe-Vibriobactin
In addition to measuring the protonation constant of Fe-vibriobactin, the spectrophotometric titrations gave the absorbance spectrum of the catecholate and phenolate-oxazoline modes of Fe-vibriobactin. This made it possible to use UV-vis spectroscopy to identify the coordination mode of Fe-vibriobactin when bound by Scn. The absorbance spectrum of Fe-vibriobactin with Scn was measured at pH 7 and compared to the spectrum of Fe-vibriobactin at the same pH without Scn (Fig. 2-11). Without Scn, the phenolate-oxazoline mode is observed. The spectrum with Scn resembles the triscatecholate Fe-vibriobactin that is observed only at high pH without Scn. Therefore, all three catechol units of Fe-vibriobactin are in the catecholate mode when bound by Scn, and Scn binding provides the energy for a coordination shift by stabilizing the catecholate mode. Similar stabilization had also been observed with Fe-enterobactin where the salicylate shift was not observed even at pH 3when bound by Scn.14
0 10 20 30 40 50 60 70 80 90
100
7 8 9 10 %
For
mat
ion
pH
Fe-Vibriobactin
H-Fe-Vibriobactin
0
5000
10000
15000
20000
25000
250 350 450 550 650 750
Abso
rban
ce (
M-1
cm-1
)
Wavelength (nm)
26

Figure 2-11. Absorbance spectra of Fe-vibriobactin alone and with Scn. The presence of Scn induces a change in the spectrum at pH 7 that matches the spectrum of Fe-vibriobactin at high pH. Scn binding causes a coordination change from phenolate-oxazoline to catecholate mode. Readjustment of the Fe-Vibriobactin Dissociation Constant
The spectrophotometric titrations and absorbance spectra show that Fe-vibriobactin is in two coordination modes at pH 7.4, and that Scn binds the less abundant triscatecholate mode. The Scn binding assay measures the apparent affinity of Scn for a mixture of Fe-vibriobactin species but not the affinity for triscatecholate Fe-vibriobactin. The binding model used to quantify the fluorescence quenching titrations was modified to include the protonation equilibrium of Fe-vibriobactin with the assumption that Scn only binds triscatecholate Fe-vibriobactin to give a Kd of 2.5 nM (Scheme 2-5). Scheme 2-5. Equations used to fit the fluorescence quenching data of Fe-vibriobactin and Scn to a model that includes the protonation equilibrium of Fe-vibriobactin. Signal: 𝐹 = 𝑎[𝑆𝑐𝑛] − 𝑏[𝑆𝑐𝑛:𝐹𝑒𝑉𝑖𝑏] Protonation equilibrium: 𝐹𝑒𝑉𝑖𝑏 + 𝐻 ⇌ 𝐹𝑒𝑉𝑖𝑏𝐻 𝐾𝐻 = [𝐹𝑒𝑉𝑖𝑏𝐻]
[𝐹𝑒𝑉𝑖𝑏][𝐻]
Binding equilibrium: 𝑆𝑐𝑛 + 𝐹𝑒𝑉𝑖𝑏 = 𝑆𝑐𝑛:𝐹𝑒𝑉𝑖𝑏 𝐾𝑃 = [𝑆𝑐𝑛:𝐹𝑒𝑉𝑖𝑏][𝑆𝑐𝑛][𝐹𝑒𝑉𝑖𝑏]
Mass Balance: [𝑆𝑐𝑛]𝑡𝑜𝑡 = [𝑆𝑐𝑛] + [𝑆𝑐𝑛:𝐹𝑒𝑉𝑖𝑏]
[𝐹𝑒𝑉𝑖𝑏]𝑡𝑜𝑡 = [𝐹𝑒𝑉𝑖𝑏] + [𝐹𝑒𝑉𝑖𝑏𝐻] + [𝑆𝑐𝑛:𝐹𝑒𝑉𝑖𝑏] Quadratic: 0 = 𝐾𝑝𝑥2 − [1 + ([𝐹𝑒𝑉𝑖𝑏]𝑡𝑜𝑡 + [𝑆𝑐𝑛]𝑡𝑜𝑡)𝐾𝑃 + [𝐻]𝐾𝐻]𝑥 + [𝐹𝑒𝑉𝑖𝑏]𝑡𝑜𝑡[𝑆𝑐𝑛]𝑡𝑜𝑡𝐾𝑃
The difference between the apparent Kd previously calculated and the Kd calculated with
the model in Scheme 2-5 arises because of a difference in speciation. The initial model used the simple assumption that all of the ferric siderophore could be bound. The two equilibria model is superior because it takes into account that there are two species in solution. It makes the assumption that only the species with catecholate coordination is bound in agreement with the previous observations that the salicylate mode is not bound by Scn.14 This assumption may be and over simplification because Scn may weakly bind the phenolate-catecholate coordination mode. To test the second model, the fluorescence titrations were repeated with all of the apo- and
0
5000
10000
15000
20000
25000
30000
250 300 350 400
ɛ (M
-1cm
-1)
Wavelength (nm)
Fe-Vibriobactin
Scn:Fe-Vibriobactin
27

Fe-siderophores at pH 8.6 (Fig. 2-12, Table 2-4). The higher pH shifts the speciation of Fe-vibriobactin which should lower the value of the apparent Kd.
Figure 2-12. Fluorescence quenching curves of Scn at pH 8.6. The titration data (points) are the average of three independent titrations. The lines represent the one-to-one binding model fit by DYNAFIT to the compiled (not averaged) titration data.22 The Kd for each Fe- or apo-siderophore is listed in Table 2-4. Table 2-4. Comparison of the dissociation constants of Scn and siderophores at pH 7.4 and 8.6.
0 0.1 0.2 0.3 0.4 0.5 0.6 0.7 0.8 0.9
1
0 200 400 600 800
Nor
m. F
luor
. (AU
)
[Siderophore] (nM)
Apo-Fluvibactin
Apo-Fluvibactin A
0 0.1 0.2 0.3 0.4 0.5 0.6 0.7 0.8 0.9
1
0 200 400 600 800
Nor
m. F
luor
. (AU
)
[Siderophore] (nM)
Apo-Vibriobactin
Apo-Vibriobactin A
0 0.1 0.2 0.3 0.4 0.5 0.6 0.7 0.8 0.9
1
0 200 400 600 800
Nor
m. F
luor
. (AU
)
[Siderophore] (nM)
Fe-Fluvibactin
Fe-Fluvibactin A
0 0.1 0.2 0.3 0.4 0.5 0.6 0.7 0.8 0.9
1
0 200 400 600 800
Nor
m. F
luor
. (AU
)
[Siderophore] (nM)
Fe-Vibriobactin
Fe-Vibriobactin A
Siderophore pH 7.4 Kd (nM)
pH 8.6 Kd(nM)
Fe-Fluvibactin 4.4(8) 7(1) Fe-Fluvibactin A 1.0(3) 1.6(3) Fe-Vibriobactin 18(3) 16(2) Fe-Vibriobactin A 8(1) 7(1) Apo-Fluvibactin 34(4) 8(1) Apo-Fluvibactin A 12(2) 3.2(5) Apo-Vibriobactin 56(6) 9(1) Apo-Vibriobactin A 18(2) 6.8(7)
28

Only a small change was observed for the fluorescence quenching titrations performed at pH 8.6 compared to the same titrations at pH 7.4. The most notable change is observed for the apo-siderophores where the Kd was lowered 2- to 6-fold. This change in apparent Kd likely occurred because at higher pH a singly deprotonated, anionic species becomes the dominant species. The anionic apo-siderophores would have more favorable interactions with the positively-charged binding pocket compared to the neutral species of the apo-siderophore. The fluorescence quenching titrations of the Fe-siderophores at pH 8.6 were almost identical to those at pH 7.4. For the siderophore analogs Fe-fluvibactin A and Fe-vibriobactin A, this was not surprising because triscatecholate siderophores do not have a protonation equilibrium in this pH range. The species present in the titration would not be different for these two different pH values. The spectrophotometric titration of Fe-fluvibactin showed that it also does not have a protonation equilibrium at this pH. The only Fe-siderophore that should have a different apparent Kd is Fe-vibriobactin because two species are present at different amounts in this pH range. At pH 7.4 the phenolate-oxazoline coordination species is 87% of the total Fe-vibriobactin, and at pH 8.6 the abundance is reduced to 29% (Fig. 2-9). The five-fold difference in concentration of the recognized catecholate species of Fe-vibriobactin is not enough to change the nanomolar apparent Kd significantly. Higher pH conditions were not tested because the protein would likely not be stable at higher pH. Conclusions
Scn binds the oxazoline siderophores of Vibrio pathogens, including Fe-vibriobactin. The affinity of Scn for triscatecholate Fe-vibriobactin is similar to the affinity of Scn for other triscatecholate siderophores. Thus, the Fe-triscatecholate structure is recognized with high affinity by Scn. The human immunoprotein outwits the coordination chemistry of V. cholerae (Fig. 2-13).
Figure 2-13. The coordination mode of Fe-vibriobactin is affected by pH and by Scn binding.
Li et al. reported contrary observations that Fe-vibriobactin is a stealth siderophore, and
that it is not bound because one catechol unit is in a phenolate-oxazoline coordination mode.15 The evidence presented for the coordination mode was from a crystal structure of the periplasmic binding protein ViuP bound to Fe-vibriobactin. For several reasons, the indirect, modeled characterization does not identify the nature of the interactions between Scn and Fe-vibriobactin. First, the ViuP:Fe-vibriobactin crystals were formed at pH 4, well below the logK of Fe-vibriobactin protonation. Second, the structure of protonated Fe-vibriobactin was excised from ViuP and docked into the binding pocket of Scn. Since two coordination modes of Fe-
O N O NFeIIIOO
FeIIIO OH
-H+
R R
pH 10 pH 7.4
Siderocalin
O N
OFeIII
O
R
pH 7.4
29

vibriobactin are present near physiological pH, it is possible that the two different proteins, each from a different species, recognize different modes of the ferric siderophore. ViuP may bind Fe-vibriobactin in a phenolate-oxazoline mode which is predominant at physiological pH, but Scn does not. Unsurprisingly, phenolate-oxazoline coordination mode observed in ViuP causes the siderophore clash with the binding pocket walls when modeled with Scn. Transposing the Fe-vibriobactin structure from ViuP to Scn is not proof of the coordination mode or explanation for the low affinity observed in the fluorescence quenching titrations with Scn performed by Li et al. However, it is well established that Scn is optimized to bind triscatecholate complexes with high affinity, and the protein binding provides the energy needed to shift the coordination. The Scn binding assay results reported here, which directly contradict Li et al., are supported by the binding assay results of several analogs. As additional evidence that Scn binds Fe-vibriobactin, addition of the protein to the siderophore solution significantly changes the absorbance spectrum. The data from several experiments reported here support the conclusion from the fluorescence quenching titrations that vibriobactin is not a stealth siderophore.
Since vibriobactin and fluvibactin are bound by Scn, V. fluvialis and V. cholerae would likely have trouble infecting the host in locations where Scn is expressed if they exclusively depend on these siderophores. V. cholerae infects the small intestine and Scn is expression is upregulated by V. cholerae infection,27 and V. fluvialis also most frequently infects the gastrointestinal tract.28 Vibriobactin has been associated with increased virulence in the small intestine of a murine model, especially with small inoculum sizes, but additional iron transport systems, including systems for transporting heme or the siderophores of other bacteria, can provide the iron for growth even if vibriobactin is not available.29 V. fluvialis also has heme and xenosiderophore uptake systems as alternative methods to acquire iron.30,31 Although the catechol siderophores are not critical to virulence in the small intestine, they may be more important during extra-gastrointestinal infections. The virulence of another Vibrio pathogen, Vibrio vulnificus, depends on the catechol siderophore vulnibactin to acquire iron from transferrin.32 Vulnibactin is identical to vibriobactin except that the catechol-oxazolines are exchanged for phenol-oxazolines which solely bind iron in a phenolate-oxazoline mode.33 The characterization of the phenolate-oxazoline mode presented in this chapter indicates that vulnibactin is a stealth siderophore.
Methods General Synthesis Procedures. Starting materials and reagents were used as provided from commercial sources. Flash chromatography was performed using silica gel (40-7 mesh). Thin layer chromatography (TLC) was performed with aluminum backed plates of silica gel 60 F254. The Mass Spectrometry Facility at University of California, Berkeley, recorded the FABLR-MS and ESI-MS, while the Microanalytical Services Laboratory of the same institution performed the microanalyses. The 1H and 13C spectra were measured using the noted Bruker spectrometers at room temperature unless otherwise indicated. The solvent for each spectrum is noted, and the spectra were calibrated the appropriate solvent peak. Benzyl 2,3-bis(benzyloxy)benzoate (2-8). A white slurry of 2,3-dihydroxybenzoic acid (2-7) (5.22 g, 33.9 mmol), benzyl chloride (12.5 mL, 109 mmol), KI (18.0 g, 109 mmol), K2CO3 (32.8 g, 237 mmol) in acetone (250 mL) was stirred at reflux (60 °C) for 3 days. After cooling, the
30

acetone was evaporated and the solid was dissolved in water and extracted three times with CH2Cl2. The organic layer was dried with Na2SO4 before purification by flash chromatography. The silica column was packed with hexanes, and a purple side product eluted was with the same solvent. The benzyl ester (14.0 g, 97% yield by weight) was eluted with a 15-100% (v/v) gradient of CH2Cl2 in hexanes: Rf = 0.96 (CH2Cl2); 1H NMR (AV-300, CDCl3) δ 7.43-7.05 (m, 18H), 5.292 (s, 2H), 5.116 (s, 2H), 5.041 (s, 2H); 13C NMR (AVQ-400, CDCl3) δ 166.37, 152.98, 148.49, 137.53, 136.70, 136.08, 128.75, 128.55, 128.39, 128.29, 128.05, 127.76, 127.03, 124.17, 123.15, 118.12, 75.78, 71.42, 67.11; ESI-MS m/z calcd for (M+H) C28H25O4 425.1753, found 425.1750. 2,3-Bis(benzyloxy)benzoic acid (2-9). Benzyl ester 2-8 was stirred at room temperature overnight in a solution of 6 g NaOH, 50 mL methanol, 20 mL CH2Cl2. After removing the solvent, the white solid was dissolved in water and acidified with concentrated HCl to precipitate bis-protected carboxylic acid 3. Filtration and drying gave 11.9 g of material with quantitative conversion of the ester to the carboxylic acid. Characterization of the carboxylic acid matches a previous characterization of the same compound prepared by another method:34 IR (neat) 3031, 2567, 1686, 1577, 1472, 1455, 1415, 1376, 1302, 1258, 1213 cm-1; 1H NMR (AV-300, CDCl3) δ 11.30 (br, 1H), 7.72 (d, J = 7.5 Hz, 1H), 7.50-7.17 (m, 12H), 5.25 (s, 2H), 5.18, (s, 2H); 13C NMR (AVQ-400, CDCl3) δ 165.48, 151.51, 147.27, 136.05, 134.85, 129.51 129.05, 129.02, 128.75, 127.99, 125.24, 124.64, 123.31, 119.13, 71.72; ESI-MS m/z calcd for (M+Na) C21H18O4Na 357.1103, found 357.1099. 2,3-Bis(benzyloxy)benzoyl chloride (2-10) was synthesized according to the procedure of Schuda et al.35: mp = 51-54°C; 1H NMR δ (AV-300, CDCl3) 7.57-7.09 (m, 13H), 5.14 (s, 2H), 5.10 (s, 2H). 3-[2,3-Bis(benzyloxy)benzoyl]-1,3-thiazolidine-2-thione (2-11) was synthesized by using a modified procedure from Samuel et al.36 Acid chloride 4 (20.7 mmol) was dissolved in THF and cooled to 0 °C. A solution of 2-mercaptothiazoline (3.21 g, 26.9 mmol) and triethylamine (5.74 mL, 41.4 mmol) in 70 mL of THF was added over five minutes. The solution became a yellow cloudy mixture while it warmed to room temperature with stirring overnight. The reaction mixture was chromatographed on a silica gel column with CH2Cl2. The product was recrystallized with EtOAc/hexanes to give bright yellow crystals: Rf = 0.43 (CH2Cl2); 1H NMR (AV-300, CDCl3) δ 7.42-7.29 (m, 10H), 7.10-7.05 (m, 2H), 6.98-6.95 (m, 1H), 5.12 (s, 4H), 4.33 (t, J = 7.4 Hz, 2H), 2.84 (t, J = 7.4, 2H); 13C NMR (AVQ-400, CDCl3) δ 201.33, 168.27, 151.45, 145.85, 138.02, 136.67, 130.39, 128.81, 128.59, 128.42, 128.31, 128.26, 127.78, 124.53, 121.60, 117.52, 71.50, 55.90, 28.78. N1,N7-bis[2,3-bis(benzyloxy)benzoyl]norspermidine (2-12) was made using a modified procedure of Miyasaka et al.34 Norspermidine replaced spermidine, and diamide 2-12 was purified by flash chromatography using 1% NH4OH/10% methanol in CH2Cl2 (v/v) to give a clear yellow oil. The characterization matches the previous report of the same compound that Bergeron et al. prepared using a different method:37 Rf = 0.23 (5% (v/v) methanol in CH2Cl2) ; 1H NMR (AVQ-400, CDCl3) δ 8.09 (t, J = 5.4 Hz, 2H), 7.69-7.64 (m, 2H), 7.47-7.32 (m, 20H), 7.13-7.01 (m, 4H), 5.15 (s, 4H), 5.07 (s, 4H), 3.32 (q, J = 6.4 Hz, 4H), 2.63 (br), 2.46 (t, J = 6.8
31

Hz, 4H), 1.57 (quin, J = 6.7 Hz, 4H); 13C NMR (AVQ-400 CDCl3) δ 165.76, 151.85, 146.84, 136.54, 128.94, 128.84, 128.42, 127.80, 127.54, 124.59, 123.26, 117.06, 71.38, 46.94, 37.52, 29.06; FABLR m/z calcd for C48H49N3O6 763.36, found 764.5. N4-(N-carbobenzyloxy-L-threonyl)-N1,N7-bis[2,3-bis(benzyloxy)benzoyl]norspermidine (2-13). Diamide 2-12 (1.09 g, 1.43 mmol) was stirred with N-carbobenzyloxy-L-threonine (0.40 g, 1.58 mmol) in DMF (30 mL dried over 4 Å molecular sieves) under N2(g) and cooled to 0 °C. 2-(1H-7-azabenzotriazol-1-yl)-1,1,3,3-tetramethyl uronium hexafluorophosphate (HATU) was added (0.65 g, 1.72 mmol) to the solution, followed by an excess of N,N-diisopropylethylamine (DIEA) (0.60 mL, 3.44 mmol). The solution turned bright yellow. The reaction mixture was allowed to warm to room temperature as the ice bath melted while stirring overnight. Water (60 mL) was added to the solution and extracted three times with CH2Cl2 (70 mL). The organic layer was washed with 0.5 N HCl (250 mL), then dried, filtered and condensed with rotary evaporation to give a yellow oil. This was purified by flash chromatography using 10% (v/v) methanol in CH2Cl2 to elute a yellow oil. The 1H NMR spectrum showed residual DMF, so the oil was dissolved in CH2Cl2 (30 mL) and washed three times with 0.5 N HCl (30 mL). The organic layer was dried, filtered, and concentrated under vacuum to yield a pale yellow solid (685 mg, 48% yield by weight). The 1H NMR spectrum matches the previously reported spectrum of the same compound prepared by a different method:37 Rf = 0.56 (10% (v/v) methanol in CH2Cl2); 1H NMR δ (AVQ-400, CDCl3) 8.05 (t, 1H), 7.94 (t, 1H), 7.64 (m, 2H) 7.48-7.25 (m, 25H) 7.15-7.07 (m, 4H), 5.64 (d, J = 9.2 Hz, 1H), 5.18-4.96 (m, 10H), 4.33 (d, J = 8.8 Hz, 1H), 4.10 (br, 1H), 3.94 (q, J = 6.4 Hz, 1H), 3.35-3.00 (m, 8H), 1.60-1.49 (m, 4H), 1.10 (d, J = 6.0 Hz, 3H); 13C NMR (AVQ-400, CDCl3) δ 172.38, 165.79, 165.58, 156.76, 151.88, 146.95, 136.77, 136.70, 136.62, 129.02, 128.90, 128.86, 128.79, 128.67, 128.48, 129.42, 128.29, 128.14, 127.84, 124.57, 123.37, 123.18, 117.14, 76.65, 76.46, 71.45, 67.76, 67.24, 45.23, 42.93, 37.07, 36.65, 29.09, 27.47, 19.07; FABLR m/z calcd for (M+H) C60H63N4O10 1000, found 1000; Anal. Calcd (Found) for C60H62N4O10 • 2/3H2O •1/6 C3H12N2O (urea): C, 70.90 (70.88); H, 6.39 (6.51); N, 5.89 (5.91). N4-(L-threonyl)-N1,N7-bis(2,3-dihydroxybenzoyl)norspermidine (2-14). Ethanol was degassed by exchanging vacuum and N2(g) on a Schlenk line. Triamide 2-13 (0.21 g, 0.21 mmol) was added to the solvent, followed by 5% Pd-C (0.22 g wet, 0.05 mmol). The black slurry was stirred under 1 atm H2(g) for 30 hours. The slurry was filtered with an acid-washed fine frit, and the solvent was removed to give the deprotected product 2-14 (0.10 g, 94 % yield). The 1H NMR spectrum matches the previously reported spectrum of the same compound prepared by a different method:37 Rf = baseline (10% (v/v) methanol in CH2Cl2, spot is red on silica); 1H NMR (AV-300, CD3OD) δ 7.24 (t, J = 9 Hz, 2H), 6.93 (d, J = 7.8 Hz, 2H), 6.75-6.68 (m, 2H), 4.25 (d, J1 = 5.4 Hz, 1H), 4.07 (quin, J = 6.0 Hz, 1H), 3.77-3.60 (m, 2H), 3.5-3.39 (m, 6H), 2.05-1.78 (m, 4H), 1.30-1.20 (m, 3H); 13C NMR (AV-300, CD3OD) δ 172.15, 171.79, 171.59, 150.69, 147.62, 147.56, 133.66, 132.52, 129.97, 119.64, 119.56, 119.03, 118.81, 117.04, 116.88, 69.36, 69.21, 57.22, 50.00, 48.30, 46.91, 44.88, 40.22, 39.00, 37.90, 31.69, 30.56, 30.22, 30.07, 28.46, 25.03, 24.13, 20.12, 14.55, 11.54. Ethyl 2,3-dihydroxybenzimidate (2-15) was made according to the procedure of Bergeron.19
32

Fluvibactin (2-1) was synthesized using a procedure given by Bergeron et al.37 and purified on a LH-20 column eluting with 20% (v/v) ethanol in benzene. The product was precipitated in diethyl ether to give a fine, light brown solid. Characterization of 2-1 matched the report of the natural product by Yamamoto et al.11: IR (neat) 3331, 2936, 1633, 1590, 1539, 1456, 1321, 1259, 1236, 1168, 1146 cm-1; 1H NMR (AVQ-400, CD3OD) δ 7.25-7.10 (m, 3H), 6.97-6.83 (m, 3H), 6.76-6.60 (m, 3H) 5.26 (quin, J = 6.4 Hz, 1H), 4.81 (d, J = 6.4 Hz, 1H), 3.95-3.80 (m, 2H), 3.75-3.60 (m, 2H), 3.60-3.35 (m, 4H), 2.15-2.00 (m, 2H), 1.89 (quin, J = 6.8 Hz, 2H), 1.39 (d, J = 6.4 Hz, 3H); 13C NMR (AVQ-400, CD3OD) δ 171.95, 171.64, 171.49, 167.96, 150.45, 147.48, 146.82, 120.35, 120.02, 119.75, 118.75, 118.70, 116.78, 111.98, 79.90, 73.01, 46.87, 45.14, 38.03, 37.96, 30.40, 28.54, 20.35; ESI-MS m/z calcd for (M+H) C31H35N4O10 623, found 623; Anal. Calcd (Found) for C31H34N4O10 • 4/5 H2O: C, 58.45 (58.46); H, 5.63 (5.67); N, 8.79 (8.72). N-[2,3-bis(benzyloxy)benzoyl]-L-threonine (2-16) was synthesized following the procedure of Peterson et al.38 As a modification to the cited procedure, acid chloride 2-10 was prepared following the procedure of Schuda et al.35 The 1H NMR spectra of 2-16 resembles the literature characterization with slight differences from using a different solvent and instrument: 1H NMR δ (AV-300 CDCl3) 8.94 (d, J = 9.0 Hz, 1H), 7.67 (dd, J1 = 7.65 Hz, J2 = 2.1 Hz, 1H), 7.45-7.09 (m, 12H), 5.20-5.11 (m, 4H), 4.60 (dd, J1 = 7.35 Hz, J2 = 2.7 Hz, 1H), 4.37 (qd, J1 = 6.45 Hz, J2 = 3 Hz, 1H), 1.11 (d, J = 6.6 Hz, 3H); ESI-MS m/z calcd for C25H25NO6 (M+H) 436.1760, found 436.1753. Benzyl-Protected Fluvibactin A (2-17). Carboxylic acid 2-16 (0.72 g, 1.6 mmol) was dissolved in THF at room temperature with N,N-diisopropylethylamine (DIEA) (0.62 mL, 3.6 mmol). The coupling agent 2-(1H-7-Azabenzotriazol-1-yl)-1,1,3,3-tetramethyl uronium hexafluorophosphate (HATU) (0.68 g, 1.8 mmol) was added to the reaction solution with stirring, and a fine white precipitate formed. Diamide 2-12 (0.72 g, 1.6 mmol) was added and the reaction was stirred for 24 hours. Over time the precipitate dissolved and the solution turned light yellow. The THF was removed, and the reaction mixture was redissolved in CH2Cl2 (~100 mL) and washed sequentially with 0.5 N HCl, brine, and water. The water wash rested overnight to break an emulsion. The organic layer was dried with Na2SO4, filtered, and evaporated to give a yellow oil. The oil was purified with flash chromatography using 100% EtOAc as the eluant to give 2-17 (1.87 g, quantitative yield by weight): Rf = 0.375 (100% EtOAc) or Rf = 0.625 (10% (v/v) methanol in CH2Cl2); 1H NMR (AV-600, CDCl3) δ 8.625 (d, J = 9.0 Hz, 1H), 8.021 (dt, J1 = 16.2 Hz, J2 = 6.0 Hz, 2H), 7.7-7.6 (m, 3H), 7.5-7.0 (m, 36H), 5.2-5.0 (m, 12H), 4.876 (d, J = 8.4 Hz, 1H), 4.016 (q, J = 6.2 Hz, 1H), 3.5-3.4 (m, 1H), 3.36-3.15 (m, 7H), 1.602 (quin, J = 7.5 Hz, 2H), 1.531 (quin, J = 6.8 Hz, 2H), 1.122 (d, J = 6.6 Hz, 3H); 13C NMR (AV-600, CDCl3) δ 172.38, 165.76, 165.54, 165.51, 151.99, 151.81, 147.18, 146.86, 146.82, 136.64, 146.58, 136.34, 136.21, 129.17, 128.91, 128.80, 128.78, 128.75, 128.73, 128.65, 128.34, 128.30, 128.01, 127.91, 127.84, 127.74, 127.71, 124.48, 124.40, 124.33, 123.25, 123.18, 123.08, 117.51, 117.09, 116.96, 76.52, 76.24, 76.11, 72.45, 71.38, 71.32, 67.91, 45.44, 43.38, 37.09, 36.83, 29.04, 27.50, 19.21, 14.31; ESI-MS m/z calcd for C73H72N4O11Na 1203.5095 (M+Na), found 1203.5126. General deprotection of benzyl-protected siderophores or siderophore precursor (2-3, 2-4, 2-5, 2-6, 2-24). The benzyl protected siderophore or siderophore precursor (2-17, 2-19, 2-23, or 2-25, 2-26) was dissolved in methanol with 1 drop of concentrated HCl. The catalyst, 10 wt%
33

Pd-C, was then added (5 mol% per benzyl protecting group). The reaction was stirred under 1 atm H2(g) for at least 24 hours. The H2(g) was removed and the solution was filtered with a fine frit to give a clear to light orange solution. The methanol was removed and the oil was precipitated in cold diethyl ether. The beige solid was isolated by centrifugation and dried under high vacuum to give the reported compounds. Fluvibactin A (2-3). See general deprotection procedure above: 1H NMR (AV-600, CD3OD) δ 7.349 (dd, J1 = 8.4 Hz, J2 = 1.2 Hz, 1H) 7.240 (dd, J1 = 7.8 Hz, J2 = 1.2 Hz, 1H), 7.204 (dd, J1 = 7.8 Hz, J2 = 1.2 Hz, 1H), 6.948 (dd, J1 = 7.8 Hz, J2 = 1.8 Hz, 1H), 6.94-6.89 (m, 2H), 6.745 (t, J = 8.1 Hz, 1H), 6.697 (t, J = 8.1 Hz, 1H), 5.058 (d, J = 4.2 Hz, 1H), 4.161 (dq, J1 = 6.3 Hz, J2 = 4.2 Hz, 1H), 3.77-3.32 (m, 8H), 2.12-1.99 (m, 2H), 1.93-1.83 (m, 2H), 1.195 (d, J = 6 Hz, 3H); 13C NMR (AV-600, CD3OD) δ 172.92, 172.02, 171.67, 170.54, 150.44, 149.45, 147.45, 147.35, 120.09, 120.04, 119.98, 119.84, 119.79, 119.77, 118.88, 118.76, 117.53, 116.90, 116.87, 69.06, 55.97, 47.05, 44.78, 38.11, 37.90, 29.98, 28.50, 20.33; ESI-MS m/z calcd for C31H36N4O11Na (M+Na) 663.2278, found 663.2265; Anal. Calcd (Found) for C31H36N4O11 • H2O • CH3OH • NaCl: C, 51.30 (51.54); H, 5.65 (5.54); N, 7.48 (7.32). Glycyl-2,3-dibenzyl-benzamide (2-18) was synthesized according to the procedure of Dertz, Xu, and Raymond to give 3.157 g at 96% yield by weight.39 Bn-Fluviabactin G (2-19). Carboxylic acid 2-18 (0.56 g, 1.4 mmol) was stirred with DIEA (0.55 mL, 3.1 mmol) in DMF in dried glassware at 0 °C. The coupling agent HATU (0.60 g, 1.4 mmol) was added, followed by diamide 2-12 (1.0 g, 1.3 mmol). The yellow solution was allowed to warm to room temperature as it was stirred for 3 days under N2. The solvent was removed with and oil-pump on a rotary evaporator. The brown oil was dissolved in CH2Cl2 and washed three times with ~50 mL of 0.5 N HCl. The organic layer was dried with Na2SO4, filtered, and evaporated to give ~2 g of an oil. The oil was loaded on a silica column and eluted with a gradient of 0-5% methanol in CH2Cl2. Only the baseline impurity was removed. The fractions containing product were repurified by flash chromatography using 100% EtOAc as the solvent. The major product was collected and the solvent was evaporated to give 0.894 g (60% yield by weight): 1H NMR δ (CDCl3) 8.73 (m, 1H), 8.03 (q, J = 5.4 Hz, 2H), 7.75-7.65 (m, 3H), 7.47-7.06 (m, 36H), 5.20-5.06 (m,12H), 4.03 (d, J = 3.9 Hz, 2H), 3.27-3.20 (m, 6H), 3.05 (t, J = 7.2 Hz, 2H), 1.61-1.51 (m, 4H); 13C NMR δ 167.56, 165.31, 165.24, 165.01, 151.79, 151.63, 151.54, 146.88, 146.83, 146.55, 136.47, 136.38, 136.31, 136.23, 129.20, 128.72, 128.64, 128.59, 128.52, 128.46, 128.17, 128.07, 127.81, 127.64, 127.54, 127.51, 127.42, 126.86, 124.32, 124.23, 124.06, 123.04, 122.93, 122.82, 117.23, 117.04, 116.67, 76.43, 76.12, 75.99, 71.16, 71.00, 44.47, 43.49, 41.47, 36.93, 28.49, 27.43, 14.15. ESI-MS m/z calcd for C71H69N4O10N4 (M+H) 1137.5014, found 1137.4984. Fluvibactin G (2-5). 1H NMR δ (methanol-d4) 7.281 (dd, J1 = 7.8 Hz, J2 = 1.2 Hz, 1H), 7.202 (ddd, J1 = 12.6 Hz, J2 = 7.8 Hz, J3 = 1.2 Hz, 2H), 6.96-6.88 (m, 3H), 6.731 (t, J = 8.1 Hz, 1H), 6.708 (t, J = 8.1 Hz, 1H), 6.670 (t, J = 8.1 Hz, 1H), 4.291 (s, 2H), 3.54-3.44 (m, 6H), 3.383 (t, J = 6.9 Hz, 2H), 2.022 (quin, J = 7.5 Hz, 2H), 1.876 (quin, J = 6.9 Hz, 2H); 13C NMR δ 171.8666, 171.6472, 171.4677, 170.84, 150.5262, 150.2746, 150.11, 147.4692, 147.46, 147.43, 119.9439, 119.90, 119.94, 119.8197, 119.77, 119.40, 118.90, 118.76, 117.0353, 117.01, 116.8716, 46.23,
34

44.95, 42.32, 38.14, 37.98, 29.67, 28.56; ESI-MS m/z calcd for C29H32N4O10Na (M+Na) 619.2016, found 619.2001; Anal. Calcd (Found) for C29H32N4O10 • H2O • ½(CH3CH2)2O: C, 57.14 (56.88); H, 6.03 (5.91); N, 8.60 (8.62). N1-(tert-butyl carbamate)norspermidine (2-20) was synthesized according to the procedure of Krapcho et al.20 N1-[2,3-bis(benzyloxy)benzoyl]-N7-(tert-butyl carbamate)norspermidine (2-21). Amine 2-20 (2.45 g, 10.6 mmol) and thiazolide 2-11 (5.08 g, 11.7 mmol) were dissolved in CH2Cl2 and stirred at room temperature overnight. The solvent was removed and mixture was purified by flash chromatography by eluting with 0-8% (v/v) methanol in CH2Cl2 to give 2-21 (3.174 g, 54% yield by mass). The product gives two spots by TLC using 10% (v/v) methanol in CH2Cl2 (Rf = 0.13 and Rf = 0.38) likely due to two protonation states of the product amine. Only one spot is observed on basic alumina plates: 1H NMR (AV-600, CDCl3) δ 8.077 (m, 1H), 7.670 (t, J = 10.8 Hz, 1H), 7.48-7.26 (m, 10H), 7.122 (d, J = 8.4 Hz, 2H), 5.251 (s, 2H), 5.125 (s, 2H), 3.315 (q, J = 6.4 Hz, 2H), 2.497 (t, J = 6.6 Hz, 2H), 2.459 (t, J = 6.6 Hz, 2H), 1.954 (br), 1.561 (quin, J = 6.3 Hz, 2H), 1.499 (quin, J = 6.6 Hz), 1.395 (s, 9H); 13C NMR (AV-600, CDCl3) δ 165.507, 156.310, 151.867, 146.864, 136.599, 136.551, 128.902, 128.816, 128.400, 127.793, 124.588, 123.356, 117.062, 76.526, 71.422, 50.650, 47.432, 47.262, 38.932, 37.679, 29.809, 29.620, 18.578; ESI-MS m/z calcd for C32H42N3O5 (M+H) 548.3124, found 548.3125. N1-[2,3-bis(benzyloxy)benzoyl]norspermidine (2-22). Boc-protected amine 2-21 (0.629 g, 1.15 mmol) was dissolved in CH2Cl2 (20 mL) and cooled to 0 °C. TFA (5 mL) was added and the reaction was monitored by TLC using alumina plates with 5% (v/v) methanol in CH2Cl2. The reaction was quenched after 40 min by adding 1 M NaOH until the pH was basic. The mixture was extracted with CH2Cl2 three times, dried with Na2SO4, and filtered and evaporated. The residue was dissolved in a small amount of CH2Cl2 and stirred with K2CO3(s) to absorb and residual water and hydroxide. The slurry was filtered to give a clear solution. Evaporation gave monoamide 2-22 (0.45 g, 87.5% yield by weight): 1H NMR (AV-300, CDCl3) δ 8.068 (m, 1H), 7.75-7.55 (m, 1H), 7.50-7.18 (m, 10H), 7.18-7.00 (m, 2H), 5.095 (s, 2H), 5.016 (s, 2H), 3.312 (q, J = 6.4 Hz, 2H), 2.660 (t, J = 6.8, 2H), 2.491 (q, J = 6.6 Hz), 1.60-1.45 (m, 4H); 13C NMR (AV-600, CDCl3) δ 165.218, 151.778, 146.688, 136.537, 136.463, 128.811, 128.699, 128.652, 128.285, 127.709, 124.454, 123.204, 116.791, 76.339, 71.260, 47.772, 47.576, 40.533, 37.901, 33.770, 29.590; ESI-MS m/z calcd for C27H34N3O3 (M+H) 448.2600, found 448.2593. N1,N4-bis(N-carbobenzyloxy-L-threonyl)]-N7-[2,3-bis(benzyloxy)benzoyl]norspermidine (2-23). The bis-TFA salt of monoamide 2-22(1.30 g, 1.92 mmol), Cbz-Thr (1.23 g, 4.87 mmol), DIEA (2.76 mL, 15.8 mmol) were stirred in CH2Cl2 at 0 °C. HATU (2.01g, 5.28 mmol) was added and the reaction was allowed to warm to room temperature. Stirring continued for 36 hours. The solution was diluted with CH2Cl2 (to 50 mL) and washed twice with 5% (w/v) citric acid in brine (50 mL) and once with brine (50 mL). The slightly cloudy organic layer was dried, filtered and evaporated. The resulting mixture was applied to a column (2 in. O.D.) layered with alumina (1.5 in.) on top of silica (5 in.) packed with CH2Cl2 and eluted with a gradient of 0-3% (v/v) methanol in CH2Cl2. The product-containing fractions were then applied to a silica column and eluted with 2-5% (v/v) methanol in ethyl acetate to give pure 2-23 (0.44 g, 23.5% yield): Rf
35

= 0.42 (5% methanol in CH2Cl2); 1H NMR (AV-300, (CD3)2SO) δ 8.35-8.15 (m, 1H), 8.05-7.80 (m, 1H), 7.60-7.10 (m, 24H), 6.925 (d, J = 8.1 Hz, 1H), 5.30-4.90 (m, 8H), 4.766 (m, 2H), 4.50-4.30 (m, 1H), 4.05-3.75 (m, 3H), 3.35-2.90 (m, 6H), 1.95-1.45 (m, 4H), 1.15-0.95 (m, 6H); 13C NMR (AV-300, (CD3)2SO) δ 170.263, 170.081, 165.905, 165.522, 164.616, 156.123, 151.624, 145.151, 137.121, 136.979, 136.819, 131.346, 130.997, 128.490, 128.341, 128.223, 128.016, 127.791, 127.689, 124.181, 120.731, 115.787, 75.088, 70.180, 67.090, 66.661, 65.568, 60.823, 56.241, 44.865, 42.926, 38.260, 36.736, 36.593, 36.217, 28.578, 27.263, 20.122, 19.814; ESI MS m/z calcd for (M+H) C51H60N5O11 918.4289, found 918.4284. N1,N4-bis(L-threonyl)-N7-(2,3-dihydroxybenzoyl)norspermidine (2-24). See general deprotection procedure above: 1H NMR (AV-600, CD3OD) δ 7.230 (dt, J1 = 8.0 Hz, J2 = 1.4 Hz, 1H), 6.918 (d, J = 7.8 Hz, 1H), 6.72-6.67 (m, 1H), 4.04-3.93 (m, 1H), 3.851 (quin, J = 6.3 Hz, 1H), 3.751 (t, J = 6.3 Hz, 1H), 3.69-3.56 (m, 2H), 3.52- 3.18 (m, 7H), 2.10-1.75 (m, 4H), 1.24-1.13 (m, 6H); 13C NMR (AV-600, CD3OD) δ 175.061, 174.346, 173.866, 171.844, 171.668, 150.931, 150.866, 147.794, 147.687, 119.583, 119.470, 119.360, 119.098, 118.862, 117.195, 117.008, 114.271, 70.573, 70.248, 69.497, 69.425, 67.040, 61.809, 61.716, 57.379, 49.999, 49.719, 47.000, 44.960, 44.830, 44.464, 37.955, 37.877, 37.792, 30.233, 30.148, 28.576; ESI MS m/z calcd for (M+H) C21H36N5O7 470.2615, found 470.2609. Vibriobactin (2-2) was synthesized following the procedure of Bergeron et al.21 The siderophore was purified using an LH-20 column with ethyl acetate as the eluant. The product was further purified by precipitation in water and ethanol to give a fine tan powder. Characterization matched the previous reports:12,21 1H NMR (AV-600, CD3OD) δ 7.21-7.08 (m, 3H), 6.96-6.86 (m, 3H), 6.73-6.62 (m, 3H), 5.30-5.19 (m, 1H), 4.90-4.75 (m, 1H), 4.425 (dd, J1 = 14.7 Hz, J2 = 7.4 Hz, 1H), 3.95-3.10 (m, 8H), 2.12-1.94 (m, 2H), 1.92-1.76 (m, 2H), 1.56-1.12 (m, 6H); 13C NMR δ (AV-300, CD3OD) 173.444, 173.149, 171.924, 171.625, 171.328, 171.234, 168.522, 167.956, 150.428, 149.492, 147.484, 146.871, 146.786, 120.393, 120.022, 119.731, 118.747, 116.775, 111.971, 111.893, 111.825, 80.782, 79.848, 75.913, 73.054, 67.050, 46.858, 46.681, 44.993, 44.678, 38.030, 37.795, 30.920, 30.333, 28.391, 21.537, 20.479, 20.318, 15.589; ESI-MS m/z calcd for C35H38N5O11 (M-H) 704.2573, found 704.2556; Anal. Calcd (Found) for C35H39N5O11: C, 59.57 (59.23); H, 5.57 (5.88); N, 9.92 (9.64). Bn-Vibriobactin A (2-25). Mono-amide 2-22 (0.789 g, 1.23 mmol), carboxylic acid 2-16 (1.29 g, 2.95 mmol), DIEA(diisopropylethyl amine) (1.67 mL, 9.59 mmol) were stirred in 40 mL of CH2Cl2 under N2(g) and cooled to 0 °C. HATU (1.21 g, 3.19 mmol) was added, and the solution was allowed to warm to room temperature. After stirring for 2 days, 40 mL of CH2Cl2 was added, and the solution was washed twice with 5% (w/v) citric acid in brine (80 mL) and once with H2O (80 mL). The organic phase was dried, filtered, and evaporated. The resulting mixture was applied to a column (2 in. diameter) layered with alumina (1.5 in.) on top of silica (5 in.) packed with CH2Cl2. The protected siderophore was eluted with a gradient of 0-3% (v/v) methanol in CH2Cl2 (0.423 g, 26.8 % yield): 1H NMR (AV-500, (CD3)2SO, 373K) δ 8.40-8.35 (m, 1H), 8.28-8.25 (m, 1H), 8.05-7.80 (br, 1H), 7.71-7.50 (br, 1H) 7.50-7.06 (m, 38H), 5.19-5.03 (m, 12H), 4.93 (m, 1H), 4.63-4.57 (m, 2H), 4.44 (m, 1H), 4.10 (m, 1H), 3.95 (m, 1H), 3.60-3.05 (m, 8H), 1.95-1.50 (m, 4H), 1.09 (d, J = 6.0 Hz, 6H); 13C NMR (AV-500, (CD3)2SO, 373K) δ 169.827, 164.535, 164.123, 151.284, 151.202, 145.737, 145.374, 136.605, 136.420, 136.243,
36

136.082, 128.489, 128.114, 128.039, 127.784, 127.595, 127.555, 127.314, 127.269, 127.241, 127.219, 127.059, 123.368, 123.322, 121.614, 121.455, 120.930, 116.905, 116.725, 116.251, 74.770, 70.454, 70.428, 66.863, 66.150, 36.418, 36.044, 19.349, 19.159; ESI-MS m/z calcd for C77H78N5O13 (M-H) 1280.5596, found 1280.5629. Vibriobactin A (2-4). See general deprotection procedure above: 1H NMR (AV-300 CH3OD) δ 7.45-7.18 (m, 3H), 7.05-6.85 (m, 3H), 6.80-6.65 (m, 3H), 5.09 (d, J = 5.1 Hz, 0.7H), 5.00 (d, J = 4.2 Hz, 0.3H), 4.48 (dd, J1 = 8.4 Hz, J2 = 3.3 Hz, 1H), 4.42-4.28 (m, 1H), 3.88-3.15 (m, 12H), 2.18-1.65 (m, 4H), 1.34-1.08 (m, 6H); 13C NMR (AV-300 CH3OD) δ 173.47, 172.92, 172.76, 171.98, 171. 63, 170.81, 170.41, 150.47, 149.22, 147.46, 147.30, 120.40, 120.24, 120.13, 119.76, 118.87, 118.74, 117.96, 117.53, 116.81, 69.24, 69.02, 68.43, 61.01, 60.88, 56.08, 55.90, 46.67, 44.62, 38.10, 37.90, 29.90, 29.43, 28.45, 28.19, 20.82, 20.69, 20.35, 20.27; ESI-MS m/z calcd for C35H42N5O13 (M-H) 740.2779, found 740.2765; Anal. Calcd (Found) for C35H43N5O13 • 2H2O • ¼(CH3CH2)2O: C, 54.30 (54.24); H, 6.27 (6.10); N, 8.79 (8.79). Bn-Vibriobactin G (2-26). Mono-amide 2-22 (0.789 g, 1.23 mmol), carboxylic acid 2-18 (1.15 g, 2.95 mmol), DIEA (1.67 mL, 9.59 mmol) were stirred in 40 mL of CH2Cl2 under N2(g) and cooled to 0 °C. HATU (1.21 g, 3.19 mmol) was added, and the solution was allowed to warm to room temperature. After stirring for 2 days, 40 mL of CH2Cl2 was added, and the solution was washed twice with 5% citric acid in brine (80 mL) and once with H2O (80 mL). The organic phase was dried, filtered, and evaporated. The resulting mixture was applied to a column (2 in. O.D.) layered with alumina (1.5 in.) on top of silica (5 in.) packed with CH2Cl2. The protected siderophore was eluted with a gradient of 0-3% methanol in CH2Cl2. After evaporating the solvent, the 1H NMR spectrum showed that a trace impurity of DIEA remained. The solid was dissolved in CH2Cl2 and washed twice with 5% citric acid in brine followed by a wash with water. The organic phase was dried, filtered, and evaporated to give the title compound (0.653 g, 44.4 % yield): 1H NMR δ (CDCl3) (spectrum is attached) 8.67-8.53 (m, 1.5 H), 8.33 (t, J = 5.7 Hz, 0.5 H), 8.01 (q, J = 5.6 Hz, 1H), 7.75-6.90 (m, 39H), 5.14-5.01 (m, 12H), 3.98-3.33 (m, 4H), 3.29-2.99 (m, 8H), 1.59-1.54 (m, 4H); 13C NMR δ (spectrum is attached) 169.98, 169.14, 168.52, 167.92, 166.83, 166.05, 165.70, 165.65, 165.38, 152.06, 151.98, 151.92, 151.833, 147.19, 147.10, 147.04, 146.81, 136.70, 136.61, 136.56, 136.50, 136.45, 136.39, 129.45, 129.24, 129.02, 128.98, 128.93, 128.89, 128.86, 128.80, 128.75, 128.69, 128.65, 128.49, 128.44, 128.40, 128.36, 128.28, 128.14, 128.04, 127.88, 127.86, 127.82, 127.79, 127.68, 127.57, 127.34, 127.18, 124.61, 124.57, 124.46, 124.34, 124.19, 123.34, 123.21, 123.11, 122.43, 117.65, 117.45, 117.39, 117.00, 76.75, 76.65, 76.52, 76.49, 76.28, 71.50, 71.39, 71.31, 44.79, 44.31, 44.04, 43.84, 43.52, 43.08, 41.61, 41.56, 37.29, 37.19, 36.28, 28.82, 28.59, 27.76, 27.41; ESI-MS m/z calcd for C73H72N5O11 (M+H) 1194.5228, found 1194.5274. Vibriobactin G (2-6).1H NMR δ (methanol-d4) 7.28-7.18 (m, 3H), 6.96-6.87 (m, 3H), 6.75-6.64 (m, 3H), 4.26 (s, 2H), 4.02 (d, J = 9.3 Hz, 2H), 3.53-3.20 (m, 8H), 2.15-1.62 (m, 4H); 13C NMR δ 172.23, 171.86, 171.61, 171.43, 170.87, 170.58, 150.43, 150.29, 150.05, 147.44, 147.37, 120.00, 119.87, 119.47, 119.26, 119.91, 118.75, 116.97, 116.81, 116.68, 46.22, 45.91, 44.83, 44.12, 44.00, 42.26, 38.14, 37.83, 29.62, 29.44, 28.54, 28.46 ; ESI-MS m/z calcd for C31H36N5O11 (M+H) 654.2411, found 654.2409; Anal. Calcd (Found) for C31H35N5O11 • 5/3H2O • 1/3(CH3CH2)2O: C, 54.82 (54.89); H, 5.93 (5.76); N, 9.89 (9.80).
37

Fluorescence quenching titrations. The fluorescence measurements were performed as previously reported with small modifications.5 The excitation slits on the Cary Eclipse fluorescence spectrophotometer were 20 nm and the emission slits were 5 nm. The ligand solutions (10 μM siderophore, TBS with 5% (v/v) DMSO, pH 7.4) were prepared from 4 mM stock solutions in DMSO. Absorbance measurements of the ligand solutions were performed after every titration to confirm the ligand concentration. The protein solution was prepared as previously reported. Small amounts of ligand solution were added to the protein solution, mixed, and allowed to equilibrate for at least 4 min before measuring the fluorescence. The data was fit to a one-to-one binding model with two parameters, Kd and fluorescence response, using the program DYNAFIT.22 The Kd values are reported with the calculated standard error in parentheses. For the titrations at pH 8.6, the TBS-buffered protein and ligand solutions were prepared as described above and adjusted to pH 8.6. Spectrophotometric Titration Procedures. All solutions were made with Milli-Q water that is degassed by boiling for one hour while bubbling Ar(g) in the water. Volumes of fluid were dispensed with glass volumetric pipets (100 mL, 50 mL, 25 mL) or adjustable volume pipets with disposable tips (< 1 mL) (Eppendorf). All titrations were controlled by the LabVIEW computer programs handsome.vi (for manual titrations) or punish.vi (for automatic titrations). Absorbance values from 190-820 nm were measured with an HP 8452A Diode Array Spectrophotometer. A Brinkmann 665 Dosimat controls the addition of titrant. The temperature were maintained at 25 °C with a water bath pumping water through the jacketed spectrophotometric cell. The cell pathlength is 6.6 cm. The titration solutions were stirred with a magnetic stirrer. Solutions of HCl and KOH in 5% (v/v) DMSO were made separately using the appropriate vial of analytical concentrate (J. T. Baker) and DMSO (50 mL) mixed in a volumetric flask (1L) with water. The HCl titrant were standardized with potassium hydrogen phthalate using phenolphthalein as the endpoint indicator. The KOH titrant was standardized with tris(hydroxymethyl)aminomethane using bromocresol green as the endpoint indicator. The semi-micro glass electrode (OI Analytical) was calibrated in the spectrophotometric cell with electrolyte (100 mL, 0.1 M KCl, 5% (v/v) DMSO). An aliquot of standardized HCl (2 mL) was added to the electrolyte followed by a titration with standardized KOH. The data were analyzed in a Gran plot by the computer program GLEE to give the E° and slope values needed to calibrate the electrode. A blank spectrum was recorded before adding vibriobactin to the solution. Vibriobactin was stored at -20 °C as a 50 mM stock solution in DMSO that was thawed before each titration. To prepare the titration cell electrolyte (100 mL, 0.1 M KCl, 5% (v/v) DMSO) was buffered with HEPES, MES, and CHES (10-15 mg of each). A small amount of base was added to make the starting pH above 10. Vibriobactin or fluvibactin (6-10 μL of 50 mM stock solution) was added to the stirring, temperature controlled solution. Then one equivalent of iron was added from a stock solution (27.1 mM FeCl3 in 1 M HCl), and the solution became faintly red. Standardized HCl was added to the solution in 5 μL steps as the absorbance was measured at every pH change of 0.05. The titration was stopped once the pH was below 7. The absorbance vs. pH data was baseline corrected at 800 nm and analyzed in pHab.24 Calculating the Dissociation Constant for Triscatecholate Fe-Vibriobactin. The data from fluorescence quenching titration of Scn with Fe-vibriobactin were refit using the SOLVER tool found in Microsoft Excel. The fitting model included the equilibrium between Fe-vibriobactin
38
and the protonated complex and a one-to-one binding of Scn to Fe-vibriobactin. The spreadsheet was set up following the example shown by Brown.40 Absorbance Measurements. Solutions of 20 μM Scn, 20 μM Fe-vibriobactin, and 20 μM Scn and Fe-vibriobactin were made (TBS buffered at pH 7.4 with 5% (v/v) DMSO).A solution of 20 μM Fe-vibriobactin (TBS with 5% (v/v) DMSO at pH 7) was made and the absorbance was measured at room temperature. Based on the measured Kd, more than 97% of the Fe-vibriobactin is bound by Scn in this solution. Structure Determination. Prior to crystallization, purified Scn (C87S mutant) was loaded with a molar excess of Fe-fluvibactin, washed multiple times with buffer and concentrated to 10 mg/mL in a 10 kDa concentrator. Crystals were grown by vapor diffusion over reservoirs of 1.0-1.4 M ammonium sulfate, 200 mM lithium sulfate, 50-100 mM sodium chloride and 100 mM sodium acetate (pH = 4.5) and cryopreserved in mother liquor (reservoir solution plus 15% (v/v) glycerol). Diffraction data were collected at the Advanced Light Source, beamline 5.0.1, and processed with HKL2000 software.41 Initial phase information was determined by molecular replacement using a previous Scn structure as the search model (PDB ID:1L6M) in PHASER and refined using REFMAC, both part of the CCP4i program suite.42–44 All model building was performed with COOT.45 Accession Code. Coordinates and structure factors have been deposited in the Protein Data Bank under accession code 4K19. Permission. Adapted with permission from Allred, B. E.; Correnti, C.; Clifton, M. C.; Strong, R. K.; Raymond, K. N. ACS Chem. Biol. 2013, 8, 1882–1887. Copyright 2013 American Chemical Society. References (1) Ratledge, C. Food Nutr. Bull. 2007, 28, S515–523. (2) Flo, T. H.; Smith, K. D.; Sato, S.; Rodriguez, D. J.; Holmes, M. A.; Strong, R. K.; Akira,
S.; Aderem, A. Nature 2004, 432, 917–921. (3) Goetz, D. H.; Holmes, M. A.; Borregaard, N.; Bluhm, M. E.; Raymond, K. N.; Strong, R.
K. Mol. Cell 2002, 10, 1033–1043. (4) Holmes, M. A.; Paulsene, W.; Jide, X.; Ratledge, C.; Strong, R. K. Structure 2005, 13,
29–41. (5) Hoette, T. M.; Abergel, R. J.; Xu, J.; Strong, R. K.; Raymond, K. N. J. Am. Chem. Soc.
2008, 130, 17584–17592. (6) Abergel, R. J.; Wilson, M. K.; Arceneaux, J. E. L.; Hoette, T. M.; Strong, R. K.; Byers, B.
R.; Raymond, K. N. Proc. Natl. Acad. Sci. U.S.A. 2006, 103, 18499–18503. (7) Fischbach, M. A.; Lin, H.; Zhou, L.; Yu, Y.; Abergel, R. J.; Liu, D. R.; Raymond, K. N.;
Wanner, B. L.; Strong, R. K.; Walsh, C. T.; Aderem, A.; Smith, K. D. Proc. Natl. Acad. Sci. U.S.A. 2006, 103, 16502 –16507.
(8) Hoette, T. M.; Clifton, M. C.; Zawadzka, A. M.; Holmes, M. A.; Strong, R. K.; Raymond, K. N. ACS Chem. Biol. 2011, 6, 1327–1331.
(9) Loomis, L. D.; Raymond, K. N. Inorg. Chem. 1991, 30, 906–911.
39

(10) Rodgers, S. J.; Raymond, K. N. J. Med. Chem. 1983, 26, 439–442. (11) Yamamoto, S.; Okujo, N.; Fujita, Y.; Saito, M.; Yoshida, T.; Shinoda, S. J. Biochem.
(Tokyo, Jpn.) 1993, 113, 538–544. (12) Griffiths, G. L.; Sigel, S. P.; Payne, S. M.; Neilands, J. B. J. Biol. Chem. 1984, 259, 383 –
385. (13) Cass, M. E.; Garrett, T. M.; Raymond, K. N. J. Am. Chem. Soc. 1989, 111, 1677–1682. (14) Abergel, R. J.; Clifton, M. C.; Pizarro, J. C.; Warner, J. A.; Shuh, D. K.; Strong, R. K.;
Raymond, K. N. J. Am. Chem. Soc. 2008, 130, 11524–11534. (15) Li, N.; Zhang, C.; Li, B.; Liu, X.; Huang, Y.; Xu, S.; Gu, L. J. Biol. Chem. 2012, 287,
8912–8919. (16) Keating, T. A.; Marshall, C. G.; Walsh, C. T. Biochemistry 2000, 39, 15522–15530. (17) Ong, S. A.; Peterson, T.; Neilands, J. B. J. Biol. Chem. 1979, 254, 1860 –1865. (18) Sakakura, A.; Umemura, S.; Ishihara, K. Chem. Commun. 2008, 3561–3563. (19) Bergeron, R. J.; McManis, J. S.; Dionis, J.; Garlich, J. R. J. Org. Chem. 1985, 50, 2780–
2782. (20) Krapcho, A. P.; Kuell, C. S. Synth. Commun. 1990, 20, 2559. (21) Bergeron, R. J.; Garlich, J. R.; McManis, J. S. Tetrahedron 1985, 41, 507–510. (22) Kuzmic, P. Anal. Biochem. 1996, 237, 260–273. (23) Raymond, K. N.; Isied, S. S.; Brown, L. D.; Fronczek, F. R.; Nibert, J. H. J. Am. Chem.
Soc. 1976, 98, 1767–1774. (24) Gans, P.; Sabatini, A.; Vacca, A. Ann. Chim. 1999, 89, 45–49. (25) Harris, W. R.; Carrano, C. J.; Cooper, S. R.; Sofen, S. R.; Avdeef, A. E.; McArdle, J. V.;
Raymond, K. N. J. Am. Chem. Soc. 1979, 101, 6097–6104. (26) Alderighi, L.; Gans, P.; Ienco, A.; Peters, D.; Sabatini, A.; Vacca, A. Coord. Chem. Rev.
1999, 184, 311–318. (27) Flach, C.-F.; Qadri, F.; Bhuiyan, T. R.; Alam, N. H.; Jennische, E.; Lönnroth, I.;
Holmgren, J. Infect. Immun. 2007, 75, 2343–2350. (28) Igbinosa, E. O.; Okoh, A. I. Int. J. Environ. Res. Public Health 2010, 7, 3628–3643. (29) Henderson, D. P.; Payne, S. M. Infect. Immun. 1994, 62, 5120–5125. (30) Ahn, S.-H.; Han, J.-H.; Lee, J.-H.; Park, K.-J.; Kong, I.-S. Infect. Immun. 2005, 73, 722–
729. (31) Goldberg, M. B.; Boyko, S. A.; Butterton, J. R.; Stoebner, J. A.; Payne, S. M.;
Calderwood, S. B. Mol. Microbiol. 1992, 6, 2407–2418. (32) Kim, C.-M.; Park, R.-Y.; Park, J.-H.; Sun, H.-Y.; Bai, Y.-H.; Ryu, P.-Y.; Kim, S.-Y.;
Rhee, J.-H.; Shin, S.-H. Biol. Pharm. Bull. 2006, 29, 911–918. (33) Okujo, N.; Saito, M.; Yamamoto, S.; Yoshida, T.; Miyoshi, S.; Shinoda, S. BioMetals
1994, 7, 109–116. (34) Miyasaka, T.; Nagao, Y.; Fujita, E.; Sakurai, H.; Ishizu, K. J. Chem. Soc., Perkin Trans. 2
1987, 1543–1549. (35) Schuda, P.; Botti, C.; Venuti, M. Org. Prep. Proced. Int. 1984, 16, 119–125. (36) Samuel, A. P. S.; Moore, E. G.; Melchior, M.; Xu, J.; Raymond, K. N. Inorg. Chem. 2008,
47, 7535–7544. (37) Bergeron, R. J.; Xin, M. G.; Weimar, W. R.; Smith, R. E.; Wiegand, J. J. Med. Chem.
2001, 44, 2469–2478.
40
(38) Peterson, T.; Falk, K. E.; Leong, S. A.; Klein, M. P.; Neilands, J. B. J. Am. Chem. Soc. 1980, 102, 7715–7718.
(39) Dertz, E. A.; Xu, J.; Raymond, K. N. Inorg. Chem. 2006, 45, 5465–5478. (40) Brown, A. M. Comput. Methods Programs Biomed. 2001, 65, 191–200. (41) Otwinowski, Z.; Minor, W. In Methods in Enzymology; Charles W. Carter, J., Ed.;
Macromolecular Crystallography Part A; Academic Press, 1997; Vol. Volume 276, pp. 307–326.
(42) McCoy, A. J.; Grosse-Kunstleve, R. W.; Adams, P. D.; Winn, M. D.; Storoni, L. C.; Read, R. J. J. Appl. Crystallogr. 2007, 40, 658–674.
(43) Murshudov, G. N.; Vagin, A. A.; Dodson, E. J. Acta Crystallogr., Sect. D: Biol. Crystallogr. 1997, 53, 240–255.
(44) Potterton, E.; Briggs, P.; Turkenburg, M.; Dodson, E. Acta Crystallogr., Sect. D: Biol. Crystallogr. 2003, 59, 1131–1137.
(45) Emsley, P.; Cowtan, K. Acta Crystallogr., Sect. D: Biol. Crystallogr. 2004, 60, 2126–2132.
41

Chapter 3
Galline Ex-FABP is a Siderocalin that Binds Mono-Glucosylated Enterobactin
Ex-FABP is a Siderocalin As discussed in Chapter 2, siderocalin (Scn) is an immunoprotein that defends against
bacterial infection by sequestering bacterial siderophores.1 The discovery that Scn binds siderophores was the first observation that the immune system targets and blocks siderophore mediated iron acquisition. The characterization of Scn was performed with the human and murine protein and gene, but it was unknown if a similar system operated in other bacterial hosts.1,2
The Scn defense mechanism depends largely on the structure of the protein and the binding pocket. Scn belongs to a large family of proteins known as lipocalins, which are characterized by the lipocalin fold, an eight stranded, anti-parallel β-barrel. The barrel forms a calyx which serves as the ligand binding pocket, and most lipocalins bind ligands other than siderophores. Even though the lipocalins are structurally similar, low sequence homology makes it difficult to search for siderocalins, defined broadly as siderophore binding lipocalins, in other species using sequence databases.3,4 A search of published protein structures found that the NMR structure of a quail lipocalin, Q83, is similar to Scn.5 Q83 has 88% sequence homology to a 21 kDa galline lipocalin, known as extracellular fatty acid binding protein (Ex-FABP), suggesting that it may be a siderocalin. 3,6–8
Although the putative Ex-FABP structure suggests a siderocalin function, most studies on have focused on functions that are apparently unrelated to immunodefense. Ex-FABP has primarily been observed in differentiating cartilage cells of chicken embryos, and chondrocyte development relies on an unidentified function of Ex-FABP.8,9 The siderocalin function of Ex-FABP corresponds to the other locations of the protein. It is found in skin, brain, heart and muscle tissues as well as the bacteriostatic hen egg, and it is secreted by granulocytes.9,10 Expression increases during inflammation and acute phase response. Pathological cartilage of dyschondroplastic and osteoarthritic chickens has an elevated amount of Ex-FABP,11 while tracheal infection with infectious bronchitis coronavirus increases expression of the protein.12 The inflammatory signals IL6 and LPS, the Gram-negative endotoxin, induce expression of Ex-FABP, supporting the role of the protein in immunodefense as a siderocalin.11,13
Several experiments were conducted to determine the siderocalin activity of Ex-FABP. Scn only binds iron when a cofactor, a catechol siderophore, is present. Likewise, Ex-FABP in cultured chondrocytes bound iron when enterobactin was added, but little iron was bound in the absence of supplemented enterobactin. Additionally, recombinant Ex-FABP coeluted with Fe-enterobactin when isolated from enterobactin producing strains of Escherichia coli. Finally, Ex-FABP demonstrated antibacterial activity by inhibiting the growth of E. coli and Bacillus subtilis in vitro. Bacterial growth was rescued by the addition of iron or by mutating Ex-FABP to diminish siderophore binding ability. The antibacterial effect of Ex-FABP was comparable to Scn.14
The binding specificity of Ex-FABP was characterized using fluorescence quenching binding assays. Similar to Scn, Ex-FABP binds with high affinity to apo and ferric forms of catechol siderophores. The protein did not recognize hydroxamate or citrate based siderophores.
42

Surprisingly, Ex-FABP recognized mono-glucosylated enterobactin (MGE), a siderophore related to a family of stealth siderophores known as salmochelins (Fig. 3-1).14
Figure 3-1. Chemical structures of glucosylated enterobactin derivatives. Salmochelins Salmochelins are a family of siderophores first observed by Winkelmann and coworkers in Salmonella enterica serotype Typhimurium and uropathogenic strains of E. coli.15 Structural characterization revealed that the salmochelins are glucosylated derivatives of enterobactin and enterobactin hydrolysis products. The initial structures proposed were hydrolysis products of enterobactin linked through the serine residues by glucose.15 Later, the structures were revised to show that all of the salmochelins exhibit β-C-glucosylation at the 5-position of the 2,3-dyhydroxybenzoyl residue. Salmochelin S4 is diglucosylated enterobactin (DGE) (Fig. 3-1).16 Production and uptake of the salmochelins was attributed to the iroA locus, and IroN is the salmochelin receptor and transporter.15 IroB is the sole enzyme required for glucosylating enterobactin.16 IroC is the salmochelin exporter and is required for Salmonella virulence.17 IroD and IroE are salmochelin hydrolases. IroD is more active with Fe-salmochelin and IroE is specific for apo-salmochelin hydrolysis.18
The iro locus is a virulence factor for pathogenic strains of Salmonella spp, E. coli, and Klebsiella pneumoniae. By making and utilizing the salmochelins these pathogens avoid the Scn defense mechanism. Scn does not bind salmochelins, and it does not inhibit the growth of bacteria that use salmochelins. iroA increases the virulence of bacteria in vivo by avoiding Scn defense.19
The thorough characterization of the salmochelins established them as stealth siderophores in humans and mice. However, Ex-FABP recognizes MGE which is structurally related to the salmochelins suggesting that the siderocalins of different species may exhibit adaptations and variations in siderophore recognition. Synthesis of MGE and DGE Initial titrations had shown that Ex-FABP binds MGE which is a siderophore that is not bound by Scn. More MGE was needed to characterize how Ex-FABP recognized this siderophore. Fischbach and Walsh et al. had characterized the glucosylating enzyme IroB in vitro.20 Our laboratory had been give samples of IroB from the Walsh laboratory. It was stored at
O
O
O
HN
O
O
ONHO
O
HN
O
OHOH
O
OH
OHHOHO
O
O
O
HN
O
O
ONHO
O
HN
O
OHOH
HO
HO
O
OH
OHHOHO
HOOH
HOOH
OH
OHO
OH
OHHOHO
Salmochelin S4Diglucosyl-Enterobactin (DGE)
Monoglucosyl-Enterobactin (MGE)
43

-80 °C for an unknown amount of time, and the condition of the enzyme was unknown. Using degraded protein for the enzymatic reaction would waste valuable enterobactin. To avoid unnecessary waste, several test reactions were performed and analyzed by analytical scale HPLC. I was able to identify the expected products and byproducts of the reaction in the chromatograms shown in Fig. 3-2. The activated sugar UDP-glucose and UDP elute first (0.6-0.7 min), closely followed by IroB (0.8-1.0 min). Enterobactin eluted near 10 min, MGE eluted near 8 min, and DGE eluted near 7 min. IroB glucosylates enterobactin sequentially, producing MGE in 10 min followed by diglucosyl-enterobactin (DGE) in 30 min. The test reactions were scaled up and MGE and DGE were isolated using super-preparative HPLC.
Figure 3-2. Analytical chromatogram of MGE reaction after 3 min, 10 min, and 30 min reaction time respectively. UDP-glucose, UDP, and IroB elute in the first peak. Enterobactin elutes at 10
44
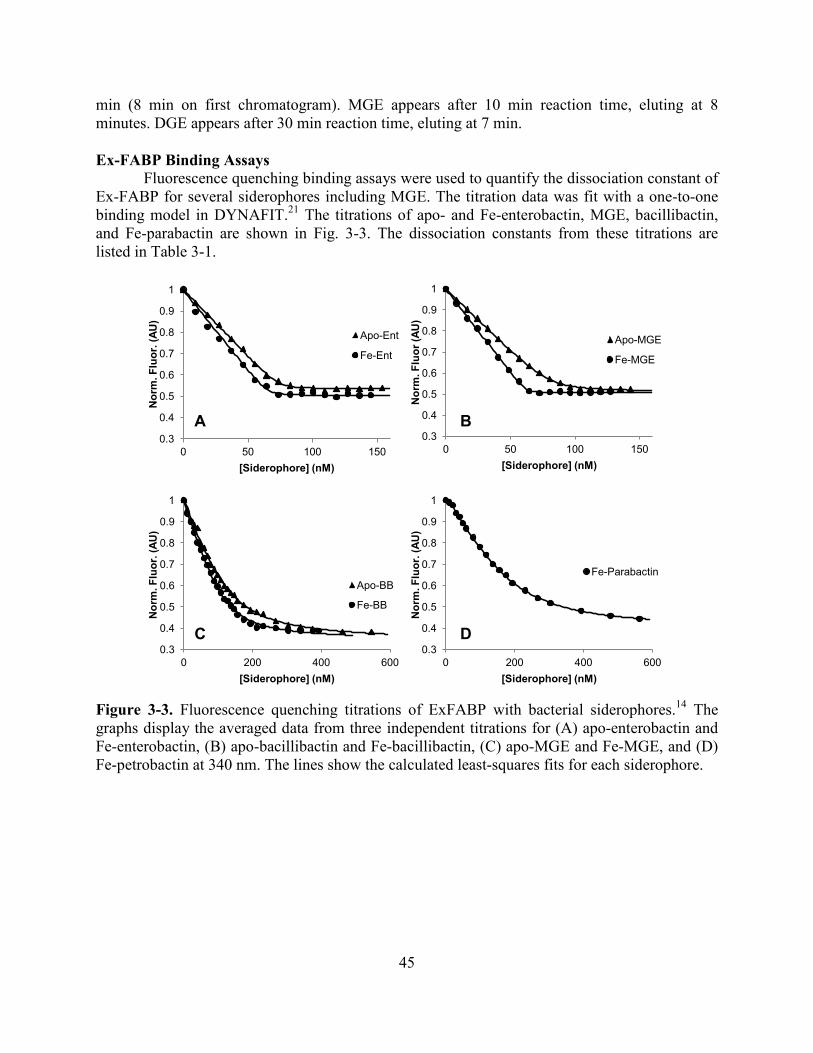
min (8 min on first chromatogram). MGE appears after 10 min reaction time, eluting at 8 minutes. DGE appears after 30 min reaction time, eluting at 7 min. Ex-FABP Binding Assays
Fluorescence quenching binding assays were used to quantify the dissociation constant of Ex-FABP for several siderophores including MGE. The titration data was fit with a one-to-one binding model in DYNAFIT.21 The titrations of apo- and Fe-enterobactin, MGE, bacillibactin, and Fe-parabactin are shown in Fig. 3-3. The dissociation constants from these titrations are listed in Table 3-1.
Figure 3-3. Fluorescence quenching titrations of ExFABP with bacterial siderophores.14 The graphs display the averaged data from three independent titrations for (A) apo-enterobactin and Fe-enterobactin, (B) apo-bacillibactin and Fe-bacillibactin, (C) apo-MGE and Fe-MGE, and (D) Fe-petrobactin at 340 nm. The lines show the calculated least-squares fits for each siderophore.
0.3
0.4
0.5
0.6
0.7
0.8
0.9
1
0 50 100 150
Nor
m. F
luor
. (AU
)
[Siderophore] (nM)
Apo-Ent
Fe-Ent
0.3
0.4
0.5
0.6
0.7
0.8
0.9
1
0 50 100 150
Nor
m. F
luor
(AU
)
[Siderophore] (nM)
Apo-MGE
Fe-MGE
0.3
0.4
0.5
0.6
0.7
0.8
0.9
1
0 200 400 600
Nor
m. F
luor
. (AU
)
[Siderophore] (nM)
Apo-BB
Fe-BB
0.3
0.4
0.5
0.6
0.7
0.8
0.9
1
0 200 400 600
Nor
m. F
luor
. (AU
)
[Siderophore] (nM)
Fe-Parabactin
B A
D C
45

Table 3-1. Dissociation constants of ExFABP for Fe- and apo-siderophores.14
Siderophore Kd (nM)
Apo-Enterobactin 1.2(1) Fe-Enterobactin 0.40(17) Apo-MGE 1.3(2) Fe-MGE 0.14(4) Apo-Bacillibactin 30(2) Fe-Bacillibactin 14(2) Fe-Parabactin 42(8)
Ex-FABP has similar affinity as Scn for apo- and Fe-catechol siderophores, including enterobactin, bacillibactin, and parabactin. The binding of the salmochelin DGE and several non-catechol siderophores was also tested. Like Scn, Ex-FABP does not recognize DGE or the non-catechol siderophores, including pyochelin, pyoverdine, rhizoferrin, desferrioxamine B, alcaligin, petrobactin, aerobactin, exochelin, and coprogen. However, Ex-FABP binds MGE with a subnanomolar dissociation constant while Scn does not bind the glucosylated siderophore.14 Even though Ex-FABP in many ways resembles Scn, the Ex-FABP binding pocket must have some significant differences to accommodate the glucose moiety of MGE while recognizing the ferric-catecholate metal center. Ex-FABP Structure Ex-FABP was crystallized by Dr. Colin Correnti while a student in Prof. Roland Strong’s laboratory. The eight-stranded β-barrel is typical of lipocalins except for an extra α-helix near the rim of the calyx. In contrast to most lipocalins, the calyx is positively charged, and this feature may be the defining feature of the siderocalin subset of the lipocalin family.14
The calyx interacts with siderophores in a manner similar to Scn. Three basic residues, Lys82, Arg101, and Arg112, give the calyx the positive charge and define three subpockets within the calyx. Each subpocket holds a catechol subunit of a bound siderophore. Arg101 and Arg112 provide electrostatic interactions with catechol and Lys82 hydrogen bonds with the meta hydroxyl of the catechols in two of the pockets.14
46

Figure 3-4. Structure of Ex-FABP bound to Fe-enterobactin.14 (A) Molecular surface representation of the Ex-FABP crystal structure is shown, colored by electrostatic potential, with the single, well-defined FeDHBA moiety and associated iron atom rendered in licorice stick representation, colored by atom type. Individual catechol binding pockets in the Ex-FABP calyx are indicated with arrows, numbered as in the Scn structure.1 (B) A difference Fourier synthesis (with 3Fobs-2Fcalc coefficients), calculated with refine-omit phases and contoured at 1.5 σ around the bound FeEnt breakdown products, is shown in a stereo-pair representation superimposed on an intact FeEnt molecule (carbons colored yellow) and the single, well-ordered DHBA moiety (carbons colored blue) in the calyx of molecule B.
Ex-FABP was crystallized with Fe-enterobactin, but the siderophore is hydrolyzed and
disordered. One Fe-catechol could be confidently modeled in one of the subpockets. From this structure, it was possible to model the rest of the Fe-enterobactin in the calyx, and a glucose moiety was added to the bound siderophore to model Ex-FABP recognition of MGE. The Ex-FABP calyx accommodates MGE in an extended subpocket. The analogous subpocket in Scn is constrained by side chains of Tyr100 and Arg81 and would clash with MGE. In Ex-FABP, the equivalent of Arg81 is substituted with a threonine and the equivalent of Tyr100 is on a different sized loop. These changes expand the subpocket of Ex-FABP so that it recognizes MGE (Fig. 3-5).14
A B
47
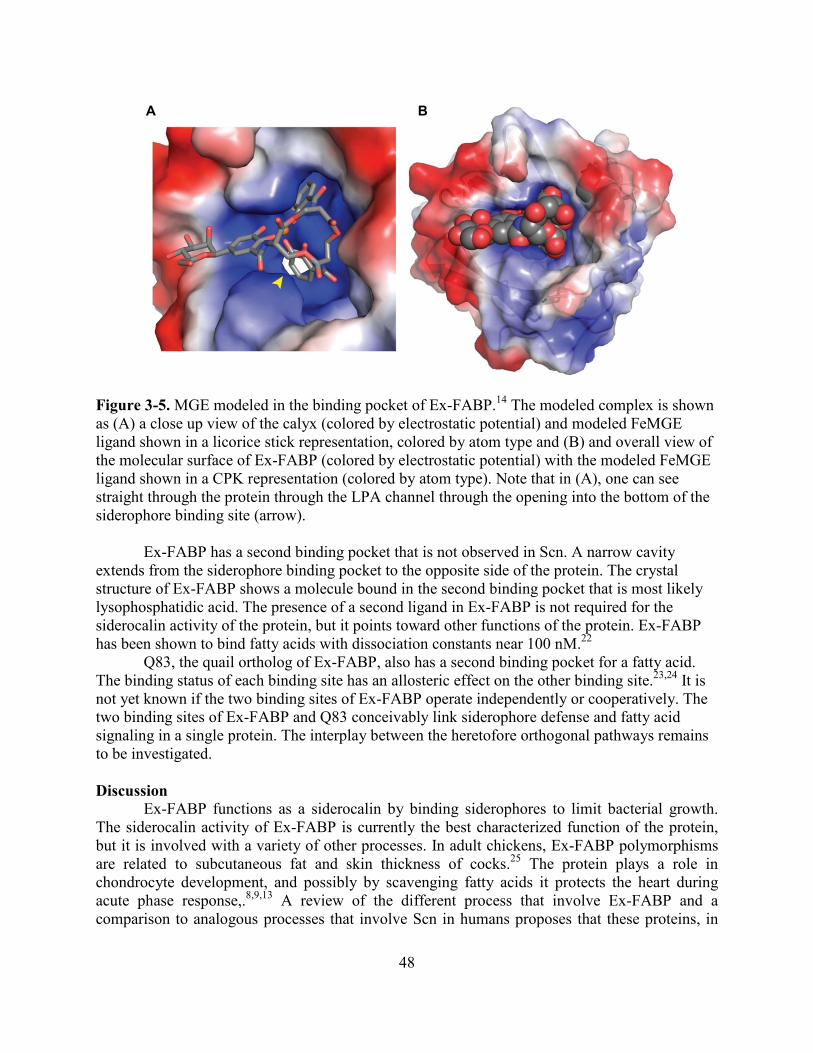
Figure 3-5. MGE modeled in the binding pocket of Ex-FABP.14 The modeled complex is shown as (A) a close up view of the calyx (colored by electrostatic potential) and modeled FeMGE ligand shown in a licorice stick representation, colored by atom type and (B) and overall view of the molecular surface of Ex-FABP (colored by electrostatic potential) with the modeled FeMGE ligand shown in a CPK representation (colored by atom type). Note that in (A), one can see straight through the protein through the LPA channel through the opening into the bottom of the siderophore binding site (arrow).
Ex-FABP has a second binding pocket that is not observed in Scn. A narrow cavity
extends from the siderophore binding pocket to the opposite side of the protein. The crystal structure of Ex-FABP shows a molecule bound in the second binding pocket that is most likely lysophosphatidic acid. The presence of a second ligand in Ex-FABP is not required for the siderocalin activity of the protein, but it points toward other functions of the protein. Ex-FABP has been shown to bind fatty acids with dissociation constants near 100 nM.22
Q83, the quail ortholog of Ex-FABP, also has a second binding pocket for a fatty acid. The binding status of each binding site has an allosteric effect on the other binding site.23,24 It is not yet known if the two binding sites of Ex-FABP operate independently or cooperatively. The two binding sites of Ex-FABP and Q83 conceivably link siderophore defense and fatty acid signaling in a single protein. The interplay between the heretofore orthogonal pathways remains to be investigated.
Discussion
Ex-FABP functions as a siderocalin by binding siderophores to limit bacterial growth. The siderocalin activity of Ex-FABP is currently the best characterized function of the protein, but it is involved with a variety of other processes. In adult chickens, Ex-FABP polymorphisms are related to subcutaneous fat and skin thickness of cocks.25 The protein plays a role in chondrocyte development, and possibly by scavenging fatty acids it protects the heart during acute phase response,.8,9,13 A review of the different process that involve Ex-FABP and a comparison to analogous processes that involve Scn in humans proposes that these proteins, in
A B
48

addition to being siderocalins, are stress proteins involved in active remodeling or acute phase response.26 It is not known if the function of Ex-FABP in these processes depends on the ability to bind iron, fatty acids, or both, or if it operates through another mechanism.
The difference of binding MGE between Scn and Ex-FABP suggests a dynamic evolutionary relationship between host and pathogen in which chickens have developed a siderocalin defense specific to the pathogens they encounter.27 MGE and DGE are produced and transported by products of the iroA gene locus found in S. enterica and extra-intestinal pathogenic E. coli, including avian pathogenic E. coli (APEC).16,28,29 The iroA locus is a virulence factor in APEC that is significantly associated with pathogenicity and lethality; the enterobactin system alone is insufficient for virulence presumably because the enterobactin is intercepted by Ex-FABP.29,30 MGE has not been observed in salmochelin extracts, and the pathogens may not secrete this siderophore because it is bound by Ex-FABP and likely would not support virulence.14 Unsurprisingly, DGE is secreted because it can circumvent the Ex-FABP defense.28,29 Salmochelin production may be more important than aerobactin production, another virulence factor of pathogenic E. coli.30 In addition to avian E. coli, pathogenic S. enterica Kentucky strain isolated from chicken has the iroA virulence factor.31 The high incidence of the salmochelin producing and utilizing genes in chicken pathogens may have provided the selective pressure that gave rise to a siderocalin that binds a salmochelin precursor. In turn, the fact that MGE is not secreted by pathogens may be a response to the presence of Ex-FABP.
Identifying a siderocalin in chickens is evidence that siderophore-targeted defense is a widespread strategy used by hosts to limit infections. The siderophore-siderocalin competition between host and pathogen has currently been observed in humans (Scn and human tear lipocalin), mice, quail (Q83), and chickens (Ex-FABP).7,27 The lack of sequence homology poses a challenge to identify siderocalins in more species without structural or biochemical characterization. The distinguishing feature of the siderocalin subset of lipocalins is a broad calyx containing three positive residues. As structure databases grow and structure prediction tools improve it is expected that many more siderocalins will be identified. Methods General Procedures. Starting materials and reagents were used as provided from commercial sources. The Mass Spectrometry Facility at University of California, Berkeley, recorded the FABLR-MS and ESI-MS. The 1H and 13C spectra were measured using the noted Bruker spectrometers at room temperature unless otherwise indicated. The solvent for each spectrum is noted, and the spectra were calibrated the appropriate solvent peak. Fluorescence quenching binding assay. Fluorescence quenching of recombinant ExFABP or Scn was measured on a Cary Eclipse fluorescence spectrophotometer. A 20 nm slit band pass for excitation and a 5 nm slit band pass for emission was used with a high voltage detector. An excitation wavelength of λexc = 281 nm was used and emission was collected at λem = 315-365 nm at a scanning rate of 120 nm/min. Measurements were made in cuvettes with 3 mL of 100 nM protein, 32 μg/mL ubiquitin (Boston Biochem or Sigma Aldrich) and 5% DMSO in a TBS solution buffered at pH 7.4. Fluorescence values were corrected for dilution upon addition of substrate. The corrected values were then normalized. Fluorescence data at 340, 342, 344, 346, 348, and 350 nm for three independent titrations were analyzed by nonlinear regression analysis
49

of fluorescence response versus substrate concentration using a one-site binding model in the program DYNAFIT.21 The dissociation constants at each wavelength were averaged to give the reported dissociation constant. Characterization of IroB. The reaction solution was made according to the procedure of Fischbach et al.20 To do this, the following stock solutions were made: 1 M Tris-HCl (pH = 7.5), 1 M MgCl2 in water, 100 mM TCEP-HCl in water, 50 mM UDP-Glc in water, an 4 mM enterobactin in DMSO. The concentration of enterobactin in DMSO should not be increased to reduce the amount of DMSO in the reaction solution. If less DMSO is used, then enterobactin will precipitate in the reaction solution. IroB stock solutions were made in 75 mM Tris-HCl (pH = 7.5) and protein concentration was determined with the extinction coefficient at 280 nM (ɛ = 56,000 M-1cm-1). The enzyme stock solution was kept on ice, and the concentration of IroB ranged from 3-6 μM. The stock solutions were used to make a solution of 75 mM Tris-HCl (pH = 7.5), 5 mM MgCl2, 2.5 mM TCEP, 3 mM UDP-Glc, 500 μM Ent, and 1 μM IroB. The solution was incubated at 25 °C for varying amounts of time. In the control experiments either UDP-Glc, Ent, or IroB were omitted while keeping the concentration of the other components the same. The reactions were stopped by adding 0.5 μL TFA. A portion of the reaction solution (25 μL) was analyzed by HPLC using a Luna C18 50 x 4.6 mm column. A gradient of 0-40% CH3CN in 0.1% TFA/water over 8 minutes eluted all the reagents and products of the reaction, which were monitored at 220 nm. DGE eluted around 7 min. MGE eluted around 8 min, and enterobactin eluted around 10 min. Preparation of MGE and DGE. The method of Lin et al. was used to synthesize and isolate MGE and DGE.18 A 50 mL solution containing 75 mM Tris-HCl (pH = 8.0), 5 mM MgCl2, 1.5 mM UDP-Glc, enterobactin 1mM, and 1 μM IroB was made with the stock solutions listed above in the small-scale characterization of IroB. The solution is made on ice, and the enterobactin/DMSO solution is also cooled on ice before addition to the aqueous solution. Otherwise, the heat generated by mixing the DMSO and water would speed up the reaction. The reaction solution was gently agitated at room temperature (< 25 °C) for 2 h. During one experiment the room temperature was high and the DMSO/water solution was warm, converting most of the MGE into DGE. The reaction was quenched with 16 mL of 5-10% HCl in methanol. The solution was filtered with a 41 μm nylon filter. The MGE and DGE were purified by super-prep HPLC by injecting 10 mL of the reaction solution on 250 x 41.4 mm C18 column and eluting with a gradient of 0-40% CH3CN in 0.1% TFA/water over 40 min. DGE eluted around 25 min and MGE eluted around 29 min. The fractions containing MGE were combined and evaporated to dryness with a rotary evaporator using an oil pump. The MGE was dissolved with a small amount of methanol and then precipitated in Et2O. The precipitate was centrifuged and the Et2O was decanted. The remaining white solid was dried using high-vacuum. The same procedure was used to obtain dry, solid DGE. Characterization of MGE: 1H NMR AVQ-400 (CD3OD) δ 7.40 (d, J = 2.0 Hz, 1H),7.25 (q, J = 8.4 Hz, 2H), 7.06 (d, J = 2.0 Hz, 1H), 6.95 (dt, J1 = 8.0 Hz, J2 = 1.6 Hz, 2H), 6.73 (q, J = 8.0 Hz, 2H), 5.04 (m, 3H), 4.72-4.55 (m, 6H), 4.02 (d, J = 9.2 Hz, 1H), 3.87(dd, J1 = 11.8 Hz, J2 = 2.4 Hz, 1H), 3.71 (dd, J1 = 11.8 Hz, J2 = 5.6 Hz, 1H), 3.46-3.30 (m, 4H); ESI-MS m/z calcd for C36H38N3O20 (M + H) 832.2043, found 832. 2040.
50

Characterization of DGE: 1H NMR AV-300 (CD3OD) δ 7.391 (t, J = 1.8 Hz, 2H), 7.264 (dd, J1 = 8.1 Hz, J2 = 1.2 Hz, 1H), 7.058 (d, J = 1.8 Hz, 2H), 6.953 (dd, J1 = 7.8 Hz, J2 = 1.5 Hz, 1H), 6.738 (t, J = 8.0 Hz, 1H), 5.10-5.00 (m, 3H), 4.75-4.63 (m, 3H), 4.63-4.51 (m, 3H), 4.024 (dd, J1 = 9.2 Hz, J2 = 2.0 Hz, 2H), 3.866 (d, J = 10.5 Hz, 2H), 3.707 (dd, J1 = 12.2 Hz, J2 = 4.4 Hz, 2H), 3.50-3.27 (m, 8H); ESI m/z calcd for C42H47N3NaO25 (M + Na) 1016.2396, found 1016.2373. Permission. This chapter was adapted with figures from Correnti, C.; Clifton, M. C.; Abergel, R. J.; Allred, B.; Hoette, T. M.; Ruiz, M.; Cancedda, R.; Raymond, K. N.; Descalzi, F.; Strong, R. K. Structure 2011, 19, 1796–1806. Copyright 2011 Elsevier Ltd. References (1) Goetz, D. H.; Holmes, M. A.; Borregaard, N.; Bluhm, M. E.; Raymond, K. N.; Strong, R.
K. Mol. Cell 2002, 10, 1033–1043. (2) Flo, T. H.; Smith, K. D.; Sato, S.; Rodriguez, D. J.; Holmes, M. A.; Strong, R. K.; Akira,
S.; Aderem, A. Nature 2004, 432, 917–921. (3) Åkerstrom, B.; Flower, D. R.; Salier, J.-P. Biochim. Biophys. Acta 2000, 1482, 1–8. (4) Flower, D. R.; North, A. C. t.; Attwood, T. K. Protein Sci. 1993, 2, 753–761. (5) Hartl, M.; Matt, T.; Schüler, W.; Siemeister, G.; Kontaxis, G.; Kloiber, K.; Konrat, R.;
Bister, K. J. Mol. Biol. 2003, 333, 33–46. (6) Ganfornina, M. D.; Gutiérrez, G.; Bastiani, M.; Sánchez, D. Mol. Biol. Evol. 2000, 17,
114–126. (7) Clifton, M. C.; Corrent, C.; Strong, R. K. BioMetals 2009, 22, 557–564. (8) Descalzi Cancedda, F.; Manduca, P.; Tacchetti, C.; Fossa, P.; Quarto, R.; Cancedda, R. J.
Cell Biol. 1988, 107, 2455–2463. (9) Dozin, B.; Descalzi, F.; Briata, L.; Hayashi, M.; Gentili, C.; Hayashi, K.; Quarto, R.;
Cancedda, R. J. Biol. Chem. 1992, 267, 2979–2985. (10) Guérin-Dubiard, C.; Pasco, M.; Mollé, D.; Désert, C.; Croguennec, T.; Nau, F. J. Agric.
Food Chem. 2006, 54, 3901–3910. (11) Cermelli, S.; Zerega, B.; Carlevaro, M.; Gentili, C.; Thorp, B.; Farquharson, C.;
Cancedda, R.; Cancedda, F. D. Eur. J. Cell Biol. 2000, 79, 155–164. (12) Cao, Z.; Han, Z.; Shao, Y.; Geng, H.; Kong, X.; Liu, S. Proteome Sci. 2011, 9, 11. (13) Gentili, C.; Tutolo, G.; Zerega, B.; Di Marco, E.; Cancedda, R.; Cancedda, F. D. J. Cell.
Physiol. 2005, 202, 683–689. (14) Correnti, C.; Clifton, M. C.; Abergel, R. J.; Allred, B.; Hoette, T. M.; Ruiz, M.; Cancedda,
R.; Raymond, K. N.; Descalzi, F.; Strong, R. K. Structure 2011, 19, 1796–1806. (15) Hantke, K.; Nicholson, G.; Rabsch, W.; Winkelmann, G. Proc. Natl. Acad. Sci. U. S. A.
2003, 100, 3677 –3682. (16) Bojan, B.; Bischoff, D.; Nicholson, G. J.; Valdebenito, M.; Schneider, K.; Winkelmann,
G.; Hantke, K.; Sussmuth, R. D. BioMetals 2004, 17, 471–481. (17) Crouch, M.-L. V.; Castor, M.; Karlinsey, J. E.; Kalhorn, T.; Fang, F. C. Mol. Microbiol.
2008, 67, 971–983. (18) Lin, H.; Fischbach, M. A.; Liu, D. R.; Walsh, C. T. J. Am. Chem. Soc. 2005, 127, 11075–
11084.
51

(19) Fischbach, M. A.; Lin, H.; Zhou, L.; Yu, Y.; Abergel, R. J.; Liu, D. R.; Raymond, K. N.; Wanner, B. L.; Strong, R. K.; Walsh, C. T.; Aderem, A.; Smith, K. D. Proc. Natl. Acad. Sci. U.S.A. 2006, 103, 16502 –16507.
(20) Fischbach, M. A.; Lin, H.; Liu, D. R.; Walsh, C. T. Proc. Natl. Acad. Sci. U.S.A. 2005, 102, 571 –576.
(21) Kuzmic, P. Anal. Biochem. 1996, 237, 260–273. (22) Cancedda, F. D.; Malpeli, M.; Gentili, C.; Di Marzo, V.; Bet, P.; Carlevaro, M.; Cermelli,
S.; Cancedda, R. J. Biol. Chem. 1996, 271, 20163 –20169. (23) Coudevylle, N.; Hoetzinger, M.; Geist, L.; Kontaxis, G.; Hartl, M.; Bister, K.; Konrat, R.
Biochemistry 2011, 50, 9192–9199. (24) Coudevylle, N.; Geist, L.; Hoetzinger, M.; Tollinger, M.; Konrat, R. J. Biomol. NMR
2011, 51, 83–88. (25) Zhao, Z.; Zhang, L.; Du, B.; Cao, N.; Jiang, X.; Tian, W.; Li, S.; Wu, W.; Ye, C. Mol.
Biol. Rep. 2012, 39, 2677–2682. (26) Descalzi Cancedda, F.; Dozin, B.; Zerega, B.; Cermelli, S.; Cancedda, R. Biochim.
Biophys. Acta 2000, 1482, 127–135. (27) Sia, A. K.; Allred, B. E.; Raymond, K. N. Curr. Opin. Chem. Biol. 2013, 17, 150–157. (28) Caza, M.; Lépine, F.; Dozois, C. M. Mol. Microbiol. 2011, 80, 266–282. (29) Caza, M.; Lépine, F.; Milot, S.; Dozois, C. M. Infect. Immun. 2008, 76, 3539–3549. (30) Gao, Q.; Wang, X.; Xu, H.; Xu, Y.; Ling, J.; Zhang, D.; Gao, S.; Liu, X. BMC Microbiol.
2012, 12, 143. (31) Fricke, W. F.; McDermott, P. F.; Mammel, M. K.; Zhao, S.; Johnson, T. J.; Rasko, D. A.;
Fedorka-Cray, P. J.; Pedroso, A.; Whichard, J. M.; Leclerc, J. E.; White, D. G.; Cebula, T. A.; Ravel, J. Appl. Environ. Microbiol. 2009, 75, 5963–5971.
52

Chapter 4
Vibrio cholerae Does Not Use Intact Ferric Enterobactin
Vibrio cholerae and Iron Uptake Vibrio cholerae is a facultative anaerobic, rod-shaped Gram-negative species of bacteria
that moves using a single polar, sheathed flagellum. Pathogenic serotypes of V. cholerae, including O1 and O139 cause the illness known as cholera. Infection begins when contaminated food or water is ingested. V. cholerae colonizes the epithelium of the small intestine with help of the toxin-coregulated pilus and other factors. Cholera enterotoxin enters epithelial cells and through a G protein activates adenylate cyclase. The resulting increase of cyclic-AMP leads to an increase in chloride secretion and changes the electrolyte concentration in the lumen. The resulting transepithelial osmotic gradient forces a massive efflux of water into the lumen. The intestine cannot reabsorb all of the water and the result is the diarrhea that is characteristic of cholera. Treatment includes rehydration therapy and antibiotics to shorten the duration of the infection.1 Cholera outbreaks continue to arise in areas with limited water and sanitation systems. In 2010 following a devastating earthquake, Haiti experienced a severe cholera outbreak, and Mexico is currently experiencing an outbreak with a strain of V. cholerae 95% similar to the Haitian strain.2,3
Whether V. cholerae is in water or the human small intestine, it must acquire iron to survive and grow. This pathogen has many different iron acquisition systems. The hemolysins Vc-δTH or HlyA provide access to red blood cell iron resources. Specific receptors for heme including HutA, HutR, and HasR, and the related transport systems provide iron from host heme.4,5 Feo facilitates ferrous ion uptake, and Fbp transport ferric ion.6,7 Lastly, V. cholerae acquires iron with siderophores, and it has specific systems for several different siderophores. Ferrichrome is transported by the receptor FhuA and the transport proteins FhuBCD.7,8 Vibriobactin is a catecholate siderophore, and it is the only siderophore synthesized by V. cholerae.9–11 The catecholate siderophore enterobactin is also used by V. cholerae, although it must be synthesized by other bacteria. Vibriobactin and enterobactin are transported with overlapping systems. The receptors are specific for each siderophore with ViuA functioning as the vibriobactin receptor, and IrgA and VctA are enterobactin receptors. The inner membrane transport systems overlap since both VctPDGC and ViuPDGC transport enterobactin and vibriobactin (Fig. 4-1). 12 It is believed that these catecholate siderophore transport systems allow V. cholerae to also use the related siderophores agrobactin and a siderophore from Vibrio fluvialis that is probably fluvibactin.7 VctPDGC is also facilitates iron uptake in the absence of siderophore. While much characterization remains, it appears that all of the iron uptake systems of V. cholerae have now been identified.13
53

Figure 4-1. V. cholerae receptors and transport systems for ferric siderophores. ViuA is the outer membrane receptor specific for ferric vibriobactin, and VctA and IrgA are receptors for ferric enterobactin. The periplasmic binding proteins ViuP and VctP, as well as the respective ABC transporters ViuDGC and VctDGC, transport both ferric vibriobactin and ferric enterobactin through the inner membrane to the cytoplasm. ViuB reduces the ferric siderophore and release ferrous iron to be used in the cell.7,13,12
Siderophore Utilization in V. cholerae
Once the ferric siderophore is in the cytoplasm the siderophore must release the iron so that it can be used. No iron binding molecules in the cell have competitive affinity for the ferric ion compared to a siderophore.14 However, siderophores have much lower affinity for ferrous ion compared to ferric ion, and if the complex is reduced the iron can be transferred to cellular iron pool. Reduction of ferric siderophores is a common method of iron release, and it is often required for iron utilization.15 ViuB is a putative ferric reductase, and it is required for iron utilization from vibriobacint in V. cholerae.16 It has been proposed that ViuB is responsible for the release of all the iron transported by catecholate siderophores via three independent receptors and two different inner membrane permeases.12 If this is the case, then the ferric catecholate siderophore systems depicted in Figure 4-1 make an inverted arch, and ViuB is the keystone.
The proposed role of ViuB was initially identified in an early study that showed viuB is required for vibriobactin utilization in V. cholerae and can suppress fes, a siderophore utilization gene in Escherichia coli.16 The complementation probably does not occur through replacement of function because viuB is not homologous to fes. The protein product of fes is an enterobactin esterase. Fes catalyzes hydrolysis of ferric enterobactin to raise the reduction potential of the complex to biological range so that a reductase can assist in iron release.17–19 V. cholerae does not have a protein homologous to Fes or any other siderophore esterase and apparently relies solely on ViuB for iron release.
Fe-Vibriobactin Fe-Enterobactin
ViuA VctA IrgA
ViuP VctP
ViuDGC VctDGC
ViuB
Fe-VibrobactinFe-Enterobactin
VibriobactinEnterobactin
Fe2+
54

Since the initial characterization of viuB, no studies have focused on the role or mechanism of the protein. Related proteins have been characterized including YqjH, the E. coli homolog of ViuB. 20 YqjH has a FAD cofactor which catalyzes NADPH-dependent reduction of ferric siderophores. It readily reduces ferric citrate, ferric-(DHB-Ser)3, and ferric-(DHB-Gly-Thr)3, the respective hydrolysis products of ferric enterobactin and ferric bacillibactin. The reductase activity cooperates with the esterase activity of Fes to use iron acquired by siderophores.
Miethke et al. also argue that YqjH is capable of reducing ferric enterobactin. The reduction potential of ferric enterobactin at pH 7 is approximately -750 mV,21 and it has long been considered improbable that direct reduction of ferric enterobactin is part of the iron-release mechanism because the reduction potential is outside the range of biological reductants. As will be shown, the evidence presented by Miethke et al. does not adequately support the assertion that YqjH is capable of reducing ferric enterobactin.
In an experiment central to their paper, Miethke et al. reconstituted YqjH with a non-catalytic FAD analog. The reduction potential of the enzyme-siderophore complex was measured by following an EPR signal to give, by extrapolation, a reduction potential of -585 mV. Thus, binding by YqjH increases the reduction potential of ferric enterobactin 165 mV. The energy diagram shown in Figure 4-2 may be constructed with this value in combination with the binding affinity of YqjH for ferric enterobactin and other reported thermodynamic constants.20,21
Figure 4-2. Energy diagram of ferric enterobactin reduction by YqjH. The solid line energy values are calculated from constants reported by Miethke et al. and others.20,21 The equilibrium constant used to calculate the energy value is shown in parentheses. The dashed line energy value is calculated by using the other values. To provide the reported increase in reduction potential of ferric enterobactin, YqjH must stabilize ferrous-enterobactin through binding interactions. The energy diagram shows that this stabilization should be approximately 52.2 kJ/mol relative to free ferrous enterobactin. This energy corresponds to a dissociation constant of 0.5 nM. Such a high binding affinity would cause product inhibition. Additionally, it is unlikely that a protein can provide the needed
72.4(E)
36.2(Kd)
56.4(E)
52.2(Kd)
Fe(II) Enterobactin
Fe(III) Enterobactin
Fe(III) Enterobactin:YqjH
Fe(II) Enterobactin:YqjH
Ener
gy (Δ
G=
kJ/m
ol)
55

interactions to stabilize a highly unstable ferrous-enterobactin complex while providing less interactions (Kd = 0.35 μM) with the unusually stable ferric enterobactin complex.
Another possibility to raise the reduction potential would be that YqjH forms a ternary complex with ferric enterobactin by inserting protein ligands in the ferric coordination sphere and displacing some of the catecholate-iron bonds. The ternary complex would have a higher reduction potential, and if the protein had high affinity for Fe(II), this would also raise the reduction potential. A similar scenario has been characterized in which sulfonated bathophenanthroline, a strong ferrous chelator, forms a ternary complex with a ferric hydroxamate siderophore. The ternary complex and stabilization of the ferrous state facilitate reduction by glutathione and ascorbate.22 However, the ferric hydroxamate siderophore has a more positive reduction potential and a smaller formation constant than ferric enterobactin. It is less likely that a ternary complex can form by YqjH displacing ferric enterobaction interactions to raise the reduction potential. It would be informative to see if YqjH has an Fe(II) binding site to facilitate reduction. Second, the reduction potential of the ferric enterobactin YqjH complex was measured in a dithionite titration using EPR to measure the change in the Fe(III)/Fe(II) ratio. The EPR spectrum of the complex showed two signals, a typical ferric-triscatecholate signal at g = 4.3 and a complex specific signal at g = 6.6. During the course of the titration, the complex specific signal diminished to 70% of the original amplitude, but the typical ferric enterobactin signal remained constant.20 If the ferric ion was being reduced, the signal at g = 4.3 should have diminished as well.
Lastly, Miethke et al. measured the rate of ferric enterobactin reduction by YqjH in vitro and in vivo. The in vitro measurements reveal that ferrous ion was released from the siderophore complex, but at a rate only slightly above baseline. In vivo, the rate of iron release was measured by the growth of mutants. With ferric enterobactin as the only iron source, the presence or absence of YqjH had little effect on the growth of E. coli. Bacterial growth depended most on the presence of the enterobactin esterase Fes. Thus the evidence presented by Miethke et al. is not convincing that YqjH is capable of directly reducing ferric enterobactin, and much of the data supports that it does not.
The similarity between YqjH and ViuB suggest that it is unlikely that ViuB can directly reduce ferric enterobactin to remove iron. It also draws attention to the observation that enterobactin supports the growth of V. cholerae. All previous experiments that found enterobactin to support V. cholerae used a strain of E. coli to supply the siderophore.12,10,23 It is possible and, with the current understanding of ViuB, probable that V. cholerae acquires iron from enterobactin hydrolysis products and not enterobactin itself.7 Enterobactin Hydrolysis
Enterobactin is a cyclic trimer of N-(2,3-dihydroxybenzoyl)serine (DHB-Ser) (Fig. 4-3) synthesized by a non-ribosomal peptide synthetase.24–26 The cyclic backbone is a trilactone, and each ester is made sequentially. Elongation occurs as the alcohol of a DHB-Ser monomer or dimer loaded on the acyl thioesterase (TE) domain of EntF condenses with the carboxylic acid of a DHB-Ser monomer tethered to the peptidyl carrier protein domain of EntF. The TE domain also catalyzes the third condensation, which is intramolecular, to cyclize the siderophore and release it.27 No monomer, dimer, or linear trimer are produced in E. coli without separate esterase activity, showing that enterobactin biosynthesis always goes to completion.28
56

Cyclizing the backbone of enterobactin is advantageous for iron chelation because it preorganizes the catechol units for coordination.29 The decrease of the entropy of the ligand and the increase of ring strain upon coordination is minimized giving an unusually high ferric stability constant of 1048.14,21,30 As expected, the linear trimer has slightly lower affinity for iron with a proton-independent stability constant (KML) near 1043.29,30 The differences in change of free energy upon coordinating iron between enterobactin and the linear trimer are about one third enthalpic (ring strain) and two thirds entropic (relative change in conformational mobility).30 The dimer and monomer have substantially different affinity for iron because they are tetradentate or bidentate chelators that do not benefit from the chelate effect as much as the hexadentate cyclic enterobactin and linear DHB-Ser trimer.21 The stability constant for the ferric dimer was determined to be KML = 1036.30
Figure 4-3. Chemical structures of enterobactin and the hydrolysis products of enterobactin.
The ester linkage in enterobactin is hydrolysis labile. Hydrolysis produces linear DHB-
Ser trimer, dimer, and monomer (Fig. 4-3).31,32 Ester hydrolysis occurs in acidic or basic aqueous solutions31,32 or it is enzymatically catalyzed by Fes.18,19 It converts the cyclic siderophore to the linear trimer, then dimer, and finally the monomer. The catalytic efficiency (kcat/Km) is much higher for ferric enterobactin than the iron free (apo) enterobactin, indicating that the ferric complex is a better substrate unless the apo/ferric enterobactin ratio is high.33 Fes recognizes and hydrolyzes the trilactone made of three L-serine residues but not a trilactone made of three D-serine residues or three threonine residues.34 A crystal structure of Fes from Salmonella typhimurium has been solved, as well as structures of Fes from Shigella flexneri with
O O
O
O
O
O
HN
NHNH
O
O
O
Enterobactin4-1
HOHN
O
OHO
HO
HO
HOHN
O
OO
HO
HO
OH
O
HN O
HO
HO
HOHN
O
OO
HO
HO
O
O
HN O
HO
HO
OH
O
HN O
HO
HO
DHB-Ser Monomer4-2
DHB-Ser Dimer4-3
DHB-Ser Trimer4-4
HO
HO
OHOH
OHOH
57

enterobactin and DHB-Ser ligands. These structures are available on the Protein Data Bank (pdb.org), although they have not yet been published.35–37
The esterase is cytosolic, and enterobactin may be hydrolyzed before export or after uptake as the ferric complex. Winkelmann et al. state that in E. coli hydrolysis of apo-enterobactin before secretion produces DHB-Ser monomer but not dimer or trimer. After secrection and subsequent uptake of ferric enterobactin, hydrolysis yields monomer, dimer, and trimer.28 In contrast, Furrer et al. constructed an E. coli entS mutant deficient in enterobactin export, and all three hydrolysis products were secreted, most likely because Fes hydrolyzed newly synthesized enterobactin.38 Hydrolysis before export lessens the iron binding ability of the siderophore, but secreted enterobactin hydrolysis products are still efficient siderophores.30,39
Hydrolysis by Fes after uptake of ferric enterobactin is critical for iron utilization. Fes assists iron release by hydrolyzing ferric enterobactin, thus lowering the stability constant of the ferric complex and raising the reduction potential. Even hydrolysis of a single ester may be sufficient to permit iron release in biological context. A simple calculation based on the stability constant of linear DHB-Ser trimer for ferric ion with the assumption that the affinity of linear enterobactin is the same as cyclic enterobactin for ferrous ion estimates the reduction potential of ferric linear enterobactin to be -500 mV. This potential is near the -400 mV reduction potential of flavin cofactors found within ferric reductase enzymes.20,40 For the ferric enterobactin complex that has been fully hydrolyzed, the reduction potential of ferric DHB-Ser monomer has been measured to be -350 mV which is also within biological range.17 Because of the role of Fes in iron release, it has been shown to be essential for utilizing iron acquired by enterobactin.
Because V. cholerae does not contain an esterase homologous to Fes and biological reductants cannot directly reduce ferric enterobactin, it is improbable that V. cholerae obtains iron from the intact siderophore. Siderophore utilization assays had used enterobactin producing bacteria as the enterobactin source which probably also contains hydrolysis products, and they had never been done with purified, cyclic enterobactin. To test the hypothesis that V. cholerae uses enterobactin hydrolysis products instead of cyclic enterobactin, I have synthesized samples of enterobactin and the monomer, dimer, and trimer of DHB-Ser. I began a collaboration with Prof. Shelley Payne and Dr. Elizabeth Wyckoff, who have characterized most the of the iron uptake systems in V. cholerae, to perform growth studies using the pure siderophore sources. Synthesis of Enterobactin
The first total synthesis of enterobactin was reported by Corey and Bhattacharyya in 1977. The synthetic route involves first making the trilactone followed by condensation with 2,3-dihydroxybenzoyl chloride.41 Several improvements have been made to the synthesis including forming the trilactone in one step from serine monomers with use of an organotin template.42,43 Following the procedure of Marinez et al., enterobactin was prepared starting with the trityl-protected trilactone (4-5). Deprotection and condensation with benzyl-protected 2,3-dihydroxybenzoyl chloride (Bn2DHB-Cl) (4-7) gave benzyl protected enterobactin (4-8), which was purified by column chromatography. Deprotection gave pure enterobactin (4-1) (Scheme 4-1).43
58
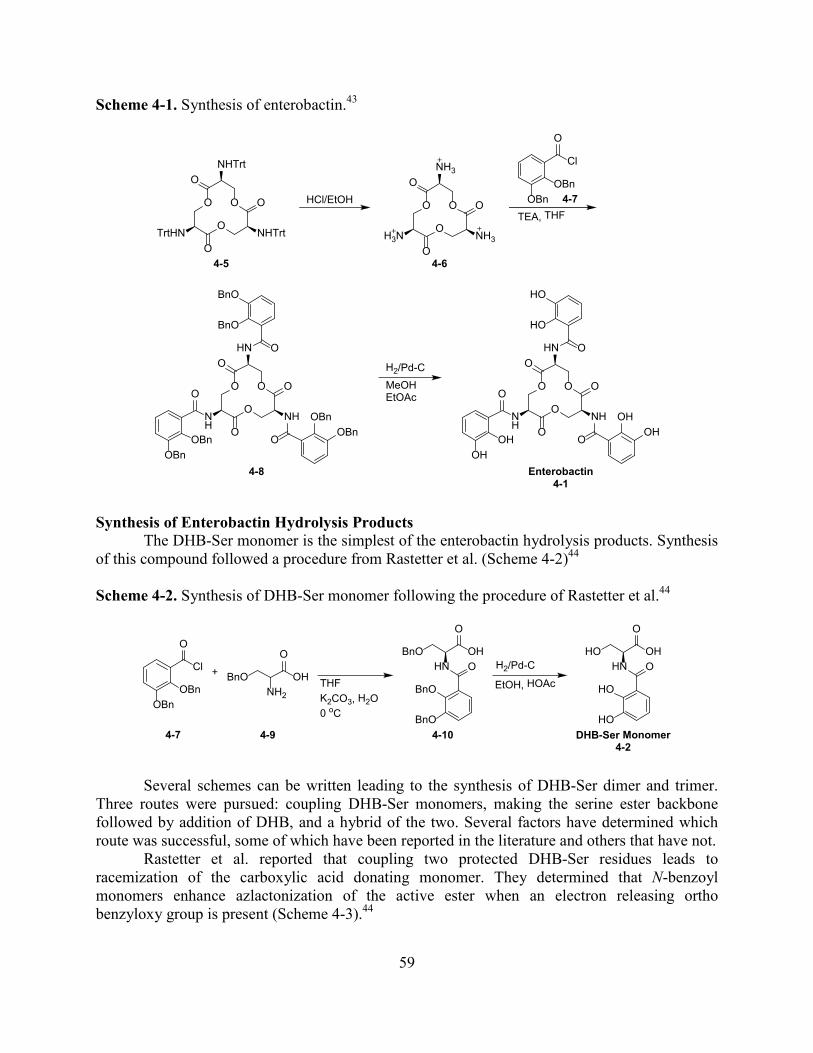
Scheme 4-1. Synthesis of enterobactin.43
Synthesis of Enterobactin Hydrolysis Products
The DHB-Ser monomer is the simplest of the enterobactin hydrolysis products. Synthesis of this compound followed a procedure from Rastetter et al. (Scheme 4-2)44 Scheme 4-2. Synthesis of DHB-Ser monomer following the procedure of Rastetter et al.44
Several schemes can be written leading to the synthesis of DHB-Ser dimer and trimer. Three routes were pursued: coupling DHB-Ser monomers, making the serine ester backbone followed by addition of DHB, and a hybrid of the two. Several factors have determined which route was successful, some of which have been reported in the literature and others that have not.
Rastetter et al. reported that coupling two protected DHB-Ser residues leads to racemization of the carboxylic acid donating monomer. They determined that N-benzoyl monomers enhance azlactonization of the active ester when an electron releasing ortho benzyloxy group is present (Scheme 4-3).44
O O
O
O
O
O
NHTrt
NHTrtTrtHN
4-5
HCl/EtOH O O
O
O
O
O
NH3
NH3H3N
TEA, THF
Cl
OBnOBn
O
4-6
4-7
O O
O
O
O
O
HN
NHNH
O
O
O
BnO
BnO
OBnOBn
OBnOBn
H2/Pd-CMeOHEtOAc
O O
O
O
O
O
HN
NHNH
O
O
O
HO
HO
OHOH
OHOH
4-8 Enterobactin4-1
O
Cl
OBnOBn
4-7
BnONH2
O
OH
BnOHN
O
OHO
BnO
BnO
HOHN
O
OHO
HO
HO
+THFK2CO3, H2O0 oC
H2/Pd-C
EtOH, HOAc
4-9 4-10 DHB-Ser Monomer4-2
59

Scheme 4-3. Racemization of DHB-Ser through azlactonization of the activated ester. The electron-releasing ortho benzyloxy group promotes azlactonization.44
Condensing Bn2DHB-Ser(Bn)-OH (4-10) with Bn2DHB-Ser-OBn (4-11) was attempted because both serine monomers are easily prepared by mixing Bn2DHB-Cl (4-7) with the appropriate serine derivative.44 Esterification was not successful in THF with either DCC/HOBt, 2-(7-aza-1H-benzotriazole-1-yl)-1,1,3,3-tetramethyluronium hexafluorophosphate (HATU), or isobutylchloroformate (Scheme 4-4). Besides the risk of racemization it appears that that the benzyl-protected DHB interferes with the availability of the caroboxylic acid or alcohol and prevents esterification. The choice of solvent may have also impeded the reaction. Scheme 4-4. Attempted synthesis of protected DHB-Ser dimer.
To avoid racemization of the DHB-Ser active ester, Rastetter et al. followed a route using Cbz-protected amines that would be coupled to DHB in the final step.44 This is similar to several of the reported syntheses of enterobactin.41,42,44 I pursued this strategy to make the DHB-Ser dimer and trimer. Using active ester mediated ester formation along with well documented protection and deprotection strategies I was able to synthesize protected serine dimer ester and trimer diester (Scheme 4-5). For the dimer, commercially available Cbz-Ser(Bn)-OH (4-12) and Cbz-Ser-OBn (4-13) were condensed in tetrahydrofuran (THF) using N,N-dicylcohexylcarbodiimide (DCC) with 1-hydroxybenzatriazole hydrate (HOBt) as an additive
BnOHN
O
OHO
BnO
BnO
DCC, HOBtCH3CN, pyr
BnOHN
O
OO
BnO
BnO
N
N
BnON
O
O
BnO
BnO
HB
BnON
O
O
BnO
BnO
BH
BnON
O
O
BnO
BnO
HBnO
HN
O
ORO
BnO
BnO
BnO O OBn
O O
HN HNBnO
HN
O
OH HOHN
O
OBn
DCC, HOBt
NMM, THF
+
4-10 4-11
O O O O
BnO
BnO
BnO
BnO
BnO
BnO
BnO
BnO
DIEA, THF
isobutylchloroformate
NMM, THF
HATU
60

and N-methylmorpholine as the base to give 4-14. The same reagents are used to condense Cbz-Ser(t-Bu)-OH (4-15) with Cbz-Ser-OBn (4-13). The resulting dimer (4-15) is an intermediate in the synthesis of the trimer. The t-Bu ether of 4-15 is selectively removed with trifluoroacetic acid (TFA) in CH2Cl2 at 0 °C to give the alcohol in dimer 4-16. The alcohol of 4-16 is condensed with Cbz-Ser(Bn)-OH (4-12) using DCC/HOBt as before to give the protected trimer (4-17). Scheme 4-5. Synthesis of protected serine dimer and trimer esters.
The next step for the synthesis of DHB-Ser dimer and trimer was removal of the protecting groups. Since the protected dimer (4-14) is simpler than the trimer (4-17) and reliably produced, the next steps were attempted with the dimer (4-14). Unfortunately, the deprotection of 4-14 gave several problems. All of the protecting groups are benzyl-based and easily removed by hydrogenolysis using H2/Pd-C. When using methanol as the solvent, the deprotection proceeded as expected. The removal of all the aromatic protecting groups was verified by 1H and 13C NMR. However, a new singlet appeared in the 1H NMR spectrum near 3.8 ppm. ESI-MS confirmed that the desired compound was formed, but it showed that the methyl ester of the desired product also formed, identifying the unexpected singlet in the 1H NMR spectrum. The reaction was repeated and acetic acid was added in case the free amine made the reaction too basic. In these conditions the methyl ester still formed as was observed in the 1H NMR and ESI-MS spectra.
To remedy this situation, I tested the deprotection of 4-14 in non-alcoholic solvents including THF, isopropanol, 2-methoxyethanol, and dimethylformamide (DMF). The deprotection either would proceed very slowly or never go to completion using these solvents. The 1H NMR spectra of the reaction products show that the serine alcohol protecting group is the most difficult to remove. All of the protecting groups were successfully removed by using DMF with 10% acetic acid after 3 days near 1000 psi of H2(g). The NMR of the product is difficult to interpret, which is expected. For ester 4-18, coupling between α and β protons is complex because the β protons are diastereotopic. The molecule is non-symmetric making the two α protons different, and the four β protons are all different. The 13C should be simpler, but many
BnO O OBn
O O
NHCbz NHCbzBnO
NHCbz
O
OH HONHCbz
O
OBnDCC, HOBt
NMM, THF+
t-BuO O OBn
O O
NHCbz NHCbzt-BuO
NHCbz
O
OH HONHCbz
O
OBnDCC, HOBtNMM, THF
50% TFA
CH2Cl2, 0 oC
HO O OBn
O O
NHCbz NHCbz
BnONHCbz
O
OH
DCC, HOBt
NMM, THF O O OBn
O O
NHCbz NHCbz
O
NHCbzBnO
4-12 4-13 4-14
4-15 4-13 4-15
4-16
4-12
4-17
+
61

peaks were observed in the spectra. The number of peaks, once the protecting groups were all removed, depended on the length of the reaction time. It is very possible for the serine-serine ester to be hydrolyzed in these conditions or for racemization to occur. The desired product was detected by MS, but it is possible that it was not the major product. To further test the identity of the product, it was mixed with the Bn2DHB-Cl (4-7). If 4-14 was successfully deprotected to give 4-18, then this reaction would yield 4-19, the last intermediate in the synthesis of DHB-Ser dimer (Scheme 4-6). However, this reaction yielded either DHB-Ser monomer or a mixture of many products. It was decided that this synthetic route was not productive Scheme 4-6. Attempted steps in the synthesis of DHB-Ser dimer.
A possible alternative to the attempted synthesis was to use a different protecting group on the serine alcohol of the dimer. By doing this, the hydrogenolysis would not have to proceed for such a long time and hydrolysis of the serine-serine ester and racemization may be prevented. I considered using a tert-butyl ether to protect the alcohol, but deprotection would then require two steps. This path appeared inferior to the other possible synthetic routes which are discussed below.
The final synthetic route to DHB-Ser dimer and trimer was informed by Yu et al. in a paper reporting the synthesis of salmochelins, the glucosylated enterobactin derivatives.45 Salmochelin S1 is a glucosylated DHB-Ser dimer, and salmochelin S2 is a glucosylated DHB-Ser trimer. The route used by the authors is a hybrid of the Cbz-amine strategy (Scheme 4-5) and the DHB-Ser monomer strategy (Scheme 4-4).To make salmochelin S1, Yu et al. condense DHB-Ser-OBn with Boc-Ser-OH using EDC/HOBt in CH3CN with pyridine. The amine is deprotected with anhydrous HCl in methanol, and then an acid chloride of DHB-glucose is used to acylate the free amine. Global deprotection gives the final product.
The reaction used to make salmochelin S1 were modified slightly to make DHB-Ser dimer. First, Bn2DHB-Ser-OBn (4-11) was condensed with Boc-Ser-OH (4-20) using diisopropylcarbodiimide (DIC) and HOBt in CH3CN with pyridine to give 4-21. The Boc protecting group was removed with HCl in methanol to provide the free amine in 4-22. Acylation with DHB-Cl (4-7) gives the protected form of DHB-Ser (4-23). The benzyl protecting groups are all removed by hydrogenolysis catalyzed by Pd(OH)2 under an atmosphere of H2(g) to yield the DHB-Ser dimer (4-3) (Scheme 4-7). The final compound was purified by reverse phase HPLC to give the pure material for use in bacterial growth assays.
H2/Pd-CHO O OH
O O
NH2 NH2
O
Cl
OBnOBn
H2O, K2CO3
HOHN
O
OHN
O
OHOO
BnO
BnO
BnO O OBn
O O
NHCbz NHCbz
4-14 4-18
4-7
4-19
2
DMF, 10% HAc BnO
BnO
62

Scheme 4-7. Synthesis of DHB-Ser dimer informed by Yu et al.45
The synthesis of DHB-Ser trimer follows the route used by Yu et al. to synthesize salmochelin S2.45 It is very similar to the synthesis of the dimer, but it requires one more condensation step and an additional protecting group. The alcohol of Boc-Ser-OH is first protected with THP to give a diastereomers of 4-24 because of the stereocenter in the protecting group. It is condensed with protected DHB-Ser monomer 4-11 to yield 4-25. The Boc and THP protecting groups are removed upon treating 4-25 with anhydrous HCl in methanol. The free amine of 4-26 is coupled to Bn2DHB-OH with DIC/HOBt to give protected DHB-Ser dimer 4-28 with an unprotected alcohol. That alcohol is condensed with 4-12 to make serine trimer 4-29. Once again, anhydrous HCl in methanol deprotects the amine (4-30) which is condensed with Bn2DHB-Cl (4-7) to make the protected trimer 4-31. Hydrogenolysis gives DHB-Ser trimer (4-4) which was purified by reverse phase HPLC to give enough material to use in bacterial growth assays.
BnONHBoc
O
OHN
O
OBnO
BnO
BnO
HOHN
O
OBnO
BnO
BnO
BnONHBoc
O
OH +DIC/HOBtCH3CN, pyr
HClMeOH
BnONH2
O
OHN
O
OBnO
BnO
BnO
O
Cl
OBnOBn
TEA, CH2Cl2
4-7BnO O OBn
O O
HN HNO O
BnO
BnO
BnO
BnO
Pd(OH)2
MeOH, EtOAc
HOHN
O
OO
HO
HO
OH
O
HN O
HO
HO
DHB-Ser Dimer4-3
4-20 4-11 4-21
4-22 4-23
63

Scheme 4-8. Syntheis of DHB-Ser trimer informed by Yu et al.45
The complete set of enterobactin hydrolysis products were successfully synthesized by using the hybrid synthetic scheme developed by Yu et al. for the synthesis of the related salmochelins. This is the first reported synthetic preparation of DHB-Ser dimer (4-3) and trimer (4-4) with retention of stereochemistry. Obtaining pure, well characterized samples of these products will help in better understanding the siderophore uptake and utilization of V. cholerae. V. cholerae Enterobactin Utilization Siderophore utilization can be determined using diffusion growth assays.10 A 5 μL drop of siderophore or siderophore producing bacteria is placed on an agar plate containing the bacterial strain or mutant of interest in iron-limited conditions. If the bacteria can use the siderophore it will grow around the drop. Dr. Elizabeth Wyckoff used this assay with the siderophores that I sent and several bacterial strains and mutants. The current results are summarized in Table 4-1.
HONH2
O
OHN
O
OBnO
BnO
BnO
O
OH
OBnOBn
NMM, THF0 oC
HO O OBn
O O
HN HNO O
BnO
BnO
BnO
BnO
Pd(OH)2
MeOH, EtOAc
BnONHBoc
O
OH
DIC/HOBtCH3CN, pyr
O O OBn
O O
HNO O
BnO
BnO
O
BnOHN O
BnO
BnO
BnO
BnO
O O OBn
O O
HN HNO O
BnO
BnO
O
BnONHBoc
BnO
BnO
O
Cl
OBnOBn
TEA, CH2Cl2
HClMeOH
O O OBn
O O
HN HNO O
BnO
BnO
O
BnONH2
BnO
BnO
O O OH
O O
HN HNO O
HO
HO
O
HOHN O
HO
HO
HO
HODHB-Ser Trimer
4-4
DIC, HOBt
THPONHBoc
O
OHN
O
OBnO
BnO
BnO
HOHN
O
OBnO
BnO
BnO
THPONHBoc
O
OH + DIC/HOBtCH3CN, pyr
HClMeOH
4-24 4-11 4-25
4-26
4-27
4-28
4-12
4-29 4-30
4-7
4-31
HN
64

DH
5aE
ntM
EC
AM
ME
CA
MD
HB
-SFc
O39
5JR
B9
Vib
Vib
A
Stra
inSp
ecie
sG
ene(
s)"E
nt"
10 μ
M10
μM
100
μM20
0 μM
"Vib
""V
ib-"
10 μ
M10
μM
JW33
52E.
col
iar
oB-
1116
015
JW05
87E.
col
ien
tB-
1516
916
017
entF
E. c
oli
entF
-/fep
B-0
0+
entF
E. c
oli
entF
-/fep
B-/v
ctPD
GC
++
++
JW05
76E.
col
ife
s-11
00
024
ALV
101
V. c
hole
rae
vibB
-13
010
150
1912
018
18
ALV
101
V. c
hole
rae
vibB
-/fep
A+/fe
s+20
179
1619
17
ALV
101
V. c
hole
rae
vibB
-/fep
A+14
017
1917
ALV
101
V. c
hole
rae
vibB
-/fes
+13
015
1610
JRB
9V.
cho
lera
evi
uB-
120
170
170
00
JRB
9V.
cho
lera
evi
uB-/f
epA+
/fes+
1915
90
170
JRB
9V.
cho
lera
evi
uB-/y
qjH
140
1417
17
Tabl
e4-
1.Si
dero
phor
eut
iliza
tion
assa
y.Th
enu
mbe
rsin
dica
teth
edi
amet
er(m
m)
ofth
egr
owth
zone
arou
ndth
esid
erop
hore
sour
ce.
Des
crip
tion
ofge
nes
and
abbr
evia
tions
:aro
B(e
nter
obac
tinsy
nthe
sis);
entB
(ent
erob
actin
synt
hesis
);en
tF(e
nter
obac
tinsy
nthe
sis);
fepB
(E.
coli
ente
roba
ctin
trans
port)
;vc
tPD
GC
(V.
chol
erae
inne
rm
embr
ane
cate
chol
ate
sider
opho
retra
nspo
rt);
fes
(E.
coli
este
rase
);vi
bB(v
ibrio
bact
insy
nthe
sis)
;fe
pA(E
.co
lien
tero
bact
inre
cept
or);
viuB
(V.
chol
erae
sider
opho
rere
duct
ase)
;yq
jH(E
.co
lisid
erop
hore
redu
ctas
e);
“Ent
”(e
nter
obac
tinpr
oduc
ing
stra
inof
E.co
li);
Ent
(ent
erob
actin
);M
ECA
M(n
on-h
ydro
lyza
ble
ente
roba
ctin
anal
og);
DH
B-S
(DH
B-S
erm
onom
er);
Fc(f
erric
hrom
e);“
Vib
”(v
ibrio
bact
inpr
oduc
ing
stra
inof
V.ch
oler
ae);
“Vib
-”(V
.ch
oler
aest
rain
with
novi
brio
bact
insy
nthe
sis)
;V
ib(v
ibrio
bact
in);
Vib
A(v
ibrio
bact
inA
).
65
The siderophore utilization assays indicate that V. cholerae cannot use cyclic enterobactin
which simultaneously shows that it uses enterobactin hydrolysis products. The V. cholerae periplasm and inner membrane transport system (VctPDGC) can transport cyclic enterobactin in E. coli, so the barrier is at the outer membrane and/or the cytoplasm. Addition of both the E. coli enterobactin outer membrane receptor, fepA, and the enterobactin esterase, fes, are required for V. cholerae to use cyclic enterobactin. The requirement for FepA to use cyclic enterobactin indicates that the V. cholerae outer membane receptors can distinguish between intact enterobactin and the hydrolysis products. Upcoming experiments with the DHB-Ser dimer and trimer will confirm whether V. cholerae uses the enterobactin hydrolysis products, and they will show whether it can distinguish between the hydrolysis products.
Miethke et al. have reported that the reductase YqjH can remove iron from ferric enterobactin without prior esterase activity.20 However, the growth assays indicate that yqjH does not give the ability to use cyclic enterobactin. This result is not conclusive because it is still possible that cyclic enterobactin does not enter the cell without FepA.
The results reported in Table 4-1 confirm that vibriobactin utilization depends on ViuB. It also shows that ViuB is complemented by YqjH, the E. coli homolog. However, viuB is not required for vibriobactin utilization when fes and fepA are present.
Additionally, the growth assays show that V. cholerae can use vibriobactin A, an oxazoline-hydrolyzed analog of vibriobactin. The function of the oxazolines in vibriobactin has not clearly been identified, but these results suggest that the oxazoline is not necessary for receptor recognition or iron release. The oxazolines may affect the rate of these two processes, but other experiments are required to determine the relative rates.
The siderophore utilization assays also raise several questions. It is surprising that 1,3,5-N,N',N"-tris-(2,3-dihydroxybenzoyl)triaminomethylbenzene (MECAM), a non-hydrolyzable analog of enterobactin, can support the growth of V. cholerae. MECAM has a lower ferric formation constant than enterobactin, and that difference may be enough that the iron can be removed.30
An equally surprising observation was that DHB-Ser monomer did not support growth in these assays. It is possible that V. cholerae can transport ferric DHB-Ser monomer but that it is not a strong enough iron chelator to mobilize iron in the agar.
The primary finding that V. cholerae cannot use ferric enterobactin confirms the understanding of siderophore utilization based on coordination chemistry. The high stability of ferric enterobactin requires breakdown of the siderophore and transitioning from one hexadentate siderophore to three bidentate chelators for iron can be released. V. cholerae does not have an enterobactin esterase so it uses the ferric hydrolysis products of enterobactin to help supply the iron resources it needs to grow and survive. Methods General Synthesis Procedures. Starting materials and reagents were used as provided from commercial sources. Flash chromatography was performed using silica gel (40-7 mesh). Thin layer chromatography was performed with aluminum backed plates of silica gel 60 F254. The Mass Spectrometry Facility at University of California, Berkeley, recorded ESI-MS, while the Microanalytical Services Laboratory of the same institution performed the microanalyses. The
66

1H and 13C spectra were measured using the noted Bruker spectrometers at room temperature unless otherwise indicated. The solvent for each spectrum is noted, and the spectra were calibrated the appropriate solvent peak. Hexabenzylenterobactin (4-8) was prepared according to the procedure of Marinez et al. with minor changes.43 Tris(N-trityl)serine lactone (4-5) was deprotected with HCl in EtOH. The triame (4-6) was collected on a fritted glass filter and washed with diethyl ether. Following addition of 2,3-bis(benzyloxy)benzoyl chloride (Bn2DHB-Cl) (4-7), prepared by the procedure of Schuda et al. (see compound 2-10),46 the reaction mixture was passed through a silica plug with EtOAc. The title compound was purified by flash chromatography with 0-25% EtOAc in CH2Cl2. The 1H-NMR spectrum matches the literature characterization of the enantiomer. Enterobactin (4-1). Clean glassware was soaked in a bath of DTPA, rinsed with Milli-Q water, and dried. Hexabenzylenterobactin (4-8) (0.702 g, 0.58 mmol) was dissolved in a mixture of EtOAc and methanol. Pd-C (10%) (0.285 g) was added, and the mixture was stirred overnight under 1 atm H2(g). The black slurry was filtered with fritted glass and a microfilter (0.45 μm). The solvent was removed and the product was precipitated with EtOAc to give enterobactin (4-1) (0.346 g, 89% yield). Characterization matched literature reports. The chirality of the product was confirmed by forming the ferric complex and measuring the CD spectrum which matched that of the natural siderophore.34 Bn2DHB-Ser(Bn) Acid (4-10). The title compound was synthesized following the procedure of Rastetter et al.44 Instead of making the acid chloride in benzene, dichloromethane was used as the solvent. DHB-Cl (4-7) (3.4 g, 9.6 mmol) in THF was added dropwise to Ser(Bn)-OH (4-9) (2.07 g, 10.06 mmol) in water with K2CO3 (3.5 g) cooled with an ice bath. The reaction was allowed to warm to room temperature and stirred for 1 h. Concentrated HCl (aq) was added to the water until pH < 2, and the product was extracted with EtOAc. It was then crystallized from EtOAc to give 2.80 g (57% yield) of a white, crystalline solid: 1H NMR (AV-300 CDCl3) δ 10.055 (br, 1H), 8.999 (d, J = 7.5 Hz, 1H), 7.725 (m, 1H), 7.50-7.10 (m, 17H), 5.20-5.04 (m, 4H), 4.880 (dt, J1 = 7.5 Hz, J2 = 3.7 Hz, 1H), 3.849 (dd, J1 = 9.6 Hz, J2 = 3.9 Hz, 1H), 3.643 (dd, J1 = 9.6 Hz, J2 = 3.9 Hz, 1H); 13C NMR (AV-300 CDCl3) δ 174.578, 165.959, 152.037, 147.333, 137.483, 136.455, 136.277, 129.335, 128.832, 128.528, 128.446, 128.026, 127.881, 127.840, 126.568, 124.599, 123.462, 117.697, 76.369, 73.337, 71.486, 69.030, 53.439; ESI-MS (pos. mode) C31H30O6N (M+H) calc’d 512.2073, found 512.2069. DHB-Ser Monomer (4-2) was synthesized by deprotecting 4-10 with H2/Pd-C in 20:1 EtOH-HAc according to the procedure of Rastetter et al.44 It was then purified by reverse phase HPLC (Zobax SB-C18, 5 μm, 9.4 x 250 mm, 5-40% acetonitrile in water/0.1% TFA in 30 min, retention time 11 min): 1H NMR (AV-300 CD3OD) δ 7.351 (dd, J1 = 8.1 Hz, J2 = 1.5 Hz, 1H), 6.952 (dd, J1 = 7.8 Hz, J2 = 1.5 Hz, 1H), 6.750 (t, J = 7.95 Hz, 1H), 4.720 (t, J = 4.2 Hz, 1H), 4.001 (qd, J1 = 11.4 Hz, J2 = 4.2 Hz, 2H); 13C (AV-300 CD3OD) δ 173.567, 170.698, 149.626, 147.261, 119.936, 119.873, 119.804, 117.278, 62.988, 56.416; ESI-MS (neg. mode) C10H10O6N (M-H) calc’d 240.0514, found 240.0510.
67

DHB-Ser(Bn)-OH (4-11) was synthesized using the same procedure for 4-10 from Rastetter et al.44 Ser-OBn hydrochloride (2.89 g, 12.5 mmol) and K2CO3 (3.44 g, 25.0 mmol) were stirred in water (50 mL) and cooled to 0 °C. DHB-Cl (4-7)(4.0 0 g, 11.3 mmol) in CH2Cl2 (10 mL) was added dropwise. The reaction mixture was stirred for 1 hour at room temperature. Water and CH2Cl2 were added and the aqueous layer was acidified. After separating the organic layer, the aqueous layer was extracted 2 more times with CH2Cl2. The combined organic layers were washed once with brine, dried with Na2SO4, filtered and evaporated to a yellow oil, which slowly became a white solid (5.576 g, 96% yield): Rf = 0.45 (2% methanol in CH2Cl2 ); 1H NMR (AV-300 CDCl3) δ 8.863 (d, J = 7.2 Hz, 1H), 7.693 (dd, J1 = 6.8 Hz, J2 = 2.9 Hz, 1H), 7.50-7.05 (m, 17H), 5.27-5.02 (m, 6H), 4.765 (dt, J1 = 5.1 Hz, J2 = 4.1 Hz, 1H), 3.855 (m, 2H), 2.50-2.10 (br, 1H); 13C NMR (AV-300, CDCl3) 170.27, 165.82, 151.94, 147.21, 136.46, 136.42, 135.49, 129.29, 128.85, 128.76, 128.68, 128.56, 128.46, 128.37, 127.97, 126.78, 124.55, 123.41, 117.68, 76.41, 71.50, 67.45, 63.59, 55.61; ESI-MS m/z calcd for C31H30NO6 (M+H) 512.2073, found 512.2069. Cbz2-Bn2-Ser Dimer (4-14) was synthesized by a procedure of Rastetter et al. for a similar compound that differed only in that the carboxylic acid was protected by a 2-(bromoethyl)anthraquinone ester instead of a benzyl ester: 1H NMR (AV-300 CDCl3) δ 7.4-7.1 (m, 20H), 5.807 (d, J = 8.4 Hz, 1H), 5.506 (d, J = 8.4 Hz, 1H) 5.25-4.97 (m, 6H), 4.82-4.32 (m, 6H), 3.80-3.51 (m, 2H); 13C NMR (AV-300 CDCl3) δ 169.777, 169.196, 156.098, 155.961, 137.125, 136.184, 135.078, 128.650, 128.534, 128.490, 128.427, 128.200, 128.152, 128.085, 127.947, 127.757, 127.603, 73.263, 69.443, 67.699, 67.135, 64.942, 54.430, 53.657, 53.477; ESI-MS (pos. mode) C36H37O9N2 (M+H) calc’d 641.2494, found 641.2496. Cbz2-Bn-t-Bu-Ser Dimer (4-15) was synthesized by the procedure from Rastetter et al. differing only in the identity of the protecting groups:44 1H NMR (AV-300 CDCl3) δ7.41-7.22 (m, 15H), 5.767 (d, J = 8.4 Hz, 1H), 5.513 (d, J = 8.4 Hz, 1H), 5.22-5.01 (m, 6H), 4.748 (dd, J1 = 11.1 Hz, J2 = 3.0 Hz, 1H), 4.666 (dt, J1 = 8.7 Hz, 1H), 4.404 (dd, J1 = 11.1 Hz, J2 = 2.7 Hz, 1H), 4.316 (dt, J1 = 8.4 Hz, 1H), 3.646 (dd, J1 = 9.2 Hz, J2 = 2.6 Hz, 1H), 3.493 (dd, J1 = 9.3 Hz, J2 = 3.0 Hz, 1H), 1.055 (s, 9H); 13C NMR (AV-300 CDCl3) δ 170.181, 169.277, 156.332, 156.027, 136.323, 136.249, 135.188, 128.780, 128.677, 128.598, 128.512, 128.362, 128.266, 74.067, 67.844, 67.289, 64.915, 62.021, 54.715, 53.770, 27.335; ESI-MS (pos. mode) C33H38O9N2Li (M+Li) calc’d 613.2732, found 613.2748. Cbz2-Bn-Ser Dimer Alcohol (4-16). The fully protected dimer 4-15 (0.741 g, 1.22 mmol) was dissolved in 50% (v/v) TFA in CH2Cl2 at 0 °C. It was stirred for 1 hr, checking by TLC (1:1 EtOAc:Hex) to see the starting material disappear, at which point the solvent and acid were removed by evaporation with an oil pump vacuum to give alcohol 4-16 (0.476 g, 71% yield): 1H NMR (AV-300 CDCl3) δ 7.42-7.30 (m, 15H), 6.10-5.52 (m, 2H), 5.21-5.02 (m, 6H), 4.85-4.25 (m, 4H), 3.95-3.42 (m, 2H); ESI-MS (pos. mode) C29H31O9N2 (M+H) calc’d 551.2030, found 551.2022. Cbz3-Bn2-Ser Trimer (4-17). The dimer alcohol 4-16 was condensed with Cbz-Ser(Bn)-OH (4-12) using the same conditions previously mentioned from Rastetter et al.:44 1H NMR (AV-300 CDCl3) δ 7.42-7.12 (m, 25H), 6.25-5.58 (m, 3H), 5.25-3.25 (m, 19H); ESI-MS (pos. mode) C47H48O13N3 (M+H) calc’d 862.3187, found 862.3171.
68

Boc-Ser(Bn)-O-Bn2DHB-Ser-OBn (4-21). Monomers 4-11 and 4-20 were condensed using a procedure reported by Yu et al.45 As a slight modification, the coupling agent DIC was used instead of EDC. For workup the solvent was removed and the residues was dissolved in CH2Cl2, washed with 5% (m/v) citric acid and saturated NaCl. The organic fraction was concentrated and purified on a silica column equilibrated with 1:6 EtOAc: hexanes. The product eluted second using a gradient of 1:4-1:3 EtOAc:hexanes to give 0.576 g (63% yield): 1H NMR (AV-300 CDCl3) δ 8.780 (d, J = 8.1 Hz, 1H), 7.687 (t, J = 4.8 Hz, 1H), 7.50-6.95 (m, 23H), 5.40-4.95 (m, 7H), 4.500 (dd, , J1 = 11.3 Hz, J2 = 3.8 Hz, 1H), 4.321 (dd, J1 = 11.1 Hz, J2 = 3.6 Hz, 1H), 4.26-4.15 (m, 2H), 4.070 (dt, J1 = 8.7 Hz, 1H), 3.251 (qd, J1 = 10.7 Hz, J2 = 3.0 Hz, 2H), 1.400 (s, 9H); 13C NMR (AV-300 CDCl3) δ 170.13, 169.14, 165.11, 155.29, 151.87, 146.91, 137.48, 136.19, 135.20, 129.40, 128.70, 128.66, 128.59, 128.44, 128.39, 128.24, 128.02, 127.60, 127.50, 126.55, 124.50, 123.12, 117.09, 79.81, 76.14, 72.90, 71.19, 69.32, 67.67, 65.09, 53.81, 51.68, 28.31; ESI-MS (pos. mode) C46H49O10N2 (M+H) calc’d 789.3387, found 789.3376. General Boc Deprotection followed the procedure of Yu et al.45 Anhydrous HCl (1M) in methanol was made by addition of acetyl chloride to cooled methanol with stirring. H-Ser(Bn)-O-Bn2DHB-Ser-OBn (4-22) was made from 4-21 using the general Boc deprotection above. The product was used for the next step without further purification or characterization. Benzyl protected DHB-Ser (4-23). Acylation of 4-22 followed the procedure of Yu et al.45 The amine salt of 4-22 (1.91 mmol) was dissolved in CH2Cl2 and TEA (2.12 mL, 15.2 mmol) and cooled to 0 °C. DHB-Cl (4-7) dissolved in CH2Cl2 was added dropwise with stirring and the solution was allowed to warm to room temperature. Stirring continued for 30 min to 1 h. The reaction mixture was then adsorbed to silica and immediately purified by flash chromatography using a gradient of 15-50% EtOAc in hexanes to give 0.70g of the title compound (36% yield from 4-21): 1H NMR (AV-300 CDCl3) δ 8.826 (d, J = 8.4 Hz, 2H), 7.78-7.66 (m, 2H), 7.50-6.85 (m, 34H), 5.28-5.05 (m , 10H), 5.022 (dd, J1 = 10.1 Hz, J2 = 2.0 Hz, 1H), 4.60-4.50 (m, 2H), 4.359 (dd, J1 = 11.3 Hz, J2 = 3.5, 1H), 4.080 (s, 2H), 3.290 (dd, J1 = 9.6 Hz, J2 = 3.3 Hz, 1H), 3.188 (dd, J1 = 9.8 Hz, J2 = 3.2 Hz, 1H); 13C NMR (AV-300 CDCl3) δ 169.832, 169.317, 165.274, 165.103, 152.040, 147.196, 147.088, 137.581, 136.449, 136.335, 135.351, 129.544, 129.364, 128.827, 128.781, 128.664, 128.553, 128.518, 128.393, 128.278, 128.245, 128.148, 128.039, 127.556, 126.972, 126.747, 124.584, 124.473, 123.317, 123.253, 117.341, 117.183, 76.190, 72.786, 71.401, 71.345, 68.809, 67.813, 65.207, 53.138, 51.763; ESI-MS (pos. mode) C62H57O11N2 (M+H) calc’d 1005.3957, found 1005.3963. General Benzyl Deprotection followed the procedure of Yu et al. to synthesize DHB-Ser dimer (4-3) and DHB-Ser trimer (4-4).45 The products were then purified by reverse phase HPLC. DHB-Ser Dimer(4-3) was synthesized using the general benzyl deprotection. It was then purified by reverse phase HPLC (Zobax SB-C18, 5 μm, 9.4 x 250 mm, 5-40% acetonitrile in water/0.1% TFA in 30 min, retention time 21 min): 1H NMR (AV-300 CDCl3) δ 7.313 (td, J1 = 7.7 Hz, J2 = 1.5 Hz, 2H), 6.942 (dt, J1 = 7.8 Hz, J2 = 1.5 Hz, 2H), 6.726 (t, J = 7.8 Hz, 2H), 5.012
69

(m, 1H), 4.833 (dd, J1 = 11.4 Hz, J2 = 3.6 Hz, 1H), 4.762 (t, J = 4.2 Hz, 1H), 4.556 (dd, J1 = 11.3 Hz, J2 = 5.6 Hz, 1H), 4.033 (dd, J1 = 11.4 Hz, J2 = 4.8 Hz, 1H), 3.934 (dd, J1 = 11.4 Hz, J2 = 3.9 Hz, 1H); 13C NMR (AV-300 CDCl3) δ 172.203, 171.618, 171.070, 170.844, 149.981, 149.616, 147.364, 47.320, 120.064, 119.979, 119.658, 117.251, 116.887, 65.510, 62.965, 56.668, 53.294; ESI-MS (neg. mode) C20H19O11N2 (M-H) calc’d 463.0994, found 463.0983; Anal. Calcd (Found) for NaC20H19O11N2: C, 49.39 (49.24); H, 3.94 (4.29); N, 5.76 (5.46). Boc-Ser(THP)-OH (4-24) was synthesized according to the procedure of Yu et al.45 Boc-Ser(THP)-O-Bn2DHB-Ser-OBn (4-25) was synthesized according to the procedure with Yu et al. using DIC/HOBt as the coupling reagents similar to 4-21 except the reaction mixture was washed only once with water. Purification of the reaction mixture by flash chromatography using a gradient of 10-40% EtOAc in hexanes gave the title compound: 1H NMR matches the literature report; 13C NMR (AV-300 CDCl3) δ 170.358, 170.257, 169.199, 169.153, 165.411, 165.283, 151.980, 147.109, 146.109, 146.968, 136.405, 136.323, 135.294, 129.442, 129.297, 128.838, 128.811, 128.771, 128.701, 128.572, 128.511, 128.444, 128.059, 127.981, 126.882, 126.748, 124.576, 123.218, 117.450, 117.242, 99.506, 98.861, 79.990, 79.894, 76.275, 71.406, 67.786, 67.295, 65.008, 62.836, 61.960, 53.918, 53.820, 52.091, 51.970, 30.326, 30.189, 28.432, 25.263, 25.192, 19.622, 19.179; ESI-MS (pos. mode) C44H51O11N2 (M+H) calc’d 788.3493, found 783.3492. H-Ser-O-Bn2DHB-Ser-OBn (4-26) was made from 4-25 using the general Boc deprotection above. The product was used for the next step without further purification or characterization. Bn2DHB-OH (4-27) was synthesized as reported in chapter 2 (compound 2-9). Bn2DHB-Ser-O-Bn2DHB-Ser-OBn (4-28) was synthesized according to the procedure of Yu et al. with the modifications used for 4-21 and 4-25: : 1H NMR (AV-300 CDCl3) δ 8.849 (d, J = 8.1 Hz, 2H), 7.72-7.60 (m, 2H), 7.50-7.00 (m, 29H), 5.30-5.00 (m, 10H), 4.688 (dd, , J1 = 11.1 Hz, J2 = 3.6 Hz, 1H), 4.527 (dt, J1 = 7.8 Hz, J2 = 3.2 Hz, 1H), 3.950 (dd, J1 = 11.4 Hz, J2 = 6.9 Hz, 1H), 3.65-3.40 (m, 2H), 3.15-3.04 (m, 1H); 13C NMR (AV-300 CDCl3) δ 170.172, 169.023, 165.869, 165.482, 152.028, 151.923, 147.283, 147.108, 136.500, 136.296, 135.140, 129.550, 129.241, 128.854, 128.788, 128.623, 128.568, 128.504, 128.452, 128.381, 128.049, 128.022, 127.012, 126.235, 124.699, 124.393, 123.338, 117.724, 117.552, 76.470, 76.341, 71.480, 67.835, 65.179, 62.53, 55.176, 51.822; ESI-MS (pos. mode) C55H51O11N2 (M+H) calc’d 915.3487, found 915.3497. Boc-Ser(Bn)-O-(Bn2DHB-Ser)2-OBn (4-29) was synthesized using a procedure from Yu et al.45 Dimer 4-28 (1.07 g, 1.17 mmol) was stirred with Boc-Ser(Bn)-OH (4-12) (0.52 g, 1.75 mmol) and HOBt (0.24 g, 1.75 mmol) in acetonitrile and cooled to 0 °C. DIC (0.37 mL, 2.34 mmol) was added and stirred for 20 min. The reaction mixture was allowed to warm to room termperature and after 15 min pyridine (0.24 mL, 2.92 mmol) was added. After stirring for 48 hours the solvent was removed and the residue was dissolve in EtOAc, washed once with water, and adsorbed to silica. The title compound was purified by flash chromatography using an 8-40% gradient of EtOAc in hexanes to give 0.73 g of product (53% yield): 1H NMR (AV-300 CDCl3) δ
70

8.823 (d, J = 7.8 Hz, 1H), 8.582 (d, J = 7.8 Hz, 1H), 7.73-7.58 (m, 2H), 7.50-6.90 (m, 39H), 5.30-4.90 (m, 12H), 4.650 (dt, J1 = 7.5 Hz, J2 = 3.9 Hz, 1H), 4.60-4.40 (m, 2H), 4.338 (dd, J1 = 11.3 Hz, J2 = 3.8 Hz, 1H), 4.30-4.05 (m, 4H), 3.966 (dd, J1 = 11.6 Hz, J2 = 3.8 Hz, 1H), 3.327 (dd, J1 = 9.6 Hz, J2 = 2.7 Hz, 1H), 3.228 (dd, J1 = 9.3 Hz, J2 = 2.7 Hz, 1H); 13C NMR (AV-300 CDCl3) δ 170.129, 169.123, 168.933, 165.510, 165.180, 155.363, 152.006, 151.974, 147.204, 147.007, 137.672, 136.433, 136.348, 135.321, 29.428, 129.216, 128.828, 128.783, 128.681, 128.612, 128.509, 128.364, 128.073, 128.016, 127.816, 127.688, 126.786, 126.660, 124.570, 123.386, 123.222, 117.705, 117.201, 79.937, 76.280, 73.528, 73.011, 71.479, 71.330, 69.522, 67.862, 65.236, 64.451, 53.884, 52.038, 51.795, 28.414; ESI-MS (pos. mode) C70H70O15N3 (M+H) calc’d 1192.4807, found 1192.4815. H-Ser(Bn)-O-(Bn2DHB-Ser)2-OBn (4-30) was made from 4-29 using the general Boc deprotection above. The product was used for the next step without further purification or characterization. Benzyl protected DHB-Ser Trimer (4-31) was synthesized by following a procedure from Yu et al.:45 1H NMR (AV-300 CDCl3) δ 8.844 (d, J = 7.8 Hz, 1H), 8.737 (d, J = 7.5 Hz, 1H), 8.654 (d, J = 7.8 Hz, 1H), 7.80-7.50 (m, 3H), 7.50-6.70 (m, 37H), 5.40-4.80 (m, 15H), 4.699 (dt, J1 = 7.8 Hz, J2 = 3.9 Hz, 1H), 4.615 (dd, J1 = 11.4 Hz, J2 = 4.2 Hz, 1H), 4.517 (dt, J1 = 7.5 Hz, J2 = 3.9 Hz, 1H), 4.373 (dd, J1 = 11.1 Hz, J2 = 3.6 Hz, 1H), 4.20-4.00 (m, 4H), 3.314 (dd, J1 = 9.9 Hz, J2 = 3.3 Hz, 1H), 3.194 (dd, J1 = 9.6 Hz, J2 = 3.0 Hz, 1H); 13C NMR (AV-300 CDCl3) δ 169.70, 169.19, 169.01, 165.47, 165.11, 165.01, 152.00, 147.18, 147.14, 147.05, 137.61, 136.51, 136.35, 135.38, 129.47, 129.41, 129.23, 128.76, 128.64, 128.60, 128.53, 128.40, 128.26, 128.09, 128.03, 128.00, 127.63, 127.55, 126.98, 126.87, 126.79, 124.49, 123.35, 117.60, 117.29, 117.14, 76.22, 76.15, 72.78, 71.39, 71.33, 68.79, 67.80, 65.28, 64.51, 53.14, 52.01, 51.78; ESI-MS (pos. mode) C86H78O16N3 (M+H) calc’d 1408.5382, found 1408.5420. DHB-Ser Trimer (4-4) was synthesized following the general deprotection methods. It was then purified by reverse phase HPLC (Zobax SB-C18, 5 μm, 9.4 x 250 mm, 5-45% acetonitrile in water/0.1% TFA in 35 min, retention time 30 min): 1H NMR (AV-300 MeOD) δ 7.35-7.20 (m, 3H), 6.96-6.89 (m, 3H), 6.77-6.64 (m, 3H), 5.045 (m, 1H), 5.02-4.95 (m, 1H), 4.801 (m, 2H), 4.689 (t, J = 4.2 Hz, 1H), 4.562 (m, 2H), 3.978 (dd, J1 = 11.4 Hz, J2 = 4.5 Hz, 1H), 3.875 (dd, J1 = 11.4 Hz, J2 = 3.6 Hz, 1H); 13C NMR (AV-300 MeOD) δ 172.110, 171.636, 171.183, 170.828, 170.388, 149.947, 149.664, 149.556, 147.280, 120.152, 120.070, 120.011, 119.839, 119.659, 117.199, 117.052, 116.660, 65.727, 65.195, 62.887, 56.623, 53.507, 53.259; ESI-MS (neg. mode) C30H28O16N3 (M-H) calc’d 686.1475, found 686.1442. References (1) Kaper, J. B.; Morris, J. G., Jr; Levine, M. M. Clin. Microbiol. Rev. 1995, 8, 48–86. (2) Barzilay, E. J.; Schaad, N.; Magloire, R.; Mung, K. S.; Boncy, J.; Dahourou, G. A.; Mintz,
E. D.; Steenland, M. W.; Vertefeuille, J. F.; Tappero, J. W. N. Engl. J. Med. 2013, 368, 599–609.
(3) WHO | Cholera in Mexico – update http://www.who.int/csr/don/2013_10_28/en/index.html (accessed Oct 30, 2013).
71

(4) Di Lorenzo, M.; Stork, M.; Alice, A. F.; Lopez, C. S.; Crosa, J. H. In Iron Transport in Bacteria; Crosa, J. H.; Mey, A. R.; Payne, S. M., Eds.; ASM Press: Washington, DC, 2004; pp. 241–255.
(5) Mey, A. R.; Payne, S. M. Mol. Microbiol. 2001, 42, 835–849. (6) Wyckoff, E. E.; Mey, A. R.; Leimbach, A.; Fisher, C. F.; Payne, S. M. J. Bacteriol. 2006,
188, 6515–6523. (7) Wyckoff, E. E.; Mey, A. R.; Payne, S. M. BioMetals 2007, 20, 405–416. (8) Rogers, M. B.; Sexton, J. A.; DeCastro, G. J.; Calderwood, S. B. J. Bacteriol. 2000, 182,
2350–2353. (9) Griffiths, G. L.; Sigel, S. P.; Payne, S. M.; Neilands, J. B. J. Biol. Chem. 1984, 259, 383 –
385. (10) Wyckoff, E. E.; Stoebner, J. A.; Reed, K. E.; Payne, S. M. J. Bacteriol. 1997, 179, 7055–
7062. (11) Keating, T. A.; Marshall, C. G.; Walsh, C. T. Biochemistry 2000, 39, 15513–15521. (12) Mey, A. R.; Wyckoff, E. E.; Oglesby, A. G.; Rab, E.; Taylor, R. K.; Payne, S. M. Infect.
Immun. 2002, 70, 3419 –3426. (13) Wyckoff, E. E.; Payne, S. M. Mol. Microbiol. 2011, 81, 1446–1458. (14) Loomis, L. D.; Raymond, K. N. Inorg. Chem. 1991, 30, 906–911. (15) Matzanke, B. F.; Anemüller, S.; Schünemann, V.; Trautwein, A. X.; Hantke, K.
Biochemistry 2004, 43, 1386–1392. (16) Butterton, J. R.; Calderwood, S. B. J. Bacteriol. 1994, 176, 5631–5638. (17) O’Brien, I.; Cox, G.; Gibson, F. Biochim. Biophys. Acta 1971, 237, 537–549. (18) Greenwood, K. T.; Luke, R. K. J. Biochim. Biophys. Acta 1978, 525, 209–218. (19) Brickman, T. J.; McIntosh, M. A. J. Biol. Chem. 1992, 267, 12350–12355. (20) Miethke, M.; Hou, J.; Marahiel, M. A. Biochemistry 2011, 50, 10951–10964. (21) Harris, W. R.; Carrano, C. J.; Cooper, S. R.; Sofen, S. R.; Avdeef, A. E.; McArdle, J. V.;
Raymond, K. N. J. Am. Chem. Soc. 1979, 101, 6097–6104. (22) Mies, K. A.; Wirgau, J. I.; Crumbliss, A. L. BioMetals 2006, 19, 115–126. (23) Wyckoff, E. E.; Valle, A.-M.; Smith, S. L.; Payne, S. M. J Bacteriol 1999, 181, 7588–
7596. (24) Bryce, G. F.; Weller, R.; Brot, N. Biochem. Biophys. Res. Commun. 1971, 42, 871–879. (25) Greenwood, K. T.; Luke, R. J. Biochim. Biophys. Acta 1976, 454, 285–297. (26) Gehring, A. M.; Mori, I.; Walsh, C. T. Biochemistry 1998, 37, 2648–2659. (27) Shaw-Reid, C. A.; Kelleher, N. L.; Losey, H. C.; Gehring, A. M.; Berg, C.; Walsh, C. T.
Chem. Biol. 1999, 6, 385–400. (28) Winkelmann, G.; Cansier, A.; Beck, W.; Jung, G. BioMetals 1994, 7. (29) Tse, B.; Kishi, Y. J. Org. Chem. 1994, 59, 7807–7814. (30) Scarrow, R. C.; Ecker, D. J.; Ng, C.; Liu, S.; Raymond, K. N. Inorg. Chem. 1991, 30,
900–906. (31) O’Brien, I. G.; Gibson, F. Biochim. Biophys. Acta BBA - Gen. Subj. 1970, 215, 393–402. (32) O’Brien, I. G.; Cox, G. B.; Gibson, F. Biochim. Biophys. Acta 1970, 201, 453–460. (33) Lin, H.; Fischbach, M. A.; Liu, D. R.; Walsh, C. T. J. Am. Chem. Soc. 2005, 127, 11075–
11084. (34) Abergel, R. J.; Zawadzka, A. M.; Hoette, T. M.; Raymond, K. N. J. Am. Chem. Soc. 2009,
131, 12682–12692.
72

(35) PDB ID: 3C87 Kim, Y.; Maltseva, N.; Abergel, R.; Raymond, K.; Holzle, D.; Joachimiak, A.; Midwest
Center for Structural Genomics (MCSG), Crystal Structure of the Enterobactin Esterase FES from Shigella flexneri in the Presence of Enterobactin.
(36) PDB ID: 3C8D Kim, Y.; Maltseva, N.; Abergel, R.; Holzle, D.; Raymond, K.; Joachimiak, A.; Midwest
Center for Structural Genomics (MCSG), Crystal Structure of the Enterobactin Esterase FES from Shigella flexneri in the Presence of 2,3-Di-hydroxy-N-benzoyl-glycine.
(37) PDB ID: 3MGA Minasov, G.; Wawrzak, Z.; Skarina, T.; Onopriyenko, O.; Papazisi, L.; Savchenko, A.;
Anderson, W. F.; Center for Structural Genomics of Infectious Diseases (CSGID), 2.4 Angstrom Crystal Structure of Ferric Enterobactin Esterase (fes) from Salmonella typhimurium.
(38) Furrer, J. L.; Sanders, D. N.; Hook-Barnard, I. G.; McIntosh, M. A. Mol. Microbiol. 2002, 44, 1225–1234.
(39) Hantke, K. FEMS Microbiol. Lett. 1990, 67, 5–8. (40) Pierre, J. L.; Fontecave, M.; Crichton, R. R. BioMetals 2002, 15, 341–346. (41) Corey, E. J.; Bhattacharyya, S. Tetrahedron Lett. 1977, 18, 3919–3922. (42) Shanzer, A.; Libman, J. J. Chem. Soc., Chem. Commun. 1983, 846. (43) Marinez, E. R.; Salmassian, E. K.; Lau, T. T.; Gutierrez, C. G. J. Org. Chem. 1996, 61,
3548–3550. (44) Rastetter, W. H.; Erickson, T. J.; Venuti, M. C. J. Org. Chem. 1981, 46, 3579–3590. (45) Yu, X.; Dai, Y.; Yang, T.; Gagné, M. R.; Gong, H. Tetrahedron 2011, 67, 144–151. (46) Schuda, P.; Botti, C.; Venuti, M. Org. Prep. Proced. Int. 1984, 16, 119–125.
73
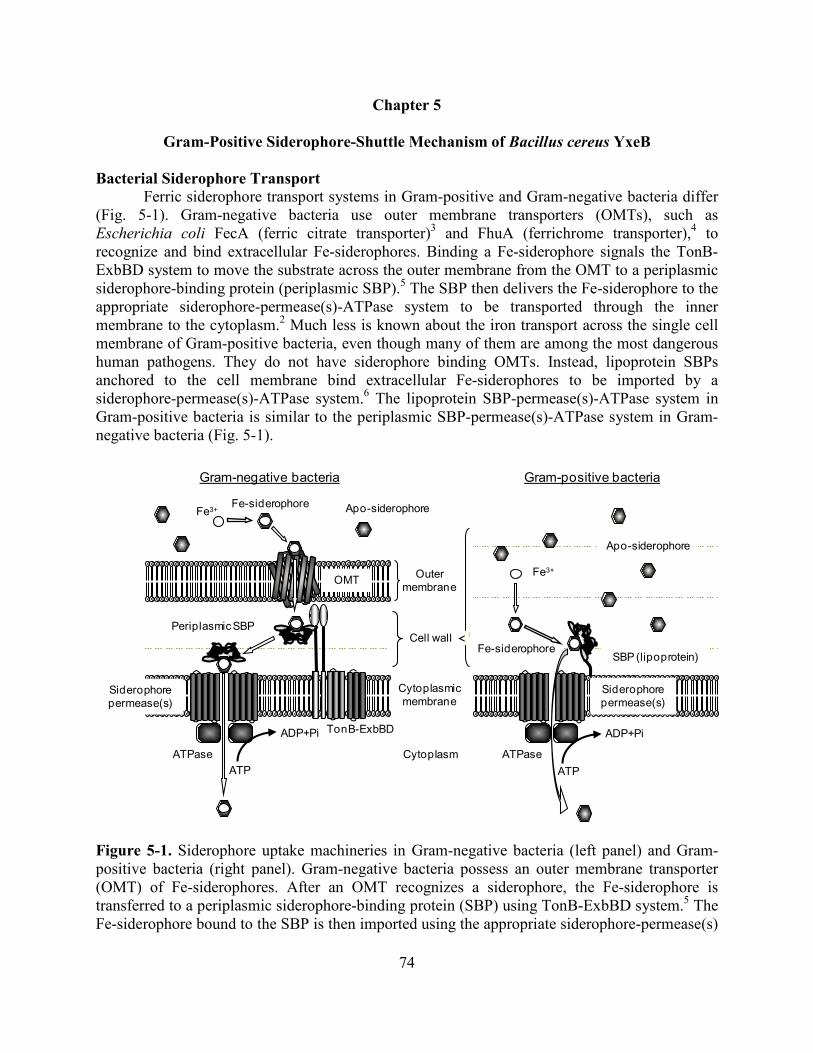
Chapter 5
Gram-Positive Siderophore-Shuttle Mechanism of Bacillus cereus YxeB
Bacterial Siderophore Transport Ferric siderophore transport systems in Gram-positive and Gram-negative bacteria differ
(Fig. 5-1). Gram-negative bacteria use outer membrane transporters (OMTs), such as Escherichia coli FecA (ferric citrate transporter)3 and FhuA (ferrichrome transporter),4 to recognize and bind extracellular Fe-siderophores. Binding a Fe-siderophore signals the TonB-ExbBD system to move the substrate across the outer membrane from the OMT to a periplasmic siderophore-binding protein (periplasmic SBP).5 The SBP then delivers the Fe-siderophore to the appropriate siderophore-permease(s)-ATPase system to be transported through the inner membrane to the cytoplasm.2 Much less is known about the iron transport across the single cell membrane of Gram-positive bacteria, even though many of them are among the most dangerous human pathogens. They do not have siderophore binding OMTs. Instead, lipoprotein SBPs anchored to the cell membrane bind extracellular Fe-siderophores to be imported by a siderophore-permease(s)-ATPase system.6 The lipoprotein SBP-permease(s)-ATPase system in Gram-positive bacteria is similar to the periplasmic SBP-permease(s)-ATPase system in Gram-negative bacteria (Fig. 5-1).
Figure 5-1. Siderophore uptake machineries in Gram-negative bacteria (left panel) and Gram-positive bacteria (right panel). Gram-negative bacteria possess an outer membrane transporter (OMT) of Fe-siderophores. After an OMT recognizes a siderophore, the Fe-siderophore is transferred to a periplasmic siderophore-binding protein (SBP) using TonB-ExbBD system.5 The Fe-siderophore bound to the SBP is then imported using the appropriate siderophore-permease(s)
Outer membrane
Cell wall
Cytoplasmic membrane
ATP
ADP+Pi
ATP
ADP+Pi
Cytoplasm
Gram-negative bacteria Gram-positive bacteria
Apo-siderophoreFe-siderophoreFe3+
Periplasmic SBP
SBP (lipoprotein)
Siderophore permease(s)
Siderophore permease(s)
TonB-ExbBD
OMT
Apo-siderophore
Fe-siderophore
Fe3+
ATPase ATPase
74
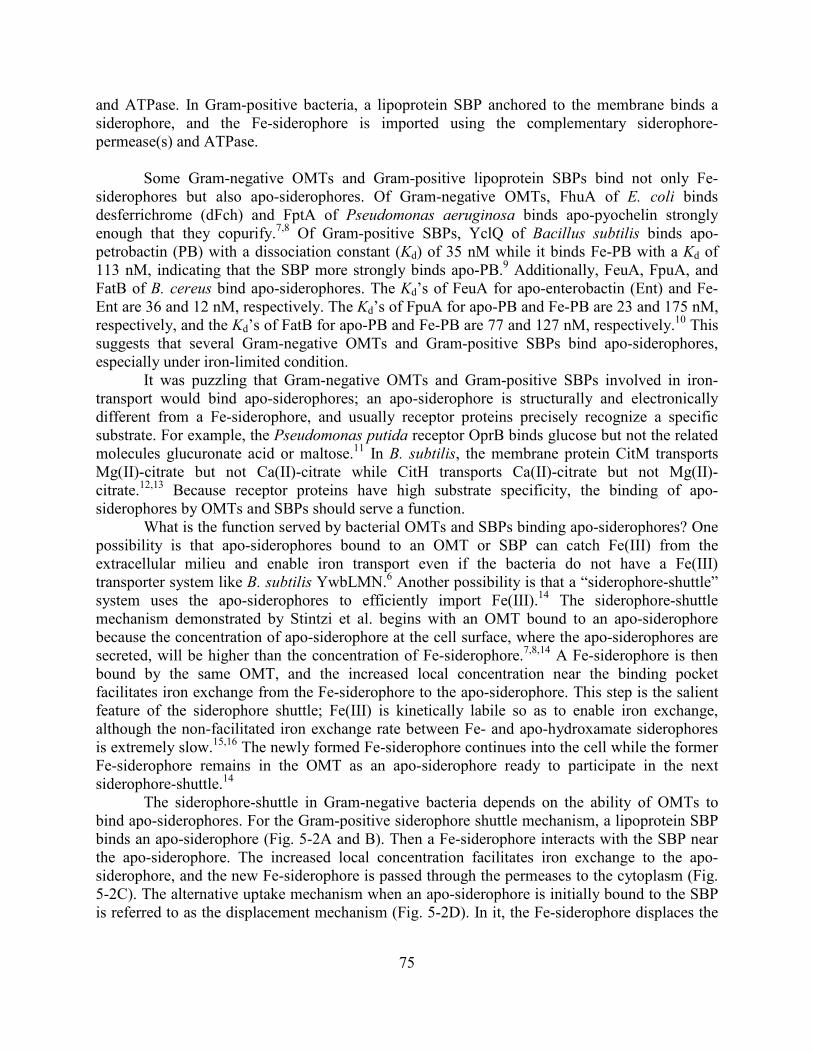
and ATPase. In Gram-positive bacteria, a lipoprotein SBP anchored to the membrane binds a siderophore, and the Fe-siderophore is imported using the complementary siderophore-permease(s) and ATPase.
Some Gram-negative OMTs and Gram-positive lipoprotein SBPs bind not only Fe-siderophores but also apo-siderophores. Of Gram-negative OMTs, FhuA of E. coli binds desferrichrome (dFch) and FptA of Pseudomonas aeruginosa binds apo-pyochelin strongly enough that they copurify.7,8 Of Gram-positive SBPs, YclQ of Bacillus subtilis binds apo-petrobactin (PB) with a dissociation constant (Kd) of 35 nM while it binds Fe-PB with a Kd of 113 nM, indicating that the SBP more strongly binds apo-PB.9 Additionally, FeuA, FpuA, and FatB of B. cereus bind apo-siderophores. The Kd’s of FeuA for apo-enterobactin (Ent) and Fe-Ent are 36 and 12 nM, respectively. The Kd’s of FpuA for apo-PB and Fe-PB are 23 and 175 nM, respectively, and the Kd’s of FatB for apo-PB and Fe-PB are 77 and 127 nM, respectively.10 This suggests that several Gram-negative OMTs and Gram-positive SBPs bind apo-siderophores, especially under iron-limited condition.
It was puzzling that Gram-negative OMTs and Gram-positive SBPs involved in iron-transport would bind apo-siderophores; an apo-siderophore is structurally and electronically different from a Fe-siderophore, and usually receptor proteins precisely recognize a specific substrate. For example, the Pseudomonas putida receptor OprB binds glucose but not the related molecules glucuronate acid or maltose.11 In B. subtilis, the membrane protein CitM transports Mg(II)-citrate but not Ca(II)-citrate while CitH transports Ca(II)-citrate but not Mg(II)-citrate.12,13 Because receptor proteins have high substrate specificity, the binding of apo-siderophores by OMTs and SBPs should serve a function.
What is the function served by bacterial OMTs and SBPs binding apo-siderophores? One possibility is that apo-siderophores bound to an OMT or SBP can catch Fe(III) from the extracellular milieu and enable iron transport even if the bacteria do not have a Fe(III) transporter system like B. subtilis YwbLMN.6 Another possibility is that a “siderophore-shuttle” system uses the apo-siderophores to efficiently import Fe(III).14 The siderophore-shuttle mechanism demonstrated by Stintzi et al. begins with an OMT bound to an apo-siderophore because the concentration of apo-siderophore at the cell surface, where the apo-siderophores are secreted, will be higher than the concentration of Fe-siderophore.7,8,14 A Fe-siderophore is then bound by the same OMT, and the increased local concentration near the binding pocket facilitates iron exchange from the Fe-siderophore to the apo-siderophore. This step is the salient feature of the siderophore shuttle; Fe(III) is kinetically labile so as to enable iron exchange, although the non-facilitated iron exchange rate between Fe- and apo-hydroxamate siderophores is extremely slow.15,16 The newly formed Fe-siderophore continues into the cell while the former Fe-siderophore remains in the OMT as an apo-siderophore ready to participate in the next siderophore-shuttle.14
The siderophore-shuttle in Gram-negative bacteria depends on the ability of OMTs to bind apo-siderophores. For the Gram-positive siderophore shuttle mechanism, a lipoprotein SBP binds an apo-siderophore (Fig. 5-2A and B). Then a Fe-siderophore interacts with the SBP near the apo-siderophore. The increased local concentration facilitates iron exchange to the apo-siderophore, and the new Fe-siderophore is passed through the permeases to the cytoplasm (Fig. 5-2C). The alternative uptake mechanism when an apo-siderophore is initially bound to the SBP is referred to as the displacement mechanism (Fig. 5-2D). In it, the Fe-siderophore displaces the
75

apo-siderophore from the SBP. No iron exchange takes place, and the original Fe-siderophore passes through the permeases to the cytoplasm. Iron exchange is the distinguishing feature of the two mechanisms.
Figure 5-2. Possible Fe-siderophore uptake mechanisms in Gram-positive bacteria. (A) No siderophore is bound to siderophore-binding protein (SBP). In the situation when a Fe-siderophore is bound to the SBP, the siderophore is immediately imported to the cytoplasm. (B) On the other hand, when apo-siderophore is bound to the SBP, two Fe-siderophore uptake
: First siderophore
: Second siderophore
: Fe(III)
(C) Gram-positive siderophore-shuttle mechanism
(D) Displacement mechanism
(A) No siderophore is bound
Periplasm
Cytoplasm
(B) SBP binds apo-siderophore
76

mechanisms, the Gram-positive siderophore-shuttle mechanism (C) or the displacement mechanism (D) are possible. (C) In the Gram-positive siderophore-shuttle mechanism, iron is transferred from a Fe-siderophore to the apo-siderophore:SBP complex and the new Fe-siderophore (green hexagon apo-siderophore with a red circle representing the transferred iron) is then imported into the cytoplasm. It is not clear whether the resulting apo-siderophore (orange hexagon) remains bound to the SBP or not after iron-exchange has occurred. (D) In the displacement mechanism, the apo-siderophore is released from the SBP, and the Fe-siderophore occupies the binding pocket. No iron exchange occurs, and the original Fe-siderophore is transported to the cytoplasm.
B. cereus ATCC 14579 uses a lipoprotein SBP called YxeB to bind and import FO (ferrioxamine) and Fch.10 These two siderophore deliver iron through YxeB even though B. cereus does not synthesize the corresponding apo-siderophores DFO (desferrioxamine) and dFch (desferrichrome).17 To characterize the Fe-siderophore transport mechanism, I synthesized and prepared several siderophores and siderophore complexes. Dr. Tatsuya Fukushima constructed many Gram-positive mutants, purified proteins, and performed biochemical assays. Together, we show that YxeB uses a Gram-positive siderophore-shuttle mechanism to transport Fe-siderophores when apo-siderophore is present.
Results
YxeB Binds DFO, FO, dFch, and Fch. Previously, Zawadzka et al. demonstrated that YxeB (BC_0383) binds Fe-siderophores, FO and Fch.10 However, it was unknown if the protein also binds apo-siderophores, DFO or dFch (chemical structures shown in Fig. 5-3).
Figure 5-3. Chemical structures of desferrioxamine B (DFO), acetyl-desferrioxamine (AcDFO) and desferriferrichrome (dFch). The ferric complexes of these siderophores are ferrioxamine (FO), acetyl-ferrioxamine (AcFO), and ferrichrome (Fch), respectively.
To begin our study of YxeB, the yxeB gene in B. cereus ATCC 14579 was sequenced. Sequencing revealed two different nucleotides in the gene compared to the sequence in the National Center for Biotechnology Information (NCBI). One nucleotide, G555, in the database (the number is with respect to the first nucleotide of the yxeB translational start codon) is incorrect, and the correct nucleotide is A555. The other nucleotide has two variations, TT425A and
RHN NOH
OO
HN
NHO
OOHN
NHO
O
HNNHNH
NH HN
HN
OO
N OOHO
NHO
O
OO
N
O
HO
O
R = H, Desferrioxamine B (DFO)R = Ac, Acetyl-Desferrioxamine (AcDFO)
Desferriferrichrome(dFch)
77

TC425A in the laboratory stock. The yxeB genes with TT425A and TC425A encode YxeB-L142 (residue 142 is Leu) and YxeB-S142 (residue 142 is Ser), respectively (Fig A5-1). Both YxeB-L142 and YxeB-S142 were used in the following fluorescence quenching assays to measure the binding affinity for several substrates.
A fluorescence quenching assay of the YxeB-S142 protein was performed. The fluorescence was quenched by DFO, FO, dFch, and Fch (Fig. 5-4C and D). The data were fit to a one-to-one binding model using Hyperquad to determine the Kd’s. 18 The Kd’s for the apo and Fe-siderophores were very similar (Table 5-1). Thus, YxeB-S142 has similar affinity for both the apo and ferric forms of siderophores.
(A) YxeB-L142-6×His (DFO derivatives) (B) YxeB-L142-6×His (DFch/Fch)
(C) YxeB-S142-6×His (DFO derivatives) (D) YxeB-S142-6×His (DFch/Fch)
78

Figure 5-4. Fluorescence quenching assay of the YxeB-L142 protein at 333 nm and 345 nm (A and B, respectively) and YxeB-S142 protein at 368 nm (C and D). FO (●), Cr-DFO (♦), DFO (○), Fch (■), and dFch (□) are used as the substrates. TBS buffer was added as a control (▲). The quenching curves of YxeB-L142 with FO, Cr-DFO, and Fch were fit to the calculated quenching curves using Hyperquad. The fluorescence intensity of YxeB-S142 with DFO, FO, Cr-DFO, dFch, and Fch was also fit to the calculated quenching curves using Hyperquad.18 The Kd values are reported in Table 5-1.
Table 5-1. Dissociation constants (Kd’s) of YxeB-L142-6×His and YxeB-S142-6×His
Ligand Kd (nM) YxeB-L142-6×His YxeB-S142-6×His
DFO NCa 35.9 (0.0056b) FO 38.8 (0.0032b) 29.1 (0.0054b)
Cr-DFO 69.0 (0.0036b) 98.9 (0.0054b)
dFch NCa 23.0 (0.0113b)
Fch 43.0 (0.0184b) 29.3 (0.0096b)
Ga-DFO NCa 44.6
AcDFO NCa 30.7
AcFO 41.0 31.6 aNC is not calculated using Hyperquad since the protein fluorescence increased (Fig. S1).18 bNumber indicates standard deviation calculated by Hyperquad.18
The quenching assays of YxeB-L142-6×His also show that the protein fluorescence was
quenched by FO and Fch (Fig. 5-4A and B). The Kd’s for FO and Fch were 38.8 nM and 43.0 nM, respectively (Table 5-1). Significantly, the protein fluorescence increased upon addition of DFO or dFch; the same as previously reported by Zawadzka et al. for YxeB-V5(epitope tag)-6×His.10 Thus, it is possible that the increasing fluorescence of the YxeB-L142 protein is caused by substrate binding. To confirm this, nano ESI-MS analysis of the protein and dFch or Fch complexes was performed. The data show that the protein formed complexes with dFch and Fch (Fig. A5-1 and Table A5-1). Additionally, the YxeB-L142 protein mixed with DFO or FO was purified and then analyzed by RP-HPLC (reverse-phase high performance liquid chromatography) showing that the protein had bound DFO and FO (Fig. A5-2B and F). Thus, it is clear that the increasing fluorescence of the protein is due to siderophore binding.
YxeB is the Sole FO/Fch-Binding Protein. B. cereus ATCC 14579 produces only PB
and BB (bacillibactin), yet it possesses at least 10 genes encoding siderophore binding proteins (information of gene annotation in the B. cereus ATCC 14579 genome database in the NCBI).17 It has been demonstrated that the gene products YxeB, YfiY, FeuA, and FpuA/FatB, are a DFO/Fch, schizokinen, Ent/BB, and PB-binding proteins (FpuA, FatB), respectively.10 FctC was recently identified as a triferric tricitrate-binding protein.19 The FO/Fch-binding ability of the other less characterized siderophore-binding proteins of B. cereus, BC_2208, BC_4363,
79

BC_4416, and BC_5380, was assessed, and none of these proteins bind FO or Fch (Fig. A5-3). Thus, YxeB is the only DFO/Fch-binding protein as shown by these in vitro assays.
To confirm that YxeB is the only DFO/Fch-binding protein in vivo, the yxeB markerless mutant was constructed. Since yxeB and the downstream genes, BC_0382 and BC_0381, make an operon, only yxeB is disrupted in the constructed strain, TC111 (yxeB-), while preserving the downstream genes. Fig. A5-4A and B show the growth assay of TC111, TC129 (YxeB-L142) and TC128 (YxeB-S142) strains. This assay uses iron-limited minimum medium, but DFO can chelate Fe(III) from the medium even though the iron concentration is very low. The growth of TC129 and TC128 with DFO was better than the growth without DFO, indicating that both the strains can import and use FO. On the other hand, the growth of TC111 with DFO was not better than the growth without DFO, showing that the TC111 strain cannot use FO. This also shows that PB and BB produced during the experiment do not affect growth in these conditions.
To further assess whether TC111 can use FO and Fch or not, a disc diffusion assay was performed. In this experiment the cells should grow around a disc containing FO or Fch if the substrates can be utilized. As shown in Fig. A5-5, the wild-type strains, TC129 and TC128, grew in halos around the discs containing FO and Fch. However, TC111 did not grow around the discs with FO and Fch although the strain grew around a disc containing BB (the positive control substrate), indicating that it cannot use FO and Fch. Therefore, the in vivo growth assay and disc diffusion assay strongly suggest that yxeB is the sole FO/Fch-binding protein. The other SBPs including YfiY, FeuA, FpuA, FatB, and FctC are not associated with FO/Fch uptake. Moreover, Fe(III) coordinated with FO is not transferred to BB and PB produced by B. cereus under the iron-limited condition since the YxeB mutant, TC111, did not grow.
Cr-DFO and Ga-DFO are FO Analogs. Since Cr(III) is kinetically inert and will not
exchange from one siderophore to another on the experimental timescale,15,20 Cr-DFO was synthesized to probe the presence of metal exchange in the siderophore transport mechanism of YxeB. The affinity of YxeB for Cr-DFO was measured using the fluorescence quenching assay. The YxeB-L142 protein was quenched by Cr-DFO, and the quenching data were fit by Hyperquad to determine the Kd (Fig. 5-4B).18 The Kd for Cr-DFO was similar to the Kd for FO (Kd for Cr-DFO, 69.0 nM; Kd for FO, 38.8 nM, Table 1). The YxeB-S142 protein was also quenched by both substrates (Fig. 5-5D). The Kd’s for Cr-DFO and FO were respectively 98.9 nM and 29.1 nM (Table 5-1). Thus, Cr-DFO can be used as a FO analog, especially with YxeB-L142, as a metal-exchange probe.
To see if B. cereus ATCC 14579 can import Cr-DFO like FO, the amount of chromium derived from Cr-DFO in whole cells was measured using ICP (Inductively Coupled Plasma) elemental analysis. The wild-type strains, TC129 and TC128, could uptake Cr-DFO, whereas the yxeB- mutant, TC111 could not (Fig. S9A). Thus, YxeB can import the kinetically inert Cr-DFO.
80
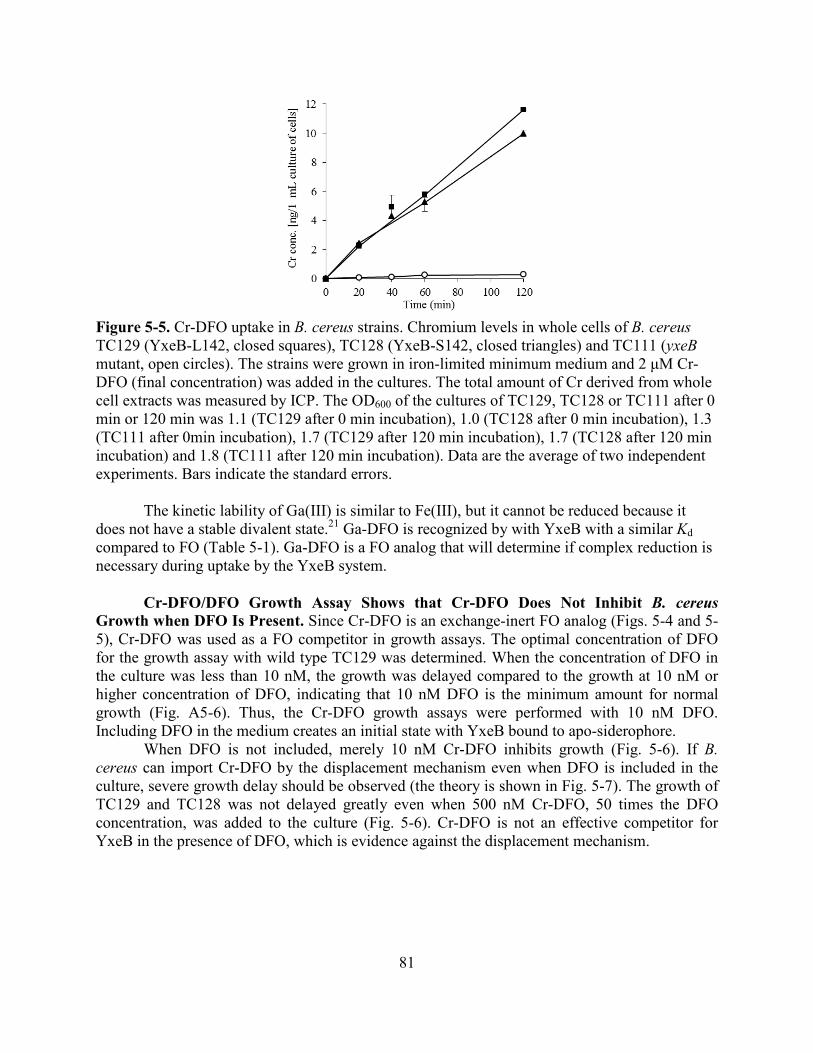
Figure 5-5. Cr-DFO uptake in B. cereus strains. Chromium levels in whole cells of B. cereus TC129 (YxeB-L142, closed squares), TC128 (YxeB-S142, closed triangles) and TC111 (yxeB mutant, open circles). The strains were grown in iron-limited minimum medium and 2 μM Cr-DFO (final concentration) was added in the cultures. The total amount of Cr derived from whole cell extracts was measured by ICP. The OD600 of the cultures of TC129, TC128 or TC111 after 0 min or 120 min was 1.1 (TC129 after 0 min incubation), 1.0 (TC128 after 0 min incubation), 1.3 (TC111 after 0min incubation), 1.7 (TC129 after 120 min incubation), 1.7 (TC128 after 120 min incubation) and 1.8 (TC111 after 120 min incubation). Data are the average of two independent experiments. Bars indicate the standard errors. The kinetic lability of Ga(III) is similar to Fe(III), but it cannot be reduced because it does not have a stable divalent state.21 Ga-DFO is recognized by with YxeB with a similar Kd compared to FO (Table 5-1). Ga-DFO is a FO analog that will determine if complex reduction is necessary during uptake by the YxeB system.
Cr-DFO/DFO Growth Assay Shows that Cr-DFO Does Not Inhibit B. cereus
Growth when DFO Is Present. Since Cr-DFO is an exchange-inert FO analog (Figs. 5-4 and 5-5), Cr-DFO was used as a FO competitor in growth assays. The optimal concentration of DFO for the growth assay with wild type TC129 was determined. When the concentration of DFO in the culture was less than 10 nM, the growth was delayed compared to the growth at 10 nM or higher concentration of DFO, indicating that 10 nM DFO is the minimum amount for normal growth (Fig. A5-6). Thus, the Cr-DFO growth assays were performed with 10 nM DFO. Including DFO in the medium creates an initial state with YxeB bound to apo-siderophore.
When DFO is not included, merely 10 nM Cr-DFO inhibits growth (Fig. 5-6). If B. cereus can import Cr-DFO by the displacement mechanism even when DFO is included in the culture, severe growth delay should be observed (the theory is shown in Fig. 5-7). The growth of TC129 and TC128 was not delayed greatly even when 500 nM Cr-DFO, 50 times the DFO concentration, was added to the culture (Fig. 5-6). Cr-DFO is not an effective competitor for YxeB in the presence of DFO, which is evidence against the displacement mechanism.
81

Figure 5-6. Cr-/apo-DFO growth assay of TC129 (A) and TC128 (B). The amounts of the substrates added in the medium (final concentration) are as follows: 10 nM DFO (closed black circles), 10 nM DFO and 10 nM Cr-DFO (1:1) (closed green diamonds), 10 nM DFO and 100 nM Cr-DFO (1:10) (closed red triangles), 10 nM DFO and 200 nM Cr-DFO (1:20) (closed blue circles), 10 nM DFO and 500 nM Cr-DFO (1:50) (closed pink squares), 10 nM Cr-DFO (open green diamonds), 50 nM Cr-DFO (open red triangles in panel B), 100 nM Cr-DFO (open red triangles in panel A), 250 nM Cr-DFO (open blue circles in panel A), 500 nM Cr-DFO (open pink squares in panel A). Data are the average of three independent experiments. Bars indicate the standard errors.
Figure 5-7. Theory of mechanism discrimination in the Cr-/apo-DFO growth assay. Various amounts of DFO and Cr-DFO are added to iron-limited minimum medium (A) with a small
(A) Growth curve using Cr-DFO/DFO [TC129] (B) Growth curve using Cr-DFO/DFO [TC128]
Addition of Cr-DFO only
Addition of Cr-DFO only
: DFO : Cr-DFO : FO
(A) Add Cr-DFO and DFO (B) A small amount of DFO chelates Fe
FO and Cr-DFO equally displace DFO
(C) Displacement
Fe derived from FO is selectively transferred to DFO
(D) Gram-positive Siderophore-Shuttle
Growth delayed by Cr-DFO import
Growth will not be affected since Cr-DFO is less imported
82

amount of DFO chelating iron from the medium, followed by the competition of Cr-DFO and FO uptake in the presence of DFO (B). If the YxeB protein uses the displacement mechanism, then Fe- and Cr-DFO are equally imported, resulting in the growth delay (C). If the protein uses the siderophore-shuttle mechanism, then FO is selectively imported by transferring iron from FO to the DFO:YxeB complex, resulting in the non-delayed growth (D). The putative permeases of YxeB are BC_0381 and BC_0382, and the ATPase is unknown.
In Vivo Cr-DFO/FO Uptake Assay Shows that YxeB Selectively Imports FO when
DFO Is Present. To observe if YxeB selects for FO over Cr-DFO when DFO is present in the culture, in vivo Cr-DFO/FO uptake assays were also performed (data in Fig. 5-8, the theory is shown in Fig. 5-9). In the experiment B. cereus produces BB and PB, however these siderophores do not affect the experiment because YxeB is the only FO/Cr-DFO-binding protein (Figs. S4, S7, S8). When 2 μM Cr-DFO was added to cultures of TC129 or TC128 containing 2 μM DFO, 5 nmol of chromium per 1 mL of cell culture was imported (closed squares in Fig. 3A and B). When 2 μM FO was added along with 2 μM Cr-DFO to the cultures of TC129 and TC128 containing 2 μM DFO, the amount of imported chromium was drastically reduced to 1 nmol of chromium per 1 mL of cell culture (triangles in Fig. 5-8A and B). Significantly, even with ten times lower FO concentration than Cr-DFO (0.2 μM FO, 1:10 FO:Cr-DFO) was added to the culture containing 2 μM DFO, the imported chromium was only 2.5 nmol in 1 mL of cell culture (circles in Fig. 5-8A and B) which does not approach the maximum 5 nmol of chromium imported per 1 mL of cell culture in the presence of 2 μM DFO (see squares in Fig. 5-8A and B). Thus, it is clear that the Cr-DFO uptake is disproportionately inhibited by the addition of FO when DFO is present in the culture. In other words, YxeB selectively imports FO over Cr-DFO, the exchange-inert analog, when DFO is present. Such a large selectivity would not be observed for the displacement mechanism and proves that metal exchange is critical to the uptake mechanism.
Figure 5-8. Cr-DFO/FO uptake assay in vivo. The cells of TC129 (A) or TC128 (B) were incubated in iron-limited minimum medium. After 2 μM DFO had been added and the cells had been incubated for 15 min, Cr-DFO (1 or 2 μM) and purified FO (0, 0.2, 0.5, or 2 μM) were added to the culture. After 0, 20, 40, 70, and 120 min incubation the cells were harvested and Cr amounts in the whole cells were measured by ICP as described in the Materials and Methods.
(A) TC129 with 2 μM DFO (B) TC128 with 2 μM DFO
2 μM Cr-DFO
2 μM Cr-DFO/ 2 μM FO (Cr-DFO:FO = 1:1)
2 μM Cr-DFO/ 0.5 μM FO (Cr-DFO:FO = 4:1)
2 μM Cr-DFO/ 0.2 μM FO (Cr-DFO:FO = 10:1)
1 μM Cr-DFO
83

The optical density at 600 nm of the cultures after 0 min or 120 min incubation was 1.2-1.4 (TC129 after 0 min incubation), 1.2-1.3 (TC128 after 0 min incubation), 1.8-2.0 (TC129 after 120 min incubation), and 1.8-1.9 (TC128 after 120 min incubation). The Cr-DFO and FO concentrations used with 2 μM DFO are as follows; 2 μM Cr-DFO (closed squares), 2 μM Cr-DFO and 2 μM FO (closed triangles), 2 μM Cr-DFO and 0.5 μM FO (closed diamonds), 2 μM Cr-DFO and 0.2 μM FO (closed circles), 1 μM Cr-DFO (open squares). Data are the average of two independent experiments. Bars indicate the standard errors.
Figure 5-9. Theory of the in vivo Cr/FO competition assay. DFO (2 μM, final concentration) is added to iron-limited minimum medium in order to provide an excess of DFO in the medium and to saturate YxeB with DFO (A). Cr-DFO (2 μM or 1 μM, final concentrations) and various amounts of purified FO (0, 0.2, 0.5 and 2 μM, final concentrations) are added to the culture to make the competition of Cr-DFO and FO uptake when DFO is bound to the YxeB protein (B). If YxeB uses the displacement system, then FO and Cr-DFO are equally imported, and the imported amount of chromium is only proportionately inhibited by the addition of FO (C). If the protein uses the siderophore-shuttle mechanism, then FO is selectively imported by transferring Fe from FO to the DFO:YxeB complex, resulting in disproportional inhibition of chromium uptake by addition of FO (D).
In Vitro Cr-DFO/FO Competition Assay Demonstrates that YxeB Selectively Binds
FO when DFO Is Present. It is possible that the substrate selectivity by YxeB occurs in vitro since B. cereus selectively imports FO when DFO is present (Fig. 5-8). To confirm the possibility, YxeB protein (YxeB-L142-6×His or YxeB-S142-6×His), DFO, and Ni-agarose beads were mixed. A mixture of Cr-DFO/FO was added to the sample, the beads were pelleted, and the chromium and iron levels in the pellet versus supernatant were measured using ICP. As a negative control, Ni-agarose beads without protein did not bind iron or chromium (triangles in Fig. 5-10A and B) and the complexes of the YxeB-L142 and YxeB-S142 proteins contained iron from FO as the major substrate (closed circles in Fig. 5-10B and D, respectively) but very little
Fe derived from FO isselectively transferred toDFO
(D) Gram-positive Siderophore-shuttle
FO and Cr-DFO equally displaceDFO
(C) Displacement
(A) YxeB binds DFO (B) Add Cr-DFO and FO Cr-DFO uptake is not drastically affected by addition of FO
Cr-DFO import is strongly inhibited by addition of FO
: DFO : Cr-DFO : FO
84

chromium from Cr-DFO. Thus, the YxeB protein selectively binds FO over Cr-DFO when DFO is initially bound to the protein, and the bound FO was generated by metal exchange.
Figure 5-10. In vitro Cr-DFO/FO competition assay using YxeB-L142-6×His (A and B) and YxeB-S142-6×His (C and D). After DFO had been bound to the YxeB proteins, Cr-DFO and FO were added to the samples and the bound or unbound amounts of Cr-DFO and FO to YxeB were then measured by ICP as described in Materials and Methods. (A and C) Amounts of bound (closed squares) and unbound (open squares) chromium derived from Cr-DFO. (B and D) Amounts of bound (closed circles) and unbound (open circles) iron derived from FO. The amounts of chromium and iron bound to Ni-agarose beads without YxeB are shown in closed triangles (control experiment). Data represent the average of three independent experiments. Bars are standard errors. To further confirm that YxeB facilitates metal exchange, the above experiment was repeated with FO, Cr-DFO, and Ga-DFO being added to the DFO loaded YxeB. Fe(III) and Ga(III) were both transferred to the YxeB-bound DFO while Cr(III) was not (Fig. 5-11). The transfer of Ga(III) shows that reduction is not necessary for the metal exchange in this context. The transfer depends on kinetic lability because Ga(III) transfer was nearly identical to the Fe(III) transfer, and inert Cr(III) was not transferred.
(A) Cr amount (YxeB-L142-6×His) (B) Fe amount (YxeB-L142-6×His)
(C) Cr amount (YxeB-S142-6×His) (D) Fe amount (YxeB-S142-6×His)
85
Figure 5-11. In vitro Ga-/Cr-DFO/FO competition assay using YxeB-L142-6×His (A) and YxeB-S142-6×His (B). The experiment was performed the same as for Figure 5-10 except Ga-DFO was added along with Cr-DFO and FO. The amount of bound iron (red squares), gallium (green triangles), and chromium (blue circles) derived from the respective metal-siderophore complex as determined by ICP is displayed.
Discussion
YxeB Possesses a Gram-Positive Siderophore-Shuttle System. Growth assays of TC128 (YxeB-S142) and TC129 (YxeB-L142) using Cr-DFO show that addition of only a small amount of Cr-DFO (10 nM) delayed the growth of both strains (Fig. 5-6A and B). However, the addition of DFO (10 nM) recovered the growth of both strains even though excess Cr-DFO (500 nM) was in the culture (Fig. 5-6A and B). Since the Kd’s of the YxeB-L142 and YxeB-S142 proteins for FO are similar to the Kd’s of the proteins for Cr-DFO (Table 5-1), the addition of Cr-DFO should delay the growth if the strains can import both of the substrates equally by the displacement mechanism (see Fig. 5-7). The in vivo Cr-DFO/FO uptake assay demonstrates that addition of FO with DFO strongly inhibited the Cr-DFO uptake even though ten times less FO (0.2 μM) than Cr-DFO (2 μM) was added to the culture (Fig. 5-8). Since YxeB is the only SBP responsible for FO and Cr-DFO binding and uptake (Figs. A5-4,5, and 6), these results show that YxeB selectively imports FO over Cr-DFO. The key difference between FO and Cr-DFO is that Fe(III) exchanges between siderophores while Cr(III) does not. The selectivity for FO shows that metal-exchange is important and that YxeB participates in a Gram-positive siderophore-shuttle mechanism when DFO is present. However, this does not eliminate the possibility that YxeB uses a displacement mechanism in vivo because Cr-DFO uptake was strongly inhibited but not completely eliminated by addition of 2 μM FO in the presence of DFO (triangles in Fig. 5-8). This possibility was eliminated by the next study.
The in vitro Cr-DFO/FO competition assay shows that YxeB binds FO and not Cr-DFO when initially loaded with DFO (Fig. 5-10) even when the Kd of the YxeB-S142 protein for Cr-DFO is nearly the same as the Kd for FO (Table 5-1). In the competition assay, 1 μM the YxeB-S142 protein and a 20-fold excess of DFO (20 μM) were used, and it is calculated from the Kd that more than 99% of the protein is bound to DFO. Since only 1 μM FO and 1 μM Cr-DFO were added to the assay solution and YxeB is saturated with DFO, then the Gram-positive siderophore-shuttle mechanism (Fig. 5-2C) or displacement mechanism (Fig. 5-2D) is
(A) YxeB-L142-6xHis (B) YxeB-S142-6xHis
FO/DFO
Ga-DFO/DFO
Cr-DFO/DFO
FO/DFO
Ga-DFO/DFO
Cr-DFO/DFO
86

responsible for any metal bound to the protein. YxeB-S142 almost exclusively binds iron from FO in the assay (Fig. 5-10D), and the metal-exchange selectivity indicates that the protein uses the Gram-positive siderophore-shuttle mechanism instead of the displacement mechanism. Moreover, YxeB-L142 also uses the Gram-positive siderophore-shuttle system since the protein binds DFO and FO (Fig. A5-2B and F) like YxeB-S142 (Fig. A5-2C and G), and the in vitro Cr-DFO/FO competition assay shows that the protein binds FO but not Cr-DFO (Fig. 5-10A and B). Therefore, both variants of YxeB predominately use the Gram-positive siderophore-shuttle mechanism over the displacement mechanism.
Siderophore Recognition by YxeB. Fluorescence intensity of the YxeB-L142 protein
was increased by the addition of DFO or dFch although the protein fluorescence was quenched by addition of FO and Fch (Fig. 5-4A and C). Nano ESI-MS analysis of the protein:dFch and protein:Fch complexes (Fig. A5-1) and RP-HPLC analysis of the protein:DFO and protein:FO (Fig. A5-2) show that the protein binds all of the substrates. Moreover, the shapes of the fluorescence quenching curves of the YxeB-S142 protein for DFO and dFch were different from the shapes for FO and Fch although the calculated Kd’s for their substrates are not different (Fig. 5-4D and E and Table 5-1). The difference in protein fluorescence points to a difference in protein conformation dependent on whether the bound substrate is an apo- or Fe-siderophore. Since the yxeB gene (BC_0383) makes an operon with putative permease genes, BC_0382 and BC_0381,10 the conformation change of YxeB may allow the permeases to distinguish between Fe- and apo-siderophores and import only Fe-siderophores.
Comparison between the Siderophore-Shuttle Systems in Gram-Positive and Gram-
Negative Bacteria. Previously, Stintzi et al. demonstrated that an OMT in Aeromonas hydrophila is a siderophore-shuttle protein.14 From the siderophore-shuttle model in Gram-negative bacteria, Fe(III) exchange seems to occur in the protein (the siderophore-binding pocket is surrounded by a β-barrel and extracellular loops).14 By contrast, SBPs in Gram-positive bacteria have the siderophore binding pocket at the surface of the protein, based on the structures of the B. subtilis FeuA:Fe-enterobactin complex and Staphylococcus aureus HtsA:Fe-staphyloferrin A complex.22,23 Thus, the mechanisms of iron exchange between apo-siderophore and Fe-siderophore in Gram-negative OMT like A. hydrophila OMT and Gram-positive SBP like B. cereus YxeB may differ. Here we show that YxeB has a Gram-positive siderophore-shuttle mechanism.
The E. coli periplasmic SBP FhuD binds FO, gallichrome (a Fch analog), and Fe-coprogen, and the substrate-binding pocket is large in order to recognize and fit the different substrates.24,25 Since the YxeB protein (YxeB-L142 and YxeB-S142) binds DFO/FO and dFch/Fch and Gram-negative periplasmic SBPs and Gram-positive lipoprotein SBPs are similar (see Fig. 5-1), it is possible that the YxeB protein also has a large substrate-binding pocket to exchange iron from FO to DFO bound to the protein. The complex analysis of the YxeB-L142 protein and dFch/Fch by ESI-MS suggests it is possible that the protein binds two molecules of dFch and Fch (Fig. A5-1). Thus, the protein would facilitate iron exchange, which is first order in both Fe- and apo-siderophore, by increasing the local concentration of the apo-siderophore.15
Significantly, FO and/or Fch-binding proteins are widely conserved in Gram-positive bacteria although many bacteria do not produce DFO or dFch. B. subtilis possesses a FO-binding protein, YxeB, and a Fch-binding protein, FhuD.6 S. aureus FhuD1 and FhuD2 and Listeria
87

monocytogenes FhuD bind FO and Fch.26,27 Streptococcus pnuemoniae also possesses a FO/Fch-binding protein, FhuD.28 In Gram-negative bacteria not only A. hydrophila but also E. coli and Salmonella typhimurium enterica have OMTs for FO/Fch import.14,29,30 Possibly all these FO/Fch-binding proteins use a Gram-positive or -negative siderophore-shuttle mechanism if they can also bind DFO/dFch.
Some SBPs have been co-crystallized with Fe-siderophores. It is known that several SBPs in Gram-positive bacteria and periplasmic SBPs in Gram-negative bacteria such as B. subtilis FeuA, S. aureus HtsA and Vibrio cholerae ViuP recognize oxygen atoms that coordinate with iron, and the siderophores seem to nearly fill the binding pocket.22,23,31 It is possible that apo-siderophores also fill the binding pocket. However, there are few structural complexes of apo-siderophores in siderophore-binding proteins (including Gram-negative OMTs), including a complex of E. coli FecA and dicitrate,3 although several SBPs and OMTs can bind both Fe-siderophores and apo-siderophores. We hope to characterize an apo-siderophore:SBP or apo-siderophore:OMT complex structure to understand why and how SBPs and OMTs bind apo-siderophores. From this study we conclude that increasing the local ligand concentration in the apo-siderophore:SBP (OMT) complex facilitates iron exchange and hence apo-siderophore binding plays an important role in iron uptake (see Fig. 5-12) in siderophore-shuttle systems of both Gram-negative and Gram-positive bacteria.
Fig. 5-12. Model of the Gram-positive siderophore-shuttle mechanism of YxeB. YxeB is initially bound to an apo-siderophore. (1) A Fe-siderophore approaches YxeB and rests near the binding pocket occupied by the apo-siderophore. At this step two pathways are possible. Steps 2-4 are the shuttle pathway. (2) Iron exchanges from the Fe-siderophore to the apo-siderophore in the binding pocket. The protein facilitates this step by increasing the local concentration of the entering ligand and the ferric complex. (3) The new Fe-siderophore (B) is transported. (4) The receptor is bound to an apo-siderophore. Steps 5-7 are the displacement pathway. (5) The Fe-
Permease
Fe-SiderophoreReceptor bound to apo-siderophore
AB
A
B
1 DisplacementCycle
Displacement
5
7
AB
B
A
6
B
A
B
A
3 ShuttleCycle
Fe3+ Exchange
2
4
k2 > k5
88

siderophore displaces the apo-siderophore and occupies the binding pocket. (6) The original Fe-siderophore (A) is transported. (7) The receptor is bound to an apo-siderophore. In the Gram-positive siderophore shuttle both pathways operate but the shuttle pathway is preferred. Methods Synthesis and Purification of FO. FO was synthesized by stirring one equivalent of desferrioxamine methansulfonate (0.25 g, 0.38 mmol) and FeCl3 (0.062, 0.38 mmol) in water at room temperature. Three equivalents of KOH (0.064, 1.14 mmol) were added, and the reaction stirred overnight. The deep red reaction mixture was concentrated using rotary evaporation and applied to a sodium cation exchange column (Bio-Rad AG 50W-X4 resin). One red band eluted with 0.3 N NaCl, and the red fractions were desalted by applying them to a BioGel P-2 column and eluting with water. FO was isolated from the red fractions as a fine red solid (80 mg) by rotary evaporation: ESI-MS (positive mode) m/z calcd for (M+H) C25H46N6O8Fe 614.2721, found 614.2732; Anal. Calcd for C25H45N6O8Fe • HCl • 4H2O: C, 41.59; H, 7.54; N, 11.64. Found: C, 41.88; H, 7.53; N, 11.42. Cr-DFO was synthesized and purified using the procedure of Leong and Raymond.20 Ga-DFO. Ga(acac)3 (0.18 g, 0.5 mmol), desferrioxamine methanosulfonate (0.30 g, 0.45 mmol), and KOH (0.11 g, 1.83 mmol) were stirred in methanol overnight. Water was added and the solution was acidified with HCl(aq). The solvent was removed and the residue was dissolved in MeOH/EtOH. A white precipitate formed which was removed by filtration. The precipitation and filtration were repeated to give the title compound (0.219 g, 76% yield): ESI-MS (positive mode) m/z calcd for (M+H) C25H46N6O8Ga 627.2627, found 627.2625; Anal. Calcd (Found) for C25H45N6O8Ga • HCl • KCl • 2H2O • 2MeOH: C, 38.67 (38.42); H, 6.97 (6.91); N, 10.02 (10.10). AcDFO was synthesized following the procedure of Ihnat et al.32 The 1H NMR spectrum matches the literature characterization. ESI-MS (pos. mode) for C27H51O9N6 (M+H) calc’d for 603.3712, found 603.3719; Anal. Calcd (Found) for C27H50N6O9: C, 53.80 (53.86); H, 8.36 (8.35); N, 13.94 (13.97). Fluorescence Quenching Experiment. Fluorescence quenching experiment of YxeB-L142-6×His and YxeB-S142-6×His for DFO, FO, dFch and Fch was performed as described previously.10,19 The dissociation constants were calculated fitting the fluorescence quenching data with a one-site binding model by Hyperquad which uses non-linear least-squares regression analysis.18
Fluorescence quenching of YxeB-L142-6×His and YxeB-S142-6×His for DFO (desferrioxiamine B), FO (ferrioxamine), Cr-DFO, dFch (desferrichrome) and Fch (ferrichrome) was measured with a Varian Cary Eclipse fluorescence spectrophotometer using excitation wavelength λexc = 280 nm, emission wavelength λem = 330-370 nm, excitation and emission slits of 20 nm and 10 nm, and PMT (photomultiplier tube) detector voltage of 695 V (YxeB-L142-6×His) or 665 V (YxeB-S142-6×His). The other proteins, BC_2208, BC_4363, BC_4416 and BC_5380, were purified as described previously,19 and the fluorescence quenching was measured with a Varian Cary Eclipse fluorescence spectrophotometer using excitation
89

wavelength λexc = 280 nm, emission wavelength λem = 320-370 nm, excitation and emission slits of 10 nm and 5 nm, respectively, and PMT detector voltage of 685 V (for BC_2208), excitation and emission slits of 20 nm and 10 nm, respectively, and PMT detector voltage of 780 V (for BC_4363), excitation and emission slits of 20 nm and 10 nm, respectively, and PMT detector voltage of 720 V (for BC_4416), and excitation and emission slits of 20 nm and 10 nm, respectively, and PMT detector voltage of 750 V (for BC_5380).
Fluorescence quenching experiments of BC_2208, BC_4363, BC_4416, and BC_5380 with FO, Fch, and Fe-BB were performed using the following procedures. Twenty µM FeCl3 and 20 µM DFO, 20 µM dFch or 20 µM apo-BB were mixed in TBS buffer [25 mM Tris-HCl, 8 g/L NaCl, 0.2 g/L KCl (pH 7.4)] (for BC_4363, BC_4416 and BC_5380) or 4-methylmorpholine-BS buffer [25 mM 4-methylmorpholine-HCl, 8 g/L NaCl, 0.2 g/L KCl (pH 7.4)] (for BC_2208). The solution was equilibrated for 2 hours at room temperature. For other ligand solutions, 20 µM DFO, 20 µM Cr-DFO and 20 µM dFch were mixed in TBS buffer. One hundred nM YxeB-L142-6×His, YxeB-S142-6×His, BC_4416, BC_4363 or BC_5380 (final concentration) was dissolved in 3 mL of TBS/5% DMSO containing 32 µg/mL ubiquitin (Sigma-Aldrich or Boston Biochem). BC_2208 (100 nM, final concentration) was dissolved in 3 mL of 4-methylmorpholine-BS buffer/5% DMSO containing 32 µg/mL ubiquitin since the protein was quenched by addition of TBS buffer without any ligand.19 The fluorescence quenching of the proteins with the ligand solutions was monitored by fluorescence spectroscopy. The dissociation constants were calculated using the fluorescence quenching data by Hyperquad with a one-site binding model which uses a non-linear least-squares regression analysis.18 YxeB-L142-6×His and YxeB-S142-6×His Binding Assay for DFO and FO Using RP-HPLC. The complexes of YxeB-L142-6×His and DFO or FO were analyzed by RP-HPLC. The YxeB-L142-6×His protein (1 μM, final concentration) and 100 μL of Ni Sepharose 6 Fast Flow agarose beads were mixed in 10 mL of TBS buffer and the mixture was then gently shaken for 2 h at room temperature to combine the protein and the beads. As a negative control, only 100 μL of the agarose beads in 10 mL of TBS buffer was also gently shaken for 2 h. After 20 μM DFO or purified FO had been added to the mixture, the sample was gently shaken for 10 min at room temperature. Five mL of the sample was collected and centrifuged, and the pellet (the beads fraction) was then washed with TBS buffer three times. The protein and the substrate (DFO or FO) bound to the protein were eluted by addition of 0.1% (v/v) TFA. The elution was analyzed by RP-HPLC with a Luna 5μ C18 column (150 × 4.60 mm 5 micron, Phenomenex) whether the protein binds the substrates or not (flow rate, 1 mL/min; monitoring wavelength 220 nm). Elution buffer A and B for RP-HPLC are 0.05% TFA in water and 100% CH3CN, respectively. The elution was performed for 50 min with a linear gradient of buffer B from 0% to 25%. Disc Diffusion Assay. The disc diffusion assay was performed as described by Zawadzka et al. (Zawadzka et al.-PNAS).9 B. cereus TC128 and TC129 (wild-type) and a yxeB markerless strain, TC111 were incubated in LB medium at 37 ˚C. When the growth reached late vegetative phase, the cells were collected from 500 µL of the culture by centrifuge and washed with TE buffer [10 mM Tris-HCl, 1 mM EDTA (pH 8.0)] three times to remove iron and then washed with sterilized milli-Q water three times. The cells were resuspended in 50 mL of melting 0.7% agar solution (42 ˚C) and 3 mL of the resuspension was overlaid on LB plates containing 500 µM 2.2'-dipyridyl as a chelator for Fe(II). After the overlaid agarose resuspension had become solid,
90

sterile paper discs [blank paper discs (6 mm diameter), BD biosciences] were put on the plates and 10 pmol of DFO, apo-ferrichrome (dFch), apo-bacillibactin (apo-BB) (positive control) in DMSO or DMSO only (negative control) was infused. The plates were incubated at 37 ˚C for 12 hours and photographs of the plate were recorded. Growth Assay Using DFO and Cr-DFO. B. cereus TC129, TC128 and yxeB markerless strains (TC111) were incubated in LB medium at 37 ˚C for 12 hours. The cells were collected from 1 mL of the culture by centrifuge and washed with TE (10 mM Tris-HCl [pH 8.0]/ 1 mM EDTA) buffer three times and then washed with milli-Q water three times to eliminate iron. The cells were resuspended in 1 mL of milli-Q, and 25 μL of the resuspension and 975 μL of milli-Q were then mixed. Five μL of the resuspension was inoculated in 195 μL of iron-limited minimum medium [5 g/L glucose, 3 g/L Difco bacto casamino acid, 1 g/L (NH4)2HPO4, 2.5 g/L K2HPO4, 2.5 g/L KH2PO4, 40 µM nicotinic acid, 100 µM thiamine, 36 µM MnSO4, 0.3 µM ZnSO4, 830 µM MgSO4 and 0.05 g/L tryptophan] containing 250 µM 2.2'-dipyridyl and with or without various amounts of DFO and/or Cr-DFO using a 96-well microplate.33 The samples were incubated in a microplate reader (SpectraMax Plus384 microplate reader, Molecular Devices) at 37 ˚C and the absorbance of the cell cultures at 600 nm was monitored. In this assay the DFO in the iron-limited minimum medium can chelate Fe(III) even though the medium has a very low concentration of Fe(III). Measurement of Cr-DFO Import in Cells. Cr-DFO import in B. cereus TC129, TC128 and yxeB markerless mutant were measured by ICP using an Optima 7000 DV (PerkinElmer). In Vivo Cr-DFO/FO Uptake Assay. B. cereus TC129 and TC128 strains were incubated in iron-limited minimum medium at 37 ˚C. After 2 μM DFO (final concentration) had been added to the culture, 1 or 2 μM Cr-DFO and 0, 0.2, 0.5, or 2 μM purified FO were added to the culture and the culture was harvested after 0, 20, 40, 70, and 120 min incubation, followed by centrifuging the samples. The pellets were used for measuring the imported Cr amounts. Competition Assay Using FO and Cr-DFO In Vitro. One μM YxeB-L142-6×His or YxeB-S142-6×His (final concentration), 20 μM DFO (final concentration), and 100 μL solution of Ni Sepharose 6 Fast Flow agarose beads (Sigma-Aldrich) were mixed in TBS buffer (pH 7.4) and the mixture was gently shaken for 2 h at room temperature. One μM FO and 1 μM Cr-DFO (final concentration) were added to the sample, and the sample was gently shaken. After 0, 5, 10, 20, and 30 min shaking, the sample was collected and centrifuged. The amounts of chromium and iron in the supernatant and pellet were measured by ICP using an Optima 7000 DV (PerkinElmer). The same steps were repeated with 0.2 μM FO, Cr-DFO, and Ga-DFO were added. After shaking the appropriate time, the samples were centrifuged and the metal content of the pellet was measured by ICP. Permission. This chapter was adapted with permission of the coauthors, who retain copyright, from Fukushima, T.; Allred, B. E.; Sia, A. K.; Nichiporuk, R.; Andersen, U. N.; Raymond, K.N. Proc. Natl. Acad. Sci. U.S.A. 2013, 110, 13821–13826.
91
References (1) Byers, B. R.; Arceneaux, J. E. L. In Iron Transport and Storage in Microorganisms,
Plants, and Animals; Sigel, A.; Sigel, H., Eds.; Metal Ions in Biological Systems; Marcel Dekker: New York, New York, 1998; Vol. 35, pp. 37–66.
(2) Braun, V.; Hantke, K.; Koster, W. In Iron Transport and Storage in Microorganisms, Plants, and Animals; Sigel, A.; Sigel, H., Eds.; Metal Ions in Biological Systems; Marcel Dekker: New York, New York, 1998; Vol. 35, pp. 67–145.
(3) Yue, W.; Grizot, S.; Buchanan, S. J. Mol. Biol. 2003, 332, 353–368. (4) Eisenhauer, H. A.; Shames, S.; Pawelek, P. D.; Coulton, J. W. J. Biol. Chem. 2005, 280,
30574–30580. (5) Koebnik, R. Trends Microbiol. 2005, 13, 343–347. (6) Ollinger, J.; Song, K.-B.; Antelmann, H.; Hecker, M.; Helmann, J. D. J. Bacteriol. 2006,
188, 3664–3673. (7) Hoegy, F.; Celia, H.; Mislin, G. L.; Vincent, M.; Gallay, J.; Schalk, I. J. J. Biol. Chem.
2005, 280, 20222 –20230. (8) Schalk, I. J.; Kyslik, P.; Prome, D.; van Dorsselaer, A.; Poole, K.; Abdallah, M. A.; Pattus,
F. Biochemistry 1999, 38, 9357–9365. (9) Zawadzka, A. M.; Kim, Y.; Maltseva, N.; Nichiporuk, R.; Fan, Y.; Joachimiak, A.;
Raymond, K. N. Proc. Natl. Acad. Sci. U.S.A. 2009, 106, 21854 –21859. (10) Zawadzka, A. M.; Abergel, R. J.; Nichiporuk, R.; Andersen, U. N.; Raymond, K. N.
Biochemistry 2009, 48, 3645–3657. (11) Van den Berg, B. J. Biol. Chem. 2012, 287, 41044–41052. (12) Boorsma, A.; van der Rest, M. E.; Lolkema, J. S.; Konings, W. N. J. Bacteriol. 1996, 178,
6216–6222. (13) Krom, B. P.; Warner, J. B.; Konings, W. N.; Lolkema, J. S. J. Bacteriol. 2000, 182, 6374–
6381. (14) Stintzi, A.; Barnes, C.; Xu, L.; Raymond, K. Proc. Natl. Acad. Sci. U.S.A. 2000, 97,
10691–10696. (15) Cotton, F. A.; Wilkinson, G. Advanced Inorganic Chemistry: A Comprehensive Text; John
Wiley & Sons: New York, 1988. (16) Tufano, T. P.; Raymond, K. N. J. Am. Chem. Soc. 1981, 103, 6617–6624. (17) Hotta, K.; Kim, C.-Y.; Fox, D. T.; Koppisch, A. T. Microbiology (Reading, U.K.) 2010,
156, 1918–1925. (18) Gans, P.; Sabatini, A.; Vacca, A. Talanta 1996, 43, 1739–1753. (19) Fukushima, T.; Sia, A. K.; Allred, B. E.; Nichiporuk, R.; Zhou, Z.; Andersen, U. N.;
Raymond, K. N. Proc. Natl. Acad. Sci. U. S. A. 2012, 109, 16829–16834. (20) Leong, J.; Raymond, K. N. J. Am. Chem. Soc. 1975, 97, 293–296. (21) Borgias, B.; Hugi, A. D.; Raymond, K. N. Inorg. Chem. 1989, 28, 3538–3545. (22) Peuckert, F.; Ramos-Vega, A. L.; Miethke, M.; Schwörer, C. J.; Albrecht, A. G.;
Oberthür, M.; Marahiel, M. A. Chem. Biol. 2011, 18, 907–919. (23) Grigg, J. C.; Cooper, J. D.; Cheung, J.; Heinrichs, D. E.; Murphy, M. E. P. J. Biol. Chem.
2010, 285, 11162–11171. (24) Clarke, T. E.; Ku, S. Y.; Dougan, D. R.; Vogel, H. J.; Tari, L. W. Nat. Struct. Biol. 2000,
7, 287–291.
92

(25) Clarke, T. E.; Braun, V.; Winkelmann, G.; Tari, L. W.; Vogel, H. J. J. Biol. Chem. 2002, 277, 13966–13972.
(26) Sebulsky, M. T.; Heinrichs, D. E. J. Bacteriol. 2001, 183, 4994–5000. (27) Xiao, Q.; Jiang, X.; Moore, K. J.; Shao, Y.; Pi, H.; Dubail, I.; Charbit, A.; Newton, S. M.;
Klebba, P. E. Mol. Microbiol. 2011, 80, 1581–1597. (28) Pramanik, A.; Braun, V. J. Bacteriol. 2006, 188, 3878–3886. (29) Sauer, M.; Hantke, K.; Braun, V. Mol. Microbiol. 1990, 4, 427–437. (30) Kingsley, R. A.; Reissbrodt, R.; Rabsch, W.; Ketley, J. M.; Tsolis, R. M.; Everest, P.;
Dougan, G.; Bäumler, A. J.; Roberts, M.; Williams, P. H. Appl. Environ. Microbiol. 1999, 65, 1610–1618.
(31) Li, N.; Zhang, C.; Li, B.; Liu, X.; Huang, Y.; Xu, S.; Gu, L. J. Biol. Chem. 2012, 287, 8912–8919.
(32) Ihnat, P. M.; Vennerstrom, J. L.; Robinson, D. H. J. Pharm. Sci. 2000, 89, 1525–1536. (33) Dertz, E. A.; Stintzi, A.; Raymond, K. N. J. Biol. Inorg. Chem.. 2006, 11, 1087–1097.
93
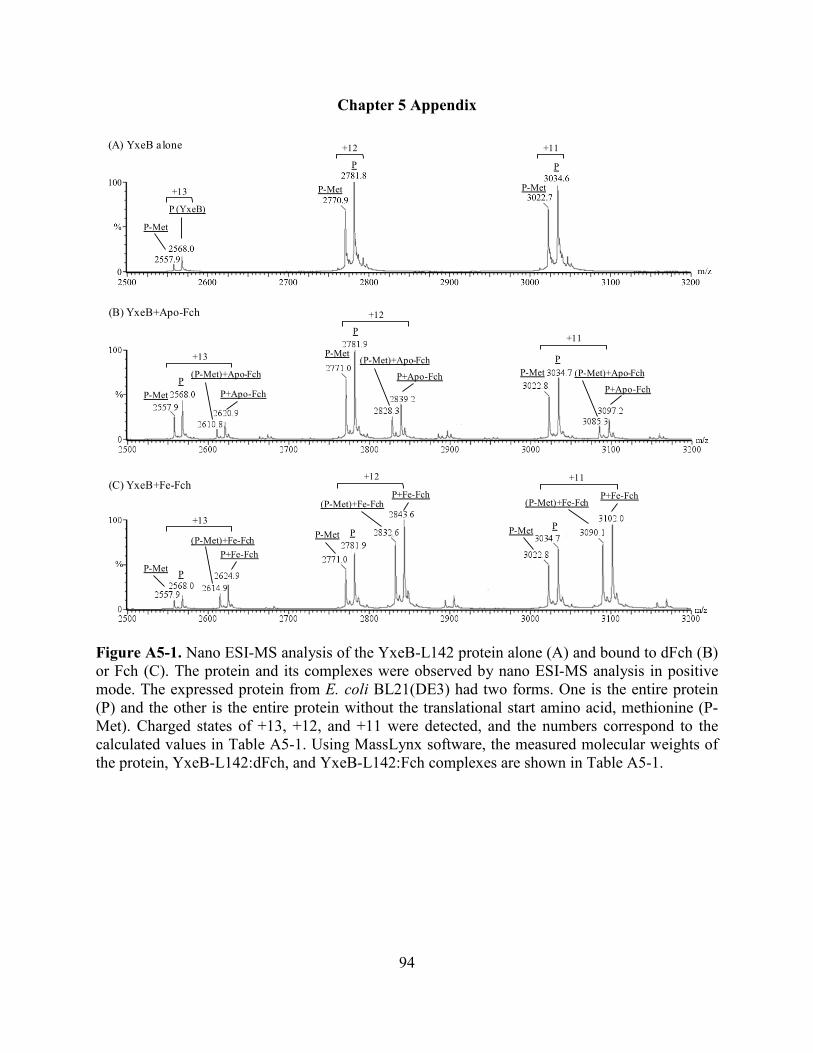
Chapter 5 Appendix
Figure A5-1. Nano ESI-MS analysis of the YxeB-L142 protein alone (A) and bound to dFch (B) or Fch (C). The protein and its complexes were observed by nano ESI-MS analysis in positive mode. The expressed protein from E. coli BL21(DE3) had two forms. One is the entire protein (P) and the other is the entire protein without the translational start amino acid, methionine (P-Met). Charged states of +13, +12, and +11 were detected, and the numbers correspond to the calculated values in Table A5-1. Using MassLynx software, the measured molecular weights of the protein, YxeB-L142:dFch, and YxeB-L142:Fch complexes are shown in Table A5-1.
P-Met
P (YxeB)
P-Met
P
P-Met
P
(A) YxeB alone
+13
+12 +11
(B) YxeB+Apo-Fch
P-MetP
+13
(P-Met)+Apo-Fch
P+Apo-Fch
P-Met
P
(P-Met)+Apo-Fch
P+Apo-Fch
+12
P-MetP
(P-Met)+Apo-Fch
P+Apo-Fch
+11
(C) YxeB+Fe-Fch
P-Met P
+13
(P-Met)+Fe-FchP+Fe-Fch
P-Met P
+12
(P-Met)+Fe-FchP+Fe-Fch
P-Met P
+11
(P-Met)+Fe-FchP+Fe-Fch
94

Table A5-1. Calculated molecular weights of YxeB-L142-6×His and its apo- and Fch complexes derived from nano ESI-MS analysis.
Protein-substrate complex YxeB (P) P:dFch P:Fch YxeB-Met (P-Met)
P-Met:dFch P-Met:Fch
Theoretical molecular weight (Da) 33,371.1 34,058.4 34,111.3 33,240.1 33,927.4 33,980.3 Calculated molecular weight using MassLynx software (Da)
YxeB only [Fig. S3A] 33,369.9 NCa NCa 33,239.1 NCa NCa YxeB + dFch [Fig. S3B] 33,370.5 34,058.5 NCc 33,239.5 33,927.3 NCa YxeB + Fch [Fig. S3C] 33,370.6 NCa 34,110.9 33,239.5 NCa 33,980.0
Charge states of nano ESI-MS +11 ([M+11H]11+) Theoretical 3,034.7 3,097.2 3,102.0 3,022.8 3,085.3 3,090.1 +11 ([M+11H]11+) Observed
YxeB only [Fig. S3A] 3,034.6 NDb NDb 3,022.7 NDb NDb YxeB + dFch [Fig. S3B] 3,034.7 3,097.2 NDb 3,022.8 3,085.3 NDb YxeB + Fch [Fig. S3C] 3,034.7 NDb 3,102.0 3,022.8 NDb 3,090.1
+12 ([M+12H]12+) Theoretical 2,781.9 2,839.2 2,843.6 2,771.0 2,828.3 2,832.7 +12 ([M+12H]12+) Observed
YxeB only [Fig. S3A] 2,781.8 NDb NDb 2,770.9 NDb NDb YxeB + dFch [Fig. S3B] 2,781.9 2,839.2 NDb 2,771.0 2,828.3 NDb YxeB + Fch [Fig. S3C] 2,781.9 NDb 2,843.6 2,771.0 NDb 2,832.6
+13 ([M+13H]13+) Theoretical 2,568.0 2,620.9 2,624.9 2,557.9 2,610.8 2,614.9 +13 ([M+13H]13+) Observed
YxeB only [Fig. S3A] 2,568.0 NDb NDb 2,557.9 NDb NDb YxeB + dFch [Fig. S3B] 2,568.0 2,620.9 NDb 2,557.9 2,610.8 NDb YxeB + Fch [Fig. S32C] 2,568.0 NDb 2,624.9 2,557.9 NDb 2,614.9
aNC is not calculated using MassLynx software since no peaks were detected by nano ESI-MS. bND is not detected by nano ESI-MS.
95

Figure A5-2. YxeB-L142-6×His and YxeB-S142-6×His binding assays using RP-HPLC. After Ni-agarose beads alone (as a negative control) or the beads and YexB-L142 mixture had been shaken, DFO or FO was added to the samples. The beads-only (control) or the beads-protein
(A) DFO (12 nmol)
(B) DFO:YxeB-L142-6×His(5 nmol of the protein was applied)
(D) DFO and Ni-agarose beads mixture(negative control)
DFO
(E) FO (12 nmol)
(F) FO:YxeB-L142-6×His(5 nmol of the protein was applied)
(H) FO and Ni-agarose beads mixture (negative control)
FO
(C) DFO:YxeB-S142-6×His (5 nmol of the protein was applied)
(G) FO:YxeB-S142-6×His(5 nmol of the protein was applied)
96

complex was collected by centrifuge, and the sample was then analyzed by RP-HPLC to assess whether the protein had bound DFO or FO. (A) DFO standard (12 nmol applied); (B) Ni-agarose beads, DFO, and YxeB-L142 mixture (approximate 5 nmol of the protein was collected); (C) Ni-agarose beads, DFO, and YxeB-S142 mixture (approximate 5 nmol of the protein was collected); (D) Ni-agarose beads and DFO mixture (negative control); (E) purified FO standard (12 nmol applied); (F) Ni-agarose beads, FO, and YxeB-L142 mixture (approximate 5 nmol of the protein was collected); (G) Ni-agarose beads, FO, and YxeB-S142 mixture (approximate 5 nmol of the protein was collected); (H) Ni-agarose beads and FO mixture (negative control).
Figure A5-3. Fluorescence quenching assay of predicted siderophore-binding proteins, BC_2208 (panel A), BC_4363 (panel B), BC_4416 (panel C) and BC_5380 (panel D) for FO (closed circles), Fch (closed squares), Fe-BB (open triangles) and 4-methylmorpholine buffer (pH 7.4) only (open diamonds). The quenching curves of these proteins at 358 nm are shown.
(A) BC_2208 (B) BC_4363
(C) BC_4416 (D) BC_5380
97

Figure A5-4. Growth assay of TC129 (YxeB-L142) (open symbols in panel A) TC128 (YxeB-S142) (open symbols in panel B) and yxeB markerless mutant, TC111 (closed symbols) strains. The strains were grown in iron-limited minimum medium containing 250 μM 2.2'-dipyridyl with or without DFO at 37 ˚C. Squares, no DFO; circles, 0.01 μM DFO; squares with white ×, 0.1 μM DFO; triangles, 0.2 μM DFO; diamonds, 2 μM DFO. Data were the average of three independent experiments. Bars indicate the standard errors.
(A) TC129 (YxeB-L142) (B) TC128 (YxeB-S142)
98

Figure A5-5. Cr-DFO/FO uptake assay in vivo. The cells of TC129 (panel A) or TC128 (panel B) were incubated in iron-limited minimum medium. After 2 μM DFO had been added and the cells had been incubated for 15 min, Cr-DFO (1 or 2 μM) and purified FO (0, 0.2, 0.5, or 2 μM) were added to the culture. After 0, 20, 40, 70, and 120 min incubation the cells were harvested and Cr amounts in the whole cells were measured by ICP as described in the Materials and Methods. The optical density at 600 nm of the cultures after 0 min or 120 min incubation was 1.2-1.4 (TC129 after 0 min incubation), 1.2-1.3 (TC128 after 0 min incubation), 1.8-2.0 (TC129 after 120 min incubation), and 1.8-1.9 (TC128 after 120 min incubation). The Cr-DFO and FO concentrations used with 2 μM DFO are as follows; 2 μM Cr-DFO (closed squares), 2 μM Cr-DFO and 2 μM FO (closed triangles), 2 μM Cr-DFO and 0.5 μM FO (closed diamonds), 2 μM Cr-DFO and 0.2 μM FO (closed circles), 1 μM Cr-DFO (open squares). Data are the average of two independent experiments. Bars indicate the standard errors.
YxeB-L142[TC129]
Desferrioxamine FerrichromeDMSO
(Negative control)Bacillibactin
yxeBmarkerless
[TC111]
YxeB-S142[TC128]
99

Figure A5-6. Growth assay of TC129 in iron-limited minimum medium with different amounts of DFO. The amounts of the substrates in the medium (final concentration) are as follows: no substrate (blue open squares), 2.5 nM DFO (closed diamonds), 7.5 nM DFO (closed triangles), 10 nM DFO (red closed circles), 50 nM DFO (open diamonds), 100 nM DFO (open triangles), 200 nM DFO (open circles), 500 nM DFO (closed squares). Data are the average of three independent experiments. Bars indicate the standard errors.
100