Coordination Action FP7-217920 Seventh Framework Programme ... · Figure 5.1 ADHERA: General view...
89
Tyre and Road Surface Optimisation for Skid Resistance and Further Effects Project Coordinator Mrs. Damaris OMASITS, arsenal research, Austria phone: +43 50550 6228, e-mail: damaris.omasits(at)arsenal.ac.at internet: http://tyrosafe.fehrl.org This project is part of the FEHRL Strategic Research Programme “SERRP IV” (www.fehrl.org ). Coordination Action FP7-217920 Seventh Framework Programme Theme 7: Transport D04 Report on state-of-the-art of test methods The research leading to these results has received funding from the European Community’s Seventh Framework Programme (FP7/2007-2013) under grant agreement n°217920 Main Editor(s) Minh-Tan Do, Peter G Roe Due Date 1 st December 2008 Delivery Date 5 th December 2008 Work Package WP2 Harmonisation of skid-resistance methods and choice of reference surfaces Dissemination Level Public (PU)
-
Upload
duongquynh -
Category
Documents
-
view
214 -
download
0
Transcript of Coordination Action FP7-217920 Seventh Framework Programme ... · Figure 5.1 ADHERA: General view...
Tyre and Road Surface Optimisation for Skid Resistance and Further Effects
Project Coordinator Mrs. Damaris OMASITS, arsenal research, Austria phone: +43 50550 6228, e-mail: damaris.omasits(at)arsenal.ac.at internet: http://tyrosafe.fehrl.org
This project is part of the FEHRL Strategic Research Programme “SERRP IV” (www.fehrl.org).
Coordination Action FP7-217920
Seventh Framework Programme Theme 7: Transport
D04
Report on state-of-the-art of test methods
The research leading to these results has received funding from the European Community’s Seventh Framework Programme (FP7/2007-2013) under grant
agreement n°217920
Main Editor(s) Minh-Tan Do, Peter G Roe
Due Date 1st December 2008
Delivery Date 5th December 2008
Work Package WP2 Harmonisation of skid-resistance methods and choice of reference surfaces
Dissemination Level Public (PU)
TYROSAFE Deliverable 04: Report on state-of-the-art of test methods
Date: 05/12/2008, Version: 4 2 (89)
Contributor(s)
Main Contributor(s) Minh-Tan Do, LCPC, France Phone: +33 2 40 84 57 95, E-Mail: [email protected]
Peter Roe, TRL, UK Phone +44 1344 77 0286, E-Mail: [email protected]
Contributor(s)
(alphabetical order)
Erik Vos, RWS, Netherlands Phone: +31 88 79 82 243, E-Mail: [email protected]
Jacob Groenendijk, KOAC-NPC, Netherlands Phone: +31 88 562 2528, E-Mail: [email protected]
Review
Reviewer(s) Peter Saleh, Arsenal, Austria
Helen Viner, TRL, UK
TYROSAFE Deliverable 04: Report on state-of-the-art of test methods
Date: 05/12/2008, Version: 4 3 (89)
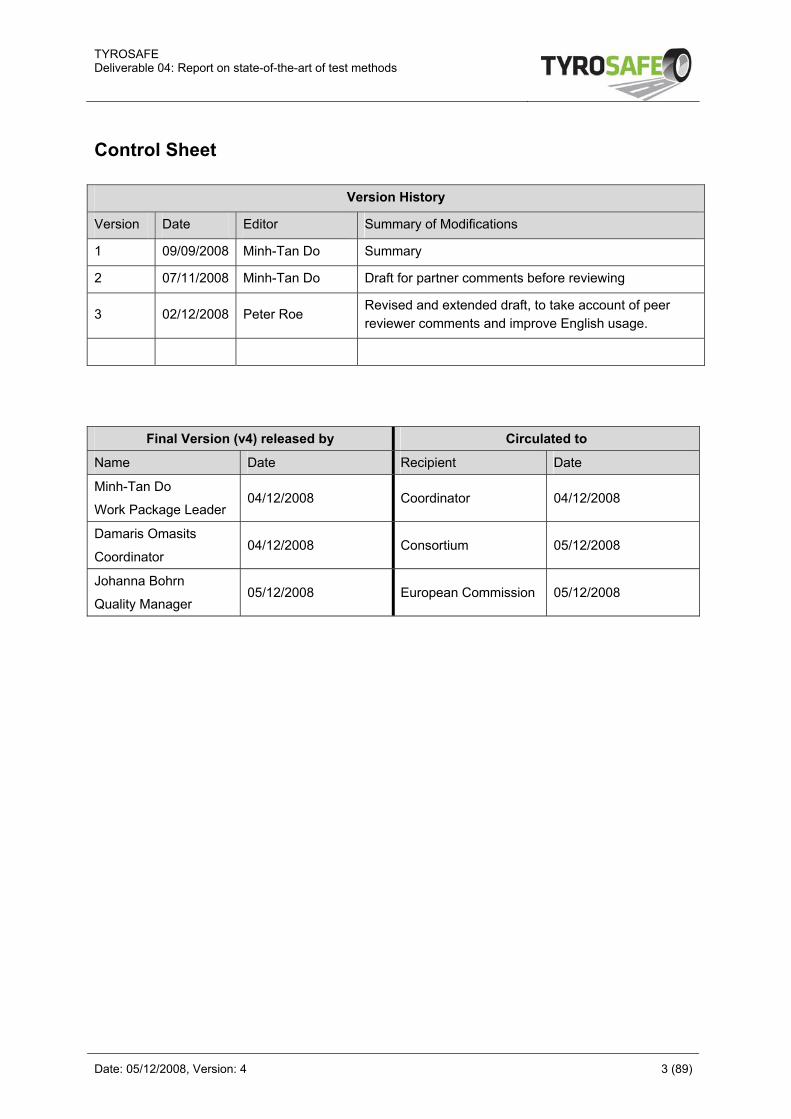
Control Sheet
Version History
Version Date Editor Summary of Modifications
1 09/09/2008 Minh-Tan Do Summary
2 07/11/2008 Minh-Tan Do Draft for partner comments before reviewing
3 02/12/2008 Peter Roe Revised and extended draft, to take account of peer reviewer comments and improve English usage.
Final Version (v4) released by Circulated to
Name Date Recipient Date
Minh-Tan Do
Work Package Leader 04/12/2008 Coordinator 04/12/2008
Damaris Omasits
Coordinator 04/12/2008 Consortium 05/12/2008
Johanna Bohrn
Quality Manager 05/12/2008 European Commission 05/12/2008
TYROSAFE Deliverable 04: Report on state-of-the-art of test methods
Date: 05/12/2008, Version: 4 4 (89)
Table of Contents 1 Introduction ...................................................................................................................12 2 Skid resistance measurement principles....................................................................16
2.1 Longitudinal friction principle ......................................................................................16 2.2 Transverse friction principle........................................................................................18 2.3 Static or slow-moving devices ....................................................................................20
3 Factors influencing skid resistance measurements and device operation.............21 3.1 Test speed..................................................................................................................21 3.2 Test tyre......................................................................................................................22 3.3 Load on test wheel......................................................................................................23 3.4 Water ..........................................................................................................................23 3.5 Temperature ...............................................................................................................24
4 Identifying current devices used to measure skid resistance ..................................25 5 Skid-resistance devices identified by CEN/TC227/WG5............................................27
5.1 ADHERA.....................................................................................................................28 5.2 BV-11 and SFT (Saab Friction Tester) .......................................................................30 5.3 GripTester...................................................................................................................32 5.4 RoadSTAR..................................................................................................................34 5.5 ROAR DK ...................................................................................................................37 5.6 ROAR NL....................................................................................................................39 5.7 RWS NL Skid Resistance Trailer................................................................................40 5.8 SCRIM ........................................................................................................................42 5.9 Skiddometer BV-8.......................................................................................................44 5.10 SKM............................................................................................................................46 5.11 SRM............................................................................................................................48 5.12 TRT.............................................................................................................................50
6 Other devices.................................................................................................................52 6.1 DFT Dynamic Friction Tester......................................................................................53 6.2 IMAG...........................................................................................................................54 6.3 Mu-Meter Mk-5 and Mk-6 ...........................................................................................55 6.4 Odoliograph ................................................................................................................56 6.5 OSCAR.......................................................................................................................57 6.6 PFT (TRL)...................................................................................................................58 6.7 SALTAR friction meter ................................................................................................60 6.8 VTI Skiddometer BV-12 ..............................................................................................61 6.9 VTI Skiddometer BV-14 ..............................................................................................62 6.10 SRT Pendulum ...........................................................................................................63 6.11 T2GO..........................................................................................................................64 6.12 VTI Portable Friction Tester (PFT)..............................................................................65 6.13 VTT Friction Lorry .......................................................................................................65
7 Discussion .....................................................................................................................66 8 Conclusions...................................................................................................................69
TYROSAFE Deliverable 04: Report on state-of-the-art of test methods
Date: 05/12/2008, Version: 4 5 (89)
9 Appendix 1 – Calibration procedures..........................................................................70 9.1 ADHERA.....................................................................................................................70 9.2 GRIPTESTER.............................................................................................................71 9.3 ROADSTAR................................................................................................................72 9.4 ROAR DK ...................................................................................................................74 9.5 ROAR NL....................................................................................................................74 9.6 RWS NL Skid Resistance Trailer................................................................................76 9.7 SCRIM ........................................................................................................................77 9.8 Skiddometer BV8........................................................................................................80 9.9 SKM............................................................................................................................81 9.10 SRM............................................................................................................................85 9.11 Tatra Runway Tester ..................................................................................................85
10 References .....................................................................................................................88
TYROSAFE Deliverable 04: Report on state-of-the-art of test methods
Date: 05/12/2008, Version: 4 6 (89)
Abbreviations
Abbreviation Meaning
CEN Comité Européen de Normalisation (European Committee for Standardization)
OSCAR Optimum Surface Contamination Analyser and Recorder
PFT Pavement Friction Tester
RoadSTAR Road Surface Tester of Arsenal Research
ROAR Road Analyser and Recorder manufactured by Norsemeter
SCRIM Sideway-force Coefficient Routine Investigation Machine
SKM Seitenkraftmessung
SFT SAAB Friction Tester
SRM Stuttgarter Reibungsmesser
TC Technical Committee
TRT Tatra Runway Tester
WG Working Group Definitions
Term Definition
Airfield operational testing
Measurement of the skid resistance of a surface on an airfield in response to an operational need and in whatever conditions exist at the time of the test, which may include contamination by ice, snow, slush or water.
Bound surface Top layer or surface course of a road with the aggregates secured permanently in place
Braking force coefficient
Ratio between the longitudinal frictional force and the load on the test tyre, the test tyre mass and the rim mass. This coefficient is without dimension.
Calibration
Periodic adjustment of the offset, the gain and the linearity of the output of a measurement method so that all the calibrated devices of a particular type deliver the same value within a known and accepted range of uncertainty, when measuring under identical conditions within given boundaries or parameters.
Contact area Overall area of the road surface instantaneously in contact with a tyre.
Fixed slip Condition in which a braking system forces the test wheel to roll at a fixed reduction of its operating speed.
Fixed-slip friction Friction between a test tyre and a road surface when the wheel is controlled to move at a fixed proportion of its natural speed.
Friction Resistance to relative motion between two bodies in contact. The
TYROSAFE Deliverable 04: Report on state-of-the-art of test methods
Date: 05/12/2008, Version: 4 7 (89)
frictional force is the force which acts tangentially in the contact area.
Horizontal force (drag)
Horizontal force acting tangentially on the test wheel in line with the direction of travel.
Horizontal force (side force)
Horizontal force acting perpendicular to a freely-rotating, angled test wheel.
Longitudinal friction coefficient (LFC)
Ratio between horizontal force (drag) and vertical force (load) for a braked wheel in controlled conditions. This is normally a decimal number quoted to two significant figures.
Macrotexture
Deviation of a pavement from a true planar pavement with characteristic dimensions along the pavement of 0.5 mm to 50 mm, corresponding to texture wavelengths with one-third-octave bands including the range 0.63 mm to 50 mm centre wavelengths.
Mean profile depth
Descriptor of macro texture, obtained from a texture profile measurement as defined in EN ISO 13473-1 and EN ISO 13473-2.
Megatexture Roughness elements with a horizontal length of 50 to 500 mm. Roughness of this magnitude can influence accumulations of water on the pavement surface (for instance, in unevenness).
Microtexture
Deviation of a pavement from a true planar pavement with characteristic dimensions along the pavement of less than 0.5 mm, corresponding to texture wavelengths with one-third-octave bands and up to 0,5 mm centre wavelengths.
Nearside wheel path
Wheel path that is closest to the edge of the road in the normal direction of travel. For countries that normally drive on the right, this is the right-hand side and for countries that normally drive on the left, this is the left-hand side.
Operating speed Speed at which the device traverses the test surface.
Pedestrian slip resistance
The property of the trafficked surface to maintain the adhesion of a pedestrian shoe sole.
Push mode When the device is pushed by a pedestrian
Repeatability r
The maximum difference expected between two measurements made by the same machine, with the same tyre, operated by the same crew on the same section of road in a short space of time, with a probability of 95 %.
Reproducibility R The maximum difference expected between two measurements made by different machines with different tyres using different crews on the same section of road in a short space of time, with a probability of 95 %.
Routine testing Measurement of the skid resistance of a surface in standardized test conditions, which normally include a defined water flow rate.
Sampling length/interval
The distance over which responses of the sensors are sampled to determine a single measurement of the recorded variables.
Side force coefficient
Ratio between the vertical force (load) and horizontal force (side force) in controlled conditions. This is normally a decimal number quoted to two significant figures.
Skid resistance Characterisation of the friction of a road surface when measured in accordance with a standardised method.
TYROSAFE Deliverable 04: Report on state-of-the-art of test methods
Date: 05/12/2008, Version: 4 8 (89)
Slip angle The angle between the mid-plane of the test tyre contact surface and the direction of travel.
Slip ratio Slip speed divided by the operating speed.
Slip speed Relative speed between the test tyre and the travelled surface in the contact area.
Subsection Defined length of surface for which one set of the measured variables is reported by the device.
Test section Length of road between defined points (e.g. location references, specific features, or measured distances) comprising a number of subsections over which a continuous sequence of measurements is made.
Theoretical water film thickness
Theoretical thickness of a water film deposited on the surface in front of the measuring tyre, assuming the surface has zero texture depth.
Tow mode When the device is towed by a vehicle
Vertical force Force applied by the wheel assembly (the static and dynamic force on the test tyre, the test tyre weight and the rim weight) on the contact area.
Water delivery system
System for depositing a given amount of water in front of the test tyre so that it then passes between the tyre and the surface being measured.
Water flow rate Rate (litres/second) at which water is deposited on the surface to be measured in front of the test tyre.
Wet road skid resistance
Property of a trafficked surface that limits relative movement between the surface and the part of a vehicle tyre in contact with the surface, when lubricated with a film of water.
Wheel paths Parts of the pavement surface where the majority of vehicle wheel passes are concentrated.
List of Figures Figure 1.1 Harmonisation scheme and actions carried out in WP 2 ......................................14 Figure 2.1 Illustration of LFC – G curve .................................................................................17 Figure 2.2 Illustration of slip angle..........................................................................................18 Figure 2.3 Illustration of SFC – δ curve..................................................................................19 Figure 3.1 Effect of vehicle speed and percentage slip on friction .........................................21 Figure 5.1 ADHERA: General view (left) and trailer (right) with cover opened ......................28 Figure 5.2 BV11 trailer (left) and SFT (right) ..........................................................................30 Figure 5.3 GripTester .............................................................................................................32 Figure 5.4 RoadSTAR general view (left) and close-up of measuring wheel (right) ..............34 Figure 5.5 A general view of ROAR DK (left) and close-up of the test wheel mechanism
(right)...............................................................................................................................37 Figure 5.6 A general view of ROAR NL (left) and close-up of the measuring system
mounted at the rear in the right wheel track (right). ........................................................39 Figure 5.7 RWS NL skid resistance trailer .............................................................................40 Figure 5.8 SCRIM wheel assembly for a left-side test wheel (wheel in its raised position)....42 Figure 5.9 Skiddometer BB-8 (example used in Switzerland)................................................44 Figure 5.10 SKM test wheel assembly (this example is on the machine operated by BASt) .46
TYROSAFE Deliverable 04: Report on state-of-the-art of test methods
Date: 05/12/2008, Version: 4 9 (89)
Figure 5.11 The SRM showing the test wheels mounted on the rear of the vehicle (this example is from Switzerland) ..........................................................................................48
Figure 5.12 The TRT..............................................................................................................50 Figure 6.1 Dynamic Friction Tester ........................................................................................53 Figure 6.2 The IMAG..............................................................................................................54 Figure 6.3 Diagram of the Mu-meter ......................................................................................55 Figure 6.4 Odoliographs following water tankers – devices from MET (left) and CRRB
(right)...............................................................................................................................56 Figure 6.5 OSCAR (the test wheel and water feed nozzle can be seen on the left) ..............57 Figure 6.6 The PFT ................................................................................................................58 Figure 6.7 Griffigkeitsmesseinrichtung SALTAR ....................................................................60 Figure 6.8 The VTI Skiddometer BV-12 .................................................................................61 Figure 6.9 VTI Skiddometer BV-14 ........................................................................................62 Figure 6.10 The Pendulum Tester..........................................................................................63 Figure 6.11 T2GO .................................................................................................................64 Figure 6.12 The VTI Portable Friction Tester .........................................................................65 List of Tables Table 1.1 Overview of the major outcomes of the individual Tasks of WP 2 .........................14 Table 5.1 Precision indicators for ADHERA measurements ..................................................28 Table 5.2 Standard test conditions for ADHERA....................................................................29 Table 5.3 Precision indicators for BV11/SFT measurements.................................................30 Table 5.4 Standard test conditions for BV-11 and SFT..........................................................31 Table 5.5 Precision indicators for GripTester measurements ................................................32 Table 5.6 Standard test conditions for GripTester..................................................................33 Table 5.7 Precision indicators for RoadSTAR measurements ...............................................35 Table 5.8 Standard test conditions for RoadSTAR ................................................................36 Table 5.9 Precision indicators for ROAR DK measurements.................................................37 Table 5.10 Standard test conditions for ROAR DK ................................................................38 Table 5.11 Precision indicators for ROAR NL measurements ...............................................39 Table 5.12 Standard test conditions for ROAR NL.................................................................40 Table 5.13 Precision indicators for RWS Skid Resistance Trailer measurements.................41 Table 5.14 Standard test conditions for the RWS Skid ResistanceTrailer .............................41 Table 5.15 Precision indicators for SCRIM measurements....................................................43 Table 5.16 Standard test conditions for SCRIM .....................................................................43 Table 5.17 Precision indicators for Skiddometer BV-8 measurements ..................................44 Table 5.18 Standard test conditions for Skiddometer BV-8 ...................................................45 Table 5.19 Precision indicators for SKM measurements .......................................................46 Table 5.20 Standard test conditions for SKM.........................................................................47 Table 5.21 Precision indicators for SRM measurements .......................................................48 Table 5.22 Standard test conditions for SRM........................................................................49 Table 5.23 Precision indicators for TRT measurements ........................................................50 Table 5.24 Standard test conditions for TRT..........................................................................51 Table 7.1 Main characteristics of the principal devices identified...........................................68 Table 9.1 Frequency of periodic calibrations of GripTester....................................................71 Table 9.2 Criteria for periodic calibrations of RoadSTAR.......................................................73 Table 9.3 Criteria for monthly repeated measurements with RoadSTAR ..............................73 Table 9.4 Criteria for repeated measurements with ROAD DK..............................................74 Table 9.5 Pre-running length against interval time between testing with ROAR NL ..............75 Table 9.6 Pre-running length against interval time between testing with RWS trailer ............76 Table 9.7 Frequency of periodic calibrations of SCRIM .........................................................77 Table 9.8 Static calibration of SCRIM ....................................................................................78
TYROSAFE Deliverable 04: Report on state-of-the-art of test methods
Date: 05/12/2008, Version: 4 10 (89)
Executive Summary Road safety is closely related to road skid-resistance: accident statistics show that low skid resistance leads to increased risk of accidents. Countries have developed skid policies for the monitoring of road networks and the acceptance of new works and the policies typically rely on specialised equipment to measure the key properties of skid resistance and texture depth. For the sake of simplicity, the output of the test devices is typically reduced to one descriptor for the property measured. For skid resistance, this is usually a measurement of friction under conditions specific to the particular device. However, this can obscure the influence of many factors involved in the tyre/road friction process during vehicle manoeuvres. The results from the measurements are used in various ways in different countries, sometimes as direct measurements, sometimes processed into some kind of index for comparison against standards where these have been set. There are no direct comparisons between skid-resistance indexes from one country to another, or even from device to device in the same country. Consequently, if a greater consistency of approach to the provision of skid resistance is to be encouraged across Europe, there is a need for a common scale against which comparisons between standards and the different types of measurement can be made. One of the main objectives of the TYROSAFE project, dealt with in the work-package 2, is to set out a strategy for moving towards a standard related to the measurement and calculation of such a common scale. One of the possible ways to achieve this, as suggested by the CEN committee dealing with test methods related to road surface characteristics (TC227 Working Group 5), is to use a “reference device”. Task 2.1 of TYROSAFE will investigate possible specifications for this reference device. The main objective of this report, however, is to compile as exhaustive a list as possible of skid-resistance measuring devices operated throughout Europe. This list is confined to devices specifically designed and used to assess road surface condition. It does not cover accelerometer devices such as those used by police forces in braking tests for collision investigation purposes. The report explains the basic principles on which skid resistance measuring devices operate – longitudinal friction, transverse friction and slider techniques – before describing the essential features of those devices that have been identified as currently operating within Europe. Twenty-three devices were identified from CEN TC227 WG5 and project partner sources. For each device, the measurement principle and test method are described. For those devices having explicitly defined calibration procedures set out in CEN draft Technical Specifications, these procedures have been included in an Appendix.
TYROSAFE Deliverable 04: Report on state-of-the-art of test methods
Date: 05/12/2008, Version: 4 11 (89)
This first overview has shown a wide variety of measurement configurations and test conditions, ranging from static spot-check devices through large-scale routine investigation tools to research equipment for specialised purposes. This emphasises both the difficulty of making comparisons between the results from different devices and the need for a rigorous harmonisation technique if this is to be achieved. Previous experience has shown the difficulty of using simple mathematical models in the process of harmonising devices with widely varying operating characteristics and a number of aspects will need to be considered in future stages of this part of the TYROSAFE project as the work moves towards its objectives. Further investigations are required to establish more details relating to some of the devices listed here so that wider comparisons can be made. This should include identifying practices for calibration so that any future recommendations can be based on all aspects that could potentially contribute to the accuracy of any future harmonised skid resistance index.
TYROSAFE Deliverable 04: Report on state-of-the-art of test methods
Date: 05/12/2008, Version: 4 12 (89)
1 Introduction The safe passage of road traffic needs a certain amount of grip (friction) between the tyres of the vehicles and the road surface. The frictional forces are necessary for the vehicle to accelerate, decelerate or safely change direction. The level of frictional forces that can be built up depends on the properties of both the road surface and the tyres. Much research has shown that the limiting frictional forces for a given road surface and tyre combination depend on many factors, including tyre load, tyre tread compound and depth, road surface characteristics, the presence of water, ice or other contaminants in the tyre/road interface and vehicle speed. In order to characterise road surfaces with respect to friction, for decades many countries have derived their own test methods. These are, of necessity, very much simplified in order to assess specifically the condition of the road surface. They all measure in some way the frictional force developed between a moving tyre or slider and the road surface (which is usually wetted) and record the quotient of the measured force with the applied vertical load (a friction coefficient). However, for each test method the effects of many of the potential influencing factors are controlled by standardising the measuring conditions. The standard conditions chosen reflect the practicalities of carrying out the particular test and are assumed to be relevant for characterizing the complex reality of friction in the tyre/road interface. Usually the measurement is called the “skid resistance” and is represented by a single value. Because the test methods and the chosen conditions vary, the actual numbers recorded can differ widely for the same road surface, Several European countries have investigated the link between skid resistance level and accident rates. The result of this research is that with a sufficiently high value of skid resistance the safety of roads can be improved by reducing the risk of skidding and hence the number or severity of accidents. Many European countries have developed their own skid policies for the road networks for which they are responsible. The approaches vary between countries but they often contain elements such as periodic routine monitoring of skid resistance of in service road and comparing the results with pre-determined values. In some countries the measurements are also used for comparison with acceptance levels for new works. As has been explained, the available standardized test methods all simplify the reality of the complex friction process in the tyre/road interface during vehicle manoeuvres and they do that in different ways. It therefore should be no surprise that a direct comparison of skid values from country to country is not an easy task. Also the relevance of the different test methods with respect to safety will be different since the techniques and standardised test conditions reflect different aspects of the tyre/road friction mechanism. For example, at one extreme, some methods simulate conditions close to those experienced by a tyre braking under the control of an Anti-lock braking system while, at the other, some devices use a
TYROSAFE Deliverable 04: Report on state-of-the-art of test methods
Date: 05/12/2008, Version: 4 13 (89)
skidding locked wheel. It is clear that a common scale for characterizing road surfaces with respect to skid resistance properties is lacking. This can be seen as a serious hindrance for making skid policy for making the European road network safer. The TYROSAFE Project is a Coordination and Support Action (CSA) in the Seventh EU Framework Programme and aims at coordinating and preparing for European harmonisation and optimisation of the assessment and management of essential tyre/road interaction parameters to increase safety and support the greening of European road transport. This work is being carried out in the following six work packages (WP):
WP1: Policies of EU countries for skid resistance / rolling resistance / noise emissions;
WP2: Harmonisation of skid-resistance test methods and choice of reference; surfaces
WP3: Road surfaces properties – skid resistance / rolling resistance / noise emissions;
WP4: Environmental effects and impact of climatic change – skid resistance / rolling resistance / noise emissions;
WP5: Dissemination and raising awareness; WP6: Management.
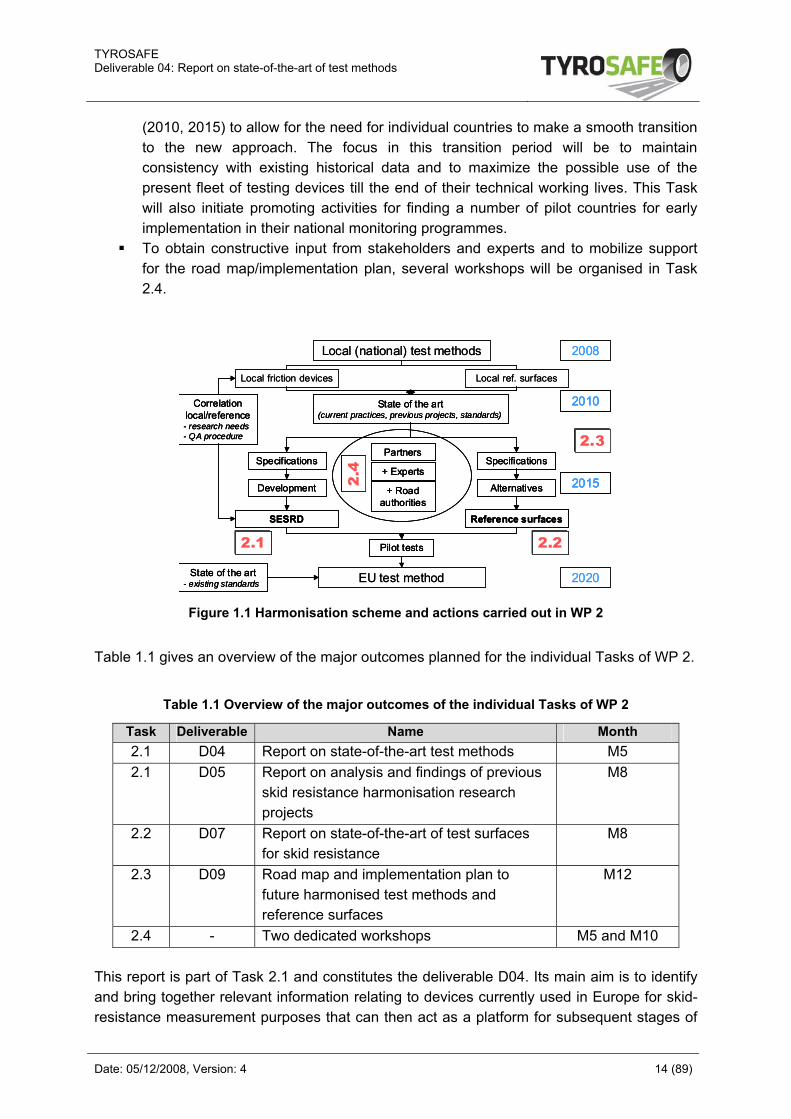
The objective of Work Package 2 of TYROSAFE is to end up with a widely supported road map towards future skid-resistance harmonisation policy in 2020, including aspects such as testing equipment, quality assurance and implementation strategy. The major field of application in mind is for monitoring the skid resistance quality of the European road network and for new work acceptance control. Basically the lines being followed are those formulated in 2005 by the CEN working group on Surface Characteristics (CEN/TC227 WG5), to prepare in the longer term (over 10 years) “a harmonised standard based on the measurement of a friction index with a common and single European friction measuring equipment”. The harmonisation process is illustrated in Figure 1.1 along with actions to be carried out in WP2 of TYROSAFE. To reach its objective, WP2 is split into four Tasks:
In Task 2.1 knowledge of current national skid resistance test methods will be collated, together with findings of previous harmonisation research projects, which will be collected and analysed. Based on the outcomes of these exercises, proposals will be formulated for possible options for the specification of a Standard European Skid Resistance Device (SESRD).
In Task 2.2 the focus will be on the use and harmonisation of reference surfaces in the Quality Assurance part of the harmonisation policy as was suggested by the HERMES project.
In Task 2.3, based on the results of Task 2.1 and 2.2, a road map or implementation plan will be developed to point the way towards a harmonised approach to wet skid resistance test methods in 2020. Special attention will be paid to intermediate stages
TYROSAFE Deliverable 04: Report on state-of-the-art of test methods
Date: 05/12/2008, Version: 4 14 (89)
(2010, 2015) to allow for the need for individual countries to make a smooth transition to the new approach. The focus in this transition period will be to maintain consistency with existing historical data and to maximize the possible use of the present fleet of testing devices till the end of their technical working lives. This Task will also initiate promoting activities for finding a number of pilot countries for early implementation in their national monitoring programmes.
To obtain constructive input from stakeholders and experts and to mobilize support for the road map/implementation plan, several workshops will be organised in Task 2.4.
Local (national) test methods
Local friction devices Local ref. surfaces
EU test method
SESRD Reference surfaces
2008
2010
2015
2020
Partners
+ Experts
+ Road authorities
Correlationlocal/reference- research needs- QA procedure
State of the art(current practices, previous projects, standards)
Development
Specifications Specifications
Alternatives
Pilot tests
State of the art- existing standards
2.1 2.2
2.3
2.4
Local (national) test methods
Local friction devices Local ref. surfaces
EU test method
SESRD Reference surfacesSESRD Reference surfaces
2008
2010
2015
2010
2015
2020
Partners
+ Experts
+ Road authorities
Partners
+ Experts
+ Road authorities
Correlationlocal/reference- research needs- QA procedure
Correlationlocal/reference- research needs- QA procedure
State of the art(current practices, previous projects, standards)
State of the art(current practices, previous projects, standards)
Development
Specifications
Development
Specifications Specifications
Alternatives
Specifications
Alternatives
Pilot testsPilot tests
State of the art- existing standards
State of the art- existing standards
2.1 2.2
2.3
2.4
Figure 1.1 Harmonisation scheme and actions carried out in WP 2
Table 1.1 gives an overview of the major outcomes planned for the individual Tasks of WP 2.
Table 1.1 Overview of the major outcomes of the individual Tasks of WP 2
Task Deliverable Name Month 2.1 D04 Report on state-of-the-art test methods M5 2.1 D05 Report on analysis and findings of previous
skid resistance harmonisation research projects
M8
2.2 D07 Report on state-of-the-art of test surfaces for skid resistance
M8
2.3 D09 Road map and implementation plan to future harmonised test methods and reference surfaces
M12
2.4 - Two dedicated workshops M5 and M10
This report is part of Task 2.1 and constitutes the deliverable D04. Its main aim is to identify and bring together relevant information relating to devices currently used in Europe for skid-resistance measurement purposes that can then act as a platform for subsequent stages of
TYROSAFE Deliverable 04: Report on state-of-the-art of test methods
Date: 05/12/2008, Version: 4 15 (89)
the work. Although the original project proposal suggested that this particular output (D04) would include coverage of skid resistance policies, the TYROSAFE Management Group has decided that to avoid unnecessary repetition or duplication of effort, the topic of skid resistance policies and how supporting measurements are obtained would be dealt with specifically in Work Package 1. Sections 2 and 3 of the report provide some brief initial background explanation of general principles relating to road/tyre friction and how these are applied to skid resistance measurement. The bulk of the rest of the report describes the individual devices. The individual descriptions include three topics: what they look like, what they measure and how they operate. Where the information is available, details of how individual devices are calibrated are included in Appendix 1. Discussion of the ways in which data from the individual devices are used is outside the immediate scope of this report. Some of the devices covered here provide data to support skid resistance policies in individual countries (and in some cases, more than one country) while others are confined to research or localised road surface investigations.
TYROSAFE Deliverable 04: Report on state-of-the-art of test methods
Date: 05/12/2008, Version: 4 16 (89)
2 Skid resistance measurement principles Before describing the various individual devices identified, this and the next chapter provide some background information about important physical effects and concepts that influence the design and operation of skid resistance measuring equipment. Current measurement devices can usually be classified into one of three groups depending on the principle used. The first two of these – longitudinal and transverse friction – utilise a test wheel that slides over the road surface to generate a frictional force that is then measured and used to calculate a value representing the skid resistance of the road. The test wheel typically has a pneumatic tyre and is mounted on a vehicle that is operated at or near normal traffic speeds. Devices in the third group are smaller and are either stationary or very slow moving when they are used.
2.1 Longitudinal friction principle For a vehicle travelling in a straight line, when the driver applies the brake, a torque is applied to the vehicle wheels via the braking system. A reacting force develops in the tyre/road contact area. Provided that grip is maintained, the angular (or rotational) speed of the wheels decreases and the vehicle slows down as kinetic energy is absorbed in the braking system. However, as the braking torque increases, the wheel speed may reduce below the vehicle speed and consequently the tyre slips on the road, generating friction forces in the contact area (due to adhesion and deformation processes) to slow down the vehicle. In the extreme, the wheel may cease to rotate (known as the “locked” condition), and one area of the tyre slides or skids over the road surface. Longitudinal friction measuring devices try to simulate part of this process, typically by controlling the rate at which the wheel rotates relative to the road speed. This leads to the idea of the “slip ratio” and it is important to appreciate how the longitudinal friction coefficient varies with the slip ratio.
2.1.1 Slip ratio The tyre slip ratio G is defined by the formula (1):
(1) V
RVG ω−=
where ω: angular speed of the wheel; R: wheel radius; V: vehicle speed. G varies between 0 and 1. For skid-resistance measuring devices, G is generally expressed as a percentage. Thus, for G = 0%, the tyre speed is equal to the vehicle speed and the wheel is freely rotating: for G = 100%, there is no rotation and the wheel is locked.
TYROSAFE Deliverable 04: Report on state-of-the-art of test methods
Date: 05/12/2008, Version: 4 17 (89)
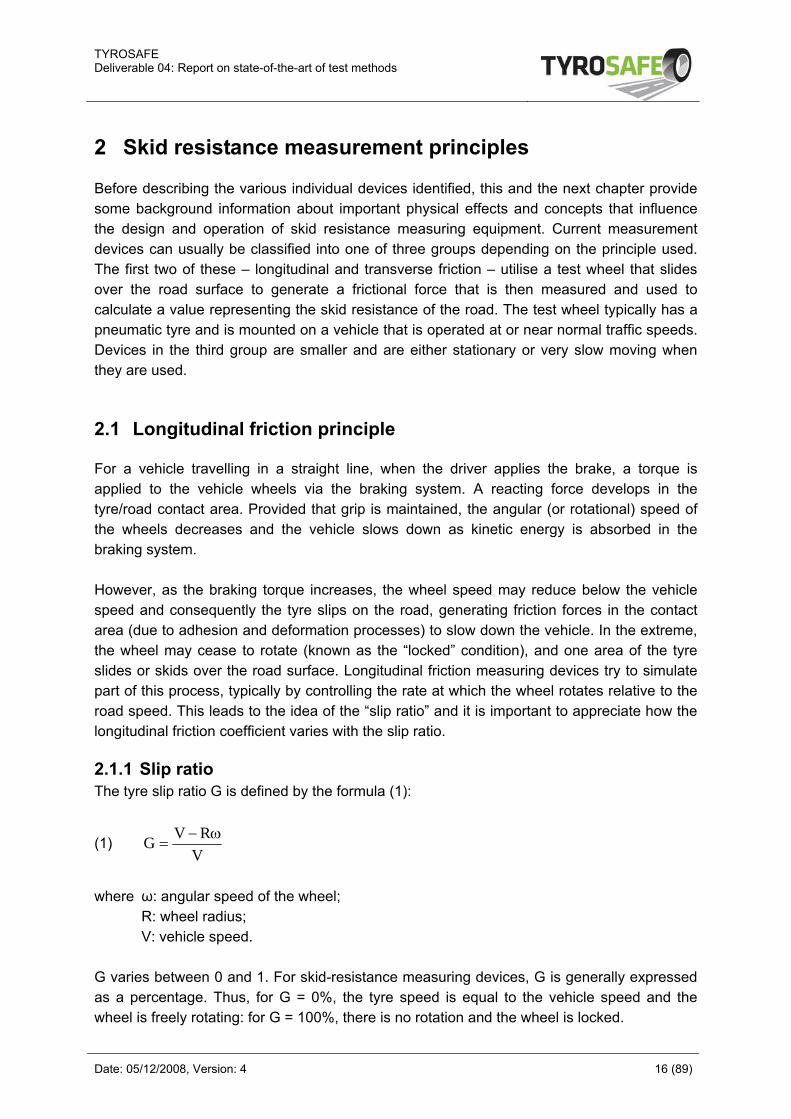
2.1.2 Friction – slip curve The longitudinal friction coefficient LFC varies with the tyre slip ratio as illustrated in Figure 2.1.
LFC
G~ 0,01
LFCmax
15% < Gmax < 20%
LFClocked
100%
LFC
G~ 0,01
LFCmax
15% < Gmax < 20%
LFClocked
100%
Figure 2.1 Illustration of LFC – G curve
It can be seen that, initially, friction increases as the slip ratio increases but it reaches a maximum value before decreasing as the slip ratio continues to increase until the locked-wheel state is reached. This variation can be explained by the movement of the tyre treads in the tyre/road contact area changing from a largely shear phase to a mainly slipping phase. The maximum value of LFC denoted by Gmax, (sometimes known as “peak friction”) typically occurs at a slip ratio between 15% and 20%.
2.1.3 Using the longitudinal friction principle for skid resistance measurements
Skid-resistance measurement devices that measure longitudinal friction operate with a slip ratio that is either set by means of a fixed mechanical linkage or by means of a controlled braking system that adjusts the brake to maintain a constant ratio between the vehicle speed and the test wheel speed. The slip ratio is generally chosen to lie between Gmax and 100%. Some devices may offer a choice of the slip ratio that can be used but this is usually fixed at that ratio once selected. Mechanical systems automatically have a fixed slip ratio. Servo-systems may suffer from a slight delay as the braking forces are adjusted to reflect changes vehicle speed or in response to a sudden change in friction (if the friction suddenly reduces, the brake force may slow the test wheel down too much and if friction suddenly increases, the brake force may need to increase). Other LFC devices have a variable slip ratio that gradually increases the braking force until the wheel locks, enabling them to plot the whole friction – slip curve during the test. Some locked-wheel devices may also record the frictional forces during whole the braking cycle, thus allowing the friction slip curve to be inferred even though the main reported value is in the locked-wheel condition.
TYROSAFE Deliverable 04: Report on state-of-the-art of test methods
Date: 05/12/2008, Version: 4 18 (89)
The fixed slip ratio approach is more suitable for general monitoring purposes since the wheel continues to rotate during the test and can therefore be used continuously. Locked-wheel and variable-slip systems can only sample a short length of road during one test and so are better-suited to research use.
2.2 Transverse friction principle In a bend, the driver uses the steering system to turn the vehicle’s front-wheels so that there is a difference between the vehicle direction and the wheel rotation-plane. The induced angular difference is known as the slip angle. It induces tyre/road friction, which in turn generates a centripetal force opposing the centrifugal force exerted on the vehicle in the bend, allowing the vehicle to follow round the curve. Just as with longitudinal friction, when as the braking force increases the wheel starts to slip over the road surface, so in the transverse friction situation if the centrifugal force exceeds the friction force available, the tyre will slip sideways, even though it continues to rotate. Transverse-friction (also known as “side-force”) skid resistance measuring devices try to simulate this process. This leads to the concept of the “slip angle” and it is important to appreciate how the transverse, or sideway, friction coefficient varies with the slip angle.
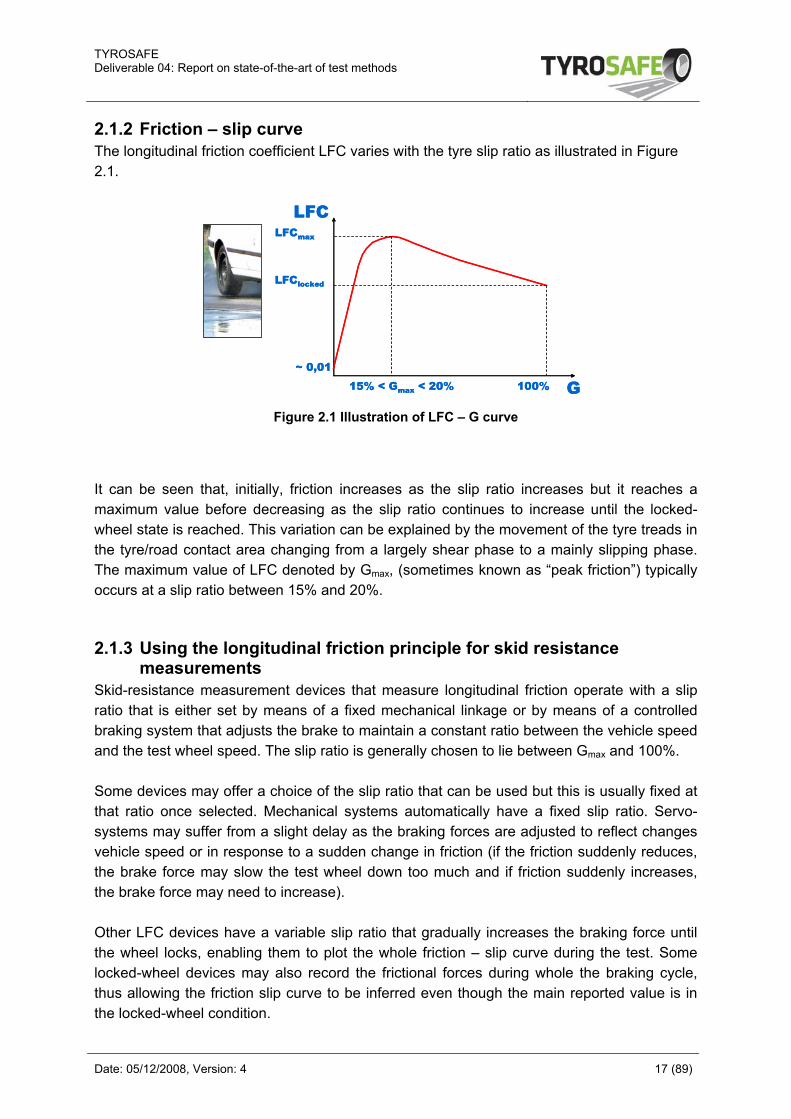
2.2.1 Slip angle The slip angle is the angle formed by the wheel’s plane of rotation and the tangent to the wheel’s path (Figure 2.2). On a skid resistance test device the wheel’s path normally follows the direction of travel of the test vehicle.
Figure 2.2 Illustration of slip angle
TYROSAFE Deliverable 04: Report on state-of-the-art of test methods
Date: 05/12/2008, Version: 4 19 (89)
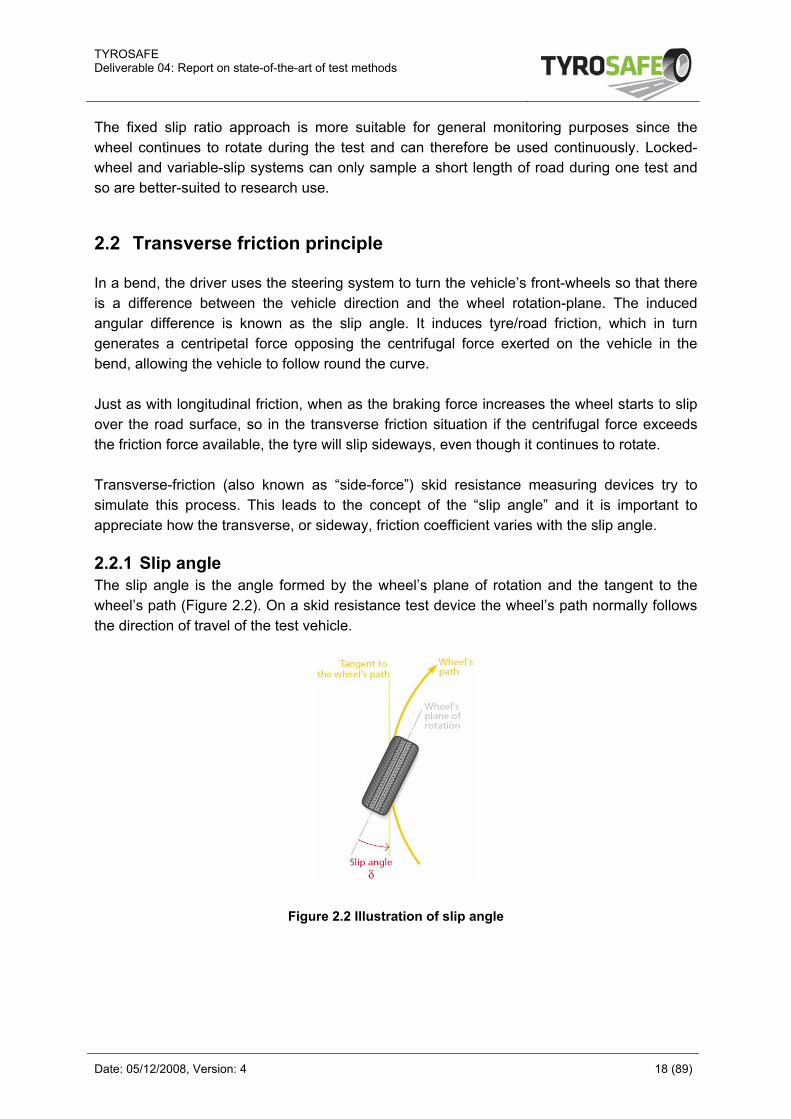
2.2.2 Friction – slip angle curve The sideways friction coefficient SFC varies with the tyre slip-angle as illustrated in Figure 2.3.
SFC
δ
SFCmax
4° < δmax < 7°
SFC
δ
SFCmax
4° < δmax < 7°
Figure 2.3 Illustration of SFC – δ curve
It can be seen that the friction increases at first as the slip angle increases, reaching a maximum before decreasing as the slip angle continues to increase. This process is analogous to the variation observed in longitudinal braking, as the tyre tread in the tyre/road contact area moves from a shear phase to a slipping phase. Typically, the maximum value of SFC occurs at a slip angle, denoted by δmax, between 4° and 7° for a light vehicle, and between 6° and 10° for a truck.
2.2.3 Using the transverse friction principle for skid resistance measurements
Skid resistance measurement devices operating on the angled wheel principle normally operate at a fixed slip angle which is typically set to be well beyond δmax. The force developed along the axle of the test wheel is measured and used to compute a friction value to represent skid resistance that is known as “sideway-force coefficient” (also abbreviated to SFC). In this case the abbreviation refers explicitly to the special case of the value measured with a skid-resistance device operating on angled-wheel principle under controlled conditions. The side-force method for measuring skid resistance allows continuous measurement and such devices are often used for routine monitoring purposes. Some devices can vary the slip angle through the test but, as with variable-slip longitudinal systems, these are normally confined to research work.
TYROSAFE Deliverable 04: Report on state-of-the-art of test methods
Date: 05/12/2008, Version: 4 20 (89)
2.3 Static or slow-moving devices The previous section has dealt with the main principles that apply to devices that use wheels fitted with rubber tyres to measure skid resistance. There is, however, a further group of devices which are designed primarily to be easily portable and suitable for laboratory or localised use. These typically utilise rubber sliders to make contact with the road surface, with a mechanism that initiates relative motion between the slider and the road. Two methods have been used. The first of these is a pendulum arm that swings under gravity with the rubber slider mounted beneath the foot of the pendulum so that the pendulum slows down as a result of friction between the slider and the road surface. The work done to decelerate the pendulum is related to the skid resistance and devices of this type usually have a pointer that is pushed up a simple calibrated scale to indicate this and serve as the measured value. The second method is to attach sliders beneath a rotating head that is lowered on to the road so that friction between the sliders and the road causes the head to slow down. These devices typically measure the rotational speed and reaction torque as the head slows down. They derive a friction coefficient from this and the vertical load, usually taking the value at a pre-defined tangential slider speed to represent the skid resistance. Some devices do not remain stationary on the road during a test but are pushed manually along the road surface at a walking speed or slower. These have been designed primarily for use in confined areas or for specialised purposes such as measuring grip on footways or on road markings. They can utilise any of the main principles but in a form suitable for low-speed use.
TYROSAFE Deliverable 04: Report on state-of-the-art of test methods
Date: 05/12/2008, Version: 4 21 (89)
3 Factors influencing skid resistance measurements and device operation
As well as the various operating principles described above, there are a number of factors that influence skid resistance measurements and that therefore need to be controlled in some way while measurements are made for particular purposes. This chapter summarises the main issues in relation to four major factors.
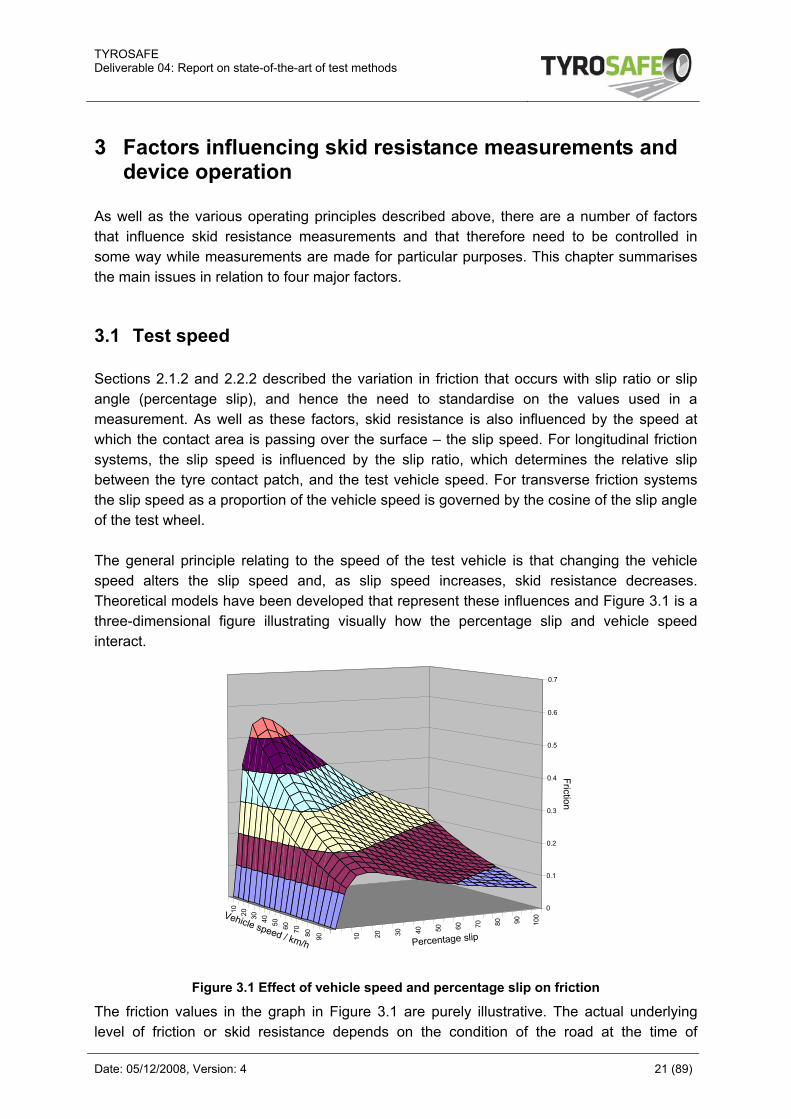
3.1 Test speed Sections 2.1.2 and 2.2.2 described the variation in friction that occurs with slip ratio or slip angle (percentage slip), and hence the need to standardise on the values used in a measurement. As well as these factors, skid resistance is also influenced by the speed at which the contact area is passing over the surface – the slip speed. For longitudinal friction systems, the slip speed is influenced by the slip ratio, which determines the relative slip between the tyre contact patch, and the test vehicle speed. For transverse friction systems the slip speed as a proportion of the vehicle speed is governed by the cosine of the slip angle of the test wheel. The general principle relating to the speed of the test vehicle is that changing the vehicle speed alters the slip speed and, as slip speed increases, skid resistance decreases. Theoretical models have been developed that represent these influences and Figure 3.1 is a three-dimensional figure illustrating visually how the percentage slip and vehicle speed interact.
10 20 30 40 50 60 70 80 90 100
908070605040302010 0
0.1
0.2
0.3
0.4
0.5
0.6
0.7
Friction
Percentage slip
Vehicle speed / km/h
Figure 3.1 Effect of vehicle speed and percentage slip on friction
The friction values in the graph in Figure 3.1 are purely illustrative. The actual underlying level of friction or skid resistance depends on the condition of the road at the time of
TYROSAFE Deliverable 04: Report on state-of-the-art of test methods
Date: 05/12/2008, Version: 4 22 (89)
measurement which, of course, is what is being assessed. The way in which measured skid resistance changes with speed also depends on characteristics of the road, in particular the macrotexure or texture depth of the surface. Currently, the influence of texture depth on the measurement process is not fully understood. Different devices respond differently to it depending on factors such as the type of tyre and the slip ratio. They may respond differently on different types of surfacing. This has been found to be one of the major factors influencing the process of harmonising measurements made on different principles and under different conditions. Although theoretical models have been developed to represent the influence of macrotexure, attempts to use these as a means of harmonising different types of measurement device have not been entirely successful and will be an important aspect to be considered by the TYROSAFE project. Clearly, even when using one type of device, it is important to control the speed at which measurements are made.
3.2 Test tyre All vehicle-based systems use pneumatic tyres on their test wheels. The properties of the test tyre are also an important aspect of the process of generating the frictional forces that are measured by skid-resistance devices. For this reason, test tyres for any particular type of device are usually standardised. Tyres vary widely in terms of their size, profile, tread pattern and depth as well as rubber properties. For this reason, most skid resistance devices use tyres specifically designed for skid resistance measurement. Some are device-specific while others are made to a defined specification and are used by more than one device. An important aspect of the test tyre is its tread profile. The principle that an individual device uses to make the measurements reflects a view taken by its designers as to what aspect of road/tyre friction is to be measured: similarly, the tread pattern chosen for the tyre will also reflect the purpose of the measurements. This is because the presence of tread on the tyre has an influence on the measurements, particularly in relation to speed, in a manner analogous to the macrotexure on the road. One or two devices use ordinary vehicle patterned tyres (albeit of one specific size and type) and some use standardised ribbed tyres, but most devices use smooth tyres. The properties of the rubber vary and whereas a vehicle tyre is typically designed to maximise wet grip, skid resistance test tyre properties are often deliberately designed to be sensitive to the condition of the road, especially at low grip levels. Measurements from slider devices may also be influenced markedly by the properties of the rubber from which the sliders are made.
TYROSAFE Deliverable 04: Report on state-of-the-art of test methods
Date: 05/12/2008, Version: 4 23 (89)
3.3 Load on test wheel All vehicle-based skid resistance measurements rely on a measurement of the coefficient of friction between a sliding test wheel and the road surface. To compute this value, both the frictional force reacting against the braked or angled wheel (which is normally directly measured by the device) and the vertical load acting on the wheel are needed. The vertical load is normally achieved either by a static load acting on the test wheel or by application of a downward force through a controlled loading system. In a classical physical situation, the coefficient of friction between two surfaces under a given set of conditions is a constant and any changes in load should be balanced by a change in the reaction force. However, the response of a test tyre sliding over a textured road is not classical and, although the principle is broadly true, there will be some variations. The load is likely to vary during the test depending on the design of the system and the way in which it responds to factors such as unevenness in the road surface. Clearly, therefore, vertical load must be controlled in some way. Some devices using a static load assume that the load is constant on average for the period over which a single measurement is made. Other devices measure the vertical load directly, simultaneously with the frictional force, smoothing out short-term variations by averaging results over a defined length of road or time interval. Analogous principles apply to slider systems which use springs or static weight to apply the load.
3.4 Water Skid resistance measurements are normally made on a wetted road surface. The amount of water on the road can have an influence on the measurements depending on the nature of the surface and other test conditions (such as speed). Too little water may lead to localised dry conditions developing in the tyre contact area, resulting in higher than expected measurements. Too much water could lead to hydrostatic pressure building and influencing the frictional force or even, in an extreme case, leading to aquaplaning and markedly reduced friction. In the latter case, of course, the test tyre would no longer be in contact with the road. It is important that there is some control over the water on the road. Vehicle-based systems generally carry their own water supply tank and water which is fed at a controlled rate, either through gravity or by a pump, through a special nozzle to wet the road just in front of the test tyre. The water depth is often specified, usually in terms of an average depth above a smooth texture. In practice, even with a closely-controlled delivery system, the actual depth of the water film on the road surface varies widely, particularly depending on the nature and shape
TYROSAFE Deliverable 04: Report on state-of-the-art of test methods
Date: 05/12/2008, Version: 4 24 (89)
of the surface itself and other factors such as the time between the water hitting the road and the test tyre reaching it, as well as water already being carried on the test tyre itself. Slider systems are also influenced by the amount of water, and normally copious amounts are required.
3.5 Temperature Skid resistance measurements can be influenced by temperature, particularly the temperature of the test tyre which can influence the properties of the tyre rubber, especially at extreme levels. Across the range of European countries, the temperatures that can occur both in the air and on the road can vary widely. There may be restrictions in individual countries on the ambient conditions in which measurements can be made (perhaps to reduce the risk of water being applied to a surface that may freeze). However, there is no general agreement as to exactly what the influences of temperature are or how they should be taken into account. Some devices are equipped to measure air temperature, some the road temperature and these values may be used to adjust the measurements to reflect standard conditions. Others rely on the assumption that in the temperature of the tyre is largely governed by cooling effect of the water used to wet the road, that the variation from this source is generally small compared with the natural variability of the road and test tyres, and therefore makes a small contribution to the variability of the test method. Temperature, both ambient and of the road, is also an important factor for slider systems, particularly the pendulum type, because of the small contact area involved and the small mass of the slider. Specifications for using such systems often require temperature to be measured and apply a correction factor to reflect “standard” conditions.
TYROSAFE Deliverable 04: Report on state-of-the-art of test methods
Date: 05/12/2008, Version: 4 25 (89)
4 Identifying current devices used to measure skid resistance
The purpose of this report is to summarise the “state of the art” in relation to skid resistance measurement methods and therefore it summarises what is known about the various devices used in Europe for this purpose. It was known from earlier work (particularly that of the CEN Working Group and the FEHRL HERMES research project) that a large number of different devices were in use across Europe. Some, such as SCRIM and GripTester, which are built commercially and marketed across the world, are used in many countries and in large fleets: others devices are unique and only used in the country in which they were made. The HERMES project found that one of the factors affecting the quality of the harmonisation process being investigated was the different conditions and methods of operating the equipment that were used, even for nominally similar devices. The operation and calibration of some devices was clearly set out in published national standards, although not always consistently applied, whereas other devices appeared to rely upon the local knowledge and practice of their operating team. As a step to move the harmonisation process forward, the CEN group initiated the preparation of a series of “Technical Specifications” which would set out in a consistent way the fundamental features of each device and how they should be used. The idea was that devices should have a clear written technical specification before they could be operated in association with any harmonised CEN procedure for dynamic measurement of skid resistance. To date, draft Technical Specifications have been prepared for twelve devices which are described Chapter 5. Other devices used in European countries are listed in Chapter 6. Information about this second group of derives primarily from the personal knowledge of members of the TYROSAFE project team. For some of this second set of devices, CEN Technical Specifications are being prepared but were not available at the time of writing, which is why they are included in this separate chapter. Some have national or other standards describing their use, others do not. The precision of the measurements is obviously an important factor in interpreting and utilising the results of the test equipment. However, the approach taken to defining this by the various organisations that prepared the technical specifications varies widely. Some devices are operated in an environment in which formal estimates of repeatability and reproducibility following standard procedures can be made. However, others are not and there are no formal assessments, although some use of repeatability concepts are incorporated into the technical specifications. For many devices it is not always possible to assess reproducibility because there are insufficient devices of the same type available and although values for “R” are sometimes quoted, they may not fully represent reproducibility conditions. For these reasons it has not been possible to standardise the way in which the precision information is presented for the individual devices.
TYROSAFE Deliverable 04: Report on state-of-the-art of test methods
Date: 05/12/2008, Version: 4 26 (89)
The information given in Chapters 5 and 6 has been drawn (or inferred) from the CEN draft Technical Specifications or other documents available to the project team, supplemented by personal knowledge in some instances. The information for each device is presented in a similar way:
• What the device looks like: a short description and photograph where available. • What the device measures: a brief definition of the measurement made, including
an indication of precision where this is available. • How the device works: a summary of the way in which the equipment works,
including (for the CEN TS devices) a table summarising the operating conditions that are standardised.
Calibration information, where this is known, is included in Appendix 1. It has not been possible at the time of writing to provide some details for all machines where this information was not immediately available.
TYROSAFE Deliverable 04: Report on state-of-the-art of test methods
Date: 05/12/2008, Version: 4 27 (89)
5 Skid-resistance devices identified by CEN/TC227/WG5 The twelve devices for which CEN Technical Specifications have been prepared are (in alphabetical order):
1. ADHERA; 2. BV11 and Saab Friction Tester; 3. GripTester; 4. RoadSTAR; 5. ROAR DK; 6. ROAR NL; 7. RWS NL Skid Resistance Trailer; 8. SCRIM; 9. Skiddometer BV8; 10. SKM; 11. SRM; 12. Tatra Runway Tester.
The main characteristics and the test procedure for each of these devices are set out in sections 5.1 to 5.12, using information taken from the descriptions in their respective Technical Specifications [1-12]. The level of detailed description in those documents varies and so, for brevity, only the basic features of each device are summarised here. There is inevitably some variation in the output from the measurement sensors as the device travels along the road and therefore the data are typically averaged over a defined length before recording a value to represent the measured skid resistance. The detail tables, which are taken directly from the Technical Specification documents, usually include an entry for the “length for the mean value”. This represents the distance along the road over which individual interval sensor readings are normally averaged before recording a result. In some cases, however, while the device may report a value over a short distance, several individual results may be aggregated to represent a section of road, for example over 100m. It is not always clear from the TS information which of these situations apply so at present there may be some ambiguity when comparing devices. For ease of reference and formatting, the description of each device begins on a new page.
TYROSAFE Deliverable 04: Report on state-of-the-art of test methods
Date: 05/12/2008, Version: 4 28 (89)
5.1 ADHERA
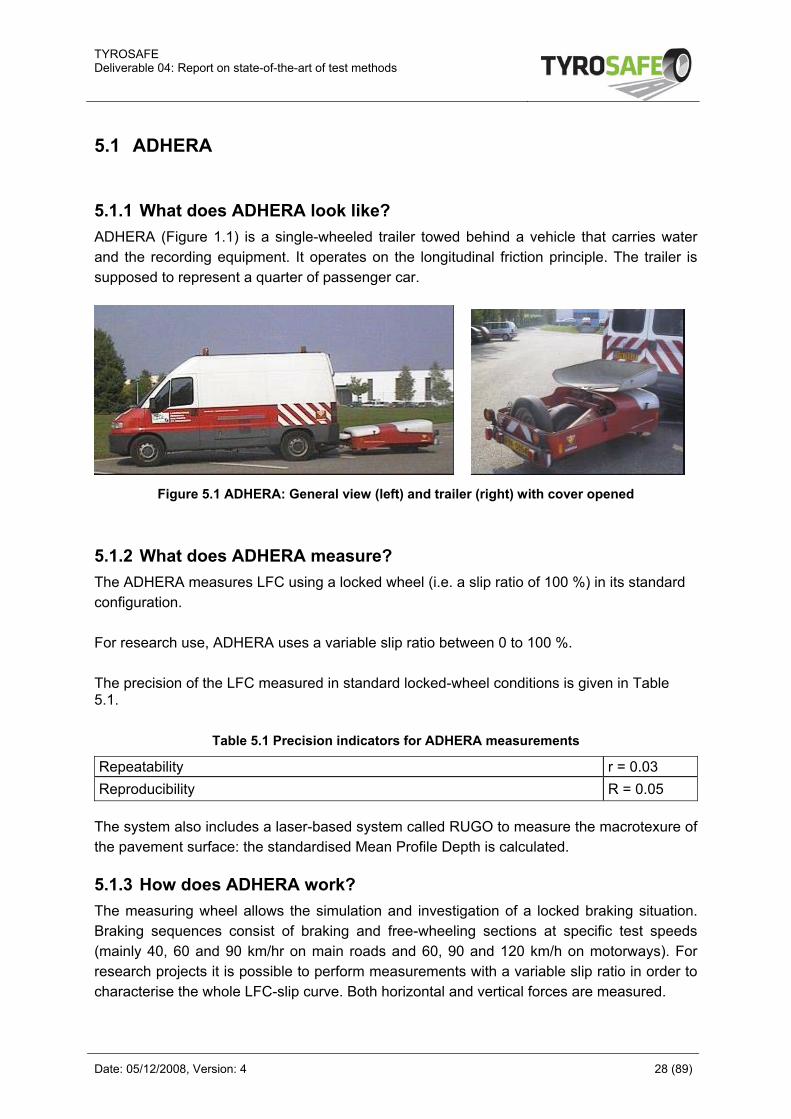
5.1.1 What does ADHERA look like? ADHERA (Figure 1.1) is a single-wheeled trailer towed behind a vehicle that carries water and the recording equipment. It operates on the longitudinal friction principle. The trailer is supposed to represent a quarter of passenger car.
Figure 5.1 ADHERA: General view (left) and trailer (right) with cover opened
5.1.2 What does ADHERA measure? The ADHERA measures LFC using a locked wheel (i.e. a slip ratio of 100 %) in its standard configuration. For research use, ADHERA uses a variable slip ratio between 0 to 100 %. The precision of the LFC measured in standard locked-wheel conditions is given in Table 5.1.
Table 5.1 Precision indicators for ADHERA measurements
Repeatability r = 0.03 Reproducibility R = 0.05
The system also includes a laser-based system called RUGO to measure the macrotexure of the pavement surface: the standardised Mean Profile Depth is calculated.
5.1.3 How does ADHERA work? The measuring wheel allows the simulation and investigation of a locked braking situation. Braking sequences consist of braking and free-wheeling sections at specific test speeds (mainly 40, 60 and 90 km/hr on main roads and 60, 90 and 120 km/h on motorways). For research projects it is possible to perform measurements with a variable slip ratio in order to characterise the whole LFC-slip curve. Both horizontal and vertical forces are measured.
TYROSAFE Deliverable 04: Report on state-of-the-art of test methods
Date: 05/12/2008, Version: 4 29 (89)
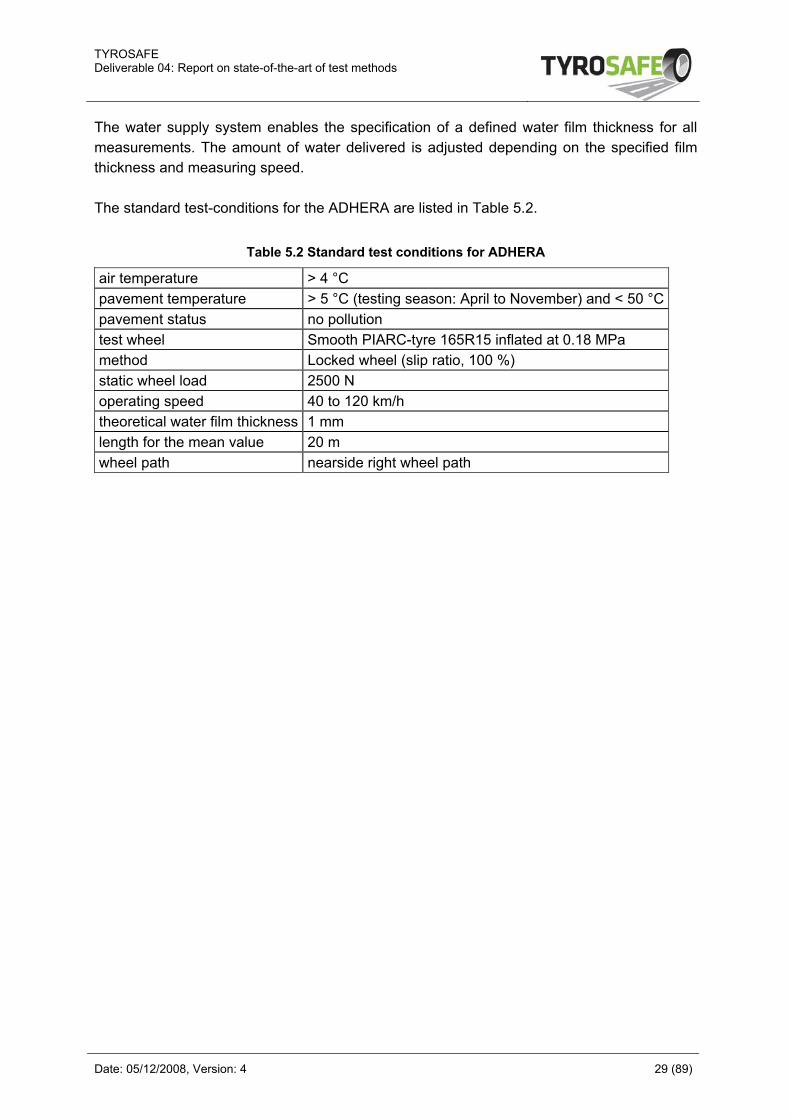
The water supply system enables the specification of a defined water film thickness for all measurements. The amount of water delivered is adjusted depending on the specified film thickness and measuring speed. The standard test-conditions for the ADHERA are listed in Table 5.2.
Table 5.2 Standard test conditions for ADHERA
air temperature > 4 °C pavement temperature > 5 °C (testing season: April to November) and < 50 °Cpavement status no pollution test wheel Smooth PIARC-tyre 165R15 inflated at 0.18 MPa method Locked wheel (slip ratio, 100 %) static wheel load 2500 N operating speed 40 to 120 km/h theoretical water film thickness 1 mm length for the mean value 20 m wheel path nearside right wheel path
TYROSAFE Deliverable 04: Report on state-of-the-art of test methods
Date: 05/12/2008, Version: 4 30 (89)
5.2 BV-11 and SFT (Saab Friction Tester)
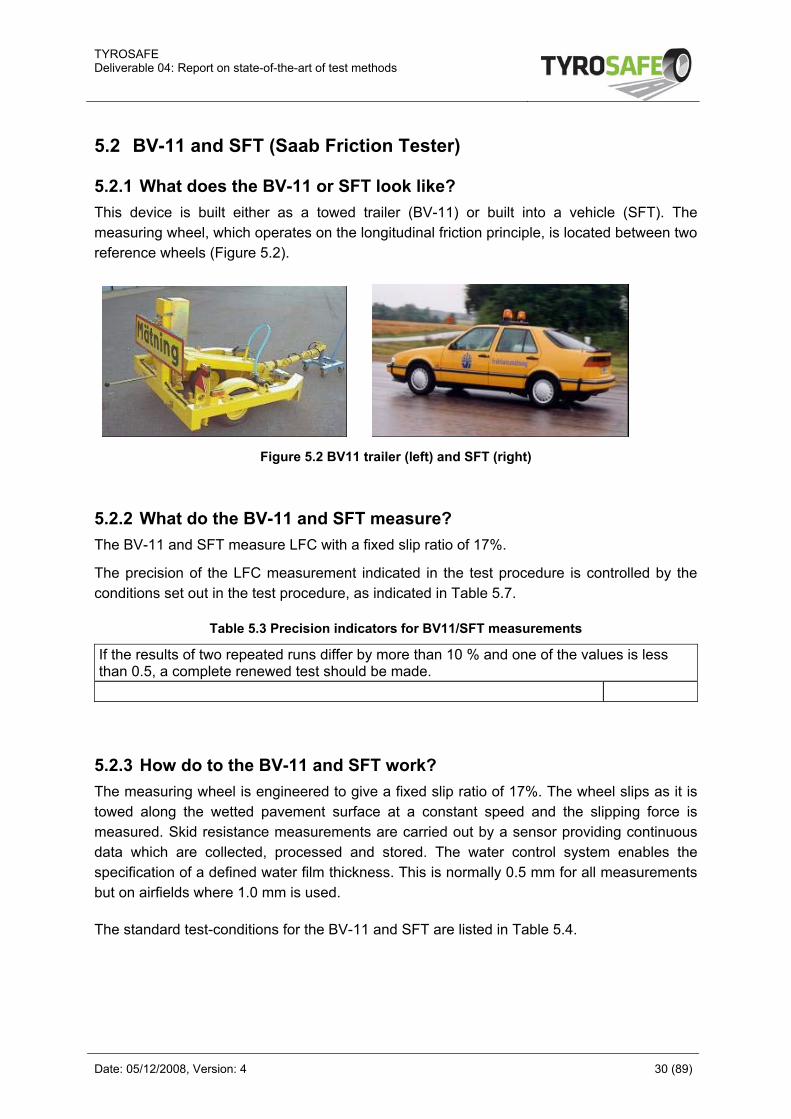
5.2.1 What does the BV-11 or SFT look like? This device is built either as a towed trailer (BV-11) or built into a vehicle (SFT). The measuring wheel, which operates on the longitudinal friction principle, is located between two reference wheels (Figure 5.2).
Figure 5.2 BV11 trailer (left) and SFT (right)
5.2.2 What do the BV-11 and SFT measure? The BV-11 and SFT measure LFC with a fixed slip ratio of 17%.
The precision of the LFC measurement indicated in the test procedure is controlled by the conditions set out in the test procedure, as indicated in Table 5.7.
Table 5.3 Precision indicators for BV11/SFT measurements
If the results of two repeated runs differ by more than 10 % and one of the values is less than 0.5, a complete renewed test should be made.
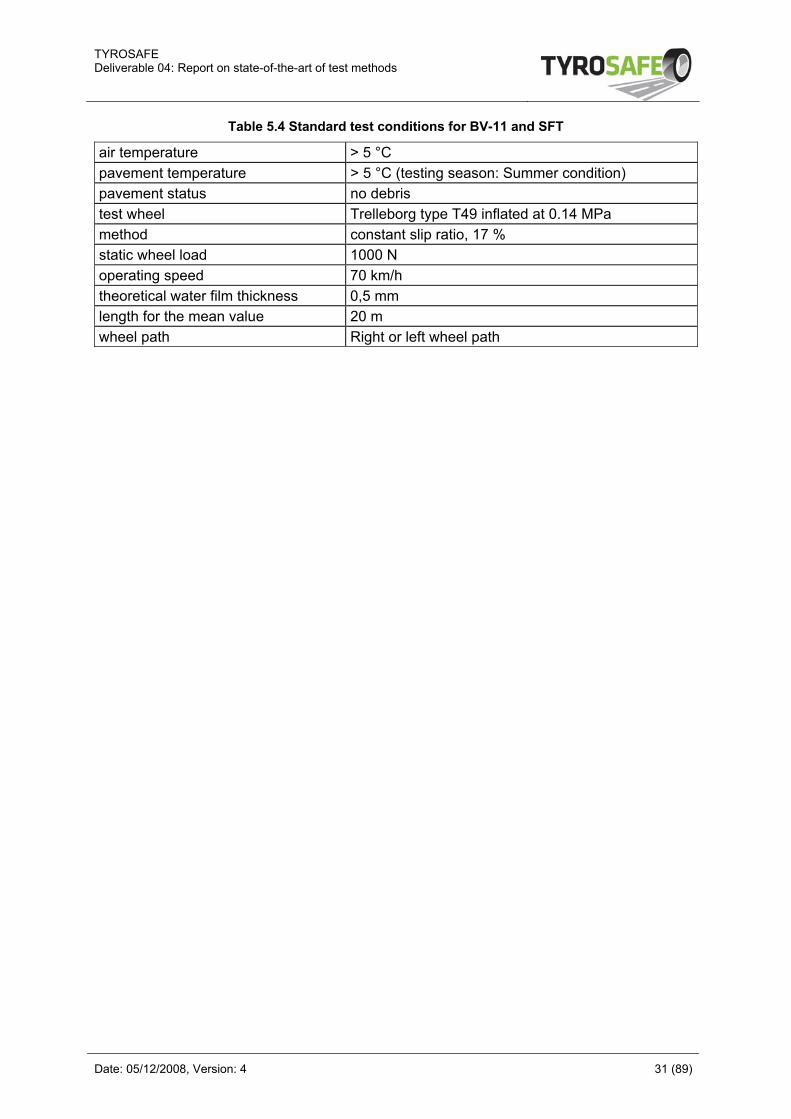
5.2.3 How do to the BV-11 and SFT work? The measuring wheel is engineered to give a fixed slip ratio of 17%. The wheel slips as it is towed along the wetted pavement surface at a constant speed and the slipping force is measured. Skid resistance measurements are carried out by a sensor providing continuous data which are collected, processed and stored. The water control system enables the specification of a defined water film thickness. This is normally 0.5 mm for all measurements but on airfields where 1.0 mm is used. The standard test-conditions for the BV-11 and SFT are listed in Table 5.4.
TYROSAFE Deliverable 04: Report on state-of-the-art of test methods
Date: 05/12/2008, Version: 4 31 (89)
Table 5.4 Standard test conditions for BV-11 and SFT
air temperature > 5 °C pavement temperature > 5 °C (testing season: Summer condition) pavement status no debris test wheel Trelleborg type T49 inflated at 0.14 MPa method constant slip ratio, 17 % static wheel load 1000 N operating speed 70 km/h theoretical water film thickness 0,5 mm length for the mean value 20 m wheel path Right or left wheel path
TYROSAFE Deliverable 04: Report on state-of-the-art of test methods
Date: 05/12/2008, Version: 4 32 (89)
5.3 GripTester
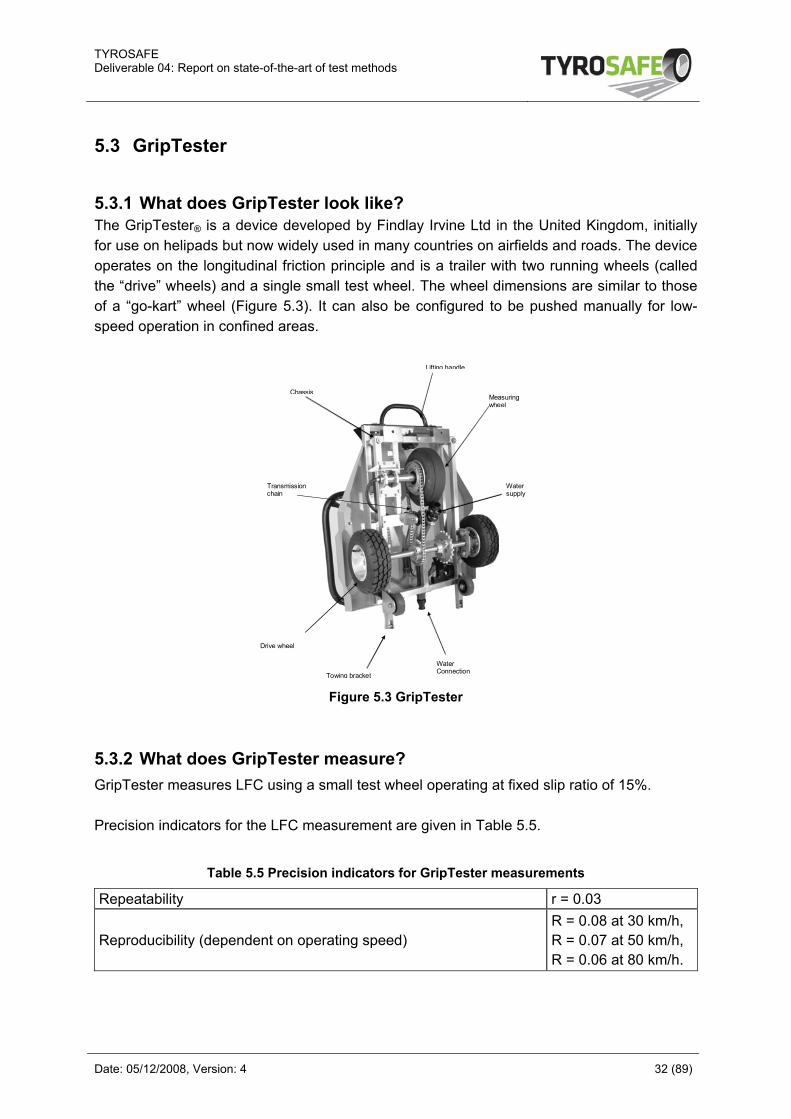
5.3.1 What does GripTester look like? The GripTester® is a device developed by Findlay Irvine Ltd in the United Kingdom, initially for use on helipads but now widely used in many countries on airfields and roads. The device operates on the longitudinal friction principle and is a trailer with two running wheels (called the “drive” wheels) and a single small test wheel. The wheel dimensions are similar to those of a “go-kart” wheel (Figure 5.3). It can also be configured to be pushed manually for low-speed operation in confined areas.
Drive wheel
Towing bracket
Water Connection
Measuring wheel
Lifting handle
Transmission chain
Chassis
Water supply
Figure 5.3 GripTester
5.3.2 What does GripTester measure? GripTester measures LFC using a small test wheel operating at fixed slip ratio of 15%. Precision indicators for the LFC measurement are given in Table 5.5.
Table 5.5 Precision indicators for GripTester measurements
Repeatability r = 0.03
Reproducibility (dependent on operating speed) R = 0.08 at 30 km/h, R = 0.07 at 50 km/h, R = 0.06 at 80 km/h.
TYROSAFE Deliverable 04: Report on state-of-the-art of test methods
Date: 05/12/2008, Version: 4 33 (89)
5.3.3 How does GripTester work? The test wheel is mounted on a stub axle and is mechanically braked by a fixed gear and chain system linking it to the drive wheel axle. The gear ratio is 27:32 in relation to the drive wheels so that there is a slip ratio of just over 15%. The wheel slips as it is towed along the wetted pavement surface at a constant speed and the slipping force and vertical load are both measured. The static load on the test wheel is (250 ± 30) N when towed or (260 ± 30) N when used in push mode (in the latter case a small water container is mounted on the device itself, adding to the load). During operation, the stub axle becomes elastically deformed by the horizontal drag and vertical load forces acting on the test tyre. Two strain gauge bridges on the stub axle continuously measure the horizontal drag and vertical load forces. The two drive wheels are mounted on the main axle, which also carries a toothed wheel. A proximity sensor generates signals for distance recording. For normal wet road testing, water is deposited in front of the test tyre from a water tank fitted with a control valve. A water nozzle is mounted directly in front of the test wheel delivering a controlled amount of water to the road surface. In towing mode, water flow rate is further controlled by a pump and may be monitored with a flow meter. The standard test-conditions for the GripTester are listed in Table 5.6.
Table 5.6 Standard test conditions for GripTester
air temperature > 4 °C pavement temperature > 5 °C and < 50 °C pavement status no pollution test wheel smooth ASTM-tyre 254 mm in diameter inflated at
0.14 MPa method constant slip ratio, 15 % static wheel load 250 ± 20 N operating speed 5 km/h to 100 km/h theoretical water film thickness 0.5 mm minimum recording length Optional, typically 10 m or 20 m. wheel path Normally nearside wheel path or as required
TYROSAFE Deliverable 04: Report on state-of-the-art of test methods
Date: 05/12/2008, Version: 4 34 (89)
5.4 RoadSTAR
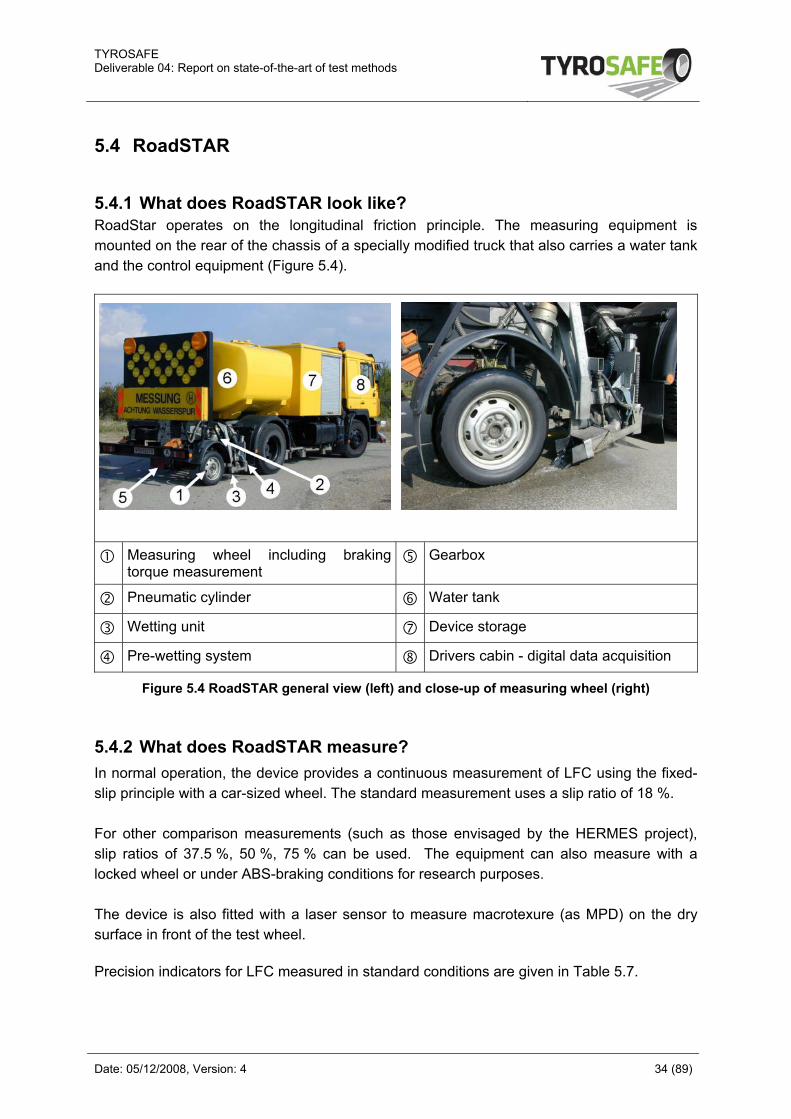
5.4.1 What does RoadSTAR look like? RoadStar operates on the longitudinal friction principle. The measuring equipment is mounted on the rear of the chassis of a specially modified truck that also carries a water tank and the control equipment (Figure 5.4).
Measuring wheel including braking torque measurement
Gearbox
Pneumatic cylinder Water tank
Wetting unit Device storage
Pre-wetting system Drivers cabin - digital data acquisition
Figure 5.4 RoadSTAR general view (left) and close-up of measuring wheel (right)
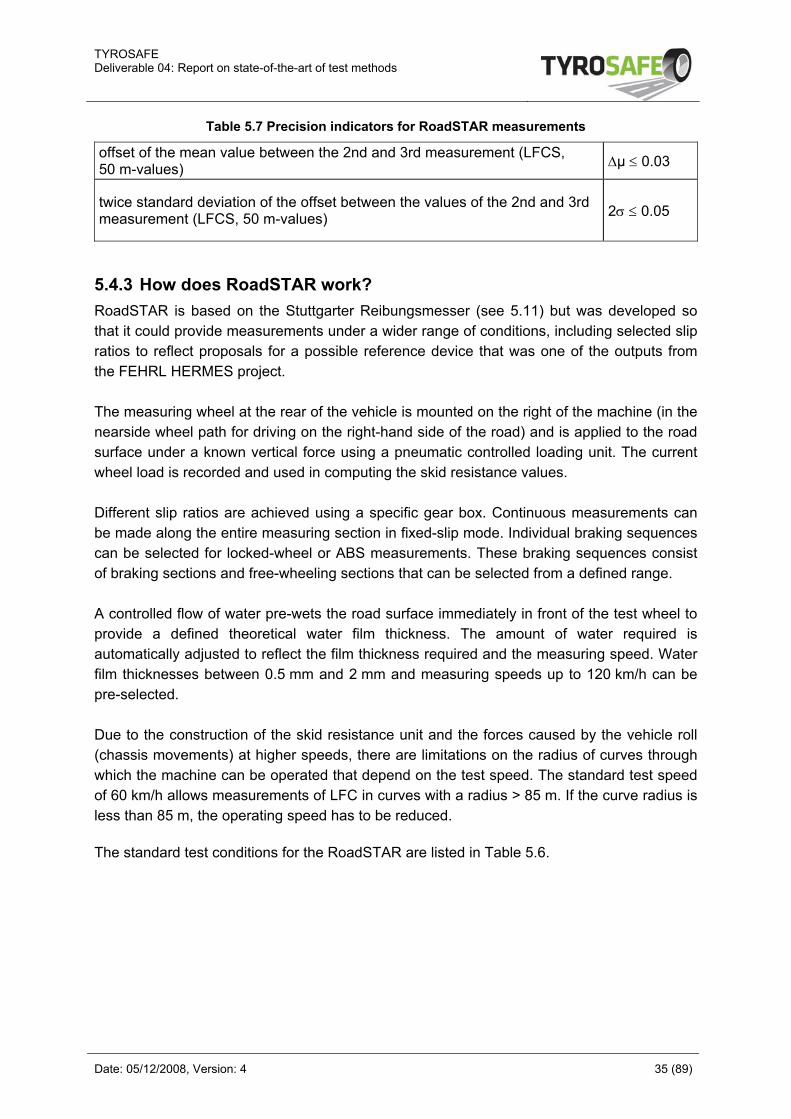
5.4.2 What does RoadSTAR measure? In normal operation, the device provides a continuous measurement of LFC using the fixed-slip principle with a car-sized wheel. The standard measurement uses a slip ratio of 18 %. For other comparison measurements (such as those envisaged by the HERMES project), slip ratios of 37.5 %, 50 %, 75 % can be used. The equipment can also measure with a locked wheel or under ABS-braking conditions for research purposes. The device is also fitted with a laser sensor to measure macrotexure (as MPD) on the dry surface in front of the test wheel. Precision indicators for LFC measured in standard conditions are given in Table 5.7.
TYROSAFE Deliverable 04: Report on state-of-the-art of test methods
Date: 05/12/2008, Version: 4 35 (89)
Table 5.7 Precision indicators for RoadSTAR measurements
offset of the mean value between the 2nd and 3rd measurement (LFCS, 50 m-values) Δµ ≤ 0.03
twice standard deviation of the offset between the values of the 2nd and 3rd measurement (LFCS, 50 m-values) 2σ ≤ 0.05
5.4.3 How does RoadSTAR work? RoadSTAR is based on the Stuttgarter Reibungsmesser (see 5.11) but was developed so that it could provide measurements under a wider range of conditions, including selected slip ratios to reflect proposals for a possible reference device that was one of the outputs from the FEHRL HERMES project. The measuring wheel at the rear of the vehicle is mounted on the right of the machine (in the nearside wheel path for driving on the right-hand side of the road) and is applied to the road surface under a known vertical force using a pneumatic controlled loading unit. The current wheel load is recorded and used in computing the skid resistance values. Different slip ratios are achieved using a specific gear box. Continuous measurements can be made along the entire measuring section in fixed-slip mode. Individual braking sequences can be selected for locked-wheel or ABS measurements. These braking sequences consist of braking sections and free-wheeling sections that can be selected from a defined range. A controlled flow of water pre-wets the road surface immediately in front of the test wheel to provide a defined theoretical water film thickness. The amount of water required is automatically adjusted to reflect the film thickness required and the measuring speed. Water film thicknesses between 0.5 mm and 2 mm and measuring speeds up to 120 km/h can be pre-selected. Due to the construction of the skid resistance unit and the forces caused by the vehicle roll (chassis movements) at higher speeds, there are limitations on the radius of curves through which the machine can be operated that depend on the test speed. The standard test speed of 60 km/h allows measurements of LFC in curves with a radius > 85 m. If the curve radius is less than 85 m, the operating speed has to be reduced. The standard test conditions for the RoadSTAR are listed in Table 5.6.
TYROSAFE Deliverable 04: Report on state-of-the-art of test methods
Date: 05/12/2008, Version: 4 36 (89)
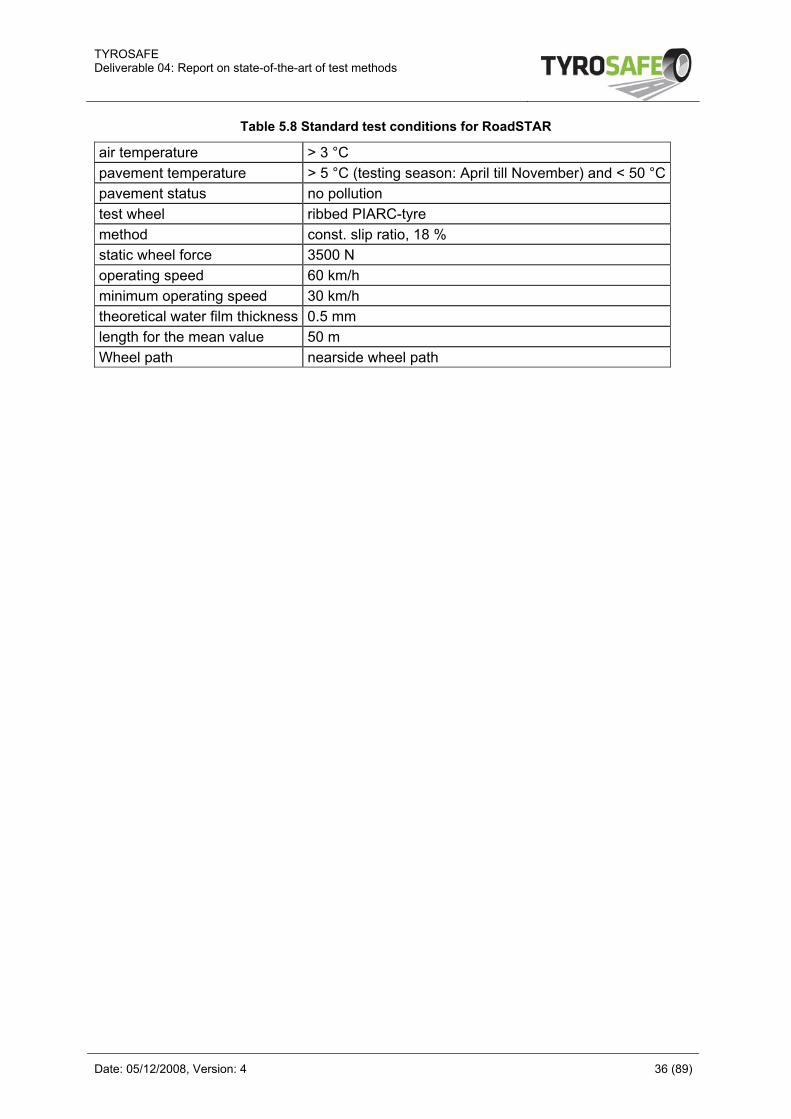
Table 5.8 Standard test conditions for RoadSTAR
air temperature > 3 °C pavement temperature > 5 °C (testing season: April till November) and < 50 °Cpavement status no pollution test wheel ribbed PIARC-tyre method const. slip ratio, 18 % static wheel force 3500 N operating speed 60 km/h minimum operating speed 30 km/h theoretical water film thickness 0.5 mm length for the mean value 50 m Wheel path nearside wheel path
TYROSAFE Deliverable 04: Report on state-of-the-art of test methods
Date: 05/12/2008, Version: 4 37 (89)
5.5 ROAR DK
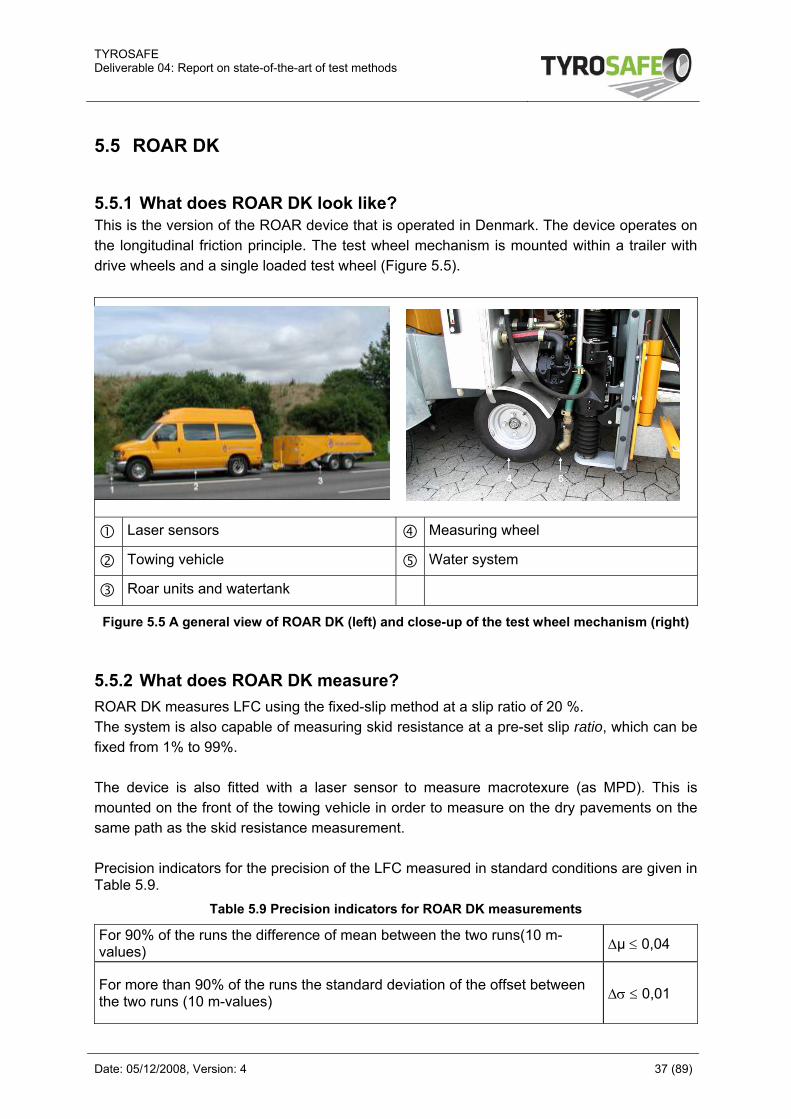
5.5.1 What does ROAR DK look like? This is the version of the ROAR device that is operated in Denmark. The device operates on the longitudinal friction principle. The test wheel mechanism is mounted within a trailer with drive wheels and a single loaded test wheel (Figure 5.5).
Laser sensors Measuring wheel
Towing vehicle Water system
Roar units and watertank
Figure 5.5 A general view of ROAR DK (left) and close-up of the test wheel mechanism (right)
5.5.2 What does ROAR DK measure? ROAR DK measures LFC using the fixed-slip method at a slip ratio of 20 %. The system is also capable of measuring skid resistance at a pre-set slip ratio, which can be fixed from 1% to 99%. The device is also fitted with a laser sensor to measure macrotexure (as MPD). This is mounted on the front of the towing vehicle in order to measure on the dry pavements on the same path as the skid resistance measurement. Precision indicators for the precision of the LFC measured in standard conditions are given in Table 5.9.
Table 5.9 Precision indicators for ROAR DK measurements
For 90% of the runs the difference of mean between the two runs(10 m-values) Δµ ≤ 0,04
For more than 90% of the runs the standard deviation of the offset between the two runs (10 m-values) Δσ ≤ 0,01
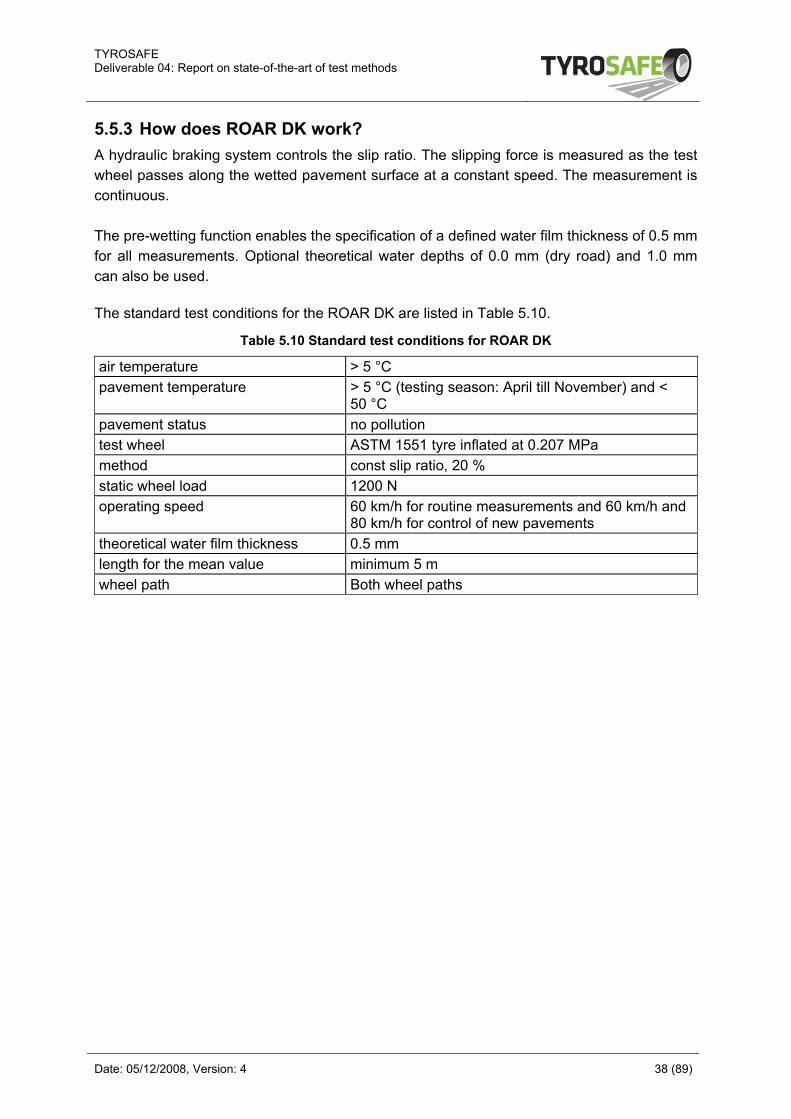
TYROSAFE Deliverable 04: Report on state-of-the-art of test methods
Date: 05/12/2008, Version: 4 38 (89)
5.5.3 How does ROAR DK work? A hydraulic braking system controls the slip ratio. The slipping force is measured as the test wheel passes along the wetted pavement surface at a constant speed. The measurement is continuous. The pre-wetting function enables the specification of a defined water film thickness of 0.5 mm for all measurements. Optional theoretical water depths of 0.0 mm (dry road) and 1.0 mm can also be used. The standard test conditions for the ROAR DK are listed in Table 5.10.
Table 5.10 Standard test conditions for ROAR DK
air temperature > 5 °C pavement temperature > 5 °C (testing season: April till November) and <
50 °C pavement status no pollution test wheel ASTM 1551 tyre inflated at 0.207 MPa method const slip ratio, 20 % static wheel load 1200 N operating speed 60 km/h for routine measurements and 60 km/h and
80 km/h for control of new pavements theoretical water film thickness 0.5 mm length for the mean value minimum 5 m wheel path Both wheel paths
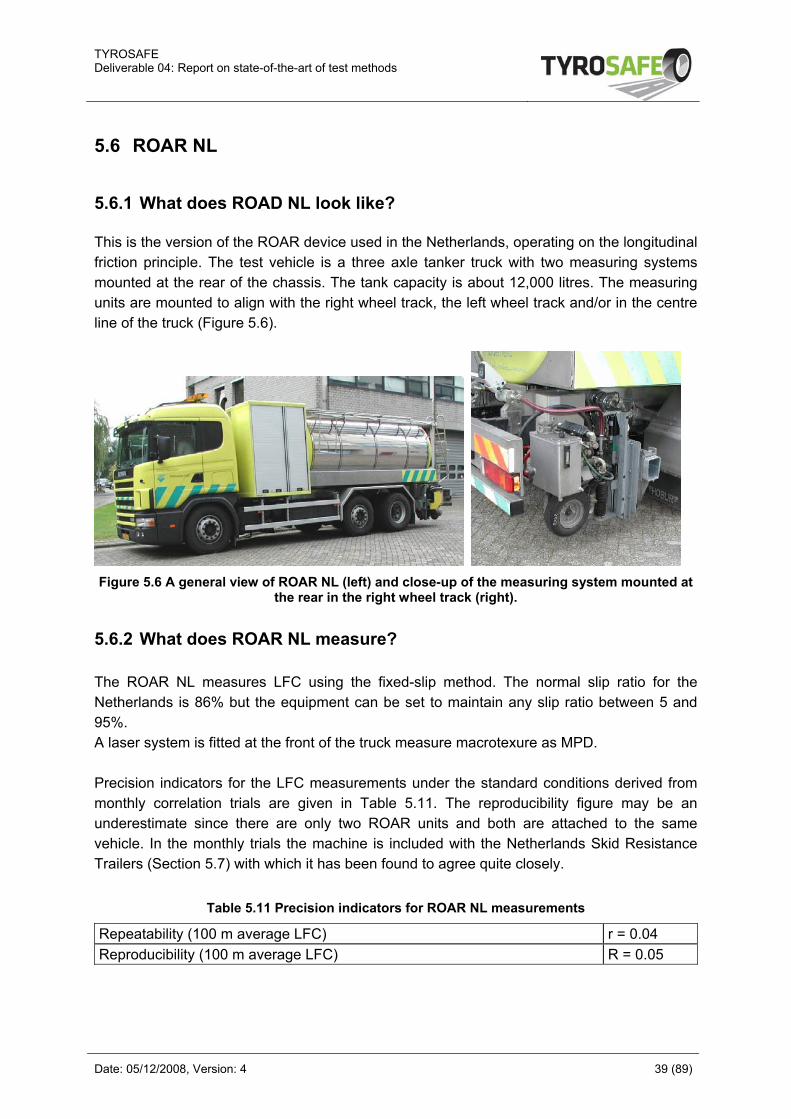
TYROSAFE Deliverable 04: Report on state-of-the-art of test methods
Date: 05/12/2008, Version: 4 39 (89)
5.6 ROAR NL
5.6.1 What does ROAD NL look like? This is the version of the ROAR device used in the Netherlands, operating on the longitudinal friction principle. The test vehicle is a three axle tanker truck with two measuring systems mounted at the rear of the chassis. The tank capacity is about 12,000 litres. The measuring units are mounted to align with the right wheel track, the left wheel track and/or in the centre line of the truck (Figure 5.6).
Figure 5.6 A general view of ROAR NL (left) and close-up of the measuring system mounted at
the rear in the right wheel track (right).
5.6.2 What does ROAR NL measure? The ROAR NL measures LFC using the fixed-slip method. The normal slip ratio for the Netherlands is 86% but the equipment can be set to maintain any slip ratio between 5 and 95%. A laser system is fitted at the front of the truck measure macrotexure as MPD. Precision indicators for the LFC measurements under the standard conditions derived from monthly correlation trials are given in Table 5.11. The reproducibility figure may be an underestimate since there are only two ROAR units and both are attached to the same vehicle. In the monthly trials the machine is included with the Netherlands Skid Resistance Trailers (Section 5.7) with which it has been found to agree quite closely.
Table 5.11 Precision indicators for ROAR NL measurements
Repeatability (100 m average LFC) r = 0.04 Reproducibility (100 m average LFC) R = 0.05
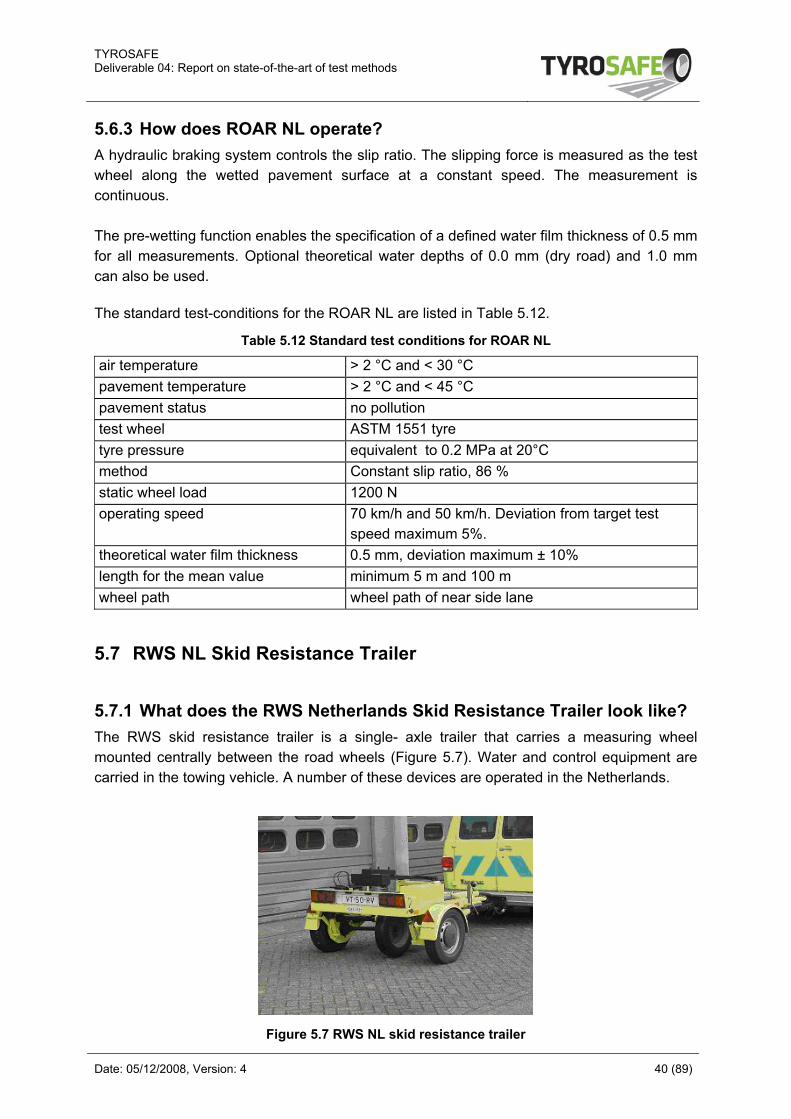
TYROSAFE Deliverable 04: Report on state-of-the-art of test methods
Date: 05/12/2008, Version: 4 40 (89)
5.6.3 How does ROAR NL operate? A hydraulic braking system controls the slip ratio. The slipping force is measured as the test wheel along the wetted pavement surface at a constant speed. The measurement is continuous. The pre-wetting function enables the specification of a defined water film thickness of 0.5 mm for all measurements. Optional theoretical water depths of 0.0 mm (dry road) and 1.0 mm can also be used. The standard test-conditions for the ROAR NL are listed in Table 5.12.
Table 5.12 Standard test conditions for ROAR NL
air temperature > 2 °C and < 30 °C pavement temperature > 2 °C and < 45 °C pavement status no pollution test wheel ASTM 1551 tyre tyre pressure equivalent to 0.2 MPa at 20°C method Constant slip ratio, 86 % static wheel load 1200 N operating speed 70 km/h and 50 km/h. Deviation from target test
speed maximum 5%. theoretical water film thickness 0.5 mm, deviation maximum ± 10% length for the mean value minimum 5 m and 100 m wheel path wheel path of near side lane
5.7 RWS NL Skid Resistance Trailer
5.7.1 What does the RWS Netherlands Skid Resistance Trailer look like? The RWS skid resistance trailer is a single- axle trailer that carries a measuring wheel mounted centrally between the road wheels (Figure 5.7). Water and control equipment are carried in the towing vehicle. A number of these devices are operated in the Netherlands.
Figure 5.7 RWS NL skid resistance trailer
TYROSAFE Deliverable 04: Report on state-of-the-art of test methods
Date: 05/12/2008, Version: 4 41 (89)
5.7.2 What does it measure? The RWS trailer measures LFC using the fixed slip method at a slip ratio of 86%. Precision indicators for the LFC measurements derived from monthly correlation trials are given in Table 5.13.
Table 5.13 Precision indicators for RWS Skid Resistance Trailer measurements
Repeatability (100 m average LFC) r = 0.04 Reproducibility (100 m average LFC) R = 0.05
5.7.3 How does it operate? The measuring wheel is connected via a mechanical transmission to one of the bearing wheels to achieve the slip ratio of 86%. This means that the circumferential speed of the standard test tyre is 14% of that of the bearing wheels. A water film thickness of 0,5 mm immediately in front of the test wheel is used for all measurements. The standard test conditions for the RWS Trailer are listed in Table 5.14.
Table 5.14 Standard test conditions for the RWS Skid ResistanceTrailer
air temperature > 2 °C and < 30 °C pavement temperature > 2 °C and < 45 °C pavement status no pollution test wheel PIARC smooth 165 R15 tyre pressure equivalent to 0.2 MPa at 20°C method Constant slip ratio 86 % static wheel load 1962 N, deviation maximum ± 10 N operating speed 70 km/h and 50 km/h. Deviation from target test
speed maximum 5%. theoretical water film thickness 0,5 mm, deviation maximum ± 10% length for the mean value minimum 5 m, mostly 100 m wheel path wheel path of nearside lane; towing vehicle drives on
an offset line to achieve this
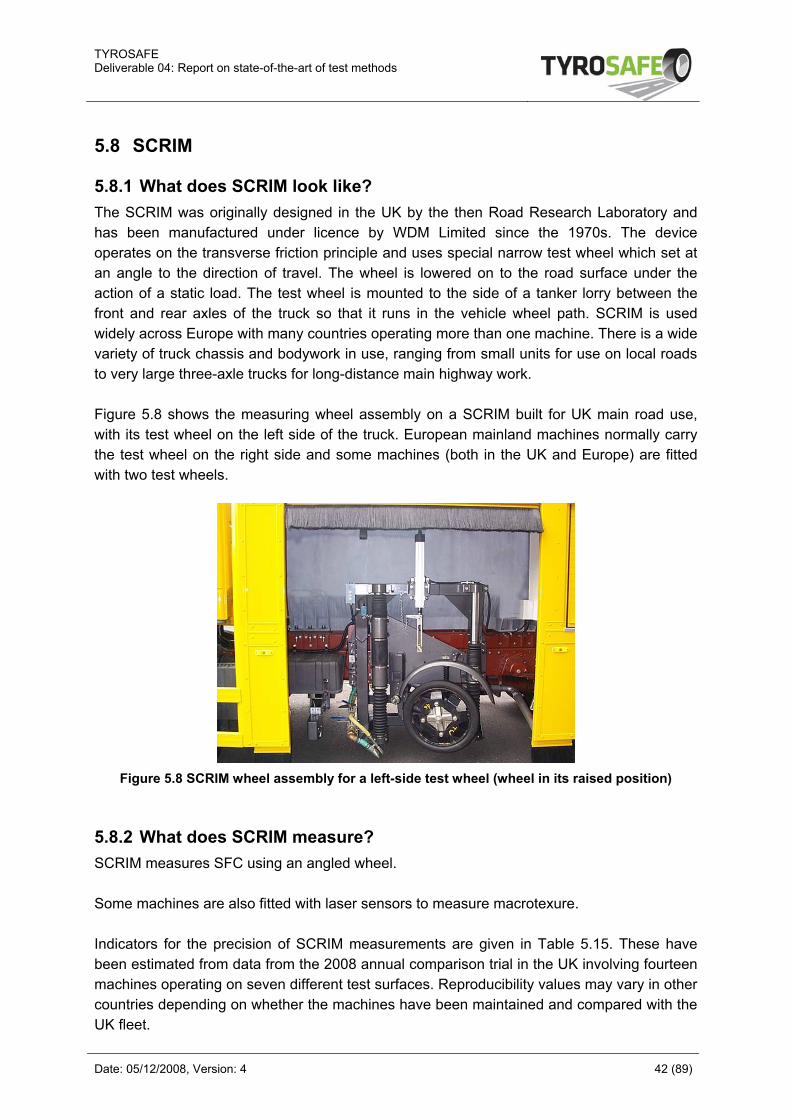
TYROSAFE Deliverable 04: Report on state-of-the-art of test methods
Date: 05/12/2008, Version: 4 42 (89)
5.8 SCRIM
5.8.1 What does SCRIM look like? The SCRIM was originally designed in the UK by the then Road Research Laboratory and has been manufactured under licence by WDM Limited since the 1970s. The device operates on the transverse friction principle and uses special narrow test wheel which set at an angle to the direction of travel. The wheel is lowered on to the road surface under the action of a static load. The test wheel is mounted to the side of a tanker lorry between the front and rear axles of the truck so that it runs in the vehicle wheel path. SCRIM is used widely across Europe with many countries operating more than one machine. There is a wide variety of truck chassis and bodywork in use, ranging from small units for use on local roads to very large three-axle trucks for long-distance main highway work. Figure 5.8 shows the measuring wheel assembly on a SCRIM built for UK main road use, with its test wheel on the left side of the truck. European mainland machines normally carry the test wheel on the right side and some machines (both in the UK and Europe) are fitted with two test wheels.
Figure 5.8 SCRIM wheel assembly for a left-side test wheel (wheel in its raised position)
5.8.2 What does SCRIM measure? SCRIM measures SFC using an angled wheel. Some machines are also fitted with laser sensors to measure macrotexure. Indicators for the precision of SCRIM measurements are given in Table 5.15. These have been estimated from data from the 2008 annual comparison trial in the UK involving fourteen machines operating on seven different test surfaces. Reproducibility values may vary in other countries depending on whether the machines have been maintained and compared with the UK fleet.
TYROSAFE Deliverable 04: Report on state-of-the-art of test methods
Date: 05/12/2008, Version: 4 43 (89)
Table 5.15 Precision indicators for SCRIM measurements
Repeatability (100 m average SFC) r < 0.03 Reproducibility (100 m average SFC) R < 0.07
5.8.3 How does SCRIM work? A freely rotating wheel fitted with a special pneumatic, smooth, rubber tyre, is mounted mid-machine in line with the nearside wheel path and set at an angle to the direction of travel of the vehicle. The wheel is lowered on to the road surface under the action of a static vertical load defined by the mass of the wheel assembly, which is able to move freely up and down on vertical linear guides. The force acting along the axle of the test wheel is measured and used to calculate the SFC. On some machines, particularly those operating in the UK, the dynamic vertical load is also simultaneously measured and used in the computation of SFC. The standard test conditions for the SCRIM are listed in Table 5.16.
Table 5.16 Standard test conditions for SCRIM
air temperature > 4 °C pavement temperature > 5 °C (testing season: April till November) and <
50 °C pavement status no pollution test wheel smooth tyre 76/508 mm inflated at 0.35 MPa method constant slip ratio from slip angle slip angle 20° static wheel load 1960 N operating speed Varies from country to country. Typically 50 km/h is
used as a reference speed but other speeds are sometimes used in operation for safety reasons with measurements corrected to the reference speed.
theoretical water film thickness 0.5 mm length for the mean value Minimum typically 10 m but other options available wheel path Normally nearside wheel path or as required
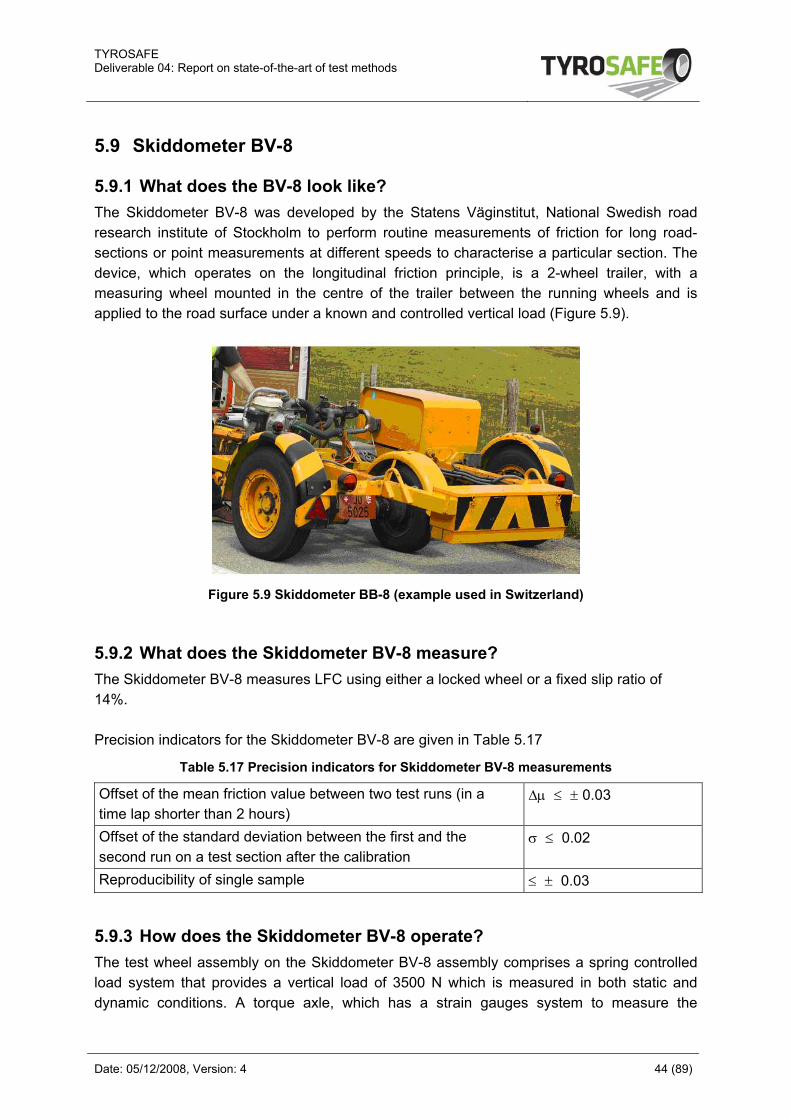
TYROSAFE Deliverable 04: Report on state-of-the-art of test methods
Date: 05/12/2008, Version: 4 44 (89)
5.9 Skiddometer BV-8
5.9.1 What does the BV-8 look like? The Skiddometer BV-8 was developed by the Statens Väginstitut, National Swedish road research institute of Stockholm to perform routine measurements of friction for long road-sections or point measurements at different speeds to characterise a particular section. The device, which operates on the longitudinal friction principle, is a 2-wheel trailer, with a measuring wheel mounted in the centre of the trailer between the running wheels and is applied to the road surface under a known and controlled vertical load (Figure 5.9).
Figure 5.9 Skiddometer BB-8 (example used in Switzerland)
5.9.2 What does the Skiddometer BV-8 measure? The Skiddometer BV-8 measures LFC using either a locked wheel or a fixed slip ratio of 14%. Precision indicators for the Skiddometer BV-8 are given in Table 5.17
Table 5.17 Precision indicators for Skiddometer BV-8 measurements
Offset of the mean friction value between two test runs (in a time lap shorter than 2 hours)
Δμ ≤ ± 0.03
Offset of the standard deviation between the first and the second run on a test section after the calibration
σ ≤ 0.02
Reproducibility of single sample ≤ ± 0.03
5.9.3 How does the Skiddometer BV-8 operate? The test wheel assembly on the Skiddometer BV-8 assembly comprises a spring controlled load system that provides a vertical load of 3500 N which is measured in both static and dynamic conditions. A torque axle, which has a strain gauges system to measure the
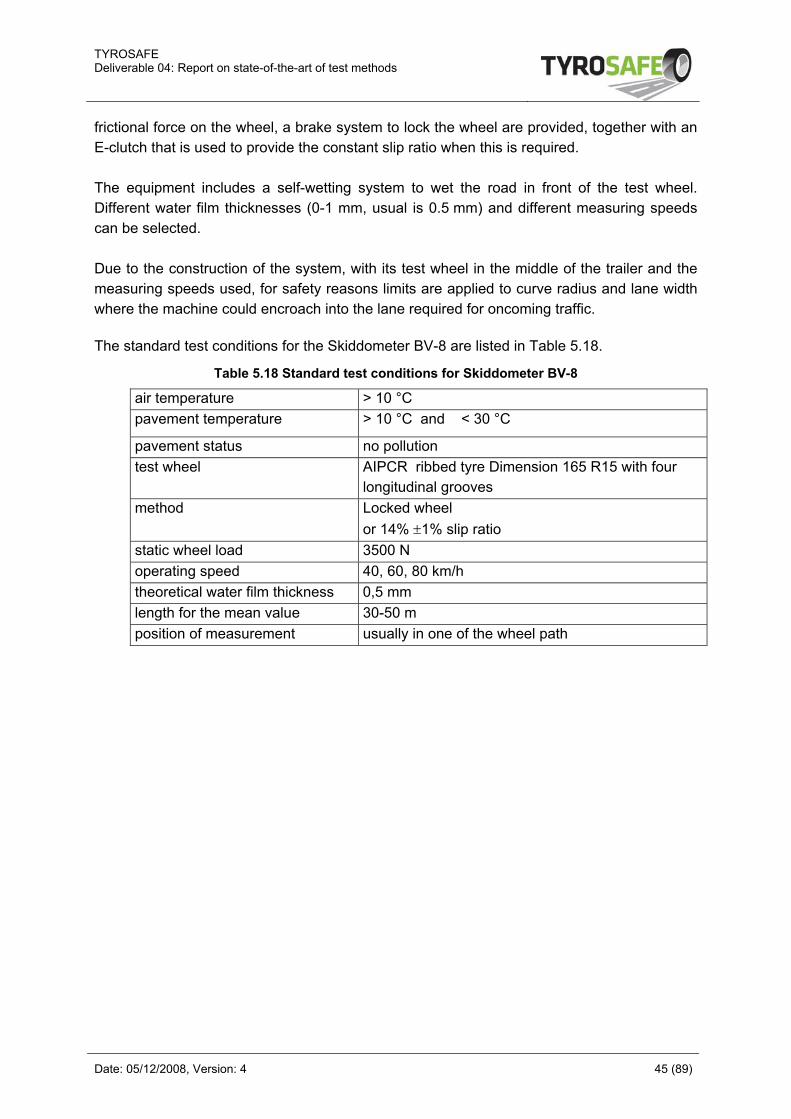
TYROSAFE Deliverable 04: Report on state-of-the-art of test methods
Date: 05/12/2008, Version: 4 45 (89)
frictional force on the wheel, a brake system to lock the wheel are provided, together with an E-clutch that is used to provide the constant slip ratio when this is required. The equipment includes a self-wetting system to wet the road in front of the test wheel. Different water film thicknesses (0-1 mm, usual is 0.5 mm) and different measuring speeds can be selected. Due to the construction of the system, with its test wheel in the middle of the trailer and the measuring speeds used, for safety reasons limits are applied to curve radius and lane width where the machine could encroach into the lane required for oncoming traffic. The standard test conditions for the Skiddometer BV-8 are listed in Table 5.18.
Table 5.18 Standard test conditions for Skiddometer BV-8
air temperature > 10 °C pavement temperature > 10 °C and < 30 °C
pavement status no pollution test wheel AIPCR ribbed tyre Dimension 165 R15 with four
longitudinal grooves method Locked wheel
or 14% ±1% slip ratio static wheel load 3500 N operating speed 40, 60, 80 km/h theoretical water film thickness 0,5 mm length for the mean value 30-50 m position of measurement usually in one of the wheel path
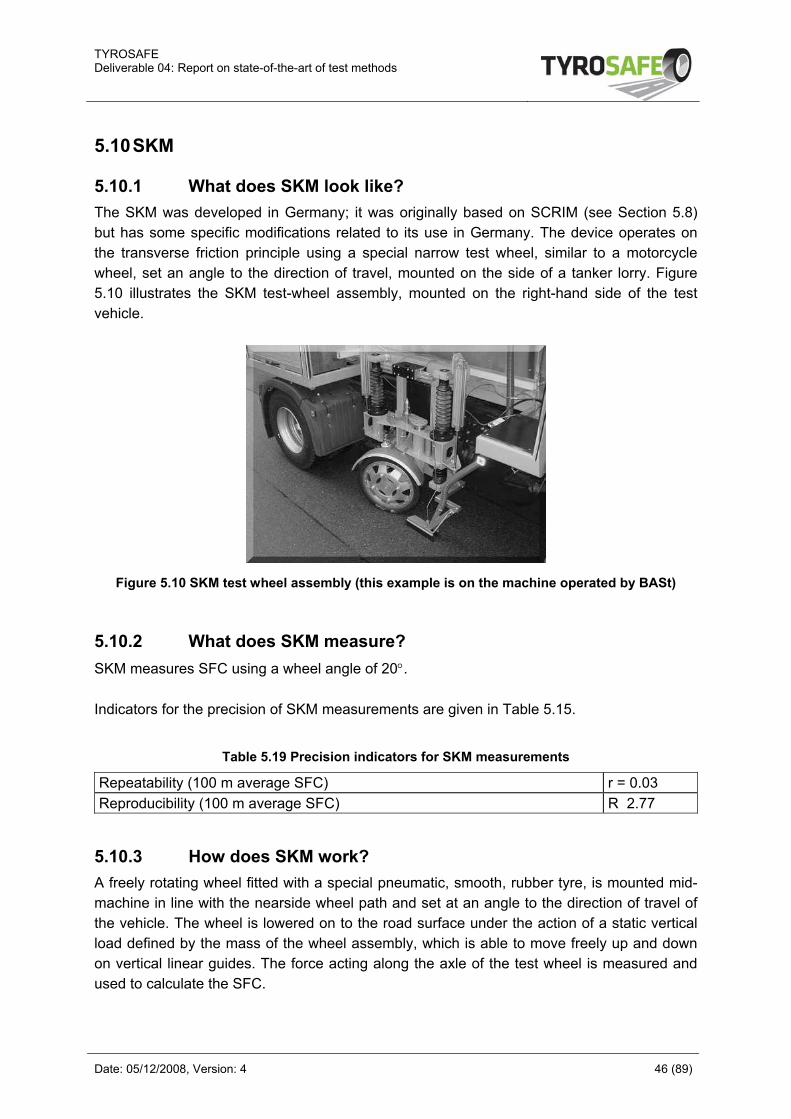
TYROSAFE Deliverable 04: Report on state-of-the-art of test methods
Date: 05/12/2008, Version: 4 46 (89)
5.10 SKM
5.10.1 What does SKM look like? The SKM was developed in Germany; it was originally based on SCRIM (see Section 5.8) but has some specific modifications related to its use in Germany. The device operates on the transverse friction principle using a special narrow test wheel, similar to a motorcycle wheel, set an angle to the direction of travel, mounted on the side of a tanker lorry. Figure 5.10 illustrates the SKM test-wheel assembly, mounted on the right-hand side of the test vehicle.
Figure 5.10 SKM test wheel assembly (this example is on the machine operated by BASt)
5.10.2 What does SKM measure? SKM measures SFC using a wheel angle of 20°. Indicators for the precision of SKM measurements are given in Table 5.15.
Table 5.19 Precision indicators for SKM measurements
Repeatability (100 m average SFC) r = 0.03 Reproducibility (100 m average SFC) R 2.77
5.10.3 How does SKM work? A freely rotating wheel fitted with a special pneumatic, smooth, rubber tyre, is mounted mid-machine in line with the nearside wheel path and set at an angle to the direction of travel of the vehicle. The wheel is lowered on to the road surface under the action of a static vertical load defined by the mass of the wheel assembly, which is able to move freely up and down on vertical linear guides. The force acting along the axle of the test wheel is measured and used to calculate the SFC.
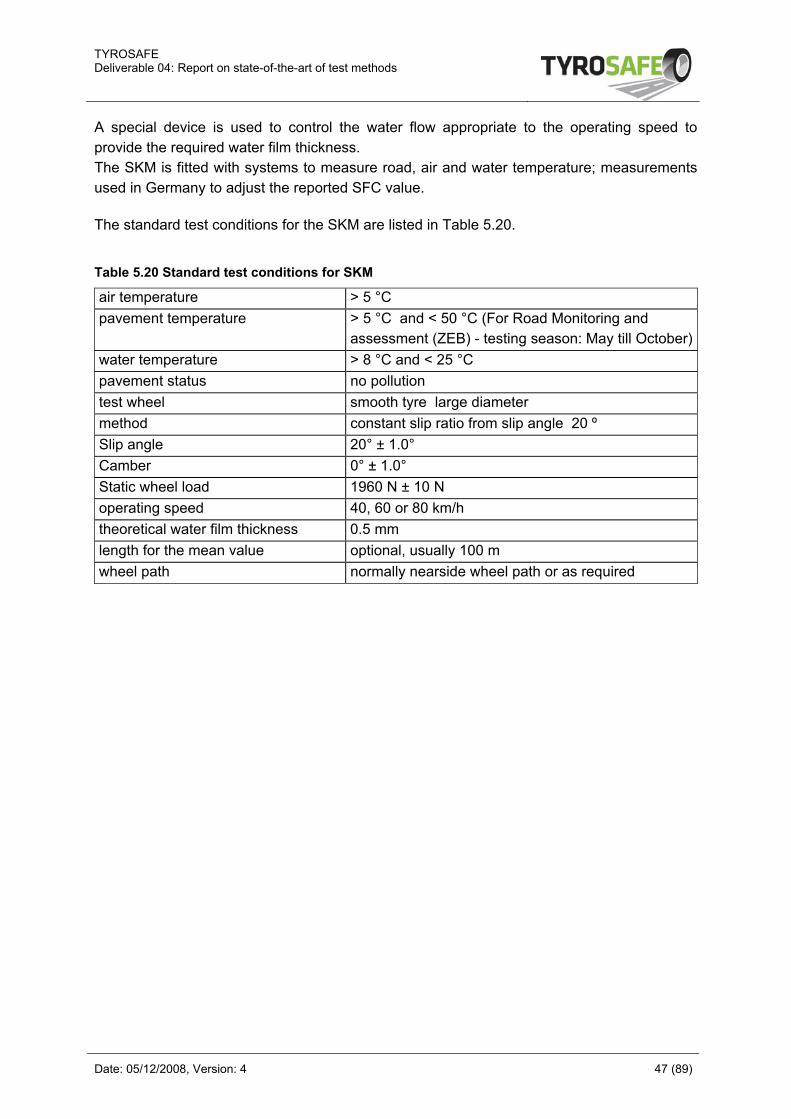
TYROSAFE Deliverable 04: Report on state-of-the-art of test methods
Date: 05/12/2008, Version: 4 47 (89)
A special device is used to control the water flow appropriate to the operating speed to provide the required water film thickness. The SKM is fitted with systems to measure road, air and water temperature; measurements used in Germany to adjust the reported SFC value. The standard test conditions for the SKM are listed in Table 5.20.
Table 5.20 Standard test conditions for SKM
air temperature > 5 °C pavement temperature > 5 °C and < 50 °C (For Road Monitoring and
assessment (ZEB) - testing season: May till October)water temperature > 8 °C and < 25 °C pavement status no pollution test wheel smooth tyre large diameter method constant slip ratio from slip angle 20 º Slip angle 20° ± 1.0° Camber 0° ± 1.0° Static wheel load 1960 N ± 10 N operating speed 40, 60 or 80 km/h theoretical water film thickness 0.5 mm length for the mean value optional, usually 100 m wheel path normally nearside wheel path or as required
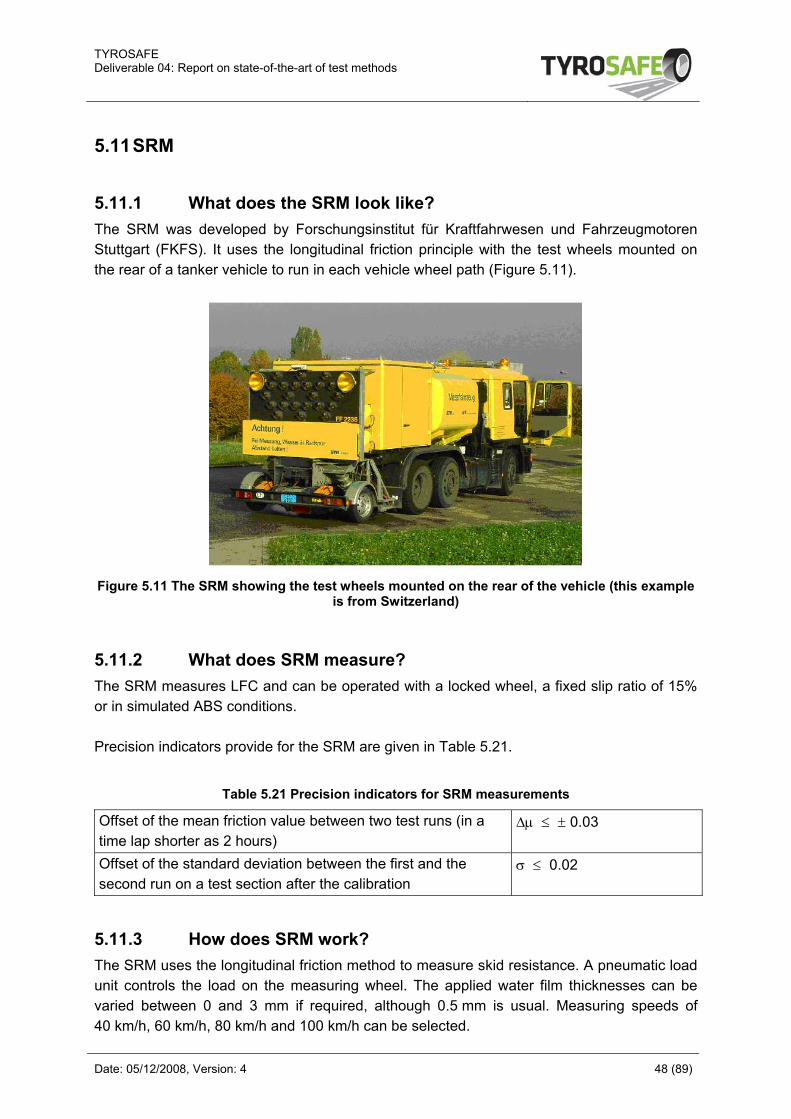
TYROSAFE Deliverable 04: Report on state-of-the-art of test methods
Date: 05/12/2008, Version: 4 48 (89)
5.11 SRM
5.11.1 What does the SRM look like? The SRM was developed by Forschungsinstitut für Kraftfahrwesen und Fahrzeugmotoren Stuttgart (FKFS). It uses the longitudinal friction principle with the test wheels mounted on the rear of a tanker vehicle to run in each vehicle wheel path (Figure 5.11).
Figure 5.11 The SRM showing the test wheels mounted on the rear of the vehicle (this example
is from Switzerland)
5.11.2 What does SRM measure? The SRM measures LFC and can be operated with a locked wheel, a fixed slip ratio of 15% or in simulated ABS conditions. Precision indicators provide for the SRM are given in Table 5.21.
Table 5.21 Precision indicators for SRM measurements
Offset of the mean friction value between two test runs (in a time lap shorter as 2 hours)
Δμ ≤ ± 0.03
Offset of the standard deviation between the first and the second run on a test section after the calibration
σ ≤ 0.02
5.11.3 How does SRM work? The SRM uses the longitudinal friction method to measure skid resistance. A pneumatic load unit controls the load on the measuring wheel. The applied water film thicknesses can be varied between 0 and 3 mm if required, although 0.5 mm is usual. Measuring speeds of 40 km/h, 60 km/h, 80 km/h and 100 km/h can be selected.
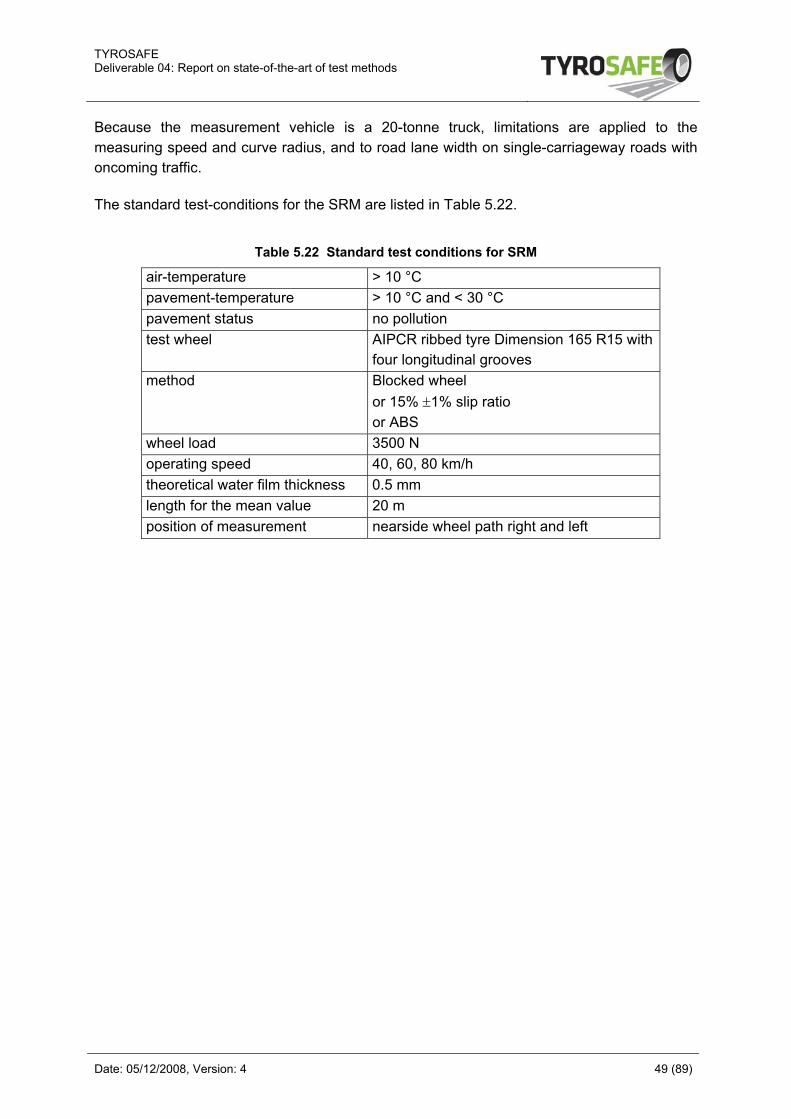
TYROSAFE Deliverable 04: Report on state-of-the-art of test methods
Date: 05/12/2008, Version: 4 49 (89)
Because the measurement vehicle is a 20-tonne truck, limitations are applied to the measuring speed and curve radius, and to road lane width on single-carriageway roads with oncoming traffic. The standard test-conditions for the SRM are listed in Table 5.22.
Table 5.22 Standard test conditions for SRM
air-temperature > 10 °C pavement-temperature > 10 °C and < 30 °C pavement status no pollution test wheel AIPCR ribbed tyre Dimension 165 R15 with
four longitudinal grooves method Blocked wheel
or 15% ±1% slip ratio or ABS
wheel load 3500 N operating speed 40, 60, 80 km/h theoretical water film thickness 0.5 mm length for the mean value 20 m position of measurement nearside wheel path right and left
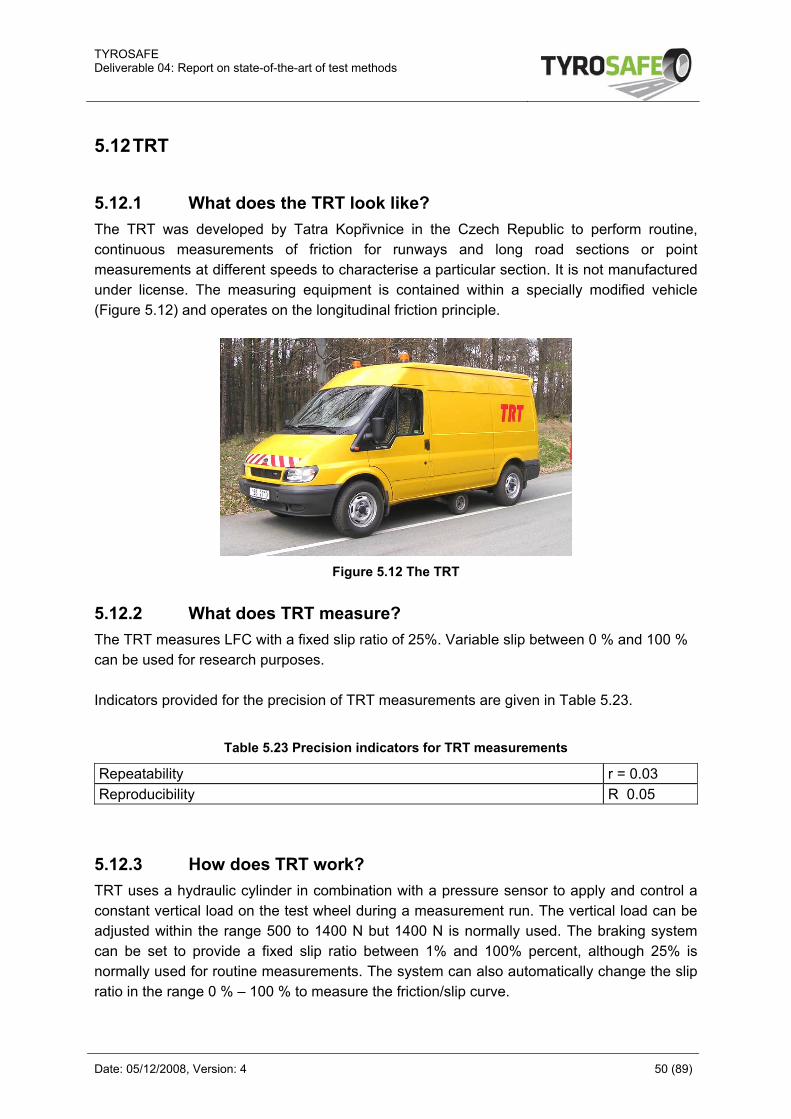
TYROSAFE Deliverable 04: Report on state-of-the-art of test methods
Date: 05/12/2008, Version: 4 50 (89)
5.12 TRT
5.12.1 What does the TRT look like? The TRT was developed by Tatra Kopřivnice in the Czech Republic to perform routine, continuous measurements of friction for runways and long road sections or point measurements at different speeds to characterise a particular section. It is not manufactured under license. The measuring equipment is contained within a specially modified vehicle (Figure 5.12) and operates on the longitudinal friction principle.
Figure 5.12 The TRT
5.12.2 What does TRT measure? The TRT measures LFC with a fixed slip ratio of 25%. Variable slip between 0 % and 100 % can be used for research purposes. Indicators provided for the precision of TRT measurements are given in Table 5.23.
Table 5.23 Precision indicators for TRT measurements
Repeatability r = 0.03 Reproducibility R 0.05
5.12.3 How does TRT work? TRT uses a hydraulic cylinder in combination with a pressure sensor to apply and control a constant vertical load on the test wheel during a measurement run. The vertical load can be adjusted within the range 500 to 1400 N but 1400 N is normally used. The braking system can be set to provide a fixed slip ratio between 1% and 100% percent, although 25% is normally used for routine measurements. The system can also automatically change the slip ratio in the range 0 % – 100 % to measure the friction/slip curve.
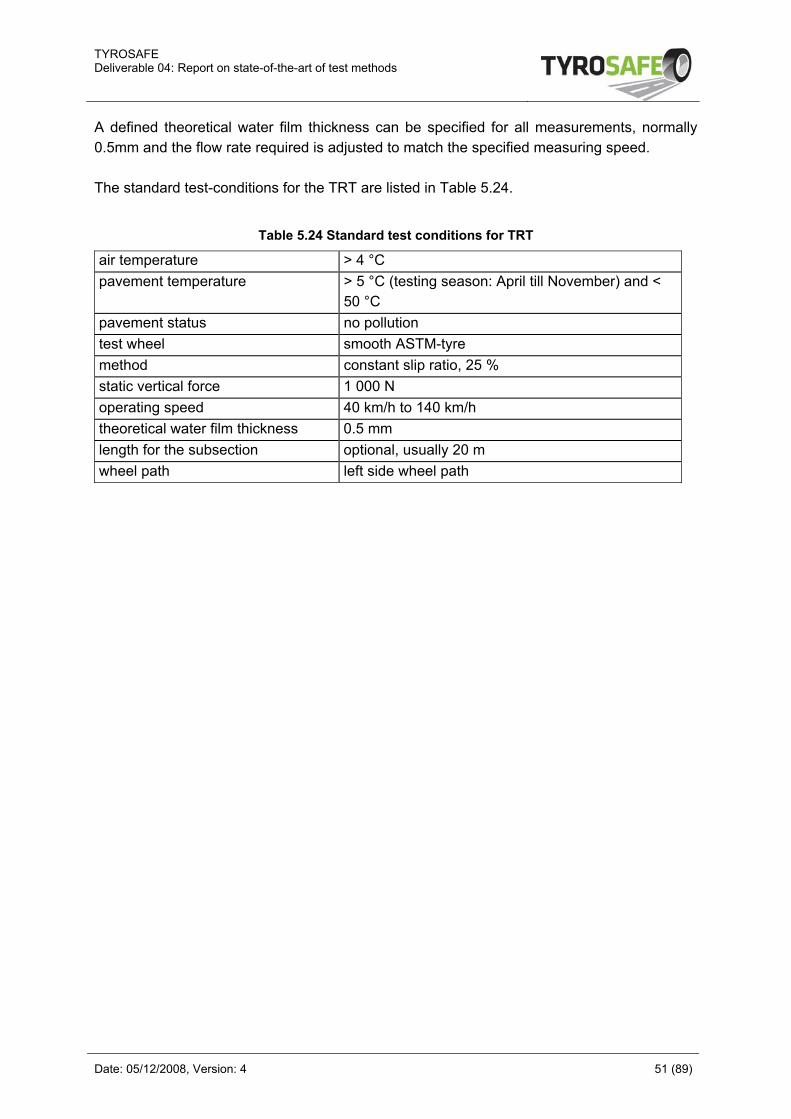
TYROSAFE Deliverable 04: Report on state-of-the-art of test methods
Date: 05/12/2008, Version: 4 51 (89)
A defined theoretical water film thickness can be specified for all measurements, normally 0.5mm and the flow rate required is adjusted to match the specified measuring speed. The standard test-conditions for the TRT are listed in Table 5.24.
Table 5.24 Standard test conditions for TRT
air temperature > 4 °C pavement temperature > 5 °C (testing season: April till November) and <
50 °C pavement status no pollution test wheel smooth ASTM-tyre method constant slip ratio, 25 % static vertical force 1 000 N operating speed 40 km/h to 140 km/h theoretical water film thickness 0.5 mm length for the subsection optional, usually 20 m wheel path left side wheel path
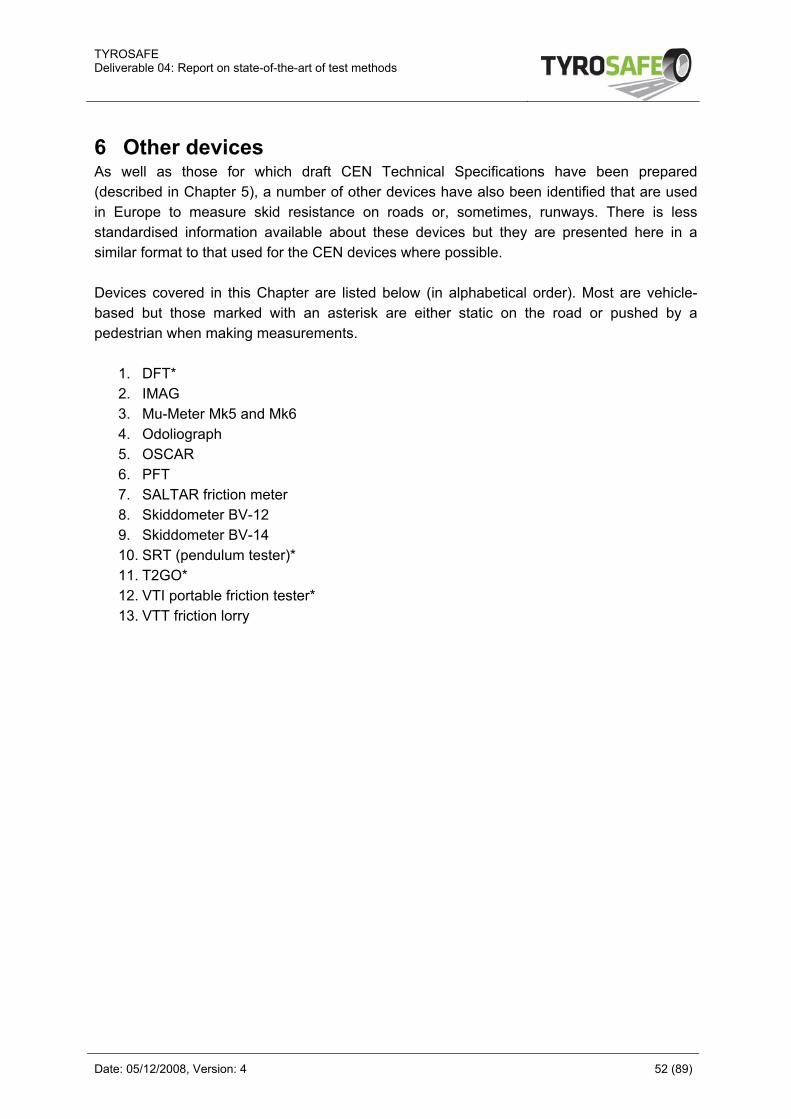
TYROSAFE Deliverable 04: Report on state-of-the-art of test methods
Date: 05/12/2008, Version: 4 52 (89)
6 Other devices As well as those for which draft CEN Technical Specifications have been prepared (described in Chapter 5), a number of other devices have also been identified that are used in Europe to measure skid resistance on roads or, sometimes, runways. There is less standardised information available about these devices but they are presented here in a similar format to that used for the CEN devices where possible. Devices covered in this Chapter are listed below (in alphabetical order). Most are vehicle-based but those marked with an asterisk are either static on the road or pushed by a pedestrian when making measurements.
1. DFT* 2. IMAG 3. Mu-Meter Mk5 and Mk6 4. Odoliograph 5. OSCAR 6. PFT 7. SALTAR friction meter 8. Skiddometer BV-12 9. Skiddometer BV-14 10. SRT (pendulum tester)* 11. T2GO* 12. VTI portable friction tester* 13. VTT friction lorry
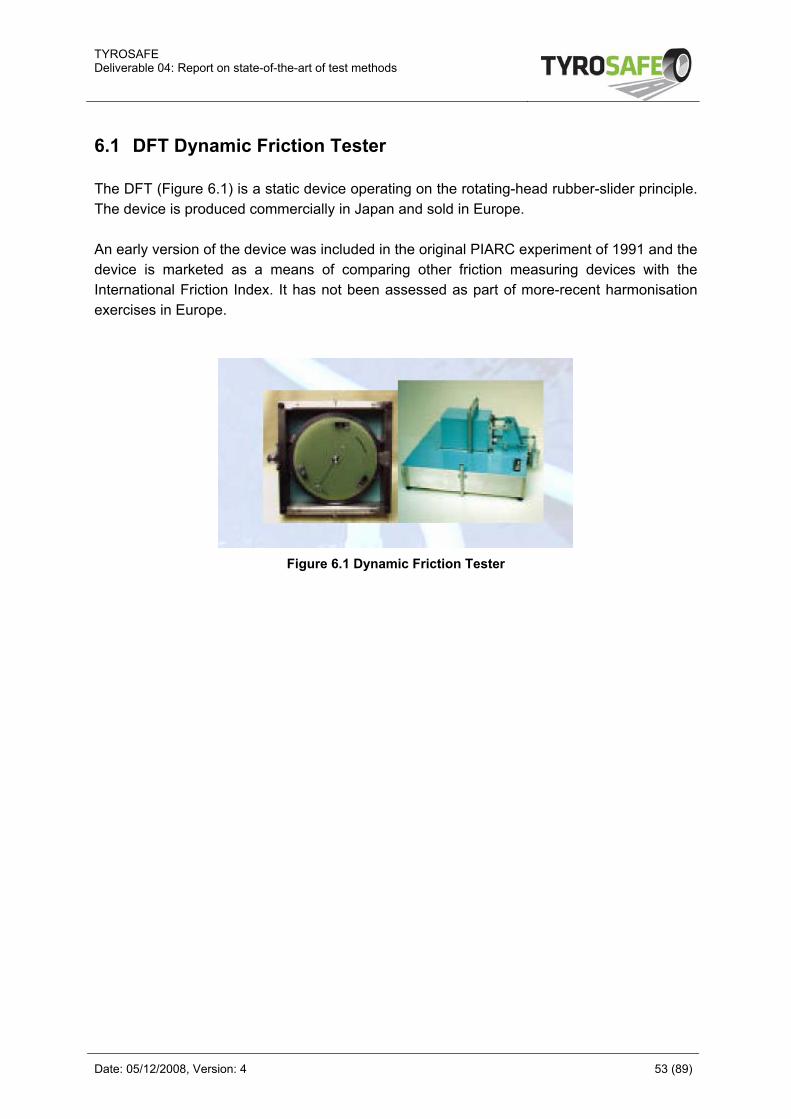
TYROSAFE Deliverable 04: Report on state-of-the-art of test methods
Date: 05/12/2008, Version: 4 53 (89)
6.1 DFT Dynamic Friction Tester The DFT (Figure 6.1) is a static device operating on the rotating-head rubber-slider principle. The device is produced commercially in Japan and sold in Europe. An early version of the device was included in the original PIARC experiment of 1991 and the device is marketed as a means of comparing other friction measuring devices with the International Friction Index. It has not been assessed as part of more-recent harmonisation exercises in Europe.
Figure 6.1 Dynamic Friction Tester
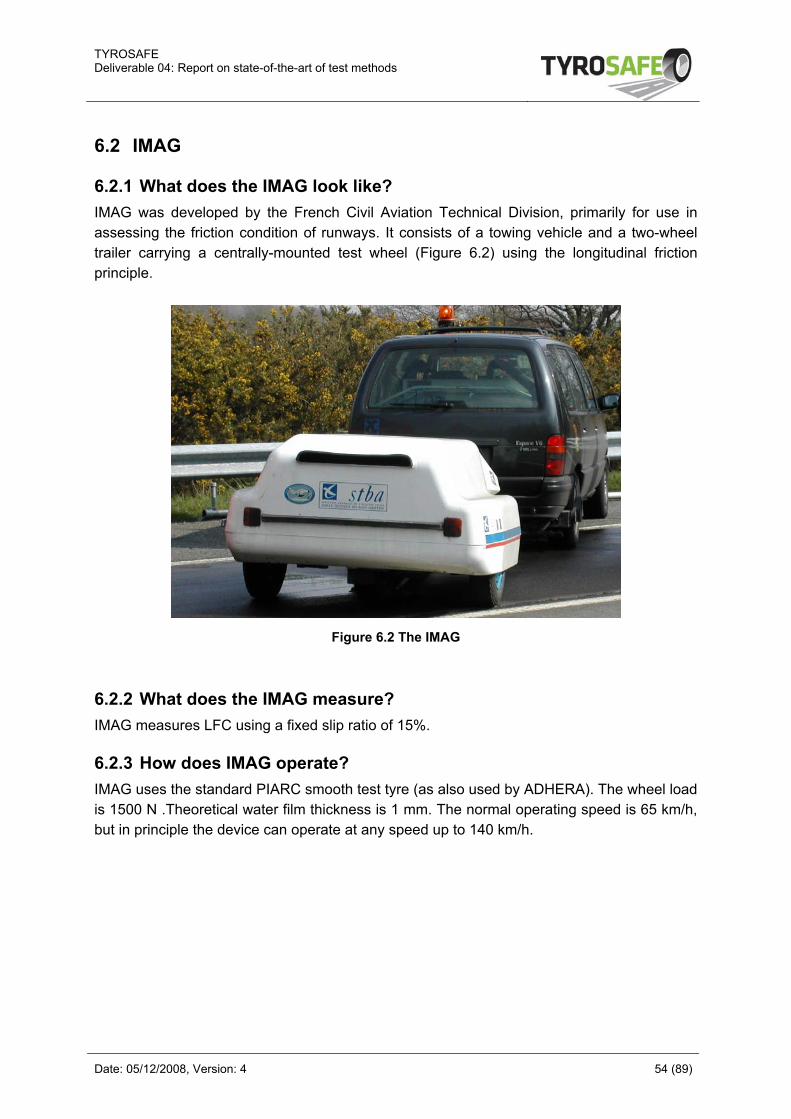
TYROSAFE Deliverable 04: Report on state-of-the-art of test methods
Date: 05/12/2008, Version: 4 54 (89)
6.2 IMAG
6.2.1 What does the IMAG look like? IMAG was developed by the French Civil Aviation Technical Division, primarily for use in assessing the friction condition of runways. It consists of a towing vehicle and a two-wheel trailer carrying a centrally-mounted test wheel (Figure 6.2) using the longitudinal friction principle.
Figure 6.2 The IMAG
6.2.2 What does the IMAG measure? IMAG measures LFC using a fixed slip ratio of 15%.
6.2.3 How does IMAG operate? IMAG uses the standard PIARC smooth test tyre (as also used by ADHERA). The wheel load is 1500 N .Theoretical water film thickness is 1 mm. The normal operating speed is 65 km/h, but in principle the device can operate at any speed up to 140 km/h.
TYROSAFE Deliverable 04: Report on state-of-the-art of test methods
Date: 05/12/2008, Version: 4 55 (89)
6.3 Mu-Meter Mk-5 and Mk-6
6.3.1 What does Mu-Meter look like? Mu-Meter is a three-wheel-trailer, shown diagrammatically in Figure 6.3. The device was designed for use on runways and operates on the transverse force principle. Unlike the other side-force devices covered in this report, Mu-meter uses two measuring wheels that are pushed apart by the frictional forces rather than one which is mounted on a vehicle and forced towards it.
Figure 6.3 Diagram of the Mu-meter
6.3.2 What does Mu-Meter measure? Mu-meter measures SFC based on the aggregated force developed between two linked test wheels, each angled at 7.5° to the direction of travel. Slip ratio is fixed at about 13 %,
6.3.3 How does Mu-Meter operate? The Mu-meter is towed along the runway at a constant speed and the transverse force on the two angled wheels tends to force them apart. A sensor mounted between the two test wheel arms measures the tension force developed. The third wheel provides distance measurement and helps to keep the trailer operating in a straight line. A separate water tank is used, either mounted on a separate trailer or fitted within the towing vehicle. Typical measurement speeds range from 20 to 80 km/h. The device was designed for use on airfields which do not generally have the well-defined wheel paths that traffic generates on roads. Because the device effectively measures the average skid resistance along two test lines which are rather far apart compared with a road wheel path, this device is not well-suited for use on trafficked roads.
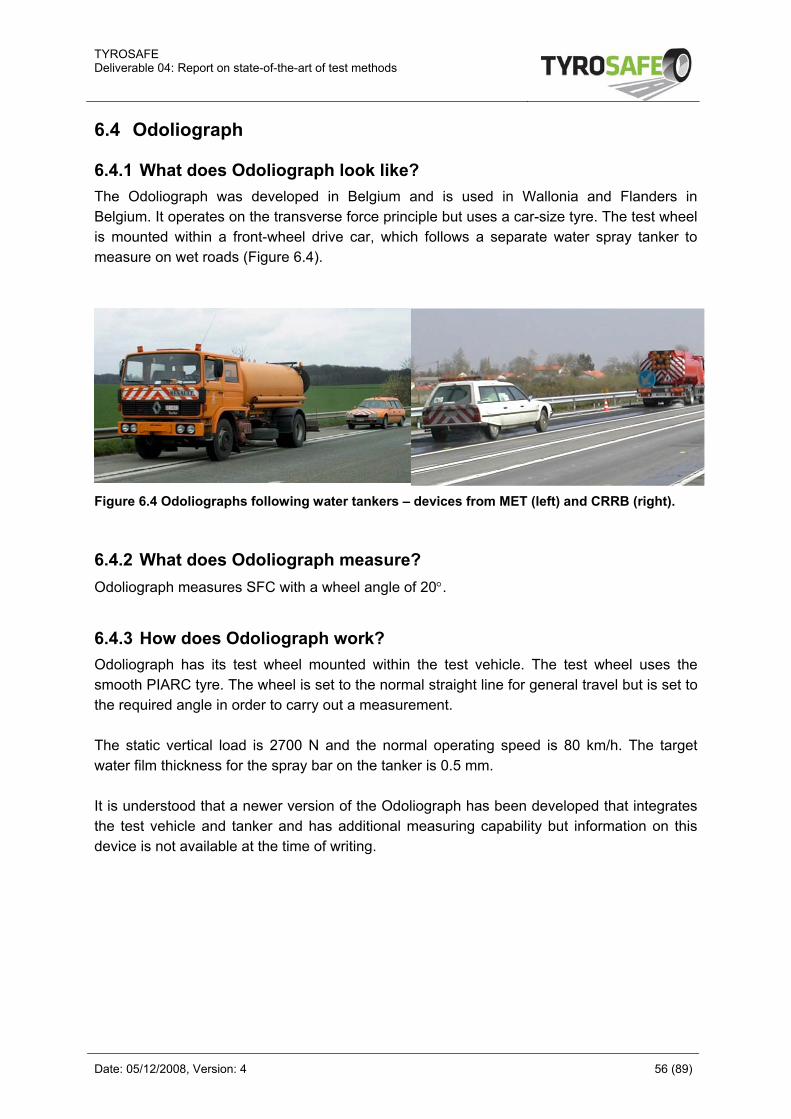
TYROSAFE Deliverable 04: Report on state-of-the-art of test methods
Date: 05/12/2008, Version: 4 56 (89)
6.4 Odoliograph
6.4.1 What does Odoliograph look like? The Odoliograph was developed in Belgium and is used in Wallonia and Flanders in Belgium. It operates on the transverse force principle but uses a car-size tyre. The test wheel is mounted within a front-wheel drive car, which follows a separate water spray tanker to measure on wet roads (Figure 6.4).
Figure 6.4 Odoliographs following water tankers – devices from MET (left) and CRRB (right).
6.4.2 What does Odoliograph measure? Odoliograph measures SFC with a wheel angle of 20°.
6.4.3 How does Odoliograph work? Odoliograph has its test wheel mounted within the test vehicle. The test wheel uses the smooth PIARC tyre. The wheel is set to the normal straight line for general travel but is set to the required angle in order to carry out a measurement. The static vertical load is 2700 N and the normal operating speed is 80 km/h. The target water film thickness for the spray bar on the tanker is 0.5 mm. It is understood that a newer version of the Odoliograph has been developed that integrates the test vehicle and tanker and has additional measuring capability but information on this device is not available at the time of writing.

TYROSAFE Deliverable 04: Report on state-of-the-art of test methods
Date: 05/12/2008, Version: 4 57 (89)
6.5 OSCAR
6.5.1 What does OSCAR look like? OSCAR (Figure 6.5) is used in Norway and was developed by the Norsemeter company [17]. The device is used in Norway. The test equipment operates on the longitudinal friction principle using a test axle carrying the measuring wheel, mounted on the rear of a small truck.
Figure 6.5 OSCAR (the test wheel and water feed nozzle can be seen on the left)
6.5.2 What does OSCAR measure? OSCAR measures LFC at a controlled slip ratio, normally 18%. Other slip ratios between 3% and 75% can also be chosen.
6.5.3 How does OSCAR work? The test axle, which can be raised when not in use for measurements, carries a test wheel on the left fitted with a standard ASTM E-524 smooth tyre. The right wheel provides speed and distance measurement. A servo braking system is used that automatically adjusts the brake force to maintain the required slip ratio as the speed and friction vary. Water film thickness is 0.5 mm; vertical load is 4826 N.
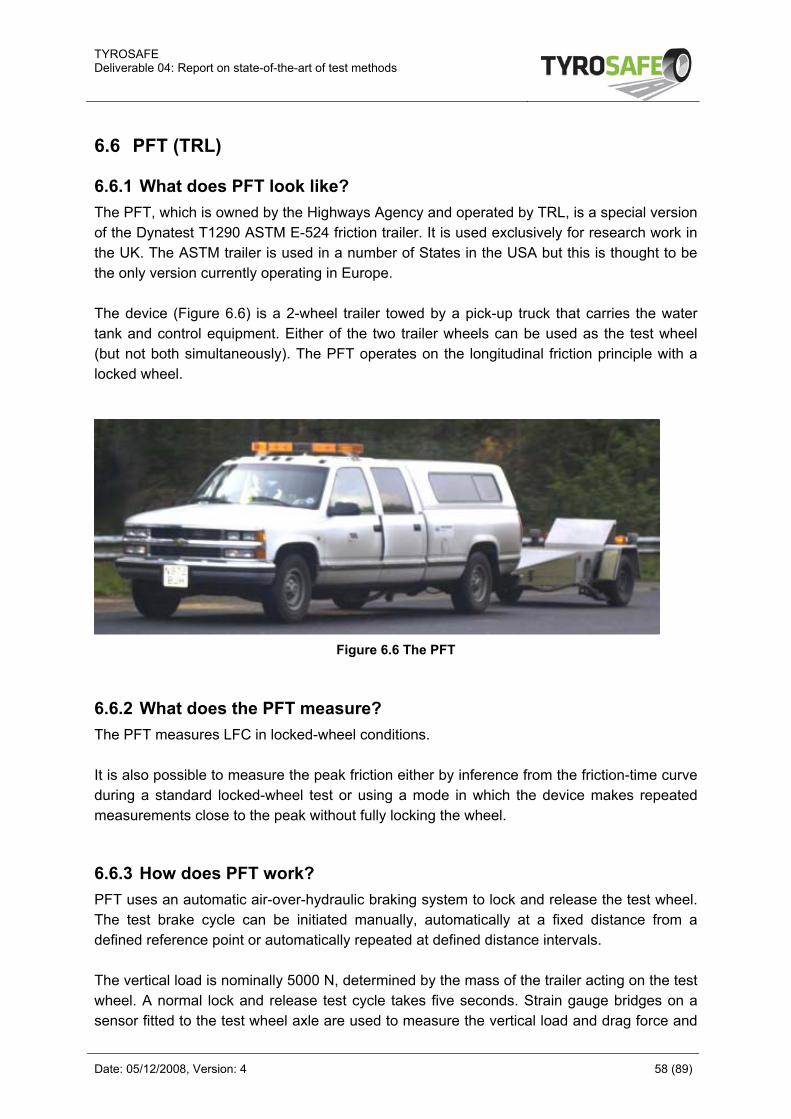
TYROSAFE Deliverable 04: Report on state-of-the-art of test methods
Date: 05/12/2008, Version: 4 58 (89)
6.6 PFT (TRL)
6.6.1 What does PFT look like? The PFT, which is owned by the Highways Agency and operated by TRL, is a special version of the Dynatest T1290 ASTM E-524 friction trailer. It is used exclusively for research work in the UK. The ASTM trailer is used in a number of States in the USA but this is thought to be the only version currently operating in Europe. The device (Figure 6.6) is a 2-wheel trailer towed by a pick-up truck that carries the water tank and control equipment. Either of the two trailer wheels can be used as the test wheel (but not both simultaneously). The PFT operates on the longitudinal friction principle with a locked wheel.
Figure 6.6 The PFT
6.6.2 What does the PFT measure? The PFT measures LFC in locked-wheel conditions. It is also possible to measure the peak friction either by inference from the friction-time curve during a standard locked-wheel test or using a mode in which the device makes repeated measurements close to the peak without fully locking the wheel.
6.6.3 How does PFT work? PFT uses an automatic air-over-hydraulic braking system to lock and release the test wheel. The test brake cycle can be initiated manually, automatically at a fixed distance from a defined reference point or automatically repeated at defined distance intervals. The vertical load is nominally 5000 N, determined by the mass of the trailer acting on the test wheel. A normal lock and release test cycle takes five seconds. Strain gauge bridges on a sensor fitted to the test wheel axle are used to measure the vertical load and drag force and
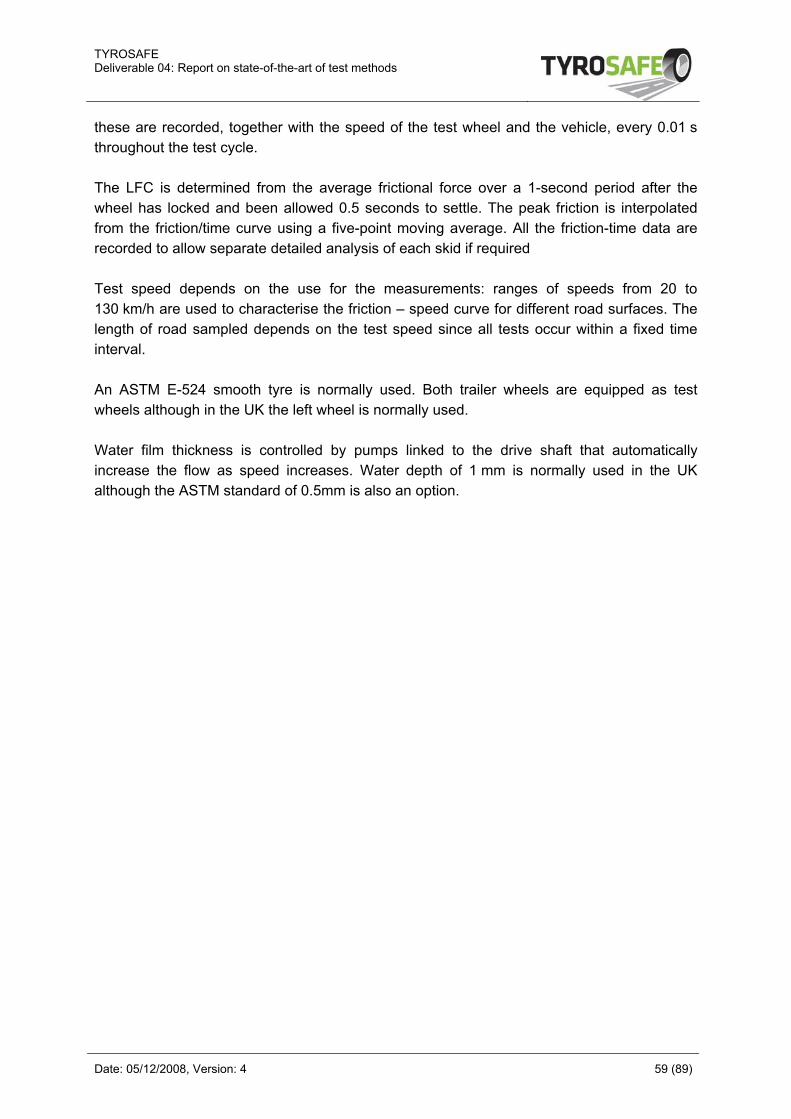
TYROSAFE Deliverable 04: Report on state-of-the-art of test methods
Date: 05/12/2008, Version: 4 59 (89)
these are recorded, together with the speed of the test wheel and the vehicle, every 0.01 s throughout the test cycle. The LFC is determined from the average frictional force over a 1-second period after the wheel has locked and been allowed 0.5 seconds to settle. The peak friction is interpolated from the friction/time curve using a five-point moving average. All the friction-time data are recorded to allow separate detailed analysis of each skid if required Test speed depends on the use for the measurements: ranges of speeds from 20 to 130 km/h are used to characterise the friction – speed curve for different road surfaces. The length of road sampled depends on the test speed since all tests occur within a fixed time interval. An ASTM E-524 smooth tyre is normally used. Both trailer wheels are equipped as test wheels although in the UK the left wheel is normally used. Water film thickness is controlled by pumps linked to the drive shaft that automatically increase the flow as speed increases. Water depth of 1 mm is normally used in the UK although the ASTM standard of 0.5mm is also an option.
TYROSAFE Deliverable 04: Report on state-of-the-art of test methods
Date: 05/12/2008, Version: 4 60 (89)
6.7 SALTAR friction meter
6.7.1 How does SALTAR work? The SALTAR device [16] was developed primarily for making skid resistance measurements on ice and snow without the addition of water using a patterned tyre. The device uses the longitudinal friction principle and can be fitted to a wide range of vehicles (Figure 6.7). Its symmetrical design allows it to be fitted to measure in either wheel path.
Figure 6.7 Griffigkeitsmesseinrichtung SALTAR
6.7.2 What does SALTAR measure? SALTAR measures LFC with variable slip ratio from free-rolling to locked wheel.
6.7.3 How does SALTAR work? A compressed air system applies a vertical load of 700 N (155 lbs) to the test wheel which is fitted with a Bridgestone 8F-228 135R X 12 tyre, inflated to 207 kPa (30 psi). An electronic brake system controls the variable-slip braking cycle.
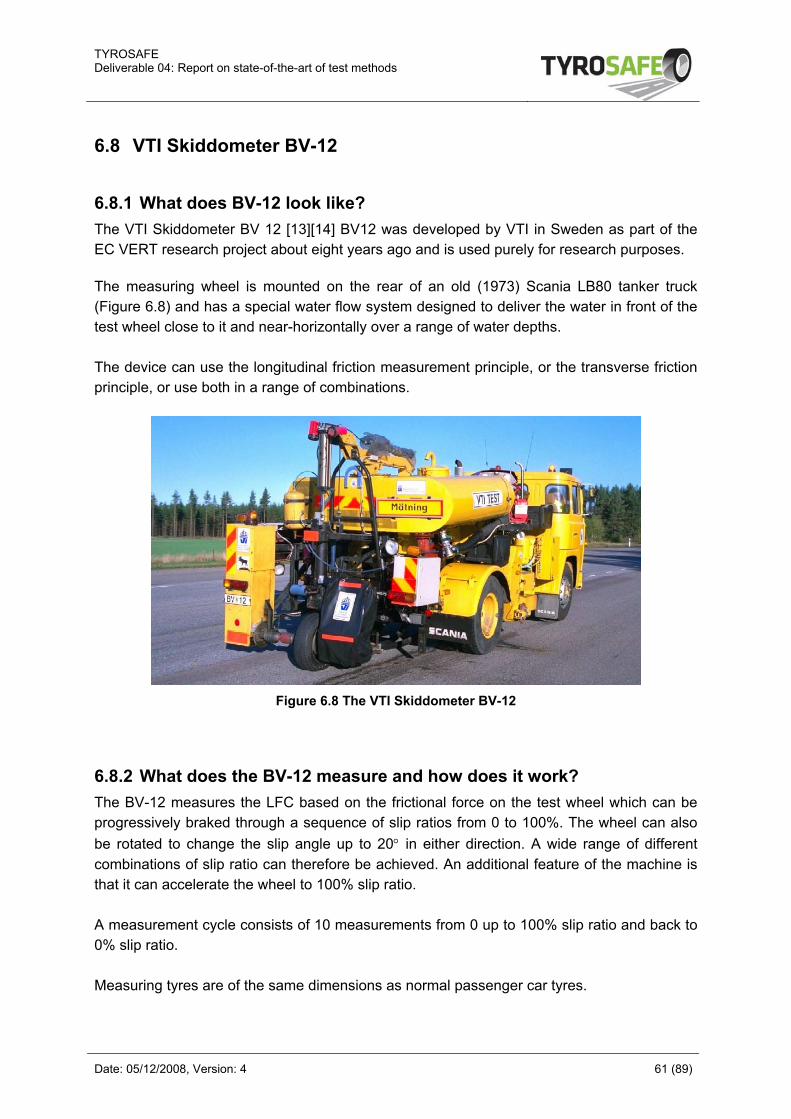
TYROSAFE Deliverable 04: Report on state-of-the-art of test methods
Date: 05/12/2008, Version: 4 61 (89)
6.8 VTI Skiddometer BV-12
6.8.1 What does BV-12 look like? The VTI Skiddometer BV 12 [13][14] BV12 was developed by VTI in Sweden as part of the EC VERT research project about eight years ago and is used purely for research purposes. The measuring wheel is mounted on the rear of an old (1973) Scania LB80 tanker truck (Figure 6.8) and has a special water flow system designed to deliver the water in front of the test wheel close to it and near-horizontally over a range of water depths. The device can use the longitudinal friction measurement principle, or the transverse friction principle, or use both in a range of combinations.
Figure 6.8 The VTI Skiddometer BV-12
6.8.2 What does the BV-12 measure and how does it work? The BV-12 measures the LFC based on the frictional force on the test wheel which can be progressively braked through a sequence of slip ratios from 0 to 100%. The wheel can also be rotated to change the slip angle up to 20° in either direction. A wide range of different combinations of slip ratio can therefore be achieved. An additional feature of the machine is that it can accelerate the wheel to 100% slip ratio. A measurement cycle consists of 10 measurements from 0 up to 100% slip ratio and back to 0% slip ratio. Measuring tyres are of the same dimensions as normal passenger car tyres.
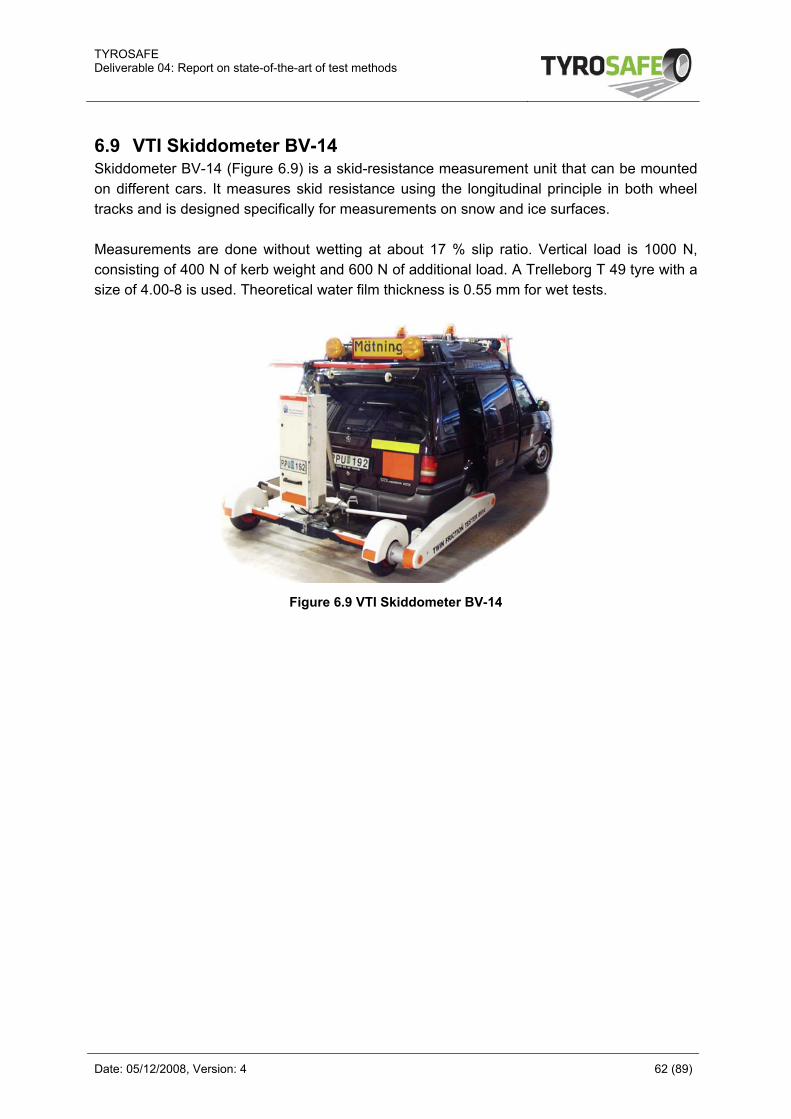
TYROSAFE Deliverable 04: Report on state-of-the-art of test methods
Date: 05/12/2008, Version: 4 62 (89)
6.9 VTI Skiddometer BV-14 Skiddometer BV-14 (Figure 6.9) is a skid-resistance measurement unit that can be mounted on different cars. It measures skid resistance using the longitudinal principle in both wheel tracks and is designed specifically for measurements on snow and ice surfaces. Measurements are done without wetting at about 17 % slip ratio. Vertical load is 1000 N, consisting of 400 N of kerb weight and 600 N of additional load. A Trelleborg T 49 tyre with a size of 4.00-8 is used. Theoretical water film thickness is 0.55 mm for wet tests.
Figure 6.9 VTI Skiddometer BV-14
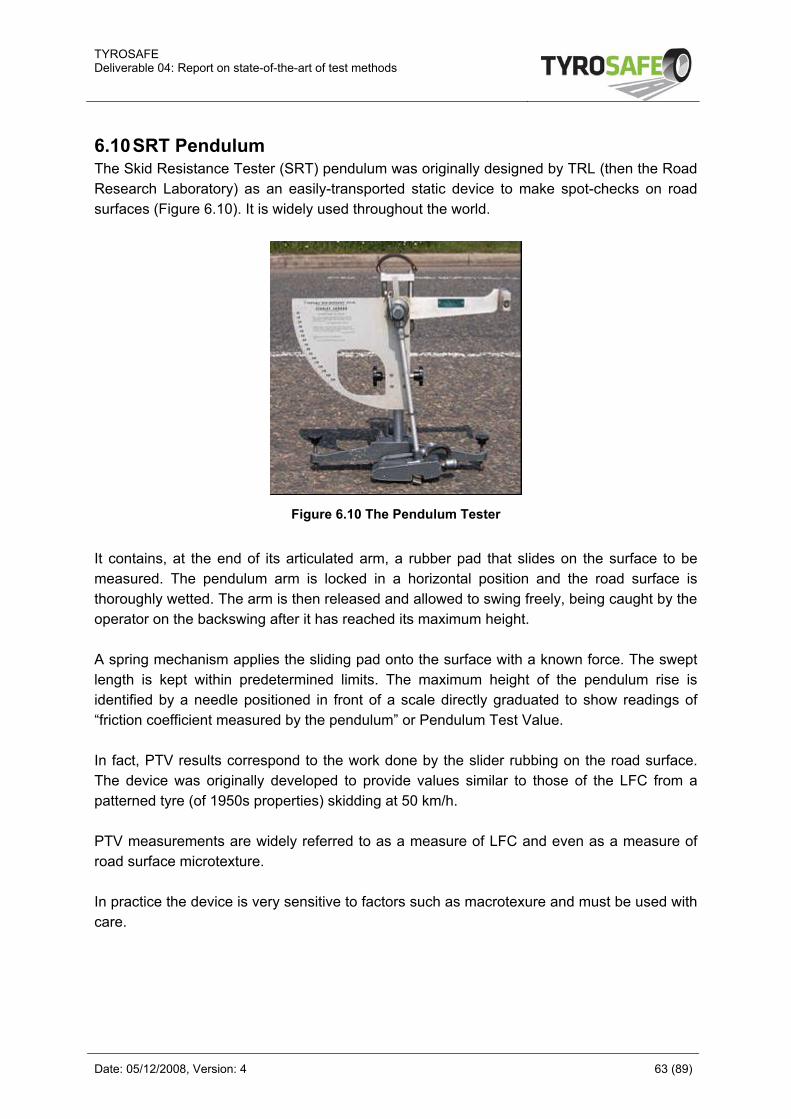
TYROSAFE Deliverable 04: Report on state-of-the-art of test methods
Date: 05/12/2008, Version: 4 63 (89)
6.10 SRT Pendulum The Skid Resistance Tester (SRT) pendulum was originally designed by TRL (then the Road Research Laboratory) as an easily-transported static device to make spot-checks on road surfaces (Figure 6.10). It is widely used throughout the world.
Figure 6.10 The Pendulum Tester
It contains, at the end of its articulated arm, a rubber pad that slides on the surface to be measured. The pendulum arm is locked in a horizontal position and the road surface is thoroughly wetted. The arm is then released and allowed to swing freely, being caught by the operator on the backswing after it has reached its maximum height. A spring mechanism applies the sliding pad onto the surface with a known force. The swept length is kept within predetermined limits. The maximum height of the pendulum rise is identified by a needle positioned in front of a scale directly graduated to show readings of “friction coefficient measured by the pendulum” or Pendulum Test Value. In fact, PTV results correspond to the work done by the slider rubbing on the road surface. The device was originally developed to provide values similar to those of the LFC from a patterned tyre (of 1950s properties) skidding at 50 km/h. PTV measurements are widely referred to as a measure of LFC and even as a measure of road surface microtexture. In practice the device is very sensitive to factors such as macrotexure and must be used with care.
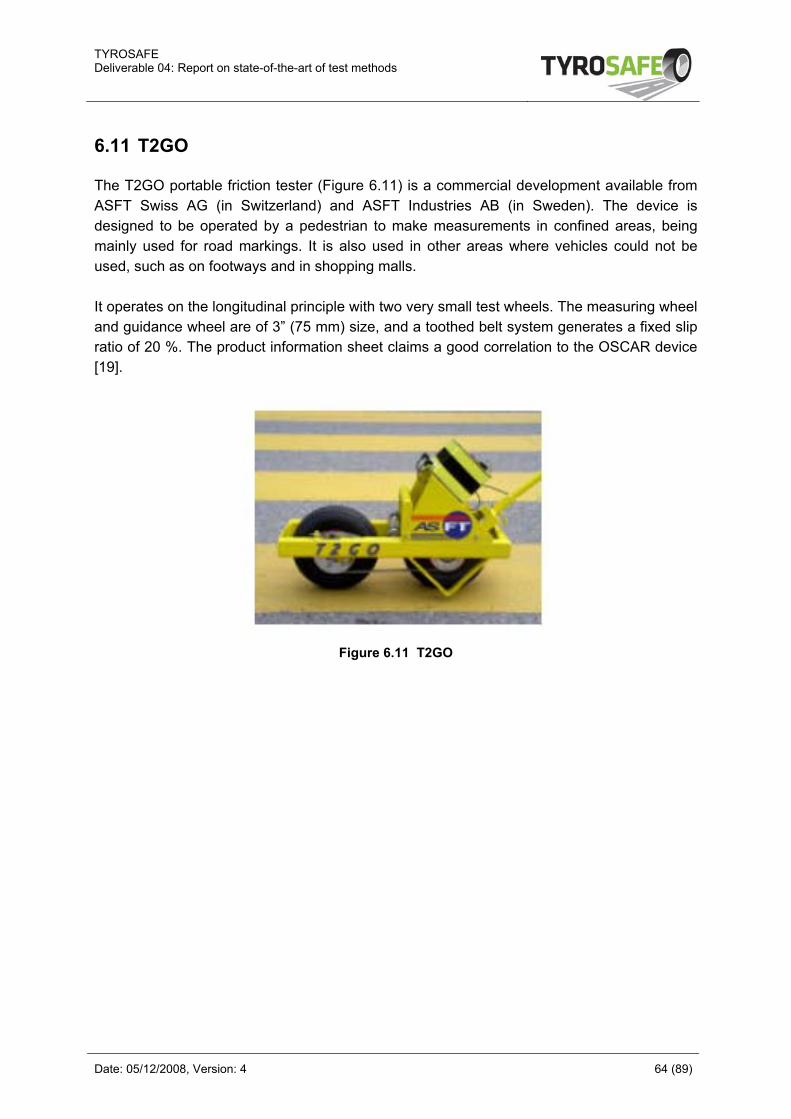
TYROSAFE Deliverable 04: Report on state-of-the-art of test methods
Date: 05/12/2008, Version: 4 64 (89)
6.11 T2GO The T2GO portable friction tester (Figure 6.11) is a commercial development available from ASFT Swiss AG (in Switzerland) and ASFT Industries AB (in Sweden). The device is designed to be operated by a pedestrian to make measurements in confined areas, being mainly used for road markings. It is also used in other areas where vehicles could not be used, such as on footways and in shopping malls. It operates on the longitudinal principle with two very small test wheels. The measuring wheel and guidance wheel are of 3” (75 mm) size, and a toothed belt system generates a fixed slip ratio of 20 %. The product information sheet claims a good correlation to the OSCAR device [19].
Figure 6.11 T2GO
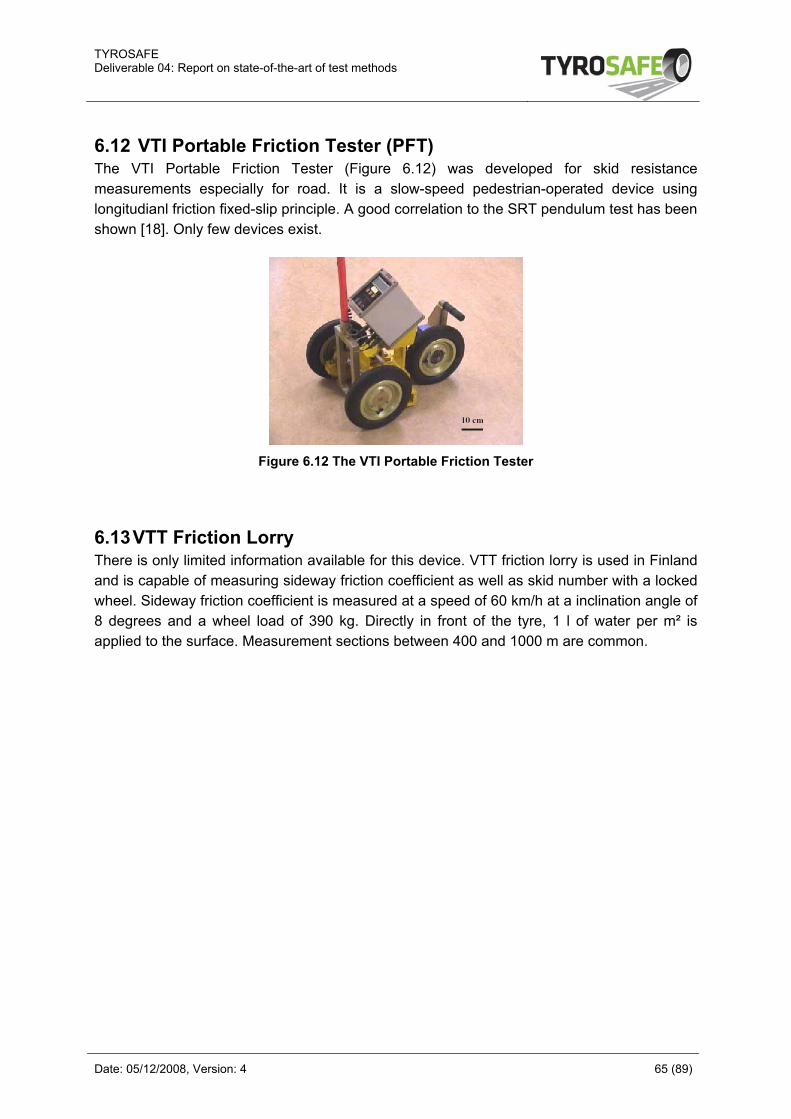
TYROSAFE Deliverable 04: Report on state-of-the-art of test methods
Date: 05/12/2008, Version: 4 65 (89)
6.12 VTI Portable Friction Tester (PFT) The VTI Portable Friction Tester (Figure 6.12) was developed for skid resistance measurements especially for road. It is a slow-speed pedestrian-operated device using longitudianl friction fixed-slip principle. A good correlation to the SRT pendulum test has been shown [18]. Only few devices exist.
Figure 6.12 The VTI Portable Friction Tester
6.13 VTT Friction Lorry There is only limited information available for this device. VTT friction lorry is used in Finland and is capable of measuring sideway friction coefficient as well as skid number with a locked wheel. Sideway friction coefficient is measured at a speed of 60 km/h at a inclination angle of 8 degrees and a wheel load of 390 kg. Directly in front of the tyre, 1 l of water per m² is applied to the surface. Measurement sections between 400 and 1000 m are common.
TYROSAFE Deliverable 04: Report on state-of-the-art of test methods
Date: 05/12/2008, Version: 4 66 (89)
7 Discussion The main characteristics of the principal devices listed in chapters 5 and 6 are summarised in Table 7.1. There are gaps in the information currently available that it is envisaged will be filled by further enquiry as the project progresses. This initial compilation of information has identified a wide range of devices. Apart from the thickness of the water film which is similar for the majority of them, the operating principle, device configuration (slip ratio, test wheel size, tyre properties etc) and standard test conditions vary significantly from one device to another. Clearly, great care is needed in making direct comparisons between devices because of the different ways in which they are likely to respond to the road surface characteristics and specific test conditions. This emphasises the importance of finding a way of harmonising measurements so that, where different devices are used to assess road skid resistance conditions in different countries, the results can easily be compared and understood. It is often possible to make direct correlations derive reasonably robust empirical relationships between individual pairs of devices under specific conditions. However, it is much more difficult to establish a way of representing the results from a number of different devices operating under a range of conditions on a common scale. In the past, mathematical models have been proposed that attempt to allow data from a given device to be processed so that they relate to a “standard” set of measurement conditions. The main effect on the measurements has been thought to be the way in which each device responds to changes in test vehicle speed (and hence the slip-speed of the test wheel contact patch) and how that response is influenced by the macrotexure of the road surface. The most popular approach to harmonisation has therefore been the method in which results from a test run with a device are corrected to represent the value it would have achieved at a common slip speed, regardless of the test vehicle speed or slip ratio at which it is normally operated. This was the method initiated during the PIARC experiments in the 1990s and studied more thoroughly in the HERMES project. These first efforts, however, found that while it was possible to develop a common scale or index, unsurprisingly, the precision of measurements relating to the index was likely to be poor compared with that of using a single device or set of similar devices, making it unsuitable for use in comparison with national standards in many European countries. The work has also shown that while the models work well for some devices, the increasingly wide range of test conditions means that the assumptions made do not work across the range, especially where devices operate in greatly different parts of the friction/slip or slip/speed curves.
TYROSAFE Deliverable 04: Report on state-of-the-art of test methods
Date: 05/12/2008, Version: 4 67 (89)
Further, while the models take some account of macrotexure by using simple measurements such as the Mean Profile Depth, they take no account of the way in which the different rubber characteristics of the test tyres respond to microtexture or how different forms of macrotexure influence the hysteretic responses of test tyres of different sizes and composition. A feature of the CEN Technical Specifications, included in part because of the experience of the HERMES experimental work, is the detailed calibration procedure for each type of device that are summarised in Appendix 1. Experience has shown that this is an important aspect of the operation of skid resistance devices, not only to verify the correct static operation of an individual device’s measuring sensor system but also to provide confidence when one device is compared with another of the same type. Some calibration procedures also incorporate dynamic checks to verify the satisfactory operation of the machines. This will be an important aspect to consider for any future harmonisation process.
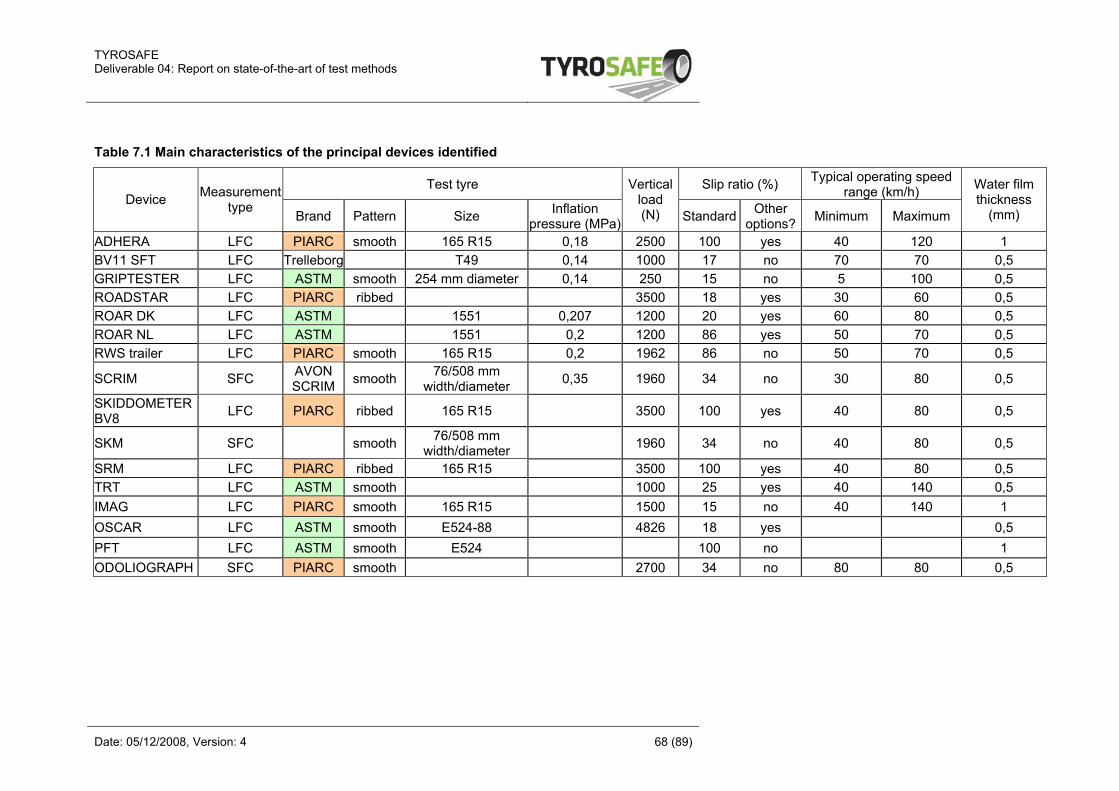
TYROSAFE Deliverable 04: Report on state-of-the-art of test methods
Date: 05/12/2008, Version: 4 68 (89)
Table 7.1 Main characteristics of the principal devices identified
Test tyre Slip ratio (%) Typical operating speed range (km/h) Device Measurement
type Brand Pattern Size Inflation
pressure (MPa)
Verticalload (N) Standard Other
options? Minimum Maximum
Water film thickness
(mm)
ADHERA LFC PIARC smooth 165 R15 0,18 2500 100 yes 40 120 1 BV11 SFT LFC Trelleborg T49 0,14 1000 17 no 70 70 0,5 GRIPTESTER LFC ASTM smooth 254 mm diameter 0,14 250 15 no 5 100 0,5 ROADSTAR LFC PIARC ribbed 3500 18 yes 30 60 0,5 ROAR DK LFC ASTM 1551 0,207 1200 20 yes 60 80 0,5 ROAR NL LFC ASTM 1551 0,2 1200 86 yes 50 70 0,5 RWS trailer LFC PIARC smooth 165 R15 0,2 1962 86 no 50 70 0,5
SCRIM SFC AVON SCRIM smooth 76/508 mm
width/diameter 0,35 1960 34 no 30 80 0,5
SKIDDOMETER BV8 LFC PIARC ribbed 165 R15 3500 100 yes 40 80 0,5
SKM SFC smooth 76/508 mm width/diameter 1960 34 no 40 80 0,5
SRM LFC PIARC ribbed 165 R15 3500 100 yes 40 80 0,5 TRT LFC ASTM smooth 1000 25 yes 40 140 0,5 IMAG LFC PIARC smooth 165 R15 1500 15 no 40 140 1 OSCAR LFC ASTM smooth E524-88 4826 18 yes 0,5 PFT LFC ASTM smooth E524 100 no 1 ODOLIOGRAPH SFC PIARC smooth 2700 34 no 80 80 0,5
TYROSAFE Deliverable 04: Report on state-of-the-art of test methods
Date: 05/12/2008, Version: 4 69 (89)
8 Conclusions The main objective of this report has been to establish as exhaustive a list as possible of skid-resistance measuring devices operated throughout Europe. So far, twenty three such devices have been identified. Twelve of these are in a group for which detailed Technical Specifications have been prepared through CEN TC227 WG5 and the remainder have been identified from other work or knowledge of the TYROSAFE project team. This first overview has shown a wide variety of measurement configurations and test conditions, ranging from static spot-check devices through large-scale routine investigation tools to research equipment for specialised purposes. This emphasises both the difficulty of making comparisons between the results from different devices and the need for a rigorous harmonisation technique if this is to be achieved. Previous experience has shown the difficulty of using simple mathematical models in the process of harmonising devices with widely varying operating characteristics and a number of aspects will need to be considered in future stages of this part of the TYROSAFE project as the work moves towards the objective of making proposals for options for “the specification of a Standard European Skid Resistance Device (SESRD) …” or, more generally, that of CEN WG5 “… a harmonised standard based on the measurement of a friction index with a common and single European friction measuring equipment …”. Further investigations are required to establish more details relating to some of the devices listed here so that wider comparisons can be made. This should include identifying practices for calibration so that any future recommendations can be based on all aspects that could potentially contribute to the accuracy of any future harmonised skid resistance index.
TYROSAFE Deliverable 04: Report on state-of-the-art of test methods
Date: 05/12/2008, Version: 4 70 (89)
9 Appendix 1 – Calibration procedures This Appendix contains extracts from the calibration procedures that have been set out for the devices covered in Chapter 5 where this information is provided. The extracts have been taken directly from the draft Technical Specifications without further significant editing. These illustrate the importance of establishing clear procedures for maintaining the calibration of individual measurement devices.
9.1 ADHERA
9.1.1 Prior to testing Prior to testing, the following points have to be checked:
The inflation pressure of the test tyre at the ambient temperature; The wear of the test tyre; Irregularities on the test-tyre tread that may affect test results; The good operating of the water flow system.
Periodical calibration is conducted once a year. Measuring equipments are first calibrated, then round-robin tests are conducted with the three ADHERA deployed in France.
9.1.2 Calibration of the static vertical test wheel load For the calibration of the static wheel load, the ADHERA is positioned on a flat surface in such a way that the wheel can be lowered and put on an electrical load cell. The load cell should be positioned in such a way that the wheel is at the same level as it would normally be when in contact with the pavement. The load is measured and adjusted if necessary to reach the nominal value of 2,500 N.
9.1.3 Calibration of the braking torque For the calibration of the braking torque, the ADHERA is positioned on a flat surface. The test wheel is put on a special system dragging the test wheel with a known force. This load is compared to the one given by the ADHERA measuring chain.
9.1.4 Correlation exercises Friction measurements are performed on a reference pavement before and after the calibration of measuring equipments; values are compared. For the round-robin tests, results obtained by each device on each test surface are compared with the average obtained by the three devices on the same test surface. If one device give too different results, it must be controlled to identify the reason of these differences (test tyre, water flow, load on the test wheel, etc.). Certificate of conformity is attributed to devices following with success the calibration program.
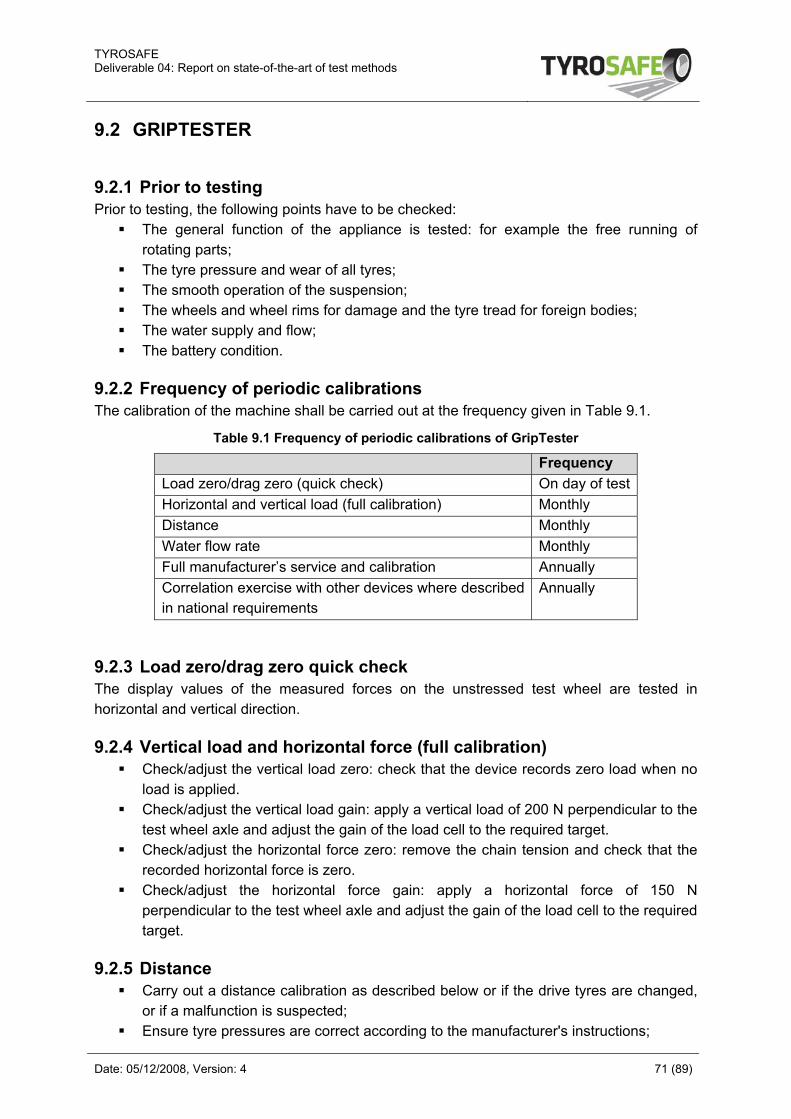
TYROSAFE Deliverable 04: Report on state-of-the-art of test methods
Date: 05/12/2008, Version: 4 71 (89)
9.2 GRIPTESTER
9.2.1 Prior to testing Prior to testing, the following points have to be checked:
The general function of the appliance is tested: for example the free running of rotating parts;
The tyre pressure and wear of all tyres; The smooth operation of the suspension; The wheels and wheel rims for damage and the tyre tread for foreign bodies; The water supply and flow; The battery condition.
9.2.2 Frequency of periodic calibrations The calibration of the machine shall be carried out at the frequency given in Table 9.1.
Table 9.1 Frequency of periodic calibrations of GripTester
Frequency Load zero/drag zero (quick check) On day of test Horizontal and vertical load (full calibration) Monthly Distance Monthly Water flow rate Monthly Full manufacturer’s service and calibration Annually Correlation exercise with other devices where described in national requirements
Annually
9.2.3 Load zero/drag zero quick check The display values of the measured forces on the unstressed test wheel are tested in horizontal and vertical direction.
9.2.4 Vertical load and horizontal force (full calibration) Check/adjust the vertical load zero: check that the device records zero load when no
load is applied. Check/adjust the vertical load gain: apply a vertical load of 200 N perpendicular to the
test wheel axle and adjust the gain of the load cell to the required target. Check/adjust the horizontal force zero: remove the chain tension and check that the
recorded horizontal force is zero. Check/adjust the horizontal force gain: apply a horizontal force of 150 N
perpendicular to the test wheel axle and adjust the gain of the load cell to the required target.
9.2.5 Distance Carry out a distance calibration as described below or if the drive tyres are changed,
or if a malfunction is suspected; Ensure tyre pressures are correct according to the manufacturer's instructions;
TYROSAFE Deliverable 04: Report on state-of-the-art of test methods
Date: 05/12/2008, Version: 4 72 (89)
Select a straight, level stretch of road of known length at least 400m; Start the recorder. Tow the device along the length and record the distance at the
start and end of the test section. The result shall be within ± 1.0 % of the known length.
9.2.6 Water Flow rate Pump the water into a calibrated receptacle of at least 10litres capacity and measure the time to fill.
9.2.7 Full manufacturer’s service and calibration The device shall have an annual independent calibration of the measuring devices. A comparative test is done with a reference device and a certificate of compliance provided.
9.2.8 Correlation exercise with other devices Where required by national regulations, devices should be checked one against each other on different surfaces.
9.3 ROADSTAR
9.3.1 Prior to testing Prior to testing the test tyre has to be checked at the ambient temperature on pressure and wear (the radius of the tyre has to be measured, and used as an input parameter for the tests). The test tyres also have to be inspected concerning flat spots, damage or other irregularities that may affect test results. The tyre has to be replaced if it is damaged or worn beyond the wear line of 1.6 mm. Also the water flow system has to be inspected. The test-wheel force has to be checked and if necessary adjusted, prior to each test series. Before each test series the test tyre has to be lowered to the pavement and must run in under measuring conditions on a test length of approximately 500 m to reach a stable operating temperature.
9.3.2 Criteria for periodic calibrations In periodical intervals, approximately every 1000 km, the friction device (the torque axle, the braking torque and the static and the dynamic wheel force) has to be calibrated. A successful calibration is carried out if the offset between a measurement before and a measurement after the calibration on a minimum two kilometre long track at the standard measuring speed (60 km/h) is not greater than specified in Table 9.2.
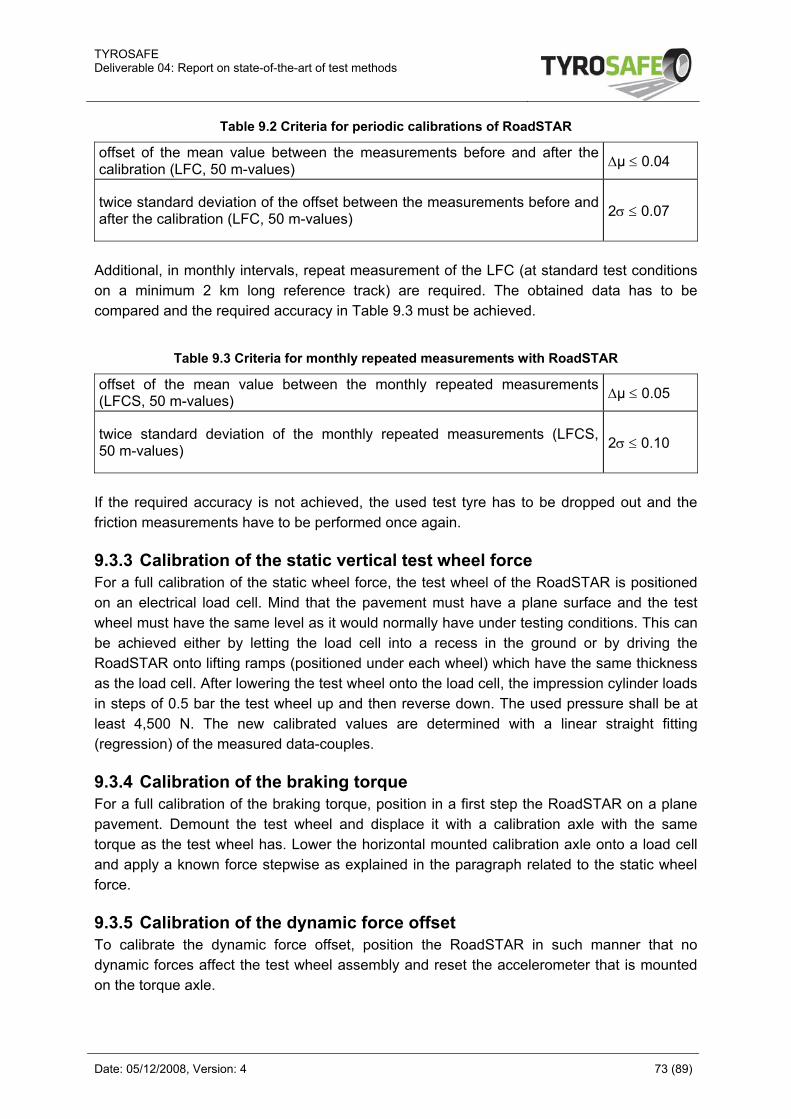
TYROSAFE Deliverable 04: Report on state-of-the-art of test methods
Date: 05/12/2008, Version: 4 73 (89)
Table 9.2 Criteria for periodic calibrations of RoadSTAR
offset of the mean value between the measurements before and after the calibration (LFC, 50 m-values) Δµ ≤ 0.04
twice standard deviation of the offset between the measurements before and after the calibration (LFC, 50 m-values) 2σ ≤ 0.07
Additional, in monthly intervals, repeat measurement of the LFC (at standard test conditions on a minimum 2 km long reference track) are required. The obtained data has to be compared and the required accuracy in Table 9.3 must be achieved.
Table 9.3 Criteria for monthly repeated measurements with RoadSTAR
offset of the mean value between the monthly repeated measurements (LFCS, 50 m-values) Δµ ≤ 0.05
twice standard deviation of the monthly repeated measurements (LFCS, 50 m-values) 2σ ≤ 0.10
If the required accuracy is not achieved, the used test tyre has to be dropped out and the friction measurements have to be performed once again.
9.3.3 Calibration of the static vertical test wheel force For a full calibration of the static wheel force, the test wheel of the RoadSTAR is positioned on an electrical load cell. Mind that the pavement must have a plane surface and the test wheel must have the same level as it would normally have under testing conditions. This can be achieved either by letting the load cell into a recess in the ground or by driving the RoadSTAR onto lifting ramps (positioned under each wheel) which have the same thickness as the load cell. After lowering the test wheel onto the load cell, the impression cylinder loads in steps of 0.5 bar the test wheel up and then reverse down. The used pressure shall be at least 4,500 N. The new calibrated values are determined with a linear straight fitting (regression) of the measured data-couples.
9.3.4 Calibration of the braking torque For a full calibration of the braking torque, position in a first step the RoadSTAR on a plane pavement. Demount the test wheel and displace it with a calibration axle with the same torque as the test wheel has. Lower the horizontal mounted calibration axle onto a load cell and apply a known force stepwise as explained in the paragraph related to the static wheel force.
9.3.5 Calibration of the dynamic force offset To calibrate the dynamic force offset, position the RoadSTAR in such manner that no dynamic forces affect the test wheel assembly and reset the accelerometer that is mounted on the torque axle.
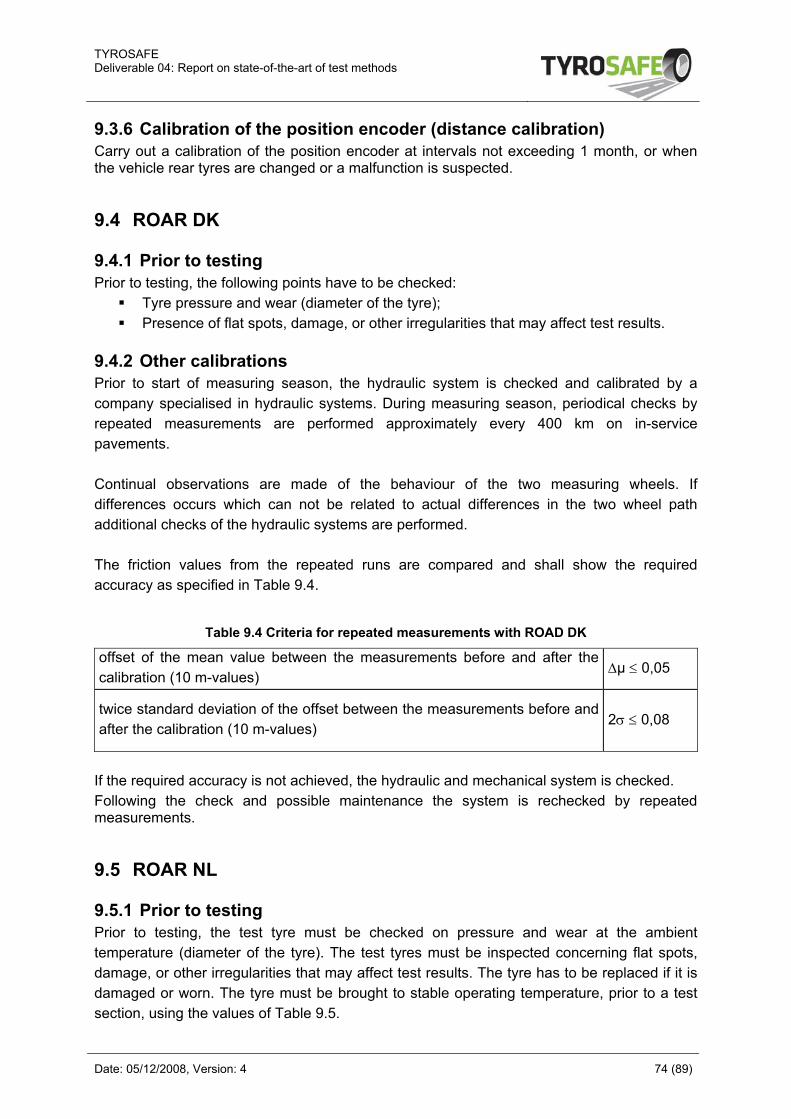
TYROSAFE Deliverable 04: Report on state-of-the-art of test methods
Date: 05/12/2008, Version: 4 74 (89)
9.3.6 Calibration of the position encoder (distance calibration) Carry out a calibration of the position encoder at intervals not exceeding 1 month, or when the vehicle rear tyres are changed or a malfunction is suspected.
9.4 ROAR DK
9.4.1 Prior to testing Prior to testing, the following points have to be checked:
Tyre pressure and wear (diameter of the tyre); Presence of flat spots, damage, or other irregularities that may affect test results.
9.4.2 Other calibrations Prior to start of measuring season, the hydraulic system is checked and calibrated by a company specialised in hydraulic systems. During measuring season, periodical checks by repeated measurements are performed approximately every 400 km on in-service pavements. Continual observations are made of the behaviour of the two measuring wheels. If differences occurs which can not be related to actual differences in the two wheel path additional checks of the hydraulic systems are performed. The friction values from the repeated runs are compared and shall show the required accuracy as specified in Table 9.4.
Table 9.4 Criteria for repeated measurements with ROAD DK
offset of the mean value between the measurements before and after the calibration (10 m-values) Δµ ≤ 0,05
twice standard deviation of the offset between the measurements before and after the calibration (10 m-values) 2σ ≤ 0,08
If the required accuracy is not achieved, the hydraulic and mechanical system is checked. Following the check and possible maintenance the system is rechecked by repeated measurements.
9.5 ROAR NL
9.5.1 Prior to testing Prior to testing, the test tyre must be checked on pressure and wear at the ambient temperature (diameter of the tyre). The test tyres must be inspected concerning flat spots, damage, or other irregularities that may affect test results. The tyre has to be replaced if it is damaged or worn. The tyre must be brought to stable operating temperature, prior to a test section, using the values of Table 9.5.
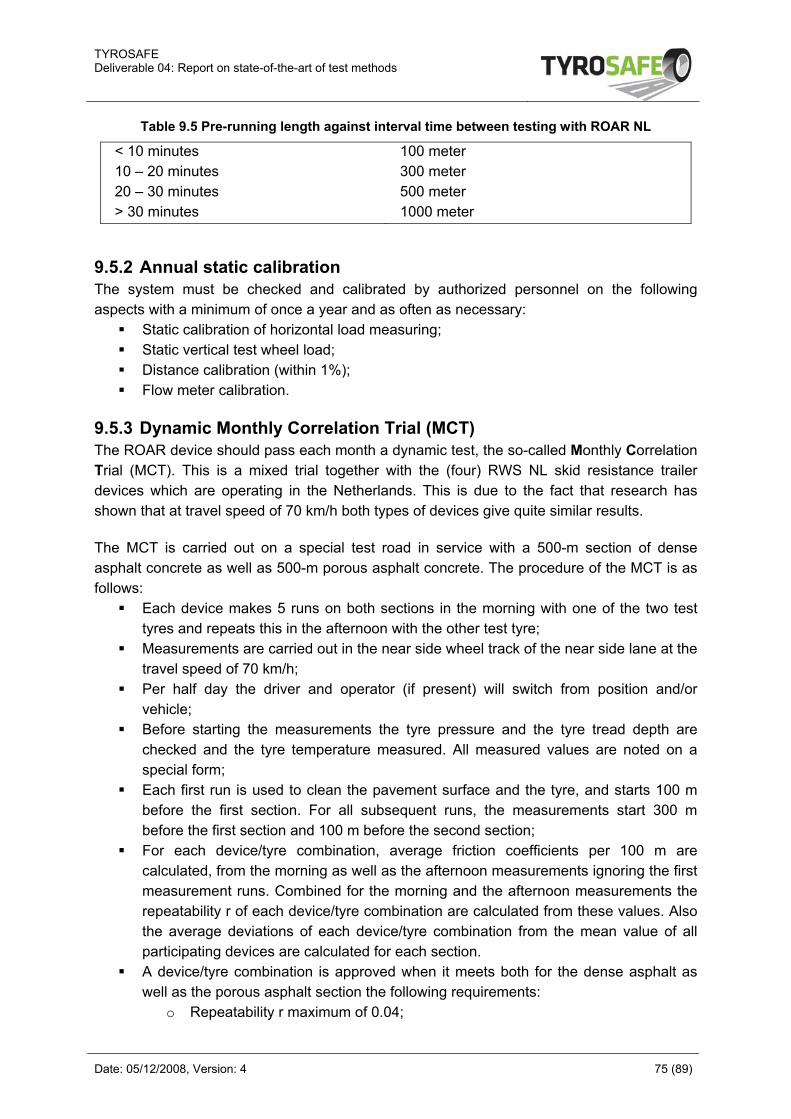
TYROSAFE Deliverable 04: Report on state-of-the-art of test methods
Date: 05/12/2008, Version: 4 75 (89)
Table 9.5 Pre-running length against interval time between testing with ROAR NL
< 10 minutes 10 – 20 minutes 20 – 30 minutes > 30 minutes
100 meter 300 meter 500 meter 1000 meter
9.5.2 Annual static calibration The system must be checked and calibrated by authorized personnel on the following aspects with a minimum of once a year and as often as necessary:
Static calibration of horizontal load measuring; Static vertical test wheel load; Distance calibration (within 1%); Flow meter calibration.
9.5.3 Dynamic Monthly Correlation Trial (MCT) The ROAR device should pass each month a dynamic test, the so-called Monthly Correlation Trial (MCT). This is a mixed trial together with the (four) RWS NL skid resistance trailer devices which are operating in the Netherlands. This is due to the fact that research has shown that at travel speed of 70 km/h both types of devices give quite similar results. The MCT is carried out on a special test road in service with a 500-m section of dense asphalt concrete as well as 500-m porous asphalt concrete. The procedure of the MCT is as follows:
Each device makes 5 runs on both sections in the morning with one of the two test tyres and repeats this in the afternoon with the other test tyre;
Measurements are carried out in the near side wheel track of the near side lane at the travel speed of 70 km/h;
Per half day the driver and operator (if present) will switch from position and/or vehicle;
Before starting the measurements the tyre pressure and the tyre tread depth are checked and the tyre temperature measured. All measured values are noted on a special form;
Each first run is used to clean the pavement surface and the tyre, and starts 100 m before the first section. For all subsequent runs, the measurements start 300 m before the first section and 100 m before the second section;
For each device/tyre combination, average friction coefficients per 100 m are calculated, from the morning as well as the afternoon measurements ignoring the first measurement runs. Combined for the morning and the afternoon measurements the repeatability r of each device/tyre combination are calculated from these values. Also the average deviations of each device/tyre combination from the mean value of all participating devices are calculated for each section.
A device/tyre combination is approved when it meets both for the dense asphalt as well as the porous asphalt section the following requirements:
o Repeatability r maximum of 0.04;
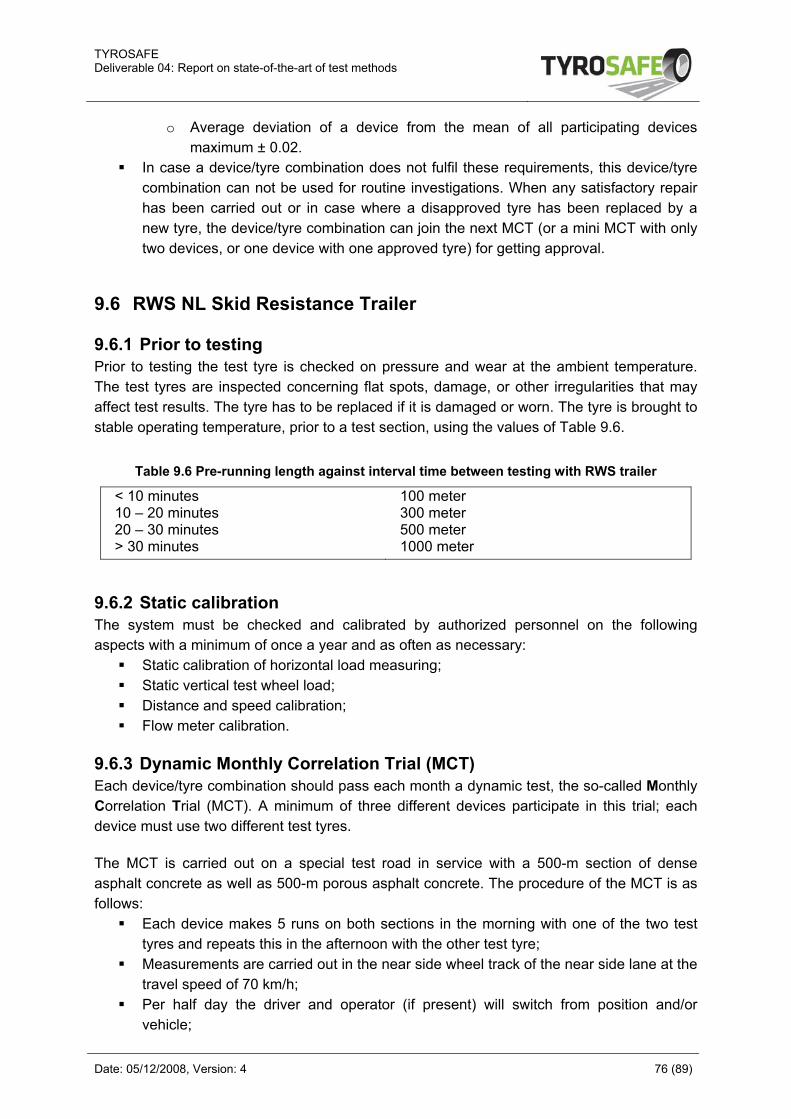
TYROSAFE Deliverable 04: Report on state-of-the-art of test methods
Date: 05/12/2008, Version: 4 76 (89)
o Average deviation of a device from the mean of all participating devices maximum ± 0.02.
In case a device/tyre combination does not fulfil these requirements, this device/tyre combination can not be used for routine investigations. When any satisfactory repair has been carried out or in case where a disapproved tyre has been replaced by a new tyre, the device/tyre combination can join the next MCT (or a mini MCT with only two devices, or one device with one approved tyre) for getting approval.
9.6 RWS NL Skid Resistance Trailer
9.6.1 Prior to testing Prior to testing the test tyre is checked on pressure and wear at the ambient temperature. The test tyres are inspected concerning flat spots, damage, or other irregularities that may affect test results. The tyre has to be replaced if it is damaged or worn. The tyre is brought to stable operating temperature, prior to a test section, using the values of Table 9.6.
Table 9.6 Pre-running length against interval time between testing with RWS trailer
< 10 minutes 10 – 20 minutes 20 – 30 minutes > 30 minutes
100 meter 300 meter 500 meter 1000 meter
9.6.2 Static calibration The system must be checked and calibrated by authorized personnel on the following aspects with a minimum of once a year and as often as necessary:
Static calibration of horizontal load measuring; Static vertical test wheel load; Distance and speed calibration; Flow meter calibration.
9.6.3 Dynamic Monthly Correlation Trial (MCT) Each device/tyre combination should pass each month a dynamic test, the so-called Monthly Correlation Trial (MCT). A minimum of three different devices participate in this trial; each device must use two different test tyres. The MCT is carried out on a special test road in service with a 500-m section of dense asphalt concrete as well as 500-m porous asphalt concrete. The procedure of the MCT is as follows:
Each device makes 5 runs on both sections in the morning with one of the two test tyres and repeats this in the afternoon with the other test tyre;
Measurements are carried out in the near side wheel track of the near side lane at the travel speed of 70 km/h;
Per half day the driver and operator (if present) will switch from position and/or vehicle;
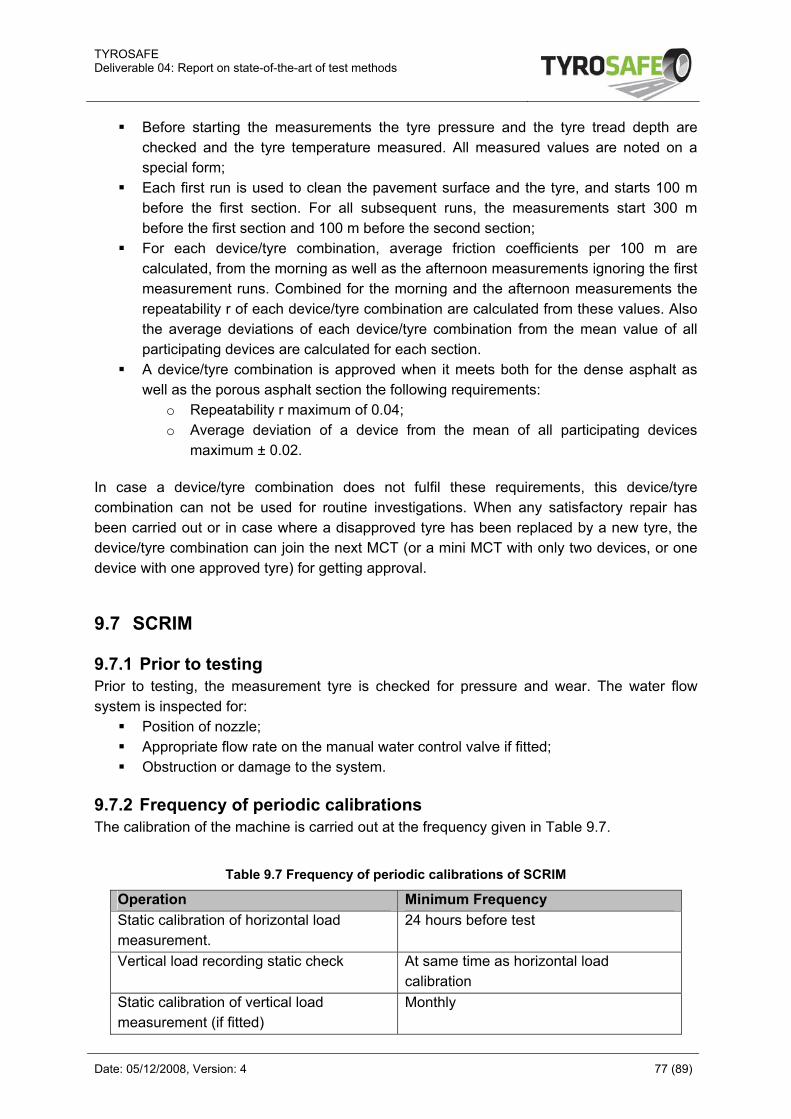
TYROSAFE Deliverable 04: Report on state-of-the-art of test methods
Date: 05/12/2008, Version: 4 77 (89)
Before starting the measurements the tyre pressure and the tyre tread depth are checked and the tyre temperature measured. All measured values are noted on a special form;
Each first run is used to clean the pavement surface and the tyre, and starts 100 m before the first section. For all subsequent runs, the measurements start 300 m before the first section and 100 m before the second section;
For each device/tyre combination, average friction coefficients per 100 m are calculated, from the morning as well as the afternoon measurements ignoring the first measurement runs. Combined for the morning and the afternoon measurements the repeatability r of each device/tyre combination are calculated from these values. Also the average deviations of each device/tyre combination from the mean value of all participating devices are calculated for each section.
A device/tyre combination is approved when it meets both for the dense asphalt as well as the porous asphalt section the following requirements:
o Repeatability r maximum of 0.04; o Average deviation of a device from the mean of all participating devices
maximum ± 0.02. In case a device/tyre combination does not fulfil these requirements, this device/tyre combination can not be used for routine investigations. When any satisfactory repair has been carried out or in case where a disapproved tyre has been replaced by a new tyre, the device/tyre combination can join the next MCT (or a mini MCT with only two devices, or one device with one approved tyre) for getting approval.
9.7 SCRIM
9.7.1 Prior to testing Prior to testing, the measurement tyre is checked for pressure and wear. The water flow system is inspected for:
Position of nozzle; Appropriate flow rate on the manual water control valve if fitted; Obstruction or damage to the system.
9.7.2 Frequency of periodic calibrations The calibration of the machine is carried out at the frequency given in Table 9.7.
Table 9.7 Frequency of periodic calibrations of SCRIM
Operation Minimum Frequency Static calibration of horizontal load measurement.
24 hours before test
Vertical load recording static check At same time as horizontal load calibration
Static calibration of vertical load measurement (if fitted)
Monthly
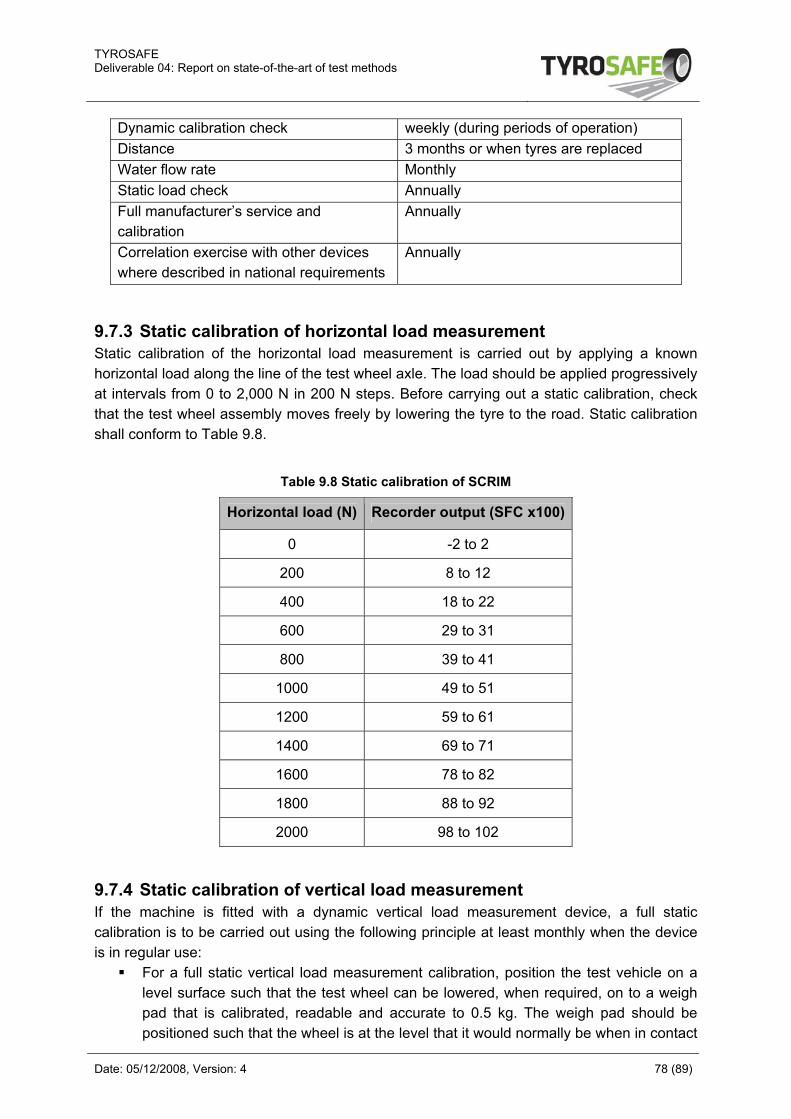
TYROSAFE Deliverable 04: Report on state-of-the-art of test methods
Date: 05/12/2008, Version: 4 78 (89)
Dynamic calibration check weekly (during periods of operation) Distance 3 months or when tyres are replaced Water flow rate Monthly Static load check Annually Full manufacturer’s service and calibration
Annually
Correlation exercise with other devices where described in national requirements
Annually
9.7.3 Static calibration of horizontal load measurement Static calibration of the horizontal load measurement is carried out by applying a known horizontal load along the line of the test wheel axle. The load should be applied progressively at intervals from 0 to 2,000 N in 200 N steps. Before carrying out a static calibration, check that the test wheel assembly moves freely by lowering the tyre to the road. Static calibration shall conform to Table 9.8.
Table 9.8 Static calibration of SCRIM
Horizontal load (N) Recorder output (SFC x100)
0 -2 to 2
200 8 to 12
400 18 to 22
600 29 to 31
800 39 to 41
1000 49 to 51
1200 59 to 61
1400 69 to 71
1600 78 to 82
1800 88 to 92
2000 98 to 102
9.7.4 Static calibration of vertical load measurement If the machine is fitted with a dynamic vertical load measurement device, a full static calibration is to be carried out using the following principle at least monthly when the device is in regular use:
For a full static vertical load measurement calibration, position the test vehicle on a level surface such that the test wheel can be lowered, when required, on to a weigh pad that is calibrated, readable and accurate to 0.5 kg. The weigh pad should be positioned such that the wheel is at the level that it would normally be when in contact
TYROSAFE Deliverable 04: Report on state-of-the-art of test methods
Date: 05/12/2008, Version: 4 79 (89)
with a road. Lower the test wheel onto the weigh pad and apply a known vertical load from 0 to 200 kg in increasing steps of 20 kg, as indicated by the weigh pad display.
9.7.5 Vertical load recording static check A static vertical load recording check is to be made whenever a horizontal load calibration is carried out unless a full static vertical load calibration is to be made at that time:
Park the vehicle on a generally level surface. Lower the test wheel to its normal operating position. Check the vertical load indicated by the vertical load sensor. The indicated static vertical load shall be 200 ± 8 kg;
Follow the manufacturer’s instructions for operating the recorder to carry out this check.
9.7.6 Vertical load static check A static vertical load check shall be made at least annually:
Position the test vehicle on a level surface such that the test wheel can be lowered, when required, on to a weigh pad that is calibrated, readable and accurate to 0.5 kg. The weigh pad should be positioned such that the wheel is at the level that it would normally be when in contact with a road. Lower the test wheel onto the weigh pad. The indicated load should be consistent with the requirements the wheel assembly mass.
9.7.7 Dynamic calibration check Carry out a dynamic calibration check, in accordance with the procedure below, at least once per week during periods of operation and after repairs/servicing to the measuring equipment:
The purpose of the dynamic calibration check is to test the SCRIM equipment under dynamic conditions to ensure consistency of results. Checks must be carried out at least once per week. Select a stretch of pavement where a convenient check can be carried out to establish consistency over time. The following should be considered when selecting a site for dynamic calibration checks:
o The check site should have separate sections to check the device at a low (but safe), medium, and high level of skidding resistance. Such a site may be difficult to locate and separate sites may be required for the different levels of skidding resistance.
o Sections should be at least 100 m long, have a generally uniform skidding resistance along the whole length, and should already have reached the equilibrium value. The horizontal alignment of the section should not be curved with a radius less than 300 m.
o The vertical alignment should not have a gradient greater than 1/20. o The road profile should be even, with no rutting, potholes, or patching, and no
areas where water can stand during rainfall. The site should be structurally sound.
o Preferably the traffic loading should not fluctuate unduly throughout the testing season.
Carry out SCRIM testing at a defined test speed and a defined subsection length. Calculate the average SFC for each section on completion of the test runs. The
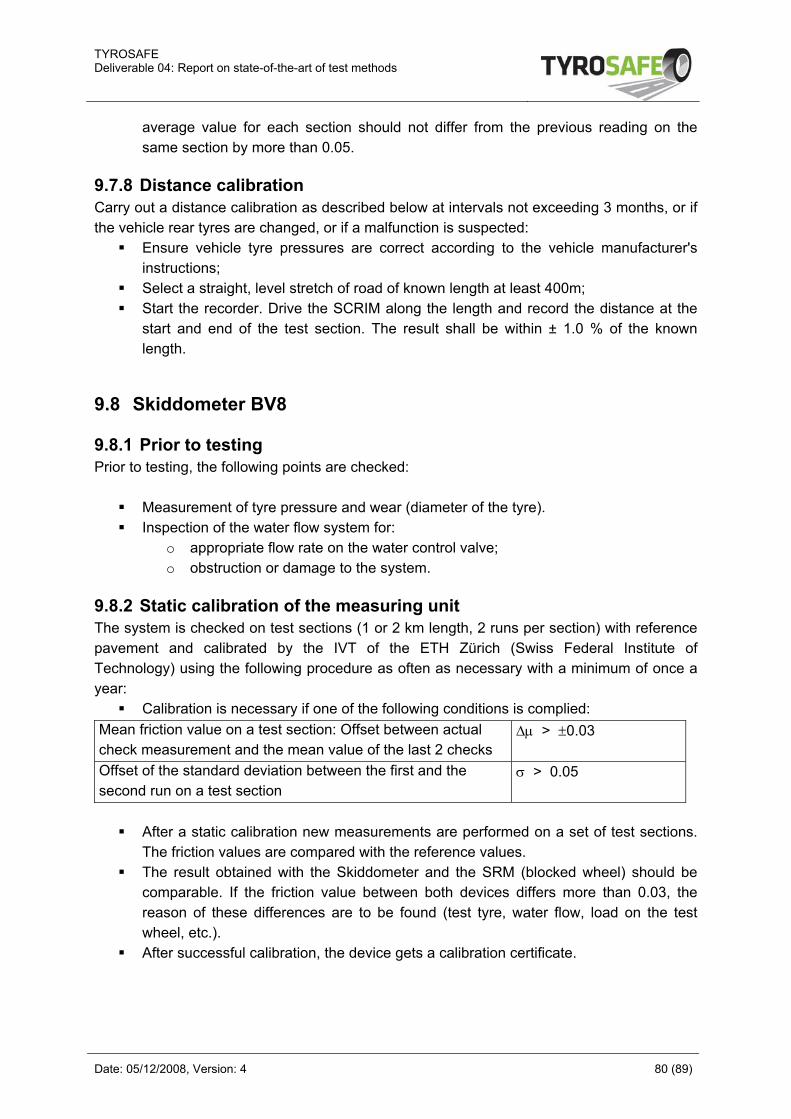
TYROSAFE Deliverable 04: Report on state-of-the-art of test methods
Date: 05/12/2008, Version: 4 80 (89)
average value for each section should not differ from the previous reading on the same section by more than 0.05.
9.7.8 Distance calibration Carry out a distance calibration as described below at intervals not exceeding 3 months, or if the vehicle rear tyres are changed, or if a malfunction is suspected:
Ensure vehicle tyre pressures are correct according to the vehicle manufacturer's instructions;
Select a straight, level stretch of road of known length at least 400m; Start the recorder. Drive the SCRIM along the length and record the distance at the
start and end of the test section. The result shall be within ± 1.0 % of the known length.
9.8 Skiddometer BV8
9.8.1 Prior to testing Prior to testing, the following points are checked:
Measurement of tyre pressure and wear (diameter of the tyre). Inspection of the water flow system for:
o appropriate flow rate on the water control valve; o obstruction or damage to the system.
9.8.2 Static calibration of the measuring unit The system is checked on test sections (1 or 2 km length, 2 runs per section) with reference pavement and calibrated by the IVT of the ETH Zürich (Swiss Federal Institute of Technology) using the following procedure as often as necessary with a minimum of once a year:
Calibration is necessary if one of the following conditions is complied: Mean friction value on a test section: Offset between actual check measurement and the mean value of the last 2 checks
Δμ > ±0.03
Offset of the standard deviation between the first and the second run on a test section
σ > 0.05
After a static calibration new measurements are performed on a set of test sections.
The friction values are compared with the reference values. The result obtained with the Skiddometer and the SRM (blocked wheel) should be
comparable. If the friction value between both devices differs more than 0.03, the reason of these differences are to be found (test tyre, water flow, load on the test wheel, etc.).
After successful calibration, the device gets a calibration certificate.
TYROSAFE Deliverable 04: Report on state-of-the-art of test methods
Date: 05/12/2008, Version: 4 81 (89)
9.9 SKM
9.9.1 Prior to testing Prior to testing, the following tests and examinations are necessary:
Check the validity of the quality assurance instruments. Count and document the monitoring bores in the tyre. The second last bore must be
clearly visible. Document the measurement tyre's entire route. Check the tyre overpressure (vehicle and measurement tyres). Check the mechanical components of the measurement-wheel suspension and
measurement-force transmission mechanism for smooth operation and tolerable bearing play.
Check whether the water dispenser is correctly positioned and whether the leading brushes are still sufficiently long; check for smooth operation and tolerable play.
Configure the measurement program according to the measurement vehicle's operating instructions and the required measurement task.
Check the lateral force coefficient with the measurement wheel lifted: IµyI ≤ 0.005. Run-in the measurement tyre on its operational setting. Before the first measurement or after any measurement interruption of more than 15
minutes, the measurement tyre must be run-in over a distance of at least 2.0 km on the operational setting (including active wetting unit); in the case of shorter measurement interruptions, the run-in distance can be reduced to 0.5 km provided that the specified tolerances are observed.
Mark the starting point and note down all details necessary for clearly identifying the measurement route.
9.9.2 Periodic calibrations Three instruments are used to assure the quality of lateral force coefficient measurements:
Annual, limited operating approval; Quarterly external control of test equipment; Monthly internal control of test equipment.
Traction measurements based on the sideway-force coefficient are to be conducted exclusively with equipment which meets the requirements stipulated in Section 6 and 7, has been approved for temporary operation and is accompanied by a valid external control certificate. Limited operating approval is granted by the BASt (Federal Highway Research Institute) for a period of one year (Appendix 2a). In addition to receiving limited operating approval, it is necessary to conduct the regular tests described in Section 10.4 as part of internal control by operators for the purpose of checking the calibration of test equipment. For regular verification of measuring accuracy, calibrations of the test equipment have to be controlled externally over every measuring period of one year on behalf of the device operator. During external control, the results obtained for the operator's test equipment are to be compared with those of BASt (Federal Highway Research Institute)'s test equipment.
TYROSAFE Deliverable 04: Report on state-of-the-art of test methods
Date: 05/12/2008, Version: 4 82 (89)
The device operator must ensure an availability of procedures for reporting events such as accidents or incidences of damage to measuring equipment.
9.9.3 Temporary operating approval The suitability of measuring equipment is to be verified as part of limited operating approval procedures. Temporary operating approval only examines the items governed by tolerances specified in the technical test regulations. Technical modifications or incidences of damage (for example, due to accident) influencing measurement results are to be reported immediately to the Federal Highway Research Institute. Further procedures in such cases will be determined by the institute. Temporary operating approval of measuring equipment is to be granted by the Federal Highway Research Institute for a period of one year in each case. As part of temporary operating approval, it is necessary to verify the test equipment suitability for the intended type of skid resistance measurement. The tests nature and scope are defined below:
Measuring mechanisms o Inspection of the joints and guides of the test equipment for smooth operation
and permissible play in accordance with the test equipment's operating instructions.
o Inspection of tension-free configuration of the load cell. o Inspection of the test wheel axle bearing positioning in accordance with
design specifications. o Inspection of the shock absorbers of the measurement unit.
Vertical load of the test wheel A calibrated weighing system is to be used for static measurement of the vertical load of the test wheel (normal force) in the test wheel's contact plane as well as 50 mm above and below this plane. Target value: 1960 N Permissible deviation: ± 10 N
Test line wetting Measurements of water discharge are to be conducted at a standstill in order to check for the existence of the required water film thickness and width during simulation of the target test speeds. It is necessary to check whether:
o an acoustic warning is emitted when a water shortage occurs; o the water supply is activated before the test wheel makes contact with the
pavement. Measuring chain for recording frictional force
Following connection of a calibrated force sensor directly to the wheel axle or wheel contact surface, a loading device compliant with the device design is to be used to apply a calibration force corresponding in magnitude and direction to the frictional force to be measured. In this state, the static friction in the bearings is to be eased through mechanical action (for example, vibrations or rubber-hammer blows). The side-way force FY is to be measured with increasing and decreasing calibration force
o in at least 5 steps from 0 to 1000 N and o in at least 3 steps from 1000 to 2000 N
TYROSAFE Deliverable 04: Report on state-of-the-art of test methods
Date: 05/12/2008, Version: 4 83 (89)
The permissible deviation in measured values μSKM = ± 0.005 Repeated and comparative measurements
Simultaneous measurements with the test equipment being inspected and the reference test equipment of the BASt (Federal Highway Research Institute) are to be performed on four test sections with differing skid resistance levels. Each test section must be at least 2,000 m long and travelled twice (repeated measurement) with the clearance control system. Proper alignment of both test equipments with respect to the test line is to be ensured through direct, head-to-tail travel. To cancel the influence of any difference in the test tyres friction coefficients, the tyres are to be interchanged between the measuring devices, and two additional measurements have to be performed. Inaccuracies in the results (calculated from the average of 100m-subsections) yielded by the measurements must remain within the following tolerances:
o Maximum deviation for repeated measurements µSKM = ± 0.015 o Maximum deviation for comparative measurements µSKM = ± 0.025
Compliance with these accuracy tolerances must be given on all test sections. Measurements are also used to determine device-specific correction factors for implementation during averaging.
9.9.4 External control of test equipment External control of test equipment comprises checks to ascertain whether the quality of annual measurements meets the specified standards. External control of test equipment is necessary:
for traction measurements as part of road monitoring and assessment according to ZTV ZEB;
for traction measurements specified by construction contracts. Valid for 3 months in each case, such control must be performed at regular intervals. If external control of test equipment has already been performed in accordance with ZEB or limited operating approval has been granted for the respective 3-month period, further external control is not required and the 3-month period becomes effective immediately. External control of test equipment needs to be performed in two directly consecutive measurements over a test section of 2 km in each case (operator's vehicle and the vehicle of the BASt (Federal Highway Research Institute)). To evaluate the comparative measurements, it is necessary to determine the average difference. Evaluation (approval or rejection of the device operator's measurements) is based on the measurement of the BASt (Federal Highway Research Institute) exhibiting the smaller deviation with respect to the device operator's measurement, provided that repeated measurement inaccuracies lie within a tolerance μSKM ≤ 0.015. Deviations between the measurement results of the operator`s measurements and the measurements of the BASt (Federal Highway Research Institute) must lie within the following tolerances: for the difference of the average value: µSKM ≤ 0.035
TYROSAFE Deliverable 04: Report on state-of-the-art of test methods
Date: 05/12/2008, Version: 4 84 (89)
External control of test equipment must be documented in a test certificate. If an external control test is not passed, the operator must inform the client about the deficiency as well as check and, if necessary, repeat all measurements carried out since the last successful external test.
9.9.5 Internal control of test equipment Internal control of test equipments comprises tests by the operator to ensure proper functionality of the devices at all times. Operators have to control their test equipment and document the results under their own responsibility with the required degree of care. If any deviations exceeding the specified accuracy tolerances are detected, their causes are to be eliminated without delay. The operator’s commitment to exercise the required degree of care is limited, apart from construction monitoring, exclusively to a verification of the test equipment's proper functionality. Measurements at v = 80 km/h are to be conducted on two test sections (federal motorway or 4-lane federal highway) each 2 km long at regular time intervals not exceeding one month. One test section is to provide an average skid resistance μSKM(80) < 0.45, the other section an average skid resistance μSKM(80) > 0.6. The result obtained for a test section is to comprise the total average value of the SKM (Sideway-Force Coefficient) of the 100m-subsection over the entire test section in two directly consecutive measurements. The accuracy tolerance μSKM(80)
= ± 0.015 for repeated measurements must be maintained thereby. The total average values are also to be compared with those obtained during the last, correct internal control of the test equipment. Inaccuracies in this case must not exceed a tolerance range of μSKM(80) = ± 0.035. It is also necessary to check the wheel load, the load cell calibration and the water dosage. Should any deviations attributable to test equipment errors occur, the measurement results obtained since the last correct internal control of the test equipment must be discarded. Before replacement of any test tyre which has attained the operating limits (section 7.2 in [10]), a comparative measurement as described above must be performed between the old and new test tyres. The results yielded by internal control of the test equipment are to be documented and saved. Internal control results (measured data) must be submitted to the BASt (Federal Highway Research Institute) immediately upon completion of internal control to facilitate timely verification of the reproducibility and repeatability of all SKM skid resistance measurement systems used. This does not relieve the operators of their responsibility for operating the SKM skid resistance measurement vehicle. Operators must ensure that both of their test sections used for internal control also permit comparative measurements by the test vehicle of the BASt (Federal Highway Research Institute) for the purpose of verifying the reproducibility and repeatability of the operators' test equipment with respect to a reference test equipment specified by the BASt (Federal
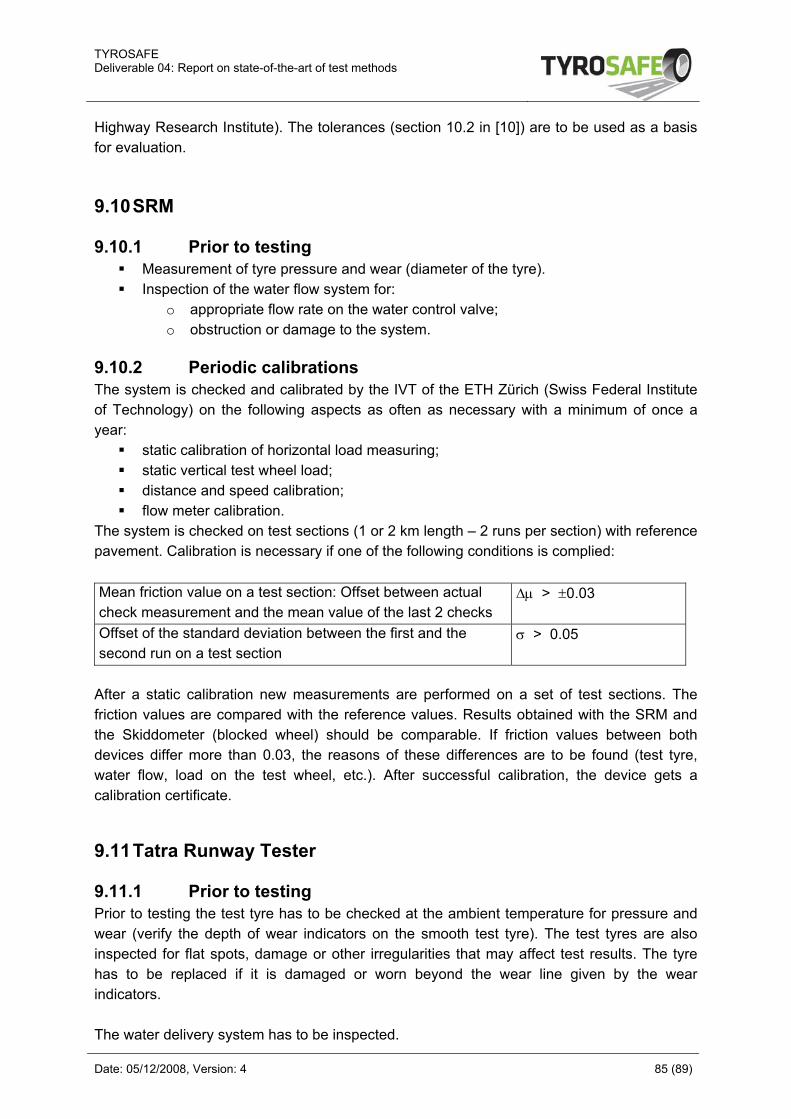
TYROSAFE Deliverable 04: Report on state-of-the-art of test methods
Date: 05/12/2008, Version: 4 85 (89)
Highway Research Institute). The tolerances (section 10.2 in [10]) are to be used as a basis for evaluation.
9.10 SRM
9.10.1 Prior to testing Measurement of tyre pressure and wear (diameter of the tyre). Inspection of the water flow system for:
o appropriate flow rate on the water control valve; o obstruction or damage to the system.
9.10.2 Periodic calibrations The system is checked and calibrated by the IVT of the ETH Zürich (Swiss Federal Institute of Technology) on the following aspects as often as necessary with a minimum of once a year:
static calibration of horizontal load measuring; static vertical test wheel load; distance and speed calibration; flow meter calibration.
The system is checked on test sections (1 or 2 km length – 2 runs per section) with reference pavement. Calibration is necessary if one of the following conditions is complied: Mean friction value on a test section: Offset between actual check measurement and the mean value of the last 2 checks
Δμ > ±0.03
Offset of the standard deviation between the first and the second run on a test section
σ > 0.05
After a static calibration new measurements are performed on a set of test sections. The friction values are compared with the reference values. Results obtained with the SRM and the Skiddometer (blocked wheel) should be comparable. If friction values between both devices differ more than 0.03, the reasons of these differences are to be found (test tyre, water flow, load on the test wheel, etc.). After successful calibration, the device gets a calibration certificate.
9.11 Tatra Runway Tester
9.11.1 Prior to testing Prior to testing the test tyre has to be checked at the ambient temperature for pressure and wear (verify the depth of wear indicators on the smooth test tyre). The test tyres are also inspected for flat spots, damage or other irregularities that may affect test results. The tyre has to be replaced if it is damaged or worn beyond the wear line given by the wear indicators. The water delivery system has to be inspected.
TYROSAFE Deliverable 04: Report on state-of-the-art of test methods
Date: 05/12/2008, Version: 4 86 (89)
9.11.2 Calibration requirements Verification and checking of the test device is carried out according to specific guidance for TRT devices. Following the provisions of this methodology ensures accuracy and repeatability of measured variables. Calibration of the parameters shall be carried out when the design value given by the manufacturer does not correspond to the value recorded by the device. A known length of road surface shall be identified and maintained as a calibration surface. Calibrated variables are as follows:
Calibration of hydraulics (by pressure sensors); Calibration of vertical force; Calibration of longitudinal force; Calibration of acceleration sensors; Calibration of the sensors of slope; Calibration of driven distance and operating speed; Calibration of the slip ratio of measuring and reference wheel.
9.11.3 Verification of basic parameters of the test device Prior to beginning of verification the content of the calibration values memory is compared with the design values given by the manufacturer.
9.11.4 Testing of measuring device Testing of motor rotations; Testing of measuring wheel rotations; Testing of pulse sensors of slip; Testing of longitudinal force sensor; Testing of vertical force sensor; Testing of regulation of hydraulic transmission.
9.11.5 Checking of the test device Daily checking
Carrying out of a complete test on all subsystems; Checking of the test tyre pressure.
Weekly checking Checking of the pressure of measuring vehicle tyres; Checking of the tread wear of the test tyre; Checking of the clamping of the test wheel; Checking of the tightness of hydraulic system; Checking of the parallelogram.
Monthly checking Checking of the oil level in hydraulic circuit; Checking of the adjustment of indented belt; Checking of anti-skid properties on calibration sections; Checking measurement by profilometer on calibration section; Annual checking (carried out usually before the beginning of measuring season); Checking of oil condition in hydraulic circuit of measuring system; Checking of the contamination of filter element in hydraulic system;
TYROSAFE Deliverable 04: Report on state-of-the-art of test methods
Date: 05/12/2008, Version: 4 87 (89)
Checking of the tightness of the hydraulic circuit of measuring system; Checking of high-pressure hoses of hydraulic system; Checking of the gas pressure accumulator of hydraulic system that loads the test
wheel; Checking of the adjustment of test vehicle parallelogram; Checking of the cabling, connectors and electronic control unit; Checking of the pre-wetting water quantity (amount of water in l/min measured by
calibrated tank); Checking of the driven distance and measured speed; Calibration of the longitudinal and vertical force sensors; Calibration of acceleration sensors; Control measurement of skid resistance using all modes on calibration sections; Control measurement using the profilometer on calibration section; Checking of the adjustment of video camera.
TYROSAFE Deliverable 04: Report on state-of-the-art of test methods
Date: 05/12/2008, Version: 4 88 (89)
10 References [1] CEN 2007, Technical specifications: Procedure for determining the skid resistance of a
pavement surface using a device with longitudinal controlled slip (LFCA): the ADHERA, N 188 E Rev.1, Bron, France.
[2] CEN 2007, Technical specifications: Procedure for determining the skid resistance of a pavement surface using a device with longitudinal controlled slip: the BV 11 and Saab Friction Tester (SFT), N 215 E Rev.1, Bron, France.
[3] CEN 2007, Procedure for determining the skid resistance of a pavement surface using a device with longitudinal fixed slip ratio (LFCG): the GripTester®, N 193 E Rev.1, Bron, France.
[4] CEN 2007, Procedure for determining the skid resistance of a pavement surface using a device with longitudinal fixed slip ratio (LFCS): the RoadSTAR, N 187 E Rev.1, Bron, France.
[5] CEN 2007, Technical specifications: Procedure for determining the skid resistance of a pavement surface using a device with longitudinal controlled slip (LFCRDK): the ROAR (Road Analyser and Recorder of Norsemeter) used in Denmark, N 190b E Rev.1, Bron, France.
[6] CEN 2007, Technical specifications: Procedure for determining the skid resistance of a pavement surface using a device with longitudinal controlled slip (LFCRNL): the ROAR (Road Analyser and Recorder of Norsemeter) as used in the Netherlands, N 190 E Rev.1, Bron, France.
[7] CEN 2007, Technical specifications: Procedure for determining the skid resistance of a pavement surface by measurement of the longitudinal friction coefficient (LFCD): the DWW NL skid resistance trailer, N 204 E Rev.1, Bron, France.
[8] CEN 2007, Technical specifications: Procedure for determining the skid resistance of a pavement surface by measurement of the sideway force coefficient (SFCS): the SCRIM, N 192 E Rev.1, Bron, France.
[9] CEN 2007, Technical specifications: Procedure for determining the skid resistance of a pavement surface using a device with longitudinal block measurement (LFCSK): the Skiddometer BV-8, N 212 E Rev.1, Bron, France.
[10] CEN 2007, Technical specifications: Procedure for determining the skid resistance of a pavement surface by measurement of the sideway-force coefficient (SFCD): the SKM, N 203 E Rev.1, Bron, France.
[11] CEN 2007, Technical specifications: Procedure for determining the skid resistance of a pavement surface using a device with longitudinal block measurement (LFCSR): the SRM, N 213 E Rev.1, Bron, France.
[12] CEN 2007, Technical specifications: Procedure for determining the skid resistance of pavements using a device with longitudinal controlled slip (LFCT): the Tatra Runway Tester (TRT), N 191 E Rev.1, Bron, France.
[13] Wälivaara B.: “VTI’s equipment for tire friction measurements: The mobile BV12 and the stationary tyre test facility”. presentation at Kick Off-Meetings of EU-Project INTRO, Brussels 2004 (unpublished)
TYROSAFE Deliverable 04: Report on state-of-the-art of test methods
Date: 05/12/2008, Version: 4 89 (89)
[14] Sandberg U., Jerzy A.: ”Noise emission, friction and rolling resistance of car tires - Summary of an experimental study”. Proceedings of the 2000 National Conference on Noise Control Engineering (NOISE-CON 2000) 2000 Dec. 3-5, Newport Beach, California, USA
[15] Nordström O.: “The VTI BV14 twin track fixed longitudinal slip road friction tester, Technical description”. Swedish Road and Transport Research Institute, Linköping, Sweden, 2001
[16] Ingulstad A.: “New friction measuring device – for safer driving during winter”. Nordic Road & Transport research No. 2, 2000
[17] ”Friction Analyzers – a Product Overview”. Norsemeter as, 1993 (unpublished) [18] WALLMANN C-G., ASTRÖM H.: Friction measurement methods and the correlation
between road friction and traffic safety – A literature review. VTI report 911A, 2001. [19] The Portable ASFT T2GO, Produktblatt der ASFT Swiss AG und ASFT Industries AB,
Switzerland and Sweden, 2005.