Citrulline Malate H2NH2N NH OO NH 2 OH L-citrulline O HO O OH Malate (Malic acid)
Upload
rebeca-parkmanCategory
view
218download
2
Richard Engel, Ph.D.Dept. of Land Resources and Environmental Sci.
Montana State University
Quantification of NH3 volatilization from urea applied to cold soils in Montana
Cooperator: Jeff Whitmus, Research Assistant
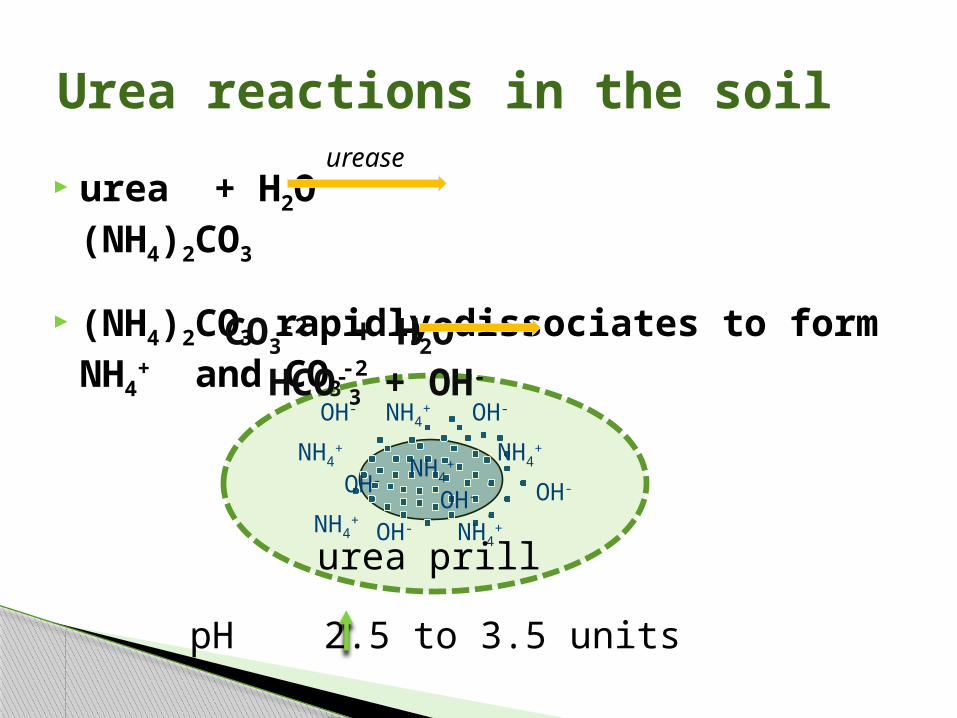
urea + H2O (NH4)2CO3
(NH4)2CO3 rapidly dissociates to form NH4+ and CO3
-2
Urea reactions in the soil
pH 2.5 to 3.5 units
urea prill
urease
NH4+
OH-
NH4+
OH- NH4+
OH- NH4+
OH-
NH4+
OH-NH4
+
OH-
CO3-2 + H2O HCO-
3 + OH-
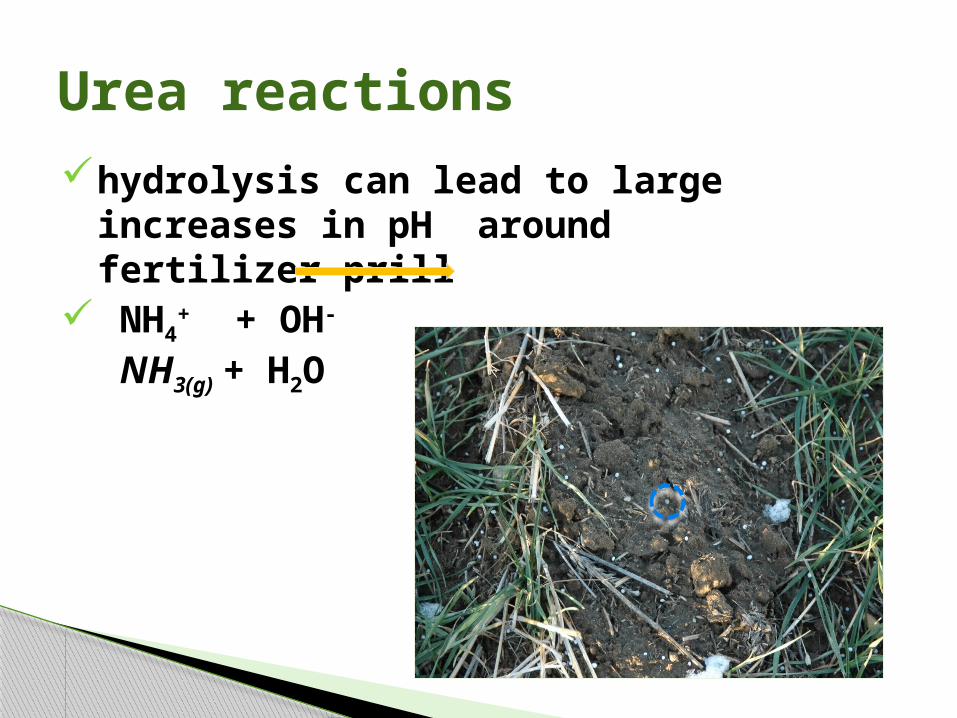
hydrolysis can lead to large increases in pH around fertilizer prill
NH4+ + OH- NH3(g) + H2O
Urea reactions
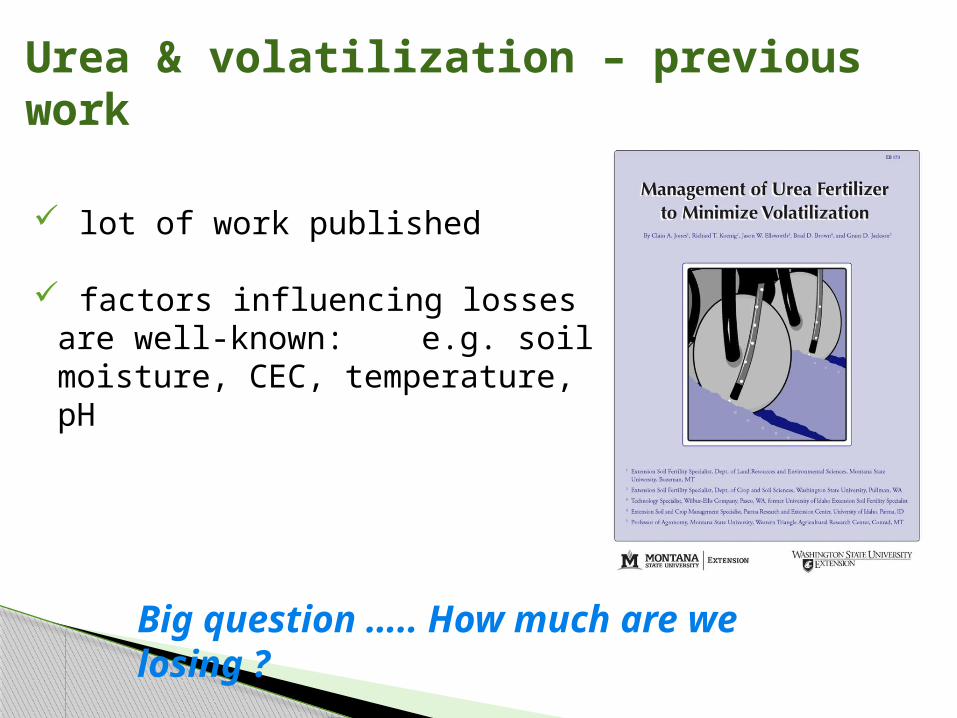
Urea & volatilization – previous work
lot of work published
factors influencing losses are well-known: e.g. soil moisture, CEC, temperature, pH
Big question ….. How much are we losing ?
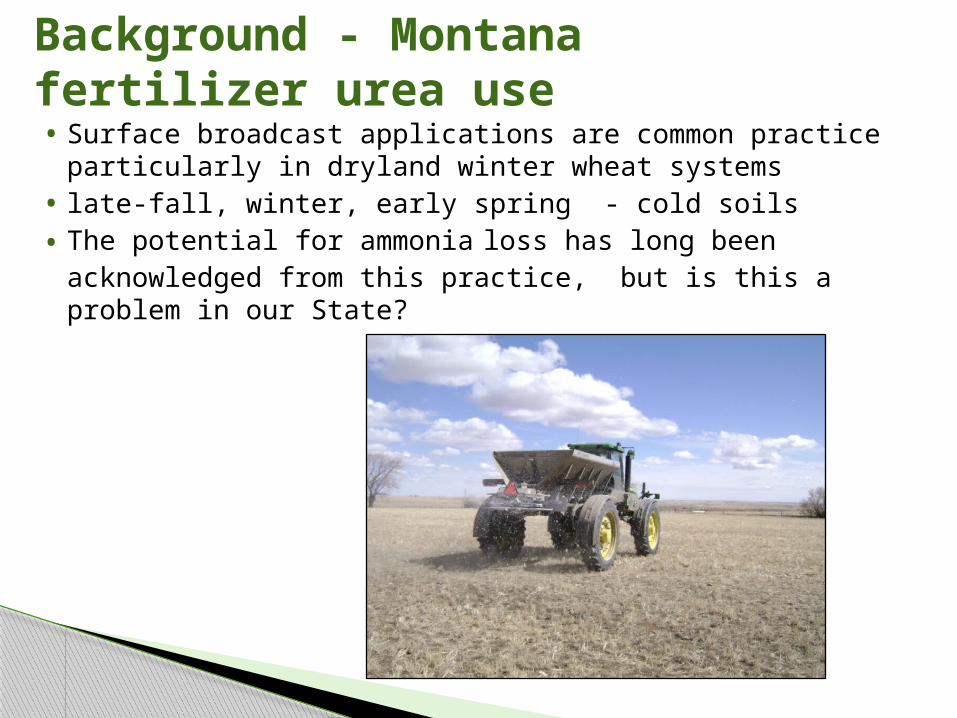
Background - Montana fertilizer urea use• Surface broadcast applications are common practice
particularly in dryland winter wheat systems• late-fall, winter, early spring - cold soils• The potential for ammonia loss has long been acknowledged
from this practice, but is this a problem in our State?
Quantify ammonia volatilization losses for spring, fall (early,late) and winter applications of urea ?
How do we mitigate losses? ◦ e.g. enhanced urea products, NBPT coated urea (Agrotain)◦ e.g. timing & incorporation with air-seeders
Project objectives
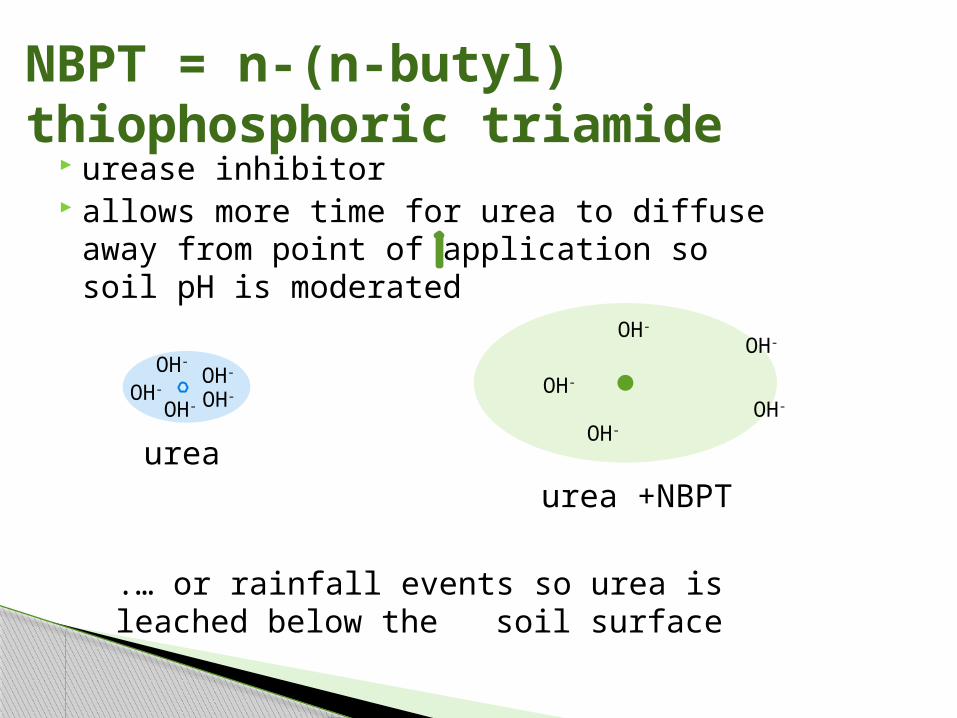
urease inhibitor allows more time for urea to diffuse away from
point of application so soil pH is moderated
.… or rainfall events so urea is leached below the
soil surface
NBPT = n-(n-butyl) thiophosphoric triamide
ureaurea +NBPT
OH-OH-
OH-
OH- OH-
OH-
OH-
OH-
OH-OH-

Any questions ?
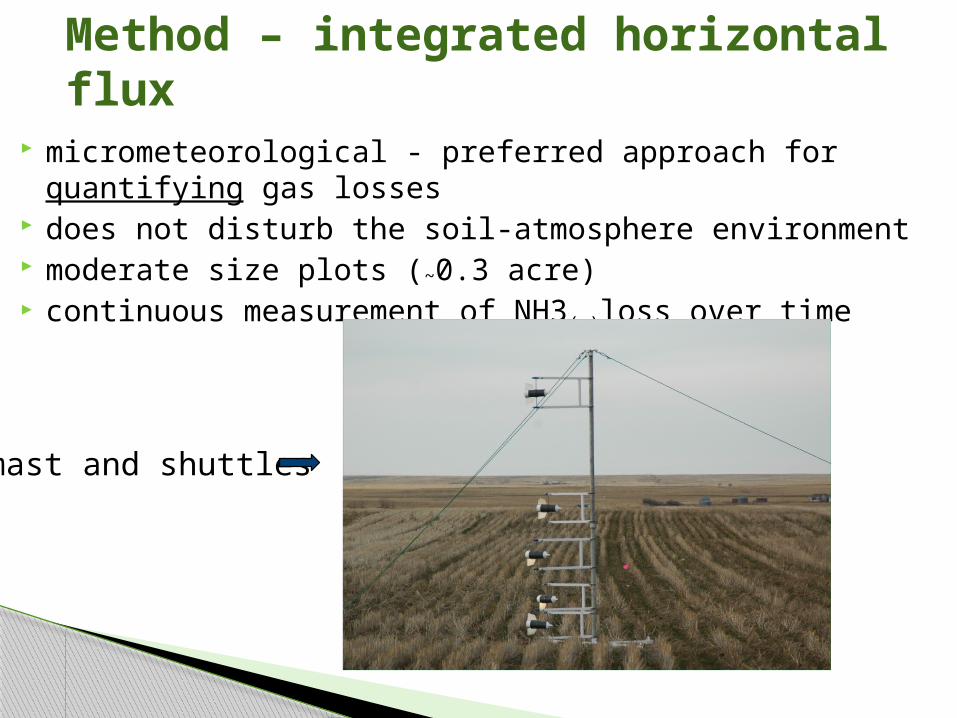
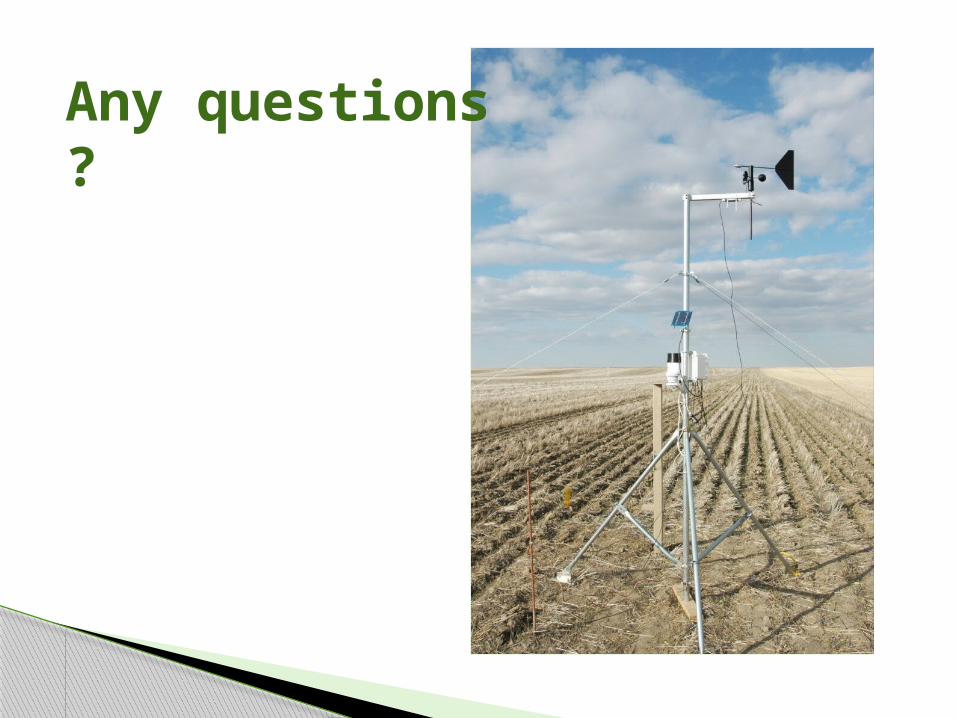
micrometeorological - preferred approach for quantifying gas losses does not disturb the soil-atmosphere environment moderate size plots (~0.3 acre) continuous measurement of NH3(g)loss over time
Method – integrated horizontal flux
mast and shuttles
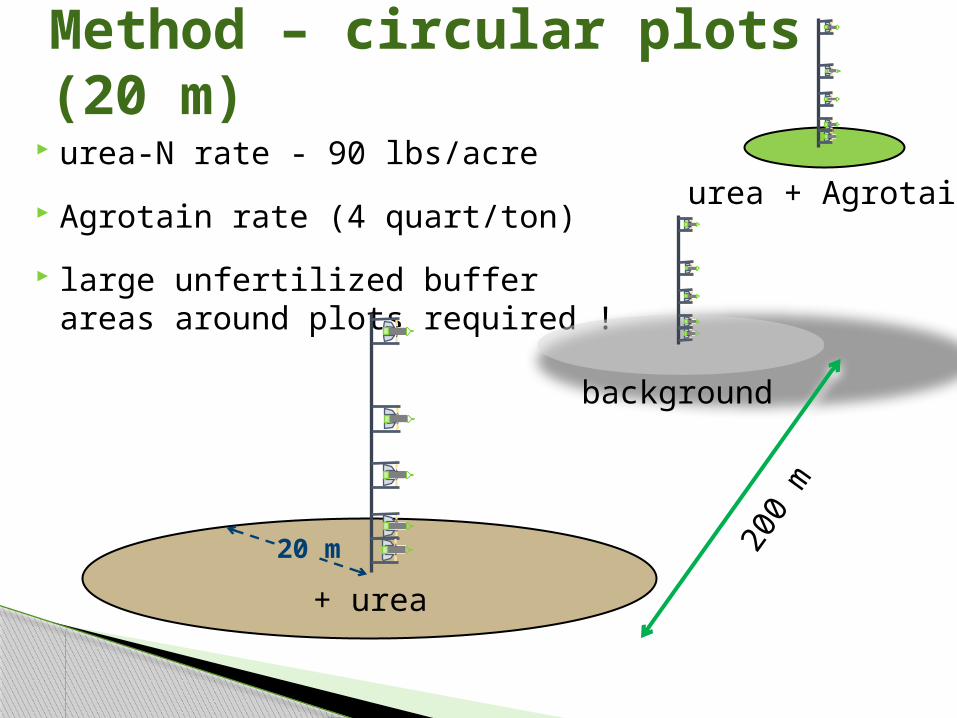
urea-N rate - 90 lbs/acre
Agrotain rate (4 quart/ton)
large unfertilized buffer areas around plots required !
Method – circular plots (20 m)
+ urea
background
200 m
urea + Agrotain
20 m
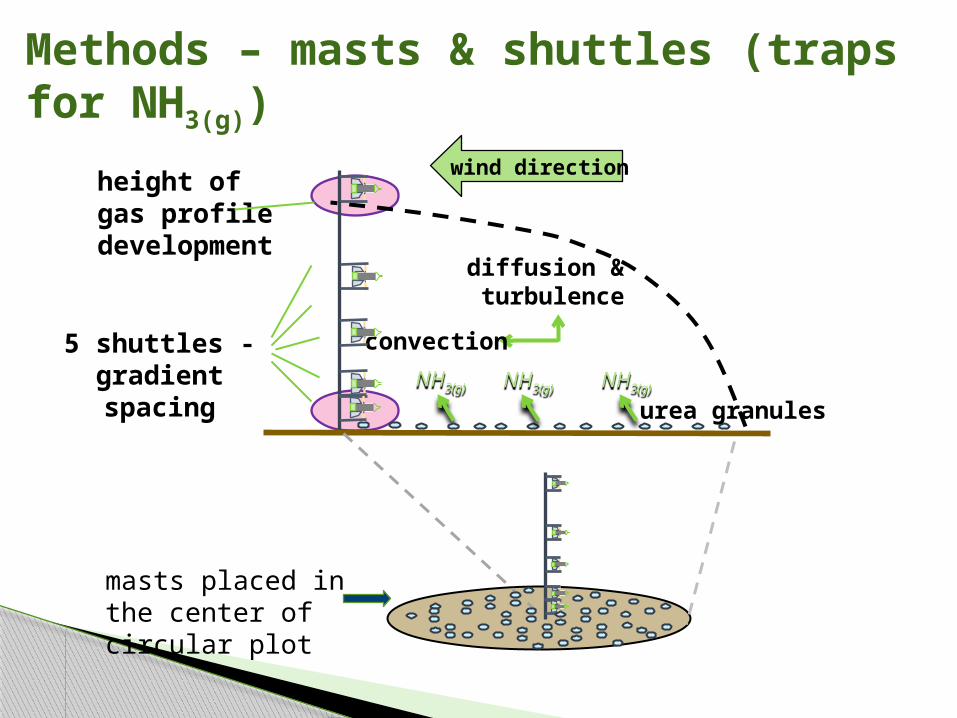
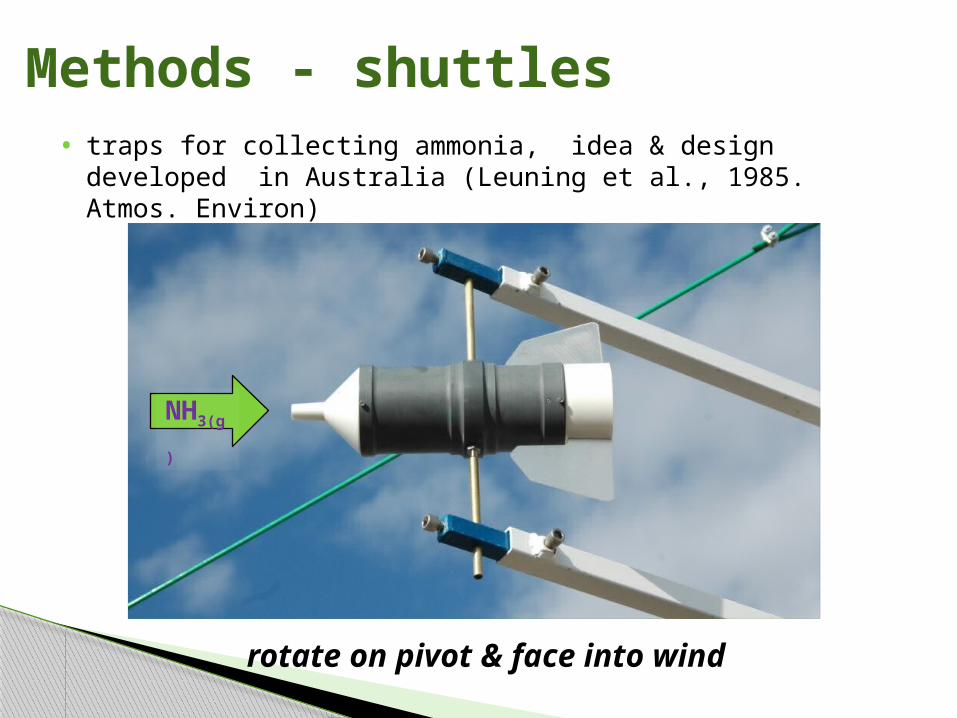
Methods – masts & shuttles (traps for NH3(g))
NH3(g)
wind direction
urea granules
diffusion & turbulence
convection
NH3(g) NH3(g)
height ofgas profile development
5 shuttles - gradient spacing
masts placed in the center of circular plot
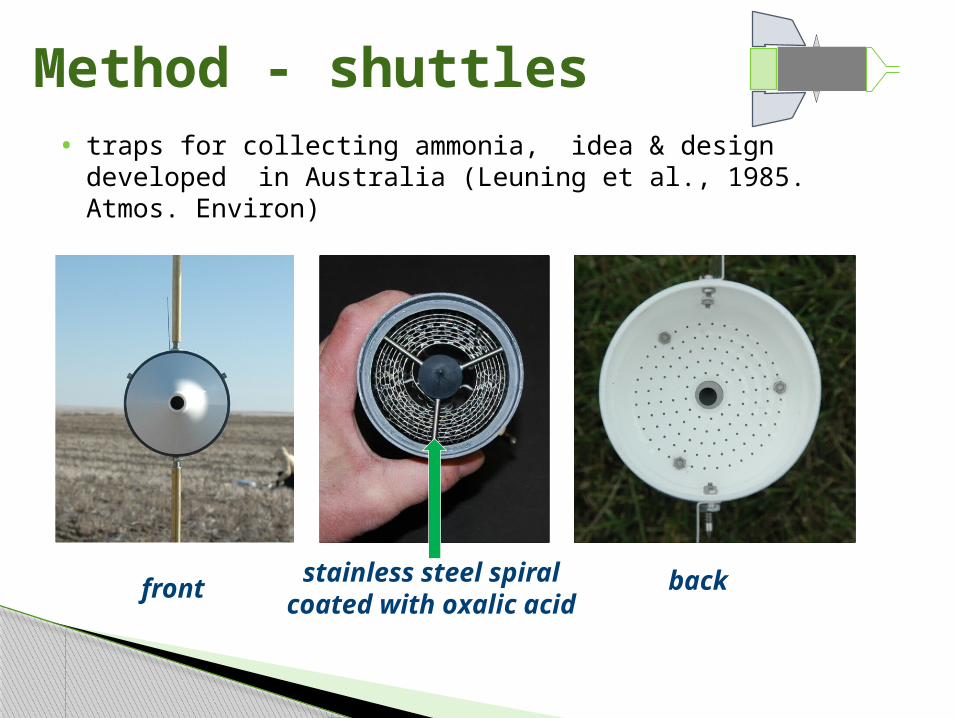
Method - shuttles• traps for collecting ammonia, idea & design developed in
Australia (Leuning et al., 1985. Atmos. Environ)
stainless steel spiralcoated with oxalic acidfront back
Methods - shuttles• traps for collecting ammonia, idea & design developed in
Australia (Leuning et al., 1985. Atmos. Environ)
NH3(g)
rotate on pivot & face into wind

Spent shuttles exchanged with recharged shuttles every week
Method-continuous measurement
recharged shuttles
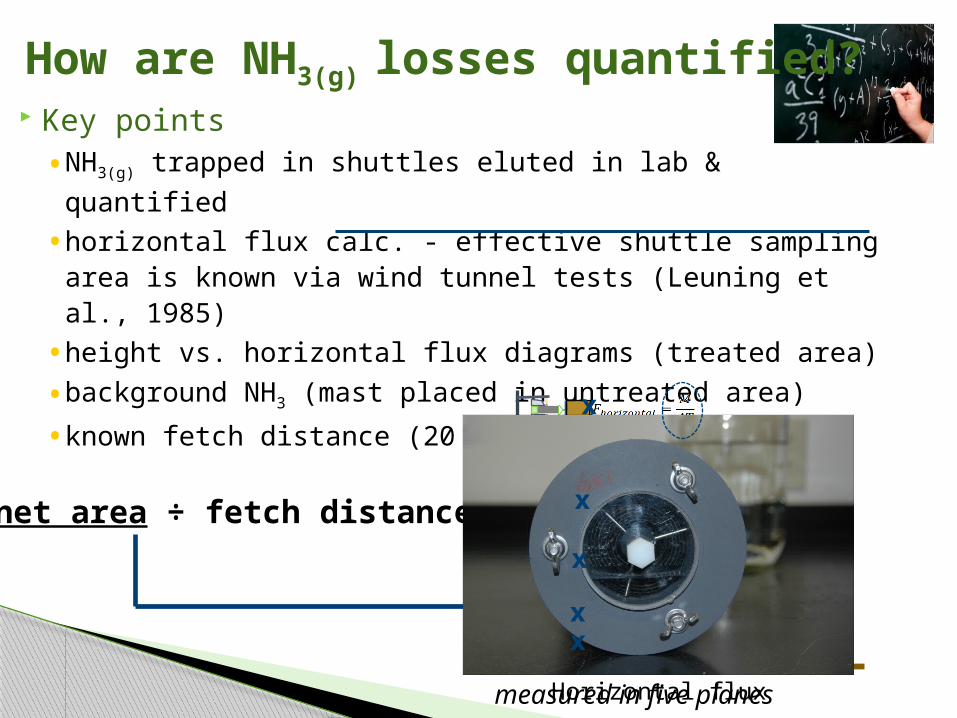
Key points• NH3(g) trapped in shuttles eluted in lab & quantified
• horizontal flux calc. - effective shuttle sampling area is known via wind tunnel tests (Leuning et al., 1985)• height vs. horizontal flux diagrams (treated area)
• background NH3 (mast placed in untreated area)
• known fetch distance (20 m.)
How are NH3(g) losses quantified?
measured in five planes
net area ÷ fetch distance H
eigh
t
x
x
xx
x
Horizontal flux
x
x
x
x
x
Any questions ?
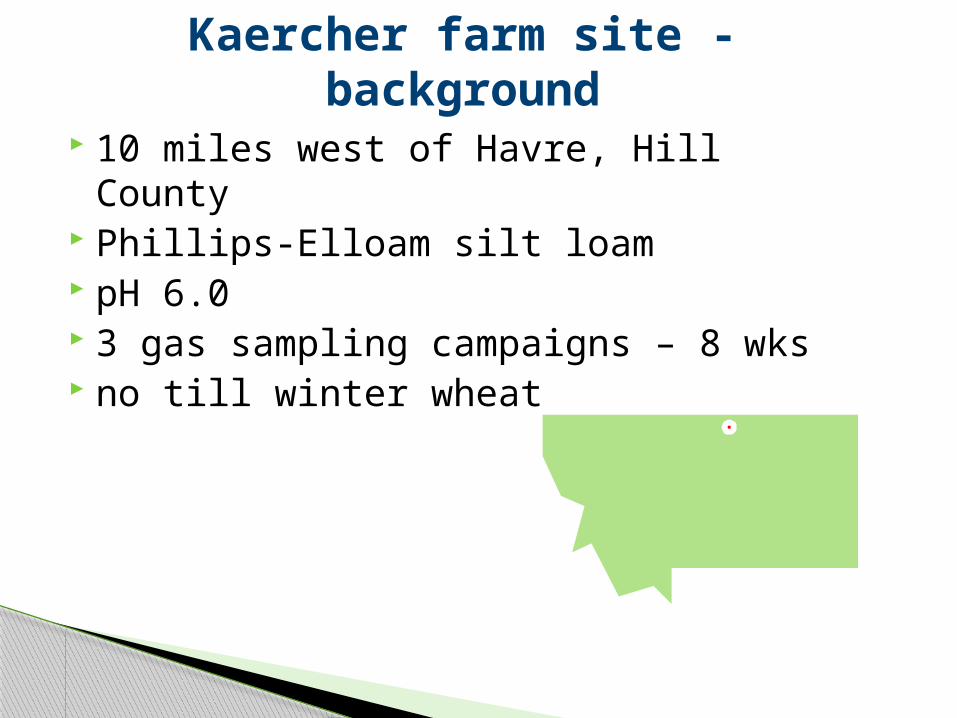
Kaercher farm site - background 10 miles west of Havre, Hill County Phillips-Elloam silt loam pH 6.0 3 gas sampling campaigns – 8 wks no till winter wheat
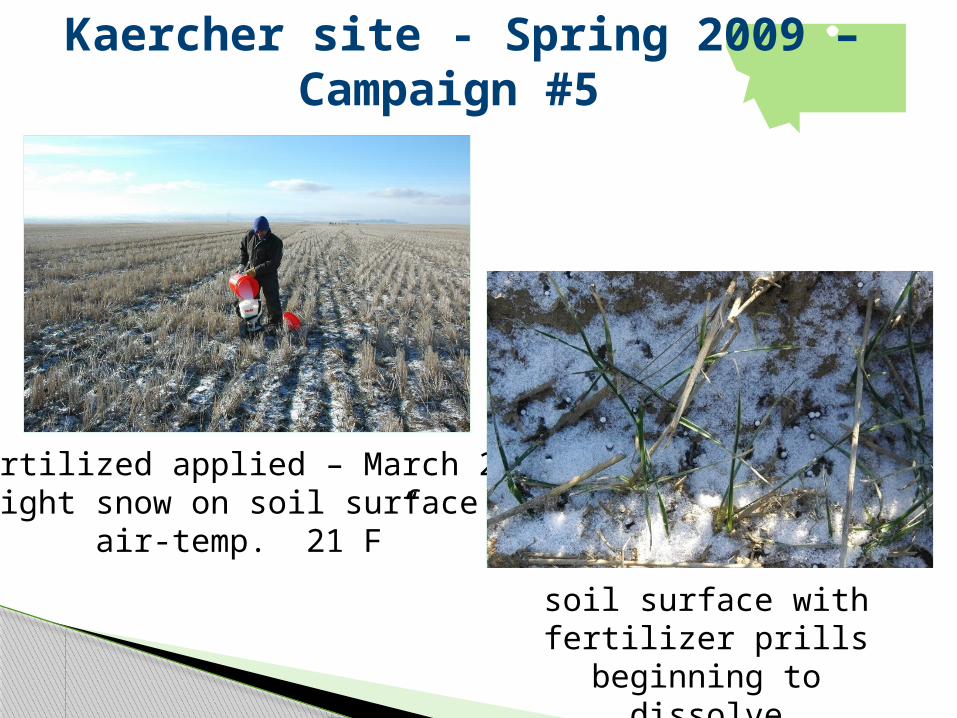
Kaercher site - Spring 2009 – Campaign #5
Fertilized applied – March 26“light snow on soil surface &
air-temp. 21 F”
soil surface with fertilizer prills beginning to dissolve
1 2 3 4 5 6 7 80
5
10
15
20
25
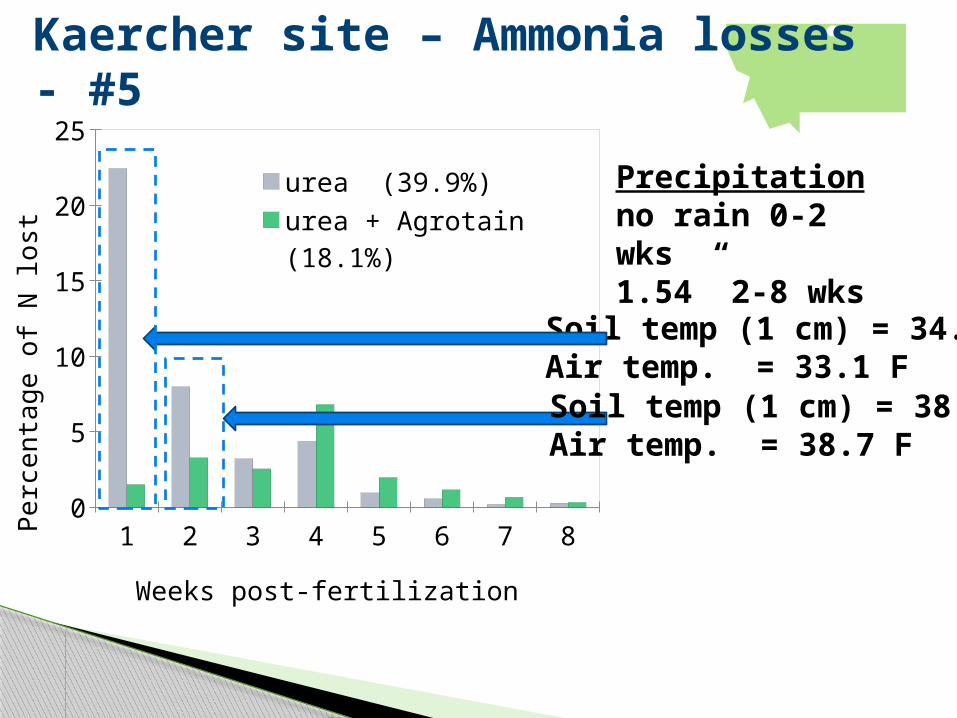
urea (39.9%)
urea + Agrotain (18.1%)
Weeks post-fertilization
Perc
enta
ge o
f N lo
st
Kaercher site – Ammonia losses - #5
Precipitation no rain 0-2 wks1.54” 2-8 wks
Soil temp (1 cm) = 34.3 FAir temp. = 33.1 FSoil temp (1 cm) = 38.5 FAir temp. = 38.7 F
Peterson farm site - background 28 miles NW of Havre, Hill County Telstad-Joplin loam pH 5.5 2 gas sampling campaigns – 8 wk no till winter wheat
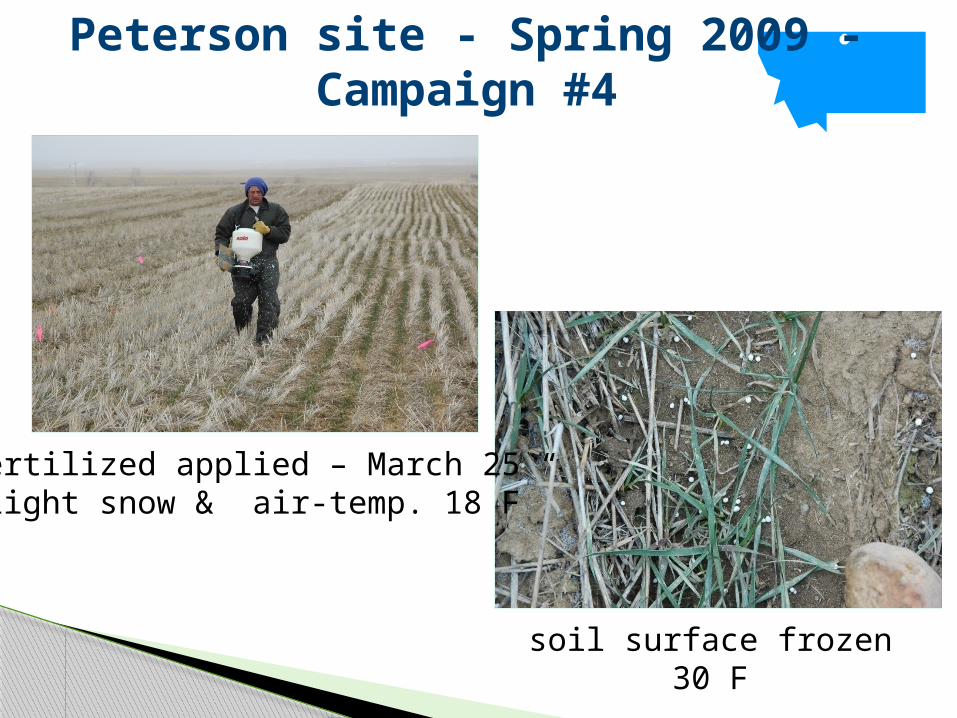
Peterson site - Spring 2009 - Campaign #4
Fertilized applied – March 25“light snow & air-temp. 18 F”
soil surface frozen30 F
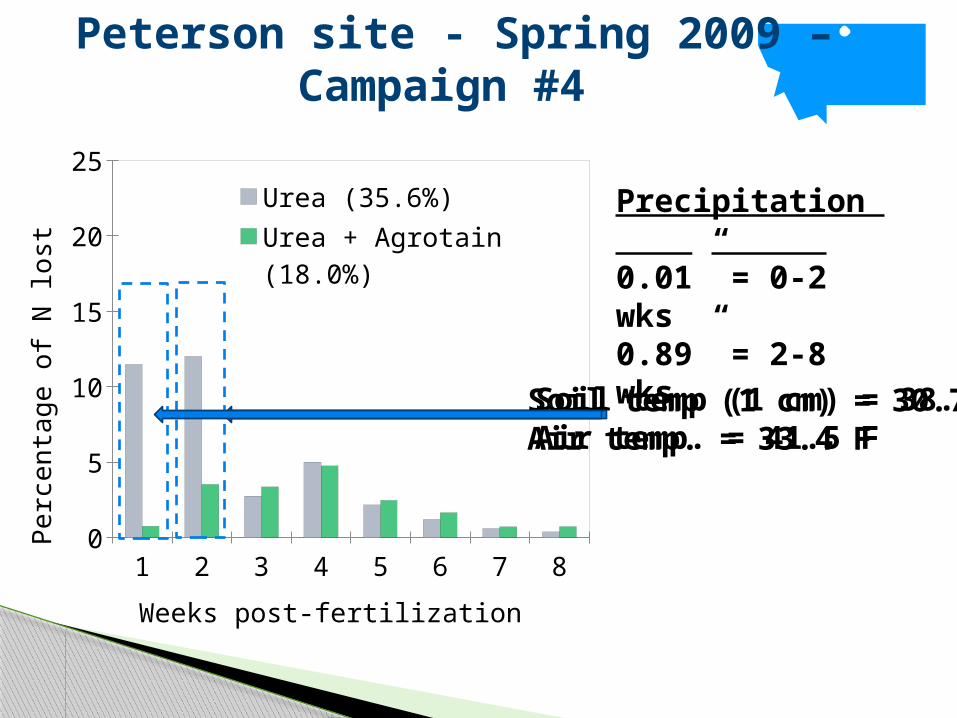
Peterson site - Spring 2009 – Campaign #4
Precipitation . 0.01” = 0-2 wks0.89” = 2-8 wks
1 2 3 4 5 6 7 80
5
10
15
20
25
Urea (35.6%)
Urea + Agrotain (18.0%)
Weeks post-fertilization
Perc
enta
ge o
f N lo
st
Soil temp (1 cm) = 38.0 FAir temp. = 41.5 F
Soil temp (1 cm) = 30.7 FAir temp. = 33.4 F
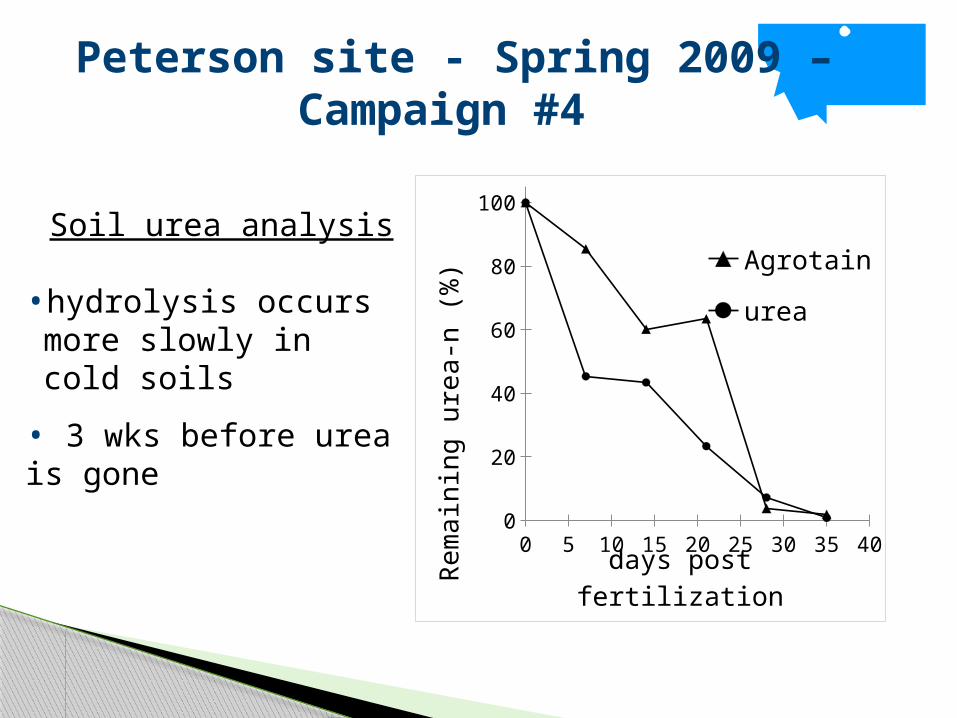
Peterson site - Spring 2009 – Campaign #4
Soil urea analysis
• hydrolysis occurs more slowly in cold soils
• 3 wks before urea is gone
0 5 10 15 20 25 30 35 400
20
40
60
80
100
Agrotain
urea
days post fertilization
Rem
aini
ng u
rea-
n (%
)
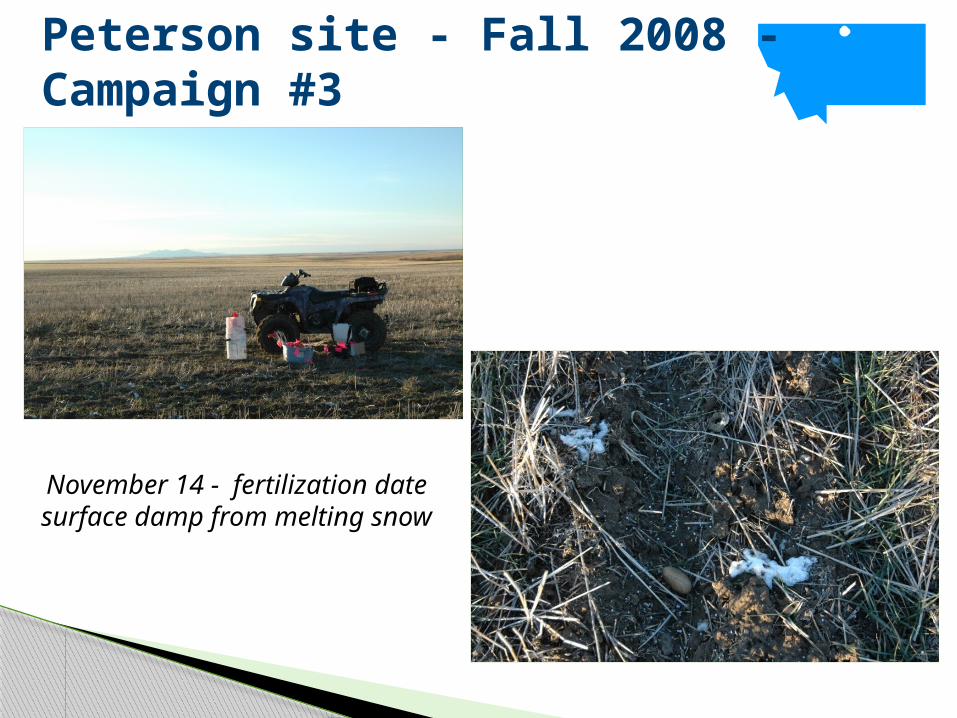
Peterson site - Fall 2008 - Campaign #3
November 14 - fertilization datesurface damp from melting snow
1 2 3 40
5
10
15
20
25
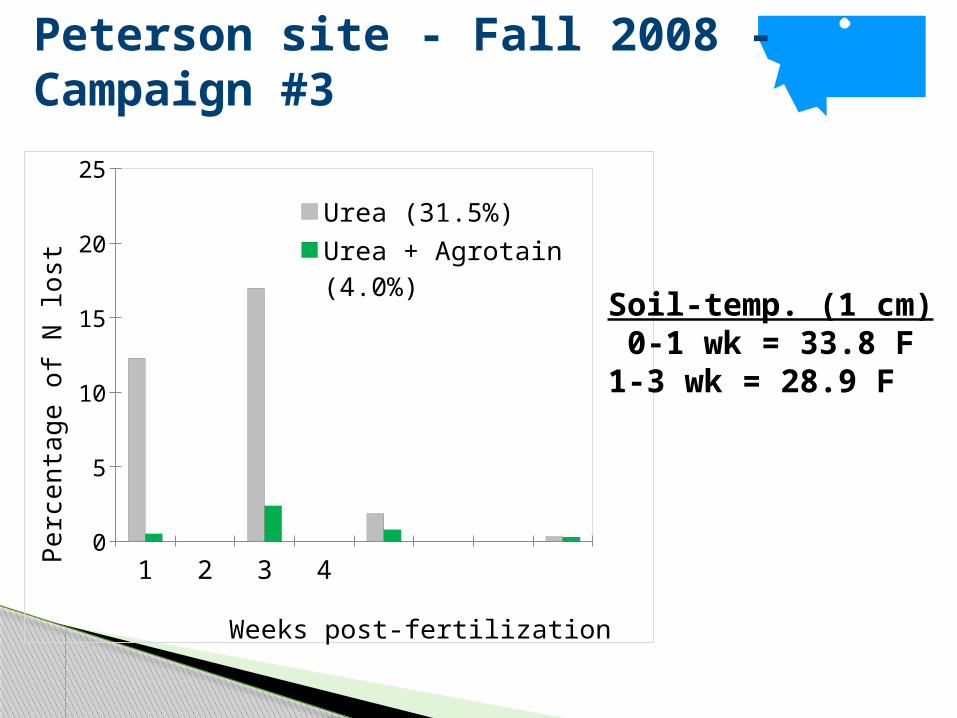
Urea (31.5%)
Urea + Agrotain (4.0%)
Weeks post-fertilization
Perc
enta
ge o
f N lo
stPeterson site - Fall 2008 - Campaign #3
Soil-temp. (1 cm) 0-1 wk = 33.8 F1-3 wk = 28.9 F
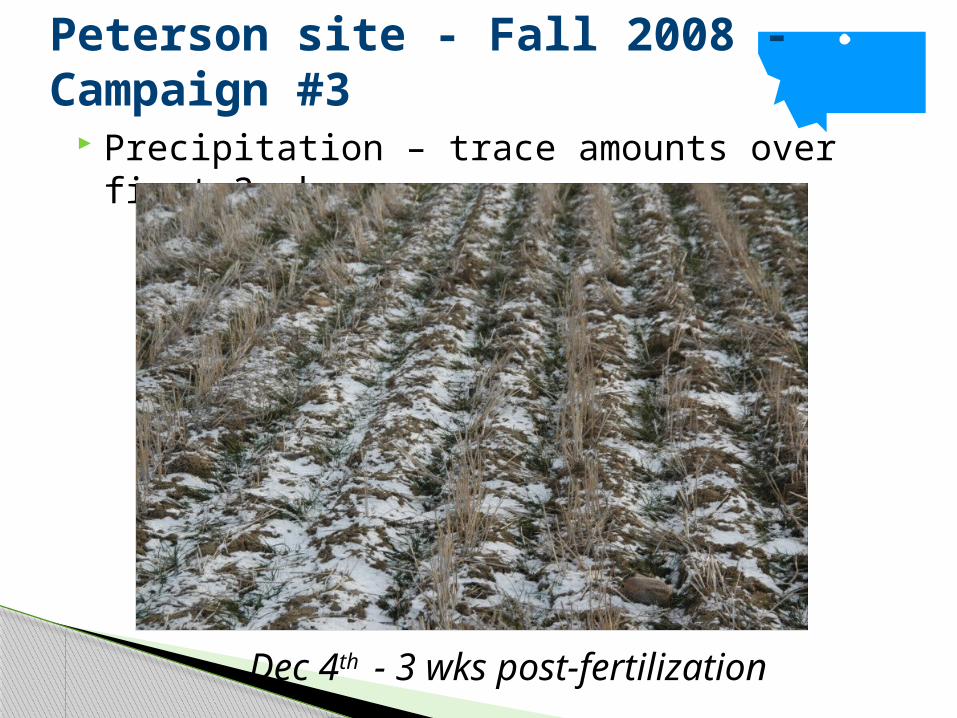
Precipitation – trace amounts over first 3 wks
Dec 4th - 3 wks post-fertilization
Peterson site - Fall 2008 - Campaign #3
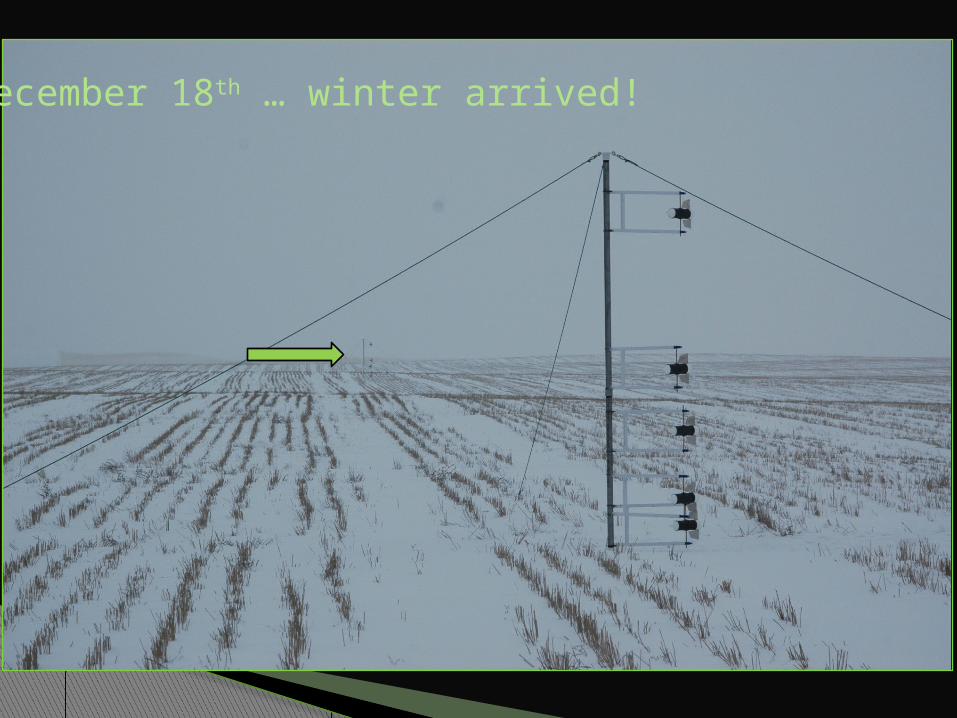
December 18th … winter arrived!
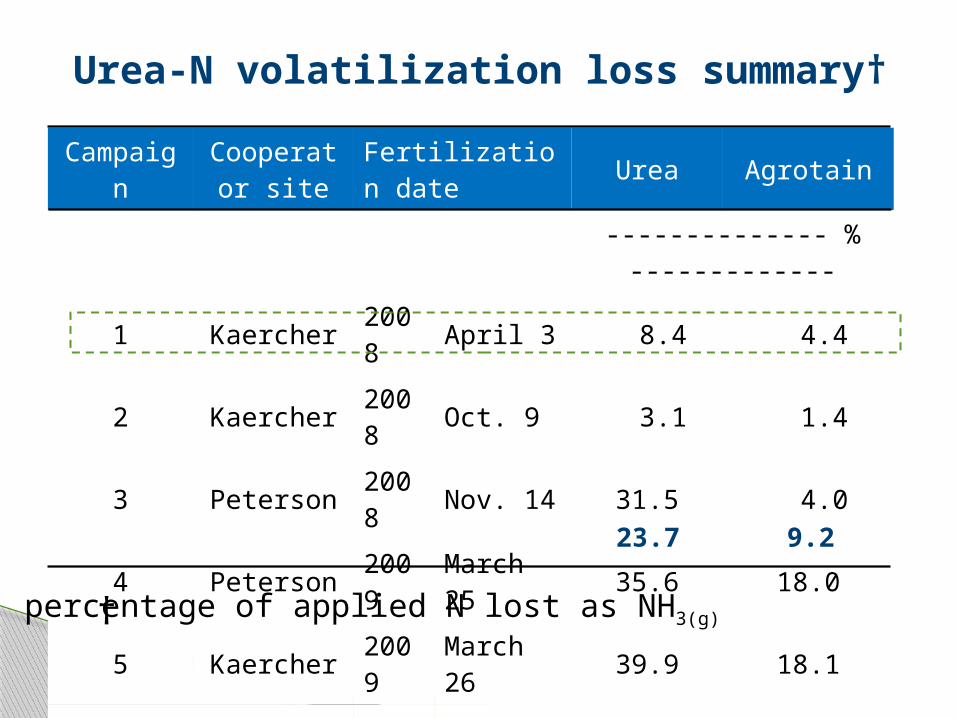
Campaign Cooperator site Fertilization date Urea Agrotain
-------------- % -------------
1 Kaercher 2008 April 3 8.4 4.4
2 Kaercher 2008 Oct. 9 3.1 1.4
3 Peterson 2008 Nov. 14 31.5 4.0
4 Peterson 2009 March 25 35.6 18.0
5 Kaercher 2009 March 26 39.9 18.1
Urea-N volatilization loss summary†
23.7 9.2
† percentage of applied N lost as NH3(g)
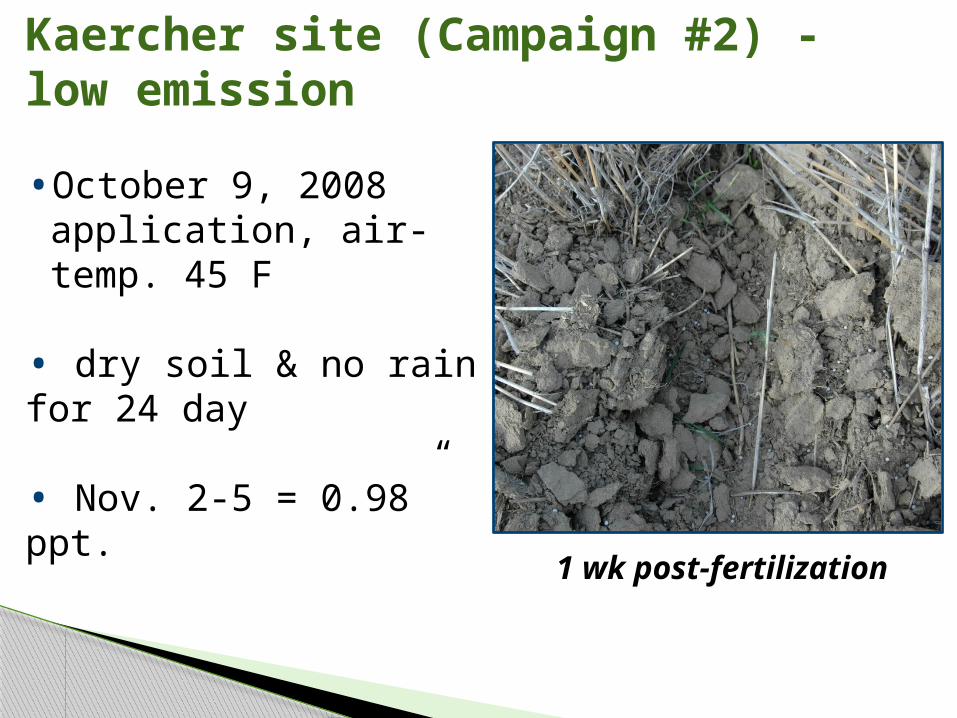
Kaercher site (Campaign #2) - low emission
• October 9, 2008 application, air-temp. 45 F
• dry soil & no rain for 24 day
• Nov. 2-5 = 0.98” ppt.
1 wk post-fertilization
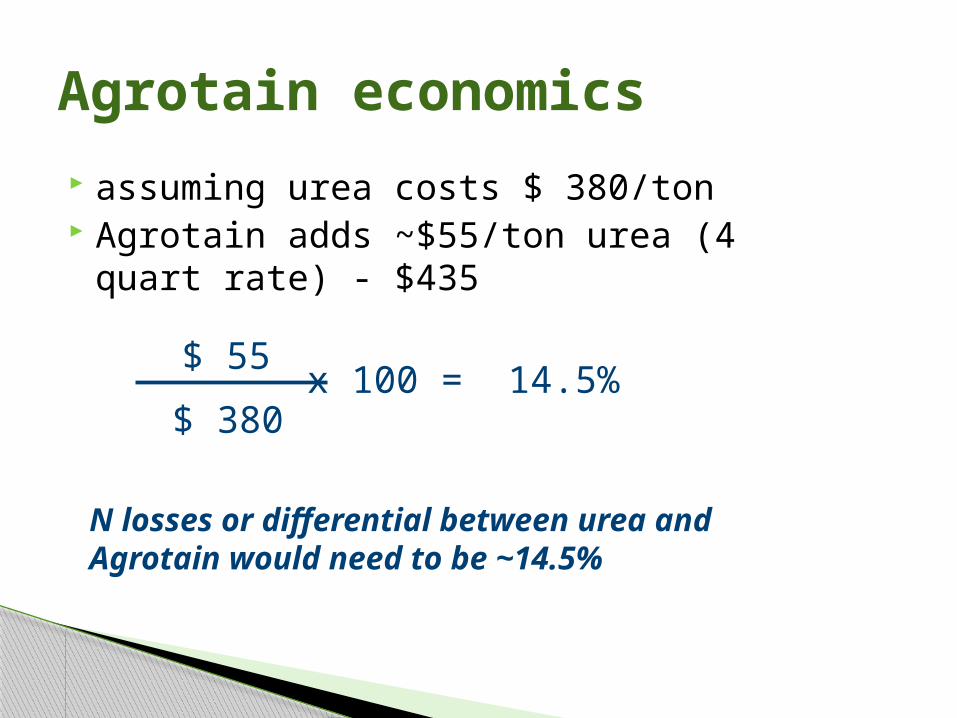
assuming urea costs $ 380/ton Agrotain adds ~$55/ton urea (4 quart rate) - $435
Agrotain economics
$ 55
$ 380x 100 = 14.5%
N losses or differential between urea and Agrotain would need to be ~14.5%
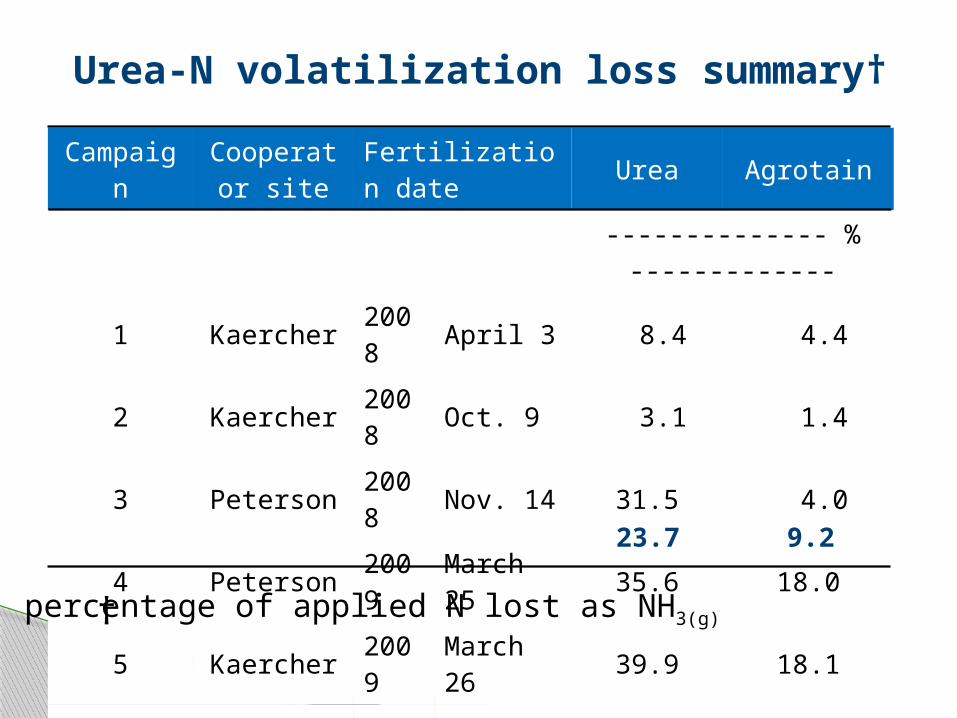
Campaign Cooperator site Fertilization date Urea Agrotain
-------------- % -------------
1 Kaercher 2008 April 3 8.4 4.4
2 Kaercher 2008 Oct. 9 3.1 1.4
3 Peterson 2008 Nov. 14 31.5 4.0
4 Peterson 2009 March 25 35.6 18.0
5 Kaercher 2009 March 26 39.9 18.1
Urea-N volatilization loss summary†
23.7 9.2
† percentage of applied N lost as NH3(g)
significant NH3(g) losses (up to 40% of applied N) from surface applied urea can occur even though soil temperatures are cold!
soil moisture conditions at surface that result in dissolution of urea granules (i.e. prolonged damp) without rain promote high NH3(g) losses.
more common to find these conditions in semi-arid Northern Great Plains during the late fall or early spring.
Agrotain control = 60% reduction in NH3(g)
Summary
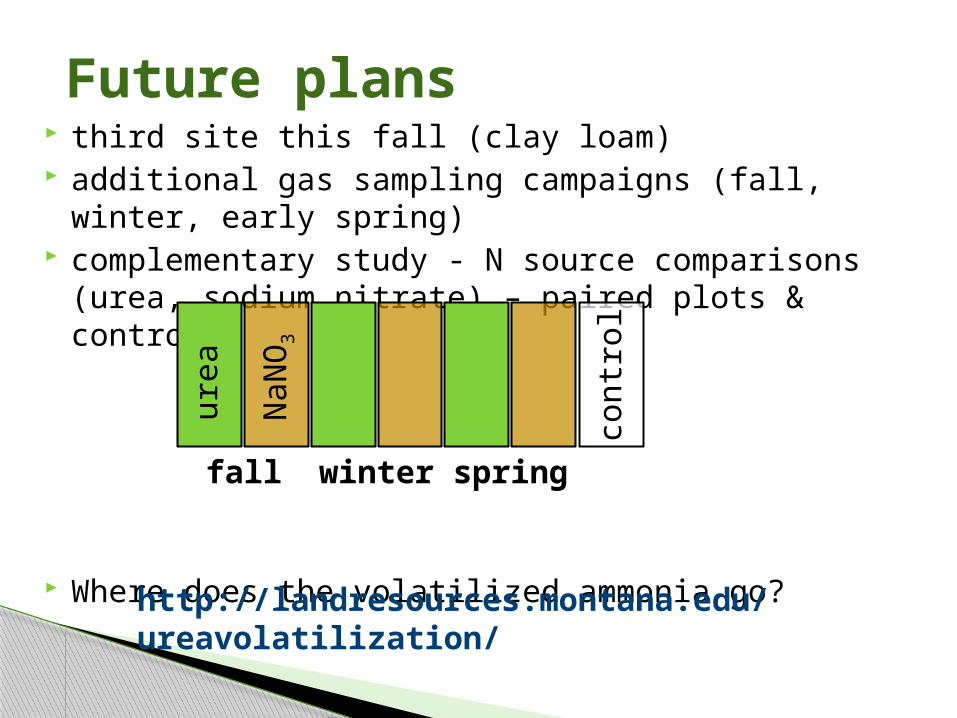
third site this fall (clay loam) additional gas sampling campaigns (fall, winter, early spring) complementary study - N source comparisons (urea, sodium
nitrate) – paired plots & control
Where does the volatilized ammonia go?
Future plans
springfall winter
NaN
O3
urea
cont
rol
http://landresources.montana.edu/ureavolatilization/
Thank you


![2013 OPEN ACCESS antibiotics - · PDF file · 2017-05-16new bicyclolides c Z Enanta Pharmaceuticals Discovery Gram-positive [77–80] O O NH NH 2 OH O NH 2 NH 2 HO NH OH HN HO O O](https://static.fdocuments.in/doc/165x107/5ab131107f8b9a00728c041b/2013-open-access-antibiotics-bicyclolides-c-z-enanta-pharmaceuticals-discovery.jpg)