Cooperative R&D and Firm Performance* · PDF file1 Cooperative R&D and Firm Performance*...
27
Cooperative R&D and Firm Performance* René Belderbos Katholieke Universiteit Leuven and Universiteit Maastricht Martin Carree Universiteit Maastricht Boris Lokshin Universiteit Maastricht Correspondence: Department of Organization and Strategy Faculty of Economics and Business Administration Universiteit Maastricht PO Box 616, 6200 MD Maastricht The Netherlands Phone: +31 43 388 3697 Fax: +31 43 325 4893 [email protected] *The empirical analysis for this paper has been performed at CEREM/Statistics Netherlands on the MICRONOOM database. The views expressed in this paper are those of the authors and do not necessarily reflect the policies of Statistics Netherlands.
Transcript of Cooperative R&D and Firm Performance* · PDF file1 Cooperative R&D and Firm Performance*...

Cooperative R&D and Firm Performance*
René Belderbos Katholieke Universiteit Leuven and Universiteit Maastricht
Martin Carree
Universiteit Maastricht
Boris Lokshin Universiteit Maastricht
Correspondence: Department of Organization and Strategy Faculty of Economics and Business Administration Universiteit Maastricht PO Box 616, 6200 MD Maastricht The Netherlands Phone: +31 43 388 3697 Fax: +31 43 325 4893 [email protected] *The empirical analysis for this paper has been performed at CEREM/Statistics Netherlands on the MICRONOOM database. The views expressed in this paper are those of the authors and do not necessarily reflect the policies of Statistics Netherlands.
1
Cooperative R&D and Firm Performance*
JEL-codes: D24, O31, O32
Keywords: R&D, R&D cooperation, spillovers, firm performance
ABSTRACT We analyse the impact of different R&D cooperation strategies on firm performance jointly with the impact of innovation expenditures and the effect of incoming knowledge spillovers that are not due to collaborative R&D, using data on a large sample of innovating firms in two waves of the biannual Dutch Community Innovation Surveys. The results confirm a major heterogeneity in the goals of R&D cooperation, with competitor and supplier cooperation focused on incremental innovations improving productivity growth, while university cooperation and again competitor cooperation are instrumental in creating radical innovations, generating sales of products and services that are novel to the market.
2
1. Introduction
The observed substantial increase in R&D alliances in the late 1980s and throughout the
1990s, in particular in sectors such as biotechnology and information technology (Hagedoorn,
2002; Tyler and Steensma, 1995) has provoked substantial academic and policy interest in the
phenomenon. A large body of literature in the management domain has been produced that
discusses various motives that incite firms to collaborate on R&D (e.g. Contractor and Lorange,
2002; Nooteboom, 1999). In parallel, a body of theoretical literature has been developed in
industrial organization focusing on the relationship between knowledge spillovers, R&D
cooperation, and R&D investment using a game theoretical perspective. The latter literature has
been most concerned with the potential impact of R&D cooperation and knowledge spillovers on
R&D investment levels, and has largely been restricted to the analysis of cooperation with direct
competitors.
A number of empirical studies have explored the determinants of R&D cooperation (e.g.
Kleinknecht and Reinen, 1992; Fritsch and Lucas, 2001; Tether, 2002; Belderbos et al. 2003). A
major finding of recent contributions is that the goals and hence the determinants of R&D
partnerships differ depending on the type of cooperation and partner. Fritsch and Lucas (2001)
find for German manufacturing firms that innovative effort directed at process improvement is
more likely to involve collaborate with suppliers, whereas product innovations are associated
with customer collaboration. Tether (2002), using UK data on innovating firms, finds that
cooperation is mostly associated with firms pursuing radical rather than incremental innovations.
Belderbos et al. (2003) finds substantial heterogeneity in the determinants to establish R&D
collaborations with different partners. Cooperation with a partner generally is more likely to be
chosen if the partner is an important source of knowledge for the innovation process, while more
basic knowledge sourced from universities and research institutes positively impacts all types of
cooperation. Collaboration with universities is more likely to be chosen by more R&D intensive
firms in sectors that exhibit greater technological dynamism.
Surprisingly, the key question whether collaborative R&D has the expected positive
impact on firms’ (innovation) performance has remained largely unexplored in both the industrial
organization as well in the management literature (see e.g. Tether, 2002; Das and Teng, 2000). A
number of papers have included a cooperation variable in empirical models explaining

3
differences in firms’ innovation output (Janz et al., 2003; Van Leeuwen and Klomp, 2001;
Klomp and van Leeuwen, 2001; Lööf and Heshmati, 2002; Monjon and Waelbroeck, 2003;
Criscuolo and Haskell, 2003), but most of these studies have been primarily concerned with the
impact of R&D investments on performance and did not examine systematically differences in
impacts across cooperation types.2 Management studies have restricted analysis to particular
performance indicators and specific industries, e.g. the relationship between alliance networking
and patent output growth in the ASIC industry (Vanhaverbeke et al., 2004) or the effect of
alliances on high tech start-up firm performance in the biotech industry (Baum et a. 2002).
The contribution of this paper is to examine in detail the effects of different types of R&D
cooperation on firm performance. We consider the impact of the four major types of partner-
specific cooperation strategies: cooperation with competitors, suppliers, customers, and research
institutes & universities. We analyse the effects of these R&D partnerships on two alternative
performance measures for a large sample of Dutch firms active in manufacturing and service
industries: growth of value added per employee (labour productivity), and growth of sales per
employee from products new to the market (which we term ‘innovative sales productivity’), and
expect a heterogeneous impact of the different R&D partnerships. The analysis controls for the
impact on productivity of incoming knowledge spillovers that are not due to R&D partnerships,
as well as the effect of the firms’ total innovation expenditures. Using data on a large sample of
innovating firms in two waves of the biannual Dutch Community Innovation Surveys (1996,
1998) linked to production statistics, we mitigate problems of simultaneity and unobserved firm-
specific effects by examining the impact of R&D (collaboration) in 1996 on subsequent
productivity growth in 1996-1998.
The remainder of the paper is organized as follows: section two provides an overview of
the previous theoretical and empirical literature discussing the impact of R&D (cooperation) and
spillovers on firm performance. Section three describes the empirical model and data. Section
four discusses the empirical results and section five concludes.
2 Most of these studies use a simultaneous equations approach pioneered by Crépon et al (1998) in which innovative sales levels in turn are allowed to impact productivity or sales. In the current paper we allow R&D (cooperation) to have a direct impact on productivity.
4
2. Previous Literature
In this section we will briefly review the theoretical and empirical literature on R&D
cooperation, spillovers and productivity. Theoretical models in the industrial organization
tradition have shown how knowledge spillovers increase the stock of effective knowledge of
firms and contribute to profitability either by expanding demand or by reducing costs.
Involuntary spillovers between competing firms provide an incentive for R&D cooperation as
this enables firms to overcome the disincentive effect on R&D from the externality that
involuntary spillovers to rival firms constitute (e.g. Amir, 2000; De Bondt, 1996; Kamien et al.,
1992; Suzumura, 1992; Leahy & Neary, 1997). Recent papers have also taken into account that
spillovers are not given but that cooperation allows firms to increase knowledge transfers
voluntarily among the cooperating partners (Katsoulacos & Ulph, 1998). Firms have incentives to
manage the flow of spillovers to and from competitors by attempting to maximize incoming
spillovers through R&D collaboration while at the same time minimizing outgoing spillovers
through investments in knowledge protection (Cassiman et al. 2002; Martin, 1999; Amir et al.,
2003). The industrial organization literature has paid little attention to collaboration between
firms that are not directly competing on output markets. An exception is Atallah (2002), who
finds that even with small vertical spillovers (knowledge spillovers between upstream and
downstream industries) firms can profitably engage in vertical R&D cooperation, as there are
fewer or no competitive considerations involved with potential leakage’s of the fruits of larger
R&D investments.
The literature in the management and technology policy domain has examined broader
motivations for R&D cooperation than internalising involuntary knowledge spillovers and has
focused more on voluntary knowledge transfers. Explanations for collaborative R&D that have
been extensively discussed revolve around such factors as sharing risks and costs in the face of
uncertain technological developments (Das and Teng, 2002; Tyler and Steensma, 1995),
shortening innovation cycles (Pisano, 1990), the pursuit of efficiency gains such as economies of
scope and scale or synergistic effects through efficient pooling of the firm’ resources (Kogut,
1988; Das and Teng, 2000), learning through monitoring technology and market developments
(Hamel, 1991; Roberts and Berry, 1985), dealing with regulations and industry standards, and
responding to government subsidy policies (Benfratello and Sembenelli, 2003; Nakamura, 2003).

5
Although it has been noted more generally that a substantial share of alliances fail (Harrigan,
1986), R&D alliances may be a source of competitive advantage and have long lasting effects on
firm performance. Teece (1980) argues that organizational practices affect firms’ performance
and can explain sustained performance differences within industries due to slow diffusion of best
practices and difficulties in imitating complex organizational capabilities. It has also been
suggested that different types of collaboration may serve different purposes, where the two main
goals of innovative effort are cost reduction and market expansion. Collaboration with customers
is important to reduce the risk associated with market introductions of the innovations, as has
been recognized since the seminal work of Von Hippel (1988). In particular when products are
novel and complex and hence require adaptations in use by customers, collaboration may be
essential to ensure market expansion (Thether, 2002). In contrast, cooperation with suppliers is
often related to the tendency to focus on core business to reduce costs, with outsourcing activities
coupled with cooperation on input quality improvements aimed at further cost reductions.
Cooperation with universities and research institutes is generally more aimed at radical
breakthrough innovations that may open up entire new markets or market segments (Tether,
2002; Monjon and Waelbroeck, 2003).
A number of empirical studies have found a positive impact of engagement in R&D
cooperation on innovation performance i.e. sales of innovative products (Klomp and van
Leeuwen, 2001; Janz et al., 2003; van Leeuwen, 2002; Lööf and Heshmati, 2002; Criscuolo and
Haskell, 2003), patenting (Vanhaverbeke et al., 2004), and sales growth (Cincera et al.
forthcoming). Some of these papers have also examined the effect of different cooperation types
but with ambiguous results. Monjon and Waelbroeck (2003) regressed innovative sales levels of
firms in a French CIS survey on a range of collaboration and spillovers variables and found a
mixture of negative and positive impacts of R&D cooperation and spillovers. Cincera et al.
(forthcoming) distinguished between overseas and domestic collaboration by Belgian firms and
found a positive impact on productivity of the latter but a counter-intuitive negative impact of the
former. Lööf and Heshmati (2002) included a selected group of cooperation types in an
innovation output equation for Swedish firms and found that cooperation with competitors and
universities impacted output levels positively but cooperation with customers negatively. These
ambiguous results can be partly attributed to the use of cross-section data, which does not allow
taking into account appropriate lags with which cooperative R&D impacts innovative output and
6
performance (cf. Cincera et al., forthcoming), as well as unobserved fixed firm traits that impact
both firms’ incentives to cooperate and their innovative output (Van Leeuwen and Klomp, 2001).
Both problems can be addressed by using panel data on innovative performance and cooperation
strategies, as is the empirical approach of this paper.
There is a large body of empirical literature examining the sources of productivity growth
and in particular the role of inter-firm knowledge spillovers (e.g. Adams and Jaffe, 1996;
Branstetter, 2001; Coe and Helpman, 1995; Basant and Flikkert, 1996). These studies have
generally confirmed an important role of inferred spillovers on productivity growth. Similarly,
empirical studies have documented the positive impact of own R&D on productivity at the firm
level (e.g. Grilliches and Mairesse, 1984; Lichtenberg and Siegel, 1991; Hall and Mairesse,
1995). A related literature has been concerned with the role of foreign multinational enterprises
(MNEs) in productivity performance (Griffith, 1999; Harris and Robinson, 2003). In these
studies MNEs are generally found to be more productive than their local industry competitors,
which is attributed to MNEs’ efficient exploitation of firm-specific assets allowing for multi-
plant economies of scale (e.g. Pfaffermayr, 1999) and the international transfer of accumulated
tacit and specialized knowledge on production (Aitkin and Harrison, 1999).
In summary, the literature suggests that an analysis of different types of cooperation strategies
should take into account the different possible aims of (collaborative) R&D efforts. Productivity
increases may be more reflective of incremental innovations and affected by collaborative R&D
aimed at cost reductions, while sales expansion through innovative products is likely to be related
to more basic R&D efforts and client collaborations. We explore this by examining in the
empirical analysis the effect of cooperation on two different types of productivity performance:
labour productivity growth and the growth in sales of innovative products that are new to the
market per employee (‘innovative sales productivity’). Further, the literature suggest that an
analysis of the performance effect of cooperation should control for the positive impact of
incoming knowledge spillovers, as well as R&D expenditures, while the existence of
multinational group linkages should also be taken into account.
7
3. Empirical model, data and descriptive statistics
The goal of the empirical analysis is to determine how different types of R&D
collaboration affect firms’ productivity growth. To examine this effect the analysis should control
for the impact of the firms’ R&D expenditures efforts as well as incoming knowledge flows that
are not due to cooperation. A growth in productivity performance specification has as major
advantage that results are not biased from simultaneity bias and unobserved fixed firm attributes
explaining both productivity levels and innovation efforts (e.g. Van Leeuwen and Klomp, 2001).
We estimate the following productivity (prodv) equation (i is firm index):
+++++=∆ iiiii coopSuppcoopCustcoopCompXprodv ___)log( 321 ζζζβα (1)
++++++ iiiiii InnspilUnivspilSuppspilCustspilCompcoopUniv int_____ 43214 δγγγγζ
iiprodv εθ ++ )log(
The dependent variable, )log()log()log( 1 tti prodvprodvprodv −=∆ + , is the growth in
productivity measured as either value added per employee or sales generated by new to the
market products per employee, respectively. Labour productivity growth will be most affected by
cost reducing innovation, while innovative sales productivity growth is mostly affected by
demand expansion oriented innovation. Differences in the impact of cooperative R&D on the two
performance measures can demonstrate the variety in purposes of different collaborative
strategies. The model includes four dummies for cooperation types with different possible
partners: competitors, customers, suppliers, and universities & research institutes (henceforward
for convenience labelled ‘universities’).3 The same partners are identified as potential sources of
incoming knowledge spillovers. The model also controls for the firm’s expenditures on R&D and
other innovation activities (Innint, innovation intensity). The lagged log(Prod) term is the level
term of the dependent variable taken in the base year (1996). Firms that are highly productive and
at the frontier of productivity may be less likely to be able record strong growth rates in
3 We do not include cooperation with consultants in the empirical analysis because of its heterogeneous character and doubts whether linkages with consultants are genuine R&D efforts rather than market transactions.
8
productivity than firms that are followers.4 In that case we expect θ to fall within the interval [-
1,0]. If θ is zero, this effect is absent and there is no gradual convergence between leading firms
and productivity laggards. If θ is –1, than a productivity lead in one period is fully neutralized in
the next and passed productivity has no impact on future productivity levels.5 The X-vector
consists of other firm-level control variables, such as size, dummies controlling for foreign and
domestic groups, dummies for cost reducing and product improving objectives of innovation, and
dummies for the industry of the firm at the two-digit level.
One worry is that our specification does not allow separating the effect of the incoming
spillovers from the effect of cooperation: cooperation can have a direct effect on productivity but
will at the same time increase the reported incoming spillovers from the collaboration partner. In
order to estimate the full impact of cooperation, we have to separate spillovers due to purposeful
informational exchanges that arise in formal cooperative arrangements from spillovers that are
not due to such cooperation (e.g. arising from market contacts with suppliers and customers). We
extract the former spillovers due to collaboration by taking as the spillover measure the residuals
obtained from regressing the spillover variables on the corresponding cooperation variable and
the set of industry dummies.
(2) compiiihori ZcoopCompspilComp ηλ ++= __
(3) custiiicusti ZcoopCustspilCust ηλ ++= __
(4) piiipi ZcoopSuppspilSupp sup
sup __ ηλ ++=
(5) univiiiinsti ZcoopUnivspilUniv ηλ ++= __
The estimated residuals from these equations comptη̂ through univ
iη̂ are then included in
place of the spillover variables ispilComp _ through ispilUniv _ in our specification. The
residuals are no longer systematically related to firms’ R&D collaborations and will indicate the
importance of ‘true’ spillovers.6
4 Since the model includes a full set of industry dummies, this variable can also be interpreted as the effect of the productivity level of the firm relative to the industry mean in 1996. 5 To see this, one can simply rewrite the relevant part of (1) as tit prodvprodv ))(1.....()log( 1 θ+=+ . 6 Whereas the four spillover sources included in the model identify the source, there are a number of other types of incoming spillovers in the CIS survey that identify the channel of the knowledge spillover (databases, trade fairs,
9
Data and Variables
The empirical analysis uses data from two consecutive Community Innovation Surveys
(CIS) from 1996 and 1998 and production statistics data for the same years, available at the
Netherlands Bureau of Statistics (CBS). It has been only recently that researchers have been able
to utilize consecutive CIS surveys merged with production statistics.7 An advantage of the Dutch
CIS surveys is that they have been held every other year rather than in four-year intervals as has
been customary in other EU countries. This allows us to more accurately examine performance
changes over a suitable time frame (two years). The production statistics database includes
information on output, employment, and value added. The CIS database contains information
concerning R&D and innovation activities of the firm, including innovation expenditures,
innovation in partnership data and sources of knowledge used in the innovation process. The CIS
and production statistics surveys are sent to all large firms and to a random sample of smaller
firms in the Netherlands. To create a two-year (panel) data set, innovating firms in 1998 were
matched with information on these firms in the 1996 survey: 2353 firms were included as
innovating firms in both surveys. We then linked these firms via a unique id number to the
production statistics data. The data are at the establishment level and include manufacturing as
well as service firms. Due to the missing values for some of the explanatory variables the
complete sample includes 2056 firms.
The labour productivity growth variable is the growth in net value added per employee
(drawn from the production statistics) between 1996 and 1998. The alternative performance
measure ‘innovation sales productivity growth’ is the growth in the value of sales of product and
services that are new to the market per employee, between 1996 and 1998. This variable is drawn
from the CIS surveys, in which firms are asked to indicate what percentage of sales has been due
products or services introduced in the passed two years that were new to the industry, not just patents). There is a clear and arguably substantial overlap in these measures (e.g. if information from competitors is important, it may reach the firm through patents or trade shows) making it problematic to include all types of spillovers available in the survey. We did include a composite measure of all other spillover ratings by the firm in the model, but this variable proved insignificant with no impact on the estimates of the four source-specific spillover measures, and was omitted in the final specification. The source-specific spillovers are apparently able to capture the lion’s share of the impact of incoming knowledge on productivity growth. 7 Other examples are Belderbos et al (2003) and Klomp and Van Leeuwen (2001).
10
novel to the firm. Firms that increase the performance on this variable are likely to be more
productive in the pursuit of more radical innovations. This in turn is a prerequisite for further
firm growth (Klomp and Van Leeuwen, 2001).
The cooperation variables are taken from 1996 CIS survey and are dummy variables
taking the value one if the firm indicated that it was or had been engaged during 1994-1996 in
active R&D cooperation with competitors, suppliers, customers, and universities or research
institutes, respectively. Hence we posit that cooperative R&D projects in 1994-1996 have their
main impact on productivity growth in the two-year period 1996-1998. This is a relatively
plausible assumption, given that most R&D cooperation projects last between 6 months and 2
years and that R&D requires some time to translate into innovative output and productivity
advances. But it is not ruled out that some cooperative projects do have faster impacts on
productivity. If this is the case, than early R&D projects (e.g. those started in or before 1994)
may already have had their impact on 1996 R&D levels and show no further impact in 1996-
1998, in which case the empirical results will underestimate the impact of cooperation. In order to
address this empirically, we also test for the impact of an alternative cooperation measure:
whether a firm is a ‘persistent’ R&D collaborator: i.e. whether the firm is cooperating with the
respective type of partner both within the 1994-1996 and the 1996-1998 period. If cooperative
projects have a more variable lagged impact on productivity, the persistent cooperation variables
may show more robust results.
The firm-specific and type-specific incoming spillovers are direct measures of the
importance of sources of incoming knowledge for the firms’ innovation process. The CIS survey
asks firms to rate on a Likert scale (1-5) the importance of various external sources of
information in terms of the effectiveness in the firms’ innovation process in the past two years.
Given this wording of the question on sources of incoming knowledge, i.e. their effective use the
innovation activities, the answers are more an indicator of their contribution to innovation output
than in indicators of innovation inputs. Hence, such effective spillovers in 1994-1996 (the 1996
CIS survey) are more likely to affect 1996 productivity levels than 1996-1998 productivity
growth. We therefore do not include the spillover measure for 1996 but the spillover measures
from the 1998 survey (effective spillovers during 1996-1998) as having an impact on 1996-1998
productivity growth. As discussed above, we do not use the scores as explanatory variables but
‘clean’ the spillover measures from the impact of cooperation. We regress the 1998 spillover
11
rates by source on 1996 cooperation and a set of industry dummies, and take the residuals of
these equations as a the measure of spillovers that are not due to purposeful exchanges in formal
R&D partnerships.8
We also include a R&D input measure in line with the previous literature that documented
positive relationship between research intensity and productivity. Our R&D measure is total
innovation expenditures as percentage of sales. Such expenditures include, in addition to internal
R&D, expenditures on extramural R&D contracts paid to other firms and research centres,
expenditures on licenses and hence also controls for the impact of the of external technology
sourcing.9 Innovation intensity is taken from the 1996 survey.
Further control variables include a set of 2-digit industry dummies (we distinguish 19
industries) and firm size (the logarithm of the number of employees). We also allow for different
productivity growth performance between independent firms and firms that are part of a domestic
group or a foreign MNE. Group firms may have higher growth if they can draw on technology
and organizational expertise from headquarters and other groups firms. The Dutch industrial
structure is characterized by the presence of several very large multinational corporations. The
large Dutch companies Akzo/Nobel, DSM, Philips, Shell and Unilever are dominating in terms of
R&D expenditures, and are important elements in the Dutch technological infrastructure. These
large companies are characterized as the core of firm networks with comparable research
intensities (i.e. Cowan and Jonard 1999; Verspagen, 2000) and greater density of knowledge
spillovers.
Finally, we include demand-pull and cost-push variables in the model as controls. The
demand-pull variable is a sum of scores on importance of objectives of innovation relating to
demand. Cost-push is the sum of scores on importance of objectives relating to cost reduction. If
cost-reduction is a major motivation for innovations efforts, it may be more likely that R&D
translates directly into improved labour productivity. Demand expansion orientation is most
likely to impact on new product sales productivity.
8 In the model including aggregate spillovers and cooperation, we regress the average spillover rate on the sum of cooperation dummies. 9 We were not able to further decompose innovation expenditures between intramural R&D and other innovation expenditures, such as outsourced R&D, procurement of licenses, and investment in equipment.
12
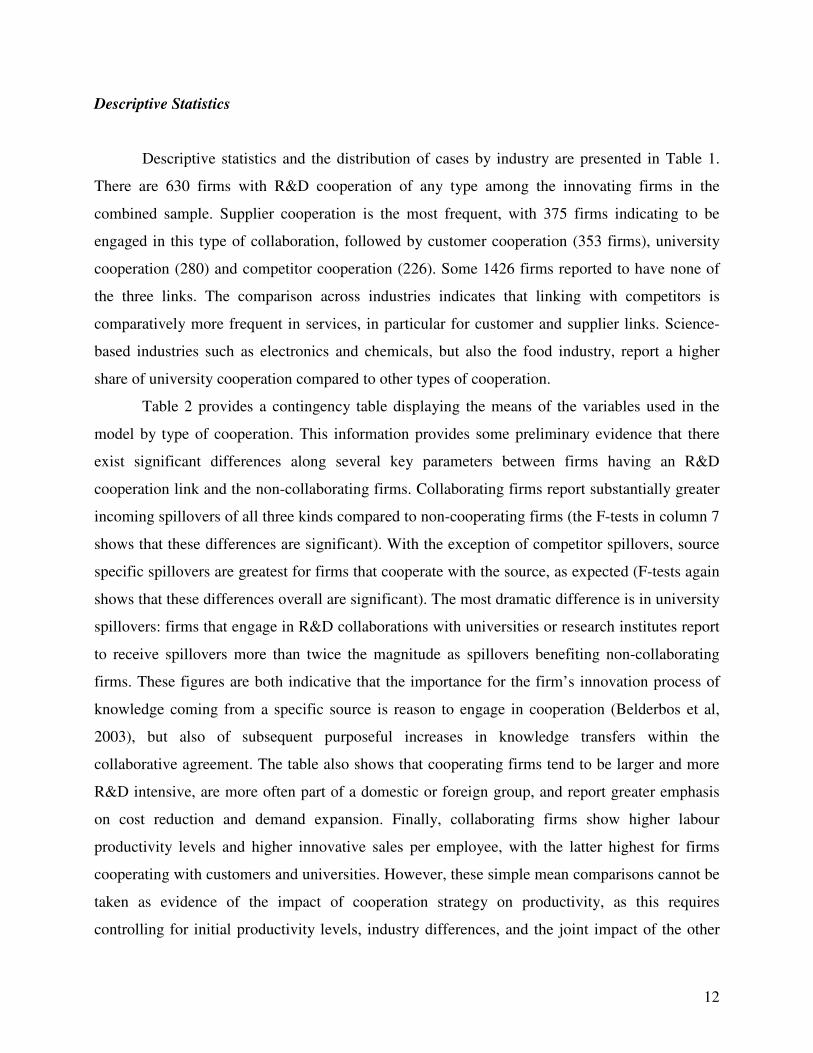
Descriptive Statistics
Descriptive statistics and the distribution of cases by industry are presented in Table 1.
There are 630 firms with R&D cooperation of any type among the innovating firms in the
combined sample. Supplier cooperation is the most frequent, with 375 firms indicating to be
engaged in this type of collaboration, followed by customer cooperation (353 firms), university
cooperation (280) and competitor cooperation (226). Some 1426 firms reported to have none of
the three links. The comparison across industries indicates that linking with competitors is
comparatively more frequent in services, in particular for customer and supplier links. Science-
based industries such as electronics and chemicals, but also the food industry, report a higher
share of university cooperation compared to other types of cooperation.
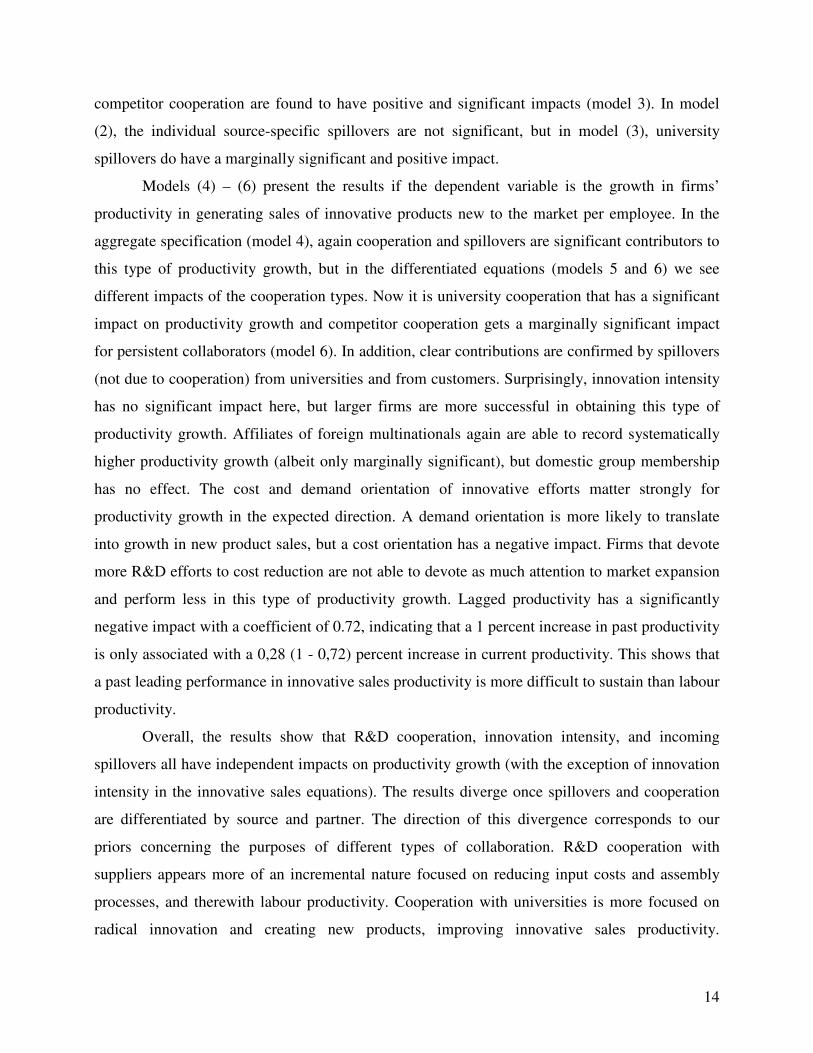
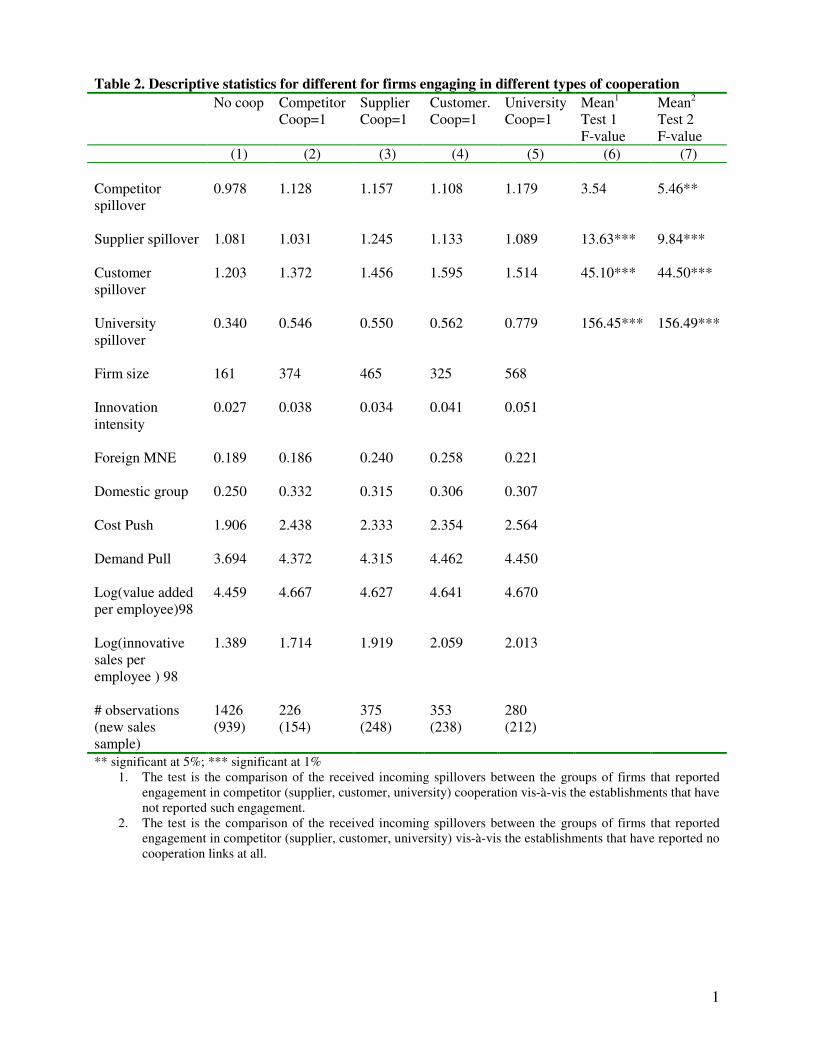
Table 2 provides a contingency table displaying the means of the variables used in the
model by type of cooperation. This information provides some preliminary evidence that there
exist significant differences along several key parameters between firms having an R&D
cooperation link and the non-collaborating firms. Collaborating firms report substantially greater
incoming spillovers of all three kinds compared to non-cooperating firms (the F-tests in column 7
shows that these differences are significant). With the exception of competitor spillovers, source
specific spillovers are greatest for firms that cooperate with the source, as expected (F-tests again
shows that these differences overall are significant). The most dramatic difference is in university
spillovers: firms that engage in R&D collaborations with universities or research institutes report
to receive spillovers more than twice the magnitude as spillovers benefiting non-collaborating
firms. These figures are both indicative that the importance for the firm’s innovation process of
knowledge coming from a specific source is reason to engage in cooperation (Belderbos et al,
2003), but also of subsequent purposeful increases in knowledge transfers within the
collaborative agreement. The table also shows that cooperating firms tend to be larger and more
R&D intensive, are more often part of a domestic or foreign group, and report greater emphasis
on cost reduction and demand expansion. Finally, collaborating firms show higher labour
productivity levels and higher innovative sales per employee, with the latter highest for firms
cooperating with customers and universities. However, these simple mean comparisons cannot be
taken as evidence of the impact of cooperation strategy on productivity, as this requires
controlling for initial productivity levels, industry differences, and the joint impact of the other
13
variables in a multivariate analysis. The results of this analysis, estimates of equation 1-5, are
discussed below.
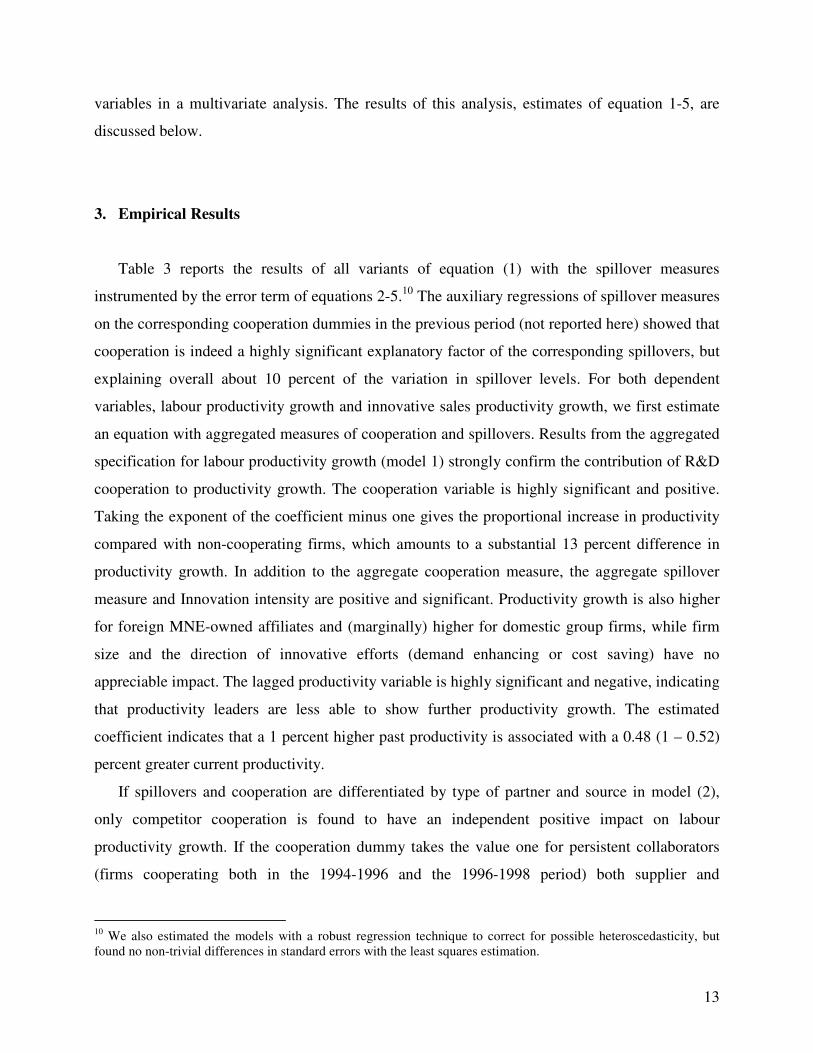
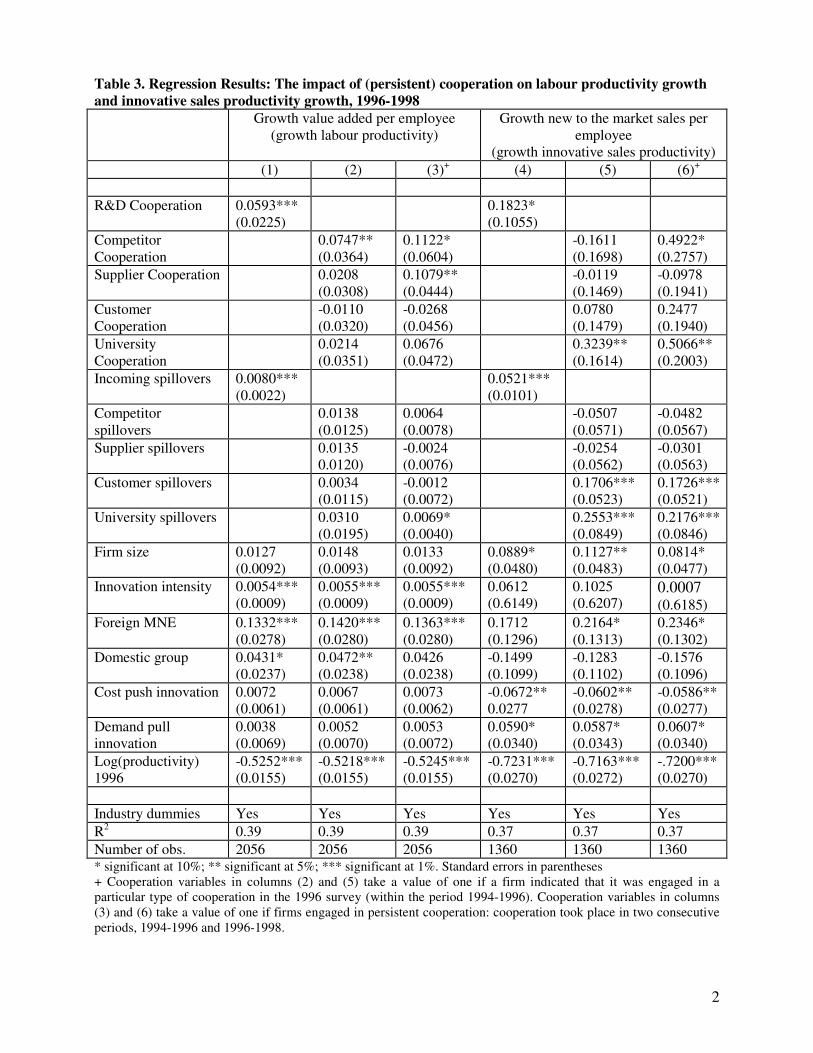
3. Empirical Results
Table 3 reports the results of all variants of equation (1) with the spillover measures
instrumented by the error term of equations 2-5.10 The auxiliary regressions of spillover measures
on the corresponding cooperation dummies in the previous period (not reported here) showed that
cooperation is indeed a highly significant explanatory factor of the corresponding spillovers, but
explaining overall about 10 percent of the variation in spillover levels. For both dependent
variables, labour productivity growth and innovative sales productivity growth, we first estimate
an equation with aggregated measures of cooperation and spillovers. Results from the aggregated
specification for labour productivity growth (model 1) strongly confirm the contribution of R&D
cooperation to productivity growth. The cooperation variable is highly significant and positive.
Taking the exponent of the coefficient minus one gives the proportional increase in productivity
compared with non-cooperating firms, which amounts to a substantial 13 percent difference in
productivity growth. In addition to the aggregate cooperation measure, the aggregate spillover
measure and Innovation intensity are positive and significant. Productivity growth is also higher
for foreign MNE-owned affiliates and (marginally) higher for domestic group firms, while firm
size and the direction of innovative efforts (demand enhancing or cost saving) have no
appreciable impact. The lagged productivity variable is highly significant and negative, indicating
that productivity leaders are less able to show further productivity growth. The estimated
coefficient indicates that a 1 percent higher past productivity is associated with a 0.48 (1 – 0.52)
percent greater current productivity.
If spillovers and cooperation are differentiated by type of partner and source in model (2),
only competitor cooperation is found to have an independent positive impact on labour
productivity growth. If the cooperation dummy takes the value one for persistent collaborators
(firms cooperating both in the 1994-1996 and the 1996-1998 period) both supplier and
10 We also estimated the models with a robust regression technique to correct for possible heteroscedasticity, but found no non-trivial differences in standard errors with the least squares estimation.
14
competitor cooperation are found to have positive and significant impacts (model 3). In model
(2), the individual source-specific spillovers are not significant, but in model (3), university
spillovers do have a marginally significant and positive impact.
Models (4) – (6) present the results if the dependent variable is the growth in firms’
productivity in generating sales of innovative products new to the market per employee. In the
aggregate specification (model 4), again cooperation and spillovers are significant contributors to
this type of productivity growth, but in the differentiated equations (models 5 and 6) we see
different impacts of the cooperation types. Now it is university cooperation that has a significant
impact on productivity growth and competitor cooperation gets a marginally significant impact
for persistent collaborators (model 6). In addition, clear contributions are confirmed by spillovers
(not due to cooperation) from universities and from customers. Surprisingly, innovation intensity
has no significant impact here, but larger firms are more successful in obtaining this type of
productivity growth. Affiliates of foreign multinationals again are able to record systematically
higher productivity growth (albeit only marginally significant), but domestic group membership
has no effect. The cost and demand orientation of innovative efforts matter strongly for
productivity growth in the expected direction. A demand orientation is more likely to translate
into growth in new product sales, but a cost orientation has a negative impact. Firms that devote
more R&D efforts to cost reduction are not able to devote as much attention to market expansion
and perform less in this type of productivity growth. Lagged productivity has a significantly
negative impact with a coefficient of 0.72, indicating that a 1 percent increase in past productivity
is only associated with a 0,28 (1 - 0,72) percent increase in current productivity. This shows that
a past leading performance in innovative sales productivity is more difficult to sustain than labour
productivity.
Overall, the results show that R&D cooperation, innovation intensity, and incoming
spillovers all have independent impacts on productivity growth (with the exception of innovation
intensity in the innovative sales equations). The results diverge once spillovers and cooperation
are differentiated by source and partner. The direction of this divergence corresponds to our
priors concerning the purposes of different types of collaboration. R&D cooperation with
suppliers appears more of an incremental nature focused on reducing input costs and assembly
processes, and therewith labour productivity. Cooperation with universities is more focused on
radical innovation and creating new products, improving innovative sales productivity.
15
Competitor collaboration is the only type of collaboration that has multiple purposes and impacts,
effective in generating both labour productivity increases (e.g. through cost sharing) and
innovative sales productivity increases (e.g. enabling the start of innovation projects through risk
sharing and improving sales through the establishment of technological standards). Customer
cooperation, in contrast, is not found to have any discernable impact on productivity growth:
apparently, the information on customer demands and technological requirements is already
effectively captured by incoming spillovers from customers through market transactions, and do
not require formal collaborative R&D agreements. The role of universities in firms’ productivity
performance also stands out, as it is the only source of knowledge that both provides effective
public spillovers (not due to collaboration) and improves firms’ innovative sales productivity
through formal R&D cooperation.
5. Conclusions
Despite a growing literature on R&D cooperation in both the fields of management and
industrial economics, surprisingly little evidence has emerged on the performance effect of R&D
collaboration. This paper analyses the impact of R&D cooperation on firm performance jointly
with the impact of innovation expenditures and the effect of incoming spillovers that are not due
to formal collaborative agreements. We differentiate between the type of R&D partner
(competitors, suppliers, customers, and universities & research institutes) and consider two
performance measures: labour productivity and productivity in innovative sales new to the
market. Using data on a large sample of Dutch innovating firms in two waves of Community
Innovation Survey (1996, 1998), we mitigate problems of simultaneity and unobserved firm-
specific effects by examining the impact of R&D (collaboration) on productivity growth in 1996-
1998. We find that supplier and competitor cooperation have a significant impact on labour
productivity growth, while cooperation universities & research institutes and again competitor
cooperation positively affects growth in sales per employee of products and services new to the
market. New product sales are furthermore stimulated by incoming spillovers (not due to
collaboration) from customers and universities & research institutes. The results are sensitive to
the lag with which innovation strategies are allowed to impact productivity growth. Generally,
16
allowing for a more variable lag structure by examining the impact of cooperation strategies that
are sustained over a 2-4 year period demonstrated a substantially more robust impact of
cooperation on productivity.
The results confirm a major heterogeneity in the rationales and goals of R&D
cooperation, with competitor and supplier cooperation focused on incremental innovations
improving the productivity performance of firms, while university cooperation and again
competitor cooperation are instrumental in creating and bringing to market radical innovations,
generating sales of products that are novel to the market, and hence improving the growth
performance of firms (Klomp and Van Leeuwen, 2001). The findings provide qualified support
for the notion that cooperating firms are generally engaged in higher level innovative activities
(Thether, 2002). This holds unequivocally for firms collaborating with universities (e.g. to get
access to basic research) and competitors (to allow R&D for risky projects), but not for firms
engaged in ‘vertical cooperation’ with suppliers and customers. In case the latter types of
cooperation are also partly focused on more radical innovations, than at least there is no evidence
in our analysis that these efforts are effective in improving firms’ performance in bringing novel
products to the market.
The findings go some way in explaining the variety of results obtained in previous
empirical work on the effect of cooperation on innovative sales and productivity, where single
performance measures were used and no (variation in) lag structures could be examined because
of the cross section nature of the data (e.g. Heshmati and Lööf, 2002; Monjon and Waelbroeck,
2003). Since different R&D strategies can impact performance with different lag structures,
future research should explore the different possible intertemporal structure of the impact of
R&D strategies on innovation output and firm performance. The increasing availability of
consecutive CIS surveys will allow construction of panel data sets to examine the effectiveness of
various innovation strategies in more detail.
17
References
Adams, J. and A. Jaffe. 1996. Bounding the effects of R&D: an investigation using matched
establishment-firm data. RAND Journal of Economics. 27(4): 700-21.
Aitken, B. and A. Harrison. 1999. Do domestic firms benefit from direct foreign investment?
Evidence from Venezuela. American Economic Review, 89(3): 605-618.
Amir, Rabah, Igor Evstigneev and John Wooders (2003). Noncooperative versus cooperative
R&D with endogenous spillover rates, Games and Economic Behavior 42, 184-207.
Atallah, G., (2002), Vertical R&D spillovers, cooperation, market structure and innovation,
Economics of Innovation and New Technology, 11, 3, 179-209.
Basant, R. and B. Flikkert. 1996. The effects of R&D, foreign technology purchase and domestic
and international spillovers on productivity on Indian firms. Review of Economics and
Statistics, 78(2): 187-99.
Baum, J. A. C.; Calabrese, T., and Silverman, B. S. (2000) Don't go it alone: alliance network
composition and startups' performance in Canadian biotechnology. Strategic Management
Journal, 21(3): 267-294.
Belderbos, R., M. Carree, B. Diederen, B. Lokshin, R. Veugelers. 2003. Heterogeneity in R&D
cooperation strategies. CEPR Discussion paper DP4021.
Branstetter, L. 2001. Are knowledge spillovers international or international in scope?
Microeconometric evidence from US and Japan. Journal of International Economics, 53:
53-79.
Cassiman, B., D. Perez-Castrillo, R. Veugelers (2002), Endogeneizing know-how flows through
the nature of R&D investments, International Journal of Industrial Organization, 20, 775-
799
Cincera, Michele, et al., 2004, Productivity Growth, R&D, and the Role of International
Collaborative Agreements: Some Evidence for Belgian Manufacturing companies,
forthcoming in: Brussels Economic Review.
Coe, D. and E. Helpman. 1995. International R&D spillovers. European Economic Review, 39:
859-87.
Contractor, F. and P. Lorange. 2002. Cooperative Strategies and Alliances. Amsterdam, Elsevier.
18
Cowan, Robin and Jonard, Nicolas, 2001, Knowledge creation, knowledge diffusion and network
structure, in: A. Kirman and J-B. Zimmermann (eds.), Economies with Heterogeneous
Interacting Agents, Springer.
Crépon, B., Duguet, E. and J. Mairesse. 1998. Research, innovation and productivity: an
econometric analysis at the firm level. The Economics of Innovation and New Technology.
7:115-58.
Criscuolo, Chiara, and Jonathan Haskel, 2003, Innovation and productivity Growth in the UK:
Evidence from CIS2 and CIS3, working paper, Centre for Research into Business Activity.
Das, T. K. and Teng, B-S. 2000. A resource-based theory of strategic alliances. Journal of
Management, 26 (1): 31-60.
De Bondt, Raymond. (1996). Spillovers and innovative activities. International Journal of
Industrial Organization. 15: 1-28.
Fritsch, Michael and Rolf Lukas. 2001. Who cooperates on R&D? Research Policy 30:297-312. Griffith, R. 1999. Using the ARD establishment level data to look at foreign ownership and
productivity in the United Kingdom. Economic Journal, 109: 416-42.
Grilliches, Z., and J. Mairesse. 1984. Productivity and R&D at the firm level. In R&D, Patents
and Productivity. Z. Grilliches (ed.). Chicago Press.
Hagedoorn, John. (2002). Inter-firm R&D partnerships: an overview of major trends and patterns
since 1960. Research Policy 31: 477-492.
Hall, B. and J. Mairesse. 1995. Exploring the relationship between R&D and productivity in
French manufacturing firms. Journal of Econometrics, 65: 263-93.
Hamel, G. (1991) Competition for competence and inter-partner learning within international
strategic alliances. Strategic Management Journal, 12: 83-103.
Harrigan, K. (1986) Strategic alliances and partner asymmetries. Management International
Review, 28: 5 -72.
Harris, R. and C. Robinson. 2003. Foreign ownership and productivity in the United Kingdom
estimates for the U.K. using ARD. Review of Industrial Organization 22: 207-23.
Janz, N, Lööf, H, and B. Peters. 2003. Firm level innovation and productivity – is there a
common story across countries. ZEW working paper dp0326
Kamien, Morton, Muller, Eitan and Zang, Israel. (1992). Research joint ventures and R&D
cartels. The American Economic Review 82(5): 1293-1992.
19
Katsoulacos, Yannis and David Ulph. (1998). Endogenous spillovers and the performance of
research joint ventures. Journal of Industrial Economics 46: 333-357.
Kleinknecht, Alfred and Jeroen Reijnen. (1992). Why do firms cooperate on R&D? An empirical
study. Research Policy 21: 347-360.
Klomp, L. and G. van Leeuwen. 2001. Linking innovation and firm performance: a new
approach. International Journal of the Economics of Business, 8(3): 343-64.
Kogut, B. 1988. Joint ventures: theoretical and empirical perspectives. Strategic Management
Journal 9: 319-332.
Leeuwen, G. van, 2002. Linking innovation to productivity growth using two waves of CIS,
CEREM working paper 0202.
Leeuwen, G. van, and L. Klomp, 2001, On the Contribution of Innovation to Multi-Factor
Productivity Growth, Paper presented at the Eindhoven Centre for Innovation Studies
(ECIS) conference, 20-23 September 2001.
Lichtenberg, F. and D. Siegel. 1991. The Impact of R&D Investment on Productivity - New
Evidence Using Linked R&D-LRD Data. Economic Inquiry, 29(2): 203-29.
Lööf, H. and A. Heshmati. 2002. Knowledge capital and performance heterogeneity: a firm-level
innovation study. International Journal of Production Economics, 76(1): 61-85.
Martin, S., 1999, Spillovers, appropriability, and R&D, W.P. University of Copenhagen.
Monjon, S. and P. Waelbroeck, 2003, Assessing Spillovers from Universities to Firms: Evidence
from French firm-level data, International Journal of Industrial Organization, 21 (9), 1255-
1270.
Nooteboom, B. 1999. Inter-firm alliances – analysis and design. London, Routledge.
Pfaffermayr, M. 1999. Ownership advantages, foreign production and productivity: evidence
from Austrian manufacturing firms. Review of Industrial Organization. 15: 379-96.
Pisano, G. 1990. The R&D boundaries of the firm: an empirical analysis. Administrative Science
Quarterly, 35: 153-177.
Röller, L, M. Tombak and R. Siebert. 1997, Why firms form Research Joint Ventures: theory and
evidence, CEPR Discussion Paper Series, no 1654.
Suzumura, Kotaro. 1992. Cooperative and noncooperative R&D in oligopoly with spillovers.
American Economic Review. 82(5): 1307-1320.
Teece, D. 1980. The diffusion of an administrative innovation. Management Science, 26: 464-70.

20
Tether, Bruce. 2002. Who co-operates for innovation, and why: an empirical analysis. Research
Policy 31: 947-967.
Tyler, Beverly B. and H. Kevin Steensma. 1995. Evaluating technological collaborative
opportunities: a cognitive modelling perspective. Strategic Management Journal 16, 43-70.
Vanhaverbeke, W., G. Duisters, B. Beerkens. 2004. Technological capabilities building through
networking strategies with high-tech industries. Eindhoven Center for Innovating Studies
working paper.
Von Hippel, (1988) The Sources of Innovation. New York: Oxford University Press.
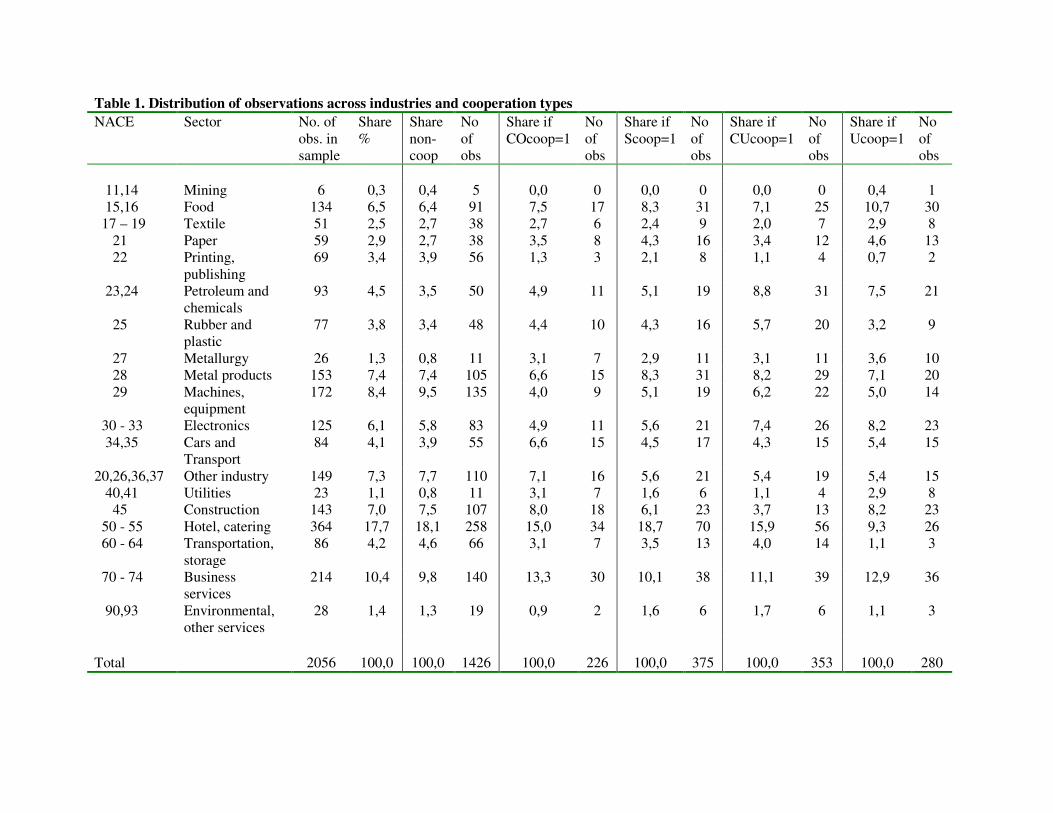
Table 1. Distribution of observations across industries and cooperation types NACE Sector No. of
obs. in sample
Share %
Share non- coop
No of obs
Share if COcoop=1
No of obs
Share if Scoop=1
No of obs
Share if CUcoop=1
No of obs
Share if Ucoop=1
No of obs
11,14 Mining 6 0,3 0,4 5 0,0 0 0,0 0 0,0 0 0,4 1 15,16 Food 134 6,5 6,4 91 7,5 17 8,3 31 7,1 25 10,7 30 17 – 19 Textile 51 2,5 2,7 38 2,7 6 2,4 9 2,0 7 2,9 8 21 Paper 59 2,9 2,7 38 3,5 8 4,3 16 3,4 12 4,6 13 22 Printing,
publishing 69 3,4 3,9 56 1,3 3 2,1 8 1,1 4 0,7 2
23,24 Petroleum and chemicals
93 4,5 3,5 50 4,9 11 5,1 19 8,8 31 7,5 21
25 Rubber and plastic
77 3,8 3,4 48 4,4 10 4,3 16 5,7 20 3,2 9
27 Metallurgy 26 1,3 0,8 11 3,1 7 2,9 11 3,1 11 3,6 10 28 Metal products 153 7,4 7,4 105 6,6 15 8,3 31 8,2 29 7,1 20 29 Machines,
equipment 172 8,4 9,5 135 4,0 9 5,1 19 6,2 22 5,0 14
30 - 33 Electronics 125 6,1 5,8 83 4,9 11 5,6 21 7,4 26 8,2 23 34,35 Cars and
Transport 84 4,1 3,9 55 6,6 15 4,5 17 4,3 15 5,4 15
20,26,36,37 Other industry 149 7,3 7,7 110 7,1 16 5,6 21 5,4 19 5,4 15 40,41 Utilities 23 1,1 0,8 11 3,1 7 1,6 6 1,1 4 2,9 8 45 Construction 143 7,0 7,5 107 8,0 18 6,1 23 3,7 13 8,2 23 50 - 55 Hotel, catering 364 17,7 18,1 258 15,0 34 18,7 70 15,9 56 9,3 26 60 - 64 Transportation,
storage 86 4,2 4,6 66 3,1 7 3,5 13 4,0 14 1,1 3
70 - 74 Business services
214 10,4 9,8 140 13,3 30 10,1 38 11,1 39 12,9 36
90,93 Environmental, other services
28 1,4 1,3 19 0,9 2 1,6 6 1,7 6 1,1 3
Total 2056 100,0 100,0 1426 100,0 226 100,0 375 100,0 353 100,0 280
1
Table 2. Descriptive statistics for different for firms engaging in different types of cooperation No coop Competitor
Coop=1 Supplier Coop=1
Customer. Coop=1
University Coop=1
Mean1 Test 1 F-value
Mean2 Test 2 F-value
(1) (2) (3) (4) (5) (6) (7)
Competitor spillover
0.978 1.128 1.157 1.108 1.179 3.54 5.46**
Supplier spillover
1.081
1.031
1.245
1.133
1.089
13.63***
9.84***
Customer spillover
1.203
1.372
1.456
1.595
1.514
45.10***
44.50***
University spillover
0.340
0.546
0.550
0.562
0.779
156.45***
156.49***
Firm size
161
374
465
325
568
Innovation intensity
0.027
0.038
0.034
0.041
0.051
Foreign MNE
0.189
0.186
0.240
0.258
0.221
Domestic group
0.250
0.332
0.315
0.306
0.307
Cost Push
1.906
2.438
2.333
2.354
2.564
Demand Pull
3.694
4.372
4.315
4.462
4.450
Log(value added per employee)98
4.459
4.667
4.627
4.641
4.670
Log(innovative sales per employee ) 98
1.389
1.714
1.919
2.059
2.013
# observations (new sales sample)
1426 (939)
226 (154)
375 (248)
353 (238)
280 (212)
** significant at 5%; *** significant at 1% 1. The test is the comparison of the received incoming spillovers between the groups of firms that reported
engagement in competitor (supplier, customer, university) cooperation vis-à-vis the establishments that have not reported such engagement.
2. The test is the comparison of the received incoming spillovers between the groups of firms that reported engagement in competitor (supplier, customer, university) vis-à-vis the establishments that have reported no cooperation links at all.
2
Table 3. Regression Results: The impact of (persistent) cooperation on labour productivity growth and innovative sales productivity growth, 1996-1998
Growth value added per employee (growth labour productivity)
Growth new to the market sales per employee
(growth innovative sales productivity) (1) (2) (3)+ (4) (5) (6)+
R&D Cooperation 0.0593***
(0.0225) 0.1823*
(0.1055)
Competitor Cooperation
0.0747** (0.0364)
0.1122* (0.0604)
-0.1611 (0.1698)
0.4922* (0.2757)
Supplier Cooperation 0.0208 (0.0308)
0.1079** (0.0444)
-0.0119 (0.1469)
-0.0978 (0.1941)
Customer Cooperation
-0.0110 (0.0320)
-0.0268 (0.0456)
0.0780 (0.1479)
0.2477 (0.1940)
University Cooperation
0.0214 (0.0351)
0.0676 (0.0472)
0.3239** (0.1614)
0.5066** (0.2003)
Incoming spillovers 0.0080*** (0.0022)
0.0521*** (0.0101)
Competitor spillovers
0.0138 (0.0125)
0.0064 (0.0078)
-0.0507 (0.0571)
-0.0482 (0.0567)
Supplier spillovers 0.0135 0.0120)
-0.0024 (0.0076)
-0.0254 (0.0562)
-0.0301 (0.0563)
Customer spillovers 0.0034 (0.0115)
-0.0012 (0.0072)
0.1706*** (0.0523)
0.1726*** (0.0521)
University spillovers 0.0310 (0.0195)
0.0069* (0.0040)
0.2553*** (0.0849)
0.2176*** (0.0846)
Firm size 0.0127 (0.0092)
0.0148 (0.0093)
0.0133 (0.0092)
0.0889* (0.0480)
0.1127** (0.0483)
0.0814* (0.0477)
Innovation intensity 0.0054*** (0.0009)
0.0055*** (0.0009)
0.0055*** (0.0009)
0.0612 (0.6149)
0.1025 (0.6207)
0.0007 (0.6185)
Foreign MNE 0.1332*** (0.0278)
0.1420*** (0.0280)
0.1363*** (0.0280)
0.1712 (0.1296)
0.2164* (0.1313)
0.2346* (0.1302)
Domestic group 0.0431* (0.0237)
0.0472** (0.0238)
0.0426 (0.0238)
-0.1499 (0.1099)
-0.1283 (0.1102)
-0.1576 (0.1096)
Cost push innovation 0.0072 (0.0061)
0.0067 (0.0061)
0.0073 (0.0062)
-0.0672** 0.0277
-0.0602** (0.0278)
-0.0586** (0.0277)
Demand pull innovation
0.0038 (0.0069)
0.0052 (0.0070)
0.0053 (0.0072)
0.0590* (0.0340)
0.0587* (0.0343)
0.0607* (0.0340)
Log(productivity) 1996
-0.5252*** (0.0155)
-0.5218*** (0.0155)
-0.5245*** (0.0155)
-0.7231*** (0.0270)
-0.7163*** (0.0272)
-.7200*** (0.0270)
Industry dummies Yes Yes Yes Yes Yes Yes R2 0.39 0.39 0.39 0.37 0.37 0.37 Number of obs. 2056 2056 2056 1360 1360 1360 * significant at 10%; ** significant at 5%; *** significant at 1%. Standard errors in parentheses + Cooperation variables in columns (2) and (5) take a value of one if a firm indicated that it was engaged in a particular type of cooperation in the 1996 survey (within the period 1994-1996). Cooperation variables in columns (3) and (6) take a value of one if firms engaged in persistent cooperation: cooperation took place in two consecutive periods, 1994-1996 and 1996-1998.
3
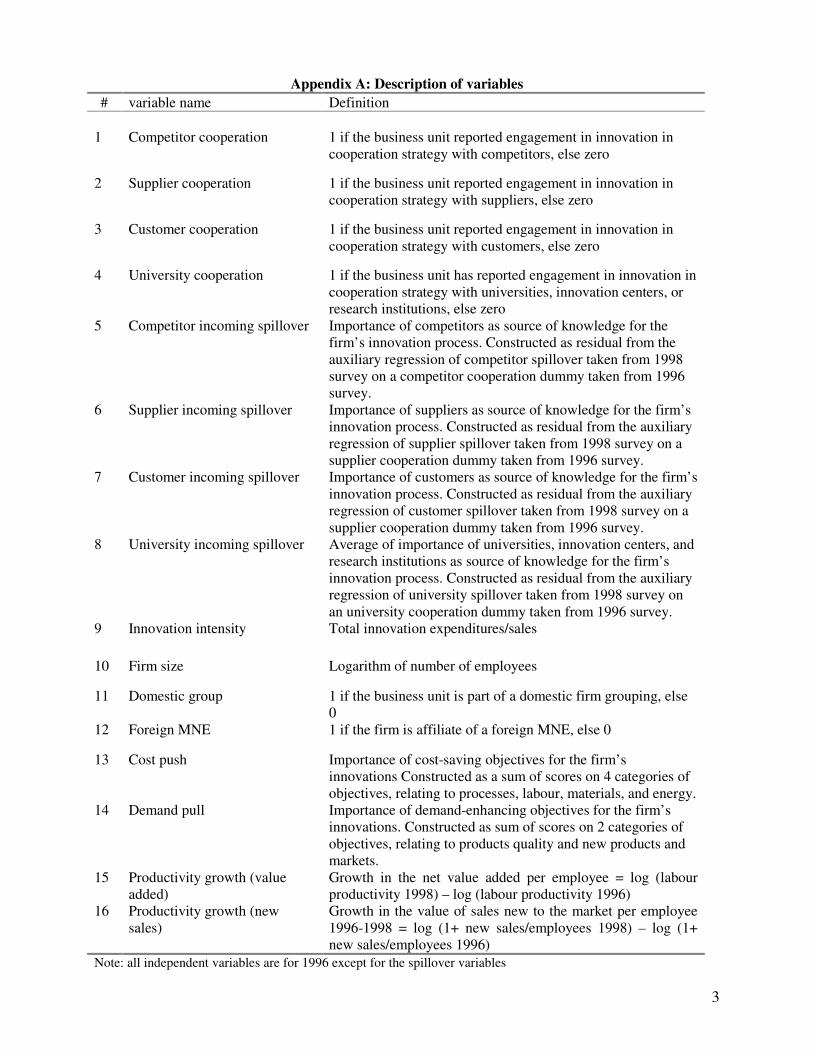
Appendix A: Description of variables # variable name Definition
1 Competitor cooperation 1 if the business unit reported engagement in innovation in
cooperation strategy with competitors, else zero
2 Supplier cooperation 1 if the business unit reported engagement in innovation in cooperation strategy with suppliers, else zero
3 Customer cooperation 1 if the business unit reported engagement in innovation in cooperation strategy with customers, else zero
4 University cooperation 1 if the business unit has reported engagement in innovation in cooperation strategy with universities, innovation centers, or research institutions, else zero
5 Competitor incoming spillover Importance of competitors as source of knowledge for the firm’s innovation process. Constructed as residual from the auxiliary regression of competitor spillover taken from 1998 survey on a competitor cooperation dummy taken from 1996 survey.
6 Supplier incoming spillover Importance of suppliers as source of knowledge for the firm’s innovation process. Constructed as residual from the auxiliary regression of supplier spillover taken from 1998 survey on a supplier cooperation dummy taken from 1996 survey.
7 Customer incoming spillover Importance of customers as source of knowledge for the firm’s innovation process. Constructed as residual from the auxiliary regression of customer spillover taken from 1998 survey on a supplier cooperation dummy taken from 1996 survey.
8 University incoming spillover Average of importance of universities, innovation centers, and research institutions as source of knowledge for the firm’s innovation process. Constructed as residual from the auxiliary regression of university spillover taken from 1998 survey on an university cooperation dummy taken from 1996 survey.
9 Innovation intensity Total innovation expenditures/sales
10 Firm size Logarithm of number of employees
11 Domestic group 1 if the business unit is part of a domestic firm grouping, else 0
12 Foreign MNE 1 if the firm is affiliate of a foreign MNE, else 0
13 Cost push Importance of cost-saving objectives for the firm’s innovations Constructed as a sum of scores on 4 categories of objectives, relating to processes, labour, materials, and energy.
14 Demand pull Importance of demand-enhancing objectives for the firm’s innovations. Constructed as sum of scores on 2 categories of objectives, relating to products quality and new products and markets.
15 Productivity growth (value added)
Growth in the net value added per employee = log (labour productivity 1998) – log (labour productivity 1996)
16 Productivity growth (new sales)
Growth in the value of sales new to the market per employee 1996-1998 = log (1+ new sales/employees 1998) – log (1+ new sales/employees 1996)
Note: all independent variables are for 1996 except for the spillover variables

5
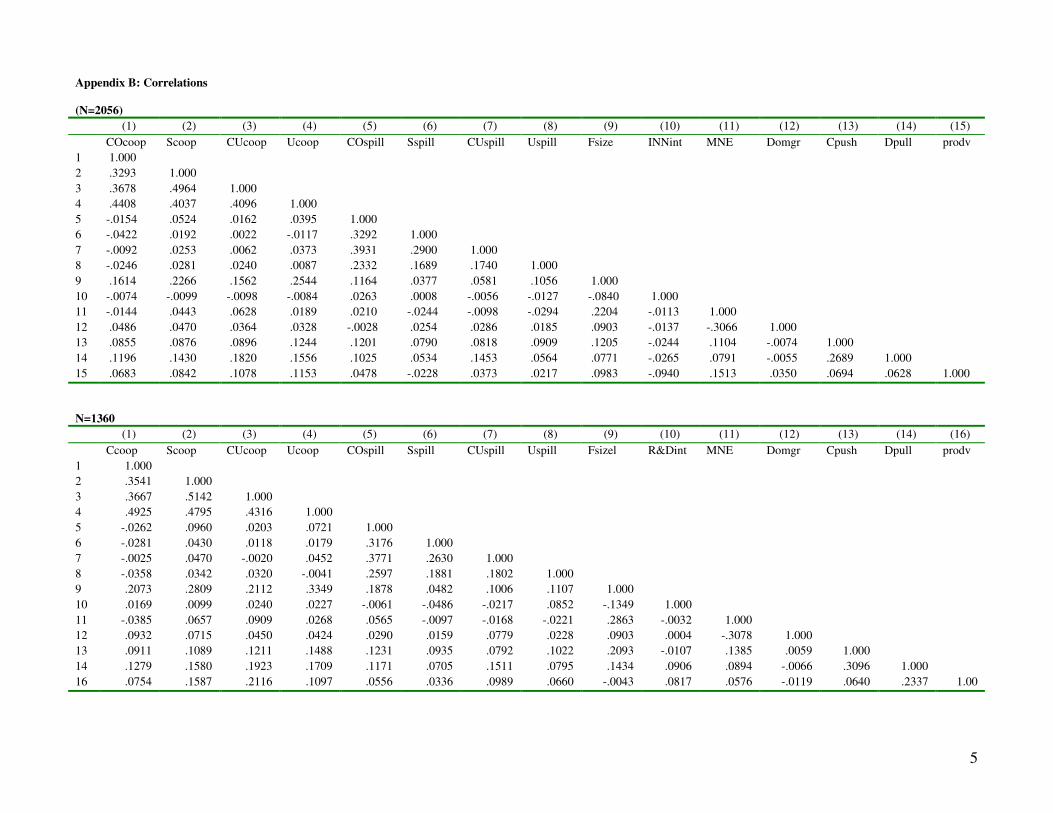
Appendix B: Correlations (N=2056)
(1) (2) (3) (4) (5) (6) (7) (8) (9) (10) (11) (12) (13) (14) (15) COcoop Scoop CUcoop Ucoop COspill Sspill CUspill Uspill Fsize INNint MNE Domgr Cpush Dpull prodv 1 1.000 2 .3293 1.000 3 .3678 .4964 1.000 4 .4408 .4037 .4096 1.000 5 -.0154 .0524 .0162 .0395 1.000 6 -.0422 .0192 .0022 -.0117 .3292 1.000 7 -.0092 .0253 .0062 .0373 .3931 .2900 1.000 8 -.0246 .0281 .0240 .0087 .2332 .1689 .1740 1.000 9 .1614 .2266 .1562 .2544 .1164 .0377 .0581 .1056 1.000 10 -.0074 -.0099 -.0098 -.0084 .0263 .0008 -.0056 -.0127 -.0840 1.000 11 -.0144 .0443 .0628 .0189 .0210 -.0244 -.0098 -.0294 .2204 -.0113 1.000 12 .0486 .0470 .0364 .0328 -.0028 .0254 .0286 .0185 .0903 -.0137 -.3066 1.000 13 .0855 .0876 .0896 .1244 .1201 .0790 .0818 .0909 .1205 -.0244 .1104 -.0074 1.000 14 .1196 .1430 .1820 .1556 .1025 .0534 .1453 .0564 .0771 -.0265 .0791 -.0055 .2689 1.000 15 .0683 .0842 .1078 .1153 .0478 -.0228 .0373 .0217 .0983 -.0940 .1513 .0350 .0694 .0628 1.000 N=1360
(1) (2) (3) (4) (5) (6) (7) (8) (9) (10) (11) (12) (13) (14) (16) Ccoop Scoop CUcoop Ucoop COspill Sspill CUspill Uspill Fsizel R&Dint MNE Domgr Cpush Dpull prodv 1 1.000 2 .3541 1.000 3 .3667 .5142 1.000 4 .4925 .4795 .4316 1.000 5 -.0262 .0960 .0203 .0721 1.000 6 -.0281 .0430 .0118 .0179 .3176 1.000 7 -.0025 .0470 -.0020 .0452 .3771 .2630 1.000 8 -.0358 .0342 .0320 -.0041 .2597 .1881 .1802 1.000 9 .2073 .2809 .2112 .3349 .1878 .0482 .1006 .1107 1.000 10 .0169 .0099 .0240 .0227 -.0061 -.0486 -.0217 .0852 -.1349 1.000 11 -.0385 .0657 .0909 .0268 .0565 -.0097 -.0168 -.0221 .2863 -.0032 1.000 12 .0932 .0715 .0450 .0424 .0290 .0159 .0779 .0228 .0903 .0004 -.3078 1.000 13 .0911 .1089 .1211 .1488 .1231 .0935 .0792 .1022 .2093 -.0107 .1385 .0059 1.000 14 .1279 .1580 .1923 .1709 .1171 .0705 .1511 .0795 .1434 .0906 .0894 -.0066 .3096 1.000 16 .0754 .1587 .2116 .1097 .0556 .0336 .0989 .0660 -.0043 .0817 .0576 -.0119 .0640 .2337 1.00