Cooperative Performance Measurement Proposal (a test with the
25
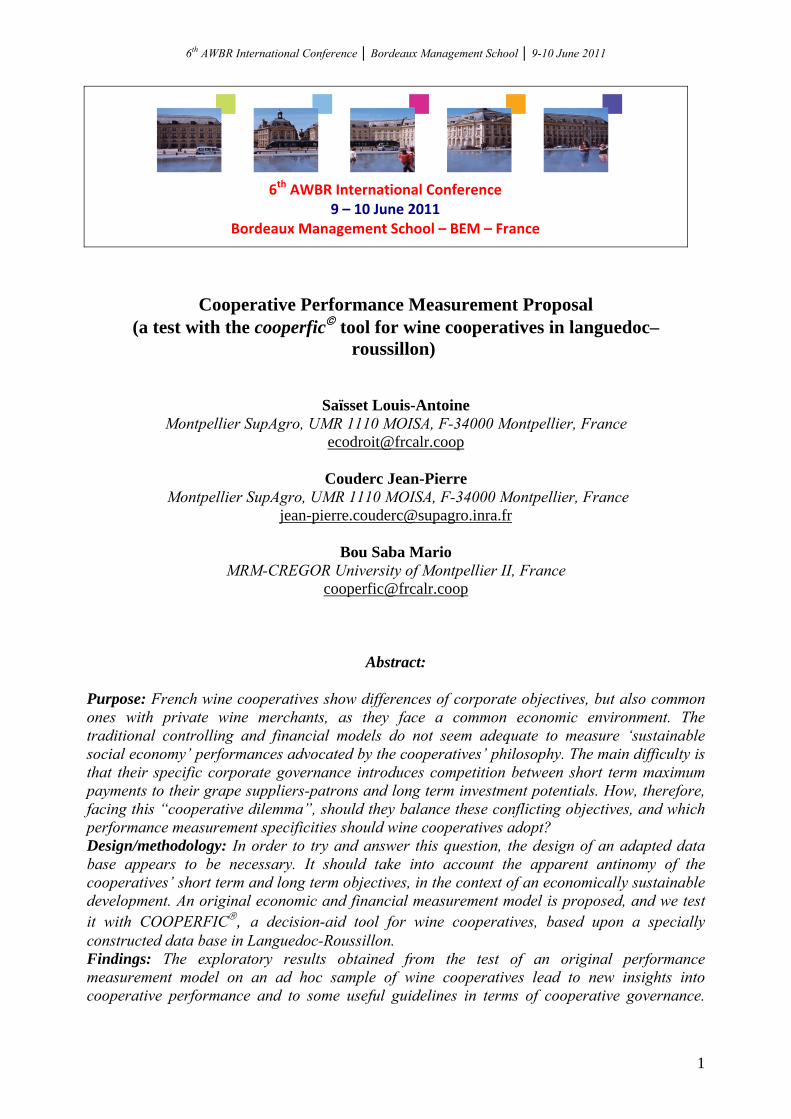
6 th AWBR International Conference │ Bordeaux Management School │ 9-10 June 2011 6 th AWBR International Conference 9 – 10 June 2011 Bordeaux Management School – BEM – France Cooperative Performance Measurement Proposal (a test with the cooperfic © tool for wine cooperatives in languedoc– roussillon) Saïsset Louis-Antoine Montpellier SupAgro, UMR 1110 MOISA, F-34000 Montpellier, France [email protected] Couderc Jean-Pierre Montpellier SupAgro, UMR 1110 MOISA, F-34000 Montpellier, France [email protected] Bou Saba Mario MRM-CREGOR University of Montpellier II, France [email protected] Abstract: Purpose: French wine cooperatives show differences of corporate objectives, but also common ones with private wine merchants, as they face a common economic environment. The traditional controlling and financial models do not seem adequate to measure ‘sustainable social economy’ performances advocated by the cooperatives’ philosophy. The main difficulty is that their specific corporate governance introduces competition between short term maximum payments to their grape suppliers-patrons and long term investment potentials. How, therefore, facing this “cooperative dilemma”, should they balance these conflicting objectives, and which performance measurement specificities should wine cooperatives adopt? Design/methodology: In order to try and answer this question, the design of an adapted data base appears to be necessary. It should take into account the apparent antinomy of the cooperatives’ short term and long term objectives, in the context of an economically sustainable development. An original economic and financial measurement model is proposed, and we test it with COOPERFIC ® , a decision-aid tool for wine cooperatives, based upon a specially constructed data base in Languedoc-Roussillon. Findings: The exploratory results obtained from the test of an original performance measurement model on an ad hoc sample of wine cooperatives lead to new insights into cooperative performance and to some useful guidelines in terms of cooperative governance. 1
Transcript of Cooperative Performance Measurement Proposal (a test with the
6th AWBR International Conference │ Bordeaux Management School │ 9-10 June 2011
6th AWBR International Conference
9 – 10 June 2011 Bordeaux Management School – BEM – France
Cooperative Performance Measurement Proposal (a test with the cooperfic© tool for wine cooperatives in languedoc–
roussillon)
Saïsset Louis-Antoine Montpellier SupAgro, UMR 1110 MOISA, F-34000 Montpellier, France
Couderc Jean-Pierre Montpellier SupAgro, UMR 1110 MOISA, F-34000 Montpellier, France
Bou Saba Mario MRM-CREGOR University of Montpellier II, France
Abstract: Purpose: French wine cooperatives show differences of corporate objectives, but also common ones with private wine merchants, as they face a common economic environment. The traditional controlling and financial models do not seem adequate to measure ‘sustainable social economy’ performances advocated by the cooperatives’ philosophy. The main difficulty is that their specific corporate governance introduces competition between short term maximum payments to their grape suppliers-patrons and long term investment potentials. How, therefore, facing this “cooperative dilemma”, should they balance these conflicting objectives, and which performance measurement specificities should wine cooperatives adopt? Design/methodology: In order to try and answer this question, the design of an adapted data base appears to be necessary. It should take into account the apparent antinomy of the cooperatives’ short term and long term objectives, in the context of an economically sustainable development. An original economic and financial measurement model is proposed, and we test it with COOPERFIC®, a decision-aid tool for wine cooperatives, based upon a specially constructed data base in Languedoc-Roussillon. Findings: The exploratory results obtained from the test of an original performance measurement model on an ad hoc sample of wine cooperatives lead to new insights into cooperative performance and to some useful guidelines in terms of cooperative governance.
1

6th AWBR International Conference │ Bordeaux Management School │ 9-10 June 2011 Results show how the conflict between their short term and long term performances could be balanced, in order for this specific type of firm to reach its economic and social objectives. Practical implications: A conjoint short and long term economic indicators approach illustrates the necessary balance in the cooperative governance, and constitutes a performance measurement model answering some of these wine cooperatives’ Board and management questions. Key words: Wine Cooperatives, Governance, Performance measurement, Indicators, Languedoc-Roussillon
2

6th AWBR International Conference │ Bordeaux Management School │ 9-10 June 2011 INTRODUCTION Cooperatives, a-capitalistic partnerships and solidarity vectors that share the founding values of the Rochdale Society of Equitable Pioneers1 are an integral part of the social economy in the same way as associations, mutual insurance companies, unions and foundations. For this flourishing economic sector, the central concern is to develop collective projects of which the aim is to address the needs and expectations of its members. Its activity is based on “an economic project serving an objective of social utility”, revolving around 215 000 establishments in France in 2007, and representing approximately 8% of GDP (Vercamer, 2010). In 2010, in this sector, there were 2 900 firms within the French agricultural co-operation, representing 40% of the national food industry and of those 715 were wine cooperatives, producing 50% of the volume for total revenues of 4.8 billion €2. Caught in a vice-like grip between the Common Market Organization (Wine CMO) and Common Agricultural Policies (CAP) reforms on the one hand and the increasing globalisation of trade, the rising importance of the new producing countries and changing consumption habits on the other hand, wine cooperatives have to face an unprecedented crisis of adaptation, as does the entire French wine industry. The wine cooperatives, unions and SICA (collective agricultural interest companies) in Languedoc-Roussillon (LR), which, in 2008 represented a total of 330 firms (Saïsset and Bou Saba, 2009) within one of the largest vineyards in the world, account for more than 70% of production and have been particularly affected by this phenomenon since 2004. Indeed, the 2003/2004 campaign, which was marked by a significant drop in bulk production prices, triggered a movement of rapprochement, alliances and mergers - the wine cooperative perimeter having decreased by 27% between 2000 and 2009 – but without being driven by any clear strategic vision. In this context of profound transformation and crisis affecting agricultural cooperation in Languedoc-Roussillon, the FRCA LR (Regional Agricultural Cooperatives Federation) has made available a collective intelligence tool called COOPERFIC©, specifically designed for presidents and directors of agricultural cooperatives in this region. It is thanks to the case of this management tool that the aim of this paper is to question the specificities of performance measurement in wine cooperatives. Indeed, the traditional controlling and financial models, mostly based upon efficiency measures (profit / financial resources), do not seem adequate to answer the objectives of a sustainable social economy advocated by the cooperatives. As a consequence, part 1 of this paper will show why their specific corporate governance introduces competition between short term maximum payments to their grape suppliers-patrons and long term investment potentials, and will define the economic and financial indicators which should be considered to rationalize cooperatives’ internal choices. Part 2 will describe the design of COOPERFIC©, this specific data base which appeared necessary to develop an adapted economic and financial measurement model, and will present the sample and the exploratory results obtained. As far as managerial interest is concerned, we propose some useful guidelines to assist the cooperative governance system, taking into account the apparent antinomy of its short term and long term objectives. In order for this specific type of firm to reach its economic and social objectives, we propose a performance measurement model answering some of these wine cooperatives’ Board and management questions.
1 First (consumer) cooperative, created in 1844, in the Manchester area, by a group of weavers. 2 Source : “Economic and social weight in French agricultural and agri-food cooperation 2010” Coop de France, November 2010.
3

6th AWBR International Conference │ Bordeaux Management School │ 9-10 June 2011 1. THE THEORETICAL QUESTION OF PERFORMANCE MEASUREMENT FOR COOPERATIVES 1.1. Literature review about cooperatives’ performance measures 1.1.1. Corporate performance Based on different theories of the firm which make it possible to define the main conceptions of the company and its objectives, from the neo classic approach to the systemic approach (Koenig, 1998), company performance measures appear to be multiple. This central question of management science can be broken down into five main components deriving from those theories of the firm and their related modes of governance at the crossroads of the economy and management:
- the company as a “black box” in the neo-classical analysis, focused on maximising profit, the unique result pursued by the entrepreneur, arising from the difference between total revenues and implicit and explicit costs (Friedman, 1953).
- the managerial company, focused on the agency relationship between shareholders, holders of property rights, and salaried management (Jensen and Meckling, 1976) focused on the distribution of value between those two categories, resulting in the search for balance concerning maximisation of revenue (growth rate) and profitability of invested capital (Marris, 1963).
- the company as an organisation with multiple decision–makers, referring to behavioural theory (Cyert, 1963; Simon, 1979). Decision-makers are essentially motivated by individual satisfaction behaviour, oriented towards multiple objectives in terms of production, stocks, sales and profit;
- the company as a network of specific contracts based on the neo - institutional theory of transaction costs (Williamson, 1989), the company substituting itself for the market, thus permitting transactions to be internalised and saving on a number of costs;
- the company viewed as an organisational structure (Mintzberg, 1989) but also as a system (Mélèze, 1968; Lemoigne, 1978; Mucchielli, 1998) leading to management by objectives and thus to a multidimensional approach to performance.
In fact, even though a number of researchers have focused on defining it with precision for more than 30 years, (Bouquin, 1986; Bescos et al, 1993; Bourguignon, 1995; Lebas, 1995; Bessire, 1999, among others), firm performance has always been an ambiguous notion that has rarely been explicitly defined. Frequently associated with pure financial logic, in which efficiency is seen as the capacity to make a profit with the least use of resources possible, performance is thus based on indicators ranging from global profitability (results/revenue), return on equity (result/ owners´ equity) or cash flow. It is also calling upon notions based on governance, clearly oriented towards shareholders’ interests with the aim of creating market value, such as Free Cash Flow (Jensen, 1986) or the ‘Economic Value Added’. This unequivocal perspective, focused on financial performance and the preferential satisfaction of shareholders, has been criticised for more than ten years because of its short term logic (Pesqueux, 2002). However, in an increasingly unstable environment that is globalised and characterised by hyper competition (D’Aveni, 1994), it would appear relevant to move towards the measurement of performance at different levels depending on the stakeholders involved: shareholders, clients, employees, public opinion, etc. The approach based on the balanced scorecard future perspective, developed by Norton and Kaplan (1996) presented by its developers as a tool to evaluate strategy and measure performance, is part of this evolution. It is based on a combination of financial and operational
4

6th AWBR International Conference │ Bordeaux Management School │ 9-10 June 2011 measures classified into four dimensions: financial results, client satisfaction, internal processes and organisational learning. However, this operational tool appears, for some, still to favour too much the financial aspects, financial performance being considered the result and the evaluation of the other three strategic dimensions of the company. Thus a notion of global performance has been emerging since the turn of the last century. Defined as “the aggregation of economic, social and environmental performances”, this notion aims to assess the implementation by the company of declared sustainable development strategies, based on alternative, socially responsible, modes of company governance (Pérez, 2003). This multidimensional concept, difficult to measure technically, has led researchers to design new tools: “Sustainability Balanced Scorecard” (SBSC – Hockerts, 2001), “Total Balanced Scorecard” (TBSC – Supizet, 2002), “Triple Bottom Line Reporting” (Elkington, 1997) and “Global Reporting Initiative” (GRI, an advanced standard of reporting in terms of sustainable development, created in 1997). These multi dimensional performance measurement models certainly offer a larger scope to the managers, but do not really clarify possibly conflicting objectives, such as higher salaries to satisfy employees, and higher profit requested by the shareholders, for example. It seems therefore necessary to develop contingent and adapted performance models, depending upon the specific objectives of the prominent stakeholders of a given organisation or firm. 1.1.2. Performance in agricultural and wine cooperatives Cooperatives have common specificities in terms of governance and in the way they operate, with consequences for accounting, management and financial aspects, which differentiate them from other types of firms:
- a cooperative pact based on “a double commitment” of the members – economic , in terms of activity, and financial, in terms of capital subscription (De Charrin, 1989) -also called “user owner principle” (Krivokapic-Skoko, 2002)
- shared accountability between the board and the duo President – Director (Benvenuti, 1982; Lewi and Perri, 2009) leading to an original dual governance.
However, like other types of company, agricultural cooperatives can also be analysed using other theoretical approaches, from the standard economy to the economy of conventions and economic sociology through the new institutional economy (Touzard, 2010). Co-operation is multi-faceted, which leads Mauget (2008) to compare the classical agricultural cooperative, where the risk factor is the product, with the complex holding group, within which the risk factor is the capital employed. Cook & al. (2006 and 2008), in turn, emphasise the differences between the traditional form of cooperatives and the new models of co-operation. They propose 7 different governance modes, integrating the entrepreneurial dimension to varying degrees. They also highlight the notion of “collective entrepreneurship”, and “hybrid” (more market-oriented forms of cooperatives), and the proactive attitude of stakeholders. Based on this diversity, mainly found in the USA, Cook et al (2008) identify two approaches in terms of performance measurement:
- capital remuneration, through an evaluation of prices paid in “traditional cooperatives” ; - share value and the profitability of invested capital in cooperatives based on “collective
entrepreneurship”, as a measurement of the standard of entrepreneurial income derived from carrying the risk at the level of the cooperative structure.
5
6th AWBR International Conference │ Bordeaux Management School │ 9-10 June 2011 However, in other large agricultural countries, where new forms of cooperatives are not so numerous, it is clear that the economic performance of an agricultural cooperative cannot be judged in terms of “classical” indicators, used for other types of firms, like, for example, net result / equity (Forestier and Mauget, 2001), or again profitability- EBIT / revenue (EBITDA / revenue for Declerck and Viviani, 2010). Even if Cadudal and Couderc (2008) analyse companies further down the line in the French wine industry, including wine cooperatives, from the point of view of added value, Amadieu and Viviani (2009), and Maurel (2010) stress that wine cooperatives should be considered separately and recommend the use of different performance criteria. Cames & al. (2001), in a specific study on wine cooperatives in Languedoc-Roussillon, highlight the average remuneration per hectare of members as one of the key criteria of performance levels for wine cooperatives. Couret (2006) meanwhile, presents the calculation of an economic efficiency indicator, called RESECO. When applying it to wine cooperatives in Aquitaine, it is equal to the accounting profit before investment remuneration per unit volume sold, which appears synthetic (global), easy to calculate and comprehend, once a fair “investment remuneration” has been defined. Chabin and Viviani (2007) detail the strategic and prospective performance indicators that relate to wine cooperatives, adapted from Norton and Kaplan (1996) prospective balanced scorecards. Bianchini, Couderc and Marchini (2008) select 6 performance criteria when comparing wine cooperatives in Umbria and Languedoc-Roussillon: sales development, average sales price, share of IG wine on total sales, rate of added value, average remuneration of members (per hectolitre and per hectare). Clearly, there is no real consensus on the way to measure agricultural and wine cooperatives performances, as, in our opinion, there are always two contradictory objectives which should be taken into account when studying these firms, given that these conflicts of interest stem from their own specific internal governance system.
1.2. A proposal for a specific economic performance measurement model for wine cooperatives
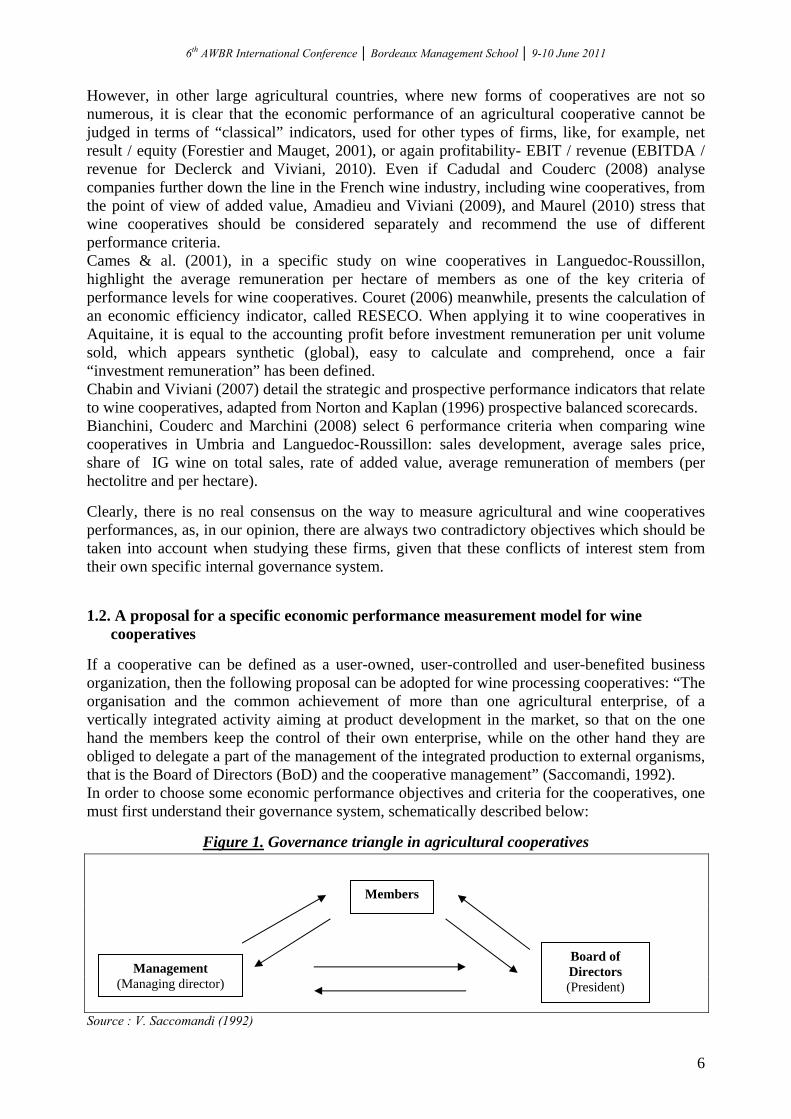
If a cooperative can be defined as a user-owned, user-controlled and user-benefited business organization, then the following proposal can be adopted for wine processing cooperatives: “The organisation and the common achievement of more than one agricultural enterprise, of a vertically integrated activity aiming at product development in the market, so that on the one hand the members keep the control of their own enterprise, while on the other hand they are obliged to delegate a part of the management of the integrated production to external organisms, that is the Board of Directors (BoD) and the cooperative management” (Saccomandi, 1992). In order to choose some economic performance objectives and criteria for the cooperatives, one must first understand their governance system, schematically described below:
Figure 1. Governance triangle in agricultural cooperatives
Members
Management (Managing director)
Board of Directors (President)
Source : V. Saccomandi (1992)
6

6th AWBR International Conference │ Bordeaux Management School │ 9-10 June 2011 The relationships inside the cooperative can be simplified and illustrated with this triangle: the first angle represents the members, who are both the main raw material suppliers and property rights owners of the cooperative; the second the Board of Directors (BoD), composed by a varying number of members-owners electing their President of the Board; and the third the management, formed, at the least, by the managing Director. The members share the strategic control with the BoD, as the management shares the operational and tactical control with the BoD, represented by its President (Benvenuti, 1982). A ‘harmonious’ governance is therefore strongly dependent upon the relationships President-BoD-members on one side, and BoD- President-managing Director on the other. It is a considerably easier task to outline the governance of the firm if we look at a private firm managed by a single owner-entrepreneur than if we take the much more complicated cooperative organisation, because of the complex relationships that exist between the various stakeholders. For example, there is a specific conflict of interest built into the cooperative system: the members are both the firm’s owners and its suppliers of agricultural raw materials. They consequently most often wish to immediately obtain prices higher than the market price for their productions, to the detriment of the cooperative’s long term investments, which are potentially financed by the cooperative reserves, themselves built from its accumulated residual profit. Facing this specific “cooperative dilemma”, the growers-members elected to the BoD, and particularly the President of the Board, in agreement with the management, need to carefully balance short term individual grower-member interest with long term collective value building. This question always generates conflicts between members and managers of the cooperatives. The current market crisis leads to increased distribution of surplus to members of the cooperative and allows farms to overcome a lack of decent revenues. But on the other hand, precisely in view of a market crisis, the cooperatives should innovate and invest in order to create or defend their competitive advantage. On top of the classical “agency costs” question between the growers, co-owners of the cooperative, who try to control their managing director in order to overcome potential conflicts of interest, there is an ‘internal’, built-in, conflict of interest specific to the cooperatives, between the short term higher prices paid to the growers-suppliers and the long term building of a residual profit and cash flow decided by the Board of the same growers-members of the cooperative. Although parallel to the ‘free cash-flow’ problem between the manager and the shareholders, treated by Jensen (1986), which could allow firms' managers to finance projects earning low returns, the question here will be exclusively centred on how to try and understand the way growers-suppliers-owners solve this internal conflict choosing short or longer term revenue, leaving aside the more classical “agency costs” problem between the cooperative manager and cooperative members. When focusing on the wine cooperatives of the Languedoc-Roussillon region, the question becomes, therefore, how to balance:
- A short term objective: to maximise farmers’ revenues (price of grapes purchased paid by the cooperative). A reasonable objective should at least be to cover the full costs (including the farmer’s salary) of cultivating a vineyard. The remuneration for the grapes delivered / hectare cultivated should therefore be higher than the costs incurred… Assuming that 4 000 € is the average revenue estimated to justify the costs and the work on one hectare of a ‘standard’ vineyard, the cooperatives remunerating their members at
7

6th AWBR International Conference │ Bordeaux Management School │ 9-10 June 2011
a level inferior to 4 000 €/hectare do not ‘satisfy’ the members: they cannot cover their full expenses (amortizations included) and pay themselves a ‘basic’ salary of 1 200 € per month (a cost of about 20 000 € per year, including social contributions expenses), when cultivating their 20 hectares vineyard (average size for a grower-member in Languedoc-Roussillon) (Montaigne & al., 2006).
- A long term objective: to keep some profit within the cooperative, to be reinvested (innovation, brand, international development, etc.), in order to improve the competitive positioning of the cooperative’s wines and therefore the price of goods sold (and, hopefully, the price of grapes purchased) in the future. Given that these wine cooperatives have made an important and recent investment in their wine-making capacities, they show relatively large amounts of amortization costs (6% on sales on average). An assumption of no loss (0 % net profit on sales) to be deducted from the cooperative reserves would therefore give a comparatively ‘competitive’ level of a 5% to 6% cash flow (and slightly higher than the private French wine firms and wine merchants which delivered about a 5% cash flow on sales in the year 2006 (Cadudal and Couderc, 2008).
A balanced analysis of cooperatives’ performance should rely on the use of both those financial and economic indicators. It should be mentioned that the financial ratios based on "Earnings before interest and tax" (EBIT) or "Profit" have not been judged by the academic literature as really relevant to estimate cooperative performances, because residual value claim, i.e. cooperative dividend distribution to the growers, generally, is not authorized in these organisations. At a first glance, creating a surplus to be kept within the cooperative therefore appears to be only secondary to the highest possible payment of the grapes brought by the growers-owners. Over the past fifteen years, the main part of the wine cooperatives in Languedoc-Roussillon have undertaken continuous and significant, even massive, tangible investments in order to go on improving wine making and adapting product quality to cope with market demand - a “profound transformation” following massive replanting of vineyards, described by Touzard and Laporte (1998) -. Thus, this current important level of amortization, representing a main part of fixed costs, should be taken into account, as it largely influences cash-flow and the creation of internal resources, allowing cooperatives to undertake new projects and developments. Notwithstanding this current high level of amortization, however, only a retained profit will, in the long run, allow the cooperative to undertake some risky future investment, and should be sought! Are these objectives of higher remuneration of growers and higher cash flow really contradictory? They indeed create a conflict between an improved short term revenue for the farmers-patrons, and a better sales value creation in the long term when reinvesting the surplus. But this apparent opposition could be solved with a better economic education of the BoD members, as the correct question is: which share of the value created should be kept within the firm in order to avoid a downgrading of the cooperative management evaluation, leading to a loss of grower-members on the one hand and to promote the undertaking of profitable investments in order to increase the firm’s economic efficiency on the other hand?
8
6th AWBR International Conference │ Bordeaux Management School │ 9-10 June 2011 2. THE DESIGN OF THE COOPERFIC© DATA BASE AND EMPIRICAL RESULTS OBTAINED FROM THE SPECIFIC MODEL 2 .1. History and design of COOPERFIC©, a management tool appropriation question
In 2004, a harsh economic crisis hit the wine sector of Languedoc-Roussillon. Since then, the wine cooperatives have been facing serious problems in terms of maintaining suitable levels of payment for growers-members, stopping the uprooting of vines and profitably commercializing their products. Committed to the protection of wine cooperatives’ economy, their federation (FRCA LR), supported by the Languedoc-Roussillon Region, initiated in 2006 a project with the Universities of Montpellier to create a management tool dedicated to cooperatives’ directors, in order to develop their strategic management competencies and particularly through benchmarking, but also to anticipate restructuring plans and mergers, and to improve cooperatives’ performance. At the same time the FRCA-LR targeted a sample of 19 volunteer wine cooperatives which identified specific “scorecard axes3”. In 2007 - 2008, performance indicators were constructed and affected to the various agricultural sectors4 (wine, olives, fruit and vegetables…). In 2009 questionnaires were elaborated and economic and financial data5 were collected in order to feed the COOPERFIC© database and make it operational. At the beginning of 2010, the tool was accessible online and 80 cooperatives6 joined the project, allowing their directors to access a board of 12 financial performance indicators. Currently, cooperatives directors can check in and visualize the evolution of indicators over the years; they can also run a benchmark by comparing their own economic information to the regional average of other cooperatives.
A complex reality was emerging, according to the approach “Network of Stakeholders” analyzed by Muchielli (1998), from the cross relationships between institutions, individuals and objects, as shown in the diagram in Exhibit 1. This type of tool, due to its new “information system” characteristics, and the way it is made available (on line), has never been tested before in the agricultural cooperative sector in France7 Thus, taking into account Chiffoleau and Touzard’s research (2007) about localised agri-food business systems (SYAL)8of LR, revealing interactions between wine cooperatives managers of the area around Béziers, mainly focused on technology and politics and rarely on sales and management, it also raises question on the adoption of such computerised management software tools. Indeed, following the emergence of information systems, there has been considerable debate about the effects of the usage of ICT (information and communication technologies) on managers. The question of passive use of ICT has been raised, considering that managers are only passive users, as they have no power to decide how ICT should be utilised. (Leavitt and
3 “Score card Axes” are inspired by Kaplan and Norton’s (1996) work on “balanced score card”; these axes were adapted to fit to the organizational aspects and managerial specificities of agricultural cooperatives. They are: Financial axis, Commercial axis, Human resources axis, Governance axis, Production axis and Process axis. 4 Even though COOPERFIC© tool contains performance indicators related to several cooperative sectors, our study concerns only the wine performance indicators. 5 Main Source: Diane (SCRL) Database, covering 75% of the agricultural cooperative perimeter of LR region. 6 80 « Interactive Cooperatives », accepted the e-convention proposed by COOPERFIC© and joined the project. 7 We have been able to identify some limited constructions of data bases carried out by the wine observatory of the Hérault department and the Ministry of Agriculture. A study has been carried out by Montpellier Supagro and INRA in 2003 on a national basis, bringing methodological contributions towards the creation of a wine observatory in LR, but this project never materialised. 8 Definition: production and service organisations (agricultural production units, agri-food, commercial, service enterprises, etc.) associated based on their characteristics, and their operating modes in a specific locality. The context, the products, people, their institutions, their know-how, their behaviour, their networks, combine together in a given area to produce a form of agri-food organisation on a given spatial scale” (CIRAD-SAR, 1996)
9
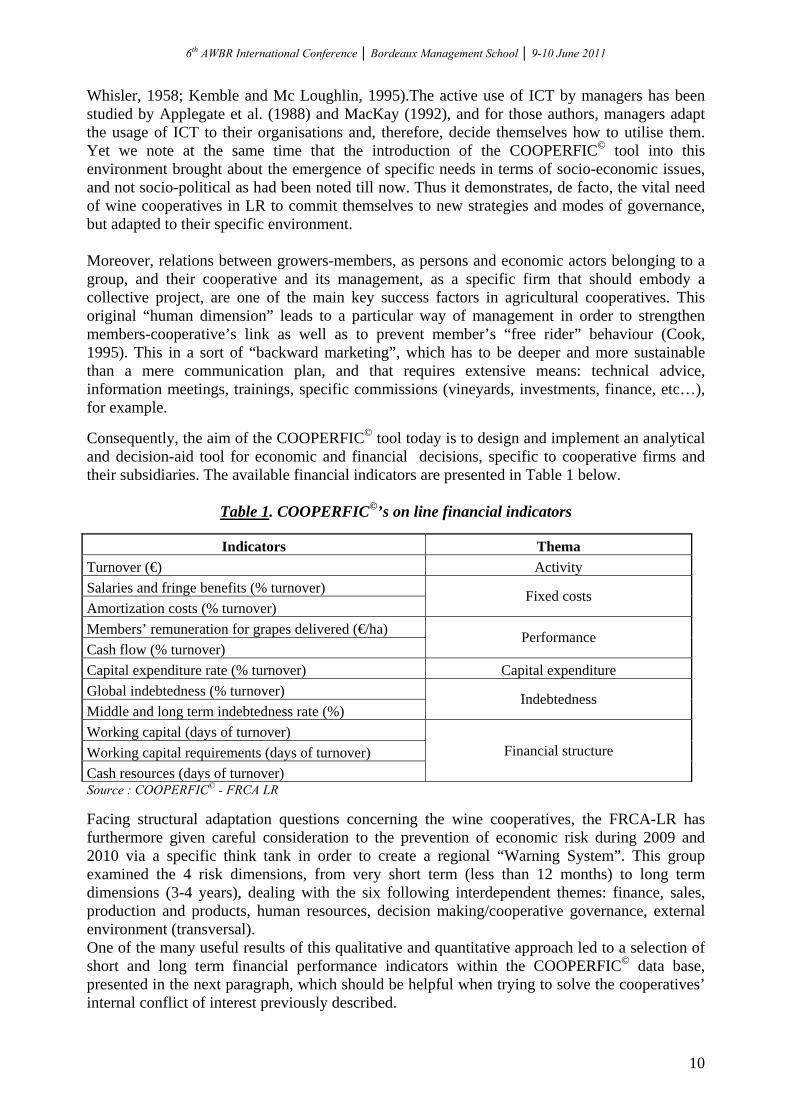
6th AWBR International Conference │ Bordeaux Management School │ 9-10 June 2011 Whisler, 1958; Kemble and Mc Loughlin, 1995).The active use of ICT by managers has been studied by Applegate et al. (1988) and MacKay (1992), and for those authors, managers adapt the usage of ICT to their organisations and, therefore, decide themselves how to utilise them. Yet we note at the same time that the introduction of the COOPERFIC© tool into this environment brought about the emergence of specific needs in terms of socio-economic issues, and not socio-political as had been noted till now. Thus it demonstrates, de facto, the vital need of wine cooperatives in LR to commit themselves to new strategies and modes of governance, but adapted to their specific environment. Moreover, relations between growers-members, as persons and economic actors belonging to a group, and their cooperative and its management, as a specific firm that should embody a collective project, are one of the main key success factors in agricultural cooperatives. This original “human dimension” leads to a particular way of management in order to strengthen members-cooperative’s link as well as to prevent member’s “free rider” behaviour (Cook, 1995). This in a sort of “backward marketing”, which has to be deeper and more sustainable than a mere communication plan, and that requires extensive means: technical advice, information meetings, trainings, specific commissions (vineyards, investments, finance, etc…), for example. Consequently, the aim of the COOPERFIC© tool today is to design and implement an analytical and decision-aid tool for economic and financial decisions, specific to cooperative firms and their subsidiaries. The available financial indicators are presented in Table 1 below.
Table 1. COOPERFIC©’s on line financial indicators
Source : COOPERFIC© - FRCA LR
Indicators Thema Turnover (€) Activity Salaries and fringe benefits (% turnover) Amortization costs (% turnover)
Fixed costs
Members’ remuneration for grapes delivered (€/ha) Cash flow (% turnover)
Performance
Capital expenditure rate (% turnover) Capital expenditure Global indebtedness (% turnover) Middle and long term indebtedness rate (%)
Indebtedness
Working capital (days of turnover) Working capital requirements (days of turnover) Cash resources (days of turnover)
Financial structure
Facing structural adaptation questions concerning the wine cooperatives, the FRCA-LR has furthermore given careful consideration to the prevention of economic risk during 2009 and 2010 via a specific think tank in order to create a regional “Warning System”. This group examined the 4 risk dimensions, from very short term (less than 12 months) to long term dimensions (3-4 years), dealing with the six following interdependent themes: finance, sales, production and products, human resources, decision making/cooperative governance, external environment (transversal). One of the many useful results of this qualitative and quantitative approach led to a selection of short and long term financial performance indicators within the COOPERFIC© data base, presented in the next paragraph, which should be helpful when trying to solve the cooperatives’ internal conflict of interest previously described.
10

6th AWBR International Conference │ Bordeaux Management School │ 9-10 June 2011 2.2. Presentation of the sample and variables used to test specific wine cooperatives
performance measurements This analysis of cooperative performance has been based on an ad hoc sample of 45 wine cooperatives (the ones among the 80 which displayed a complete set of relevant variables, during this phase of the data base construction), associated to the– “Interactive Cooperatives”. In the following table we describe the main features of this sample:
Table 2. Characteristics of the wine cooperatives sample
COOPERFIC© Number of cooperatives 45 Survey period November 2010 to January 2011 Type of survey COOPERFIC© financial data
Geographic repartition (districts)
- Aude 13 - Hérault 15 - Gard 13 - Pyrénées Orientales 4
Main product sold (vol. > 60% for bulk or bottle)
- Bulk wine 22 - Bottled wine 10 - Mixed wine sales 13
Concerning performance measurement, we made a selection of indicators based on the specific cooperative’s model as described in part 1.2. Both the selection and the model contain some financial and economic indicators, in order to characterize the “cooperative dilemma”. The short and long term terms dimensions of these indicators will allow us to test whether their peculiar governance is able (or not) to ‘balance’ the immediate individual growers’ objective with the firm’s future potentialities. In a cooperative Profit and Loss Statement, the first deduction from the sales turnover comes from the purchase of grapes to the growers-suppliers, who also are the owner-members of this collectively owned firm. The first desire of these ‘special’ suppliers is to obtain the highest possible price for each ton of grapes delivered to the cooperative cellar, as it constitutes their own private grape growing farm revenue. But the higher the price paid for these purchases, the lower the added value will become, and the lower the residual value or profit. Then, in a similar way to the agency classical conflicts of interest, the growers-members, in a more direct way, also compete with the management and employees for revenues, which can certainly explain their reluctance to hire ‘too much’ new and more competent talent. Consequently, for the purpose of testing this specific economic performance measurement model for wine cooperatives, the variables chosen to illustrate the “short term approach” tackle the value repartition of the wine sector ‘backward’, as farmers’ revenues maximisation first comes from an optimal immediate remuneration and/or minimum fixed costs, whereas the “long term approach” deals with the relative positioning in the wine sector ‘forward’ at the level of the firm (higher sales price and turnover, leading to higher cash flow). The hypothesis there is that value creation ‘forward’ will however spread all over the wine chain and the growers-members remuneration in the long run, given that pertinent investments and sales development will be permitted by a sufficient cash flow production.
short term approach : grape grower’s remuneration level - remuneration for the grapes delivered/hectolitre (€/hl)
11
6th AWBR International Conference │ Bordeaux Management School │ 9-10 June 2011
- remuneration for the grapes delivered/hectare cultivated (€/ha) - fixed costs9/hectolitre (€/hl) - fixed costs/turnover (%)
long term approach : the level of the firm and value chain sustainability - mean price/hectolitre (€/hl) - sales turnover/hectare cultivated (€/ha) - cash flow10/turnover (%) - cash flow/hectare cultivated (€/ha) - cash flow/hectolitre (€/hl) - cash flow/[amortizations + provisions] (%)
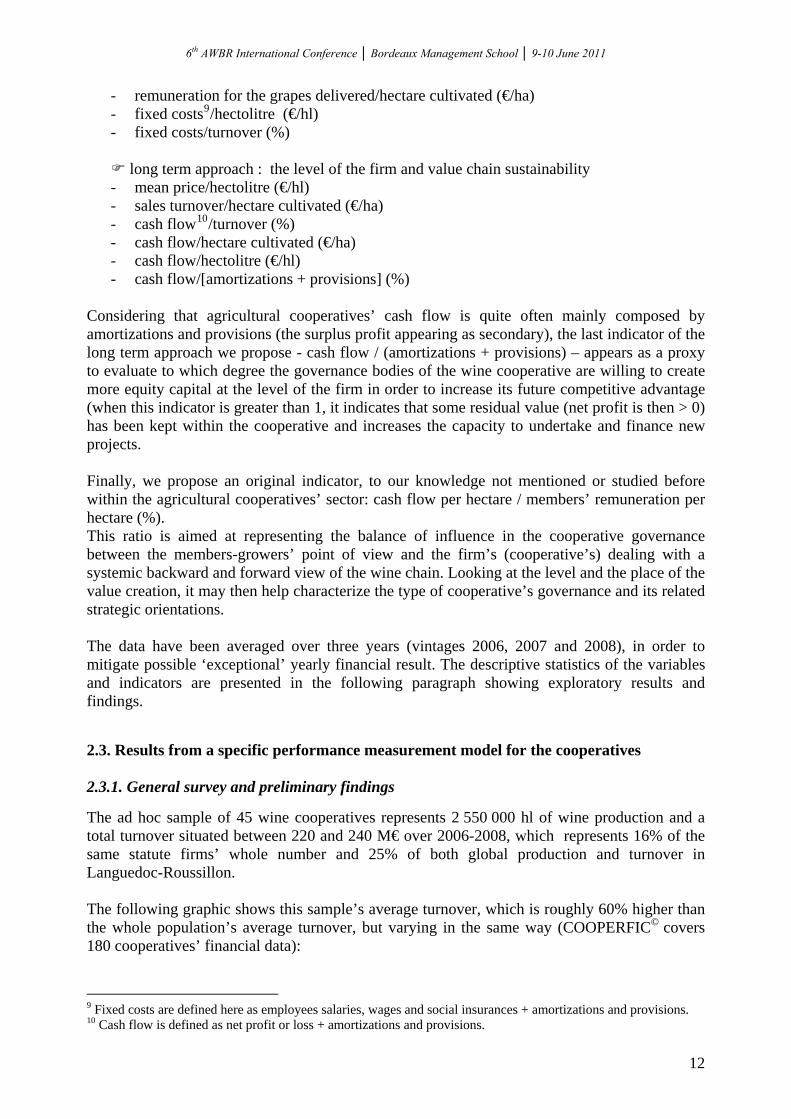
Considering that agricultural cooperatives’ cash flow is quite often mainly composed by amortizations and provisions (the surplus profit appearing as secondary), the last indicator of the long term approach we propose - cash flow / (amortizations + provisions) – appears as a proxy to evaluate to which degree the governance bodies of the wine cooperative are willing to create more equity capital at the level of the firm in order to increase its future competitive advantage (when this indicator is greater than 1, it indicates that some residual value (net profit is then > 0) has been kept within the cooperative and increases the capacity to undertake and finance new projects. Finally, we propose an original indicator, to our knowledge not mentioned or studied before within the agricultural cooperatives’ sector: cash flow per hectare / members’ remuneration per hectare (%). This ratio is aimed at representing the balance of influence in the cooperative governance between the members-growers’ point of view and the firm’s (cooperative’s) dealing with a systemic backward and forward view of the wine chain. Looking at the level and the place of the value creation, it may then help characterize the type of cooperative’s governance and its related strategic orientations. The data have been averaged over three years (vintages 2006, 2007 and 2008), in order to mitigate possible ‘exceptional’ yearly financial result. The descriptive statistics of the variables and indicators are presented in the following paragraph showing exploratory results and findings. 2.3. Results from a specific performance measurement model for the cooperatives 2.3.1. General survey and preliminary findings The ad hoc sample of 45 wine cooperatives represents 2 550 000 hl of wine production and a total turnover situated between 220 and 240 M€ over 2006-2008, which represents 16% of the same statute firms’ whole number and 25% of both global production and turnover in Languedoc-Roussillon. The following graphic shows this sample’s average turnover, which is roughly 60% higher than the whole population’s average turnover, but varying in the same way (COOPERFIC© covers 180 cooperatives’ financial data):
9 Fixed costs are defined here as employees salaries, wages and social insurances + amortizations and provisions. 10 Cash flow is defined as net profit or loss + amortizations and provisions.
12

6th AWBR International Conference │ Bordeaux Management School │ 9-10 June 2011
Figure 2. Wine cooperative’s sample vs all cooperative sector in LR average turnover evolution
0
1 000 000
2 000 000
3 000 000
4 000 000
5 000 000
6 000 000
06/07 07/08 08/09
Sample Languedoc-Roussillon
Source : COOPERFIC© - FRCA LR
There is a great heterogeneity among these 45 cooperatives which receive grapes from vineyards varying from about 200 up to 3 000 ha, with a median yield of 60 hl per ha, therefore producing around 50 000 hectolitres. Their average turnover (2006-2008), just above 5 million euros, results in an average net loss (and, at best, an almost null residual value), and both these variables show quite a large standard deviation. These generalized losses over 2006-2008 confirm that, when facing market difficulties, the trade-off between the remuneration of the growers-members and the building of capital reserves for future new projects of these cooperatives massively bends in favour of the short term higher payment to the cooperatives’ patrons…
Table 3. Main statistics for structural characteristics of the wine cooperatives sample (06-08)
N Mean Median Sum Minimum Maximum Stand. Deviation
Surface (ha cultivated) 45 1 000 855 44 991 197 3 008 700Volume produced (hl) 45 56 709 49 798 2 551 921 12 166 202 011 42 113Average yield per ha 45 57 60 2 565 27 80 13
Turnover (€) 45 5 160 616 3 721 207 232 227 732 671 361 27 039 739 5 127 652Profit (€) 45 -223 406 -77 316 -10 053 290 -4 139 809 47 537 626 366
This growers-members demand for higher remuneration of their grapes appears fully justified when analyzing the variables chosen to represent the short term and long term approaches we suggest. Over the 45 cooperatives studied, the average (06-08) grape-growers remuneration of 2 737 € per hectare has been clearly insufficient to meet the 4 000 € per ha needed to cover their full cultivation costs. With such low payment for their grapes, as they cannot pay themselves any salary , nor account for a normal amortization of their farms (the other operating expenses having already drawn all the cash they received), one can easily understand that they cannot imagine lowering it for longer terms purposes! More generally, concerning these short term and long term variables, an F test of means to verify the impact of size, type of production quality standard (protected origin or not) and type of product sold (bulk and bottles), which appear as important control variables, showed significant non parametric differences only for the type of product sold: the grape growers remuneration went up from 41 € per hl and 2 579 € per ha for bulk to 76 € per hl and 3 279 € per ha for bottles. This means that a downward integration strategy can possibly improve their revenues, but, on average, stays far from being satisfactory or even bearable…
13

6th AWBR International Conference │ Bordeaux Management School │ 9-10 June 2011 2.3.2. Short term approach With an average price per hectolitre of about 50 €, for an average yield of less than 60 hl per ha cultivated, one can understand that the average remuneration received by the cooperative patrons, well under the necessary 4 000 €/ha for an average 20 ha vineyard, is far from sufficient for the farm to be ‘viable’, as demonstrated by Montaigne & al. (2006). It can explain the interest of the vested interest of these cooperatives Boards to keep the firm’s fixed costs at the lowest possible level, when they can vary so widely from 6.35 € to 413.66 € per hl (and with a high standard deviation). It might be a false question, however, as, when standardized by the sales turnovers, these fixed costs, which average about 20%, show a relatively very low standard deviation of less than 7%.
Table 4. Main statistics for the short term approach indicators (06-08)
Short term approach
Grape growers remuneration
per hl (€)
Grape growers remuneration
per ha (€) Fixed costs
per hl % Fixed costs/
Turnover N 45 45 45 45Mean 51.72 2 737 26.10 20.45%Median 43.25 2 644 13.35 19.04%Minimum 26.66 1 539 6.35 11.11%Maximum 195.00 5 610 413.66 47.32%Stand. Deviation 27.95 869 60.19 6.84%
As far as “wine making costs” and more particularly fixed costs are concerned, we can observe that no correlation (see Exhibit 2: Table of bi-lateral correlations for the main variables and indicators of the research) exists between the size of the cooperative (wine volume of production level) and fixed costs per hectolitre, given that the correlation coefficient is hardly -0.11 and not significant, whereas many grape growers and cooperative directors highlight the necessary economies of scales coming from an increasing volume of production in order to face national and international competition. It seems this mean of raising competitiveness doesn’t apply to all kinds of wine cooperatives and certainly depends on their strategic orientations. In fact, quite often, the bigger the cooperative’s size, the more staff it requires, particularly to develop new management functions arising from their increasing activity (e.g. backward relations, accounting control, normalisation, coordination, etc.). This indicator, as well as the % of fixed costs on sales turnover, reaches a highly positive and significant level (respectively 0.706 and 0.428), however, when compared to the sales turnover. This reflects the fact that some fixed costs (product, process or organizational innovation, marketing, sales management, etc.) can help build a real ‘value creation’ for the bulk or bottle sold, although they do not always lead to a higher profit for the cooperative. It consequently appears that members’ payment is paradoxically in close and positive significant correlation with fixed costs if we compare remuneration for the grapes delivered/hectolitre and fixed costs/hectolitre (€/hl) or % of fixed costs on sales turnover (respectively 0.835 and 0.398). This statement of fact tends to prove that these two indicators must not systematically be opposed in a reduction costs’ unequivocal perspective which appears to be too simplistic and may even be value destroying. In this way, tangible (amortizations) and intangible (job creation and human capital) investments seem to improve short term economic efficiency via co-operators remuneration. Therefore, many grape growers’ obsession of aiming at a strict costs decrease, through a focused benchmark on “wine making costs”, in order to maximize their revenue may be incoherent and even counter productive.
14

6th AWBR International Conference │ Bordeaux Management School │ 9-10 June 2011 2.3.3. Long term approach The current crisis has particularly hit the Languedoc-Roussillon region, and wine prices have fallen far below the necessary levels to insure a decent living for the average growers-members of the cooperatives. It averages 62 €/hl, for example, for bulk sales in this ad hoc sample, leading in this case to a turnover of 3 850 € per ha cultivated, inferior to the full costs to produce the grapes, and notwithstanding the cooperative wine-making costs (11.50 € per hl for bulk). One can therefore easily understand that the cooperatives’ boards will vote for the highest possible price to be paid for the grapes produced by their suppliers-members, and forget all potentially fruitful long term expenses or investments… The average 6% amortization on sales is not even covered to result in the acceptance of a net loss, reducing the average cash flow on sales to a mere 3% (although still representing almost 6% of a ‘poor’ growers remuneration), and the weight of the final average cash flow on these amortizations does not reach 1 (which would reflect a null profit).
Table 5. Main statistics for the long term approach indicators (06-08)
Long term approach
Mean price per hl sold (€)
Turnover per ha
% Cash Flow /
Turnover
Cash Flow per
ha (€)
Cash Flow per
hl (€)
% Cash Flow / Amortization
Provision
% Cash Flow/Grape
growers remuneration
N 45 45 45 45 45 45 45Mean 103.17 4 967 3.04% 156 2.62 42.38% 5.71%Median 69.12 4 195 4.41% 209 3.44 68.70% 7.63%Minimum 37.54 2 705 -25.84% -979 -29.44 -477.82% -30.73%Maximum 873.89 23 866 9.17% 858 31.50 132.40% 20.49%Stand. Deviation 124.71 3 243 6.66% 292 7.67 96.82% 10.30%
The higher the price per hectolitre sold, however, the higher the expected cash flow/hl (significant correlation coefficient of 0,472, and similar correlations can be observed for the other cash flow indicators), which would suggest that when a ‘decent’ remuneration of the growers-members is reached, the cooperatives boards agree to reserve and affect some of the value created to longer term objectives. The turnover per hectare, to a lesser degree, as it might be linked to the ‘hectomaniac’ strategy described below, confirms this finding. 2.3.4. Relations and balance between short term and long term approach The grape-growers remuneration per hectolitre is obviously highly dependent on the mean price per hl sold by the cooperatives (significant correlation coefficient of 0.912), and relatively independent (negative non significant correlation) of the volume of wine they produce. The always higher ‘critical size’ motto seem to lead to an ‘hectomaniac’, and cost fighting attitude which does not produce the expected ‘higher value’ for the growers-members of the cooperatives in Languedoc-Roussillon . Obviously, as prices stay low, the members remuneration drops, even if the boards decide to create a loss when distributing previous capital reserves to the growers, and sacrificing the cash flow level, as shown in Figure 3 below. This is in fact acting traditionally for the cooperatives,
15

6th AWBR International Conference │ Bordeaux Management School │ 9-10 June 2011 smoothing over bad vintages, appearing as a crisis cushion, on condition that these setbacks do not last too long …
Figure 3. Evolution of cash-flow and member’s payment
0,0%
1,0%
2,0%
3,0%
4,0%
5,0%
6,0%
7,0%
8,0%
06/07 07/08 08/091 5001 7001 9002 1002 3002 5002 7002 9003 1003 3003 500
Cash Flow (%) Member's payment (€/ha)
Source : COOPERFIC© - FRCA LR Coming back to the growers’ remuneration, the first and most important short term indicator of cooperative economic health, it clearly appears that it is linked (significant correlation coefficient of 0.535) to the mean price per hectolitre sold. Figure 4 below shows that only 3 out of the 45 cooperatives studied reach the 4 000 € minimum target level of average remuneration per hectare over the years 2006 to 2008.
Figure 4. Balance between valorisation level (mean price/hl) and member’s payment
6 000 Members’ payment (€/ha) 5 500
5 000 4 500
4 000 0.00 200.00 250.00 50.00 100.00 150.003 500
Valorisation’s level (€/hl) 3 000
2 500 2 000
1 500 1 000 Furthermore, crossing the two indicators which are the more emblematic ones as far as the two approaches of wine cooperatives performance are concerned, leads us to distinguish three main groups of firms with different balances and dynamics, as shown below.
16
6th AWBR International Conference │ Bordeaux Management School │ 9-10 June 2011
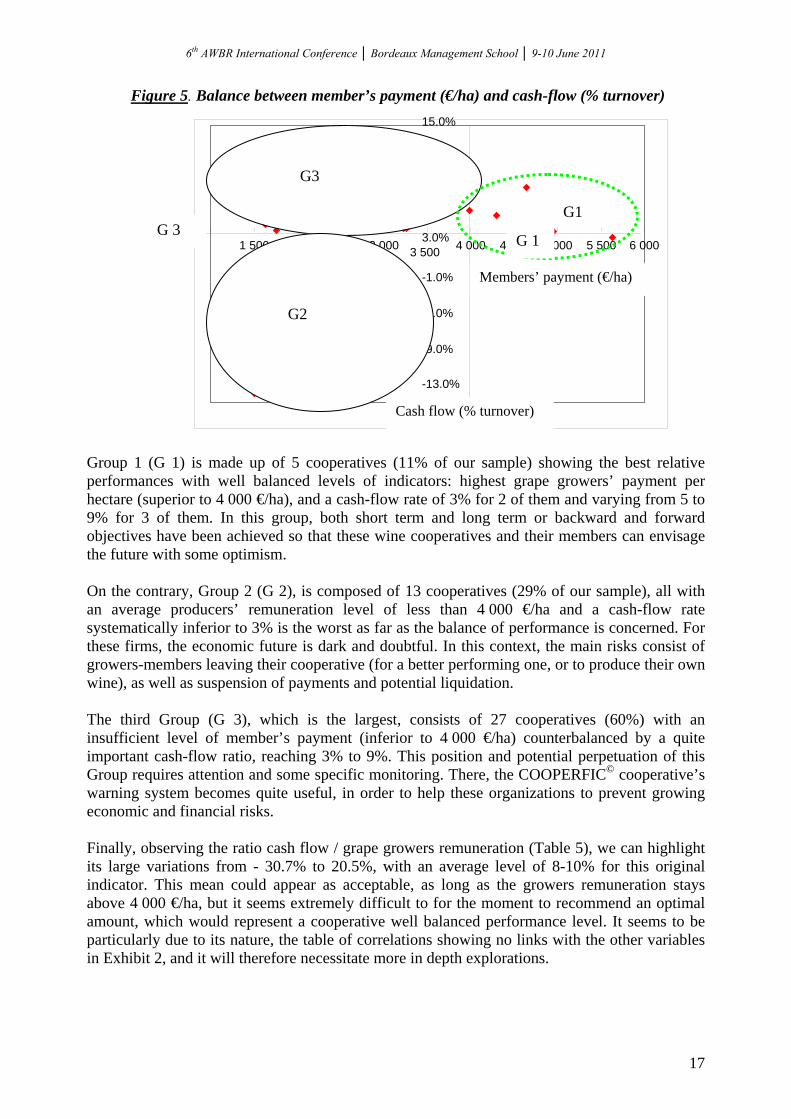
Figure 5. Balance between member’s payment (€/ha) and cash-flow (% turnover)
-13.0%
-9.0%
-5.0%
-1.0%
3.0%
7.0%
11,0%
15.0%
1 500 2 000 2 500 3 000 3 500 4 000 4 500 5 000 5 500 6 000
G3 G1 G 3
G 1
Members’ payment (€/ha)
G2 Cash flow (% turnover) Group 1 (G 1) is made up of 5 cooperatives (11% of our sample) showing the best relative performances with well balanced levels of indicators: highest grape growers’ payment per hectare (superior to 4 000 €/ha), and a cash-flow rate of 3% for 2 of them and varying from 5 to 9% for 3 of them. In this group, both short term and long term or backward and forward objectives have been achieved so that these wine cooperatives and their members can envisage the future with some optimism. On the contrary, Group 2 (G 2), is composed of 13 cooperatives (29% of our sample), all with an average producers’ remuneration level of less than 4 000 €/ha and a cash-flow rate systematically inferior to 3% is the worst as far as the balance of performance is concerned. For these firms, the economic future is dark and doubtful. In this context, the main risks consist of growers-members leaving their cooperative (for a better performing one, or to produce their own wine), as well as suspension of payments and potential liquidation. The third Group (G 3), which is the largest, consists of 27 cooperatives (60%) with an insufficient level of member’s payment (inferior to 4 000 €/ha) counterbalanced by a quite important cash-flow ratio, reaching 3% to 9%. This position and potential perpetuation of this Group requires attention and some specific monitoring. There, the COOPERFIC© cooperative’s warning system becomes quite useful, in order to help these organizations to prevent growing economic and financial risks. Finally, observing the ratio cash flow / grape growers remuneration (Table 5), we can highlight its large variations from - 30.7% to 20.5%, with an average level of 8-10% for this original indicator. This mean could appear as acceptable, as long as the growers remuneration stays above 4 000 €/ha, but it seems extremely difficult to for the moment to recommend an optimal amount, which would represent a cooperative well balanced performance level. It seems to be particularly due to its nature, the table of correlations showing no links with the other variables in Exhibit 2, and it will therefore necessitate more in depth explorations.
17
6th AWBR International Conference │ Bordeaux Management School │ 9-10 June 2011 DISCUSSION OF RESULTS AND CONCLUSION The review of the literature concerning the performance and governance of cooperatives shows that in this type of firm, there still exists an unresolved question of performance measurement. The financial ratios, mostly based upon efficiency measures (profit / financial resources), do not seem adequate to estimate cooperative performances. Due to a specific “double commitment” as grower-suppliers and member-owners of their patrons, cooperatives face a problem of dual performance objectives (short term remuneration for the growers, long term value creation for the owners) and find it difficult to establish balanced governance in order to solve this internal conflict of interests, that we call the “cooperative dilemma”. The economic crisis in the wine sector exacerbates the practical question of how to balance economic indicators such as a short term grower remuneration higher than 4 000 € per hectare with a minimum 5% longer term cash flow on sales in the Languedoc-Roussillon wine cooperatives. The test of this specific model, designed thanks to COOPERFIC©’s decision-aid tool, has confirmed that both the average growers’ remuneration and the cooperatives’ cash flow are insufficient, as only 5 out of the 45 cooperatives studied reach these indicators levels. All the other cooperatives fail to satisfy their suppliers-members’ need for a decent revenue, and 13 of them have sacrificed their long term interests and distributed their previously accumulated capital reserves in order to smooth over the detrimental effects of low prices on the wine market. Quite clearly, this exploratory research is also showing that growers’ remuneration is linked to a higher price obtained for their sales of bulk or bottled wine, much more than a reduction of fixed costs, which, in the long run, would condemn more value creation for the cooperative patrons. When the price per hectolitre sold increases, the higher the expected cash flow becomes, which suggests that when a satisfactory revenue for the cooperatives’ growers-members is reached, their boards tend to agree to affect some of the value created to their capital reserves and to longer term objectives. This study proposes a model based on short and long term economic indicators, which can help cooperative managers and boards reach balanced decisions. But it also shows that a larger size does not produce the expected economies of scale. Public and professional institutions spend a lot of efforts to convince many Languedoc-Roussillon cooperatives to merge or associate. They should also take into account the question of those cooperatives’ potential tangible and particularly intangible (marketing, sales organization, etc) investments, in order to create more value for their products and their patrons in the long run. The COOPERFIC© tool therefore appears to be an appropriate mean to measure and analyse, beyond the merely financial dimension, cooperatives’ global performance. It will allow developing, as far as needed, suited indicators related to the various axes of a sustainable social economy performance. In this way, COOPERFIC© can be seen as a pertinent and pedagogic management tool, offering cooperatives Presidents and directors a specific benchmark in order to better run their company, bearing in mind both members and firm interests. However, this original tool entails its own limits: it must be used by a significant number of cooperatives to be adapted, and should regularly be updated, as existing gap between on line’s indicators and cooperatives’ present situation can be prejudicial. It follows that this exploratory research is obviously limited because of the small actual number of adhering cooperatives. It should therefore be completed in the future with a larger survey, including more wine cooperatives. Finally, it should also be enhanced in the near future by also using non financial indicators in order to have a vision of global and sustainable performance (economic, social and
18

6th AWBR International Conference │ Bordeaux Management School │ 9-10 June 2011 environmental), taking into account specific strategic groups of cooperatives or specific productions (wines of guaranteed origin or not). REFERENCES Amadieu, P., Viviani, J.L. (2009), “Intangible expenses: a risk management tool for the French wine industry ?”, working paper, CR2M, University of Montpellier, Montpellier, June. Applegate, L.M., Cash, J.I.,Mills, D.Q., (1988), “Information Technology and Tomorrow's Manager”, Harvard Business Review, Vol. 66, No 6, pp. 128-136. Benvenuti, B., a cura di (1982), “I problemi dell’imprenditorialità agricola nell’integrazione cooperativa”, AIPA, Bologna, IT. Bescos, P., Dobler, P., Mendoza, C., Naulleau, G. (1993), Contrôle de gestion et management, Monchrestien, Paris, France. Bessire, D. (1999), “Définir la performance”, Comptabilité-Contrôle-Audit, september, pp. 127-150. Bianchini, S., Couderc, J.P., Marchini, A. (2008), “Wine Cooperatives performance determinants : a comparative analysis between Italy and France”, Competitive paper, AIEA2 International Conference, Bologna, pp. 8-30. Bouquin, H. (1986), Le contrôle de gestion, Presses Universitaires de France, Paris, France. Bourguignon, A. (1995), “Peut-on définir la performance ?”, Revue Française de comptabilité, juillet-août, pp. 61-66. Cadudal F., Couderc, J.P. (2008), “Analyse financière des structures aval de la filière viti-vinicole française – Entreprises et coopératives 1998-2007”, Montpellier SupAgro and Crédit Agricole SA. Cames, A., Cottencin, L., Cutzach, L., Pintard, J.N., Richard, G., Saïsset, L.A., Touzard, J.M., Traversac, S. (2002), “Recensement 2001 des caves coopératives : diversité des stratégies et des résultats économiques”, Agreste Languedoc-Roussillon, October. Chabin, Y., Viviani, J.L. (2007), “Performance des coopératives viticoles : des indicateurs stratégiques et prospectifs à la création de valeur”, in Couderc, J.P., D’Hauteville, F., Hannin, H. and Montaigne, E. (Ed.), Bacchus 2008 : enjeux, stratégies et pratiques dans la filière viti-vinicole, Dunod, Paris, F, pp. 211-234. Chiffoleau, Y., Touzard, J.M. (2007), “Réseaux d’entrepreneurs et innovation dans un cluster : une approche par les échanges de conseil entre dirigeants”, Economies et Sociétés, Vol. 41, No 29, pp. 1485-1506. Couret, F. (2006), “La démocratie nuit-elle à l’efficacité économique des coopératives ?, RECMA”, No 302, pp. 54-66. Cook, M.L. (1995), “The Future of Agricultural Cooperatives : a Neo-Institutional Approach”, American Journal of Agricultural Economics, Vol. 77, No 5, pp. 1153-1159. Cook, M.L., Plunkett, B. (2006), “Collective Entrepreneurship : an emerging phenomenon in producer-owned organizations”, Journal of agricultural and applied economics, Vol. 38, No 2, pp. 421-428. Cook, M.L., Burress, M.J., Iliopoulos, C. (2008), New Producer Strategies : The Emergence of Patron-Driven Entrepreneurship, Competitive paper, 12th EAAE Congress, 26-29 August, Gent, Belgium. Cyert, R.M., March J.G. (1963), A behavioral theory of the firm, Prentice Hall, USA. D’Aveni, R.A. (1994), Hypercompetition : managing the dynamics of the strategic maneuvering, The Free Press, Traduction française, 1995, Vuibert, Paris, France. De Charrin, G. (1989), Les coopératives agricoles à l’heure du marché unique, Revues Purpan No 151 and 152.
19

6th AWBR International Conference │ Bordeaux Management School │ 9-10 June 2011 Declerck, F., Viviani, J.L. (2010), “Solvency and Performance of French Wineries in Times of Declining Sales : Co-operatives and Corporations”, 4th International European Forum on System Dynamics and Innovation, Proceedings in Food System Dynamics 2010, Bonn, Germany. Elkington, J. (1997), Cannibals with forks : the triple bottom line of 21st century business, Oxford, GB. Forestier, M., Mauget, R. (2001), “De la coopérative au groupe coopératif agro-alimentaire – 1ère partie : de la valeur pour l’usager à la valeur pour l’actionnaire ?”, RECMA, No 278, pp. 1-15. Friedman, M. (1953), “The methodology of positive economics”, in Essays in positive economics, Chicago University Press, Chicago, USA. Hockerts, K. (2001), “Corporate Sustainability Management, Towards Controlling Corporate Ecologicla and Social Sustainability”, in Proceedings of Greening of Industry Network Conference, 21-24 January, Bangkok, Thailand. Jensen, M.C., Meckling, W.H. (1976), “Theory of the firm : managerial behaviour, agency costs and ownership structure”, Journal of Financial Economics, Vol. 3, No 4, pp. 305-360. Jensen, M.C. (1986), “The Agency Cost of Free Cashflow : corporate finance and takecovers”, AER, Vol. 76, No 2, pp. 323-329. Kaplan, R. S., Norton D. P. (1996), The balanced scorecard : translating strategy into action, Boston, USA. Kimble, C., Mcloughlin, K., (1995), “Computer based Information Systems and Managers Work”, New Technology, Work and Employment, Vol. 10, No 1, pp. 56 - 67. Koenig, G. (1998), Les Théories de la Firme, Economica, Paris, France. Krivokapic-Soko, B. (2002), “The Concept and Classifications of Agricultural Co-operatives”, working paper, Australian Centre for Cooperative Research and Development, University of Technology, Sidney, Charles Sturt University, Bathurst, November. Leavitt, H., Whisler, T., (1958), “Management in the 1980’s”, Harvard Business Review, November-December, pp.41-48. Lebas, M. (1995), “Oui, il faut définir la performance”, Revue Française de comptabilité, juillet-août, pp. 66-71. Levy, P., (1997), L’intelligence collective: Pour une anthropologie du cyberspace, La Découverte, Paris, France. Lemoigne, J.L. (1978), La théorie du système général, Presses Universitaires de France, Paris. Lewi, G., Perri, P. (2009), Les défis du capitalisme coopératif, Pearson, Paris, France. MacKay, H., (1992), “Extending the Social Shaping of Technology Approach: Ideology and Appropriation”, Social Studies of Science, Vol. 22, No 4, pp. 685 - 716. Marris, R. (1963), “A model of managerial enterprise”, Quaterly Journal of Economics, No 2, pp. 185-209. Mauget, R. (2008), “Les coopératives agricoles : un atout pour la pérennité de l’agriculture dans la mondialisation”, RECMA, No 307, p. 46-57. Maurel, C. (2010), « Les déterminants financiers de la performance export des PME : le cas de la filière vin française », Ph. D. Thesis, University of Montpellier 1, Ecole Doctorale Economie Gestion, May, 299 pages. Mélèse, J. (1968), La gestion par les systèmes, Editions Hommes et Techniques, Paris, France. Mintzberg, H. (1989), Mintzberg on management. Inside our strange world of organizations, traduction française, Les Editions d’Organisation, Paris, France. Montaigne, E., Couderc, J.P., D’hauteville, F., Hannin, H. (2006), Bacchus 2006. Enjeux, stratégies et pratiques dans la filière vitivinicole, Dunod, Paris, F. Mucchielli, A., (1998), Approche systémique et communicationnelle des organisations, Armand Colin, Paris, France. Pérez, R. (2003), La gouvernance de l’entreprise, La Découverte, Paris, France.
20

6th AWBR International Conference │ Bordeaux Management School │ 9-10 June 2011
21
Pesqueux, Y. (2002), Organisations : modèles et représentations, Presses Universitaires de France, Paris, France. Saccomandi, V. a cura di (1992), Il management delle imprese cooperative agricole : gestire con le moderne tecniche di pianificazione e controllo contabile, Etas Libri, Milano, IT. Simon, H.A. (1979), “Rational decision making in business organizations”, American Economic Review, No 4, pp. 493-513. Saïsset L.A., Bou Saba M. (2009), Observatoire du périmètre coopératif agricole du Languedoc-Roussillon - Evolution de la population entre 2000 et 2008 : créations, fusions et dissolutions, Rapport de la FRCA Languedoc-Roussillon, December. Supizet, J. (2002), “Total Balanced Scorecard, un pilotage aux instruments”, L’Informatique Professionnelle, No 209, pp.15-20. Touzard, J.M. , Laporte, J.P. (1998), “Deux décennies de transition viticole en Languedoc-Roussillon : de la production de masse à une viticulture plurielle”, Pôle Sud, No 9, pp. 26-47. Vercamer, F. (2010), Rapport sur l’Economie Sociale et Solidaire, rapport de mission parlementaire. Williamson, O.E. (1989), “Transaction cost economics”, in Schmalensee, R. , Willig, R.D. (Ed.), Handbook of industrial organization, North Holland, Vol.1, pp. 135-184.
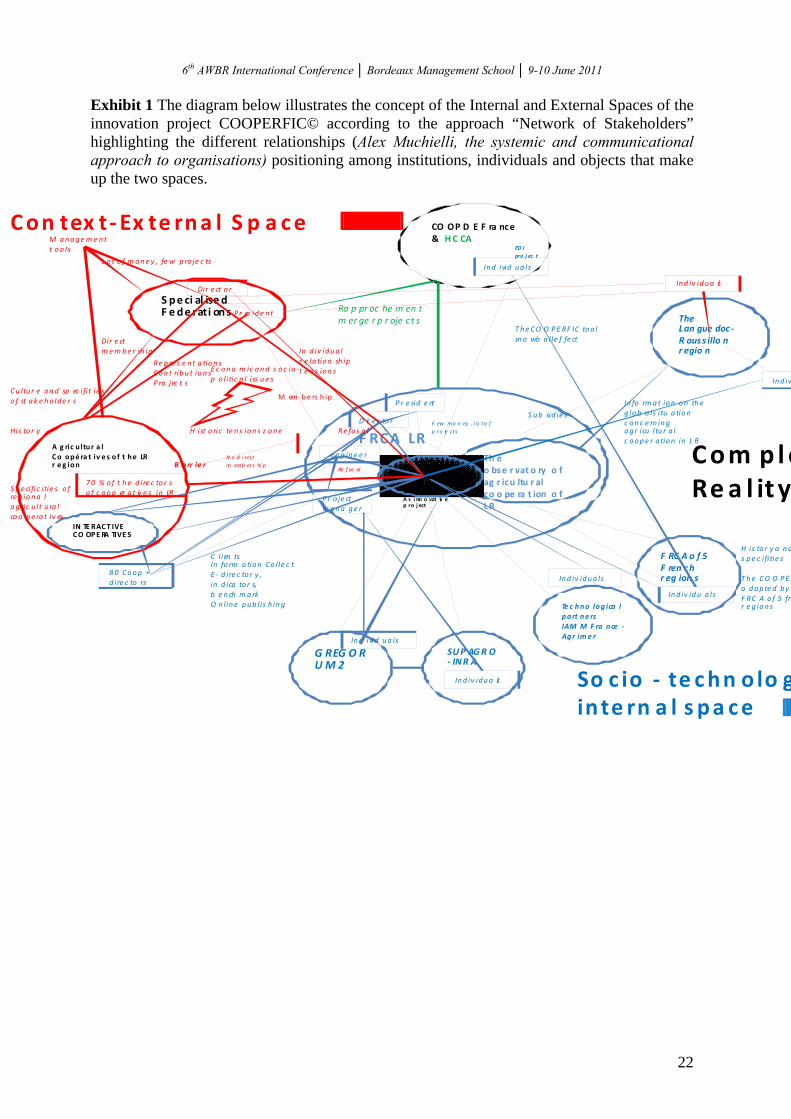
6th AWBR International Conference │ Bordeaux Management School │ 9-10 June 2011 Exhibit 1 The diagram below illustrates the concept of the Internal and External Spaces of the innovation project COOPERFIC© according to the approach “Network of Stakeholders” highlighting the different relationships (Alex Muchielli, the systemic and communicational approach to organisations) positioning among institutions, individuals and objects that make up the two spaces.
SUP AGR O ‐ INR A
G REG O R UM 2
The Lan gue doc ‐R ouss illo n r egio n
CO OP D E F ra nce & HC CA
F RCA LR
S pe ci al ise dF ede rati ons
A g ric u ltur a l Co opé ra t iv e s of t he LR r e g ion
Th e o bse r vat o ry o f ag r icu ltu r al co o pe ra t ion o f LR
The CO O PE RF IC® t oo lA s i nn o vat iv ep ro j ect
F RC A o f 5 F ren ch r eg ion s
Te c hno log ica l part ne rs IAM M F ra nce ‐Agr im e r
IN TE RACT IVECO OPERA TIVE S
S pe cific i tie s o f re g iona l ag ric u l t u ra l coo pe ra t iv es
Cu ltu r e and sp ec i fit ie so f st a k e ho lde r s
His to r y
Re p re s e n t a tion s Con t ribu t ion s P ro jec t s
L o t o f mone y , fe w p ro je c ts
M em be rs h ip
B arr ie rN o d i rect m emb ers hi p
8 0 Coop +d ire c to rs
C l ien tsIn fo rm a tion Co l le c tE ‐ d ire c to r y , in d ica to r s, b e nch m arkO n lin e pub l is h ing
Ra p pr oc he m en t m er ge r p r oje ct s
S ub sid ie s
In fo rm a t ion on th e g lob a l s i tu a tion c on c e rn ing ag r icu l tu r a l c oope r a tion in L R
T he CO O PE Ra dop te d byF RC A o f 5 frer e g io n s
T he CO O PE RF IC too l sno wb a ll e f fe ct
ED I pro j ec t
H is to r y a nds pe c i fi tie s
M anagem e n t t o o ls
Dir e ct mem be r sh ip
P r es id e n t
D ir e c to r
P r e sid e nt
e ng ine e r
Ind iv idua ls
Ind iv
P r o je ct mana ge r
Dir e ct o r
H ist o ric te n s ion s z one
Con tex t‐Ex te rna l S p a ce
In d iv idua l r e la tion sh ip t e n s ion sE c ono m ic and s o c io ‐
p o l i tic a l iss ue s
70 % o f t h e d ire c to r s o f c oop er a t iv e s in LR
Re fus al
Re fu s a l
In d ivid ua ls
So c io ‐ te chn o lo ginte rn a l s pa ce
F ew mo n ey , l o t o f p ro je cts
In d iv idu a ls
Ind iv idua ls
In d ivid ua ls
Com pleRea l ity
In d iv idua ls
22

6th AWBR International Conference │ Bordeaux Management School │ 9-10 June 2011
23

6th AWBR International Conference │ Bordeaux Management School │ 9-10 June 2011 Exhibit 2: Table of bi-lateral correlations for the main variables (06-08) and indicators of the research
Table of correlations
ddl = 43 for all cells
Volume
produced (hl)
Turnover (€)
Profit (€)
Grape growers remuner
ation per hl
(€)
Grape growers remuner
ation per ha
(€)
Fixed costs
per hl (€)
% Fixed costs
/ Turnover
Mean price per hl sold
(€)
Turnover per
ha (€)
% Cash Flow
/ Turnover
Cash Flow
per ha (€)
Cash Flow
per hl (€)
% Cash Flow /
Amortization
Provision
Correlation
1,000 ,527 -,08
4
-,075 ,184 -,11
0
-,231 -,12
8
-,076 ,179 ,122
,034
,181Volume produced (hl)
Signification
. ,000* ,582
,623 ,225 ,471
,127 ,402
,621 ,239 ,426
,826
,235
Corrélation
,527 1,000 -,32
6
,696 ,504 ,706
,428 ,722
,726 ,019 ,210
,311
,132Turnover (€)
Signification
,000* . ,029*
,000* ,000* ,000*
,003* ,000*
,000* ,902 ,165
,037*
,386
Corrélation
-,084 -,326 1,000
-,250 -,047 -,10
0
-,316 -,13
1
-,092 ,496 ,676
,690
,314Profit (€)
Signification
,582 ,029* . ,098* ,758 ,515
,035* ,391
,550 ,001* ,000*
,000*
,035
Corrélation
-,075 ,696 -,25
0
1,000 ,746 ,835
,398 ,912
,915 -,111 ,145
,295
,062Grape growers remuneration per hl (€)
Signification
,623 ,000* ,098
. ,000* ,000*
,007* ,000*
,000* ,467 ,343
,049*
,688
Corrélation
,184 ,504 -,04
7
,746 1,000 ,452
-,026 ,535
,666 ,083 ,283
,292
,208Grape growers remuneration per ha (€)
Signification
,225 ,000* ,758
,000* . ,002*
,864 ,000*
,000* ,588 ,060
,051
,169
Corrélation
-,110 ,706 -,10
0
,835 ,452 1,000
,680 ,978
,924 -,037 ,289
,494
,061Fixed costs per hl (€) Signific
ation ,471 ,000* ,51
5 ,000* ,002* . ,000* ,00
0*,000* ,809 ,05
4 ,001*
,689
Corrélatn io
-,231 ,428 -,31
6
,398 -,026 ,680
1,000 ,611
,528 -,130 ,012
,154
-,112% Fixed costs / Turnover Signific
ation ,127 ,003* ,03
5* ,007* ,864 ,00
0*. ,00
0*,000* ,393 ,93
9 ,31
2 ,465
Corrélation
-,128 ,722 -,13
1
,912 ,535 ,978
,611 1,000
,969 -,047 ,276
,472
,075Mean price per hl sold (€) Signific
ation ,402 ,000* ,39
1 ,000* ,000* ,00
0*,000* . ,000* ,759 ,06
7 ,001*
,626
Corrélation
-,076 ,726 -,09
2
,915 ,666 ,924
,528 ,969
1,000 ,030 ,361
,517
,153Turnover per ha (€)
Signification
,621 ,000* ,550
,000* ,000* ,000*
,000* ,000*
. ,842 ,015*
,000*
,314
24

6th AWBR International Conference │ Bordeaux Management School │ 9-10 June 2011
25
Corrélatn io
,179 ,019 ,496
-,111 ,083 -,03
7
-,130 -,04
7
,030 1,000 ,845
,662
,930% Cash Flow / Turnover Signific
ation ,239 ,902 ,00
1* ,467 ,588 ,80
9,393 ,75
9,842 . ,00
0* ,000*
,000*
Corrélation
,122 ,210 ,676
,145 ,283 ,289
,012 ,276
,361 ,845 1,000
,938
,757Cash Flow per ha (€)
Signification
,426 ,165 ,000*
,343 ,060 ,054
,939 ,067
,015* ,000* . ,000*
,000*
Corrélation
,034 ,311 ,690
,295 ,292 ,494
,154 ,472
,517 ,662 ,938
1,000
,567Cash Flow per hl (€)
Signification
,826 ,037* ,000*
,049* ,051 ,001*
,312 ,001*
,000* ,000* ,000*
. ,000*
Corrélatn io
,181 ,132 ,314
,062 ,208 ,061
-,112 ,075
,153 ,930 ,757
,567
1,000% Cash Flow / Amortization Provision
Signification
,235 ,386 ,035*
,688 ,169 ,689
,465 ,626
,314 ,000* ,000*
,000*
.
* significant coefficients at a .05 level