Cooperation for innovation and the exchange of good ...
162
1
Transcript of Cooperation for innovation and the exchange of good ...

1


Cooperation for innovation and the exchange of good practices sub-programme
EVENT PROJECT
EUROPEAN AND VIETNAMESE COLLABORATION
ON GRADUATE EMPLOYMENT
VIETNAMESE GRADUATES’
LABOUR MARKET ENTRY AND EMPLOYMENT:
A TRACER STUDY
Nguyen Van Thang
National Economics University
José María Peiró University of Valencia and Ivie
Le Quang Canh National Economics University
Vicente González-Romá University of Valencia
Vicente Martínez-Tur University of Valencia
April 2020

Disclaimer: "The European Commission's support for the production of this publication does not constitute an endorsement of the contents, which reflect the views only of the authors, and the Commission cannot be held responsible for any use which may be made of the information contained therein.".
Suggested citation:
Van Thang, N., J. M. Peiró, L. Q. Canh, V. González-Romá and V. Martínez-Tur (2020). Vietnamese graduates' labour market entry and employment: A tracer study. Uppsala (Sweden): Uppsala University. DOI: 10.33063/diva-409987
ISBN: 978-91-506-2828-9
1st edition, April 2020
Uppsala University PO Box 256, SE-751 05 Uppsala, Sweden
© The authors
This work is published under the Creative Commons Attribution (CC BY 4.0) licence. Anyone may reproduce, distribute, translate and create derivative works of this article (for both commercial and non-commercial purposes), subject to full attribution to the original publication and authors. The full terms of this licence may be seen at http://creativecommons.org/licences/by/4.0/legalcode

5
PROLOGUE
Students’ labour market entry and employment after graduation is an important issue for
education policy makers, University authorities and managers, employers, researchers, and
graduates and their families. It is a critical challenge for all the actors involved to ensure that the
human capital generated and developed in universities leads to proper jobs that can optimally
contribute to the development of society and the country’s economy. This objective implies that
graduates are able to obtain high quality jobs that fit their education and level of qualifications.
This is an important aspiration of students and their families, who invest in graduates’ education
and of the whole society, which also makes important contributions to their education.
In the context of a rapidly changing socio-economic context and labour market, a growing
demand for university graduates, and increasing university enrolment, the creation of jobs for
newly graduated students becomes more difficult and urgent. Enhancing the employability of
students is an important objective of the employment and education agendas of each country.
This book is written to increase the understanding of the employability of university graduates,
in order to improve their employment capacity and bridge the gap between the university and
the labour market.
This book is based on the Europe-Vietnam Collaborative on Graduates’ Employment project,
funded and supported by the European Union under the Erasmus + CBHE Program, EVENT,
573903-EPP-1-2016-1-SE-EPPKA2-CBHE-SP. The broader objective of the EVENT Project was to
contribute to increasing the employability of university graduates in Vietnam. To achieve this
central objective, the project carried out several actions whose outputs may be found in the web
portal that was transferred to the Vietnamese Ministry of Education and Training (MOET) at the
end of the project.
The project consortium consisted of nine universities from Europe and Vietnam: Uppsala
University (Sweden-leader of the project), Royal Swedish Technical University (Sweden),
University of Valencia (Spain), University of Groningen (Netherlands), National Economics
University, Hanoi University of Industry, Hue University, Ho Chi Minh City University of Technical
Education, and Ho Chi Minh City University of Technology. This book is a product of the project
and led by the University of Valencia in collaboration with the National Economics University.
One key action of the project was the development of a tracer study to study the situation of
the job market entry and labour status of the graduates of the five Vietnamese universities
involved in the project. This tracer study aimed to fulfil, among others, the following functions:
• to provide feedback to the HEI to improve the redesigning of the curricula taught and
better respond to the demands of the job market;
• to provide occupational information for young people and their families that is relevant for
vocational orientation and guidance;
• to offer indicators to evaluate the effectiveness of the HEI in increasing graduates’
employability and orientating and evaluating higher education policies;
6
• to offer a tool for other Universities to use to perform tracer studies based on their specific
needs and aims.
The context, aims, methods, and results of the tracer study, as well as a number of conclusions
and recommendations, are presented in this book, which has also been published in
Vietnamese. The study was developed by the authors, who are professors at the University of
Valencia and the National Economics University. The university graduates’ survey was conducted
with significant support from Vietnamese partner universities under the overall management
and coordination of Uppsala University and the project coordinators: Ms. Oddný Ósk
Sverrisdóttir and Mr. Björn Nyström. The project coordinators helped to organise the necessary
support activities to conduct the surveys and compile this book.
The authors would like to acknowledge and express their gratitude for the support and
contributions of many officials and individuals in the preparation of this book: Mr. Hoang Cong
Dung, Ms. Bui Lan Huong (Ministry of Education and Training); Mr. Pham Hong Chuong-Rector,
Mr. Le Viet Thuy, Mr. Bui Trung Hai, (National Economics University); Mr. Le Viet Anh, Mr.
Nguyen Van Thanh, Ms. Dinh Thi Hai Ha, Mr. Tran Viet Hoi (Hanoi University of Industry); Mr.
Truong Quy Tung – Vice Rector, Mr. Hoang Huu Hanh, Mr. Hoang Kim Toan (Hue University);
Mr. Bui Xuan Lam - Vice Rector, Ms. Nguyen Lan Huong, Mr. Huynh Thanh Tung (Ho Chi Minh
City University of Technology); Do Van Dung - Rector, Mr. Nguyen Vu Lan (Ho Chi Minh City
University of Technical Education).
The authors would also like to thank 1710 graduates from the five Vietnamese partner
universities for their time and sincere comments when participating in the survey. Without their
cooperation, this study would not have been possible, and their contributions have shed light on
the complex and interesting reality of graduates´ labour market and job insertion situation and
processes.
Hanoi, 15th of April, 2020.

7
TABLE OF CONTENTS
PROLOGUE............................................................................................................................................. 5
EXECUTIVE SUMMARY .......................................................................................................................15
CHAPTER 1: INTRODUCTION ........................................................................................................... 27
1.1. Higher education in Vietnam .................................................................................................... 28
1.2. Nation-wide and university surveys on graduate employability ......................................... 30
1.3. Vietnamese labour market ........................................................................................................ 32
1.3.1. Labour force ................................................................................................................................................................ 32
1.3.2. Unemployment .......................................................................................................................................................... 33
1.3.3. Productivity and wages .......................................................................................................................................... 33
1.3.4. Challenges in the labour market ........................................................................................................................ 35
1.4. The project .................................................................................................................................. 35
1.4.1. Universities involved ................................................................................................................................................ 36
1.4.2. Objectives of the project ....................................................................................................................................... 37
1.4.3. Connection to other parts of the project ........................................................................................................ 38
1.5. Contents and structure of the report ...................................................................................... 38
Chapter 2: METHODOLOGY .............................................................................................................. 39
2.1. Sample ......................................................................................................................................... 40
2.2. Data collection ............................................................................................................................ 40
2.2.1. Procedures ................................................................................................................................................................... 40
2.2.2. Quality assurance...................................................................................................................................................... 41
2.2.3. Sampling bias checks .............................................................................................................................................. 41
2.3. Description of the sample ......................................................................................................... 43
2.4. Questionnaire ............................................................................................................................. 44
2.4.1. Questionnaire Development ................................................................................................................................ 44
2.4.2. Structure and content ............................................................................................................................................. 45
2.5. Analysis........................................................................................................................................ 46
2.6. Limitations .................................................................................................................................. 47
CHAPTER 3: SURVEY RESULTS FOR THE TOTAL SAMPLE OF GRADUATES ................................ 49
3.1. Graduates’ employment status ................................................................................................ 50
3.1.1. Current employment situation ............................................................................................................................ 50
3.1.2. Number of jobs since graduation ...................................................................................................................... 51
3.2. Employed graduates .................................................................................................................. 51
3.2.1. Time needed to find the first paid job after graduation ........................................................................... 51
3.2.2. Strategies to find first paid job after graduation ......................................................................................... 53
3.2.3. Strategies to find the current job after graduation..................................................................................... 53
3.2.4. Horizontal match ...................................................................................................................................................... 54

8
3.2.5. Level of education required for the current job ........................................................................................... 54
3.2.6. Competences-job requirement match ............................................................................................................. 55
3.2.7. Employer organization ........................................................................................................................................... 56
3.2.8. Location ........................................................................................................................................................................ 57
3.2.9. Functional area .......................................................................................................................................................... 58
3.2.10. Hierarchical level .................................................................................................................................................... 58
3.2.11. Formal written employment contract ............................................................................................................ 59
3.2.12. Duration of the contract ...................................................................................................................................... 59
3.2.13. Part-time vs. full-time ........................................................................................................................................... 60
3.2.14. Monthly income ...................................................................................................................................................... 60
3.2.15. Work satisfaction .................................................................................................................................................... 61
3.2.16. Importance of competencies for good performance .............................................................................. 62
3.3. Unemployed graduates ............................................................................................................. 65
3.3.1. Time looking for a job ............................................................................................................................................ 65
3.3.2. Job search strategies used .................................................................................................................................... 65
3.3.3. Difficulties in finding a job .................................................................................................................................... 66
3.3.4. University career centre: demand and services ............................................................................................ 67
3.4. Economically inactive graduates .............................................................................................. 68
3.4.1. Reason for not looking for a job ........................................................................................................................ 68
3.5. Summary and conclusions ........................................................................................................ 69
CHAPTER 4. GENDER DIFFERENCES ................................................................................................ 71
4.1. Graduates’ employment status ................................................................................................ 72
4.1.1. Current employment situation ............................................................................................................................ 72
4.1.2. Number of jobs since graduation ...................................................................................................................... 72
4.2. Employed graduates .................................................................................................................. 73
4.2.1. Time needed to find the first paid job after graduation ........................................................................... 73
4.2.2. Strategies to find first paid job after graduation ......................................................................................... 74
4.2.3. Strategies to find the current job after graduation..................................................................................... 75
4.2.4. Horizontal match ...................................................................................................................................................... 75
4.2.5. Level of education required for the current job ........................................................................................... 76
4.2.6. Competencies-job requirement match ............................................................................................................ 76
4.2.7. Employer organization ........................................................................................................................................... 77
4.2.8. Location ........................................................................................................................................................................ 79
4.2.9. Functional area .......................................................................................................................................................... 79
4.2.10. Hierarchical level .................................................................................................................................................... 80
4.2.11. Formal written employment contract ............................................................................................................ 81
4.2.12. Duration of the contract ...................................................................................................................................... 81
4.2.13. Part-time vs. full-time ........................................................................................................................................... 82
4.2.14. Monthly income ...................................................................................................................................................... 82
4.2.15. Work satisfaction .................................................................................................................................................... 83
4.2.16. Importance of competencies for good performance .............................................................................. 83

9
4.3. Unemployed graduates ............................................................................................................. 87
4.3.1. Time spent looking for a job ................................................................................................................................ 87
4.3.2. Job search strategies used .................................................................................................................................... 87
4.3.3. Difficulties in finding a job .................................................................................................................................... 88
4.3.4. University career centre: demand and services ............................................................................................ 88
4.4. Economically inactive graduates .............................................................................................. 90
4.4.1. Reason for not looking for a job ........................................................................................................................ 90
4.5. Summary and conclusions ........................................................................................................ 90
CHAPTER 5: DIFFERENCES BY MAJORS .......................................................................................... 93
5.1. Graduates’ employment status ................................................................................................ 94
5.1.1. Current employment situation ............................................................................................................................ 94
5.1.2. Number of jobs since graduation ...................................................................................................................... 95
5.2. Employed graduates .................................................................................................................. 95
5.2.1. Time needed to find the first paid job after graduation ........................................................................... 95
5.2.2. Strategies to find first paid job after graduation ......................................................................................... 97
5.2.3. Strategies to find the current job after graduation..................................................................................... 97
5.2.4. Horizontal match ...................................................................................................................................................... 98
5.2.5. Level of education required for the current job ........................................................................................... 99
5.2.6. Competencies-job requirement match ............................................................................................................ 99
5.2.7. Employer organization ......................................................................................................................................... 100
5.2.8. Location ...................................................................................................................................................................... 102
5.2.9. Functional area ........................................................................................................................................................ 103
5.2.10. Hierarchical level .................................................................................................................................................. 103
5.2.11. Formal written employment contract .......................................................................................................... 104
5.2.12. Duration of the contract .................................................................................................................................... 105
5.2.13. Part-time vs. full-time ......................................................................................................................................... 105
5.2.14. Monthly income .................................................................................................................................................... 106
5.2.15. Work satisfaction .................................................................................................................................................. 106
5.2.16. Importance of competences for good performance ............................................................................. 107
5.3. Unemployed graduates ........................................................................................................... 110
5.3.2. Job search strategies used .................................................................................................................................. 110
5.3.3. Difficulties in finding a job .................................................................................................................................. 111
5.3.4. University career center: demand and services .......................................................................................... 112
5.4. Economically inactive graduates ............................................................................................ 113
5.4.1. Reason for not looking for a job ...................................................................................................................... 113
5.5. Summary and conclusions ...................................................................................................... 114
CHAPTER 6: GRADUATE-JOB MATCHING TYPES ........................................................................ 117
6.1. Introduction .............................................................................................................................. 118
6.2. Distribution of graduates by groups according to the double matching ................................. 119
6.3. Matching types and gender .................................................................................................... 120
6.4. Matching types and major ...................................................................................................... 120

10
6.5. Matching types and job search strategies. ........................................................................... 121
6.6. Matching types and employed vs self-employed ................................................................ 124
6.7. Matching types and sectors. ................................................................................................... 125
6.8. Matching types and Job location ........................................................................................... 127
6.9. Matching types and organization type ................................................................................. 128
6.10. Matching types and organization size ................................................................................ 129
6.11. Matching types and type of contract. ................................................................................. 130
6.12. Matching types and job duration ........................................................................................ 131
6.13. Matching types and full-time vs part-time job. ................................................................. 132
6.14. Matching types and hierarchical level ................................................................................. 133
6.15. Matching types and monthly income .................................................................................. 134
6.16. Matching types and work satisfaction ............................................................................... 135
6.17. Matching types and the match between competences and job requirements .............. 136
6.18. Matching types and competence importance .................................................................... 137
6.19 Summary and conclusions. .................................................................................................... 143
Chapter 7: DISCUSSION AND CONCLUSIONS .............................................................................. 147
REFERENCES ..................................................................................................................................... 152
ANNEX. EVENT QUESTIONNAIRE .................................................................................................. 153

11
LIST OF FIGURES
Figure 1.1. The number of universities in Vietnam, 2000-2017 ......................................................................... 28
Figure 1.2: Faculty with doctoral degrees at universities and colleges during the period 2000 –
2017 ........................................................................................................................................................................................... 29
Figure 1.3. Probability distribution of universities by number of students enrolled ................................. 30
Figure 1.4. Shares of the employed labour force by sectors in 2017 .............................................................. 32
Figure 1.5. Unemployment rate in Vietnam, 2008-2018 ....................................................................................... 33
Figure 1.6. Labour productivity and salary, 2005-2017 ......................................................................................... 34
Figure 2.1. Shares of university participation in the population and survey sample ................................. 42
Figure 2.2. Shares of respondents by gender and major in the population and survey sample .......... 42
Figure 2.3. Numbers of respondents and response rates of member universities .................................... 43
Figure 2.4. Composition of the survey sample ......................................................................................................... 44
Figure 3.1. Current employment situation .................................................................................................................. 50
Figure 3.2. Number of jobs since graduation ............................................................................................................ 51
Figure 3.3. When did you find your first paid job.................................................................................................... 52
Figure 3.4. The average number of months to find the first paid job after graduation .......................................... 52
Figure 3.5. Strategies to find your first paid job after graduation or the job you already had when
you graduated ....................................................................................................................................................................... 53
Figure 3.6. Strategies to find your current job after graduation ....................................................................... 54
Figure 3.7. To what extent is the content of your current job related to the content of your
degree ....................................................................................................................................................................................... 54
Figure 3.8. What is the level of education required for your current job ...................................................... 55
Figure 3.9. To what extent do your competences match the requirements of your job ........................................ 55
Figure 3.10. The organization you work for ............................................................................................................... 56
Figure 3.11. What is the sector of economic activity of your organization ................................................... 56
Figure 3.12. How many employees does your company have ........................................................................... 57
Figure 3.13. Where is your current job located ........................................................................................................ 57
Figure 3.14. In what functional area of the company is your current job included ................................... 58
Figure 3.15. What is the hierarchical level of your current job ........................................................................... 59
Figure 3.16. Did you sign a formal written employment contract for your current job .......................................... 59
Figure 3.17. Is your current job… .................................................................................................................................... 60
Figure 3.18. Is your current job… .................................................................................................................................... 60
Figure 3.19. An estimation of your monthly income in your current job ....................................................... 61
Figure 3.20. What is the degree of satisfaction or dissatisfaction produced by each of the
following aspects of your job .......................................................................................................................................... 61
Figure 3.21. Rate the importance of each of the following factors and competences for good performance
in your current job: cognitive competences ...................................................................................................................... 62
Figure 3.22. Rate the importance of each of the following factors and competences for good
performance in your current job: management competences .......................................................................... 63

12
Figure 3.23. Rate the importance of each of the following factors and competences for good
performance in your current job: interpersonal competences .......................................................................... 63
Figure 3.24. Rate the importance of each of the following factors and competences for good
performance in your current job: instrumental competences ............................................................................ 64
Figure 3.25. Rate the importance of each of the following factors and competences for good performance
in your current job: attitudinal competences .................................................................................................................... 64
Figure 3.26. How many months have you been looking for a job.................................................................... 65
Figure 3.27. What are the 3 job search strategies you have been using more frequently ..................................... 66
Figure 3.28. Rate the degree of responsibility of each of the following factors in your difficulties
in finding a job ...................................................................................................................................................................... 67
Figure 3.29. Do you want the career centre of your university to support you in searching for a
job ............................................................................................................................................................................................... 67
Figure 3.30. If yes, what do you want the Career Centre to offer (multiple responses) .......................................... 68
Figure 3.31. Why aren't you looking for a job right now? (choose the most important reason) ......... 69
Figure 4.1. Current employment situation, by gender........................................................................................... 72
Figure 4.2. Number of jobs since graduation, by gender ..................................................................................... 73
Figure 4.3. When did you find your first paid job, by gender ............................................................................ 73
Figure 4.4. The average number of months to find the first paid job after graduation, by gender .... 74
Figure 4.5. Strategies to find your first paid job after graduation or the job you already had when
you graduated, by gender ................................................................................................................................................ 74
Figure 4.6. Strategies to find your current job after graduation, by gender ................................................ 75
Figure 4.7. To what extent does the content of your current job relate to the content of your
degree, by gender ................................................................................................................................................................ 76
Figure 4.8. What is the level of education required for your current job, by gender ............................... 76
Figure 4.9. To what extent do your competencies match the requirements of your job, by gender . 77
Figure 4.11. Sector of economic activity of your organization, by gender ................................................... 78
Figure 4.12. How many employees does your company have, by gender .................................................... 79
Figure 4.13. Where is your current job located, by gender ................................................................................. 79
Figure 4.14. In what functional area of the company is your current job included, by gender ............ 80
Figure 4.15. What is the hierarchical level of your current job, by gender .................................................... 80
Figure 4.16. Did you sign a formal written employment contract for your current job, by gender .... 81
Figure 4.17. Is your current job… by gender .............................................................................................................. 81
Figure 4.18. Is your current job… by gender .............................................................................................................. 82
Figure 4.19. An estimation of your monthly income in your current job, by gender ................................ 82
Figure 4.20. What is the degree of satisfaction or dissatisfaction produced by each of the
following aspects of your job, by gender ................................................................................................................... 83
Figure 4.21. Rate the importance of each of the following factors and competences for good
performance in your current job, by gender: cognitive competences ............................................................ 83
Figure 4.22. Rate the importance of each of the following factors and competences for good
performance in your current job, by gender: management competences ................................................... 84
Figure 4.23. Rate the importance of each of the following factors and competences for good
performance in your current job, by gender: interpersonal competences ................................................... 85

13
Figure 4.24. Rate the importance of each of the following factors and competences for good
performance in your current job, by gender: instrumental competences ..................................................... 86
Figure 4.25. Rate the importance of each of the following factors and competences for good
performance in your current job, by gender: attitudinal competences.......................................................... 86
Figure 4.26. Average number of months that you have been looking for a job, by gender.................. 87
Figure 4.27. What are the 3 job search strategies you have been using more frequently, by
gender ....................................................................................................................................................................................... 87
Figure 4.28. Rate the degree of responsibility of each of the following factors in your difficulties
in finding a job, by gender ............................................................................................................................................... 88
Figure 4.29. Do you want the career centre of your university to support you in searching for a
job, by gender ........................................................................................................................................................................ 89
Figure 4.30. If yes, what do you want the Career Centre to offer, by gender (multiple responses) .... 89
Figure 4.31. Why aren't you looking for a job right now, by gender? (choose the most important
reason) ...................................................................................................................................................................................... 90
Figure 5.1. Current employment situation, by major ............................................................................................. 94
Figure 5.2. Number of jobs since graduation, by major ....................................................................................... 95
Figure 5.3. When did you find your first paid job, by major ............................................................................... 96
Figure 5.4. The average numbers of months to find the first paid job after graduation, by major .... 96
Figure 5.5. Strategies to find your first paid job after graduation or the job you already had when
you graduated, by major ................................................................................................................................................... 97
Figure 5.6. Strategies to find your current job after graduation, by major ................................................... 98
Figure 5.7. To what extent is the content of your current job related to the content of your
degree, by major................................................................................................................................................................... 98
Figure 5.8. What is the level of education required for your current job, by major .................................. 99
Figure 5.9. To what extent do your competences match the requirements of your job, by major ..... 99
Figure 5.11. What is the sector of economic activity of your organization, by major ........................................... 101
Figure 5.12. How many employees does your company have, by major .................................................... 102
Figure 5.13. Where is your current job located, by major .................................................................................. 102
Figure 5.14. In what functional area of the company is your current job included, by major ............. 103
Figure 5.15. What is the hierarchical level of your current job, by major .................................................... 104
Figure 5.16.. Did you sign a formal written employment contract for your current job, by major .... 104
Figure 5.17. Is your current job… by major .............................................................................................................. 105
Figure 5.18. Is your current job… by major .............................................................................................................. 105
Figure 5.19. An estimation of your monthly income in your current job, by major ................................ 106
Figure 5.20. What is the degree of satisfaction or dissatisfaction produced by each of the
following aspects of your job, by major .................................................................................................................... 107
Figure 5.21. Rate the importance of each of the following factors and competences for good
performance in your current job, by major: cognitive competences ............................................................ 107
Figure 5.22. Rate the importance of each of the following factors and competences for good
performance in your current job, by major: management competences .................................................... 108
Figure 5.23. Rate the importance of each of the following factors and competences for good
performance in your current job, by major: interpersonal competences .................................................... 108

14
Figure 5.24. Rate the importance of each of the following factors and competences for good
performance in your current job, by major: instrumental competences ..................................................... 109
Figure 5.25. Rate the importance of each of the following factors and competences for good
performance in your current job, by major: attitudinal competences .......................................................... 109
Figure 5.26. Average number of months you have been looking for a job, by major ................................................. 110
Figure 5.27. What are the 3 job search strategies you have been using more frequently, by major111
Figure 5.28. Rate the degree of responsibility of each of the following factors in your difficulties
in finding a job, by major ................................................................................................................................................ 112
Figure 5.29. Do you want the career centre of your university to support you in searching for a
job, by major ........................................................................................................................................................................ 112
Figure 5.30. If yes, what do you want the Career Centre to offer, by major (multiple responses)..... 113
Figure 5.31. Why aren't you looking for a job right now, by major? (choose the most important
reason) .................................................................................................................................................................................... 114
Figure 6.1. Double match: general results ................................................................................................................ 119
Figure 6.2. Matching types and gender ..................................................................................................................... 120
Figure 6.3. Matching types and major ....................................................................................................................... 121
Figure 6.4a. Matching type (G1) and job search strategies ............................................................................... 122
Figure 6.4b. Matching type (G2) and job search strategies ............................................................................... 122
Figure 6.4c. Matching type (G3) and job search strategies ............................................................................... 123
Figure 6.4d. Matching type (G4) and job search strategies ............................................................................... 123
Figure 6.5. Matching types and employed vs. self-employed .......................................................................... 125
Figure 6.6.a. Matching G1: LH-LV and sectors ........................................................................................................ 125
Figure 6.6.b. Matching G2: HH-LV and sectors ...................................................................................................... 126
Figure 6.6.c. Matching G3: LH-HV and sectors ....................................................................................................... 126
Figure 6.6.d. Matching G4: HH-HV and sectors ..................................................................................................... 127
Figure 6.7. Matching types and job location ........................................................................................................... 128
Figure 6.8. Matching types and organization type ............................................................................................... 129
Figure 6.9. Matching types and organization size ................................................................................................. 130
Figure 6.10. Matching types and formal contracts ............................................................................................... 131
Figure 6.11. Matching types and job duration ....................................................................................................... 132
Figure 6.12. Matching types and full-time vs part-time job .............................................................................. 133
Figure 6.13. Matching types and hierarchical level ............................................................................................... 134
Figure 6.14. Matching types and monthly income ............................................................................................... 135
Figure 6.15. Matching types and work satisfaction .............................................................................................. 136
Figure 6.16. Matching types and competences-job requirements match ................................................... 137
Figure 6.10.a. Matching types and importance of cognitive competences ................................................ 139
Figure 6.10.b. Matching types and importance of management competences .................................................... 140
Figure 6.10.c. Matching types and importance of interpersonal competences ..................................................... 141
Figure 6.10.d. Matching types and importance of instrumental competences ...................................................... 142
Figure 6.10.e. Matching types and importance of attitudinal competences .............................................. 143

15
EXECUTIVE SUMMARY

16
EXECUTIVE SUMMARY
Structure of the
executive summary
The executive summary is structured in five main sections:
• Introduction: It presents the context, objectives, functions, and method
of the study.
• Graduates’ job search
• Graduates’ job characteristics
• Graduates’ job quality
• ‘Soft’ competencies and effective performance
INTRODUCTION
Context This project responds to the needs of Vietnamese higher education
institutions. Unemployment of university graduates in Vietnam may partly
stem from a mismatch between the education offered and the demands of
the labour market. The feedback from the labour market seems to support
this, but employers also mention a lack of “soft” competencies in newly
graduated job applicants. The responses from graduates suggest a lack of
actors bridging the gap between universities and employers, whereas
MOLISA has stated that there is a surplus of graduates recently, given the
countries’ current economy. Moreover, the available information on the true
state of employment of university graduates is not sufficient for universities
in developing their curriculums and for MOET and MOLISA in their
management.
Objectives The broader objective of the project is to increase employability of
university graduates in Vietnam. To reach the central objectives, the project
attempts to work towards the following specific objectives:
• to identify the main characteristics of the labour-market insertion
processes of University graduates through a survey study addressed to
graduates from five Vietnamese Universities.
• to provide information about the employment status, working conditions,
and characteristics of the graduates’ jobs.
• to analyse the job search processes and strategies and their effectiveness
in the different segments of the labour market.
• to provide indicators of the usefulness of their University education and
the Degree obtained in getting a job, the job quality (in terms of fit to the
Degree, job salary, job satisfaction, etc.), and their work performance.
• to provide information about unemployed and inactive graduates.
Functions The tracer studies aim to fulfil, among others, the following functions:
• to provide feedback to the HEI to improve the redesigning of the curricula
taught and better respond to the demands of the labour market;
• to provide occupational information for young people and their families
that is relevant for vocational orientation and guidance,
• to offer indicators to evaluate the effectiveness of the HEI in increasing the
graduates’ employability, as well as the orientation and evaluation of higher
education policies.
• To offer a tool for other Universities to use to perform tracer studies
based on their needs and aims.

17
Method The survey is conducted in five universities in Vietnam. The target group
in the surveyed sample includes students who graduated in 2016. At the
time of conducting the survey, these graduates had already been in the job
market for a year.
• A multistage-sampling method was used. First, each university member
decided on at least three majors to be surveyed. Second, based on
proportions of graduates in each major, the number of students in the
sample was determined, and they were randomly selected by applying the
Proportionate Stratified Random Sampling Method. Third, replacements for
the selected sample were also randomly prepared in advance.
• The final survey sample includes 1710 students covering two science
fields: engineering and social sciences.
• An online survey was employed by using SurveyMonkey. An invitation
letter, which was prepared in advance, was sent to the selected graduates
via confirmed emails asking for their participation.
• Response rates of graduates from each university were relatively high
compared to a common online survey, and the average response rate was
54.8% of the total number of emails sent out. • The survey sample covers
graduates from 21 majors, of which 5 majors overlap across universities.
These majors are finally categorized into two larger science fields:
Engineering and Social Sciences. Then, the Vietnamese questionnaire was
implemented on an on-line platform in order to collect a small sample of
data that allowed us to conduct a pilot study.
GRADUATES’ JOB SEARCH
Most graduates
declared that they had
worked in one or two
jobs since graduation
42.1% of graduates reported that they had only worked in one job since
graduation; whereas 36.4% of them declared that they had worked in two
jobs
• Only 3.3% of graduates declared they had not worked after graduation
Of those graduates
who found their first
paid job after
graduation, 73.6% took
three months or less
(after graduating) to
find it
53.5% of graduates found their first paid job after graduation, whereas
46.5% found it before graduating. Among those who found their first job
after graduation, 35.4% took one month or less after graduation to find it;
23.5% took two months; and 14.7% took three months
• The average time to find the first paid job after graduation was 3.1
months
• Only 5.6% of graduates took 10 months or more, after graduation, to
find their first paid job
• The percentage of men who found a job “before graduation” (49%) was
greater than the percentage of women (43.7%)
• The percentage of Engineering and Science (ES) graduates who found a
job “before graduation” (51.9%) was greater than the percentage of Social
Science (SS) graduates (42%)
• The average number of months spent looking for the first paid job was
higher for SS graduates (3.28 months) than for ES graduates (2.79)

18
Internet resources
predominated among
strategies used by
graduates to find their
first paid job
Graduates used a wide range of strategies (they were asked to report
the three most important) to find their first paid job. Internet resources
predominated: “social and/or professional Internet networks” (30.6%) and
“Internet portals, company websites, and press ads.” (29.2%). Graduates
also frequently used “Personal contacts” (25.2%) and “contacting the
employer on my own initiative” (24.6%).
• Contacting “universities’ employment services” (4.5%) and “employment
agencies” (1.9%) were among the least frequently used strategies
• Women used “social and/or professional Internet networks” (40.1%) and
“Internet portals, company websites, and press ads.” (36.3%) more often
than men (30.8% and 31.6%, respectively).
• Men used the “employment services of the university” (8.4%) and were
“contacted by the employer” (16%) more often than women (1.5% and
10%, respectively).
• SS graduates used the following strategies more often than ES
graduates: practices in companies or institutions; social and/or
professional Internet networks; and self-employment. By contrast, ES
graduates used the following strategies more often than SS graduates:
personal contacts; contacts initiated by the employer; contacts with the
employer initiated by the graduate; employment agencies; Internet
portals, company websites, and press ads; and university employment
services
Internet resources also
predominated in the
strategies used to find
the current job after
graduation
Graduates used a wide range of strategies (they were asked to report
the three most important) to find their current job after graduation.
Internet resources predominated again: “Internet portals, company
websites, and press ads.” (33.2%) and “social and/or professional Internet
networks” (29.9%). Graduates also frequently used “Personal contacts”
(27.2%) and “contacting the employer on my own initiative” (25.5%).
• Again, contacting “universities’ employment services” (4.8%) and
“employment agencies” (2.8%) were among the least frequently used
strategies
• Women used “social and/or professional Internet networks” (39.3%)
more often than men (30.3%).
• Men used the “employment services of the university” (9.1%) and were
“contacted by the employer” (17.8%) more often than women (1.2% and
11.4%, respectively).
• SS graduates used the following strategies more often than ES
graduates: internships in companies or institutions; social and/or
professional Internet networks; and self-employment. By contrast, ES
graduates used the following strategies more often than SS graduates:
personal contacts; contacts initiated by the employer; contacts with the
employer initiated by the graduate; employment agencies; and university
employment services
On average,
unemployed graduates
have already spent 6.4
months looking for a
job
29.34% of unemployed graduates had been looking for a job for a
month or less. By contrast, 12.01% had already spent 7 to 12 months
looking for a job, and 16.01% had already spent more than 12 months.

19
Internet resources
predominated among
the strategies used by
unemployed graduates
to look for a job
The two job search strategies most frequently used by unemployed
graduates were related to Internet resources: “Internet portals, company
websites, and press ads.” (78%) and “social and/or professional Internet
networks” (65.3%).
• A relevant group of unemployed graduates also used “personal
contacts” (45.3%). By contrast, more formal strategies such as “contacting
employment agencies” (10.0%) and using the “employment services of
their own University” (3,3%) were considered by a minority of the
graduates searching for a job
• Women used “social and/or professional internet networks” (70%) more
often than men (61.3%).
• Men used “Internet portals, company websites, and press ads.” (82.5%)
and “personal contacts (relatives, friends, etc.)” (51.3%) more often than
women (72.9% and 38.6%, respectively).
Unemployed graduates
perceive that the most
important obstacle to
find a job is “lack of, or
insufficient,
professional practice
and experience”
Using a measurement scale that ranged from 1 to 5 (higher scores
indicate greater difficulties), “lack of, or insufficient, professional practice
and experience” (mean = 3.6) was unemployed graduates’ most important
obstacle to finding a job.
• Other obstacles were also scored with a value of 3 or higher: “lack of
language skills” (3.3); “lack of knowledge about the labour market” (3.1);
“saturation of the labour market” (3); and “The jobs you have been offered
do not have an adequate wage” (3)
• SS and ES graduates partially differed in the importance attributed to
obstacles. “Lack of or insufficient professional practice and experience”
was the most important obstacle for both SS (3.7) and ES (3.6) graduates.
The second and third most important obstacles for SS graduates were
“lack of language skills” (3.4) and “lack of knowledge about the labour
market” (3.1). By contrast, the second and third most important obstacles
for ES graduates were “the jobs offered did not have an adequate wage”
(3.2) and “saturation of the labour market” (3.1)
Most unemployed
graduates (72.1%)
wanted the University
Career Centres to
support them in
searching for a job
Among those unemployed graduates who wanted the University Career
Centres to support them in searching for a job, 68.4% requested that
these Centres “provide job opportunities for each major”. 55.1% of them
also requested that these Centres “provide general information about the
labour market and job opportunities”
• Other services were requested less: “hosting job fairs and other events
with employers” (43.9%); “job search consulting services” (40.8%); “soft
skills training services (38.8%); “information about training opportunities
(38.8%); and “job hunting skills” (27.6%).
• Men insisted more on the need for services related to “hosting job fairs
and other events with employers” (51%) and “soft skill training services”
(42.9%) than women (36.7% and 34.7%, respectively)
• SS graduates insisted more on the need for services related to
“information about training opportunities” (27.4%) than ES graduates
(21.8%). By contrast, ES graduates expected more services that would
“provide more job opportunities for each major” (58.2%) and “more job-
hunting skills” (21.8%) than SS graduates (36.8% and 15.8%, respectively)

20
The main reason for
inactive graduates not
looking for a job was
to continue studying
Only 2.3% of the surveyed graduates were inactive (neither working nor
looking for a job)
• Among inactive graduates, the main reason for not looking for a job was
to “keep on studying” (66.7%). The other reasons represented far fewer
graduates (e.g., “taking care of family and/or housework, 11.1%)
GRADUATES’ JOB CHARACTERISTICS.
The employment rate
was high (91.2%)
among graduates
Most of the graduates were employed (82.6%); whereas 6.2% were self-
employed
• Only 8.8% of the graduates were actively searching for a job
• Only 2.3% of the graduates were unemployed and not looking for a job
(inactive graduates)
56.1% of graduates
worked in private
companies
In addition to private companies, a relevant number of graduates
worked in Foreign Direct Investment companies (23.7%)
• 10.5% of graduates worked in public organizations, 3.6% in public-
private ventures, 2% in foreign organizations, and only 0.3% in NGOs
• Men worked in Foreign Direct Investment companies (27.6%) more often
than women (20.8%)
• Women (62.4%) worked in private companies more often than men
(54.1%)
• Graduates in Social Sciences (SS) worked in private companies (61.8%)
more often than graduates in Engineering and Science (ES) (53.5%)
• ES graduates (30%) worked in Foreign Direct Investment companies
more often than SS graduates (19.6%)
Graduates worked in a
very wide range of
sectors
The two biggest groups of graduates worked in the “manufacturing”
(17.2%) and “banking, finance, and insurance” (10.7%) sectors
• Other sectors where graduates worked were the following: “education
and training” (6%); “wholesale, retail, and repairs” (5.7%); “professional,
science, and technological activities” (5.6%); “agriculture, forestry, fishery”
(5.6%); “construction” (5.6%); “information and communication” (5.2%). In
general, other sectors each represented less than 5% of graduates
• Women and men differed in their profiles. Women were more present
than men in “transportation and logistics”, “food-accommodation
services”, “banking-finance-insurance”, “administrative-supportive
services”, and “education and training”. Men were more present than
women in: “manufacturing”, “electricity-fuel-gas (energy)”, “construction”,
and “professional-science-technology”
• SS graduates and ES graduates also differed in their profiles. SS
graduates worked in the following sectors more often than ES graduates:
“banking, finance and insurance”; “food, accommodation services”;
“transportation and logistics”; and “administration and supportive
services”. By contrast, ES graduates worked in the following sectors more
often than SS graduates: “professional, science, and technological
activities”; “electricity, fuel, oil, and gas”; “construction”; “agriculture,
forestry, and fishery”; “information and communication”; and “education
and training”

21
Most graduates
worked in large (more
than 300 employees)
or small (between 11
and 200 employees)
companies
43.8% of graduates worked in large companies, whereas 39.5% worked
in small companies
• 10.2% of graduates worked in micro-companies (up to 10 employees),
whereas only 6.5% of graduates worked in medium-size companies
(between 201 and 300 employees)
• Women worked in micro (11.6%) and small companies (43.8%) more
than men (8.8% and 35.5%, respectively)
• Men worked in large companies (48%) more than women (39.1%)
• ES graduates worked in large companies (49.2%) more than SS
graduates (39.2%)
• SS graduates worked in small companies (44.5%) more than ES
graduates (33.4%)
56.3% of the graduates
worked in a different
region from the one
where their families
live
Although working in a different region from the one where their
families live predominated among graduates, another large group of
graduates worked in the same town (13.4%), province (18%), or region
(9.1%) where their families live
• Only 3.3% of the graduates surveyed worked abroad
• Women worked more in places closer to cities where their families live
(46.9% in the same town, province, or region) than men (34.7%)
• Men worked more in places in a different region from the one where
their families live (60.2%), or abroad (5.1%), than women (51.8% and 1.3%,
respectively)
• SS graduates worked more in places closer to cities where their families
live (43.8% in the same town, province, or region) than ES graduates
(36.6%)
• ES graduates worked more in places in a different region from the one
where their families live (59.9%) than SS graduates (53.2%)
Graduates worked in a
very wide range of
functional areas within
companies
The two biggest groups of graduates worked in “production and/or
provision of services” (20.9%) and “sales and marketing” (18%) functional
areas
• Other functional areas where graduates worked were the following:
“quality control” (10%); “customer service” (8.6%); “administration and
finance” (7.8%); “research, development, & innovation” (6.9%); “general
management” (6.5%); “computing” (5.9%); and “education” (5.2%). Other
functional areas each represented less than 5% of graduates
• Women and men differed in their profiles. Women worked in
“Administration and finance”, “computing”, “customer services”,
“education”, and “logistics” more often than men. By contrast, men
worked in “Production and/or provision of services”, “quality control”, and
“Research, Development & Innovation” more often than women
• SS and ES graduates also differed in their profiles. SS graduates worked
in “sales and marketing”, “administration and finance”, “customer
services”, “computing”, and “logistics” more often than ES graduates. By
contrast, ES graduates worked in “production and/or provision of
services”, “quality control”, “education”, and “research, development &
innovation” more often than SS graduates

22
GRADUATES’ JOB QUALITY
Job content matched
graduates’ degree
content in 53% of
graduates
Regarding the horizontal match (i.e., the relationship between the
content of the graduates’ job and the content of their university degree),
53% of the graduates had a job with a high (“quite” or “a lot”) horizontal
match, whereas 47% had a job with a low (“little” or “none”) horizontal
match.
• Most male graduates (59%) had jobs with a high horizontal match,
whereas only 47% of female graduates had this type of job.
• Focusing on graduates’ majors, most graduates in Engineering and
Science (ES) (59%) had jobs with a high horizontal match, whereas only
48% of graduates in Social Sciences (SS) had this type of job.
The percentage of
over-educated
graduates was very low
(5.7%)
Most of the graduates (85.7%) indicated that the level of education
required in their current job was a college or university degree.
• 8.7% had jobs requiring a master’s degree or a higher level.
The percentage of
over-qualified
graduates was low
(18%)
Regarding the vertical match (i.e., the degree to which graduates’
competences matched the requirements of their jobs), 71% of the
graduates reported a good match.
• 11% of the graduates reported being under-qualified.
• More women (75%) than men (68%) reported a good vertical match.
• More men (14%) than women (7%) reported being under-qualified.
Half of the graduates
(51%) had jobs with
both a horizontal and a
vertical match
Regarding a double match (i.e., the degree to which the surveyed
graduates reported a horizontal and/or vertical match), 51% reported
having jobs with both a horizontal and a vertical match.
• 42% of the graduates reported having jobs with a vertical match, but a
low horizontal match.
• More men (58%) than women (42%) reported having jobs with a double
match.
• More graduates in SS (61%) than in ES (39%) had jobs with a low
horizontal match and a high vertical match.
83% of the graduates
surveyed were
entry-level employees
Regarding the hierarchical level, only 15% of the graduates occupied
supervisory/managerial positions.
• More men (19%) than women (11%) occupied supervisory/managerial
positions.
• More graduates in ES (19%) than in SS (13%) occupied
supervisory/managerial positions
Most graduates (87%)
signed a formal written
employment contract
Only 13% performed their jobs without a formal written employment
contract.
• Men (89%) had formal contracts more often than women (85%).
• More graduates in ES (89%) than in SS (85 %) had formal contracts.

23
70% of the graduates
had long-term jobs
Regarding contract duration, 11% had short-term jobs, and 17% had a
job with an unidentified-term job.
• More graduates in ES (73%) than in SS (67 %) had long-term jobs.
Most of the graduates
(97%) had full-time
jobs
The percentages of part-time vs. full-time jobs were similar for men and
women, and for ES and SS graduates.
Almost two thirds of
the sample (64%) had
monthly incomes of
between 5 and 10
million Vietnamese
dongs
In the case of monthly income, 11% had a monthly income below 5
million dongs, and 25% had a monthly income above 10 million.
• Men had a greater monthly income than women. 38% of male graduates
had a monthly income above 10 million dongs, whereas this percentage
was 11% for female graduates.
• ES graduates had a greater monthly income than SS graduates. 34% of
ES graduates had a monthly income above 10 million, whereas this
percentage was 18% for SS graduates.
The average level of
work satisfaction was
slightly above the
intermediate point
In terms of work satisfaction, the surveyed graduates were moderately
satisfied with their work. The average score in the sample was 2.83
(response scale:
1. Very dissatisfied, 2. Dissatisfied, 3. Satisfied, 4. Very satisfied;
intermediate point = 2.5).
• There were no relevant differences between the work satisfaction scores
of male (2.85) and female (2.81) graduates, or between ES (2.87) and SS
(2.80) graduates.
SOFT COMPETENCIES AND EFFECTIVE PERFORMANCE
Cognitive
competencies highly
necessary for
graduates in order to
effectively perform
their jobs.
Participants in the study reported on the importance of cognitive
competencies in their job performance. On a scale from 1 (none) to 5 (a
lot), the ranking of importance as assessed by the total sample is as
follows: Problem solving (4.26), continuous learning (4.20), systematic
thinking (3.89), creativity (3.76), critical thinking (3.74), report writing
(3.66), and transferring theory into practice (3.59).
• Graduates in ES score significantly higher on creativity (3.87) compared
to SS graduates, whereas SS score higher on critical thinking (3.76) than
graduates in Engineering and science.
• Moreover, males score significantly higher than women on Creativity
(3.90), systematic thinking (3.78), and Report writing (3.73).
Cognitive
competencies are more
necessary for
graduates working in
jobs that fit their
Degree specialty and
When data are split on the basis of the quality of the job in terms of the
vertical and horizontal fit (vertical fit indicates that the job requires
University studies, and horizontal fit indicates high correspondence
between the discipline of the degree and the field of practice of the job),
the graduates working in jobs with a high vertical fit and a high horizontal
fit present significantly higher average scores than the other groups (see
for comparison purposes the average scores after the slash in each

24
require a university
degree
competency). They declare that in order to perform their jobs effectively, it
is extremely important to be competent in Problem solving (4.3/3.8),
continuous learning (4.3/3.6), Systematic thinking (4.0/3.2), critical thinking
(3.9/3.3) creativity (3.9/3.2), report writing (3.8/2,7), and transferring theory
into practice (3.8/2.8).
Management
competencies are
highly necessary in
order for graduates to
effectively perform
their jobs.
University-graduate employees often need to have management
competencies in order to effectively perform their jobs. In fact, on a scale
from 1 (none) to 5 (a lot), the ranking of importance of the management
competencies considered is as follows: Planning (4.03), decision making
(4.01), time management (4.01), motivating others (3.74), and leadership
(3.69).
• Interestingly, the graduates in ES score significantly higher on decision
making (4.09) compared to graduates from SS, whereas SS score higher
on motivating others (3.82) and leadership (3.77) than ES graduates.
• Males score significantly higher than women on most management
competencies: Planning (4.08), decision making (4.08), motivating others
(3.81), and leadership (3.79).
Management
competencies are more
necessary for
graduates working in
jobs that fit their
Degree specialty and
require a university
degree.
When data are desegregated based on the quality of their job in terms
of vertical and horizontal fit (vertical fit indicates that the job requires
University studies, and horizontal fit indicates high correspondence
between the degree and the field of practice), the graduates working in
jobs with a high vertical fit and a high horizontal fit present significantly
higher average scores than the other groups on every competency (after
the slash, see the figures for the low-low fit group, for comparison
purposes). To effectively do their jobs, it is very important for them to be
competent in Planning (4.20/3.5), decision making (4.20/3.5), time
management (4.10/3.5), motivating others (3.9/3.1), and leadership
(3.8/3.2).
Interpersonal
competencies are also
very important for
graduates in order to
effectively perform
their jobs
University-graduate employees often perform jobs that require relating
to others (mates, subordinates, customers, etc.) competently. According to
the information provided by the total sample of graduates on the survey,
the ranking of importance of these competencies is as follows:
communication skills (4.29), team work (4.01), negotiation skills (4.01),
customer relations skills (3.97), conflict solving (3.94) intercultural skills
(3.89), and presentation skills (3.75).
• ES graduates score significantly higher on teamwork (4.10) compared to
SS graduates. In turn, the SS graduates score higher on communication
skills (4.32) and negotiation skills (4.05)
• Moreover, males score significantly higher than women on teamwork
(4.10) and presentation skills (3.82), whereas women score significantly
higher on customer relations skills (4.03).
Interpersonal
competencies are more
important for
graduates working in
jobs that fit their
When we compare the average obtained for the group of graduates
employed in jobs with high vertical and horizontal fit with the other three
groups on the need for these competencies for effective job performance,
they present significantly higher scores on every competency. We rank
these competencies according to their scores in the high-high fit group,

25
Degree specialty and
require a university
degree
and after the slash we provide the average score for the low-low group
for comparison purposes: communication skills (4.40/4.0), teamwork
(4.10/3.5), negotiation skills (4.10/3,7), customer relations skills (4.0/3,8),
conflict solving (4.0/3.7) intercultural skills (4.0/3.5), and presentation skills
(3.90/3.2).
Instrumental
competencies are
important for
graduates in order to
effectively perform
their jobs.
University-graduate employees often perform jobs that require
instrumental competencies that are rather horizontal and relevant for
many jobs. In our study, we have addressed office skills, computer skills,
and foreign language skills. According to the information provided by the
total sample of graduates on the survey, the ranking of importance of
these competencies for their job performance is the following: computer
skills (4.05), office skills (3.89), and foreign languages skills (3.84).
• ES graduates score significantly higher on foreign languages skills (3.95)
compared to SS graduates. In turn, the SS graduates score higher on
office skills (3.95).
• Regarding gender differences, males score significantly higher than
women on office skills (3.98).
Instrumental
competencies are more
necessary for
graduates working in
jobs that fit their
Degree specialty and
require a university
degree
When we compare the average obtained for the employed graduates in
jobs with high vertical and high horizontal fit with the other three groups
(coming out from different fit conditions) in the need for instrumental
competencies for effective job performance, the group with high-high fit
presents significantly higher scores on every competency. We rank these
competencies according to their scores in the high-high fit group, and
after the slash, we provide the average score for the low-low fit group for
comparison purposes: computer skills (4.17/3.0), foreign languages skills
(3.98/3.08), and office skills (3.96/3.11)
Attitudinal
competencies are very
important for
graduates in order to
perform effectively
their jobs
The attitudes graduates show when performing their jobs influence
their performance. Effective and excellent performance requires these
horizontal competencies, which if not enacted, may hamper even good
technical performance. This is clearly acknowledged by the participants in
the survey. According to the information provided by the graduates, the
ranking of importance of these competencies is as follows: accept
responsibility (4.24), punctuality (4.15), adaptability (4.14), rule compliance
(4.06), commitment (3.91), and entrepreneurship (3.54).
• ES graduates score significantly higher on commitment (3,95) and
entrepreneurship (3,68) compared to SS graduates.
• Men score significantly higher than women on rule compliance (4.11),
commitment (3.95), and entrepreneurship (3.68).
Attitudinal
competencies are more
necessary for
graduates working in
jobs that have a high
Degree-specialty fit
and require a
university degree
When comparing the average of the group of graduates employed in
jobs with high vertical and high horizontal fit with the other three groups,
they present significantly higher scores on every attitudinal competency
considered. We rank these competencies according to their scores in the
high-high fit group, and after the slash, we provide the average score for
the low-low group for comparison purposes: accept responsibility
(4.3/3.9), punctuality (4.3/3.8), adaptability (4.2/3.9), rule compliance
(4.2/3.6), commitment (4.0/3.7), and entrepreneurship (3.7/3.1).


27
CHAPTER 1:
INTRODUCTION

28
CHAPTER 1: INTRODUCTION
1.1. Higher education in Vietnam
The number of higher education institutions in Vietnam grew strongly from 2000 - 2012 and has
tended to level off since 2012. By December 2017, there were a total of 235 (undergraduate)
universities in Vietnam, excluding the military and police universities. Figure 1.1. presents the
growth trend of universities and colleges (both public and private) in the period from 2000 to
2018. It shows that the total number of universities tripled in the period from 2000-2012 and
then levelled-off. The demarcation between private and not-for-profit institutions remains vague
because Vietnam mainly uses the term "private" to indicate only those not owned by the state.
Universities are primarily administered by central ministries, most of which are under the
management of the Ministry of Education and Training (MOET), as seen in Table 1.1.
Figure 1.1. The number of universities in Vietnam, 2000-2017
Source: Statistics from MOET
Table 1.1: Classification of universities by administrative agency (2017)
Number of universities Of public universities (%) Of total
universities (%)
Public 170
72.3
National university 2 1.2 0.9
MOET 35 20.6 14.9
Other Ministries 91 53.5 38.7
Local Authority 42 24.7 17.9
Private 65
27.7
Total 235 100
Source: Consolidated from MOET 2018
52
57
60
64
68
71
79 109
100
101
103
113
150
153
156
159
163
170
17
17
17
17
19
22
25
30
40
45
46 50
54
54
58
60
60
65
0
50
100
150
200
250
2000
2001
2002
2003
2004
2005
2006
2007
2008
2009
2010
2011
2012
2013
2014
2015
2016
2017
Public Private

29
The number of students rose significantly and faster than the number of universities, which has
led to overcrowding in a few universities. The number of university students in Vietnam
increased from 124,000 students in 1991 to 1,707,000 students in 2017. In other words, the
number of students doubled in around 7 years, which means that the total number of students
enrolled during this period increased to almost 14 times the original number. These increases,
however, disproportionally occurred in a few well-known universities, causing these universities
to be overwhelmed and struggle to meet the explosion in demand. Many newly established
private universities still struggle to meet the enrolment threshold (Crawford and Tran, 2015). The
number of faculties also faces a similar challenge. The proportion of students/faculty on average
has been multiplied by four, having risen to over 50 students/faculty at some institutions. The
quality of the teachers is generally still considered to be low compared to common international
standards. The number of faculty members with doctoral degrees has remained relatively stable.
As Figure 1.2 shows, during this 17-year period, the percentage of faculty members with
doctoral degrees did not change. This suggests that the quality of training, reflected in
competencies gained by graduates, may suffer.
Figure 1.2: Faculty with doctoral degrees at universities and colleges during the period 2000 – 2017
Source: MOET
Universities and colleges in Vietnam are quite different in size, with a few large universities co-
existing with numerous small ones. Figure 1.3. shows a picture of land use of a representative
sample of 42 universities, and their enrolment numbers in undergraduate and postgraduate
programmes. This figure shows that a small number of large cases account for a large
proportion of students, and institution sizes drop significantly towards the tail of the probability
distribution. The distribution of enrolled students demonstrates that the group of 14 major
universities as of 2012/2013 (accounting for about 5% of institutions) attracts nearly one-third of
undergraduate students and nearly two-thirds of graduate students. These 14 institutions (under
the management of many different ministries) are called the "key universities" or "national key
universities".
0.0
5.0
10.0
15.0
20.0
25.0
2000
2001
2002
2003
2004
2005
2006
2007
2008
2009
2010
2011
2012
2013
2014
2015
2016
2017
PhDs in University PhDs in College
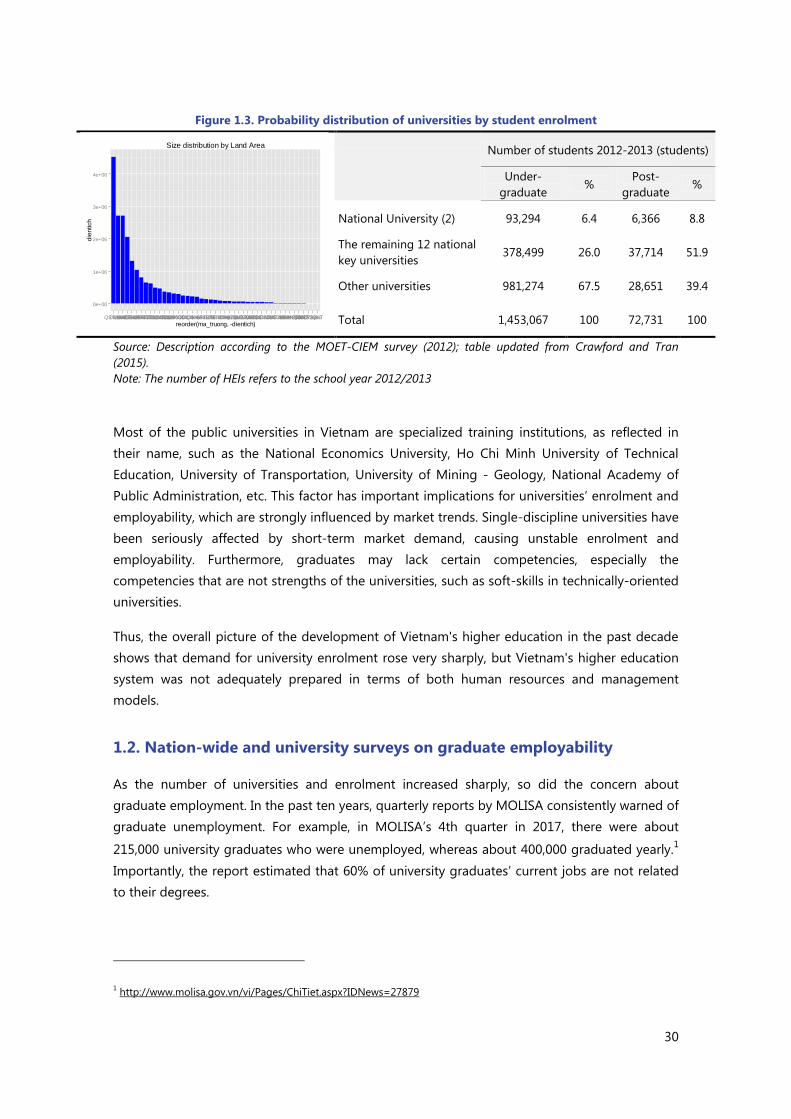
30
Figure 1.3. Probability distribution of universities by student enrolment
Number of students 2012-2013 (students)
Under-
graduate %
Post-
graduate %
National University (2) 93,294 6.4 6,366 8.8
The remaining 12 national
key universities 378,499 26.0 37,714 51.9
Other universities 981,274 67.5 28,651 39.4
Total 1,453,067 100 72,731 100
Source: Description according to the MOET-CIEM survey (2012); table updated from Crawford and Tran
(2015).
Note: The number of HEIs refers to the school year 2012/2013
Most of the public universities in Vietnam are specialized training institutions, as reflected in
their name, such as the National Economics University, Ho Chi Minh University of Technical
Education, University of Transportation, University of Mining - Geology, National Academy of
Public Administration, etc. This factor has important implications for universities’ enrolment and
employability, which are strongly influenced by market trends. Single-discipline universities have
been seriously affected by short-term market demand, causing unstable enrolment and
employability. Furthermore, graduates may lack certain competencies, especially the
competencies that are not strengths of the universities, such as soft-skills in technically-oriented
universities.
Thus, the overall picture of the development of Vietnam's higher education in the past decade
shows that demand for university enrolment rose very sharply, but Vietnam's higher education
system was not adequately prepared in terms of both human resources and management
models.
1.2. Nation-wide and university surveys on graduate employability
As the number of universities and enrolment increased sharply, so did the concern about
graduate employment. In the past ten years, quarterly reports by MOLISA consistently warned of
graduate unemployment. For example, in MOLISA’s 4th quarter in 2017, there were about
215,000 university graduates who were unemployed, whereas about 400,000 graduated yearly.1
Importantly, the report estimated that 60% of university graduates’ current jobs are not related
to their degrees.
1 http://www.molisa.gov.vn/vi/Pages/ChiTiet.aspx?IDNews=27879
0e+00
1e+06
2e+06
3e+06
4e+06
QST219DHHUELNH055DHCTHOMBS289THV047NHF041TTG279HDT046TAG248DCN033SKH068TDL256DDM034DPY267DDKDQNCGHXXX054KHA050SPD258DTENHHYTB084DPQDHK231HHT042CQU270HVA246TGC020XXX024SPS275DDS241XDA080DHTTYS288KTA051MHNXXXXX256HYD030HQT027TDH072MTS263LPS262QHT
reorder(ma_truong, -dientich)
die
ntich
Size distribution by Land Area

31
MOET has also given priority to increasing graduate employability. Several measures have been
introduced:
- Since 2016, universities are required to conduct graduate employment surveys and send
reports to MOET (Resolution 97/NQ-CP, dated 04/11/2016 of the Government).
- Employability, based on universities’ self-reports, has become a criterion for the enrolment
quota given to each university (Circular 05/2017/TT-BGDĐT, dated 25/ 01/2017)
The most recent report from the Higher Education Department (MOET) (16/4/2018) reports
several figures: 2
- In 2015, there were 175,781 graduates, of which 141,381 participated in university
employability surveys (80.4%). Of the surveyed graduates, 112,694 graduates were
employed (80%), and 9091 graduates continued to study (6.4%).
- In 2016, 233 universities conducted employability surveys. The reported results were that
82% of the graduates surveyed had jobs after 12 months (82%). Fields with the highest
unemployment rates include Education and Teacher Training (19%), Social Services (19%),
Environmental Studies (17%), and Legal Studies (17%). Those with the lowest
unemployment rates are Architecture (7%), Health (7%), and Technology (9%).
Reports by MOLISA and MOET have provided some overall indicators of employability, i.e.,
overall employability ratios and the most employable fields. In these reports, there are gaps
between the competencies required for jobs and those provided by universities. Furthermore,
there is inconsistency in the methods used by different agencies in conducting the surveys.
Since 2016, universities are required to conduct surveys and report graduate employability 12
months after graduation. In 2017, 233 universities sent reports to MOET. Although the reports
provide some indications of employability, there are reservations about using these results:
- Universities conducted employability surveys based on the administrative order from
MOET, not necessarily on their own volition. Thus, commitment to conducting quality
surveys is not guaranteed. In addition, the reported employability rates were used to decide
on the enrolment quotas for the universities. This raises a potential conflict in conducting
the survey and reporting the results.
- Although MOET gave some instructions about reported indicators, there have been no
guidelines for survey methods and processes. The methods and processes could be vastly
different across universities, raising concerns about the reliability of the results.
- Most universities have conducted employability surveys to fulfil administrative orders
2 Employability of university graduates in 2016 – a compilation from universities’ self-reports. Department of Higher
Education, Ministry of Education and Training, Hanoi, Vietnam, dated 16/4/2018.

32
and/or have input for their public relations. The feedback has not been adequately used to
improve curricula and/or academic offerings.
In this context, a carefully designed survey with the clear purpose of giving feedback to
education programs would be helpful to Vietnamese universities. Hence, we have EVENT!
1.3. Vietnamese labour market
1.3.1. Labour force
Vietnam is a country with a young population and a labour force of 54.8 million people,
accounting for 58.5 percent of the population in 2017. The labour force is continuously
increasing over time. For example, the labour force of 38.5 million in 2000 increased to 54.8
million people in 2017, representing an annual growth of approximately 2.1 percent. The
employed labour force working in state, foreign-invested, and non-state sectors accounted for
8.6, 7.8, and 83.6 percent, respectively. There is a downward trend in the share of the employed
labour force in the agricultural sector and an upward trend in the share of the employed labour
force in the industrial and service sectors. In 2017, employment in the agricultural sector was
40.2 percent, a sharp drop from the 55.1 percent in 2005; the industrial sector employs 25.7
percent of the working labour force, and the other 34.1 percent work in the services sector.
Figure 1.4. Shares of the employed labour force by sectors in 2017
Source: Consolidated from GSO data
Urban areas accounted for around 32 percent of the employed labour force, whereas the rest
were employed in rural areas. Male employees accounted for 52 percent of the Vietnamese
workforce, which is slightly different from the female share. The workforce between the ages of
15 and 39 currently accounts for nearly half of the total labour force. The share of skilled
workers of working age in 2017 was estimated at 21.5 percent, increasing slightly over time.
55.1
52.9
52.3
51.5
49.5
48.4
47.4
46.7
46.3
44
41.9
40.2
17.6
18.9
19.3
20
20.9
21.3
21.3
21.2
21.4
22.8
24.7
25.7
27.1
28.1
28.4
28.5
29.5
30.4
31.4
31.9
32.3
33.1
33.4
34.1
0
10
20
30
40
50
60
70
80
90
100
2005 2007 2008 2009 2010 2011 2012 2013 2014 2015 2016 2017
Agriculture Industry Service

33
1.3.2. Unemployment
Recently, unemployment and underemployment rates are relatively low in Vietnam. In 2018, the
rate of unemployment in the working age group was 2.1 percent, of which rates for urban and
rural areas were 3.1 and 1.7 percent, respectively. The underemployment rate of working age
workers was 1.63 percent, of which rates for urban and rural areas were 0.86 and 2.1 percent,
respectively.
Figure 1.5. Unemployment rate in Vietnam, 2008-2018
Source: Consolidated from GSO number
Despite low unemployment and underemployment rates, the number of unemployed workers
with university degrees is relatively large. By the end of 2017, about 162,000 unemployed people
held bachelor’s degrees, accounting for 13.0 percent of unemployment. This raises a question
about a mismatch between universities and the labour market.
1.3.3. Productivity and wages
Vietnam's labour productivity has improved significantly over the years. Its average growth rate
was 11.3 percent from 2010-2017, and labour productivity doubles every five years. However,
labour productivity is still low compared to other countries in the region, and the absolute
distance is continuously increasing. Labour productivity in the Agricultural sector is low, equal to
38% of the average labour productivity for the whole economy, whereas labour productivity in
industrial and service sectors is 20 and 6 times the productivity in the agricultural sector,
respectively. From 2010 to 2017, the sectors with high labour productivity were mining,
production and distribution of electricity and gas, finance, insurance, technological activities, real
estate, and water supply. At the other extreme, the agricultural sector has the lowest labour
productivity. Improving labour productivity in the agricultural sector should be a serious part of
the government’s agenda.
0.00
0.50
1.00
1.50
2.00
2.50
3.00
3.50
4.00
4.50
5.00
2008 2009 2010 2011 2012 2013 2014 2015 2016 2017 2018
Country Urban Rural

34
Figure 1.6. Labour productivity and salary, 2005-2017
Source: Consolidated from GSO data
Wages and salaries in Vietnam are very dissimilar across occupations, and there is a stark
contrast between urban and rural areas. The average annual salary per person in Vietnam is
around VND 76.3 million dong (US$3500), and it is differentiated by many factors, such as
regions, industries, and ownership. From 2010-2017, the annual average growth rate of
productivity was 11.3 percent, whereas it was 10 percent for the average wages. State-owned
enterprises paid the highest average monthly wages, compared to FDI and private sector firms
in 2017, about VND 11.01 million (US$ 469) per month. The average monthly wage in FDI firms
was VND 9.04 million (US$ 386), and private firms paid their workers VND 7.37 million (US$ 314)
per month. Regions that have attracted the majority of the FDI in the past few years have the
highest salaries in the country, such as Ba Ria-Vung Tau, Ho Chi Minh city, Hanoi, and Bac Ninh.
Among all the economic sectors, services and industry had the highest average monthly income
at VND 9.41 million (US$ 402), whereas agriculture had the lowest average monthly wages in
2017 at VND 5.25 million (US$ 225).
21.4
23.4
25.3
32.0
37.9
44.0
55.2
63.1
68.7
74.7
79.4
84.5
93.2
19.7
21.1
28.2
32.4
36.3
39.1
45.3
53.6
61.7
65.9
68.3
71.9
76.3
0
10
20
30
40
50
60
70
80
90
100
2005 2006 2007 2008 2009 2010 2011 2012 2013 2014 2015 2016 2017
Productivity (mil.dong/year) Salary (mil.dong/year)

35
1.3.4. Challenges in the labour market
The Vietnamese labour market is facing some major challenges, including lack of skilled labour,
the impact of industry 4.0, and the need for labour reforms due to the upcoming free trade
agreements (MOLISA and GSO, 2019; Das, 2018)3. First, lack of skilled labour is a chronic issue in
the Vietnamese labour market. Although the Vietnamese government has taken steps to
increase vocational and technical training in order to meet the requirements of the labour
market, only 22.2 percent of the employed labour force were trained by universities granting
degrees/certificates. Many FDI firms have been struggling to hire skilled labour in Vietnam, and
around 40 percent of FDI firms in Vietnam find it difficult to recruit skilled employees (Das,
2018). Lack of skilled labour will slow down the economic transition from labour-intensive to
high-tech production, which will reduce the country’s competitiveness. Second, there are
challenges due to the impact of industry 4.0. Global businesses are moving quickly towards
Industry 4.0, which would impact current and future labourers because industry 4.0 will create
totally new jobs and require high skills and competences. It is predicted that the youth
unemployment rate will be higher, and as Industry 4.0 approaches, the shortage of skilled
workers will become much more pronounced. If the Vietnamese government does not take
steps to enhance human capital, it will have a significant impact on the economy. Third, there
are challenges due to free trade agreements (FTA). Vietnam is an active country in signing free
trade agreements with 12 signed FTAs, with four others in final discussions. When the
Comprehensive and Progressive Agreement for Trans-Pacific Partnership (CPTPP) and the EU-
Vietnam FTA come into effect, labour costs are predicted to be higher. These FTAs are beneficial
because they improve market access for Vietnamese exporters, but the government needs to
focus on labour reforms, skills, and governance to fully realize the benefits of the agreements.
The FTAs require members to adopt and maintain the rights stated in the 1998 ILO Declaration,
institutions, and practices because labour rights are among the key provisions. Although
Vietnam has taken steps to meet the requirements through institutional and legal reforms, more
needs to be done in terms of enforcement.
1.4. The project
This project responds to the needs of Vietnamese higher education institutions. Unemployed
university graduates recently initiated a public debate and discussion about the government
agenda. Officials from the Ministry of Education and Training (MOET) and the Ministry of
Labour, Invalids and Social Affairs (MOLISA) have publicly commented that the unemployment
of university graduates in Vietnam stems from a mismatch between the education offered and
the demands of the labour market. The feedback from the labour market seems to highlight
this, but employers also mention a lack of “soft” competencies in newly graduated job
3 MOLISA and GSO (2019). Quarterly labor market update 2018, Hanoi.
Das, K. (2018). Labor market trends in Vietnam, Vietnamese Briefing
36
applicants. Responses from graduates suggest that there is a lack of actors bridging the gap
between universities and employers, whereas MOLISA has stated that there is a surplus of
graduates recently, given the country’s current economy. Moreover, the information on the real
state of employment of university graduates is not sufficient for universities developing curricula
or for MOET and MOLISA in their management duties. Performing a detailed tracer study would
benefit all partners by designing a standard tracer study and providing evidence for curriculum
development and management by related ministries. This study potentially identifies the areas
where the academic education offered by our partner universities does not fit the demands of
the labour market.
1.4.1. Universities involved
Three European and five Vietnamese universities were involved in this project. In this section, the
role of each partner in the project is briefly described.
Uppsala University is a coordinator of the project, ensuring that all objectives are met, making
sure all indicators are measured in the quality control of the project, and guaranteeing that
activities are carried out as described in the proposal. The University of Valencia, one of the
most outstanding Spanish universities in both national and international rankings, plays a
significant role in the project. It contributes to the different packages designed in the project,
and it leads the work package for the tracer studies. The University of Groningen is a research
university with a global outlook, and it is currently in the top 100 on several influential ranking
lists. The university contributes to the projects in different packages by developing tracer
studies, teaching research methodology, and providing input to develop the career centres of
Vietnamese university partners.
The five Vietnamese university partners include the National Economics University (NEU), Hanoi
University of Industry (HaUI), University of Hue (HU), Ho Chi Minh city University of Technology
and Education (HCMUTE), and Ho Chi Minh City University of Technology (HUTECH). The
National Economics University is one of the leading universities in Economics, Management and
Business Administration, with more than 45,000 students currently enrolled. It is the current
chair of the network of more than 40 universities offering economics and business
administration degrees in Vietnam. Participating in this project, the role of NEU involved
conducting the tracer study, the career centre, and web-portal development. HaUI is the oldest
technical university in Vietnam, offering many technical majors and training degrees. It currently
has 27,000 students enrolled in different levels: college, university, and post-graduate. HaUI
takes the lead in the work package on dissemination and exploitation of the project, it
participates in all project activities, and it assists the coordinator in the management of the
project. Hue University has been recognized as a key academic and scientific research hub for
central Vietnam and the whole country. It has succeeded in building its position as a prestigious
institution in the Vietnamese higher education system. Currently, it has 8 colleges under its

37
umbrella, with 47,000 students currently enrolled4. With its previous experiences in Erasmus
Mundus projects, HU participates in all the work packages of the project in order to further
enhance the university’s educational and academic roles in terms of support for student
activities, especially the employability of graduated students. HCMUTE is the first university in
Vietnam, educating and training technical teachers for the whole country. It offers quality
technology-oriented programs delivered at various levels of training and in different modes of
study. Current enrolment is 24,000 students, including both part-time and full-time training
modes. The university mainly participates in the career centre, the tracer study, and project
quality assurance. HUTECH has highly ranked and nationally recognized academic programs. It is
a home for students who desire to study in an intimate, scholarly, and dynamic atmosphere and
conduct their higher education in a trustworthy institution. The university assists the
coordinating institution with the implementation of the project by leading a work package on
the quality plan and by participating in all the other activities in the project.
1.4.2. Objectives of the project
The broad objective of the project is to increase the employability of university graduates in
Vietnam. To reach the central objectives, the project attempts to work towards the following
specific objectives:
Perform a detailed tracer study at partner universities. The data collected in this study would be
fed back to the curricula designers and higher education managers. This could potentially help
to identify the areas where the academic education offered by the partner universities does not
meet the demands of the labour market. This tracer study offers its methodology to other
universities in Vietnam, inviting them to do the same. This will potentially assist in bridging the
gap in the mismatch between education and work.
Design and host intensive workshops for teachers and educators in our Vietnamese partner
universities, raising awareness of the particular skills reportedly lacking in Vietnamese students.
International experts who are currently implementing models for how to reach both students
and university management stress the importance of raising awareness not only with university
teachers but also at the level of university management and with the students. The project,
therefore, aims to set up meetings with all the specified target groups, relying on data from the
tracer study, in order to create a permanent place for soft skills development at our partner
universities.
Develop a collaboration between partner universities and industry. A career centre plays a role
in student employability by bringing together the university, students, and industries. By
developing a web portal, it continues to gather information in line with the tracer study, adding
to the data already collected.
4 The eight colleges include Sciences, Education, Medicine, Agriculture & Forestry, Economics, Foreign Languages, Arts,
Law.

38
1.4.3. Connection to other parts of the project
The tracer study is an important work package under the umbrella of the project. By counselling
related stakeholders, this tracer study is conducted to respond to the need to understand the
employability of university graduates and provide feedback on curriculum design and
management. Results from the survey will reveal the real state of employment of newly
graduated university students in Vietnam, the competences and/or knowledge students need to
be trained in, and how to deliver this knowledge. The tracer study is closely associated with the
career centre work package because it provides feedback to adjust curriculums, feedback on
what competences the career centre should provide to meet labour market demands, and
feedback on how to do this. The tracer study also provides input to design a web-portal offering
appropriate services and a platform for collecting more regular data on the employment of
university graduates.
1.5. Contents and structure of the report
This report offers the main results of the study. After this introductory chapter, Chapter 2
presents the methodology of the study, describing the study sample and the questionnaire used
to collect the data. Chapter 3 offers the results obtained for the whole sample, distinguishing
different groups according to their employment status: employed, unemployed, and inactive
graduates. In chapter 4, we describe the results, disaggregating them by gender and comparing
the information obtained from male and female graduates. Chapter 5 analyses the results of the
different sections of the survey, splitting them by major category: Science and engineering vs.
social sciences. In chapter 6, we classify the graduates according to two types of matching: 1) a
vertical match (which analyses the fit between the level of education required by the job and the
highest level the graduate has achieved; and 2) horizontal matching (the fit or misfit between
the occupational area of the job held by the graduate and the disciplinary content of the
University degree with which s/he graduated. Finally, in chapter 7, a number of conclusions are
drawn from the results of the study, and recommendations from those conclusions are
presented for different stakeholders. The analyses of the data obtained from the graduates of
each University participating in the tracer study are carried out and reported by the team from
each University.

39
CHAPTER 2:
METHODOLOGY

40
CHAPTER 2: METHODOLOGY
2.1. Sample
This survey is conducted in five project-universities in Vietnam, including the National
Economics University (NEU), Hanoi University of Industry (HAUI), Hue University (HUE), Ho Chi
Minh City University of Technology (HUTECH), and Ho Chi Minh City University of Technology
and Education (HCMUTE). The targeted groups in the surveyed sample include students who
graduated in 2016. At the time of conducting the survey, these graduates had been already in
the job market for a year, and so they are suitable to participate in this tracer-study survey.
The sampling method is multistage-sampling. First, each university member decides on at least
three majors included in the survey. After selecting the majors, the universities provide the lists
of students who graduated in 2016 in the selected majors. Data on the students on the lists that
serve as a survey population include student name, gender, place of birth, major, minor, type of
training, email, telephone number,… Second, based on the proportion of graduates in each
major, the number of students in the survey sample is determined. The survey sample is
randomly selected by applying the Propionate Stratified Random Sampling Method. A statistic
software is used for random selection. Data collection must be conducted in the selected
sample. Third, replacement for the selected sample is also randomly prepared in advance. About
20% of the expected sample is reserved for replacement if the randomly selected graduates
cannot be reached, or if they refuse to participate the survey.
The final survey sample includes 1710 students covering two science fields: engineering and
social sciences. A detailed description of the sample is presented in section 2.3.
2.2. Data collection
2.2.1. Procedures
An online survey is employed by using the SurveyMonkey, which is an online survey
development cloud-based software. Respondents complete the survey questionnaire
anonymously online. The survey procedure includes several steps.
Survey upload and pilot: The questionnaire was designed and uploaded online using the
SurveyMonkey platform. This online survey was sent to each university to test whether any
issues arose. Three graduates from each university participated in the pilot. Some critical issues
to check were smoothness, transitional questions, and shifts in the questionnaire. Some minor
changes in the questionnaires and shifts were appropriately made after the pilot study to finalize
the online questionnaire.
Email confirmation: With the telephone numbers provided on the lists, the selected graduates
were called to confirm whether their active email address was the one on the lists. If not, they

41
were asked to provide a new email address. The confirmed emails were used to send out the
questionnaire to the selected graduates.
Participation invitation: An invitation letter, which was prepared in advance, was sent to the
selected graduates at their confirmed email addresses to ask for their participation. The
SurveyMonkey generates unique links to the survey questionnaire for each participant, and the
links were included in the invitation letter. The recipients just click “start survey”, attached in the
invitation letter, to directly participate in the survey.
Follow-up: The selected graduates were reminded three times during the duration of the survey
from December 2017 to March 2018. The reminder letter was also prepared in advance, and
only graduates who had not completed the survey were reminded. After three tries at different
times, if graduates did not respond to the survey, a replacement was made by randomly
drawing a name from the lists selected in advance.
2.2.2. Quality assurance
Quality of the survey is determined by many factors. Based on our research team’s experience,
many activities/solutions for online surveys help to mitigate the quality gap between
expectations and reality:
- Each project-member university was asked to provide necessary information about
students who graduated in 2016. The research team applied the same sampling methods
and data collection procedures in this project;
- Anonymity of the survey was applied to mitigate unbiased opinions and answers;
- Although we cannot do a random check for respondents with online surveys, other
measures to ensure the quality of the survey were applied. For example, one technique is
to put the time to complete the survey on a distribution curve, and surveys that take a
significantly short time to complete are viewed with caution. Another technique is to
check and deal with surveys containing missing values.
2.2.3. Sampling bias checks
Sampling bias occurs when a sample statistic does not accurately reflect the true value of the
parameters in the target population. In other words, in the selected sample, it is practically
impossible to ensure acceptable randomness and representation in sampling. Sampling bias is
problematic because it is possible to make systematically erroneous inferences. Therefore,
checking for sample bias is a necessary procedure in this survey.
First, the research team checks sampling bias by using participation shares from each university,
in order to check whether shares of survey participation by each university are significantly
different from its shares in the total population. The results are presented in Figure 2.1.

42
Figure 2.1. Shares of university participation in the population and survey sample
Empirical results indicate that the shares of each university in the sample and total population
are similar. Therefore, there is no evidence of sample bias in the participation of university
members.
Second, the research team checks sampling bias by using shares of respondents by gender and
major, in order to check whether shares of respondents, in terms of gender and major in the
sample, are similar to their shares in the population. Empirical results show that there is little
evidence of sample bias using the gender and major of graduates (See more in Figure 2.2.).
Figure 2.2. Shares of respondents by gender and major in the population and survey sample
27.1
21.9
14.0 14.3
22.7
24.8
20.1
16.5 16.0
22.7
0
5
10
15
20
25
30
NEU HAUI HUTECH HCMUTE HUE
Sample Population
24.5
59.2
69.2
95.5
41.9
26.9
60.0
55.0
96.4
40.6
0
20
40
60
80
100
NEU HaUi HUTECH HCMUTE HUE
Sampling bias by gender at university level
Male/Sam Male/Pop
52.5
44.0
52.2 49.9
0
10
20
30
40
50
60
Male students Social Sciences
Sampling bias by gender and majors
Sample Population

43
2.3. Description of the sample
The survey sample consists of 1710 students who graduated in 2016 from five universities and
follow the survey procedures presented above. Response rates of graduates from each
university are relatively high, compared to a common online survey, and the average response
rate is 54.8% of the total number of surveys sent out.5 Numbers of respondents and response
rates of member universities are presented in Figure 2.3.
Figure 2.3. Numbers of respondents and response rates of member universities
The survey sample covers graduates from 21 majors, of which 5 majors overlap among
universities. These majors are finally categorized into two larger science fields: Engineering and
Social Sciences. According to the survey sample, 44% of respondents belong to engineering,
56% are from the social sciences, 47.7% are female graduates, and 95% are from 23 to 26 years
old. The following figures show the demographic characteristics, majors, and university
composition of the survey respondents.
5 For example, the enterprise survey for the Provincial Competitiveness Index (PCI) conducted by VCCI has a response
rate of 9.8%, or the enterprise survey in the "Conflict of Interest survey" conducted by the World Bank Vietnam has a
response rate of 10.2% (WB & GI, 2016).
464
375
239 244
388
60.0 59.7
46.5 48.8
54.8
0
10
20
30
40
50
60
70
0
50
100
150
200
250
300
350
400
450
500
NEU HAUI HUTECH HCMUTE HUE
Respondents Response rates

44
Figure 2.4. Composition of the survey sample
2.4. Questionnaire
2.4.1. Questionnaire Development
The questionnaire used to collect data was developed in a series of different stages. The most
important stages are briefly described next. First, the structure of the questionnaire, its main
sections, and the variables to be measured were determined in the meeting that the project
members held in Ho Chi Minh City in April 3-7, 2017. In order to make these decisions, the
results of the two focus groups held by the project coordinator, in cooperation with the
University of Valencia (UV) Team, with groups of Vietnamese graduates and employers were
taken into account. Second, the project members from the UV and the National Economic
University (NEU) began to write the questionnaire items. Initially, a first draft version of the
questionnaire in English was created and later modified after several rounds of reviews between
the UV and NEU members. This modified draft version was sent out to other members of the
partner universities to gather their comments and suggestions for improvement. Once these
comments and suggestions had been incorporated, the resulting version was reviewed by
members from all partner universities in the meeting the project members held in Hue in
52.3 47.7
Respondents by gender
Male
Female
56.0
44.0
Respondants by field of study
Social Sciences
Engineering
27.1
21.9 14.0
14.3
22.7
Respondents by university
NEU
HAUI
HUTECH
HCMUTE
HUE

45
October 30 and November 1, 2017. The group review produced a new version of the
questionnaire that was translated into Vietnamese in the meeting. Then, the Vietnamese
questionnaire was uploaded onto an on-line platform in order to collect a small sample of data
that allowed us to conduct a pilot study. The aims of the pilot study were: 1) to check the
comprehension of the questionnaire content and the instructions for completing it; 2) to check
the time required to answer it (considering the different paths of the questionnaire depending
on the current employment situation of graduates; i.e., employed, self-employed, unemployed,
inactive); 3) to check that the filter question (current employment situation) introduced in the
questionnaire works well and is properly understood and followed by the respondents; and 4) to
check the functioning of the on-line platform. Data from a sample of 27 graduates from the five
partner universities were collected. The data provided by this sample were analysed and
discussed in a meeting held by the project members involved in the Tracer Study in Hanoi in
December 4-5, 2017. The conclusion of the pilot study was that the final version of the
questionnaire worked well.
2.4.2. Structure and content
The structure of the questionnaire is composed of five main sections:
1. Socio- demographic data
2. Employment situation
3. Employed graduates
4. Unemployed graduates
5. Inactive graduates
The socio-demographic section is composed of five items that ask subjects about:
1. the University where they obtained their (most recent) bachelor’s degree,
2. the major of their bachelor’s degree,
3. their gender,
4. their age, and
5. the year they initiated their bachelor’s degree
The second section is composed of two items that obtain information about:
1. the number of jobs they had after graduation, and
2. their employment situation at the time they answered the questionnaire.
This last question was used as a filter that allowed us to ask different questions to distinct
groups of subjects depending on their employment situation (i.e., employed, self-employed,
unemployed, inactive).
The third section is focused on employed graduates and is the longest section of the
questionnaire. In this section, subjects initially provide information about their first job:

46
1. Time needed to find first paid job after graduation
2. Strategies to find first paid job after graduation
Then, they are asked to provide detailed information about their current job:
1. Strategies to find current job after graduation
2. Horizontal match
3. Level of education required for current job
4. Vertical Match
5. Employer organization (type, sector, and size)
6. Location
7. Functional area
8. Hierarchical level
9. Formal written employment contract
10. Duration
11. Part-time vs full-time
12. Monthly income
13. Work satisfaction
14. Importance of a number of competences for good performance
The fourth section is devoted to unemployed graduates. Here, subjects respond to questions
about the following aspects:
1. Time they have been looking for a job
2. Job search strategies used
3. Their difficulties in finding a job
4. Their opinion about university career centres’ services
Finally, the fifth section is focused on inactive graduates. Here, subjects are asked about their
reasons for not looking for a job.
2.5. Analysis
The data collected were submitted to descriptive analysis. Depending on the nature of the
variable involved, we computed percentages or means to describe the variables measured in the
study sample. We also created appropriate graphs to represent the results obtained.
The descriptive analysis was conducted for the total sample of surveyed graduates and for the
different groups defined on the basis of the following variables: gender, bachelor major (Social
Sciences vs Sciences & Engineering), and graduate-job matching types (based on the degree to
which graduates’ jobs are related to the content of their degree and require university
education). The results obtained for the different groups were compared using appropriate
statistical techniques.

47
2.6. Limitations
The results reported here come from a large sample of Vietnamese university graduates.
However, a number of limitations have to be taken into account when interpreting the study
results. The data were collected from subjects who graduated from only five Vietnamese
universities. Moreover, although the surveyed graduates had a variety of bachelor majors, not all
the majors in the Vietnamese university system were included in the study. These characteristics
of the study limit the generalizability of its results to other universities and majors that are not
considered.


49
CHAPTER 3:
SURVEY RESULTS FOR THE TOTAL SAMPLE
OF GRADUATES

50
CHAPTER 3: SURVEY RESULTS FOR THE TOTAL SAMPLE
OF GRADUATES
In this chapter, we present the results obtained for the total sample of surveyed graduates. In
the first section, we focus on the employment situation graduates had at the time they
responded to the questionnaire. Because they were asked different questions depending on
their employment situation (e. g., employed, unemployed, inactive), after the first section we
present the results obtained for employed, unemployed, and inactive graduates.
3.1. Graduates’ employment status
3.1.1. Current employment situation
According to Figure 3.1. 82.6% of the graduates reported that they were employed at the time
they filled in the survey (Table 3.1). In addition, 6.2% were self-employed, and so at that time,
88.8% of the graduates were working, 8.8% were actively searching for a job, and 2.3% were
unemployed and not looking for a job (inactive graduates). Thus, the employment rate amounts
to 91.4% for the subjects in this study.
Figure 3.1. Current employment situation
82.6%
6.2% 8.8%
2.3%
0%
10%
20%
30%
40%
50%
60%
70%
80%
90%
100%
Employed Self-employed Unemployed and
looking for a job
Unemployed but not
looking for a job

51
3.1.2. Number of jobs since graduation
In all, 42.1% of the graduates reported that they had had just one job after graduation, whereas
another 36.4% declared that they had worked in two jobs since their graduation. Over 18%
declared more than two jobs during that period, and 3.3% informed that they had not worked
after they graduated (Figure 3.2).
Figure 3.2. Number of jobs since graduation
3.2. Employed graduates6
3.2.1. Time to find the first paid job after graduation
In order to find out how long it took the graduates to get a job, we asked them to report, first, if
they found their current job before or after they graduated; 53.4% reported they found the job
after graduation, whereas 46.5% were already employed when they graduated (Figure 3.3).
6 The term ‘Employed graduates’ includes self-employed graduates and graduates employed by an employer.
3.3%
42.1%
36.4%
13.9% 2.4%
1.9%
0 1 2 3 4 5+

52
Figure 3.3. When did you find your first paid job
Considering the graduates who found their first paid job after graduation, one third of them
found the job in one month, and nearly one fourth of them found it in two months (Figure 3.4).
However, 5.6% of these graduates needed 10 or more months to find their first paid job. In fact,
the average time to get their first job after graduation was 3.1 months, and the standard
deviation was 3.05.
Figure 3.4. The average number of months to find their first paid job after graduation
53.5% 46.5% After graduation
Before graduation
2.1%
33.3%
23.5%
14.7%
6.4% 5.5% 6.2%
0.8% 1.4% 0.6% 0.6% 0.3%
3.5%
0.1% 0.3% 0.5% 0.3%
0%
5%
10%
15%
20%
25%
30%
35%
40%
0 1 2 3 4 5 6 7 8 9 10 11 12 14 15 18 24

53
3.2.2. Strategies to find first paid job after graduation
The surveyed graduates were asked to report the three most important strategies they used to
find their first job (Figure 3.5). The most frequent strategy is social and/or professional internet
networks (30.6% of all the strategies mentioned). The second most important strategy is looking
at Internet portals, company websites, and the press (29,2%), followed personal contacts (25.2%)
and contacting the employer on his/her own (24.6%). Interestingly, formal means, such as
contacting employment agencies (1.9%) and universities’ employment services (4.5%), were
among the least frequently used strategies.
Figure 3.5. Strategies to find your first paid job after graduation or the job that you already had
when you graduated
3.2.3. Strategies to find the current job after graduation
The Figure 3.6 presents the results corresponding to the strategies participants used to find their
“current job” after graduation. A total of 10 alternatives were presented to participants, and they
had to choose up to 3 of them. Four strategies were used by participants more frequently than
the others: “Social and/or professional Internet networks” (32.2%); “Internet portals, company
websites, and press” (29.9%); “personal contacts” (27.2%); and “contacting the employer on their
own” (25.5%). The rest of the strategies were used much less by participants, including the use
of university employment services (4%).
30.6%
29.2%
25.2%
24.6%
12.5%
11.2%
4.5%
3.3%
1.9%
0.9%
0% 5% 10% 15% 20% 25% 30% 35% 40%
3. Social and/or professional Internet networks
8. Internet portals, company websites, and press ads.
1. Personal contacts
6. I contacted the employer on my own initiative
2. Practices in companies or institutions
4. The employer contacted me
9. Employment services of my university
5. Self-employment
7. By contacting employment agencies
10. Other means

54
Figure 3.6. Strategies to find your current job after graduation
3.2.4. Horizontal match
Results about horizontal match (Figure 3.7) indicate the existence of two very balanced groups
of participants. Of them, 53% perceived that their current job is quite (or a lot) related to the
content of their degrees, whereas 47% indicated low (little) or an absence (none) of horizontal
match.
Figure 3.7. To what extent is the content of your current job related to the content of your degree
3.2.5. Level of education required for the current job
According to the results of the survey study (Figure 3.8), most of the graduates (85.7%) indicated
that the level of education required in their current jobs was a college or university degree. By
contrast, only 8.7% perceived that a Master’s degree (or higher) is required.
33.2%
29.9%
27.2%
25.5%
12.6%
11.0%
4.8%
4.0%
2.8%
1.2%
0% 5% 10% 15% 20% 25% 30% 35% 40%
8. Internet portals, company websites, and press ads.
3. Social and/or professional Internet networks
1. Personal contacts
6. I contacted the employer on my own initiative
4. The employer contacted me
2. Practices in companies or institutions
9. Employment services of my university
5. Self-employment
7. By contacting employment agencies
10. Other means
15.7%
31.3%
35.3%
17.7%
0%
5%
10%
15%
20%
25%
30%
35%
40%
1. None 2. Little 3. Quite 4. A lot

55
Figure 3.8. What is the level of education required for your current job
3.2.6. Competences-job requirement match
Regarding a vertical match (Figure 3.9), most of the participants (71.2%) indicated that their
competencies match the requirements of their jobs. A group of them (18.1%) perceive that their
competencies are a little bit above (or considerably above) the requirements of the job, whereas
only 10.7% perceive that their competences are quite or a little bit below the requirements of
the job.
Figure 3.9. To what extent do your competences match the requirements of your job
0.6% 3.5% 1.6%
85.7%
8.7%
0%
10%
20%
30%
40%
50%
60%
70%
80%
90%
1. Below high
school
2. High school 3. Vocational
education
4. College and
University degree
5. Master degree
and higher
1.4%
9.3%
71.2%
15.4%
2.7%
0%
10%
20%
30%
40%
50%
60%
70%
80%
90%
1. My
competences are
quite below the
requirements of my
job
2. My
competences are a
little bit below the
requirements of my
job
3. My
competences
match the
requirements of my
job
4. My
competences are a
little bit over the
requirements of my
job
5. My
competences are a
quite over the
requirements of my
job

56
3.2.7. Employer organization
Type
As Figure 3.10 shows, most of the surveyed graduates (56.1%) worked in private companies,
whereas only 10.5% worked in public organizations. Of the remaining graduates, 23.7% were
employed in Foreign Direct Investment (FDI) companies, 3.6% worked in public-private ventures,
2% worked in foreign organizations, and only 0.3% worked in NGOs.
Figure 3.10. The organization you work for
Sector
Regarding the sector of economic activity of the company where the graduates worked, Figure
3.11 shows that the two sectors with the highest percentages were manufacturing (17.2%) and
“banking, finance and insurance” (10.7%). The remaining sectors showed percentages equal to
or less than 6%.
Figure 3.11. What is the sector of economic activity of your organization
56.1%
23.7%
10.5%
3.6%
2.0%
0.3%
0% 10% 20% 30% 40% 50% 60%
2. Private company/organization
4. FDI company
1. Public company/organization
3. Public-private venture
5. Foreign organization
6. NGO
19.8% 17.2%
10.7% 6.0%
5.7% 5.6% 5.6% 5.6%
5.2% 3.9% 3.7%
2.9% 2.7%
1.9% 1.6%
1.2% 0.6%
0.1%
0% 5% 10% 15% 20% 25%
18. Other services
11. Banking, finance and insurance
7. Wholesales, retails and repairs
1. Agriculture, forestry, fishery
10. Information and communication
4. Electricity, fuel, oil, gas
14. Administration and supportive services
16. Health and social protection
5. Water supply, waste and drainage

57
Size
As to the size of the companies where graduates worked (see Figure 3.12), most graduates
worked either in large companies (43.8%) or small ones (39.5%). Only 10.2% worked in micro
companies, and 6.5% worked in medium-sized companies.
Figure 3.12. How many employees does your company have
3.2.8. Location
Regarding the location of the graduates’ jobs, Figure 3.13 shows that for more than half of the
sample (56.3%), the job was located in another region apart from where the graduate’s family
lived. For 18% of the graduates, the job was located in the province where their families lived.
For the remaining cases, 13.4% of the graduates had a job in the town where their family lived,
and 9.1% in the same region where the family lives. Only 3.3% of the graduates worked abroad
in another country.
Figure 3.13. Where is your current job located
10.2%
39.5%
6.5%
43.8%
Micro (up to 10 employees)
Small (between 11 and 200)
Medium (between 201 and 300)
Large (more than 300)
0.0% 10.0% 20.0% 30.0% 40.0% 50.0%
56.3%
18.0%
13.4%
9.1%
3.3%
In another region
In the province
In the town
In the region
Abroad
0.0% 10.0% 20.0% 30.0% 40.0% 50.0% 60.0%

58
3.2.9. Functional area
About 40% of the participants had their current job in one of the two most frequently
mentioned functional areas: production and/or provision of services (20.9%) or sales and
marketing (10.8%) (Figure 3.14). A total of 7 functional areas were mentioned by a percentage of
participants ranging between 5% and 10%: quality control, customer service, administrative and
finance, research/research & development & innovation, general management, computing, and
education. The rest of the functional areas were mentioned by less than 5% of participants.
Figure 3.14. In what functional area of the company is your current job included
3.2.10. Hierarchical level
Regarding the hierarchical level, the majority of the graduates were entry-level employees
(83.3%; see Figure 3.15). Only 15% of the surveyed graduates had a higher hierarchical level
(supervisor: 1.4%; middle manager: 5.4%; manager: 7.9%; top manager: 0.7%). Finally, 1.3% were
apprentices.
20.9%
18.0%
10.0%
8.6%
7.8%
6.9%
6.5%
5.9%
5.2%
4.0%
2.5%
2.1%
1.4%
0.4%
0% 5% 10% 15% 20% 25%
2. Production and/or provision of services
1. Sales and marketing
9. Quality control
7. Customer Service
4. Administration and finance
11. Research/Research& Development& Innovation
8. General management
5. Computing
10. Education
3. General services of the company
14. Do not know
13. Logistics
6. Human Resources
12. Health

59
Figure 3.15. What is the hierarchical level of your current job
3.2.11. Formal written employment contract
As Figure 3.16 shows, the majority of graduates (86.7%) signed a formal written employment
contract. However, the remaining 13.3% of the graduates performed their job without a formal
written employment contract.
Figure 3.16. Did you sign a formal written employment contract for your current job
3.2.12. Duration of the contract
More than two-thirds of the graduates (69.9%) had long-term jobs, whereas only 11.4% had
short-term jobs (Figure 3.17). In addition, 16.6% of the graduates responded by saying they had
an unidentified-term job, whereas 2.1% did not know the duration of their job.
83.3%
7.9%
5.4%
1.4%
1.3%
0.7%
5. Base employee
2. Manager
3. Middle manager
4. Supervisor
6. Apprentice
1. Top manager
0.0% 20.0% 40.0% 60.0% 80.0% 100.0%
86.7%
13.3%
1. Yes
2. No

60
Figure 3.17. Is your current job…
3.2.13. Part-time vs. full-time
Almost all of the surveyed graduates (96.8%) had a full-time job. Only 3.2% of them performed a
part-time job (Figure 3.18).
Figure 3.18. Is your current job…
3.2.14. Monthly income
Regarding the monthly income of the surveyed graduates, the results obtained show that
almost two-thirds of the sample (63.9%) had monthly incomes between 5 and 10 million
Vietnamese dongs (Figure 3.19). Moreover, 11% had a lower monthly income, and 25% had
monthly incomes of more than 10 million Vietnamese dongs.
11.4%
69.9%
16.6%
2.1%
1. A SHORT-TERM job
2. A LONG-TERM job
3. An unidentified-term job.
4. I do not know.
3.2%
96.8%
1. A part-time job
2. A full-time job

61
Figure 3.19. An estimation of your monthly income in your current job
3.2.15. Work satisfaction
Figure 3.20 shows the averages obtained for the surveyed graduates’ satisfaction with several
aspects of their job. The response scale used was the following: 1. Very dissatisfied, 2.
Dissatisfied, 3. Satisfied, 4. Very satisfied. Therefore, the scale’s intermediate point is 2.5. The
results showed that graduates were moderately satisfied with their jobs (overall job satisfaction
average: 2.83). The aspect that showed the highest satisfaction average was the working
conditions (2.94), and the aspect that showed the lowest satisfaction average was income (2.65).
The standard deviations for all the satisfaction scores were between 0.53 and 0.67.
Figure 3.20. What is the degree of satisfaction or dissatisfaction produced by each of the following
aspects of your job
11.0%
32.8%
31.1%
17.3%
7.7%
<5 mil. dong
5-7 mil dong
7-10 mil. dong
10-15 mil.dong
> 15 mil.dong
0.0% 5.0% 10.0% 15.0% 20.0% 25.0% 30.0% 35.0%
2.90
2.65
2.94 2.77
2.89 2.83
1
2
3
4
1. The work you
do
2. The income
you receive
3. Your working
conditions
4. The
opportunities
for professional
development
5. Your
company as a
whole
Overall job
satisfaction

62
3.2.16. Importance of competences for good performance
We asked the surveyed graduates to rate the importance of a number of different competences
in attaining good performance in their job. The response scale used was the following: 1. None,
2. Some, 3. Intermediate, 4. Quite, 5. A lot.
The rated competences can be classified into the following groups: cognitive, management,
interpersonal, instrumental, and attitudinal.
Regarding the importance of cognitive competences, the averages obtained (Figure 3.21)
showed that two competences stood out over the rest: problem solving (4.26) and continuous
learning (4.20). The remaining competences were rated as moderately important (systematic
thinking: 3.89; creativity: 3.76; critical thinking: 3.74; report writing: 3.66; transferring theory to
practice: 3.59). These results suggest that the ability to solve problems by keeping up to date is
an important factor in good job performance.
Figure 3.21. Rate the importance of each of the following factors and competences for good
performance in your current job: cognitive competences
Figure 3.22 shows the results obtained for the importance of several management
competences. In this case, the three competences that were rated as more important were
planning (4.03), time management (4.01), and decision making (4.01). The other two
management competences considered were rated as moderately important (motivate others:
3.74; leadership: 3.69). These results suggest that management competences related to others
(motivate others and leadership) are considered less important for good performance than
management competences focused on personal skills (planning, time management, and
decision making).
3.74
3.89
4.26
3.76
3.59
4.20
3.66
1 2 3 4 5
1. Critical thinking
2. Systematic thinking
3. Problem solving
4. Creativity
5. Transfer theory to practice
6. Continuous learning
7. Report writing
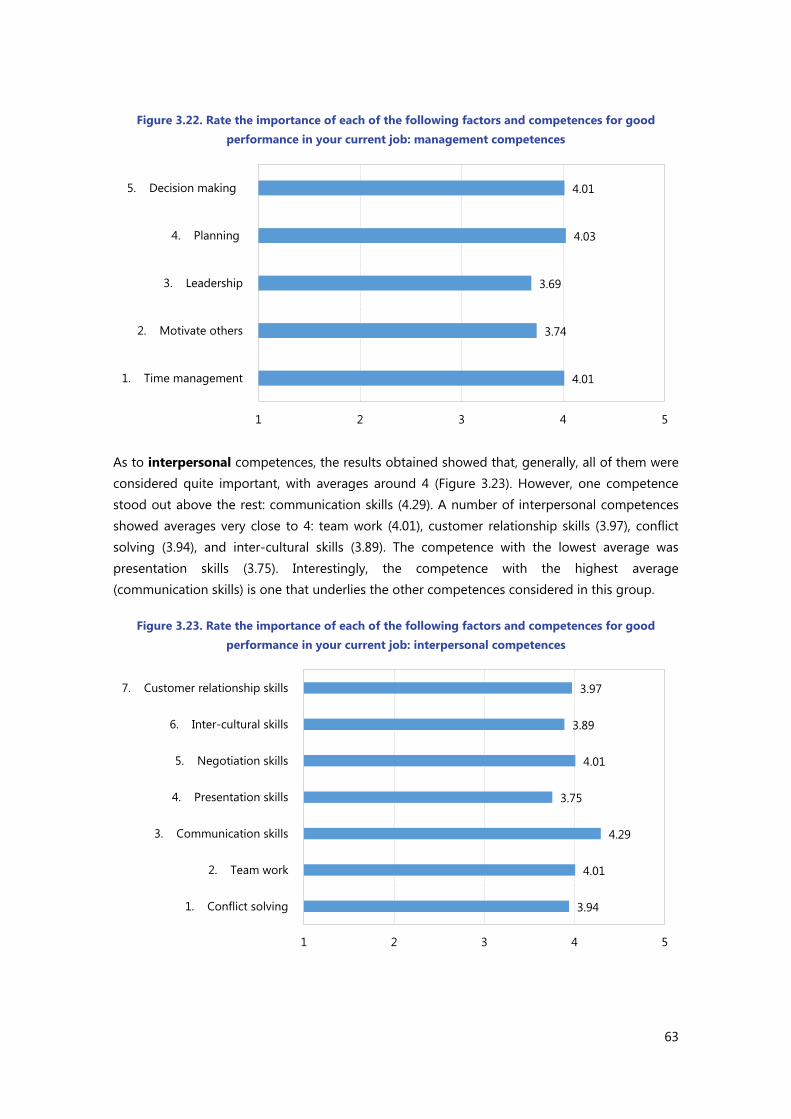
63
Figure 3.22. Rate the importance of each of the following factors and competences for good
performance in your current job: management competences
As to interpersonal competences, the results obtained showed that, generally, all of them were
considered quite important, with averages around 4 (Figure 3.23). However, one competence
stood out above the rest: communication skills (4.29). A number of interpersonal competences
showed averages very close to 4: team work (4.01), customer relationship skills (3.97), conflict
solving (3.94), and inter-cultural skills (3.89). The competence with the lowest average was
presentation skills (3.75). Interestingly, the competence with the highest average
(communication skills) is one that underlies the other competences considered in this group.
Figure 3.23. Rate the importance of each of the following factors and competences for good
performance in your current job: interpersonal competences
4.01
3.74
3.69
4.03
4.01
1 2 3 4 5
1. Time management
2. Motivate others
3. Leadership
4. Planning
5. Decision making
3.94
4.01
4.29
3.75
4.01
3.89
3.97
1 2 3 4 5
1. Conflict solving
2. Team work
3. Communication skills
4. Presentation skills
5. Negotiation skills
6. Inter-cultural skills
7. Customer relationship skills

64
With regard to the importance graduates give to instrumental competences (Figure 3.24) such
as office skills, computer skills, and foreign language skills to perform their current jobs, on
average, the students rate all of them as “quite” important. Computer skills are rated (4.05),
followed by office skills (3.89) and foreign language skills (3.84).
Figure 3.24. Rate the importance of each of the following factors and competences for good
performance in your current job: instrumental competences
Finally, the importance attributed by the graduates to attitudinal competencies in their current
job tends to be high (Figure 3.25). In fact, “Task responsibility” is scored the highest (average
4.24), followed by “punctuality” (4.15) and “adaptability” (4.14). The “Rule compliance” average is
slightly above 4, and “commitment” lies slightly below (3.91). Interestingly enough,
“entrepreneurship” presents the lowest value (3.54). Considered as a whole, the graduates’ jobs
involves competences such as responsibility for tasks, punctuality, and compliance with the
rules. They also require flexibility, but commitment and entrepreneurship are less frequently
required in the job.
Figure 3.25. Rate the importance of each of the following factors and competences for good
performance in your current job: attitudinal competences
3.84
4.05
3.89
1 2 3 4 5
1. Foreign languages
2. Computer skills
3. Office skills
4.14
3.91
3.54
4.06
4.15
4.24
1 2 3 4 5
1. Adaptability
2. Commitment
3. Entrepreneurship
4. Rule compliance
5. Punctuality
6. Take responsibility

65
3.3. Unemployed graduates
3.3.1. Time looking for a job
Unemployed graduates who were looking for a job, on average, had already spent 6.4 months
looking for a job when they answered the survey (Figure 3.26). However, when we look at the
distribution, it is interesting to point out that nearly 30% had only been looking for a job for one
month or less, whereas a similar number of graduates (12.01%) had been looking for a job for 7-
12 months, and 16.01% for more than one year.
Figure 3.26. How many months have you been looking for a job
3.3.2. Job search strategies used
The strategy most frequently used to search for a job was to use Internet portals, company
websites, and press ads (78% of graduates used this type of strategy) (Figure 3.27). The second
most frequently used strategy was the use of social and professional Internet networks (65.3% of
the graduates). Personal contacts were used by 45.3% of the graduates searching for a job.
More formal strategies such as contacting employment agencies (10.0%) and using the
employment services of their own University (3,3%) were used by a minority of the graduates
searching for a job.
6.67%
22.67%
11.33%
9.33%
6.67% 6.67%
8.67%
12.01%
16.01%
0%
5%
10%
15%
20%
25%
30%
0 1 2 3 4 5 6 Between 7
and 12
more than
12

66
Figure 3.27. What are the 3 job search strategies you have been using more frequently
3.3.3. Difficulties in finding a job
Graduates who were unemployed and searching for a job provided information about the main
factors that contribute to their difficulties in finding a job (Figure 3.28). The most important
reason mentioned is the lack of, or insufficient, professional practice and experience (the
average reached is 3.6, which means the impact of this factor is between “3.intermediate” and
“4.quite”). The second factor mentioned is “Lack of language skills” (3.3). This factor is clearly
scored higher than “lack of computer skills” (2.6) and “Deficiencies in the university education I
received”. One area that is quite important in hampering the graduates’ opportunities of finding
a job is their “lack of knowledge about the labour market” (3.1) and their “lack of job search
skills” (2.9). Moreover, it is also relevant that the graduates find the labour market saturated
(3.0). The graduates also decide not to accept a job for several reasons that kept them from
taking a job offer. They gave these factors intermediate or lower relevance. “The jobs you have
been offered do not have an adequate wage” (3) is a reason of intermediate importance. It is
followed by “the jobs you have been offered are not related to your degree” (2.7), and a reason
with a lower average score is “you do not like the jobs you have been offered” (2.5). Finally, the
two least important factors hampering the opportunities to get a job are the existence of
personal circumstances that keep the graduate from working (2.1) and “my demographic
characteristics (gender, age, etc.)” (2.1).
78.0%
65.3%
45.3%
10.0%
3.3%
0.7%
0% 10% 20% 30% 40% 50% 60% 70% 80% 90% 100%
4. Internet portals, company websites, and press ads.
2. social and/or professional Internet networks
1. personal contacts
3. contacting employment agencies
5. Use of the employment services of my university
6. Other strategies

67
Figure 3.28. Rate the degree of responsibility of each of the following factors in your difficulties in
finding a job
3.3.4. University career centre: demand and services
Nearly three out of four graduates report that they want their University to support them in
searching for a job (Figure 3.29).
Figure 3.29. Do you want the career centre of your university to support you in searching for a job?
3.6
3.3
3.1
3.0
3.0
2.9
2.9
2.7
2.6
2.5
2.1
2.1
1 2 3 4 5
2. Lack of, or insufficient, professional practice and experience
4. Lack of language skills
3. Lack of knowledge about the labor market
11. Saturation of the labor market
7. The jobs you have been offered do not have an adequate wage
10. Lack of job search skills
1. Deficiencies in the university education I received
8. The jobs you have been offered are not related to your degree
5. Lack of computer skills
6. You do not like the jobs you have been offered
9. There are personal circumstances that prevent you from working
12. My demographic characteristics (gender, age, etc.)
72.1%
27.9%
YES NO

68
This demand is further specified in Figure 3.30, where we find that “providing job opportunities
for each major” is requested by 68.4% of graduates who requested support from their
Universities in searching for a job. Next, the graduates ask the Universities to provide “general
information on the labour market and job opportunities” (55.1%), “hosting job fairs and other
events with employers” (43.9%), and “job search consulting services” (40.8%). Training services
are requested, on average, by approximately 4 out of 10 graduates. Thus, both the “information
on training opportunities” and the “soft skill training services (communication, team working,…”
are requested by 38.8% of the graduates who request support from their universities in finding a
job. Finally, “the training in job-hunting skills” reaches the lowest percentage (27.6%).
Figure 3.30. If so, what do you want the Career Centre to offer (multiple responses)
3.4. Economic inactive graduates
3.4.1. Reason not to look for a job
Inactive graduates are those who are not employed or searching for a job. They just represent
2.3% of all the graduates who answered the survey. Still we wanted to know the reasons for not
looking for a job at the time the survey was answered. Two-thirds of the inactive graduates
indicate that they continue to study (Figure 3.31). All the other reasons are provided by
approximately 1 out of 10 graduates: e.g.: “Because I have to take care of my family and/or
housework” (11.1%), or “because I have lost hope in finding work” (8.3%), which may be
complemented by the following reason “because there are no jobs for people with my degree”
(5.6%). Finally, 8.3% reported that they do not want to work.
55.1%
38.8%
40.8%
38.8%
27.6%
43.9%
68.4%
3.1%
0% 20% 40% 60% 80% 100%
1. General information on labor market and job opportunities
2. Information on training opportunities
3. Job searching consulting services
4. Soft skill training services (communication, teamworking,…
5. Job-hunting skills
6. Hosting job fairs and other events with employers
7. Providing job opportunities for each major
8. Other (specified)
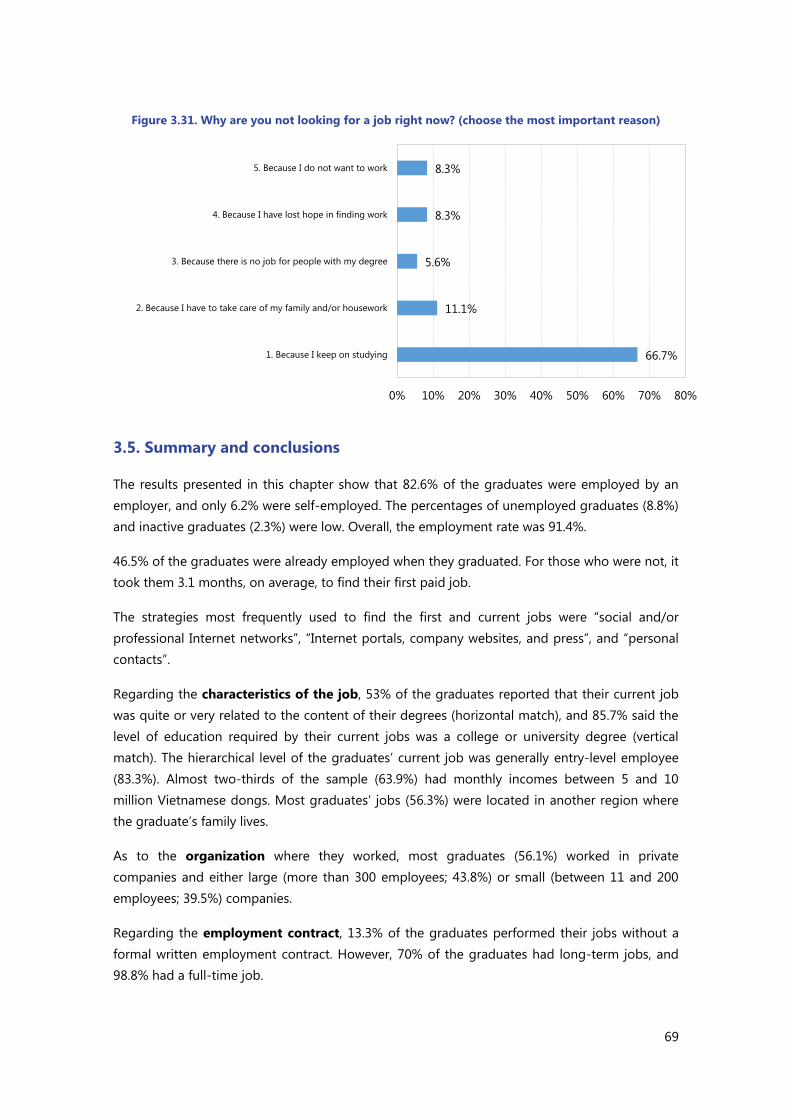
69
Figure 3.31. Why are you not looking for a job right now? (choose the most important reason)
3.5. Summary and conclusions
The results presented in this chapter show that 82.6% of the graduates were employed by an
employer, and only 6.2% were self-employed. The percentages of unemployed graduates (8.8%)
and inactive graduates (2.3%) were low. Overall, the employment rate was 91.4%.
46.5% of the graduates were already employed when they graduated. For those who were not, it
took them 3.1 months, on average, to find their first paid job.
The strategies most frequently used to find the first and current jobs were “social and/or
professional Internet networks”, “Internet portals, company websites, and press”, and “personal
contacts”.
Regarding the characteristics of the job, 53% of the graduates reported that their current job
was quite or very related to the content of their degrees (horizontal match), and 85.7% said the
level of education required by their current jobs was a college or university degree (vertical
match). The hierarchical level of the graduates’ current job was generally entry-level employee
(83.3%). Almost two-thirds of the sample (63.9%) had monthly incomes between 5 and 10
million Vietnamese dongs. Most graduates’ jobs (56.3%) were located in another region where
the graduate’s family lives.
As to the organization where they worked, most graduates (56.1%) worked in private
companies and either large (more than 300 employees; 43.8%) or small (between 11 and 200
employees; 39.5%) companies.
Regarding the employment contract, 13.3% of the graduates performed their jobs without a
formal written employment contract. However, 70% of the graduates had long-term jobs, and
98.8% had a full-time job.
66.7%
11.1%
5.6%
8.3%
8.3%
0% 10% 20% 30% 40% 50% 60% 70% 80%
1. Because I keep on studying
2. Because I have to take care of my family and/or housework
3. Because there is no job for people with my degree
4. Because I have lost hope in finding work
5. Because I do not want to work

70
With regard to work satisfaction, the surveyed graduates were moderately satisfied (overall work
satisfaction average: 2.83, scale range; 1-4).
Regarding the importance of a number of different competences for attaining good
performance in their job, the most important competences within the corresponding category
were the following: problem solving (cognitive competences), planning (management
competences), communication skills (interpersonal competences), computer skills (instrumental
competences), and task responsibility (attitudinal competencies).
Finally, for unemployed graduates, the factor that mostly contributes to their difficulties in
finding a job is the lack of, or insufficient, professional practice and experience.

71
CHAPTER 4.
GENDER DIFFERENCES

72
CHAPTER 4. GENDER DIFFERENCES
In this chapter, we present the results obtained for the sample of surveyed graduates,
differentiating by gender (women vs. men). In the first section, we focus on the employment
situation the men and women had at the time they responded to the questionnaire. We also
present the results obtained by gender for employed, unemployed, and inactive graduates.
4.1. Graduates’ employment status
4.1.1. Current employment situation
The relationship between gender and the current employment situation was not statistically
significant. Most of the men (82.2%) and women (83.1%) were working (Figure 4.1). By contrast,
percentages of men and women corresponding to other possible situations (self-employed,
looking for a job, unemployed but not looking for a job) were always below 10%.
Figure 4.1. Current employment situation by gender
4.1.2. Number of jobs since graduation
The relationship between gender and the number of jobs since graduation was not statistically
significant. Most of the men (79.2%) and women (77.8%) had had one or two jobs since
graduation (Figure 4.2). The percentages of men (3.5%) and women (3.1%) without any job since
graduation were very small.
82.2%
6.7% 9.0%
2.1%
83.1%
5.8% 8.6%
2.5%
0%
10%
20%
30%
40%
50%
60%
70%
80%
90%
Working Self-employed Looking for a job Unemployed but not
looking for a job
MALE FEMALE

73
Figure 4.2. Number of jobs since graduation by gender
4.2. Employed graduates7
4.2.1. Time needed to find their first paid job after graduation
The relationship between gender and the time needed to find their first job after graduation was
statistically significant. The percentage of men who found a job “before graduation” was greater
than the percentage of women, whereas the percentage of women who found a job “after
graduation” was greater than the percentage of men (Figure 4.3.).
Figure 4.3. When did you find your first paid job? by gender
7 The term ‘Employed graduates’ includes self-employed graduates and graduates employed by an employer.
3.5%
42.0%
37.2%
12.5%
2.3% 2.4% 3.1%
42.3%
35.5%
15.3%
2.5% 1.4%
0%
5%
10%
15%
20%
25%
30%
35%
40%
45%
0 1 2 3 4 5+
MALE FEMALE
51.0% 49.0%
56.3%
43.7%
0%
10%
20%
30%
40%
50%
60%
After graduation Before graduation
Male Female

74
There were no significant differences between men and women in terms of the number of
months it took to find their first paid job (Figure 4.4). Both men and women took about 3
months, on average, to find their first paid job.
Figure 4.4. The average number of months to find the first paid job after graduation, by gender
4.2.2. Strategies to find their first paid job after graduation
There was a significant relationship between gender and strategies to find their first job after
graduation (Figure 4.5). Women tended to use social and professional Internet networks more
than men.
Figure 4.5. Strategies to find your first paid job after graduation or the job that you already had
when you graduated by gender
3.15 3.02
1.00
1.50
2.00
2.50
3.00
3.50
Male Female
30.8%
15.9%
30.8%
16.0%
5.2%
29.4%
2.4%
31.6%
8.4%
1.1%
27.0%
13.0%
40.1%
10.0%
2.4%
27.5%
2.1%
36.3%
1.5%
1.0%
0% 5% 10% 15% 20% 25% 30% 35% 40% 45%
1. Through personal contacts (relatives, friends, ...)
2. Through the practices that I performed in companies or
institutions
3. Through social and/or professional Internet networks
4. The employer contacted me
5. By creating my own job, company or business (Self-
employment)
6. I contacted the employer on my own initiative
7. By contacting employment agencies
8. Through Internet portals, company websites, and press ads.
9. Through the employment services of my university
10. Other means
Female Male

75
4.2.3. Strategies to find their current job after graduation
There was a significant relationship between gender and strategies to find their current job after
graduation (Figure 4.6). Women tended to use social and professional Internet networks more
frequently than men. Men were contacted by the employer more frequently than women.
Figure 4.6. Strategies to find your current job after graduation by gender
4.2.4. Horizontal match
Horizontal match refers to the degree to which the current job is related to the content of the
degree. There was a significant association between gender and horizontal match. The job was
more related to the content of the degree for men than for women (Figure 4.7). Most of the
men (58.9%) perceived a high horizontal match (“quite” or “a lot”). By contrast, most of the
women (53.5%) perceived a low horizontal match (“little” or “none”).
32.6%
14.0%
30.3%
17.8%
6.1%
32.1%
3.9%
38.3%
9.1%
1.1%
29.8%
11.7%
39.3%
11.4%
3.2%
26.8%
2.5%
38.7%
1.2%
1.8%
0% 10% 20% 30% 40% 50%
1. Through personal contacts (relatives, friends, ...)
2. Through the internship that I performed in companies or
institutions
3. Through social and/or professional Internet networks
4. The employer contacted me
5. By creating my own company or business (Self-
employment)
6. I contacted the employer on my own initiative
7. By contacting employment agencies
8. Through Internet portals, company websites, and press
advertisement.
9. Through the employment services of my university
10. Other means
Female Male

76
Figure 4.7. To what extent is the content of your current job related to the content of your degree?
by gender
4.2.5. Level of education required for the current job
There was no significant association between the level of education required for the current job
and gender (see Figure 4.8). The vast majority of men and women perceived that their current
job requires a university degree.
Figure 4.8. What is the level of education required for your current job? by gender
4.2.6. Competences-job requirement match
There was a significant relationship between gender and the degree to which the competences
matched the requirements of their jobs (Figure 4.9). Men felt a little more underqualified than
women. More specifically, more men indicated that their competences are a little below the
requirements of the job than women. In general, most men and women perceived a match
between their competences and the job requirements.
12.8%
28.4%
40.0%
18.9% 19.0%
34.5%
30.1%
16.4%
0%
5%
10%
15%
20%
25%
30%
35%
40%
45%
1. None 2. Little 3. Quite 4. A lot
Male Female
0.8% 3.8% 1.6%
84.2%
9.7%
0.4% 3.1% 1.7%
87.2%
7.5%
0%
10%
20%
30%
40%
50%
60%
70%
80%
90%
100%
1. Below high
school
2. High school 3. Vocational
education
4. Col. and Uni.
degree
5. Master degree
and higher
Male Female

77
Figure 4.9. To what extent do your competences match the requirements of your job? by gender
4.2.7. Employer organization
Type
There was a significant association between gender and the type of company where
respondents worked (Figure 4.10). Men worked in foreign organizations and Foreign Direct
Investment (FDI) companies more often than women. By contrast, women worked in private
companies more often than men.
Figure 4.10. The organization you work for, by gender
1.9%
12.0%
67.8%
14.9%
3.4% 0.7%
6.2%
75.0%
16.0%
2.0%
0.0%
10.0%
20.0%
30.0%
40.0%
50.0%
60.0%
70.0%
80.0%
1. quite below 2. a little bit
below
3. match 4. a little bit over 5. quite over
Male Female
10.4%
54.1%
4.0%
27.6%
3.0%
0.4%
0.5%
11.5%
62.4%
3.3%
20.8%
1.0%
0.2%
0.9%
0% 20% 40% 60% 80%
1. Public company/organization
2. Private company/organization
3. Public-private venture
4. FDI company
5. Foreign organization
6. NGO
7. Others (specify)
Female Male

78
Sector
There was a significant association between gender and the sector where respondents worked
(Figure 4.11). Women and men differed in their profiles. Women were present more than men
in: transportation and logistics, food-accommodation services, banking-finance-insurance,
administrative-supportive services, and education and training. Men were more present in:
manufacturing, electricity-fuel-gas (energy), construction, and professional-science-technology.
Figure 4.11. Sector of economic activity of your organization by gender
Size
There was a significant association between gender and the size of the company where
respondents worked (Figure 4.12). Women tended to work more in small companies (up to 10
employees) and companies with between 11 and 200 employees, whereas men tended to work
in large companies more (more than 200 employees).
6.1%
0.1%
27.2%
5.6%
1.0%
7.9%
6.6%
1.0%
1.2%
6.4%
4.9%
1.7%
8.0%
1.4%
3.1%
1.0%
1.4%
15.2%
5.0%
0.1%
6.1%
1.6%
0.1%
3.0%
4.7%
5.0%
6.9%
4.0%
17.1%
2.1%
3.0%
4.1%
9.1%
2.1%
0.9%
24.9%
0.0% 5.0% 10.0% 15.0% 20.0% 25.0% 30.0%
1. Agriculture, forestry, fishery
2. Mining
3. Manufacturing
4. Electricity, fuel, oil, gas
5. Water supply, waste and drainage
6. Construction
7. Wholesales, retails and repairs
8. Transportation and logistics
9. Food, accommodation services
10. Information and communication
11. Banking, finance and insurance
12. Real estate activities
13. Professional, science and technological activities
14. Administration and supportive services
15. Education and training
16. Health and social protection
17. Sport, culture, art and entertainment
18. Other services
Female Male

79
Figure 4.12. How many employees does your company have? by gender
4.2.8. Location
There was a significant association between gender and the location of the job (Figure 4.13).
Women tended to work in workplaces that are closer to places where their families live than
men.
Figure 4.13. Where is your current job located? by gender
4.2.9. Functional area
There was a significant association between gender and the functional area where respondents
work (Figure 4.14). Women and men differed in their profiles. Women worked more often in
8.8%
35.5%
7.7%
48.0%
11.6%
43.8%
5.5%
39.1%
0%
10%
20%
30%
40%
50%
60%
1. Up to 10 employees 2. Between 11 and 200 3. Between 201 and
300
4. More than 300
employees
Male Female
10.3%
16.6%
7.8%
60.2%
5.1%
16.8% 19.6%
10.5%
51.8%
1.3%
0%
10%
20%
30%
40%
50%
60%
70%
1. In the town
where your family
lives
2. In the
province where
your family lives
3. In the region
where your family
lives
4. In another
region of your
country.
5. Abroad, in
another country.
Male Female

80
Administration and finance, computing, customer services, education, and logistics. By contrast,
men worked more often in Production and/or provision of services, quality control, and
Research & Development & Innovation.
Figure 4.14. In what functional area of the company is your current job included? by gender
4.2.10. Hierarchical level
There was a significant association between gender and the hierarchical position of jobs (Figure
4.15). Men tended to occupy manager and middle manager positions more often than women.
By contrast, women were more often in “entry-level employee” positions than men.
Figure 4.15. What is the hierarchical level of your current job? by gender
17.9%
30.6%
3.1%
3.1%
2.0%
1.0%
4.9%
6.9%
13.4%
2.7%
10.3%
0.3%
0.5%
3.2%
18.0%
10.9%
4.9%
12.6%
10.0%
1.8%
12.4%
6.0%
6.5%
7.7%
3.3%
0.5%
3.7%
1.8%
0% 5% 10% 15% 20% 25% 30% 35%
1. Sales and marketing
2. Production and/or provision of services
3. General services of the company
4. Administration and finance
5. Computing
6. Human Resources
7. Customer Service
8. General management
9. Quality control
10. Education
11. Research/Research& Development&…
12. Health
13. Logistics
14. Do not know
Female Male
0.8%
9.5% 7.0% 1.9%
78.9%
1.8% 0.5% 6.1% 3.6% 0.8%
88.3%
0.8%
0.0%
10.0%
20.0%
30.0%
40.0%
50.0%
60.0%
70.0%
80.0%
90.0%
100.0%
1. Top manager 2. Manager 3. Middle
manager
4. Supervisor 5. Base employee 6. Apprentice
Male Female

81
4.2.11. Formal written employment contract
There was a significant association between gender and signing a formal written employment
contract, although the differences were not strong (Figure 4.16). Men tended to have formal
contracts more frequently than women.
Figure 4.16. Did you sign a formal written employment contract for your current job? by gender
4.2.12. Duration of the contract
There was no significant association between gender and the duration of the job (Figure 4.17).
Most of the men and women had a long-term job.
Figure 4.17. Is your current job… by gender
88.8%
11.2%
84.5%
15.5%
0%
10%
20%
30%
40%
50%
60%
70%
80%
90%
100%
1. Yes 2. No
9.8%
71.2%
17.3%
1.7%
13.1%
68.4%
15.9%
2.6%
0%
10%
20%
30%
40%
50%
60%
70%
80%
1. A SHORT-TERM
job
2. A LONG-TERM
job
3. An unidentified-
term job.
4. I do not know.
Male Female

82
4.2.13. Part-time vs. full-time
There was no significant association between gender and time dedicated to the job (Figure
4.18). The vast majority of both men and women had a full-time job.
Figure 4.18. Is your current job…? by gender
4.2.14. Monthly income
There was a strong and significant association between monthly income and gender (Figure
4.19). Men had a larger monthly income than women.
Figure 4.19. An estimation of your monthly income in your current job, by gender
3.5%
96.5%
2.9%
97.1%
0%
20%
40%
60%
80%
100%
120%
1. A part-time job 2. A full-time job
Male Female
6.7%
22.6%
33.3%
24.9%
12.6%
15.9%
44.2%
28.7%
8.9%
2.3%
0%
5%
10%
15%
20%
25%
30%
35%
40%
45%
50%
1. Less than 5
mil. dong/month
2. From 5 mil.
dong to 7 mil.
dong/month
3. From 7 mil.
dong to 10 mil.
dong/month
4. From 10 mil.
dong to 15 mil.
dong/month
5. Higher than
15 mil.
dong/month
Male Female

83
4.2.15. Work satisfaction
There were significant differences between men vs. women in their work satisfaction, although
the differences were not strong (Figure 4.20). Men were more satisfied than women on overall
job satisfaction (the composite scale of satisfaction). Men were also more satisfied than women
on items 2 (income) and 4 (opportunities for professional development).
Figure 4.20. What is the degree of satisfaction or dissatisfaction produced by each of the following
aspects of your job? by gender
4.2.16. Importance of competences for good performance
There were significant differences between women vs. men in the importance attributed to three
cognitive competences (Figure 4.21) in good performance: report writing, creativity, and
systematic thinking. Men attributed more importance to all three competences than women.
There were significant differences between women and men in the importance attributed to four
management competences (Figure 4.22) in good performance: decision making, planning,
leadership, and motivating others. Men attributed more importance to all four competences
than women.
2.91
2.69
2.95
2.81
2.90
2.85
2.89
2.61
2.94
2.72
2.89
2.81
1 2 3 4
1. The work you do
2. The income you receive
3. Your working conditions
4. The opportunities for professional
development
5. Your company as a whole
Overall job satisfaction
Levels of satisfaction
Female Male

84
Figure 4.21. Rate the importance of each of the following factors and competences for good
performance in your current job by gender: cognitive competences
Figure 4.22. Rate the importance of each of the following factors and competences for good
performance in your current job by gender: management competences
3.78
3.96
4.28
3.90
3.66
4.23
3.73
3.69
3.81
4.23
3.60
3.51
4.17
3.58
1 2 3 4 5
1. Critical thinking
2. Systematic thinking
3. Problem solving
4. Creativity
5. Transfer theory to practice
6. Continuous learning
7. Report writing
Female Male
4.04
3.81
3.79
4.08
4.08
3.98
3.66
3.57
3.97
3.94
1 2 3 4 5
1. Time management
2. Motivate others
3. Leadership
4. Planning
5. Decision making
Female Male

85
There were significant differences between women and men in the importance attributed to
three interpersonal competences (Figure 4.23) in good performance: customer relationship
skills, presentation skills, and team work. Women attributed more importance to customer
relationship skills than men. By contrast, men attributed more importance to presentation skills
and team work than women.
Figure 4.23. Rate the importance of each of the following factors and competences for good
performance in your current job by gender: interpersonal competences
There was a significant difference between men and women in one of the instrumental
competences (Figure 4.24): office skills. Women attributed more importance to office skills in
good performance than men.
3.93
4.10
4.28
3.82
3.98
3.90
3.92
3.95
3.91
4.31
3.68
4.04
3.87
4.03
1 2 3 4 5
1. Conflict solving
2. Team work
3. Communication skills
4. Presentation skills
5. Negotiation skills
6. Inter-cultural skills
7. Customer relationship skills
Female Male

86
Figure 4.24. Rate the importance of each of the following factors and competences for good
performance in your current job by gender: instrumental competences
There were significant differences between women and men in the importance attributed to
three attitudinal competences (Figure 4.25) in good performance: rule compliance,
entrepreneurship, and commitment. Men attributed more importance to all these three
competences than women.
Figure 4.25. Rate the importance of each of the following factors and competences for good
performance in your current job by gender: attitudinal competences
3.87
4.03
3.81
3.80
4.07
3.98
1 2 3 4 5
1. Foreign languages
2. Computer skills
3. Office skills
Female Male
4.15
3.95
3.68
4.11
4.17
4.25
4.13
3.86
3.39
4.00
4.14
4.24
1 2 3 4 5
1. Adaptability
2. Commitment
3. Entrepreneurship
4. Rule compliance
5. Punctuality
6. Take responsibility
Female Male

87
4.3. Unemployed graduates
4.3.1. Time looking for a job
There was no significant association between gender and the time spent looking for a job
(Figure 4.26). On average, men and women spent between 6 and 7 months looking for a job.
Figure 4.26. Average number of months you have been looking for a job, by gender
4.3.2. Job search strategies used
There was a significant association between gender and strategies used to find a job (Figure
4.27). The strategy related to using “social and/or professional Internet networks” was used
more frequently by women than by men. The rest of the strategies (“personal contacts”,
“employment agencies”, “Internet portals, company websites, …”, and “university employment
services”) were used more frequently by men than by women.
Figure 4.27. What are the 3 job search strategies you have used more frequently? by gender
6.89
5.93
0.0
1.0
2.0
3.0
4.0
5.0
6.0
7.0
8.0
Male Female
51.3%
61.3%
12.5%
82.5%
3.8%
0.0%
38.6%
70.0%
7.1%
72.9%
2.9%
1.4%
0% 10% 20% 30% 40% 50% 60% 70% 80% 90%
1. personal contacts (relatives, friends, ...)
2. social and/or professional Internet networks
3. contacting employment agencies
4. Internet portals, company websites, and press ads.
5. Use of the employment services of my university
6. Other strategies
Female Male

88
4.3.3. Difficulties in finding a job
There were no significant differences between women and men in the difficulties they perceive
in finding a job (Figure 4.28). The main difficulty for both women and men was “lack of, or
insufficient, professional practice and experience”.
Figure 4.28. Rate the degree of responsibility of each of the following factors in your difficulties in
finding a job, by gender
4.3.4. University career centre: demand and services
Although more women than men wanted the university career service to help them, there was
no significant association with gender (Figure 4.29).
2.99
3.54
2.96
3.32
2.57
2.57
3.09
2.86
2.00
2.88
2.95
1.97
2.69
3.75
3.17
3.19
2.73
2.38
2.79
2.59
2.16
2.98
3.11
2.16
1 2 3 4 5
1. Deficiencies in the university education I received
2. Lack of, or insufficient, professional practice and
experience
3. Lack of knowledge about the labor market
4. Lack of language skills
5. Lack of computer skills
6. You do not like the jobs you have been offered
7. The jobs you have been offered do not have an adequate
wage
8. The jobs you have been offered are not related to your
degree
9. There are personal circumstances that prevent you from
working
10. Lack of job search skills
11. Saturation of the labor market
12. My demographic characteristics (gender, age, etc.)
Female Male

89
Figure 4.29. Do you want the career centre of your university to support you in searching for a job?
by gender
Among those respondents who wanted the university career service to help them to find a job,
two specific actions of this type of services (“Hosting job fairs and other events with employers”
and “Soft skill training services (communication, teamworking, …)” were preferred more by men
than by women (Figure 4.30).
Figure 4.30. If so, what do you want the Career Centre to offer? by gender (multiple responses)
66.2%
33.8%
79.0%
21.0%
0%
10%
20%
30%
40%
50%
60%
70%
80%
90%
1. Yes 2. NoMale Female
57.1%
38.8%
40.8%
42.9%
28.6%
51.0%
67.3%
4.1%
53.1%
38.8%
40.8%
34.7%
26.5%
36.7%
69.4%
2.0%
0% 10% 20% 30% 40% 50% 60% 70% 80% 90%
1. General information on labor market and job
opportunities
2. Information on training opportunities
3. Job searching consulting services
4. Soft skill training services (communication,
teamworking,…
5. Job-hunting skills
6. Hosting job fairs and other events with employers
7. Providing job opportunities for each major
8. Other (specified)
Female Male

90
4.4. Economic inactive graduates
4.4.1. Reason for not looking for a job
Among the respondents who did not look for a job, there was no association between gender
and their reasons for not looking for a job. Most of the women and men indicated that the most
important reason was “to continue to study” (Figure 4.31).
Figure 4.31. Why are you not looking for a job right now? by gender (choose the most important
reason)
4.5. Summary and conclusions
Graduates’ gender was not related to their current employment situation, the number of months
spent looking for their first paid job, or the number of jobs they had after graduation. However,
the percentage of men who found a job “before graduation” (49%) was slightly higher than the
percentage of women (43.7%).
Regarding strategies to find a job, women tended to use social and professional Internet
networks more frequently than men.
As to job characteristics, horizontal match was higher for men than for women, but there were
no significant differences in vertical match. Men tended to occupy manager and middle
manager positions more often than women, and they had a larger monthly income than women.
Considering the organization where the graduates performed their jobs, women worked in
private companies (62.4%) more frequently than men (54.1%). Women also tended to work in
66.7%
5.6%
5.6%
11.1%
11.1%
66.7%
16.7%
5.6%
5.6%
5.6%
0% 10% 20% 30% 40% 50% 60% 70% 80% 90%
1. Because I keep on studying
2. Because I have to take care of my family and/or
housework
3. Because there is no job for people with my degree
4. Because I have lost hope in finding work
5. Because I do not want to work
Female Male
91
smaller companies more frequently than men, and in jobs located closer to places where their
families live.
Regarding the employment contract, men tended to have formal contracts slightly more
frequently than women. However, there were no relevant differences in the contract duration or
the type of time arrangement (part-time vs. full-time).
In the case of work satisfaction, men showed higher levels of overall work satisfaction,
satisfaction with income, and satisfaction with opportunities for professional development than
women.
As to the importance of a number of different competences in attaining good performance in
their job, men tended to attribute more importance to cognitive, management, and attitudinal
competences than women. However, women tended to assign more importance to
interpersonal and instrumental competences.
Focusing on unemployed graduates, there were differences between men and women in the
strategies used to find a job. Women tended to use “social and/or professional Internet
networks” more frequently than men, and the latter tended to use the other strategies
considered more frequently.


93
CHAPTER 5:
DIFFERENCES BY MAJORS
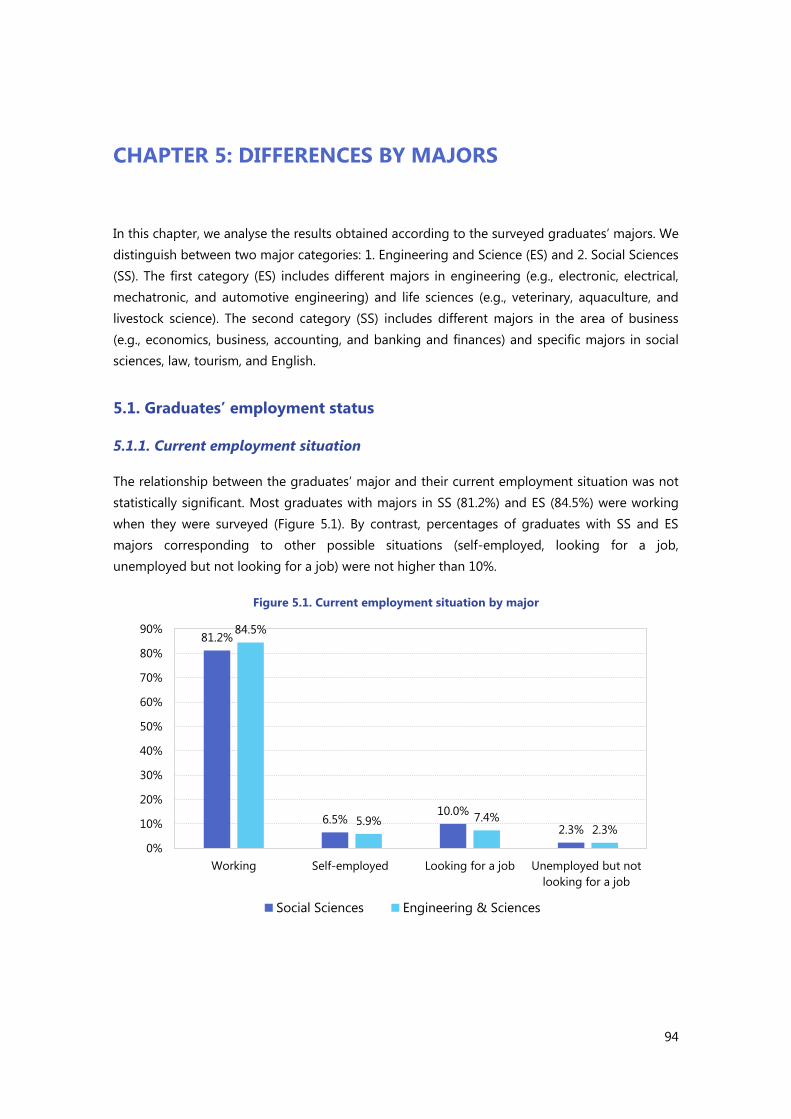
94
CHAPTER 5: DIFFERENCES BY MAJORS
In this chapter, we analyse the results obtained according to the surveyed graduates’ majors. We
distinguish between two major categories: 1. Engineering and Science (ES) and 2. Social Sciences
(SS). The first category (ES) includes different majors in engineering (e.g., electronic, electrical,
mechatronic, and automotive engineering) and life sciences (e.g., veterinary, aquaculture, and
livestock science). The second category (SS) includes different majors in the area of business
(e.g., economics, business, accounting, and banking and finances) and specific majors in social
sciences, law, tourism, and English.
5.1. Graduates’ employment status
5.1.1. Current employment situation
The relationship between the graduates’ major and their current employment situation was not
statistically significant. Most graduates with majors in SS (81.2%) and ES (84.5%) were working
when they were surveyed (Figure 5.1). By contrast, percentages of graduates with SS and ES
majors corresponding to other possible situations (self-employed, looking for a job,
unemployed but not looking for a job) were not higher than 10%.
Figure 5.1. Current employment situation by major
81.2%
6.5% 10.0%
2.3%
84.5%
5.9% 7.4% 2.3%
0%
10%
20%
30%
40%
50%
60%
70%
80%
90%
Working Self-employed Looking for a job Unemployed but not
looking for a job
Social Sciences Engineering & Sciences

95
5.1.2. Number of jobs since graduation
The relationship between the major and the number of jobs subjects had since graduation was
not statistically significant. Most of the SS (79.0%) and ES (78.1%) graduates had one or two jobs
since graduation (Figure 5.2). The percentages of SS (2.8%) and ES graduates (3.9%) without any
job since graduation were very small. Finally, the average number of jobs since graduation for
the two major categories considered was 2.8.
Figure 5.2. Number of jobs since graduation by major
5.2. Employed graduates8
5.2.1. Time needed to find the first paid job after graduation
The relationship between the major and the time needed to find the first job after graduation
was statistically significant. The percentage of ES graduates who found a job “before
graduation” (51.9%) was greater than the percentage of SS graduates (42%), whereas the
percentage of SS graduates who found a job “after graduation” (58%) was greater than the
percentage of ES graduates (48.1%) (Figure 5.3.).
8 The term ‘Employed graduates’ includes self-employed graduates and graduates employed by an employer.
2.8%
42.1%
36.9%
14.4%
2.4% 1.4% 3.9%
42.0%
36.1%
13.3%
2.3% 2.4%
0%
5%
10%
15%
20%
25%
30%
35%
40%
45%
0 1 2 3 4 5+
Social Sciences Engineering & Sciences

96
Figure 5.3. When did you find your first paid job? by major
In addition, the average number of months it took to find the first paid job was slightly higher
for SS graduates (3.28 months) than for ES graduates (2.79) (Figure 5.4).
Figure 5.4. The average number of months to find the first paid job after graduation, by major
58.0%
42.0%
48.1% 51.9%
0%
10%
20%
30%
40%
50%
60%
70%
After graduation Before graduation
Social Sciences Engineering & Sciences
3.28
2.79
1.0
1.5
2.0
2.5
3.0
3.5
Social Sciences Engineering & Sciences

97
5.2.2. Strategies to find the first paid job after graduation
Regarding the strategies used to find the first paid job after graduation, ES graduates tended to
use the following strategies more often (Figure 5.5): personal contacts; contacts initiated by the
employer; contacts with the employer initiated by the graduate; employment agencies; Internet
portals, company websites, and press ads; and university employment services. SS graduates
tended to use the following strategies more often (Figure 5.5): practices in companies or
institutions; social and/or professional Internet networks; and self-employment (creating their
own job, company, or business).
Figure 5.5. Strategies to find your first paid job after graduation or the job that you already had
when you graduated, by major
5.2.3. Strategies to find the current job after graduation
Regarding the strategies used to find the job graduates had when they were surveyed, the
results were very similar to the ones obtained for the first paid job. ES graduates tended to use
the following strategies more (Figure 5.6): personal contacts; contacts initiated by the employer;
contacts with the employer initiated by the graduate; employment agencies; and university
employment services. SS graduates tended to use the following strategies more (Figure 5.6):
internships in companies or institutions; social and/or professional Internet networks; and self-
employment (creating their own job, company or business). The two groups of graduates
showed similar percentages of the tendency to use Internet portals, company websites, and
press advertisements.
27.3%
15.2%
36.3%
10.6%
4.3%
26.6%
1.8%
33.3%
3.4%
1.3%
31.1%
13.6%
33.9%
16.3%
3.3%
30.8%
2.8%
34.5%
7.3%
0.7%
0% 10% 20% 30% 40%
1. Through personal contacts (relatives, friends, ...)
2. Through the practices that I performed in
companies or institutions
3. Through social and/or professional Internet
networks
4. The employer contacted me
5. By creating my own job, company or business
(Self-employment)
6. I contacted the employer on my own initiative
7. By contacting employment agencies
8. Through Internet portals, company websites, and
press ads.
9. Through the employment services of my university
10. Other means
Engineering & Sciences Social Sciences

98
Figure 5.6. Strategies to find your current job after graduation by major
5.2.4. Horizontal match
The results obtained for the horizontal match of the current job (i.e., the relationship between
the content of the current job and the content of the graduate’s university degree) showed that
ES graduates had a higher horizontal match than SS graduates. The percentages of ES graduates
with “quite” and “a lot” of horizontal match (40.5% and 18.8%, respectively) were higher than the
corresponding percentages for SS graduates (31% and 16.9%, respectively) (Figure 5.7).
Conversely, the percentages of SS graduates with “none” and “little” horizontal match (17.5%
and 34.6%, respectively) were higher than the corresponding percentages of SS graduates
(13.4% and 27.3%, respectively).
Figure 5.7. To what extent is the content of your current job related to the content of your degree?
by major
29.7%
13.3%
35.6%
11.4%
5.2%
27.6%
3.2%
38.5%
3.6%
1.9%
33.2%
12.3%
33.3%
18.8%
4.1%
32.0%
3.3%
38.5%
7.6%
0.9%
0% 10% 20% 30% 40% 50%
1. Through personal contacts (relatives, friends, ...)
2. Through the internship that I performed in companies or
institutions
3. Through social and/or professional Internet networks
4. The employer contacted me
5. By creating my own company or business (Self-
employment)
6. I contacted the employer on my own initiative
7. By contacting employment agencies
8. Through Internet portals, company websites, and press
advertisement.
9. Through the employment services of my university
10. Other means
Engineering & Sciences Social Sciences
17.6%
34.6%
31.0%
16.9% 13.4%
27.3%
40.5%
18.8%
0%
5%
10%
15%
20%
25%
30%
35%
40%
45%
1. None 2. Little 3. Quite 4. A lot
Social Sciences Engineering & Sciences

99
5.2.5. Level of education required for the current job
Regarding the level of education required by the current job, there were no significant
differences between the two major categories (Figure 5.8). In the two categories, most of the
graduates’ current jobs required a university degree (SS: 85%, ES: 86.4%).
Figure 5.8. What is the level of education required for your current job? by major
5.2.6. Competences-job requirement match
When we asked the surveyed graduates about the extent to which their competences matched
the requirements of their job, the results obtained were similar for ES and SS graduates (Figure
5.9). In both categories, most graduates reported that their competences closely matched the
requirements of their jobs (SS: 71.9%; ES: 70.4%).
Figure 5.9. To what extent do your skills match the requirements of your job? by major
0.7% 4.2%
1.1%
85.0%
8.9%
0.5% 2.5% 2.2%
86.4%
8.4%
0%
10%
20%
30%
40%
50%
60%
70%
80%
90%
100%
1. Below high
school
2. High school 3. Vocational
education
4. Col. and Uni.
degree
5. Master degree
and higher
Social Sciences Engineering & Sciences
1.5%
8.5%
71.9%
15.8%
2.2% 1.2%
10.2%
70.4%
15.0%
3.3%
0.0%
10.0%
20.0%
30.0%
40.0%
50.0%
60.0%
70.0%
80.0%
1. quite below 2. a little bit below 3. match 4. a little bit over 5. quite over
Social Sciences Engineering & Sciences

100
5.2.7. Employer organization
Type
The results obtained for the type of organization the surveyed graduates worked for (Figure
5.10) revealed that the percentages of SS graduates working for private companies (61.8%) and
public organizations (12.4%) were higher than the corresponding percentages of ES graduates
(53.5% and 9.2%, respectively). However, the percentages of ES graduates working for FDI
(Foreign Direct Investment) companies (30%) were higher than the corresponding percentages
of SS graduates (19.6%).
Figure 5.10. The organization you work for, by major
Sector
In the case of the sector of economic activity where the graduates’ organization operated, the
results obtained showed that the percentages of SS graduates were clearly higher in the
following sectors (Figure 5.11): banking, finance and insurance; food, accommodation services;
transportation and logistics; and administration and supportive services. On the other hand, the
percentages of ES graduates were clearly higher in the following sectors (Figure 5.11):
professional, science and technological activities; electricity, fuel, oil, and gas; construction;
agriculture, forestry, and fishery; information and communication; and education and training.
12.4%
61.8%
3.5%
19.6%
1.6%
0.5%
0.7%
9.2%
53.5%
3.8%
30.0%
2.7%
0.0%
0.8%
0% 20% 40% 60% 80%
1. Public company/organization
2. Private company/organization
3. Public-private venture
4. FDI company
5. Foreign organization
6. NGO
7. Others (specify)
Engineering & Sciences Social Sciences
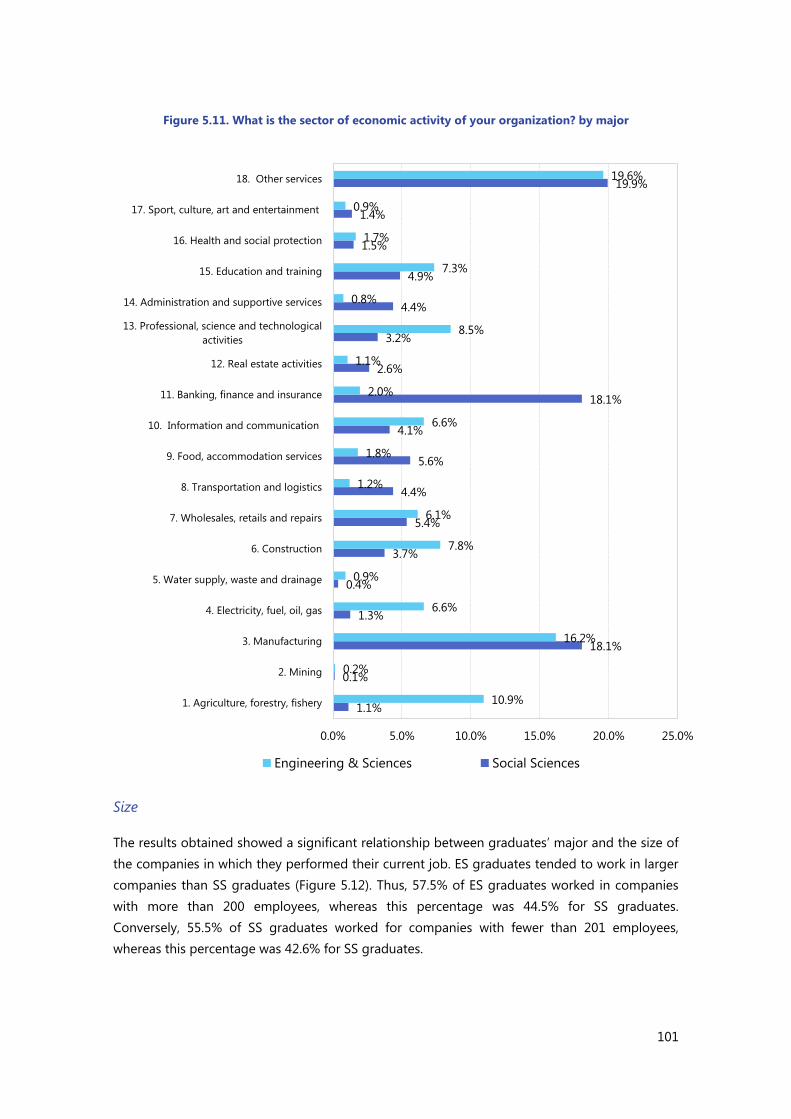
101
Figure 5.11. What is the sector of economic activity of your organization? by major
Size
The results obtained showed a significant relationship between graduates’ major and the size of
the companies in which they performed their current job. ES graduates tended to work in larger
companies than SS graduates (Figure 5.12). Thus, 57.5% of ES graduates worked in companies
with more than 200 employees, whereas this percentage was 44.5% for SS graduates.
Conversely, 55.5% of SS graduates worked for companies with fewer than 201 employees,
whereas this percentage was 42.6% for SS graduates.
1.1%
0.1%
18.1%
1.3%
0.4%
3.7%
5.4%
4.4%
5.6%
4.1%
18.1%
2.6%
3.2%
4.4%
4.9%
1.5%
1.4%
19.9%
10.9%
0.2%
16.2%
6.6%
0.9%
7.8%
6.1%
1.2%
1.8%
6.6%
2.0%
1.1%
8.5%
0.8%
7.3%
1.7%
0.9%
19.6%
0.0% 5.0% 10.0% 15.0% 20.0% 25.0%
1. Agriculture, forestry, fishery
2. Mining
3. Manufacturing
4. Electricity, fuel, oil, gas
5. Water supply, waste and drainage
6. Construction
7. Wholesales, retails and repairs
8. Transportation and logistics
9. Food, accommodation services
10. Information and communication
11. Banking, finance and insurance
12. Real estate activities
13. Professional, science and technological
activities
14. Administration and supportive services
15. Education and training
16. Health and social protection
17. Sport, culture, art and entertainment
18. Other services
Engineering & Sciences Social Sciences

102
Figure 5.12. How many employees does your company have? by major
5.2.8. Location
Regarding the location of the current job, the results obtained showed that SS graduates tended
to work close to their families more than ES graduates. For instance, 59.9% of ES graduates
worked in a region that was different from the region where their families lived (Figure 5.13).
This percentage was 53.2% for SS graduates. Finally, 43.8% of SS graduates lived in the same
town, province, or region where their families lived, whereas this percentage was 36.6% for ES
graduates.
Figure 5.13. Where is your current job located? by major
11.0%
44.5%
5.3%
39.2%
9.2%
33.4%
8.3%
49.2%
0%
10%
20%
30%
40%
50%
60%
1. Up to 10
employees
2. Between 11 and
200
3. Between 201 and
300
4. More than 300
employees
Social Sciences Engineering & Sciences
13.7%
19.6%
10.5%
53.2%
3.0%
13.1% 16.1%
7.4%
59.9%
3.6%
0%
10%
20%
30%
40%
50%
60%
70%
1. In the town
where your
family lives
2. In the
province where
your family lives
3. In the region
where your
family lives
4. In another
region of your
country.
5. Abroad, in
another country.
Social Sciences Engineering & Sciences

103
5.2.9. Functional area
Regarding the functional area of the company where the surveyed graduates performed their
current job, the results obtained showed that, on the one hand, a higher percentage of SS
graduates than ES graduates tended to have jobs in the following areas: sales and marketing,
administration and finance, customer services, computing, and logistics. On the other hand, a
higher percentage of ES graduates than SS graduates tended to have jobs in the following areas:
production and/or provision of services; quality control; and education, research, development
and innovation (see Figure 5.14).
Figure 5.14. In what functional area of the company is your current job included? by major
5.2.10. Hierarchical level
Regarding the hierarchical level of the surveyed graduates’ current job, the results obtained
showed a slight tendency: ES graduates tend to occupy managerial positions more frequently
than SS graduates. For instance, 15.9% of ES graduates had a manager or middle manager
position, whereas this percentage was 11.1% for SS graduates (Figure 5.15). Conversely, 86% of
SS graduates worked as entry-level employees, whereas this percentage was smaller (80.1%) for
ES graduates.
17.9%
12.9%
3.2%
9.6%
7.8%
1.5%
8.6%
5.1%
5.8%
2.8%
4.1%
0.1%
2.4%
1.8%
10.8%
22.2%
3.3%
2.3%
1.3%
0.6%
5.2%
5.5%
11.1%
5.9%
7.5%
0.6%
0.8%
2.3%
0% 5% 10% 15% 20% 25%
1. Sales and marketing
2. Production and/or provision of services
3. General services of the company
4. Administration and finance
5. Computing
6. Human Resources
7. Customer Service
8. General management
9. Quality control
10. Education
11. Research/Research& Development& Innovation
12. Health
13. Logistics
14. Do not know
Engineering & Sciences Social Sciences

104
Figure 5.15. What is the hierarchical level of your current job? by major
5.2.11. Formal written employment contract
There was a significant relationship between the major and the existence of a formal written
employment contract (Figure 5.16). The percentage of graduates with a formal written
employment contract was slightly higher for ES graduates (88.7%) than for SS graduates (85.1%).
Figure 5.16.. Did you sign a formal written employment contract for your current job? by major
0.8%
6.5% 4.6% 0.8%
86.0%
1.2% 0.5%
9.5% 6.4%
2.1%
80.1%
1.4%
0%
10%
20%
30%
40%
50%
60%
70%
80%
90%
100%
1. Top manager 2. Manager 3. Middle
manager
4. Supervisor 5. Base
employee
6. Apprentice
Social Sciences Engineering & Sciences
85.1%
14.9%
88.7%
11.3%
0%
10%
20%
30%
40%
50%
60%
70%
80%
90%
100%
1. Yes 2. No
Social Sciences Engineering & Sciences
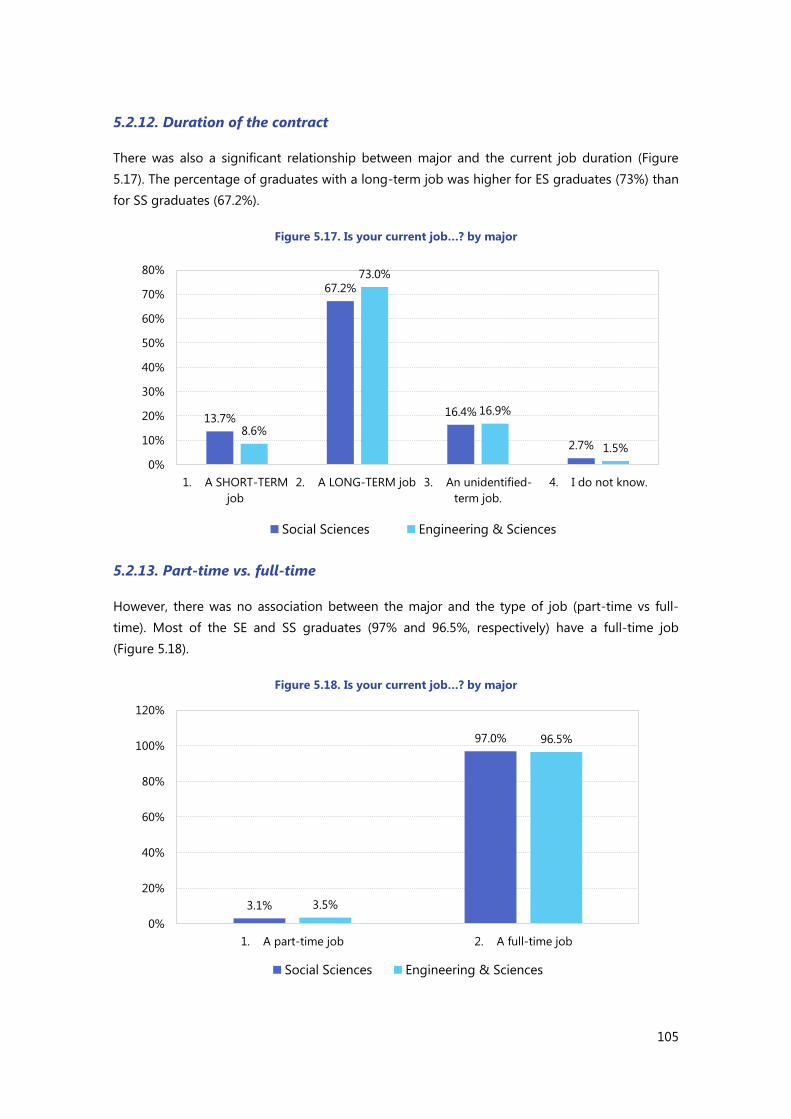
105
5.2.12. Duration of the contract
There was also a significant relationship between major and the current job duration (Figure
5.17). The percentage of graduates with a long-term job was higher for ES graduates (73%) than
for SS graduates (67.2%).
Figure 5.17. Is your current job…? by major
5.2.13. Part-time vs. full-time
However, there was no association between the major and the type of job (part-time vs full-
time). Most of the SE and SS graduates (97% and 96.5%, respectively) have a full-time job
(Figure 5.18).
Figure 5.18. Is your current job…? by major
13.7%
67.2%
16.4%
2.7%
8.6%
73.0%
16.9%
1.5%
0%
10%
20%
30%
40%
50%
60%
70%
80%
1. A SHORT-TERM
job
2. A LONG-TERM job 3. An unidentified-
term job.
4. I do not know.
Social Sciences Engineering & Sciences
3.1%
97.0%
3.5%
96.5%
0%
20%
40%
60%
80%
100%
120%
1. A part-time job 2. A full-time job
Social Sciences Engineering & Sciences

106
5.2.14. Monthly income
The results obtained showed a significant relationship between graduates’ major and their
monthly income (Figure 5.19). The percentage of graduates earning more than 7 million dong
per month was higher in ES graduates (67.1%) than in SS graduates (46.9%).
Figure 5.19. An estimation of your monthly income in your current job, by major
5.2.15. Work satisfaction
There was a significant relationship between the major and the graduate’s work satisfaction. On
four of the six indicators obtained (the work itself, income, professional development, and the
composite indicator of overall work satisfaction that combined the five items considered), the
average score for ES graduates was higher than the average score for SS graduates (see Figure
5.20). However, on all the indicators, the averages for both groups were above the intermediate
point on the response scale (2.5). For instance, on overall work satisfaction, the means for ES and
SS were 2.87 and 2.80, respectively.
15.9%
37.2%
29.0%
12.7%
5.2% 5.3%
27.6%
33.6%
22.8%
10.7%
0%
5%
10%
15%
20%
25%
30%
35%
40%
1. Less than 5 mil.
dong/month
2. From 5 mil. dong
to 7 mil. dong/month
3. From 7 mil. dong
to 10 mil.
dong/month
4. From 10 mil.
dong to 15 mil.
dong/month
5. Higher than 15
mil. dong/month
Social Sciences Engineering & Sciences

107
Figure 5.20. What degree of satisfaction or dissatisfaction does each of the following aspects of
your job produce? by major
5.2.16. Importance of competences for good performance
There was a significant relationship between the major and the importance graduates assigned
to some cognitive competences for good performance in their current job. Critical thinking was
more important for SS graduates (3.78) than for ES graduates (3.69). However, creativity was
more important for ES graduates (3.87) than for SS graduates (3.66). There were no significant
differences in the other cognitive competences considered (see Figure 5.21)
Figure 5.21. Rate the importance of each of the following factors and competences for good
performance in your current job, by major: cognitive competences
2.87
2.60
2.93
2.71
2.88
2.80
2.94
2.71
2.97
2.84
2.92
2.87
1 2 3 4
1. The work you do
2. The income you receive
3. Your working conditions
4. The opportunities for professional
development
5. Your company as a whole
Overall job satisfaction
Engineering & Sciences Social Sciences
3.78
3.89
4.24
3.66
3.54
4.21
3.66
3.69
3.89
4.28
3.87
3.64
4.19
3.65
1 2 3 4 5
1. Critical thinking
2. Systematic thinking
3. Problem solving
4. Creativity
5. Transfer theory to practice
6. Continuous learning
7. Report writing
Engineering & Sciences Social Sciences

108
There was a significant relationship between the major and three of the five management
competences considered. In all of them, SS graduates assigned greater importance to these
competences for good performance than ES graduates. These competences were the following:
motivating others (SS: 3.82; SE: 3.67), leadership (SS: 3.77; SE: 3.61), and decision making (SS:
4.09; SE: 3.95) (Figure 5.22).
Figure 5.22. Rate the importance of each of the following factors and competences for good
performance in your current job, by major: management competences
There was a significant relationship between the major and the importance graduates assigned
to some interpersonal competences for good performance in their current job. Communication
skills and negotiation skills were more important for SS graduates (4.32 and 4.05, respectively)
than for ES graduates (4.26 and 3.96, respectively). However, teamwork was more important for
ES graduates (4.10) than for SS graduates (3.93). There were no significant differences in the
other interpersonal competences considered (see Figure 5.23).
Figure 5.23. Rate the importance of each of the following factors and competences for good
performance in your current job, by major: interpersonal competences
3.98
3.67
3.61
3.98
3.95
4.05
3.82
3.77
4.08
4.09
1 2 3 4 5
1. Time management
2. Motivate others
3. Leadership
4. Planning
5. Decision making
Engineering & Sciences Social Sciences
3.93
3.93
4.32
3.75
4.05
3.88
4.02
3.95
4.10
4.26
3.76
3.96
3.90
3.92
1 2 3 4 5
1. Conflict solving
2. Team work
3. Communication skills
4. Presentation skills
5. Negotiation skills
6. Inter-cultural skills
7. Customer relationship skills
Engineering & Sciences Social Sciences

109
Regarding instrumental competencies, SS graduates assigned more importance to foreign
languages (3.95) than ES graduates (3.74). However, office skills were more important for SE
graduates (3.95) than for SS graduates (3.81). There were no differences in the importance
assigned to computer skills (see Figure 5.24).
Figure 5.24. Rate the importance of each of the following factors and competences for good
performance in your current job, by major: instrumental competences
Finally, in the case of attitudinal competences, there were significant differences between the
two major groups on two of the six competences considered. ES graduates assigned more
importance to commitment (3.96) and entrepreneurship (3.68) than SS graduates (3.86 and 3.43,
respectively) (see Figure 5.25).
Figure 5.25. Rate the importance of each of the following factors and competences for good
performance in your current job, by major: attitudinal competences
3.74
4.05
3.95
3.95
4.05
3.81
1 2 3 4 5
1. Foreign languages
2. Computer skills
3. Office skills
Engineering & Sciences Social Sciences
4.14
3.86
3.43
4.04
4.15
4.22
4.15
3.96
3.68
4.08
4.15
4.27
1 2 3 4 5
1. Adaptability
2. Commitment
3. Entrepreneurship
4. Rule compliance
5. Punctuality
6. Take responsibility
Engineering & Sciences Social Sciences

110
5.3. Unemployed graduates
5.3.1. Time
looking for a job
When focusing on unemployed graduates and the time they had been looking for a job, the
results obtained showed very similar results for the two groups of majors. The average time
spent looking for a job was 6.39 months for SS graduates and 6.53 for SE graduates (Figure
5.26).
Figure 5.26. Average number of months you have been looking for a job, by major
5.3.2. Job search strategies used
Regarding the strategies used by unemployed graduates to search for a job, the results
obtained are very similar for SE and SS graduates. The most frequently used strategies are
(Figure 5.27): Internet portals, company websites, and press ads (SS: 76.8%; SE: 80%); social
and/or professional Internet networks (SS: 65.3%; SE: 65.5%); and personal contacts (relatives,
friends, ...) (SS: 43.2%; SE: 49.1%).
6.39 6.53
0.0
1.0
2.0
3.0
4.0
5.0
6.0
7.0
Social Sciences Engineering & Sciences

111
Figure 5.27. What are the 3 job search strategies you have used more frequently, by major
5.3.3. Difficulties in finding a job
When unemployed graduates were asked about the degree of responsibility that different
factors had in their difficulties in finding a job, the results obtained showed some differences
and similarities in the most important factors, depending on the graduate’s major. For SS
unemployed graduates, the most important factors were (Figure 5.28): lack of, or insufficient,
professional practice and experience (3.67); lack of language skills (3.38); and lack of knowledge
about the labour market (3.13). For ES unemployed graduates, the most important factors were:
lack of, or insufficient, professional practice and experience (3.58); the jobs offered did not have
an adequate wage (3.17); and saturation of the labour market (3.13). Thus, the most important
factor was the same in the two groups, but the second and third most important factors were
different.
43.2%
65.3%
12.6%
76.8%
3.2%
1.1%
49.1%
65.5%
5.5%
80.0%
3.6%
0.0%
0% 10% 20% 30% 40% 50% 60% 70% 80% 90%
1. personal contacts (relatives, friends, ...)
2. social and/or professional Internet networks
3. contacting employment agencies
4. Internet portals, company websites, and press
ads.
5. Use of the employment services of my
university
6. Other strategies
Engineering & Sciences Social Sciences

112
Figure 5.28. Rate the degree of responsibility of each of the following factors in your difficulties in
finding a job, by major
5.3.4. University career centre: demand and services
Regarding the unemployed graduates’ demands for support from the university career centres
in their search for a job, there were no differences by major. Most SS and SE graduates (72.6%
and 71.2%, respectively) expected this support (Figure 5.29).
Figure 5.29. Do you want the career centre of your university to support you in searching for a job?
by major
2.82
3.67
3.14
3.38
2.75
2.53
2.82
2.74
2.11
2.95
2.95
2.05
2.91
3.58
2.92
3.06
2.47
2.40
3.17
2.73
2.02
2.88
3.13
2.08
1 2 3 4 5
1. Deficiencies in the university education I received
2. Lack of, or insufficient, professional practice and…
3. Lack of knowledge about the labor market
4. Lack of language skills
5. Lack of computer skills
6. You do not like the jobs you have been offered
7. The jobs you have been offered do not have an…
8. The jobs you have been offered are not related to…
9. There are personal circumstances that prevent you…
10. Lack of job search skills
11. Saturation of the labor market
12. My demographic characteristics (gender, age, etc.)
Engineering & Sciences Social Sciences
72.6%
27.4%
71.2%
28.9%
0%
10%
20%
30%
40%
50%
60%
70%
80%
1. Yes 2. No
Social Sciences Engineering & Sciences
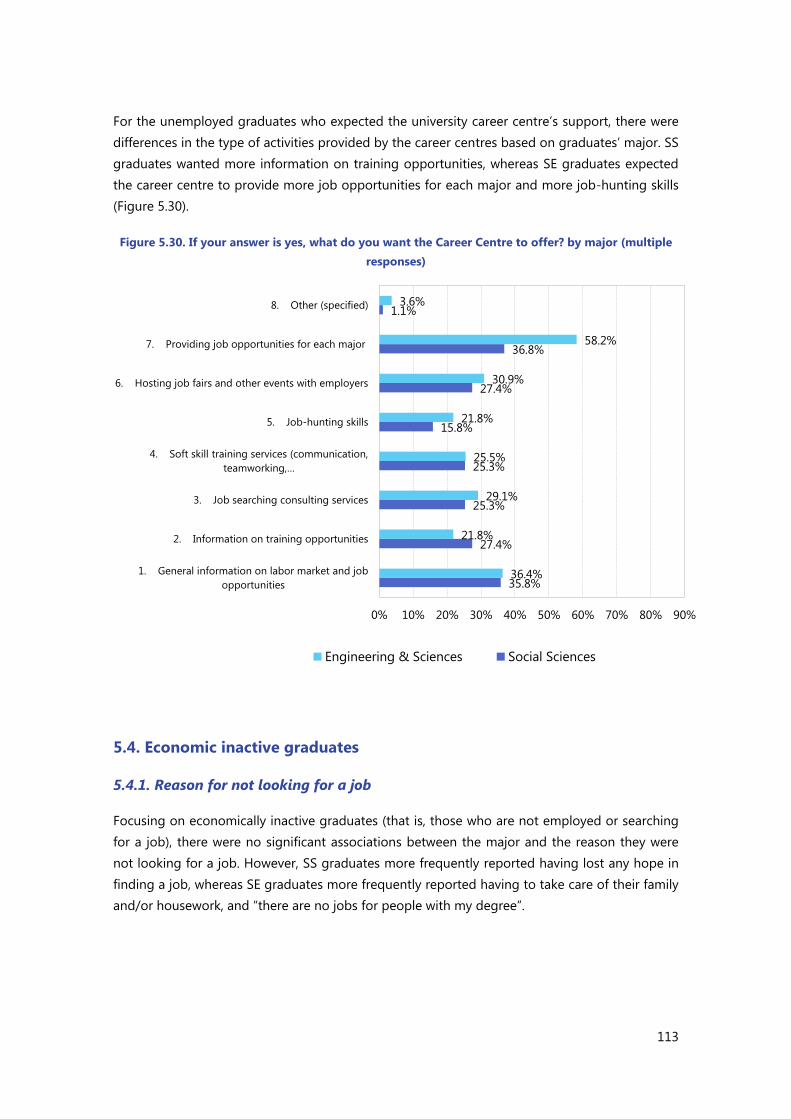
113
For the unemployed graduates who expected the university career centre’s support, there were
differences in the type of activities provided by the career centres based on graduates’ major. SS
graduates wanted more information on training opportunities, whereas SE graduates expected
the career centre to provide more job opportunities for each major and more job-hunting skills
(Figure 5.30).
Figure 5.30. If your answer is yes, what do you want the Career Centre to offer? by major (multiple
responses)
5.4. Economic inactive graduates
5.4.1. Reason for not looking for a job
Focusing on economically inactive graduates (that is, those who are not employed or searching
for a job), there were no significant associations between the major and the reason they were
not looking for a job. However, SS graduates more frequently reported having lost any hope in
finding a job, whereas SE graduates more frequently reported having to take care of their family
and/or housework, and “there are no jobs for people with my degree”.
35.8%
27.4%
25.3%
25.3%
15.8%
27.4%
36.8%
1.1%
36.4%
21.8%
29.1%
25.5%
21.8%
30.9%
58.2%
3.6%
0% 10% 20% 30% 40% 50% 60% 70% 80% 90%
1. General information on labor market and job
opportunities
2. Information on training opportunities
3. Job searching consulting services
4. Soft skill training services (communication,
teamworking,…
5. Job-hunting skills
6. Hosting job fairs and other events with employers
7. Providing job opportunities for each major
8. Other (specified)
Engineering & Sciences Social Sciences

114
Figure 5.31. Why are you not looking for a job right now? by major (choose the most important
reason)
5.5. Summary and conclusions
Graduates’ major (ES vs SS) was not related to their current employment situation or the number
of jobs they had after graduation. However, the percentage of ES graduates who found a job
“before graduation” (51.9%) was higher than the percentage of SS graduates who did so (42%).
Moreover, the average number of months spent to find the first paid job was slightly higher for
SS graduates (3.28 months) than for ES graduates (2.79).
There were differences in the strategies used to find a job; ES graduates tended to use personal
contacts more, whereas SS graduates tended to use social and/or professional Internet networks
more.
With regard to graduates’ job characteristics, ES graduates had a higher horizontal match than
SS graduates. However, there were no differences in the vertical match. SS graduates tended to
work closer to their families than ES graduates. The latter tended to occupy managerial positions
more frequently than the former, and they had higher monthly incomes.
Regarding the organization where graduates performed their job, SS graduates tended to work
more in private and public companies than ES graduates. However, ES graduates tended to work
in larger companies more than SS graduates.
As to the employment contract, ES graduates tended to have formal contracts slightly more
frequently than SS graduates. Moreover, the percentage of graduates with a long-term job was
68.2%
4.6%
9.1%
13.6%
4.6%
64.3%
21.4%
14.3%
0.0%
0.0%
0% 10% 20% 30% 40% 50% 60% 70% 80% 90%
1. Because I keep on studying
2. Because I have to take care of my family and/or
housework
3. Because there is no job for people with my degree
4. Because I have lost hope in finding work
5. Because I do not want to work
Engineering & Sciences Social Sciences

115
higher for ES graduates (73%) than for SS graduates. However, there were no relevant
differences in the type of time arrangement (part-time vs. full-time).
With regard to work satisfaction, ES graduates tended to show higher levels of satisfaction
than SS graduates.
In the case of the importance of a number of different competences for attaining good
performance in their jobs, SS graduates tended to assign higher importance to management
competences than ES graduates, whereas the latter attributed more importance to attitudinal
competences than SS graduates.
Focusing on unemployed graduates, the results obtained by the two major groups were quite
similar.


117
CHAPTER 6:
GRADUATE-JOB MATCHING TYPES

118
CHAPTER 6: GRADUATE-JOB MATCHING TYPES
6.1. Introduction
As presented in previous chapters, an important issue when studying the graduates’ labour-
market entry is to analyse both the vertical and the horizontal match between the qualification
of the graduates and the jobs for which they are hired. Vertical match was assessed on the
questionnaire with two questions. One asked about the level of education required for your
current job?: 1. Below high school; 2. High school; 3. Vocational education; 4. College and
University degree; 5 Master degree and higher. Taking into account that the survey respondents
are University graduates, the operationalization of vertical match is scored as a match when the
respondents chose options 4 or 5, whereas answers 1 to 3 were considered a mismatch.
Horizontal match refers to the congruence between the content of the degree studied and the
contents of the current job. For instance, if a graduate has studied medicine and he or she works as
government civil servant on topics not related to medicine, the horizontal match will be none. The
question posed to the graduates participating in the survey to operationalize the horizontal match
was as follows: To what extent is the content of your current job related to the content of your
degree? The answer scale was: 1. None; 2. Little; 3. Quite; and 4. A lot. Thus, we considered answers 1
and 2 to be a mismatch and answers 3 and 4 to be a match.
We have combined the two types of (mis)matches in a variable that we have labelled ‘double-
match’. It differentiates four groups: G1 Horizontal Low (HL) Vertical Low (VL) matching; G2:
Horizontal High (HH) Vertical Low (VL); G3: Horizontal Low (HL) Vertical High (VH); and G4:
Horizontal High (HH) Vertical High (VH). This categorical variable provides clear information
about the quality of the jobs held by graduates in terms of their fit to their qualifications. Then,
it indicates whether they are overqualified or not for the job, and if they have the opportunity to
work in a sector or type of job clearly related to the discipline and profession of their choice.
The general assumption in this chapter is that the graduates’ jobs that show a double match will
present better quality on the indicators studied than the jobs that do not show either of the two
matches considered.

119
6.2. Distribution of graduates by groups according to the double match
Figure 6.1 presents the general distribution of the graduates in the four groups resulting from
the double match. More than half of the sample holds a job with high horizontal and high
vertical matches. Interestingly, an important percentage of the rest of the students hold jobs
with a high vertical fit and a low horizontal fit. This indicates that a significant number of
students work in university-level jobs that are hardly related to the major they studied. A more
detailed analysis of the majors in which this happens would be helpful, so that the academic
authorities can consider possible changes in the contents of the education, given the
distribution of graduates in these matching groups. Finally, it is interesting to note that the
pattern ‘High Horizontal and low vertical’ (G2) is only represented by 1% of the sample, and the
low horizontal-low vertical match group (G1) only contains 6% of the sample.
Figure 6.1. Double match: general results
Given these results, in the following, we will often only pay attention to the results of groups G3
and G4 because they include 93% of the total employed sample. When the data for group G1 or
G2 show something special, we will also refer to these groups.
6%
1%
42%
51%
0%
10%
20%
30%
40%
50%
60%
G1: LH-LV G2: HH-LV G3: LH-HV G4: HH-HV

120
6.3. Matching types and gender
The differential analysis by gender shows that males hold double-matched jobs 16 % more than
females (G4). Conversely, in the group with High Vertical fit but low horizontal fit, females
exceed males by 10 %. Finally, among the graduates working in jobs with clear horizontal and
vertical mismatches (G1), females exceed males by 4 %. In sum, males more frequently held
higher quality jobs in terms of matching, whereas females are more frequently employed in jobs
with vertical matches (jobs that require University qualifications), but in different types of
professions from the ones related to their major. In G2, the males largely exceed the females in
percentage, but this group only includes 1% of the total sample. In general, the jobs held by
males present higher quality on this indicator of double matching than those held by females.
The women occupy more generalist jobs that are less focused on the contents of their studies.
Figure 6.2. Matching types and gender
6.4. Matching types and major
The data on the double match of the jobs, split by the study major, show that in G4 (High
Horizontal, High vertical), the distribution is quite similar (51% Engineering and Sciences and
49% Social Sciences). However, Social Science graduates exceeded Engineering and Sciences
graduates by 22 % in holding Jobs with a high vertical match and low horizontal match. In fact,
this may indicate that Social Science graduates may adapt better to University level jobs that do
not require specific training in a specific profession. Finally, it is interesting to note that the jobs
with low horizontal-low vertical match are held mostly by graduates in Social Sciences (two-
thirds), and only one-third are held by engineers and scientists. We can conclude that the
preparation in Social Sciences helps the graduates with these degrees to adapt better to jobs
48%
80%
45%
58%
52%
20%
55%
42%
0%
10%
20%
30%
40%
50%
60%
70%
80%
90%
G1: LH-LV G2: HH-LV G3: LH-HV G4: HH-HV
Male Female

121
requiring university preparation, even when it is not specific to the degree studied or when they
do not find or prefer the jobs offered within their specialty.
Figure 6.3. Matching types and major
6.5. Matching types and job search strategies.
It is interesting to find out whether graduates in different groups based on the vertical and
horizontal match/mismatch differ in the job search strategies they perform. In order to shed
light on this issue, we asked the graduates in the sample the following question: CJ1. How did
you find your current job? (Choose the 3 most important strategies). The potential responses
were:
1. Through personal contacts (relatives, friends, ...)
2. Through the internship I had in companies or institutions
3. Through social and/or professional Internet networks
4. The employer contacted me
5. By creating my own company or business (self-employment)
6. I contacted the employer on my own initiative
7. By contacting employment agencies
8. Through Internet portals, company websites, and press advertisements.
9. Through the employment services of my university
10. Other means
67%
50%
61%
49%
33%
50%
39%
51%
0%
10%
20%
30%
40%
50%
60%
70%
80%
G1: LH-LV G2: HH-LV G3: LH-HV G4: HH-HV
Social Sciences Engineering & Sciences

122
It is important to note that every candidate has the possibility of choosing up to three options.
Then the percentage for each strategy is computed based on the total number of choices made
by the people surveyed.
Figure 6.4a. Matching type (G1) and job search strategies
Figure 6.4b. Matching type (G2) and job search strategies

123
Figure 6.4c. Matching type (G3) and job search strategies
Figure 6.4d. Matching type (G4) and job search strategies

124
The results obtained for the different groups show a similar trend. In fact, in all cases, the four
most frequently chosen job search methods are: through personal contacts (relatives, friends, ...);
through social and/or professional Internet networks; by contacting the employer on one’s own
initiative; and through Internet portals, company websites, and press advertisements. Of course,
the Internet and other electronic means are prevalent among the young graduates, but personal
contacts also play an important role. However, the employment services and career services are
much less frequently used strategies. Even though the most frequently used strategies are the
same for the four groups considered, we still find a clear difference in the groups with higher
quality employment (they hold a job that requires University studies, whether it fits their major
or not). These two groups tend to more frequently use Internet portals, company websites, and
press, in addition to contacting employers on their own. In fact, in G4 (double matched jobs),
39% of the choices referred to these two strategies, and in G3 this figure reached 40%. For G1,
the two categories add up to 33%. On the other hand, this group uses Personal contacts and
Internet professional networks (43%) more often than G4 (33%). The G4 group also presents the
highest percentage of the strategy “Through the internship I had in companies or institutions”
(10%, whereas in G1, it was only 1%).
6.6. Matching types and employed vs self-employed
One important piece of information the graduates can provide is whether they are employed or
self-employed. The latter type of work is often an indicator of entrepreneurship. In order to
obtain this information, we have included the following question in the survey: SA2. What is
your current employment situation?
1. I have a job now and work for an employer.
2. I am self-employed now
3. I am unemployed and looking for a job
4. I am unemployed but not looking for a job
In this chapter, we focus on the match between qualifications and job demands of those who
are employed; thus, we have only considered the two first categories. The results obtained when
cross tabulating the type of employment and the matching groups are clear. The percentage of
self-employed graduates decreases in the groups that work in a job that requires a university
degree (the G3 and G4), whereas it is higher in those whose jobs do not require a degree,
especially in G1 (20% of graduates in this group are self-employed. It is interesting to note that
often when graduates opt for self-employment, they develop a work activity that is rather low in
terms of the qualifications required.

125
Figure 6.5. Matching types and employed vs. self-employed
6.7. Matching types and sectors.
In the present section, we focus on the differences in the sectors of the jobs based on the
double matched groups. As Figure 6.4.a shows, the jobs with a low horizontal match and a low
vertical match are mostly in “other services” (21%), “wholesale, retail, and repairs” (18%), and
“manufacturing” (11%).
Figure 6.6.a. Matching G1: LH-LV and sectors
80%
90% 94% 94%
20%
10% 6% 6%
0%
10%
20%
30%
40%
50%
60%
70%
80%
90%
100%
G1: LH-LV G2: HH-LV G3: LH-HV G4: HH-HV
Employed Self-employed
3%
0%
11%
2% 0%
3%
18%
2%
8% 6%
5% 6%
2% 2% 3%
6% 5%
21%
0%
5%
10%
15%
20%
25%

126
The jobs that present a high horizontal match but a low vertical match (only 1% of the total jobs
considered) are mostly concentrated in “manufacturing” (39%).
Figure 6.6.b. Matching G2: HH-LV and sectors
Interestingly, the jobs that present a low horizontal match and a high vertical match are mostly
included in the following sectors: “Other Services” (21%), “Manufacturing” (16%), and “Banking,
finances, and insurance” (10%).
Figure 6.6.c. Matching G3: LH-HV and sectors
0% 0%
39%
0% 0% 0%
6%
0%
11% 11% 11%
0%
11%
0% 0%
6%
0%
6%
0%
5%
10%
15%
20%
25%
30%
35%
40%
45%
4%
0%
16%
3%
0%
5%
7%
4% 4%
6%
10%
2%
5%
2%
6%
2% 1%
21%
0%
5%
10%
15%
20%
25%

127
Finally, the jobs with both a high horizontal match and a high vertical match are also
concentrated mostly in “Other Services” (19%), “Manufacturing” (19%), and “Banking, finances,
and insurance” (12%).
Figure 6.6.d. Matching G4: HH-HV and sectors
6.8. Matching types and Job location
One interesting issue to better understand the differences in the jobs held by the graduates in
different matching groups is the location of these jobs compared to the location where their
families live. In order to obtain this information, we asked the following question CJ9.Where is
your current job located? (choose the most accurate option). The response options were:
1. In the town where your family lives
2. In the province where your family lives
3. In the region where your family lives
4. In another region of your country.
5. Abroad, in another country.
Interestingly enough, about six out of ten graduates in G2, G3, and G4 (the groups that show at
least one type of match) work in a different region of the country from the one their family lives
in. However, for G1 this percentage is about 20% lower. Thus, mobility across country regions is
an important factor in getting higher quality employment. Another interesting feature of the
data (Figure 6.6) is the fact that in each of the two larger groups, only 3% of the graduates are
8%
0%
19%
4%
1%
7%
4%
2% 3%
4%
12%
1%
7%
3%
6%
1% 1%
19%
0%
2%
4%
6%
8%
10%
12%
14%
16%
18%
20%

128
working in another country. This figure is rather low for graduates, although it is possible that
those working abroad are underrepresented in the sample gathered.
Figure 6.7. Matching types and job location
6.9. Matching types and organization type
It is interesting to identify the types of jobs that different types of employers offer to the
graduates. In order to do so, we asked the graduates the following question: CJ5. Is the
organization you work for a …?
1. Public company/organization
2. Private company/organization
3. Public-private venture
4. FDI company (Foreign Direct Investment)
5. Foreign organization
6. NGO
7. Others (specify)
23%
6%
13% 13% 15%
6%
18% 18%
14%
6%
11% 7%
41%
61%
55% 58%
8%
22%
3% 3%
0%
10%
20%
30%
40%
50%
60%
70%
G1: LH-LV G2: HH-LV G3: LH-HV G4: HH-HV
1. In the town where your family lives 2. In the province where your family lives
3. In the region where your family lives 4. In another region of your country.
5. Abroad, in another country.

129
Figure 6.8. Matching types and organization type
As Figure 6.8 shows, as the match increases, employment in the private
companies/organizations decreases: in G1, 81% of the graduates are employed in these types of
companies, whereas in G4, only 56% of the graduates work in these companies. By contrast, the
graduates with jobs in group G3 and group G4 are hired significantly more in the FDI companies
(G3: 27% and G4: 24%). It is also interesting to note that the public companies/organizations
more often hire people with high matches. In fact, only 3% of the G1: LH-LV are hired by these
companies, whereas in the G4: HH-HV, the percentage of graduates hired in the public sector
reaches 13%.
6.10. Matching types and organization size
In order to identify the types of companies, in terms of their size, that offer jobs to the
graduates and the quality of jobs offered in terms of the match between the graduate’s
qualifications and those required by the job, we asked the participants to answer the following
question: CJ8. How many employees does your company have?
1. Up to 10 employees
2. Between 11 and 200
3. Between 201 and 300
4. More than 300 employees
3% 6%
10% 13%
81%
72%
58% 56%
5%
11%
27% 24%
0%
6% 1%
3% 0% 0% 0% 0%
6%
0% 0% 0%
0%
10%
20%
30%
40%
50%
60%
70%
80%
90%
G1: LH-LV G2: HH-LV G3: LH-HV G4: HH-HV
1. Public company/organization 2. Private company/organization
3. Public-private venture 4. FDI company
5. Foreign organization 6. NGO
7. Others

130
Figure 6.9. Matching types and organization size
The quality of the jobs tends to be higher in larger companies than in smaller ones. In fact, in
G4, 51% of the graduates work in organizations with more than 200 employees. The graduates
in G3 show the same percentage of graduates in these types of companies. However, this
percentage declines to 34% for graduates in G2, and to 41% in G1. Conversely, the graduates
with a low match in both the vertical and horizontal dimensions, as well as those with a low
match in the horizontal dimension, tend to work more often in smaller companies.
6.11. Matching types and type of contract.
The formalization of the employment relations between the employer and the employee is an
important feature and a source of guarantees for both parties involved. Thus, we included the
following question in the survey: CJ11. Did you sign a formal written employment contract
for your current job? The response alternatives were:
1. Yes
2. No
The results clearly show that when a double match occurs, more that 9 out of ten contracts are
formal and written (G4: 91%), whereas only 58% of the jobs were supported by a written formal
contract when the graduates and jobs had low horizontal and low vertical matches (G1). The two
groups in between show that when there is a vertical match, the percentage of formal contracts
is higher (85%) than when there is only a horizontal match (78%).
27%
6% 9% 9%
32%
61%
40% 39%
6% 6% 6% 7%
35%
28%
45% 44%
0%
10%
20%
30%
40%
50%
60%
70%
G1: LH-LV G2: HH-LV G3: LH-HV G4: HH-HV
1. Up to 10 employees 2. Between 11 and 200
3. Between 201 and 300 4. More than 300 employees

131
Figure 6.10. Matching types and formal contracts
6.12. Matching types and job duration
Usually work stability is a job characteristic valued by employees. Thus, it is usually considered a
feature of good quality jobs. However, job flexibility in the labour market is increasing because
of the growing trend toward short-term and fixed-term jobs. In order to find out the types of
jobs the graduates hold, we included the following question: CJ12. Is your current job …?
1. A short-term job
2. A long-term job
3. An unidentified-term job.
4. I do not know.
The results clearly show that double matching is a significant antecedent of the permanent job
rate. Thus, in G4 (horizontal and vertical matches) the rate of long-term jobs is 77% of the total,
whereas in G1, where there is no match, the rate is 39%. In the two middle categories with only
one match, the rates of long-term jobs are in between (G2: 67% and G3: 64%).
58%
78%
85%
91%
42%
22%
15%
9%
0%
10%
20%
30%
40%
50%
60%
70%
80%
90%
100%
G1: LH-LV G2: HH-LV G3: LH-HV G4: HH-HV
1. Yes 2. No

132
Figure 6.11. Matching types and job duration
6.13. Matching types and full-time vs part-time job.
Another feature of the jobs is time dedication. Often, there is a distinction between full-time
jobs and part-time jobs. In order to clarify the distribution of this feature, we included the
following question in the survey: CJ13. Is your current job …?. The response alternatives were:
1. A part-time job
2. A full-time job
In most cases, the young graduates in normal conditions prefer full-time jobs. Our results show
that nearly all the jobs (97%) held by the graduates in G3-G4 are full time. However, in the G1
(low match in vertical and horizontal dimensions), the percentage is 88%.
23%
17% 14%
8%
39%
67% 64%
77%
26%
17% 19%
14% 12%
0% 2% 1%
0%
10%
20%
30%
40%
50%
60%
70%
80%
90%
G1: LH-LV G2: HH-LV G3: LH-HV G4: HH-HV
1. A SHORT-TERM job 2. A LONG-TERM job
3. An unidentified-term job. 4. I do not know.

133
Figure 6.12. Matching types and full-time vs part-time job
6.14. Matching types and hierarchical level
It is also interesting to clarify whether the different groups of jobs on the basis of double
matching differ in their hierarchical level. In order to clarify this issue, we asked the graduate the
following question: CJ10.What is the hierarchical level of your current job?
5. Top manager
6. Manager
7. Middle manager
8. Supervisor
9. Entry-level employee
10. Apprentice
The results show that most of the graduates (between 78% and 84%) work as entry-level
employees. However, between 6% and 11% work as managers, although the statistical analysis
shows non-significant differences between the groups based on the group to which the
graduates belong. Therefore, there is no significant relationship between the double matching
and the hierarchical level of the current job.
12%
0% 3% 3%
88%
100% 97% 97%
0%
20%
40%
60%
80%
100%
120%
G1: LH-LV G2: HH-LV G3: LH-HV G4: HH-HV
1. A part-time job 2. A full-time job

134
Figure 6.13. Matching types and hierarchical level
6.15. Matching types and monthly income
One indicator of the quality of the job that the graduates hold is the monthly income they
receive. In order to obtain information about it, the following question was posed to them:
CJ14. Please, give an estimation of your monthly income in your current job:
1. Less than 5 million dong/month
2. From 5 million dong to 7 mil. dong/month
3. From 7 million dong to 10 mil. dong/month
4. From 10 million dong to 15 mil. dong/month
5. Higher than 15 million dong/month
Looking at the distribution of the salaries among the groups, it is interesting to note that the
lowest percentage of graduates that earn over 7000 dong is in G1: LH-LV (with low vertical and
horizontal match. Only 37% of the graduates in this group earn more than 7000 dongs. Group 2
(high horizontal match but low vertical match) presents the highest percentage of graduates
(67%) who get paid more than 7000 dongs. Nevertheless, it is important to highlight that this
group only includes one percent of the total sample. It is more interesting to compare the two
most populated groups. Whereas 51% of the graduates included in G3 (LH-HV) receive a
monthly income above 7000 dongs, in the G4 (the one with high vertical and horizontal
matches), 61% receive more than 7000 dongs.
3% 6%
1% 0%
6% 11%
8% 8% 3%
0%
6% 5% 2% 0% 1% 2%
82% 78%
84% 83%
3% 6%
1% 2%
0%
10%
20%
30%
40%
50%
60%
70%
80%
90%
G1: LH-LV G2: HH-LV G3: LH-HV G4: HH-HV
1. Top manager 2. Manager 3. Middle manager
4. Supervisor 5. Base employee 6. Apprentice

135
Thus, based on this indicator, we can conclude that working in a job with a high horizontal and
high vertical match is important in terms of salary because they are more often better paid than
those in a job with a vertical match and a poor horizontal match.
Figure 6.14. Matching types and monthly income
6.16. Matching types and work satisfaction
Another quality indicator of the jobs held by the university graduates is operationalized as work
satisfaction. Work satisfaction is a positive cognitive and affective response of employees to
different facets of the work they perform. In this survey, we have measured work satisfaction
with the following questions: CJ15. What is the degree of satisfaction or dissatisfaction
produced by each of the following aspects of your job? To respond to these items, choose
one of the options from the following response scale: 1 (strong dissatisfaction), 2 (a lot of
dissatisfaction), 3 (some dissatisfaction), 4 (some satisfaction), 5 (a lot of dissatisfaction) and 6
(strong satisfaction). The facets we asked about are: 1) The work you do, 2) the income you
receive, 3) your working conditions, 4) the opportunities for professional development, and 5)
your company as a whole.
The results disaggregated by the four groups established according to the double match
criterion show very clearly that in every facet considered, those graduates who work in jobs that
fulfil the horizontal and vertical match (G4) present a significantly higher work satisfaction
average score than those who work in jobs with a vertical match but without a horizontal match
(G3). As Figure 6.10 shows, in every facet of job satisfaction, group 4 presents a significantly
higher average score on job satisfaction than group 3. There are also some significant
30%
6%
12%
9%
33%
28%
37%
30%
17% 17%
31% 32%
8%
17% 15%
20%
12%
33%
5%
9%
0%
5%
10%
15%
20%
25%
30%
35%
40%
G1: LH-LV G2: HH-LV G3: LH-HV G4: HH-HV
1. Less than 5 mil. dong/month
2. From 5 mil. dong to 7 mil. dong/month
3. From 7 mil. dong to 10 mil. dong/month
4. From 10 mil. dong to 15 mil. dong/month
5. Higher than 15 mil. dong/month

136
differences between the G4 scores and scores obtained in G1 and/or G2, but they are less
relevant given that the number of graduates in each of these groups is rather low.
In sum, double matching is a clear indicator of the quality of the graduates’ jobs when
considering employees’ work satisfaction with job facets as an indicator of job quality. The
employees with high vertical and horizontal matches are more satisfied with the activities they
perform, the income they receive, the working conditions they have, their opportunities for
professional development, and the company where they work as a whole.
Figure 6.15. Matching types and work satisfaction
6.17. Matching types and the match between competences and job
requirements
It is interesting to analyse the subjective matching reported by the graduates between their
competences and the ones required by their jobs. To clarify this, we asked the participants in the
survey: To what extent do your competences match the requirements of your job? The
answers were obtained with the following scale:
1. My competences are far below the requirements of my job
2. My competences are a little bit below the requirements of my job
3. My competences match the requirements of my job
4. My competences are a little bit above the requirements of my job
5. My competences are a far above the requirements of my job
2.7
2.6
2.8
2.5
2.9
3.0
2.5
3.1
2.8
3.0
2.8
2.6
2.9
2.6
2.8
3.0
2.7
3.0
2.9
3.0
1 2 3 4 5
1. The work you do
2. The income you receive
3. Your working
conditions
4. The opportunities for
professional development
5. Your company as a
whole
G4: HH-HV G3: LH-HV G2: HH-LV G1: LH-LV
G4>G3, G1
G4>G3
G4>G3, G1
G4>G3, G1; G2>G1
G4>G3

137
The distribution of the different answers provided by the graduates in each of the job types
clearly differs in the matching of their competencies with those required in their job. The
subjective perception of an adequate match between the competencies of the graduates and
the ones required by the job dramatically increases from G1 (41% “match”) to G4 (81% “match”).
Moreover, the perception of being overqualified (“A little bit above” + “far above”) clearly
decreases from G1 (32% + 17%) to G4 (9% + 2%). Moreover, the perceptions of
underqualification (“a little bit below” + “far below”) are lower in G4 double matched jobs (7% +
1%) than in the other three groups that have the following under-qualification percentages: G3:
14%; G2: 17% and G1: 11%.
Figure 6.16. Matching types and competences-job requirements match
6.18. Matching types and competence importance
One relevant aspect that heavily influences employees’ job performance is the number and type
of competences that the employees have to master when working in that job. ‘Competence’ has
been defined as "a learned ability to adequately perform a task, duty or role" (Roe, 2002; p. 195).
From this perspective, “competences are acquired through a process of learning-by-doing, in
which knowledge, skills, personal values and attitudes become integrated and connected to a
particular task, duty or role” (Lunt, Peiró, Portinga & Roe, 2014, ch.5). It is important to know
what competencies are required in the jobs the University graduates have because this
knowledge will provide essential information about the type of education university students
should have to receive a preparation that will respond to the demands of the labour market.
Given the broad array of majors targeted in this survey, we just focused on soft competencies
without asking about the specific competencies for every profession. Soft competencies are
required in a large variety of jobs and professions, and they are often not explicitly considered in
the curricula of different disciplines and professional groups. Of course, more specific studies
2% 6%
2% 1%
9% 11% 12% 7%
41%
50%
63%
81%
32% 33%
21%
9%
17%
0% 2% 2%
0%
10%
20%
30%
40%
50%
60%
70%
80%
90%
G1: LH-LV G2: HH-LV G3: LH-HV G4: HH-HV
Quite below A little bit below Match A little bit over Quite over

138
should also analyse the professional competencies of each degree major aiming to educate a
given professional group.
In order to obtain relevant information about the soft competencies required by the employers,
we asked the graduates the following question: CJ17. Rate the importance of each of the
following factors and competencies for good performance in your current job. To respond
to these items, choose one of the options from the following response scale: 1. None; 2. Some;
3. Intermediate; 4. Quite; and 5. Extremely. Then, we presented a long list of competencies that
might be required to perform a given job. Those competencies were organized in the following
categories: a) Cognitive competencies; b) Management competencies, c) Interpersonal
competencies, d) Instrumental competencies; e) Attitudinal competencies. Next, we will present
the main results, which show what types of competencies are important in order to perform the
four types of jobs that we are considering in this chapter: G1. Low Horizontal match – Low
vertical match; G2: High Horizontal match – Low vertical match; G3: Low Horizontal match –
High vertical match and G4: High Horizontal match – High vertical match. We aim to find out
not only the importance of each competence for each group, but also which ones significantly
differ among the groups considered. In this way, we will better identify the relationship between
the quality of the graduates’ jobs and the competencies that are significantly required by these
types of jobs.
Cognitive competencies. Regarding the cognitive competencies considered, the survey
explored the importance of the following competencies for the job: 1) Critical thinking, 2)
Systematic thinking, 3) Problem solving, 4) Creativity, 5) Transferring theory to practice, 6)
Continuous learning and 7) Report writing.
Looking at the average score for the importance of each competency for the job performed by
the graduate students, it is interesting to highlight that for every competence, graduates in G4
(High horizontal and High Vertical match) report a significantly higher level of importance than
the other large group of graduates (G3), who are employed in jobs with a low horizontal match
– High vertical match. Moreover, G4 also exceeded the scores obtained by G2 and G1, and G3
also exceeded the scores of G2 and G1 on a number of competencies.
A clear conclusion of these results is that every cognitive competence considered should be
developed during the education of University students because they are clearly needed,
especially in the jobs that the university graduates should aim to hold: jobs that require a
university degree and are clearly related to the subject and discipline of their major. Additionally,
in the cases where the graduates work in jobs that require a university degree, even if they are
not clearly related to the major studied, the importance of the cognitive competencies is higher
than in jobs that do not require a university degree (G1 and G2). In these last two groups, the
over-qualification of the graduates represents a waste of effort and investment in their
education, given that afterwards their jobs do not require some of those competencies and
hardly give them the opportunity to practice and develop them.
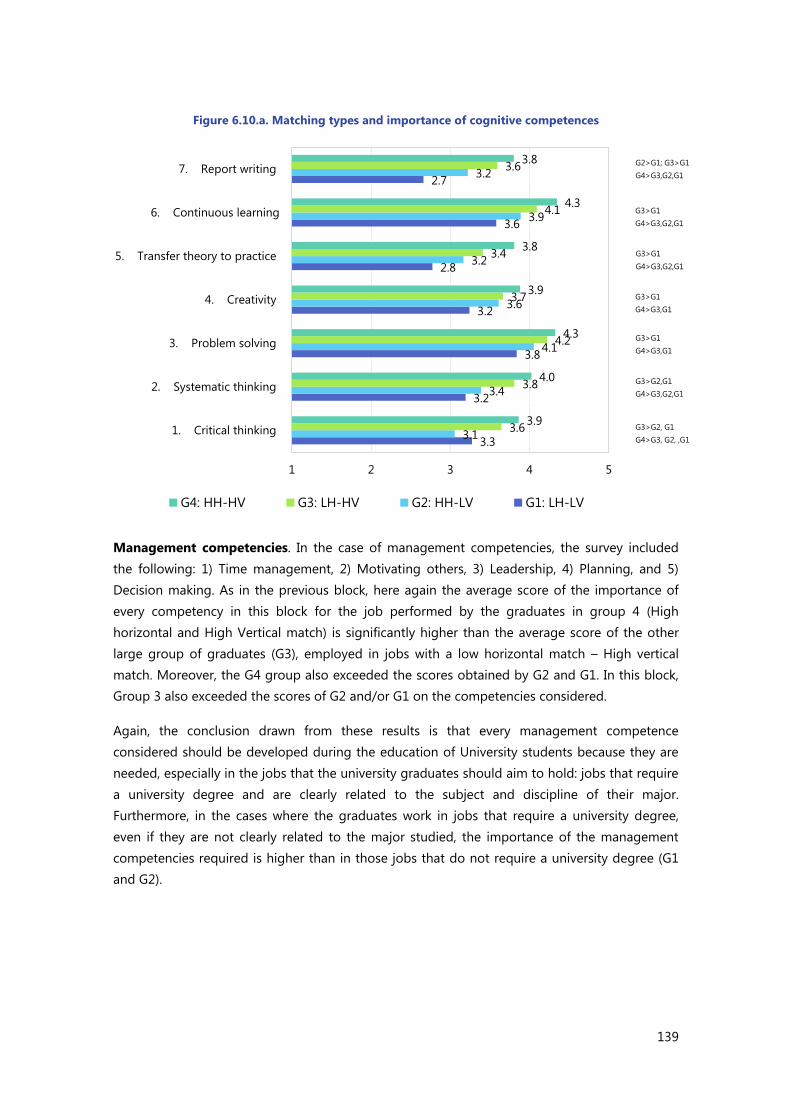
139
Figure 6.10.a. Matching types and importance of cognitive competences
Management competencies. In the case of management competencies, the survey included
the following: 1) Time management, 2) Motivating others, 3) Leadership, 4) Planning, and 5)
Decision making. As in the previous block, here again the average score of the importance of
every competency in this block for the job performed by the graduates in group 4 (High
horizontal and High Vertical match) is significantly higher than the average score of the other
large group of graduates (G3), employed in jobs with a low horizontal match – High vertical
match. Moreover, the G4 group also exceeded the scores obtained by G2 and G1. In this block,
Group 3 also exceeded the scores of G2 and/or G1 on the competencies considered.
Again, the conclusion drawn from these results is that every management competence
considered should be developed during the education of University students because they are
needed, especially in the jobs that the university graduates should aim to hold: jobs that require
a university degree and are clearly related to the subject and discipline of their major.
Furthermore, in the cases where the graduates work in jobs that require a university degree,
even if they are not clearly related to the major studied, the importance of the management
competencies required is higher than in those jobs that do not require a university degree (G1
and G2).
3.3
3.2
3.8
3.2
2.8
3.6
2.7
3.1
3.4
4.1
3.6
3.2
3.9
3.2
3.6
3.8
4.2
3.7
3.4
4.1
3.6
3.9
4.0
4.3
3.9
3.8
4.3
3.8
1 2 3 4 5
1. Critical thinking
2. Systematic thinking
3. Problem solving
4. Creativity
5. Transfer theory to practice
6. Continuous learning
7. Report writing
G4: HH-HV G3: LH-HV G2: HH-LV G1: LH-LV
G3>G2, G1
G4>G3, G2, ,G1
G3>G2,G1
G4>G3,G2,G1
G3>G1
G4>G3,G1
G3>G1
G4>G3,G1
G3>G1
G4>G3,G2,G1
G3>G1
G4>G3,G2,G1
G2>G1; G3>G1
G4>G3,G2,G1

140
Figure 6.10.b. Matching types and importance of management competences
Interpersonal competencies. The third block of competences included in the survey is related
to interpersonal relationships. Here we have considered: 1) Conflict solving, 2) Teamwork, 3)
Communication skills, 4) Presentation skills, 5) Negotiation skills, 6) Intercultural skills, and 7)
Customer relations skills. First, let’s note that the average scores obtained in the competence
‘Customer relations skills’ do not present any significant differences across groups established
based on the double (miss)match between the job and the graduate job holder. Moreover, in
what concerns with the ‘negotiation skills’ there are no significant differences about the
importance between group 4 and 3 (the two most populated ones). Independently that the job
performed present or not an horizontal match, the fact that there is a vertical match already
requires high skills of negotiation to perform a good job in both types of work.
For the rest of the competencies in this block, the average score of their importance for the job
performed in the G4 (High horizontal and High Vertical match) is significantly higher than the
ones obtained by the graduates classified in the other large group (G3 employed in jobs with
low horizontal match – High vertical match). Moreover G4 also exceeds the scores obtained by
G2 and G1. Moreover, in the case of several competencies, G3 also exceeded the scores
presented by graduates in G2 and/or G1.
Again, the conclusion of these results is that most of the interpersonal competencies should be
developed during the education at the University because these competencies are needed,
especially in the jobs that require a university degree and that are clearly related to the subject
and discipline of their major studies.
3.5
3.1
3.2
3.5
3.5
3.5
3.3
3.4
3.3
3.2
3.9
3.7
3.6
3.9
3.9
4.1
3.9
3.8
4.2
4.2
0.0 0.5 1.0 1.5 2.0 2.5 3.0 3.5 4.0 4.5
1. Time management
2. Motivate others
3. Leadership
4. Planning
5. Decision making
G4: HH-HV G3: LH-HV G2: HH-LV G1: LH-LV
G3>G2,G1
G4>G3,G2,G1
G3>G1
G4>G3,G2,G1
G3>G1
G4>G3,G1
G3>G2,G1
G4>G3,G2,G1
G3>G2,G1
G4>G3,G2,G1

141
Figure 6.10.c. Matching types and importance of interpersonal competences
NO DIFFS
G3>G1
G4>G3,G1
G3>G2,G1
G4>G2,G1
G3>G1
G4>G3,G1
G3>G1
G4>G3,G1
G3>G1
G4>G3,G2,G1
G4>G3,G1
Instrumental competencies. The fourth block of competences considered are Instrumental
ones. The ones considered are: 1) Foreign languages, 2) Computer skills, and 3) Office skills. In
this case, the average scores obtained in the competence ‘Office skills’ do not shed significant
differences concerning their importance between G4 and G3 (the two most populated ones)
although both of them significantly present higher scores that the ones of G2 and G1.
Independently that the job performed presents or not horizontal match, the fact that there is a
vertical match implies that the office skills are more important for those jobs. For the two other
competencies of the block, the average score of each is higher for the jobs performed in the G4
(High horizontal and High Vertical match) than for those performed in the G3 (low horizontal
match – High vertical match). Moreover G4 group also exceeds the scores obtained by G2
and/or G1.
Again, the conclusion of these results is that the instrumental competencies should be developed
during the education at the University because they are needed, especially in the jobs that require a
university degree and are clearly related to the subject and discipline of their major studies.
3.7
3.5
4.0
3.2
3.7
3.5
3.8
3.7
3.6
4.1
3.7
3.6
3.8
3.8
3.9
3.9
4.2
3.7
4.0
3.8
3.9
4.0
4.1
4.4
3.9
4.1
4.0
4.0
1 2 3 4 5
1. Conflict solving
2. Team work
3. Communication skills
4. Presentation skills
5. Negotiation skills
6. Inter-cultural skills
7. Customer relationship skills
G4: HH-HV G3: LH-HV G2: HH-LV G1: LH-LV

142
Figure 6.10.d. Matching types and importance of instrumental competences
Attitudinal competencies. Every competence integrates the following components: knowledge,
skills and attitudes and different ones emphasize one or other component. There are a number
of competencies that emphasized affect and attitudes as important component for proper
enactment. In our study we have paid attention to a number of competencies in which attitudes
are critical: 1) Adaptability, 2) Commitment, 3) Entrepreneurship, 4) Rule Compliance, 5)
Punctuality, and 6) Taking responsibility. Looking at the average score of their importance for
the performance of the work by the graduate students it is noteworthy to highlight that G4
(High horizontal and High Vertical match) report significant higher score that G3. Thus, if in
addition of presenting vertical match the job presents also horizontal match, then the attitudinal
competencies considered become more important to perform the work. Of course this is also
true when we compare the scores of G4 with G1. Moreover, G3 also exceeds the scores obtained
by G1 in four out of the six competencies considered: Entrepreneurship, Rule Compliance,
Punctuality, and Take responsibility. Thus, when a graduate holds a job of the university level,
these competencies are more important that when he or she holds a job that is mismatched
both horizontally and vertically and so he or she is overqualified for that job.
3.08
3.06
3.11
3.50
3.50
3.22
3.75
4.02
3.90
3.98
4.17
3.96
1 2 3 4 5
1. Foreign
languages
2. Computer skills
3. Office skills
G4: HH-HV G3: LH-HV G2: HH-LV G1: LH-LV
G3>G2,G1
G4>G2,G1
G3>G2,G1
G4>G3,G2,G1
G3>G1
G4>G3,G1

143
Figure 6.10.e. Matching types and importance of attitudinal competences
A clear conclusion of these results is that every attitudinal competence considered should be
developed during the education of the University students if the aim is to help then to work in
jobs according to their education, i.e., jobs that require a university degree and that clearly relate
to the subject and discipline of the major studies. Also in the cases, where the graduates work in
jobs that require a university degree, even if they are not clearly related to the ‘major’ degree
studied, the importance of the attitudinal competencies still is higher than the ones required by
those jobs that do not require a university degree (G1). In these cases, the over-qualification of
the graduates represents a waste of efforts and investment on their education, given that as
their jobs do not require that much, those competencies, the jobs hardly give them the
opportunity to practice the competencies and to further develop them.
6.19 Summary and conclusions.
It is important to point out that more than 90% of the surveyed graduates are included in G4
and G3 when combining the horizontal and vertical mismatch: G4 includes high vertical-high
horizontal match jobs and G3 high vertical low horizontal matching jobs. Thus, more than nine
out of ten graduates hold a job that requires university level. This is a clear signal of the quality
of the jobs. The importance of this grouping displays clearly when considering the differences
by groups (G1 to G4) in a number of personal, organizational, job and task characteristics.
The characteristic of the graduates, when analysed by groups show that by gender, males
concentrate significantly more in G4 (High horizontal- high vertical match) while women
concentrate in G3, holding more frequently jobs just with vertical match but with no horizontal
3.9
3.7
3.1
3.6
3.8
3.9
4.1
3.7
3.6
4.0
4.1
4.1
4.1
3.8
3.4
4.0
4.1
4.2
4.2
4.0
3.7
4.2
4.3
4.3
1 2 3 4 5
1. Adaptability
2. Commitment
3. Entrepreneurship
4. Rule compliance
5. Punctuality
6. Take
responsibility
G4: HH-HV G3: LH-HV G2: HH-LV G1: LH-LV
G3>G1
G4>G3,G1
G3>G1
G4>G3,G1
G3>G1
G4>G3,G1
G3>G1
G4>G3,G1
G4>G3,G1
G4>G3,G1

144
match. In what concerns the major of the studies, there are no strong differences by major in G4.
However, in G3 the percentage of graduates in Social Sciences and Humanities is higher than
the one on Engineering and Sciences. Referring to job search the graduates in G3 and G4 use
internet sources more frequently that the ones in the other groups and also look with higher
frequency to seek direct contact with employers as a job search strategy. Moreover, the ones in
G4 benefit more from their internships and get a job in the company where they did it.
A number of characteristics have been studied concerning the employment and labour market
characteristics. Related to the type of employment, the percentage of self-employed is lower in
the groups where jobs require an university degree (the G3 and G4) than in those that do not
require it, especially in G1. The analysis by sectors of economic activity shows that most of the
graduates work in manufacturing, sales and repairs, banking, finance and insurance, and other
services. There is no much differences by groups based on matching. However, the banking,
finance and insurance sector is more populated by members of the G3 and G4 (jobs requiring
university studies). In what refers to graduates’ geographical mobility required by the location of
their jobs related to the place where their families live, these mobility occurs mostly across the
regions of the country, especially among the groups that present partial matching (G2 & G3)
and full matching (G4).
The double matching also shows interesting differences concerning the characteristics of the
organizations where the graduates work. The type of company shows that when the matching
is high, employment in private companies/organizations decreases (G1: 81% of the graduates
G4: 56% of the graduates). On the contrary, both graduates holding G3 and G4 jobs are more
frequently hired in the FDI companies (G3: 27% and G4: 24%). The public
companies/organizations hire more often people with high matching. Related to the size of the
companies. The matching of jobs and youngsters’ preparation according to the size of the
company is significant. It tends to be higher in larger companies than in the smaller ones.
The contract and employment features are also influenced by the type of matching. In what
concerns the formalization of the contract, when the double matching occurs more than nine
out of ten jobs are supported by formal and written contracts (G4), while less than six out of ten
(G1) are, when low horizontal and vertical matches occur. Moreover, when considering job
duration matching is also a significant antecedent of the rate of permanent jobs. In G4 jobs, the
rate of long-term jobs is up to 77% of the total while in the G1 where no match occurs the same
rate only reaches 39%. Full time jobs are held by all (G2) o or nearly all (G3 & G4) graduates.
However, in G1 only 88% report this type of jobs. In what relates to hierarchical position, around
eight out of ten graduates work as base-employees, although the disaggregation between
groups did not yield significant differences. We find clear differences by groups in terms of the
monthly income the graduates get paid. In G1, 37% get paid more than 7 million dongs while in
G4 this percentage reaches 61%.
Satisfaction with different job facets differs significantly across the different matching groups
of jobs. Double matching is a clear indicator of the quality of the graduates’ jobs when

145
considering work satisfaction of employees. The group (G4) with high vertical and horizontal
matches are significantly more satisfied in all the facets considered: the activities they perform,
the income they receive, the working conditions they have, the opportunities for professional
development they get in their job and the company as a whole in which they work.
Finally, we paid detailed attention to the competencies required by the jobs in the groups
considered. In what concerns the subjective evaluation of the match between competencies
available and those required by the job, the perception of an adequate match dramatically
increases from G1 till G4. Moreover, the perception of being overqualified clearly decreases
from G1 to G4 and the perceptions of under-qualification are lower in G4 double matched jobs
than in the other three groups (G1, G2, G3).
The importance of different types of soft competencies for the jobs held has been analysed in
detail. The results clearly show that double matching (G4) clearly exceeds the other groups (G3
to G1) in the importance of different types of soft characteristics. Also G3 exceeds G1 in a
number of competencies. This has been the case for the types of competencies analysed: a)
Cognitive competencies; b) Management competencies, c) Interpersonal competencies, d)
Instrumental competencies; e) attitudinal competencies. A clear conclusion of these results is
that soft competencies should be stronger developed during the education of the University
students if the aim is to help them to work in jobs according to their education, that is jobs that
require a university degree and clearly related to the subject and discipline of the major studies.
In the cases, where the graduates work in jobs that require a university degree, when not clearly
related to the ‘major’ studied, the importance of the soft competencies is still higher than those
required by the jobs that do not require a university degree (G1). In these cases, the over-
qualification of the graduates represent a waste of efforts and investment on their education,
given that as their jobs do not require that much, those competencies, the jobs hardly give them
the opportunity to practice the competencies and to learn and further develop them.


147
CHAPTER 7:
DISCUSSION AND CONCLUSIONS

148
CHAPTER 7: DISCUSSION AND CONCLUSIONS
Previous chapters have reported survey results in overall sample as well as in different sub-
samples. An integration of these results reveals several key findings that could be inferred from
the study. This Chapter presents a synthesis of the results reported in the previous chapters and
offer some recommendations to related stakeholders.
7.1. Synthesis of the results
Finding #1: To the vast majority of graduates, finding jobs is not a problem, but finding jobs that
matches well with their programs’ contents is. As reported, close to 90% of the graduates in the
whole sample got at least a job after 6 months of their graduation, and more than half of them
(54%) got 2 or more jobs. While we do not have formal statistics, our international experts
confirm that these numbers were quite impressive. However, finding jobs that match with
graduates’ acquired knowledge and skills remains a concern. As reported, close to a half of the
sample reported a poor match between their jobs’ and programs’ contents (horizontal match),
and nearly one fifth of graduates believed their jobs required lower levels of competencies than
what they possessed. Thus, in the context of Vietnam, statistics “having a job” may tell only a
small part of the story. Universities should also report on “jobs that match with programs’
contents” in their employability reports.
Finding #2: For a significant proportion of employed graduates, the incomes are not significantly
higher than the average of the general workforce, nor is it superior than basic living standards.
As reported, about 44% had a monthly income of less than 7 million dong (about US$300) and
three fourth of employed graduates had a monthly income of less than 10 million dong (about
US$400). Note that 7 million dong is just about the average salary of the whole working
population in Vietnam (Chapter 1), and 10 million dong is barely above the basic living
standards, especially in Hanoi and HCMC. This is in contrast with the recent sharp increases in
total universities’ enrolment, raising a question of whether students and their parents carefully
considered their future careers when applying to universities.
Finding #3: Job satisfaction is moderate and the tendency to ‘jump’ from one job to another is
quite high in the first year since graduation. As reported in Chapter 3, employed graduates’
satisfaction with the jobs (2.85) is just above the mid-point (2.5 on a scale from 1 to 4). Nearly
55% have more than one jobs, and the average number of jobs during the first year after
graduation is 2.8. These findings suggest a low fit between graduates’ expectations and jobs’
characteristics. Our focus group discussions with employers suggested that while graduates had
a basic understanding of the jobs’ technical requirements, they had quite poor understanding of
professional values, ethics, and were not well equipped for longer-term career development.
This points to the need of career supports where preparation for career development is as
critical as job search.
149
Finding #4: A majority of jobs offered by the private sector and foreign direct invested
enterprises (FDIs). Jobs from the public sector accounted for 10.6% of employed sample and
self-employed account for only 6% of the whole sample. These results suggest that universities
should have employment strategies with clear which target mostly to the private sector and
FDIs. While we support the campaign for starting-up businesses among graduates, we caution
universities to be realistic in setting the target as well in equipping graduates with necessary
competencies/conditions for starting-up.
Finding #5: There are notable differences by gender and major in terms of job characteristics,
i.e., income, horizontal match, and type of employers. Male graduates have better horizontal
match, earn more, and more likely to work in FDIs than female counterparts. Similarly, graduates
in science and engineering also earn more, have better horizontal match, more likely to work in
FDIs, and are satisfied with the jobs more than those in social science. This implies that
universities of social science may need to work harder in linking their graduates with potential
employers for better quality jobs. Universities also need to be more attentive to the needs of
female graduates who may not be as active as male graduates in looking for help.
Finding #6: Personal/social network and internet appear to be most frequently used as job
search channels, while universities' services were hardly used by graduates. Social networks,
internet, and companies’ websites were reported as the most frequently used strategies in
finding jobs. These channels mostly provide information on job vacancy. How to approach
potential employers and apply successfully for vacant jobs may require more focused strategies
that help demonstrate the fit between graduates and job requirements. Direct contacts with
employers or use of career services may help developing these strategies. However, neither of
these strategies were frequently used. As a case in point, less than 5% of graduates used
university employment services, suggesting a great need to promote and improve university
employment services to graduates.
Finding #7: Lack of practical experience and poor understanding of the job contexts are most
critical obstacles for job finding. Three of four most critical obstacles for finding jobs, reported
by unemployed graduates, related to lack of professional experiences and practices and poor
understandings of job contexts. These obstacles were ranked as more critical than job search
skills and deficiency in university education. This suggests that universities’ programs need to be
embedded in the professional contexts to help graduates catch-up with labour markets’
movements and requirements. This finding aligns to that on horizontal match (Finding #1) as
well as competencies needed (Finding #7).
Finding #8: Problem solving, adaptation, and continuous learning were most important for
attaining good performance. These competencies require certain understandings of the contexts
and effectively use professional knowledge to solve context-specific problems. This finding
further enhances the need to equip graduates with better knowledge of job contexts. Programs
that allow experiential learning and have job orientation early are better help students in these
respects.

150
7.2. Recommendations
Based on the study results, we offer some recommendations in order to enhance employability
of the graduates, in terms of job access and quality. The recommendations are for universities
and MOET.
Recommendations to universities
Recommendation 1 – Curriculum contents: Review their curriculum design to ensure that
genuine experiential learning is incorporated, and job orientation is introduced early in the
program. The survey results suggest that graduates lack of professional practice and experience
in searching for well-matched jobs. These elements can only be provided via experiential
learning where students engaged in solving practical problems, socializing with professionals in
their fields, and experiencing the act of working in the fields. Graduates should not only
understand and practice the acquired knowledge, they should also 'live and feel’ as real
professionals. In addition, many universities only let students do internship in later half of the
studies, believing that they only have enough knowledge to practice at that time. We believe
some practical elements should be introduced even in the first and second years of the study to
help students familiarized with their professional fields. These knowledge and feelings will then
orient students to study better for future jobs.
Recommendation 2 – Collaboration with industries and potential employers: Intensive
collaboration with industries (guest lectures from experts from the field, work visits, internships,
joint curriculum development). Universities invite potential employers of their own graduates in
curriculum design. By law, employers’ participation in curriculum design is required. Many
universities have been inviting experts from industries to give lectures or host internships.
However, there is a tendency for universities to invite big companies, successful alumni, or
representatives from government organizations. As the study shows, most of jobs are offered by
SMEs and FDIs. In general, these types of enterprises should be consulted more often in
curriculum design. However, each university could have different targets of potential employers
for their graduates. We recommend universities to identify potential types of employers and
then invite them to participate in curriculum design.
Recommendation 3 – Career services: Provide career services to help students have better
knowledge of job contexts and job search skills. Many universities in Vietnam now offer career
services to students. Most of the services focus on providing job vacancy information and
improving students’ job search skills. What is missing is knowledge of job contexts and career
identity, i.e., core values, professional ethics, and critical success factors of the jobs. Thus, career
services not only help graduates find the jobs, but also prepare them for how to succeed with
their career. The services should be easy to access, especially for female students/ graduates.
Recommendation 4 – Tracer study: Conduct tracer studies to provide feedback to curriculum
design, career services, and other services to improve employability and success of graduates.
Many universities in Vietnam now conduct tracer studies for administrative reasons, i.e., required

151
by MOET. The results are for getting enrolment quota and accreditation. These are a very limited
use of tracer studies. As demonstrated in this study, results of tracer studies could be used to
revise curriculum and services in order to improve graduates’ employability and success in their
career. We recommend universities to shift the purpose of tracer studies to more long-term
benefits for graduates and universities.
Recommendation 5 – Tracer study: Adopt more rigorous methodologies in tracer studies. The
methods and process in tracer studies are neither rigorous nor consistent among universities.
We recommend universities to adopt more rigorous methods and process, especially in
sampling, questionnaire design, and analysis. The methods used in this study could be
referenced as a starting point.
Recommendations to Ministry of Education and Training
Recommendation 6 – Tracer study: Consider using independent employability reports for quality
accreditations and enrolment quotas. The current practice of using self-reported employability
for quality accreditation and enrolment quotas contains potential conflict of interests. In
addition, universities used vastly different approaches and methods in the studies, raising a
question of incompatibility in the results. We recommend MOET to conduct or out-source
independent tracer studies for universities for that purposes. The studies may be conducted
every several years with consistent methods.
Recommendation 7 – Tracer study: Share EVENT’s tracer study methodologies to non-
participant universities. The study’s methods and process used in EVENT meets rigorous
standards and commonly accepted by international universities. MOET could share the methods
to non-participant universities via various channels, such as workshops, web portals, or manuals.

152
REFERENCES
Lunt, I., Peiró, J. M., Poortinga, Y. and Roe, R. (2014). EuroPsy: Standards and quality in education
for psychologists. Hogrefe Publishing.
Roe, R. A. (2002). What makes a competent psychologist? European Psychologist, 7(3), 192-202
Tran, C. and Crawford, M. (2015). Vietnamese higher education system: characteristics and
challenges. Unpublished manuscript

153
ANNEX. EVENT QUESTIONNAIRE
INTRODUCTION
Dear participants,
Your university, in collaboration with a consortium composed of four other Vietnamese
Universities (university names) and four European Universities (university names) is conducting a
survey about the characteristics of Vietnamese university graduates’ employment. The
information collected will provide important input to enhance the quality of university education
in Vietnam and graduates’ employability.
Your participation in this survey is of the utmost importance. You have been randomly selected
among the graduates who finished their bachelor’s degree in your university one year ago.
We ask you to participate in the survey by responding to the questions you will see below. The
information collected will be treated confidentially for research purposes only, and the
responses in the data base will be anonymous. Answering the questions on this questionnaire
will take around 10 minutes.
Thank you very much for your participation.

154
SOCIO-DEMOGRAPHIC DATA
SD1. First, tell us the University where you obtained your (most recent) bachelor’s degree:
1. National Economics University (NEU)
2. Hanoi University of Industry (HAUI)
3. Ho Chi Minh University of Technology (Hutech)
4. Ho Chi Minh City University of Technology and Education (HCMUTE)
5. Hue University (HueUni)
SD2. Tell us the Major of your bachelor degree (the list of options displayed will depend on the
University in which the degree was obtained):
1. Major A
2. Major B
3. Major C
4. Etc.
5. Etc.
SD3. What is your gender?
1. Male
2. Female
SD4. How old are you?
SD5. Please tell us the year in which you initiated your bachelor’s degree:
SECTION A
Remember that throughout this questionnaire a JOB is defined as an activity that provides
income to make a living. Thus, employed people are those who perform a work activity that
provides them with an income to make a living. This definition includes self-employed people,
but it excludes voluntary unpaid work.
SA1. How many jobs have you had since you graduated?
0
1
2
3
4
5 or more

155
SA2. What is your current employment situation?
1. I have a job now and work for an employer go to SECTION CJ (Current Job)
2. I am self-employed now go to SECTION CJ (Current Job)
3. I am unemployed and looking for a job go to SECTION JS (Job Search)
4. I am unemployed but not looking for a job go to SECTION EIP (Economically Inactive
Population)
SECTION CJ
(This section is only for those who responded 1 or 2 to SA2)
FJ1. Once you got your degree, how long did it take you to find your first paid job after
graduation?
1. I already had it. I found it before I graduated.
2. It took me ____ months (write the number of months in the gap)
FJ2. How did you find that first paid job after graduation or the job that you already had
when you graduated? (choose the 3 most important strategies)
1. Through personal contacts (relatives, friends, ...)
2. Through the practices that I performed in companies or institutions
3. Through social and/or professional Internet networks
4. The employer contacted me
5. By creating my own job, company or business (Self-employment)
6. I contacted the employer on my own initiative
7. By contacting employment agencies
8. Through Internet portals, company websites, and press ads.
9. Through the employment services of my university
10. Other means (Specify)
Please, think of your current job (If now you have more than 1 job, think of the best paid
job). The following questions refer to your current job. It does not matter whether your current
job is the first job you found after graduation or you already had it when you graduated. It is the
job you have now. Answer the following questions thinking of your current job.
CJ1. How did you find your current job? (choose the 3 most important strategies)
1. Through personal contacts (relatives, friends, ...)
2. Through the internship I had in companies or institutions
3. Through social and/or professional Internet networks
4. The employer contacted me
5. By creating my own company or business (Self-employment)
6. I contacted the employer on my own initiative

156
7. By contacting employment agencies
8. Through Internet portals, company websites, and press advertisement.
9. Through the employment services of my university
10. Other means
CJ2. To what extent is the content of your current job related to the content of your degree?
1. None
2. Little
3. Quite
4. A lot
CJ3. What is the level of education required for your current job?
1. Below high school
2. High school
3. Vocational education
4. College and University degree
5. Master’s degree and higher
CJ4. To what extent do your competences match the requirements of your job?
1. My competences are far below the requirements of my job
2. My competences are a little below the requirements of my job
3. My competences match the requirements of my job
4. My competences are a little above the requirements of my job
5. My competences greatly exceed the requirements of my job
CJ5. Is the organization you work for a …?
1. Public company/organization
2. Private company/organization
3. Public-private venture
4. FDI company
5. Foreign organization
6. NGO
7. Others (specify)
CJ6. What is the sector of economic activity of your organization? Choose the best option.
1. Agriculture, forestry, fishery
2. Mining
3. Manufacturing
4. Electricity, fuel, oil, gas
5. Water supply, waste, and drainage
6. Construction

157
7. Wholesale, retail, and repairs
8. Transportation and logistics
9. Food, accommodation services
10. Information and communication
11. Banking, finance, and insurance
12. Real estate activities
13. Professional, science, and technological activities
14. Administration and supportive services
15. Education and training
16. Health and social protection
17. Sport, culture, art, and entertainment
18. Other services
CJ7. In what functional area of the company is your current job included?
1. Sales and marketing
2. Production and/or provision of services
3. General services of the company
4. Administration and finance
5. Computing
6. Human Resources
7. Customer Service
8. General management
9. Quality control
10. Education
11. Research/Research& Development& Innovation
12. Health
13. Logistics
14. Do not know
15. Others
CJ8. How many employees does your company have?
1. Up to 10 employees
2. Between 11 and 200
3. Between 201 and 300
4. More than 300 employees
CJ9.Where is your current job located? (choose the most accurate option)
1. In the town where your family lives
2. In the province where your family lives
3. In the region where your family lives
4. In another region of your country.
5. Abroad, in another country.
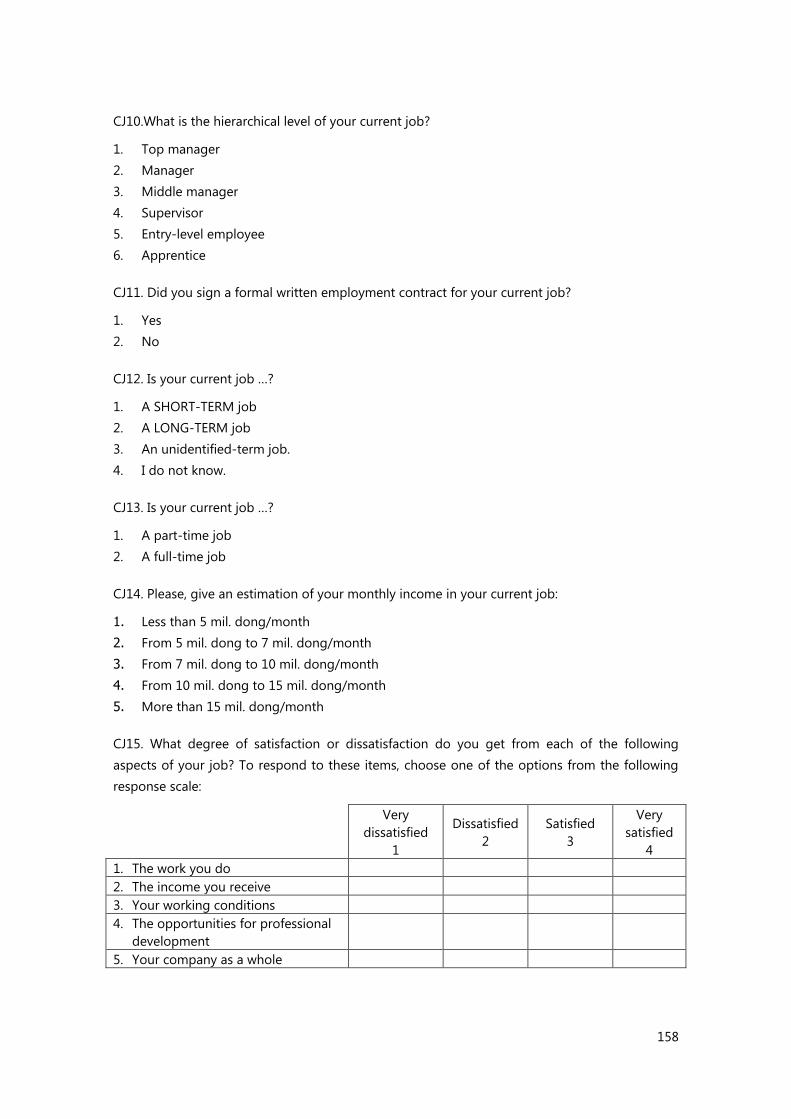
158
CJ10.What is the hierarchical level of your current job?
1. Top manager
2. Manager
3. Middle manager
4. Supervisor
5. Entry-level employee
6. Apprentice
CJ11. Did you sign a formal written employment contract for your current job?
1. Yes
2. No
CJ12. Is your current job …?
1. A SHORT-TERM job
2. A LONG-TERM job
3. An unidentified-term job.
4. I do not know.
CJ13. Is your current job …?
1. A part-time job
2. A full-time job
CJ14. Please, give an estimation of your monthly income in your current job:
1. Less than 5 mil. dong/month
2. From 5 mil. dong to 7 mil. dong/month
3. From 7 mil. dong to 10 mil. dong/month
4. From 10 mil. dong to 15 mil. dong/month
5. More than 15 mil. dong/month
CJ15. What degree of satisfaction or dissatisfaction do you get from each of the following
aspects of your job? To respond to these items, choose one of the options from the following
response scale:
Very
dissatisfied
1
Dissatisfied
2
Satisfied
3
Very
satisfied
4
1. The work you do
2. The income you receive
3. Your working conditions
4. The opportunities for professional
development
5. Your company as a whole

159
CJ16. What is the title of your current job? (e.g., accountant, mechanical engineering, primary
school teacher, etc.). Write it on the following line:
CJ17. Rate the importance of each of the following factors and competences for good
performance in your current job. To respond to these items, choose one of the options from the
following response scale:
NONE
1
SOME
2
INTERMEDIATE
3
QUITE
4
A LOT
5
1.COGNITIVE COMPETENCIES
1. Critical thinking
2. Systematic thinking
3. Problem solving
4. Creativity
5. Transferring theory to practice
6. Continuous learning
7. Report writing
2.MANAGEMENT COMPETENCIES
1. Time management
2. Motivating others
3. Leadership
4. Planning
5. Decision making
3. INTERPERSONAL COMPETENCIES
1. Conflict solving
2. Team work
3. Communication skills
4. Presentation skills
5. Negotiation skills
6. Inter-cultural skills
7. Customer relationship skills
4 INSTRUMENTAL COMPETENCIES
1. Foreign languages
2. Computer skills
3. Office skills
5 ATTITUDINAL COMPETENCIES
1. Adaptability
2. Commitment
3. Entrepreneurship
4. Rule compliance
5. Punctuality
6. Taking responsibility
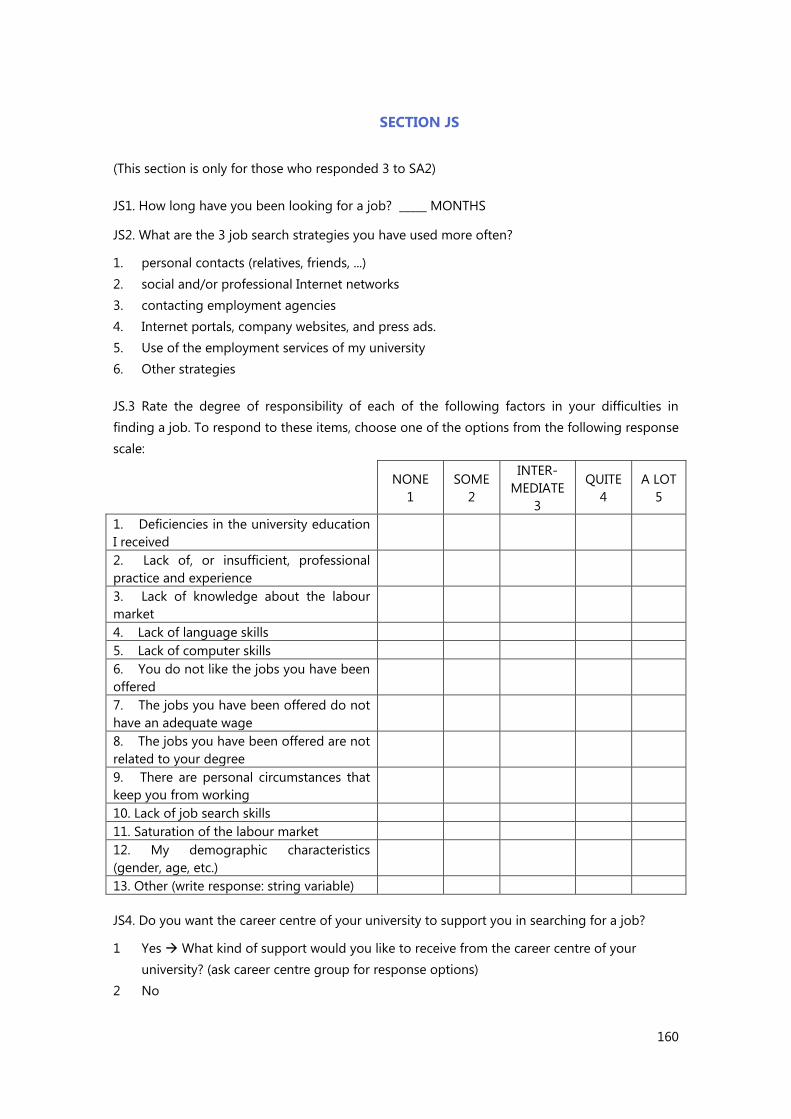
160
SECTION JS
(This section is only for those who responded 3 to SA2)
JS1. How long have you been looking for a job? _____ MONTHS
JS2. What are the 3 job search strategies you have used more often?
1. personal contacts (relatives, friends, ...)
2. social and/or professional Internet networks
3. contacting employment agencies
4. Internet portals, company websites, and press ads.
5. Use of the employment services of my university
6. Other strategies
JS.3 Rate the degree of responsibility of each of the following factors in your difficulties in
finding a job. To respond to these items, choose one of the options from the following response
scale:
NONE
1
SOME
2
INTER-
MEDIATE
3
QUITE
4
A LOT
5
1. Deficiencies in the university education
I received
2. Lack of, or insufficient, professional
practice and experience
3. Lack of knowledge about the labour
market
4. Lack of language skills
5. Lack of computer skills
6. You do not like the jobs you have been
offered
7. The jobs you have been offered do not
have an adequate wage
8. The jobs you have been offered are not
related to your degree
9. There are personal circumstances that
keep you from working
10. Lack of job search skills
11. Saturation of the labour market
12. My demographic characteristics
(gender, age, etc.)
13. Other (write response: string variable)
JS4. Do you want the career centre of your university to support you in searching for a job?
1 Yes What kind of support would you like to receive from the career centre of your
university? (ask career centre group for response options)
2 No

161
JS5. If yes, what do you want the Career Centre to offer?
1. General information on labour market and job opportunities
2. Information about training opportunities
3. Job search consulting services
4. Soft skill training services (communication, teamworking,…
5. Job-hunting skills
6. Hosting job fairs and other events with employers
7. Providing job opportunities for each major
8. Other (specified)
SECTION EIP
(This section is only for those who responded to SA2 with option 4)
EIP1. Why aren’t you looking for a job right now? (choose the most important reason)
1. Because I continue to study
2. Because I have to take care of my family and/or housework
3. Because there are no jobs for people with my degree
4. Because I have lost hope in finding work
5. Because I do not want to work
6. For other reasons