Cookstoves, Climate & Development
46
Daniel Kammen Class of 1935 Distinguished Professor of Energy Energy and Resources Group | Goldman School of Public Policy Director, Renewable and Appropriate Energy Laboratory University of California, Berkeley COP21, December 8, 2015 Cookstoves, Climate & Development
Transcript of Cookstoves, Climate & Development
Daniel KammenClass of 1935 Distinguished Professor of Energy
Energy and Resources Group | Goldman School of Public PolicyDirector, Renewable and Appropriate Energy Laboratory
University of California, Berkeley
COP21, December 8, 2015
Cookstoves, Climate & Development

Twitter: @dan_kammen
Website: http://rael.berkeley.edu
Resources:
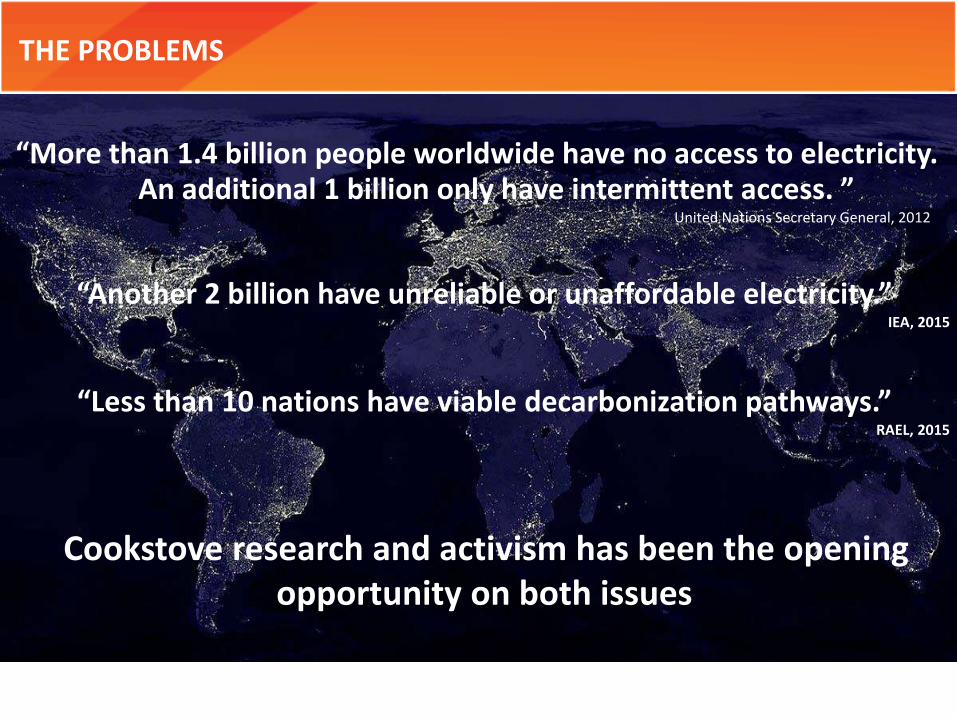
THE PROBLEM
“More than 1.4 billion people worldwide have no access to electricity. An additional 1 billion only have intermittent access. ”
United Nations Secretary General, 2012
THE PROBLEMS
“Another 2 billion have unreliable or unaffordable electricity.”IEA, 2015
“Less than 10 nations have viable decarbonization pathways.”RAEL, 2015
Cookstove research and activism has been the opening opportunity on both issues
4
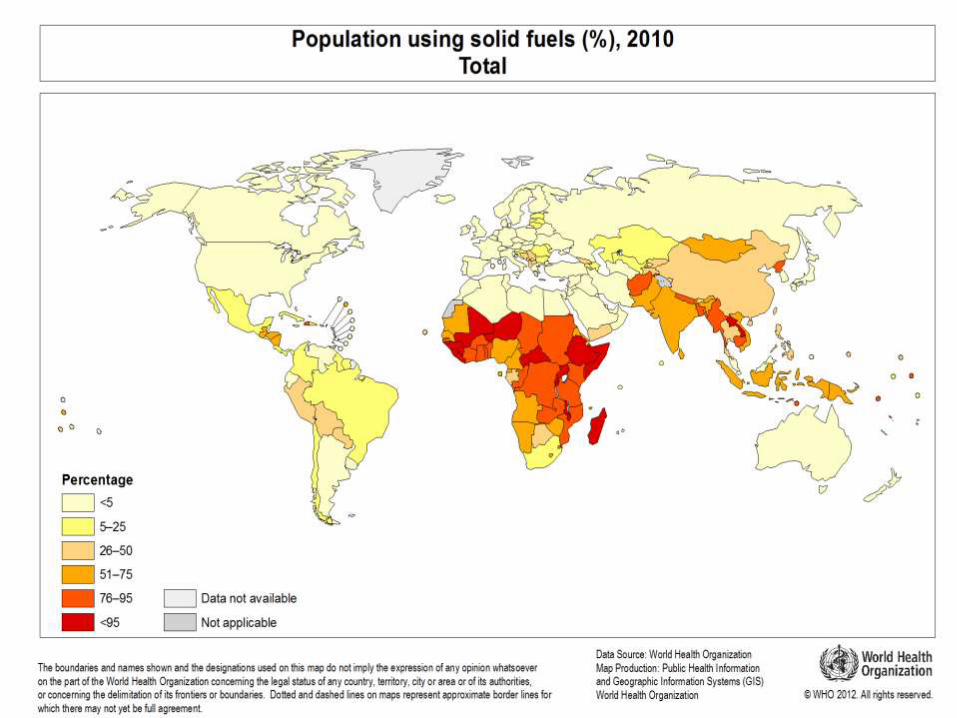
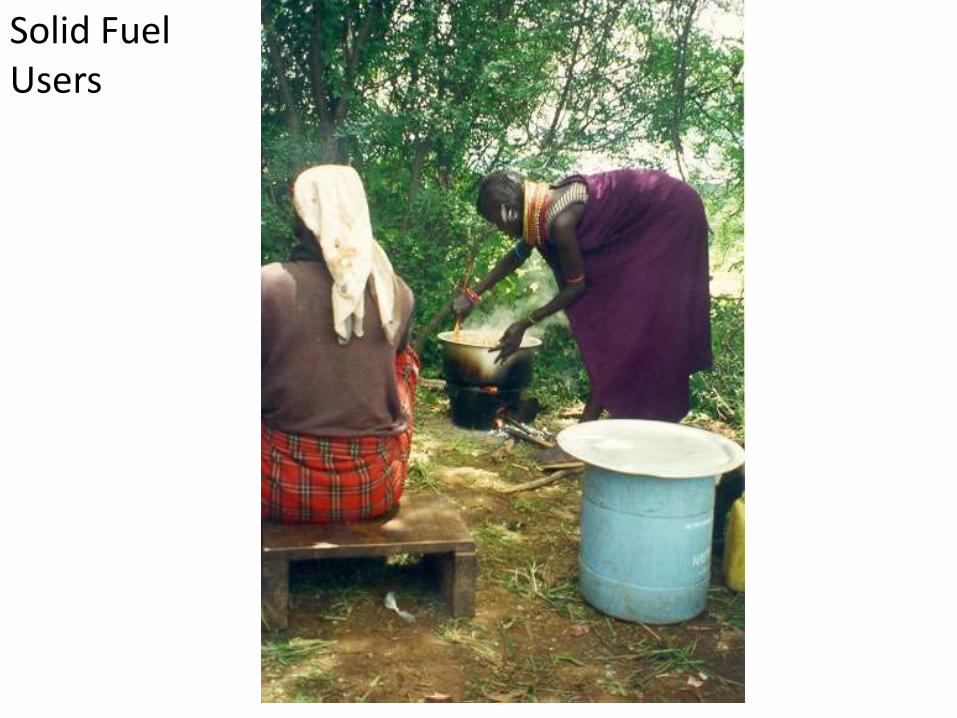
Solid Fuel Users
Source: Global Energy Assessment (2012) www.globalenergyassessment.org

6
Solid Fuel Users
ER100 - Lecture 5 Page 7
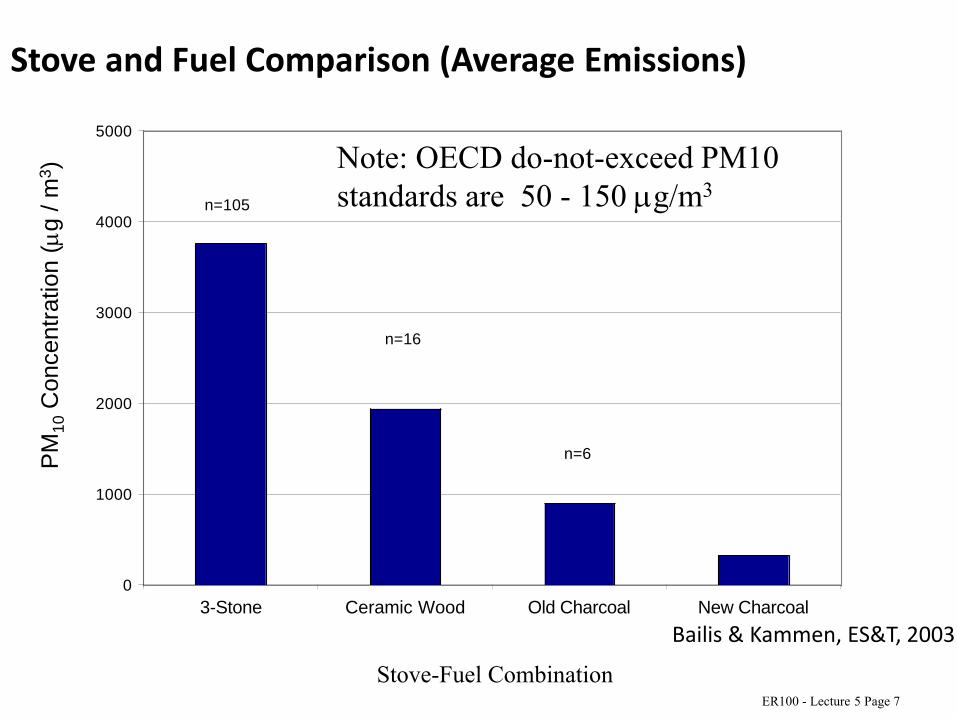
PM
10
Concentr
ation (
g / m
3)
Stove-Fuel Combination
0
1000
2000
3000
4000
5000
3-Stone Ceramic Wood Old Charcoal New Charcoal
n=105
n=16
n=6
Note: OECD do-not-exceed PM10
standards are 50 - 150 g/m3
Stove and Fuel Comparison (Average Emissions)
Bailis & Kammen, ES&T, 2003
8
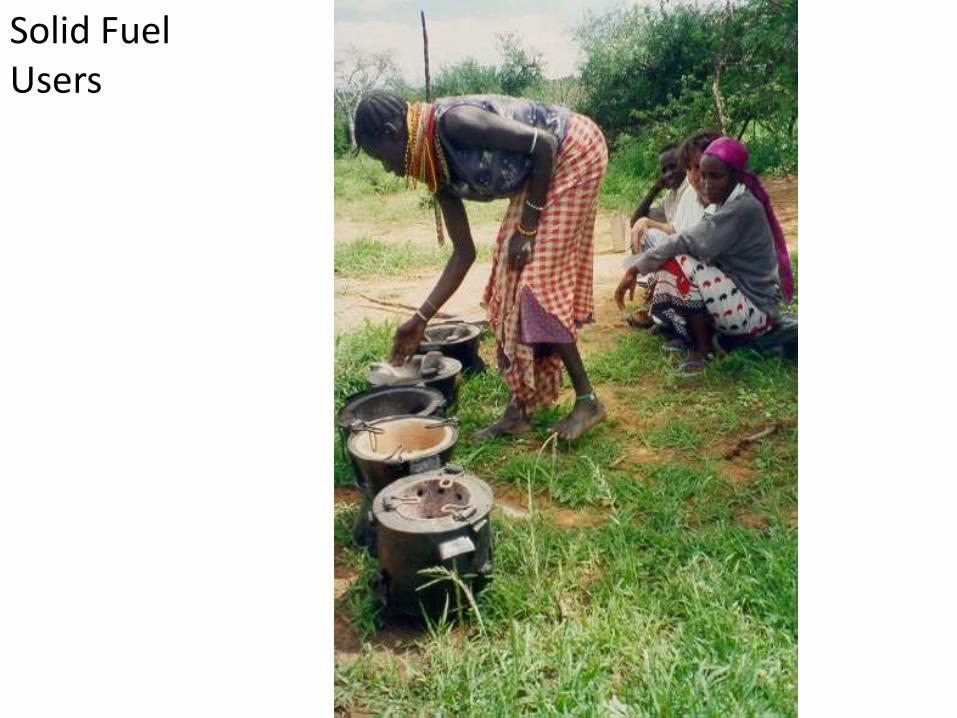
Solid Fuel Users
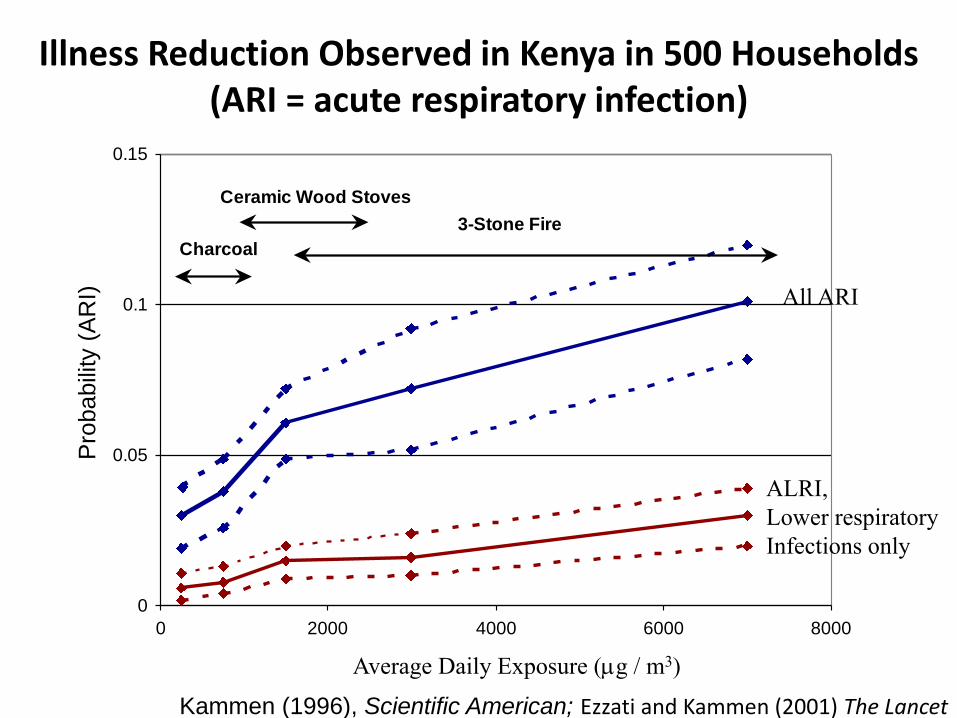
Kammen (1996), Scientific American; Ezzati and Kammen (2001) The Lancet
Pro
babili
ty (
AR
I)
Average Daily Exposure (g / m3)
0
0.05
0.1
0.15
0 2000 4000 6000 8000
Charcoal
Ceramic Wood Stoves
3-Stone Fire
Illness Reduction Observed in Kenya in 500 Households(ARI = acute respiratory infection)
All ARI
ALRI,
Lower respiratory
Infections only

10 | C L E A N C O O K S T O V E S A N D F U E L S
How Clean Is Clean Enough to Impact Child Survival?More evidence along the ALRI “Integrated Exposure Response Curve”
ambient air pollutionsecond hand smokehousehold air pollution(Guatemala RCT)
LPG / Ethanol
Rocket Stove
AdvancedBiomass
Ghana RCTNepal RCTNigeria RCT
Exposure to PM2.5
11
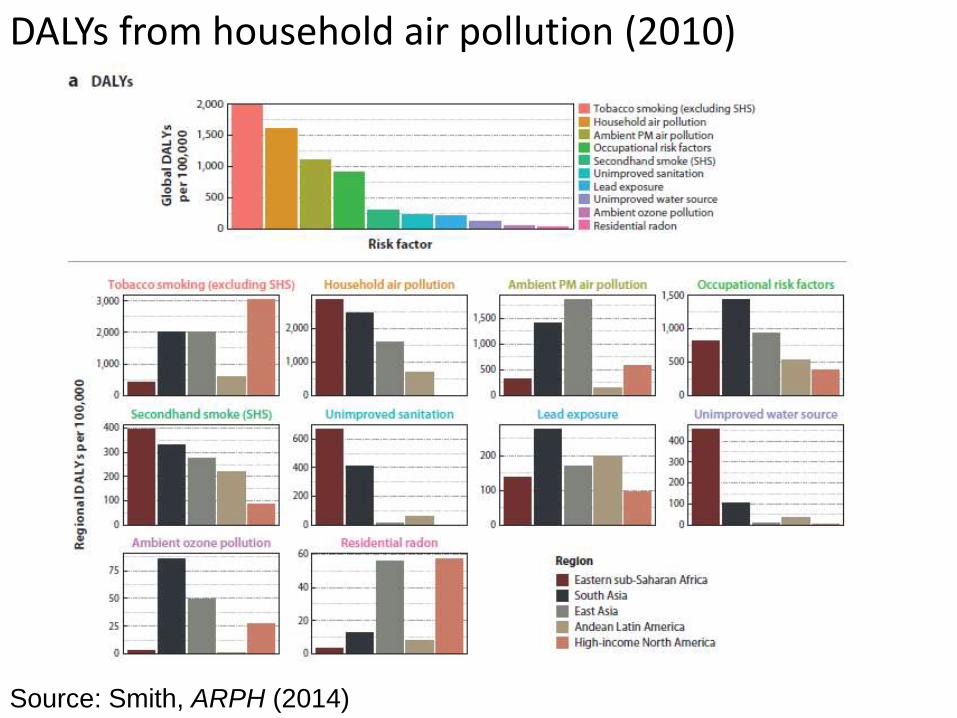
DALYs from household air pollution (2010)
Source: Smith, ARPH (2014)
12
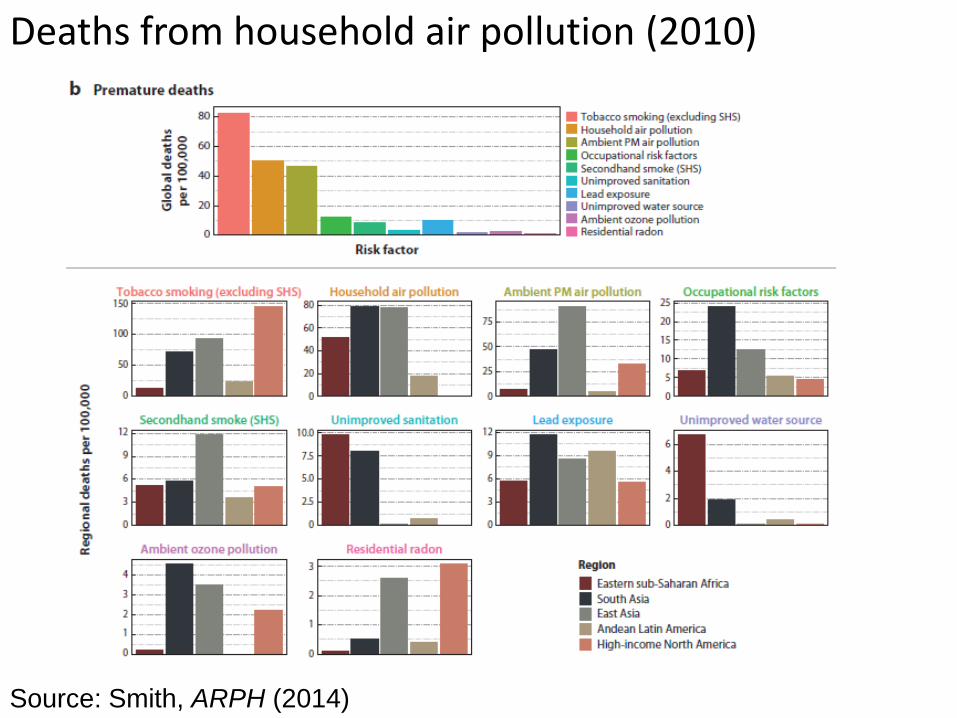
Deaths from household air pollution (2010)
Source: Smith, ARPH (2014)
13
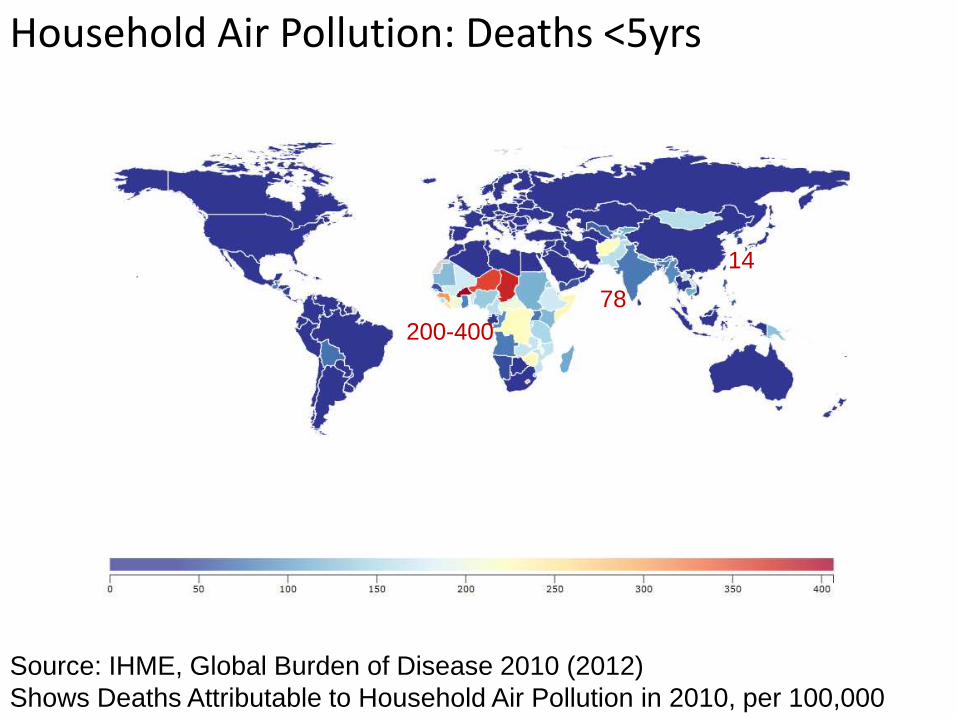
Household Air Pollution: Deaths <5yrs
78
14
200-400
Source: IHME, Global Burden of Disease 2010 (2012)
Shows Deaths Attributable to Household Air Pollution in 2010, per 100,000
14
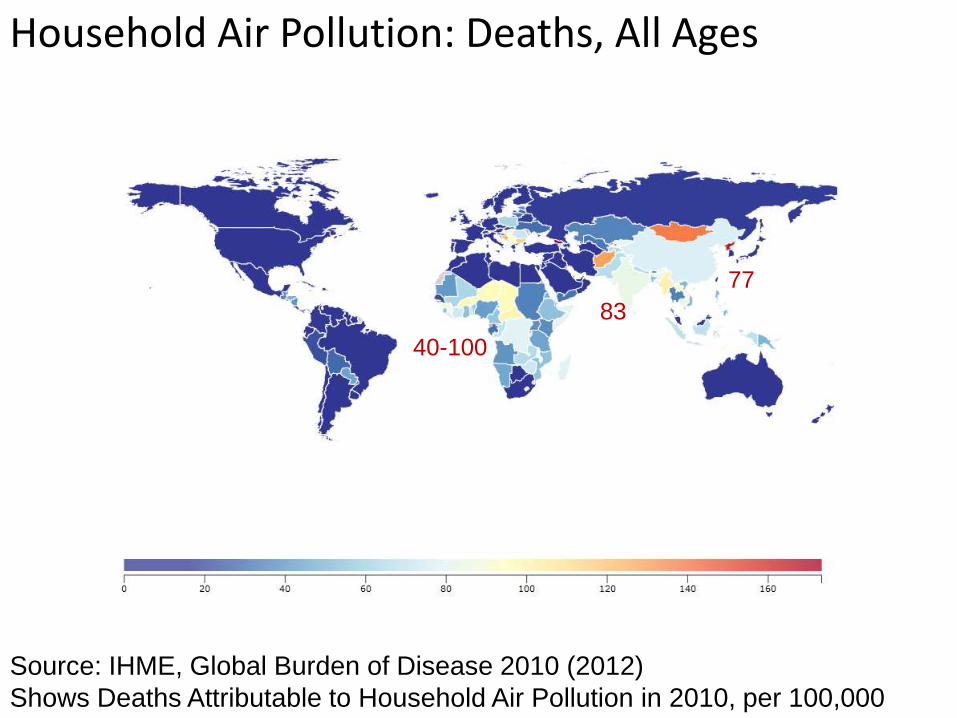
Household Air Pollution: Deaths, All Ages
83
77
40-100
Source: IHME, Global Burden of Disease 2010 (2012)
Shows Deaths Attributable to Household Air Pollution in 2010, per 100,000
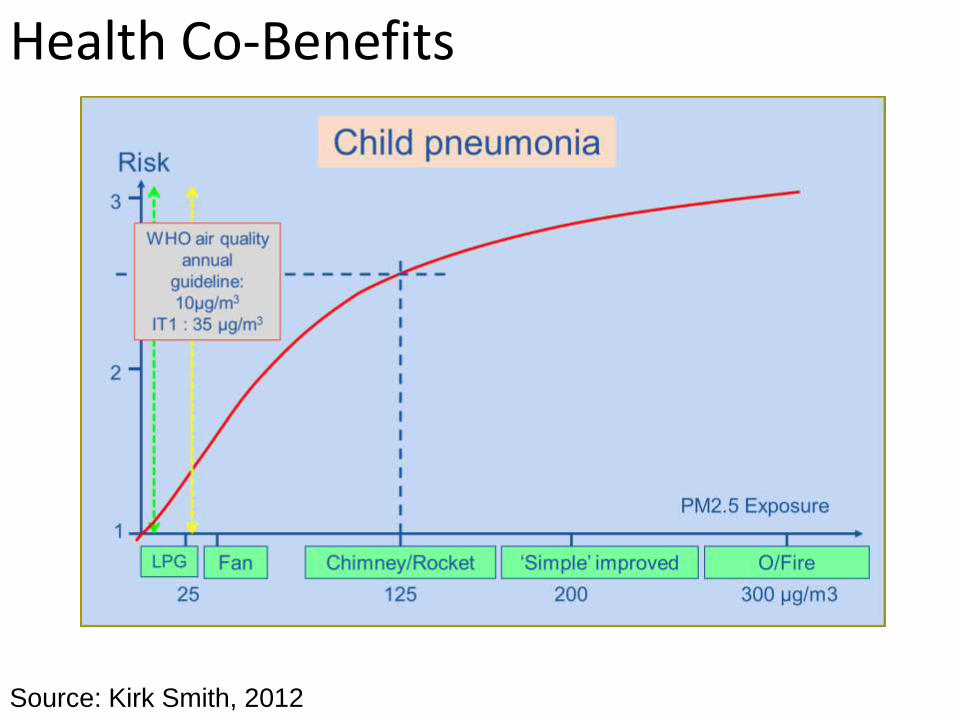
15
Health Co-Benefits
Source: Kirk Smith, 2012
. . /~
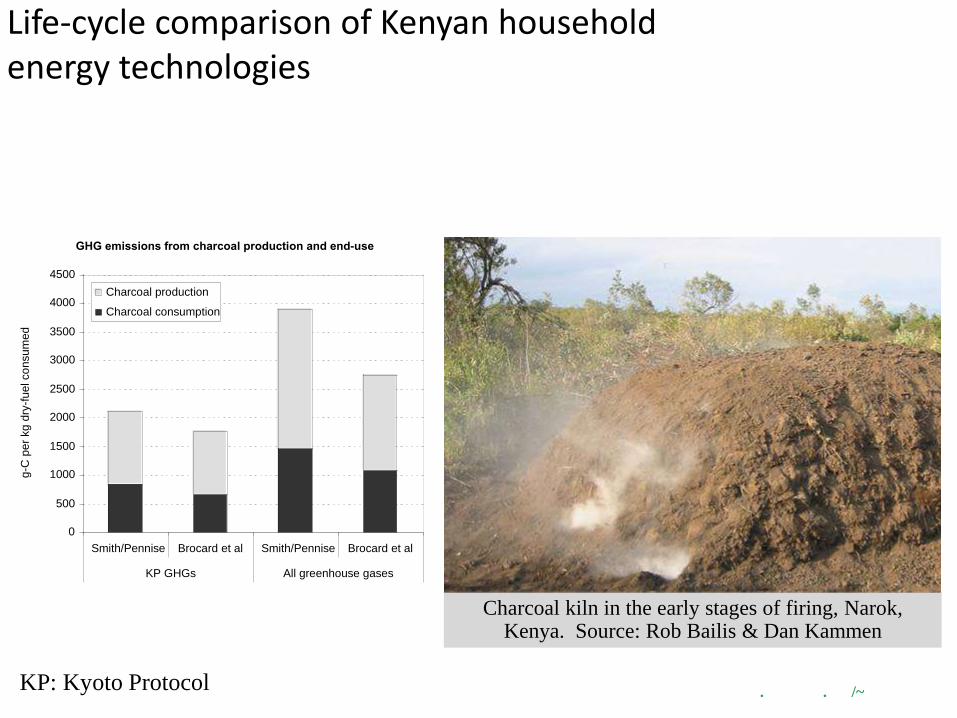
Life-cycle comparison of Kenyan household energy technologies
GHG emissions from charcoal production and end-use
0
500
1000
1500
2000
2500
3000
3500
4000
4500
Smith/Pennise Brocard et al Smith/Pennise Brocard et al
KP GHGs All greenhouse gases
g-C
per
kg
dry
-fuel co
nsum
ed
Charcoal production
Charcoal consumption
Charcoal kiln in the early stages of firing, Narok, Kenya. Source: Rob Bailis & Dan Kammen
KP: Kyoto Protocol
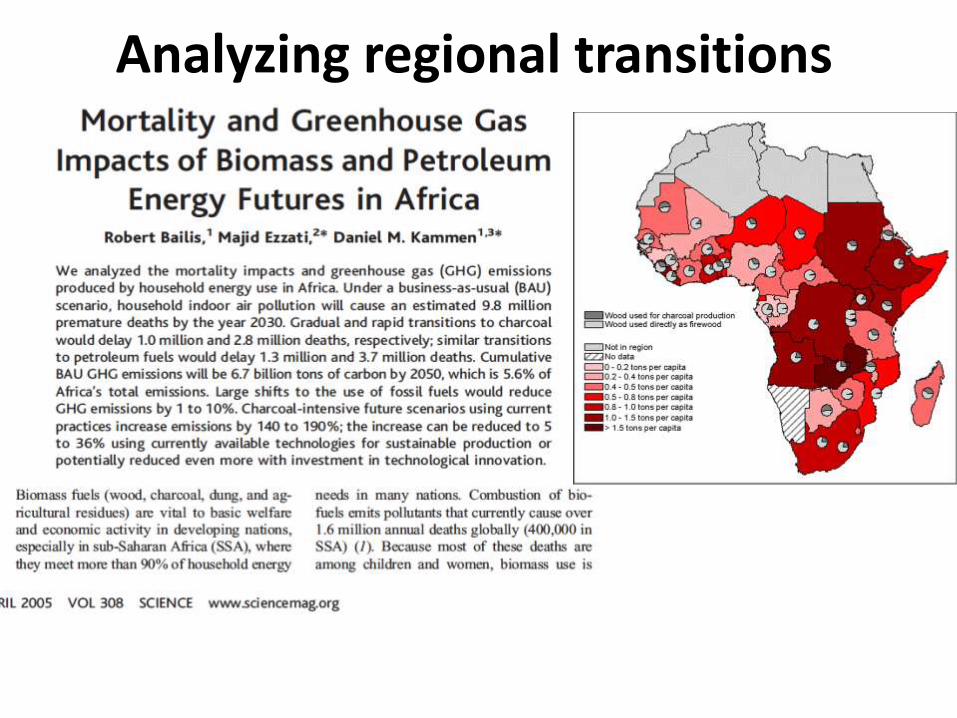
Analyzing regional transitions
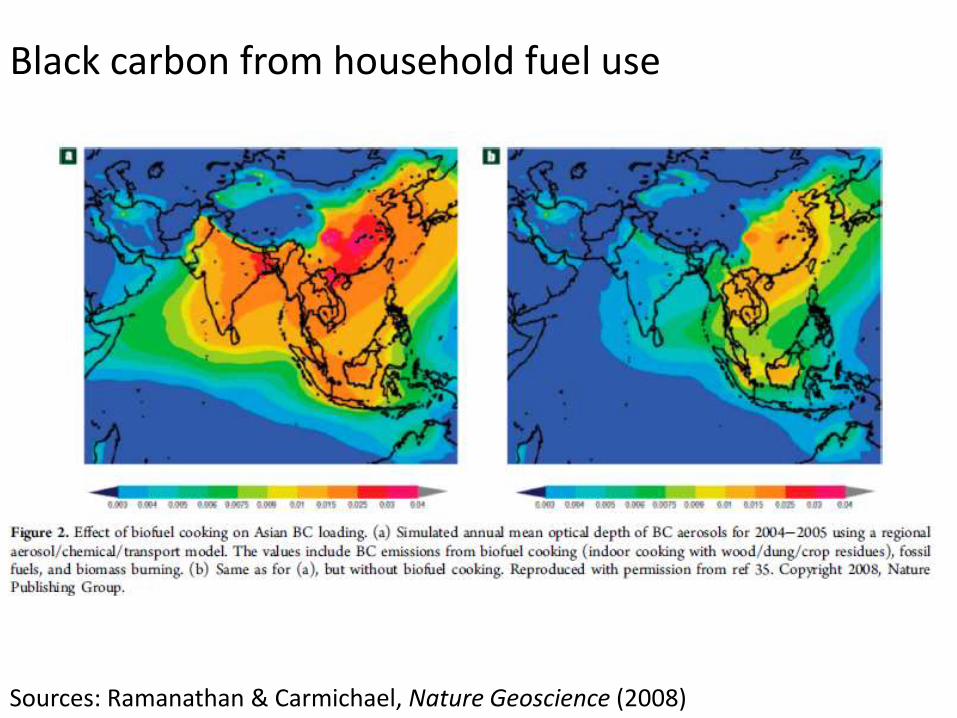
Black carbon from household fuel use
18Sources: Ramanathan & Carmichael, Nature Geoscience (2008)
19
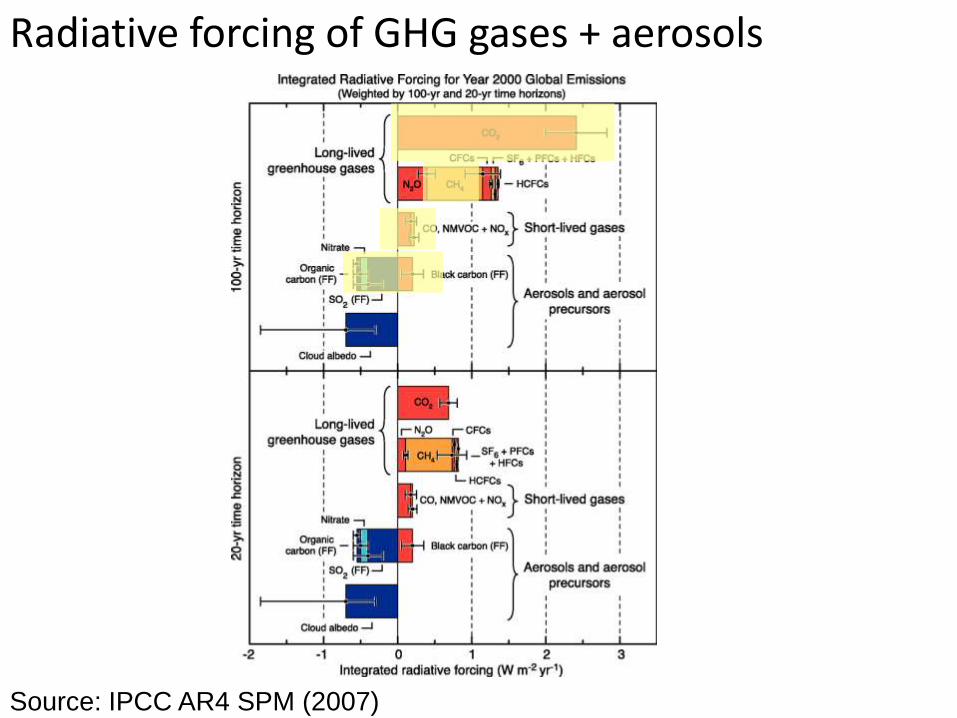
Radiative forcing of GHG gases + aerosols
Source: IPCC AR4 SPM (2007)
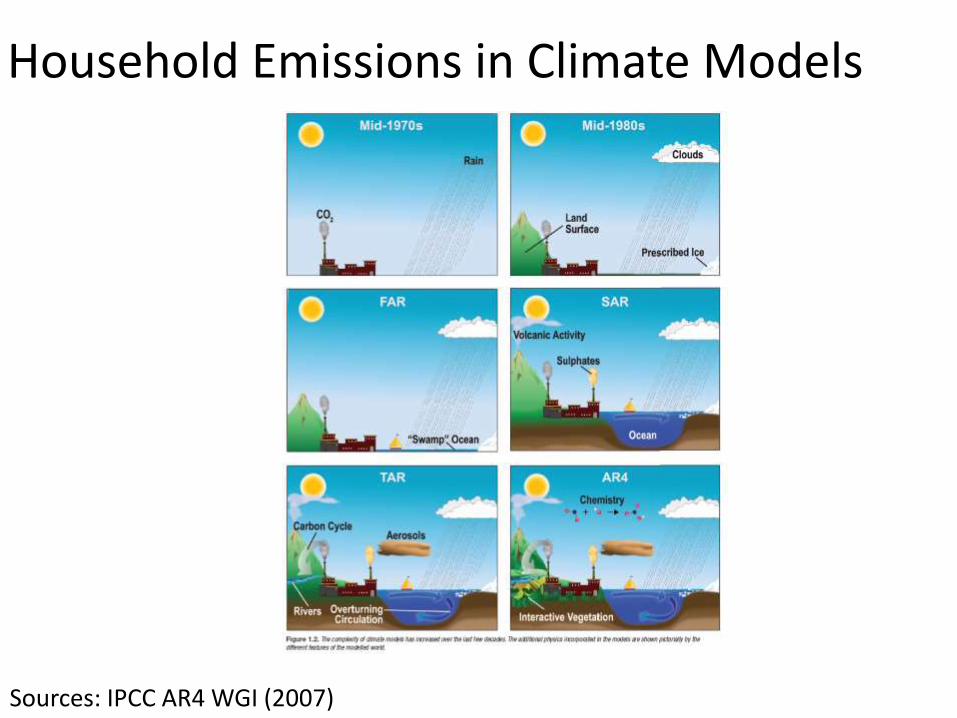
Household Emissions in Climate Models
20Sources: IPCC AR4 WGI (2007)
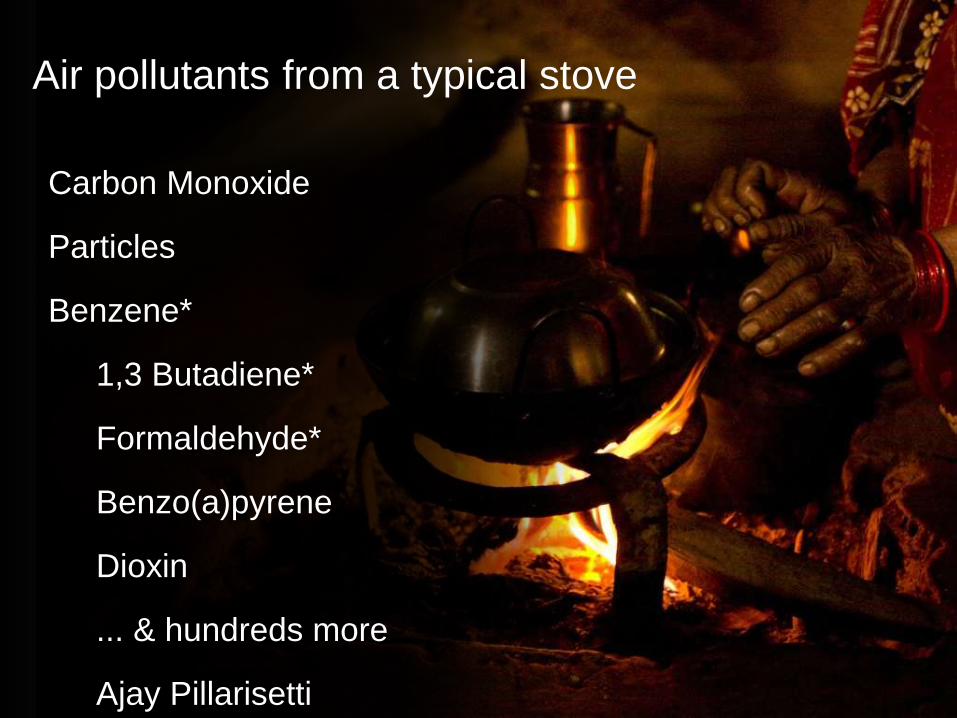
Carbon Monoxide
Particles
Benzene*
1,3 Butadiene*
Formaldehyde*
Benzo(a)pyrene
Dioxin
... & hundreds more
Ajay Pillarisetti
Air pollutants from a typical stove

22
Solid Fuel Users: Clustered
Source: Global Energy Assessment (2012) www.globalenergyassessment.org
23

24
Hot Topic: Kerosene for Lighting
Source: Lam et al., EST (2012)
• 7-9% of kerosene become black carbon (BC--strong forcer)
– Warming of 1 kg of BC = 700 kg of CO2 over 100 years
• Low organic carbon emissions (OC)
• Lung function, asthma, cancer risks

Quantitative Assessments: Energy and Human Development
Literacy
Mortality(Children)
Poverty
Education
Mortality(Infants)
Sanitation
Correlation, not causation, but warrants deeper investigation
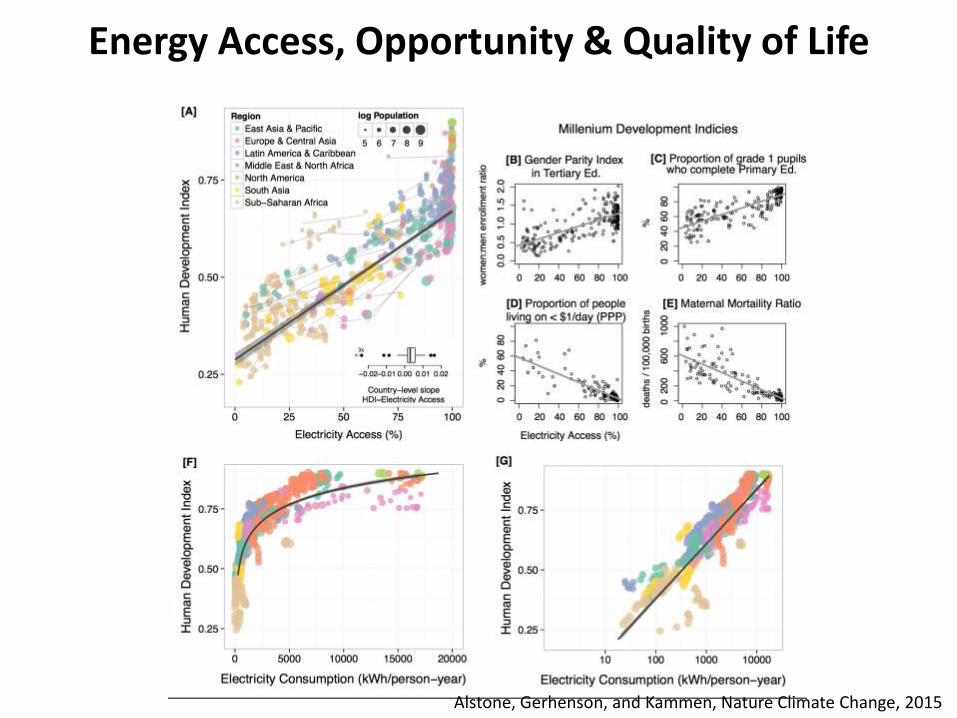
Energy Access, Opportunity & Quality of Life
Alstone, Gerhenson, and Kammen, Nature Climate Change, 2015
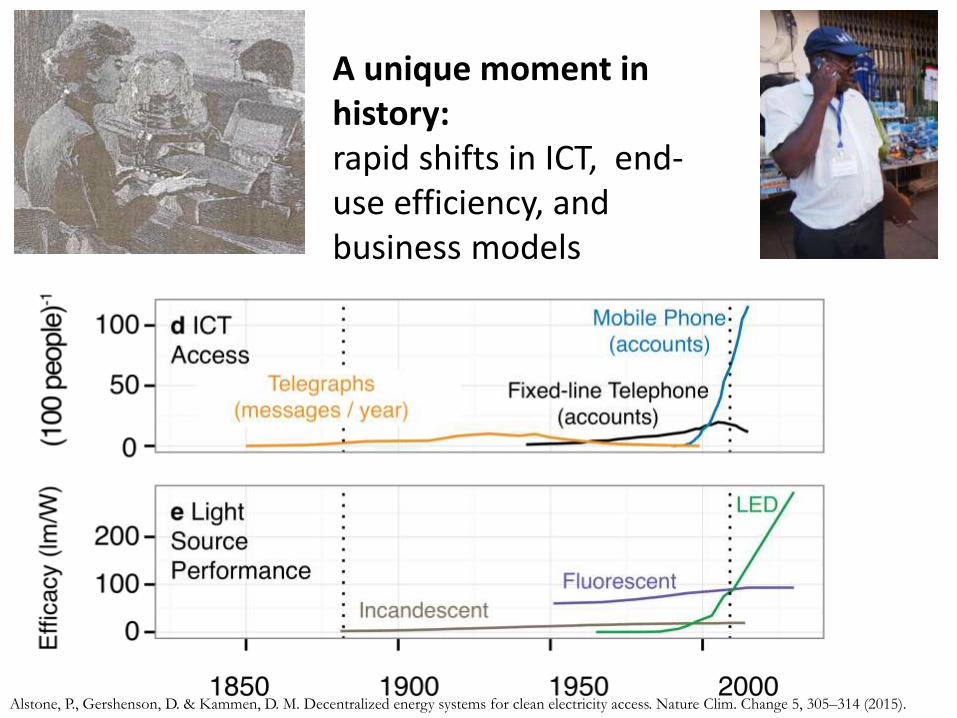
A unique moment in history: rapid shifts in ICT, end-use efficiency, and business models
Alstone, P., Gershenson, D. & Kammen, D. M. Decentralized energy systems for clean electricity access. Nature Clim. Change 5, 305–314 (2015).
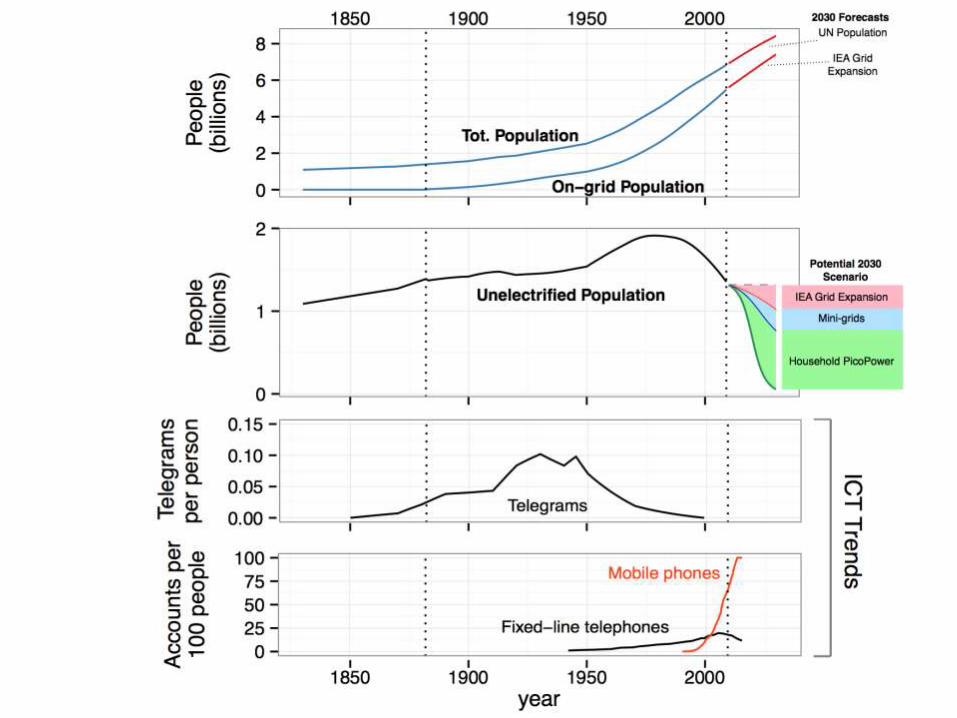
Fig.3SOM
28

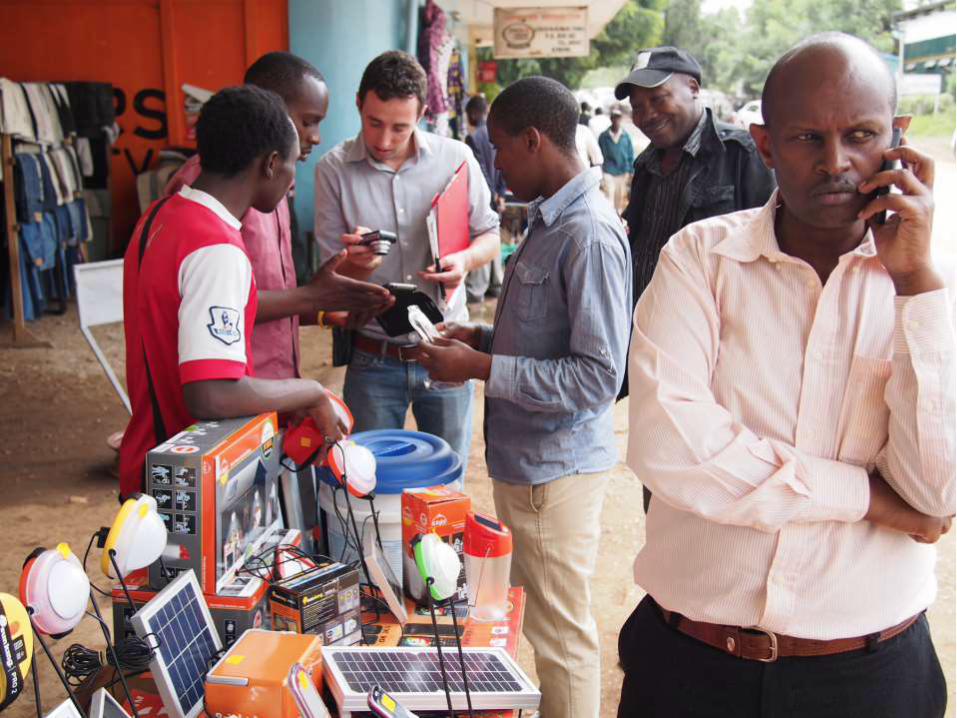
Fuel Based Lighting : Expensive, Unhealthy, and Inefficient
Kerosene for lighting is a $25 billion per year industry globally (source: UNEP, 2013)
Fuel Based Lighting is the Incumbent Technology
Photo by Evan MillsPhoto by Peter Alstone
Photo by Peter Alstone
Kammen – http://rael.berkeley.edu
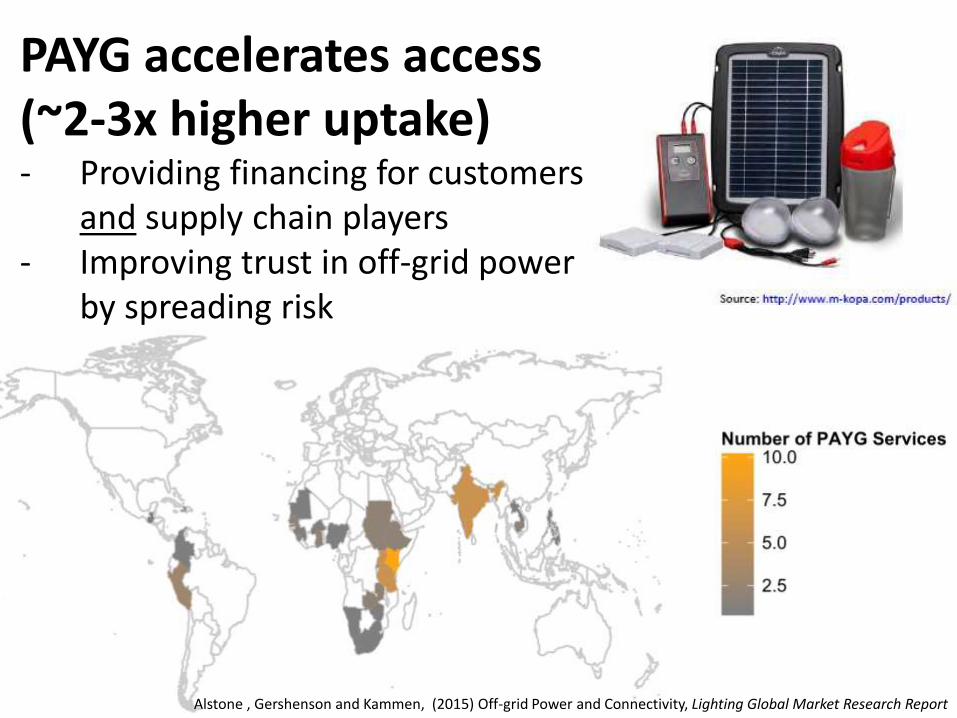
PAYG accelerates access (~2-3x higher uptake)- Providing financing for customers
and supply chain players- Improving trust in off-grid power
by spreading risk
Alstone , Gershenson and Kammen, (2015) Off-grid Power and Connectivity, Lighting Global Market Research Report

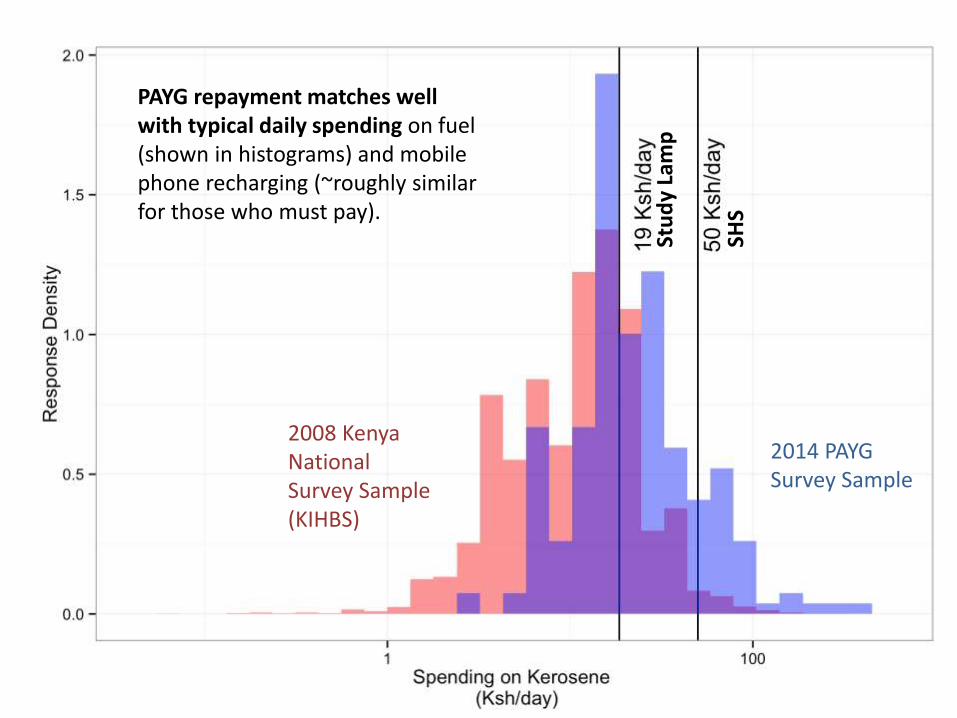
PAYG repayment matches well with typical daily spending on fuel (shown in histograms) and mobile phone recharging (~roughly similar for those who must pay).
2014 PAYG Survey Sample
2008 Kenya National Survey Sample(KIHBS)
Stu
dy
Lam
p
SHS
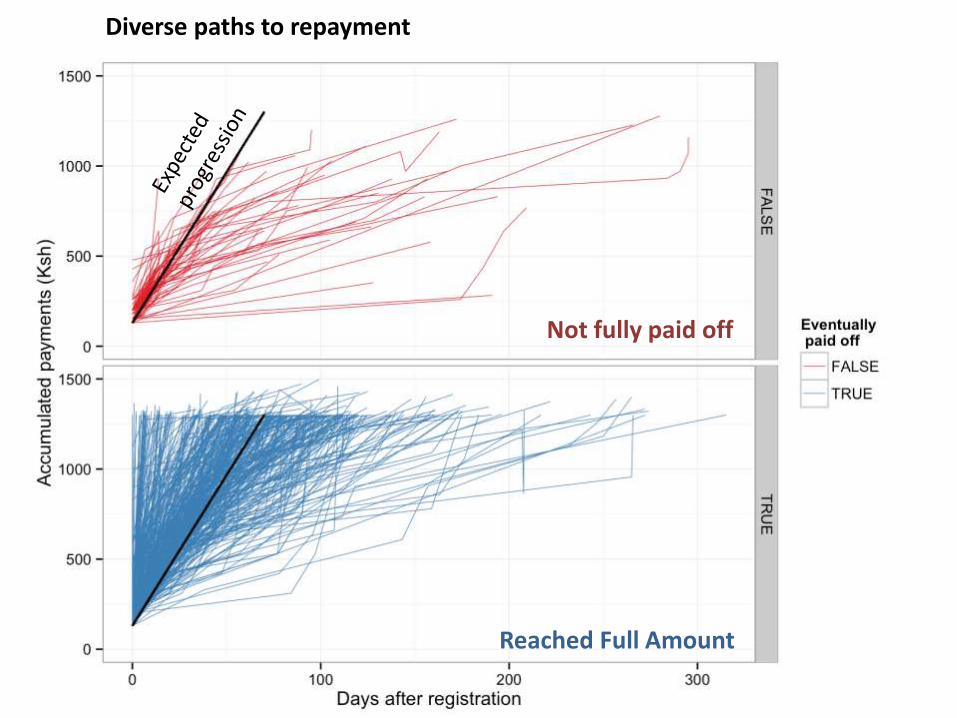
Diverse paths to repayment
Not fully paid off
Reached Full Amount


36
Next Wave of Off-grid products
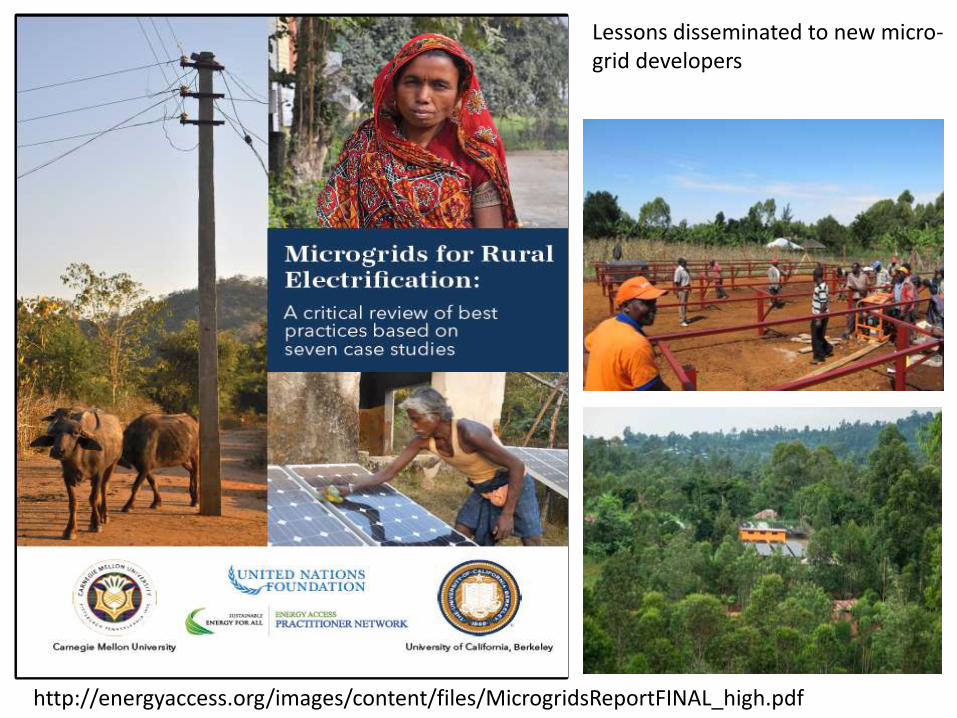
http://energyaccess.org/images/content/files/MicrogridsReportFINAL_high.pdf
Lessons disseminated to new micro-grid developers
UN General Assembly resolution 65/151
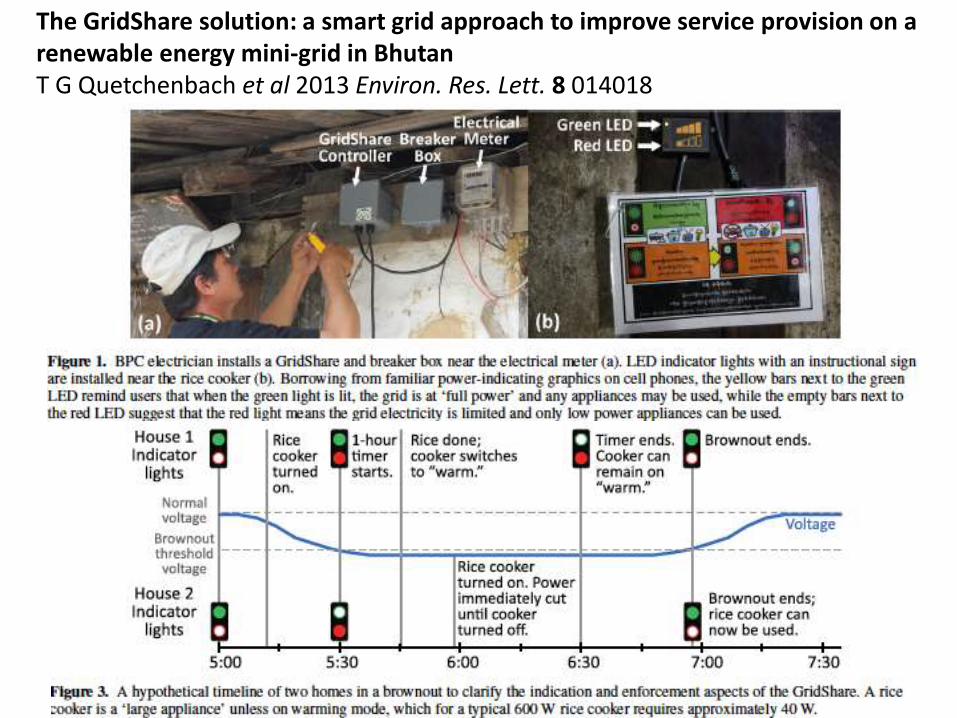
The GridShare solution: a smart grid approach to improve service provision on a renewable energy mini-grid in BhutanT G Quetchenbach et al 2013 Environ. Res. Lett. 8 014018
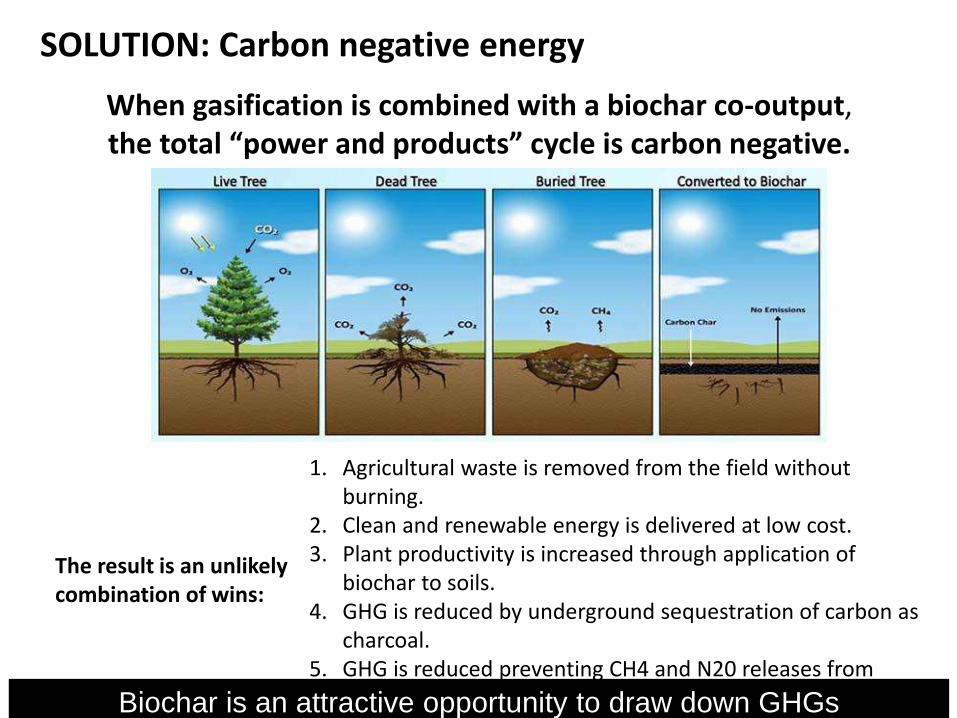
SOLUTION: Carbon negative energy
Property and Confidential © ALL Power Labs Inc 2015
1. Agricultural waste is removed from the field without burning.
2. Clean and renewable energy is delivered at low cost.3. Plant productivity is increased through application of
biochar to soils.4. GHG is reduced by underground sequestration of carbon as
charcoal.5. GHG is reduced preventing CH4 and N20 releases from
decaying biomass.Biochar is an attractive opportunity to draw down GHGs
The result is an unlikely combination of wins:
When gasification is combined with a biochar co-output,the total “power and products” cycle is carbon negative.
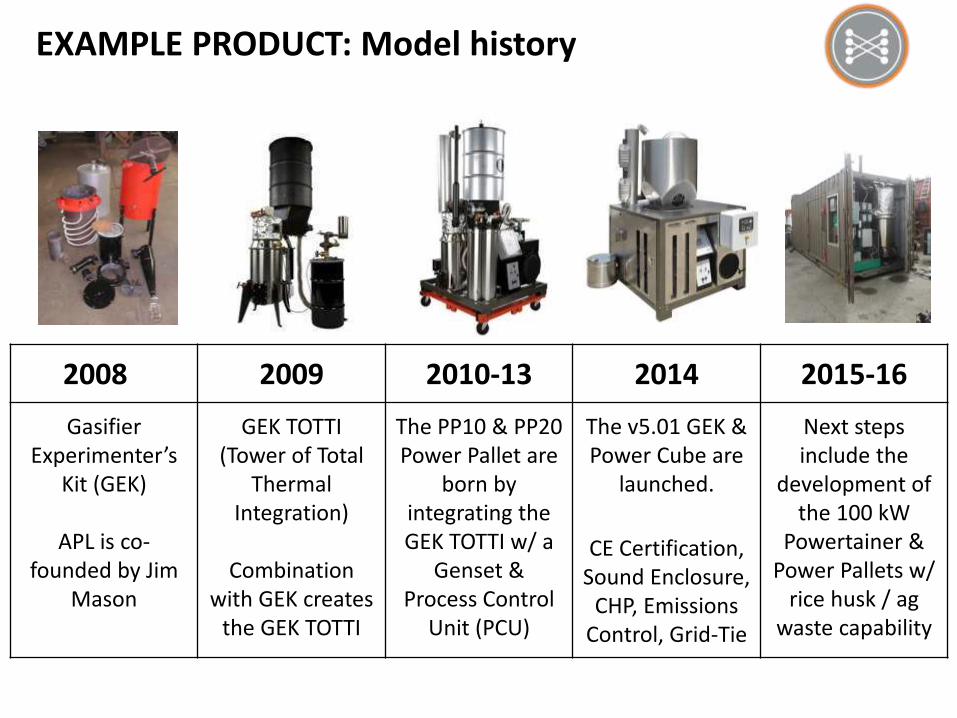
EXAMPLE PRODUCT: Model history
2008 2009 2010-13 2014 2015-16
Gasifier Experimenter’s
Kit (GEK)
APL is co-founded by Jim
Mason
GEK TOTTI(Tower of Total
Thermal Integration)
Combination with GEK creates
the GEK TOTTI
The PP10 & PP20Power Pallet are
born by integrating the GEK TOTTI w/ a
Genset & Process Control
Unit (PCU)
The v5.01 GEK & Power Cube are
launched.
CE Certification, Sound Enclosure,
CHP, EmissionsControl, Grid-Tie
Next steps include the
development of the 100 kW
Powertainer & Power Pallets w/
rice husk / ag waste capability

Twitter: @dan_kammen
Website: http://rael.berkeley.edu
Resources:
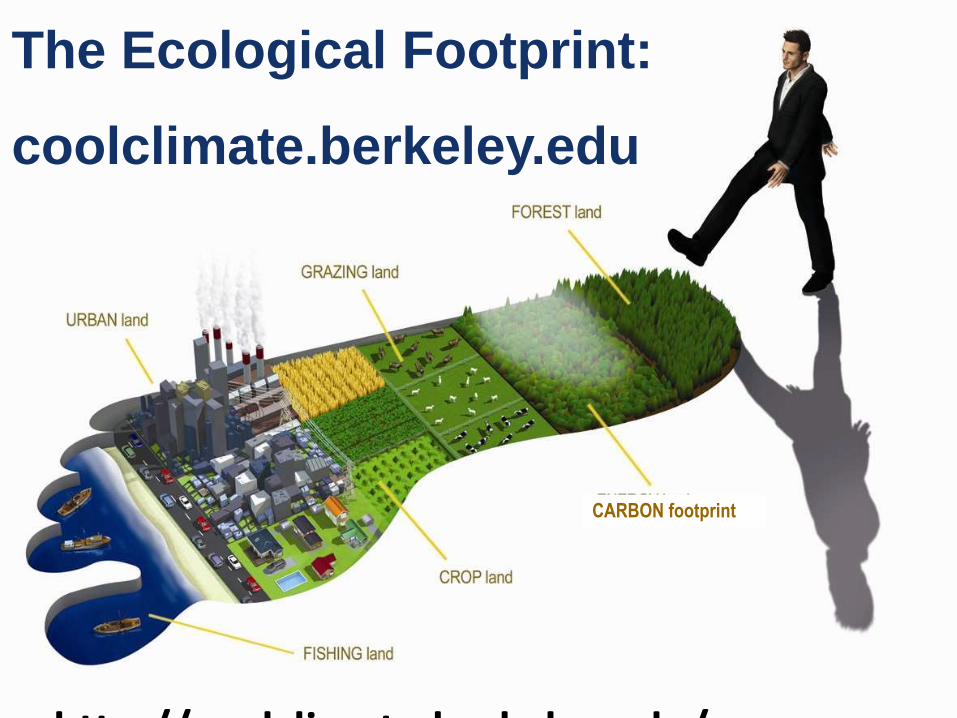
The Ecological Footprint:
coolclimate.berkeley.edu
CARBON footprint
http://coolclimate.berkeley.edu/maps

43

http://coolclimate.berkeley.edu/maps
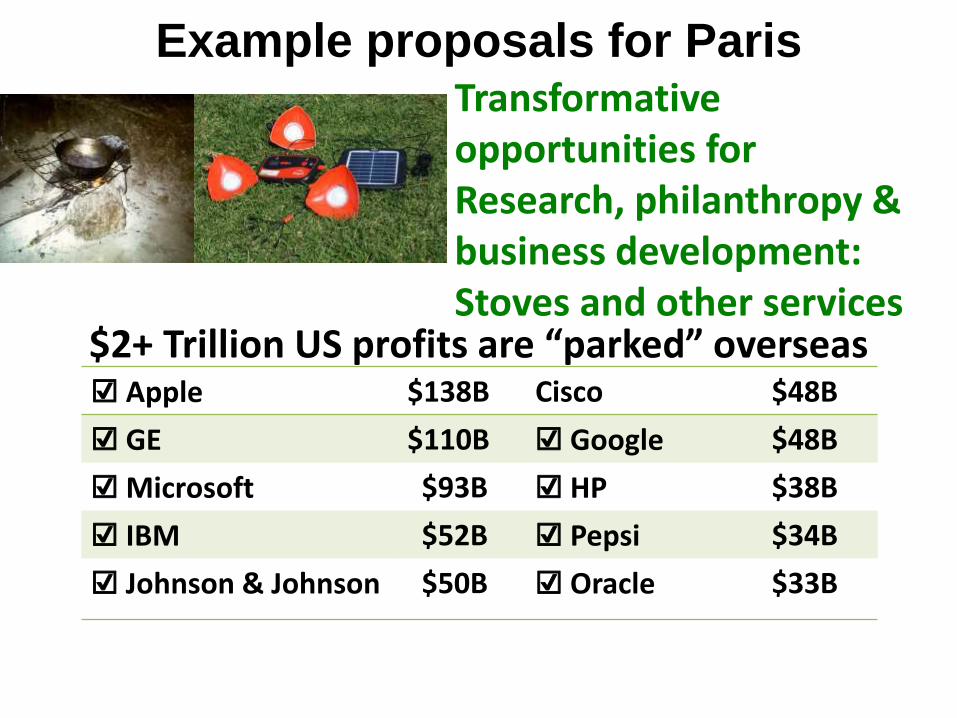
Example proposals for Paris
$2+ Trillion US profits are “parked” overseas
Transformative opportunities forResearch, philanthropy &business development:Stoves and other services
☑︎ Apple $138B Cisco $48B
☑︎ GE $110B ☑︎ Google $48B
☑︎Microsoft $93B ☑︎ HP $38B
☑︎ IBM $52B ☑︎ Pepsi $34B
☑︎ Johnson & Johnson $50B ☑︎ Oracle $33B
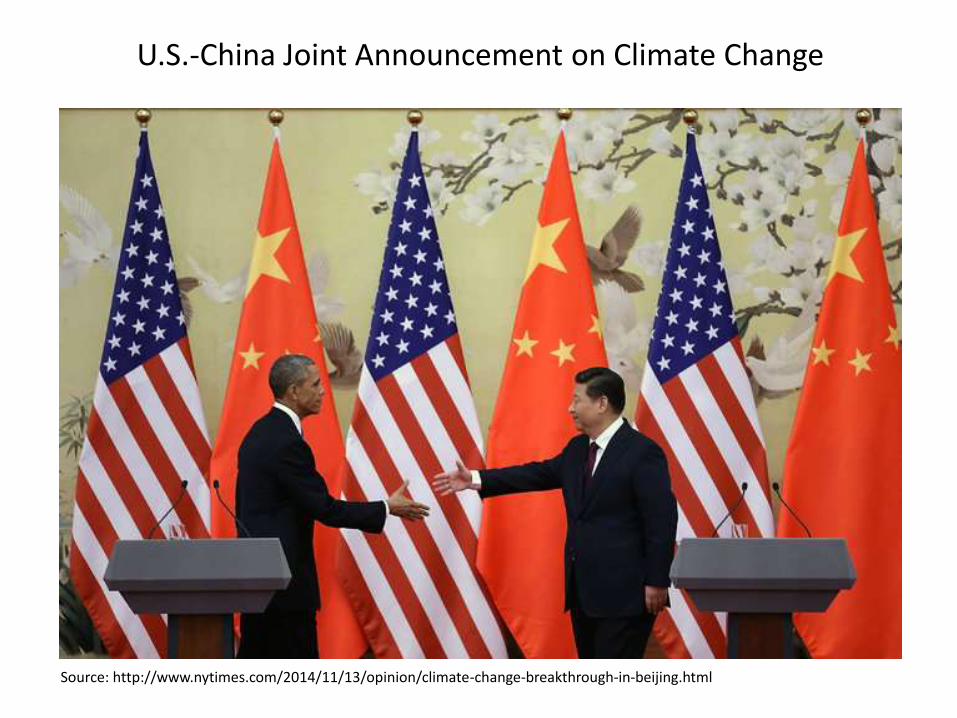
U.S.-China Joint Announcement on Climate Change
Source: http://www.nytimes.com/2014/11/13/opinion/climate-change-breakthrough-in-beijing.html